
The Socio-Economic Heterogeneity of Rural Areas: Towards a Rural Typology of Poland


Abstract
1. Introduction
2. From Continuum Studies to Heterogeneity Studies
3. Some Remarks on “Typology” Criteria
- (1)
- Multilevel classification (dividing the set into lower- and higher-level classes solely based on differences in a single criterion);
- (2)
- Multidimensional classification (dividing objects that differ in many aspects simultaneously; then each of these dimensions is treated as a separate variable). Classification means both the action of dividing a set of spatial units and the result of that action.
- Formulating the objective of the typology.
- Selecting the spatial level of the analysis—aggregation of units.
- Choosing the most appropriate variables.
- Identifying the most reliable sources of statistical data.
- Data gathering and processing, calculating the variables.
- Technical exploration of input data.
- Checking reliability and knowledge value against the adopted criteria.
- Final version of the typology.
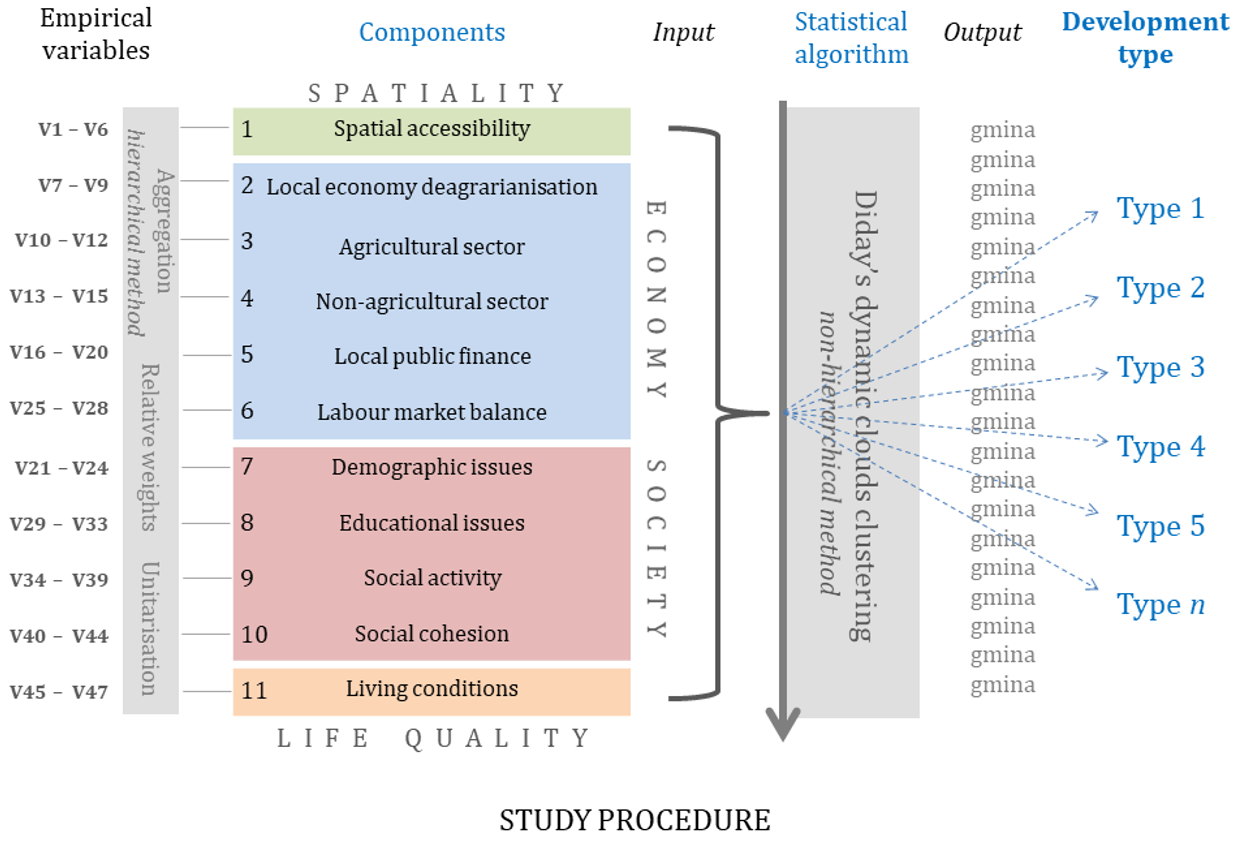
4. Methodology
4.1. Conceptual Framework and Definition
4.2. Data Sources and Indicators
4.3. Method
- xm(j,i)—average value of variable j in cloud i (type i);
- xg(j)—overall average value of the same variable j;
- S(j)—standard deviation of variable j.
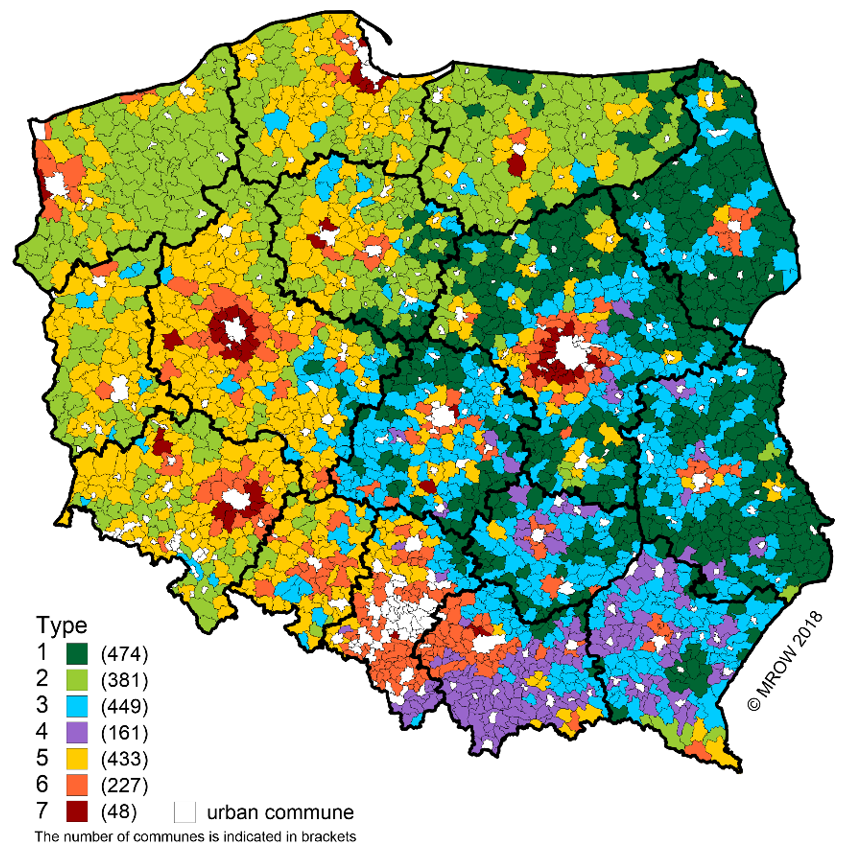
5. Results: Typology of Rural Areas
5.1. Rural Areas Dominated by Traditional Agriculture
5.2. Rural Areas Dominated by Large-Scale Agriculture
5.3. Rural Areas Dominated by Agriculture: Intermediate
5.4. Rural Areas with Dispersed Agriculture and Multiple Sources of Income
5.5. Multifunctional Rural Areas: Balance of Sectors
5.6. Suburban Rural Areas with Reduced Agriculture
5.7. Highly Urbanised Rural Areas
6. Discussion and Conclusions
- The domination of traditional agriculture inhibits the social and economic development of rural areas.
- Rural areas, even those situated far from urban centres, can achieve an average level of development, provided their development is multifunctional.
- On farms with numerous sources of income, the agricultural function diminishes.
- The deagrarianisation process of a local economy may be successful or not. Its success in terms of the level of socio-economic development depends on whether agriculture is replaced by other economic functions, or the population becomes reliant on non-earned sources of income.
Author Contributions
Funding
Institutional Review Board Statement
Informed Consent Statement
Data Availability Statement
Conflicts of Interest
Appendix A

| Components | Number of Indicator | Empirical Indicators | Spatial Unit a | Median (2019) | Data Provider b |
|---|---|---|---|---|---|
| 1. Community spatial accessibility | W1 | Average time needed to reach the capital of voivodeship | M_W | 70 min | Gmina Survey |
| W2 | Average commuting time to the nearest powiat (district) town that has a significant role for the local labour market | M_W | 20 min | Gmina Survey | |
| W3 | The percentage of gmina villages connected by public transport (bus stop or railway station), with the exception of student transport | M_W | 83.3% | Gmina Survey | |
| W4 | The percentage of villages accessible by a paved road | M_W | 100% | Gmina Survey | |
| W5 | The total number of registered passenger cars per 100 inhabitants | M_W | 61.5 | Central Register of Vehicles and Drivers (CEPIK) | |
| W6 | The percentage of cars manufactured before 2009 in the total number of registered vehicles | M_W | 90.4% | Central Register of Vehicles and Drivers (CEPIK) | |
| 2. Desagrarisation of local economy | W7 | The percentage of non-agricultural businesses in the total number of businesses | M_W | 36.6% | Ministry of Finance (MF) and the Agency for Restructuring and Modernisation of Agriculture (ARiMR) |
| W8 | CIT and PIT revenues to the gmina’s budget per PLN 1 of agricultural tax revenue | M_W | 8.6 PLN | Local Data Bank (BDL) | |
| W9 | The number of KRUS pensions beneficiaries per 100 people of post-working age | W | 24.7 | Agricultural Social Insurance Fund (KRUS) and the Local Data Bank (BDL) | |
| 3. Agricultural sector | W10 | The average size of farms (ha) owned by direct payment applicants | M_W | 8.4 ha | Agency for Restructuring and Modernisation of Agriculture (ARiMR) |
| W11 | Number of agricultural land parcels per 100 ha | M_W | 76.9 | Agency for Restructuring and Modernisation of Agriculture (ARiMR) | |
| W12 | The percentage of direct payment applicants under the age of 40 years in the total number of applicants | M_W | 25.5% | Agency for Restructuring and Modernisation of Agriculture (ARiMR) | |
| 4. Non-farm sector | W13 | The number of entities registered in the REGON system per 1000 people of working age | M_W | 124.9 | Local Data Bank (BDL) |
| W14 | The number of PIT and CIT taxpayers conducting business per 1000 inhabitants | M_W | 49.2 | Ministry of Finance (MF) and the Local Data Bank (BDL) | |
| W15 | The percentage of public service operators in the total number of entities registered in the REGON system | M_W | 10.8% | Local Data Bank (BDL) | |
| 5. Demographic problems | W21 | The percentage of population of post-working age | W | 19.2% | Local Data Bank (BDL) |
| W22 | Feminisation ratio within the age range of 25 to 34 | W | 92.2 | Local Data Bank (BDL) | |
| W23 | Children-to-old-people ratio | W | 0.7 | Local Data Bank (BDL) | |
| W24 | Population growth per 1000 inhabitants | W | −0.7 | Local Data Bank (BDL) | |
| 6. Local public finances | W16 | Percentage of gmina’s own income in total income | M_W | 34% | Local Data Bank (BDL) |
| W17 | The index value G used in the calculation of compensatory subsidies | M_W | 65.9 | Ministry of Finance (MF) | |
| W18 | Gmina budget revenues from PIT and CIT per capita | M_W | 576.8 PLN | Local Data Bank (BDL) | |
| W19 | Share of funds for financing and co-financing of EU programmes and projects within gmina revenue | M_W | 3.6% | Local Data Bank (BDL) | |
| W20 | The percentage of capital expenditure in the general gmina’s budget expenditures | M_W | 16.4% | Local Data Bank (BDL) | |
| 7. Labour market balance degree | W25 | The percentage of registered unemployed among the working-age population | M_W | 4.1% | Ministry of Labour and Social Affairs (MPiPS) |
| W26 | Labour force aging ratio | W | 37.2 | Local Data Bank (BDL) | |
| W27 | The ratio of the migration attractiveness for internal migration | W | −0.07 | Local Data Bank (BDL) | |
| W28 | Insured (individuals paying insurance premiums) in KRUS (Agricultural Social Insurance Fund) per 100 hectares of farmland | W | 8.1 | Agricultural Social Insurance Fund (KRUS) and Agricultural Social Insurance Fund (ARIMR) | |
| 8. Educational problems | W29 | The percentage of children attending preschool in the 3 to 5 age group | M_W | 75.7% | Local Data Bank (BDL) |
| W30 | Gross enrolment ratio at the primary school level | M_W | 88.7 | Local Data Bank (BDL) | |
| W31 | The average primary school final test result (score) | M_W | Central Examination Commission (CKE) | ||
| W32 | The average primary school final test result—Maths and Polish | M_W | 50.7% | Central Examination Commission (CKE) | |
| W33 | The percentage of local council members who are university or high-school graduates | M_W | 73.3% | Local Data Bank (BDL) | |
| 9. Societal activity | W34 | Voter turnout in local elections (village heads and mayors) | M_W | 55.8% | National Electoral Commission (PKW) |
| W35 | Voter turnout in the presidential election (first round) | M_W | 60.6% | National Electoral Commission (PKW) | |
| W36 | The number of NGOs per 10,000 population | M_W | 33 | Local Data Bank (BDL) | |
| W37 | The percentage of PIT taxpayers donating 1% to non-profit organisations | W | 47.7% | Ministry of Finance (MF) | |
| W38 | The number of applications for funding of projects co-financed by the European Union for the years 2007–2013 per 10,000 inhabitants | M_W | 80 | Ministry of Infrastructure and Development (MIiR) | |
| W39 | The number of applications for funding of projects under the LEADER initiative for 2007–2013 submitted via the LAGs per 10,000 inhabitants | M_W | 11 | 16 Offices of Marshals | |
| 10. Social cohesion of local community | W40 | The average annual income of a PIT taxpayer | M_W | 35,220 PLN | Ministry of Finance (MF) |
| W41 | The percentage of long-term unemployed in the working-age population | M_W | 2% | Ministry of Labour and Social Affairs (MPiPS) | |
| W42 | The percentage of families covered by the social welfare system in the general population of a gmina | M_W | 6.1% | Ministry of Labour and Social Affairs (MPiPS) | |
| W43 | The number of dwellings with access to internet service as a proportion of total dwellings | W | 76.1% | Office of Electronic Communications (UKE) | |
| W44 | The average primary school final test result in a foreign language | M_W | 49.4% | Central Examination Commission (CKE) | |
| 11. Living conditions elements | W45 | The percentage of flats with central heating | W | 69.7% | Local Data Bank (BDL) |
| W46 | The percentage of permanently inhabited flats with a flushable toilet | W | 87.1% | Local Data Bank (BDL) | |
| W47 | Usable floor space per inhabitant | W | 28.5 m2 | Local Data Bank (BDL) |
References
- Myrdal, G. Economic Theory and Underdeveloped Regions; Gerald Duckworth & Co.: London, UK, 1957. [Google Scholar]
- Hirschman, A.O. The Strategy of Economic Development; Yale University Press: New Haven, CT, USA, 1958. [Google Scholar]
- Friedmann, J. A General Theory of Polarized Development; The Ford Foundation: Santo Domingo, Chile, 1967. [Google Scholar]
- Krugman, P. Development Geography, and Economic Theory; MIT Press: Cambridge, UK, 1995. [Google Scholar]
- Iammarino, S.; Rodriguez-Pose, A.; Storper, M. Regional inequality in Europe: Evidence, theory and policy implications. J. Econ. Geogr. 2018, 19, 273–298. [Google Scholar] [CrossRef]
- Woods, M. Rural Geography; Sage: London, UK, 2005. [Google Scholar]
- Begg, I. Cohesion or Confusion: A Policy Searching for Objectives. Eur. Integr. 2010, 32, 77–96. [Google Scholar] [CrossRef]
- OECD. Rural Well-Being: Geography of Opportunities, OECD Rural Studies; OECD Publishing: Paris, France, 2020; Available online: https://www.oecd.org/regional/rural-well-being-d25cef80-en.htm (accessed on 1 June 2021).
- Pahl, R.E. The rural–urban continuum. Sociol. Rural. 1966, 6, 299–329. [Google Scholar] [CrossRef]
- European Union; FAO; UN-Habitat; OECD; The World Bank. Applying the Degree of Urbanisation—A Methodological Manual to Define Cities, Towns and Rural Areas for International Comparisons, 2021 ed.; Publications Office of the EU: Luxembourg, 2021. [Google Scholar] [CrossRef]
- Saraceno, E. Disparity and Diversity: Their Use in EU Rural Policies. Sociol. Rural. 2013, 53, 331–348. [Google Scholar] [CrossRef]
- Sherry, E.; Shortall, S. Methodological fallacies and perceptions of rural disparity: How rural proofing addresses real versus abstract needs. J. Rural Stud. 2018, 68, 336–343. [Google Scholar] [CrossRef]
- OECD. OECD Principles on Urban Policy; OECD CFE: Paris, France, 2019; Available online: https://www.oecd.org/cfe/Brochure-OECD-Principles-Urban-Policy.pdf (accessed on 1 June 2021).
- Hoggart, K. Not a definition of rural. Area 1988, 20, 35–40. [Google Scholar]
- Mormont, M. Who is rural? Or, how to be rural: Towards a sociology of the rural. In Rural Restructuring: Global Processes and Their Responses; Marsden, T., Lowe, P., Whatmore, S., Eds.; David Fulton: London, UK, 1990; pp. 21–44. [Google Scholar]
- Halfacree, K.H. Locality and social representation: Space, discourse and alternative definitions of the rural. J. Rural. Stud. 1993, 9, 23–37. [Google Scholar] [CrossRef]
- Cloke, P.J. Rural life-styles: Material opportunity, cultural experience, and how theory can undermine policy. Econ. Geogr. 1996, 72, 433–449. [Google Scholar] [CrossRef]
- Cromartie, J.; Bucholtz, S. Defining the ”rural” in rural America. Amber Waves 2008, 6, 3. [Google Scholar]
- FAO. Guidelines on Defining Rural Areas and Compiling Indicators for Development Policy. 2018. Available online: http://www.fao.org/3/ca6392en/ca6392en.pdf (accessed on 15 June 2021).
- UNSD. A Recommendation on the Method to Delineate Cities, Urban and Rural Areas for International Statistical Comparisons. 2020. Available online: https://unstats.un.org/unsd/statcom/51st-session/documents/BG-Item3j-Recommendation-E.pdf (accessed on 25 May 2021).
- Cloke, P.J. An index of rurality for England and Wales. Reg. Stud. 1977, 11, 31–46. [Google Scholar] [CrossRef]
- Halfacree, K.H. Talking about rurality: Social representations of the rural as expressed by residents of six English parishes. J. Rural. Stud. 1995, 11, 1–20. [Google Scholar] [CrossRef]
- Isserman, A.M. In the national interest: Defining rural and urban correctly in research and public policy. Int. Reg. Sci. Rev. 2005, 28, 465–499. [Google Scholar] [CrossRef]
- Nelson, K.S.; Nguyen, T.D.; Brownstein, N.A.; Garcia, D.; Walker, H.C.; Watson, J.T.; Xin, A. Definitions, measures, and uses of rurality: A systematic review of the empirical and quantitative literature. J. Rural Stud. 2021, 82, 351–365. [Google Scholar] [CrossRef]
- Rodríguez-Pose, A. The revenge of the places that don’t matter (and what to do about it). Camb. J. Reg. Econ. Soc. 2018, 11, 189–209. [Google Scholar] [CrossRef]
- Edensor, T.; Kalandides, A.; Kothari, U. (Eds.) The Routledge Handbook of Place; Routledge: Abingdon, UK; New York, NY, USA, 2020. [Google Scholar]
- Rye, J.F. Rural youths’ images of the rural. J. Rural Stud. 2006, 22, 409–421. [Google Scholar] [CrossRef]
- Brezzi, M.; Dijkstra, L.; Ruiz, V. OECD Extended Regional Typology: The Economic Performance of Remote Rural Regions. OECD Reg. Dev. Work. Pap. 2011, 6, 1–21. [Google Scholar] [CrossRef]
- Pain, A.; Hansen, K. Rural Development; Routledge: Abingdon, UK, 2019. [Google Scholar]
- Halamska, M. Continuity and Change. Rural Poland 1918–2018; Searching for Sources of the Present, IRWiR PAN; Scholar Publishing House Ltd.: Warsaw, Poland, 2020. [Google Scholar]
- OECD. Rural 3.0. Policy Note—A Framework for Rural Development; OECD: Paris, France, 2018; Available online: https://www.oecd.org/cfe/regional-policy/Rural-3.0-Policy-Note.pdf (accessed on 1 June 2021).
- Stanny, M. Wieś, obszar wiejski, ludność wiejska—O problemach z ich definiowaniem. Wielowymiarowe spojrzenie. WiR 2014, 162, 123–138. [Google Scholar]
- Sorokin, P.A.; Zimmerman, C.C. Principles of Rural-Urban Sociology; Henry Holt and Co.: New York, NY, USA, 1929. [Google Scholar]
- Cloke, P.; Edwards, G. Rurality in England and Wales 1981: A replication of the 1971 index. Reg. Stud. 1986, 4, 289–306. [Google Scholar] [CrossRef]
- Harrington, V.; O’Donoghue, D. Rurality in England and Wales 1991: A Replication and Extension of the 1981 Rurality Index. Sociol. Rural 1998, 38, 178–203. [Google Scholar] [CrossRef]
- Prieto-Lara, E.; Ocaña-Riola, R. Updating Rurality Index for Small Areas in Spain. Soc. Indic. Res. 2010, 95, 267–280. [Google Scholar] [CrossRef]
- Salvati, L.; Zitti, M.; Carlucci, M. In-between regional disparities and spatial heterogeneity: A multivariate analysis of territorial divides in Italy. J. Environ. Plan. Manag. 2016, 60, 997–1015. [Google Scholar] [CrossRef]
- Li, Y.; Long, H.; Liu, Y. Spatio-temporal pattern of China’s rural development: A rurality index perspective. J. Rural Stud. 2015, 38, 12–26. [Google Scholar] [CrossRef]
- Waldorf, B.; Kim, A. The Index of Relative Rurality (IRR): US County Data for 2000 and 2010. Purdue Univ. Res. Repos. 2018. [Google Scholar] [CrossRef]
- Nestorová Dická, J.; Gessert, A.; Sninčák, I. Rural and non-rural municipalities in the Slovak Republic. J. Maps 2019, 15, 84–93. [Google Scholar] [CrossRef]
- Woods, M.; Heley, J. Conceptualisation of Rural-Urban Relations and Synergies. Deliverable 1.1. In ROBUST Project Report; Department of Geography and Earth Sciences: Aberystwyth, UK, 2017; Available online: https://rural-urban.eu/publications/conceptualisation-rural-urban-relations-and-synergies (accessed on 26 May 2021).
- Murdoch, J.; Pratt, A.C. Rural studies: Modernism, postmodernism and the ‘post-rural’. J. Rural Stud. 1993, 9, 411–427. [Google Scholar] [CrossRef]
- Hedlund, M. Mapping the Socioeconomic Landscape of Rural Sweden: Towards a Typology of Rural Areas. Reg. Stud. 2016, 50, 460–474. [Google Scholar] [CrossRef]
- Cattivelli, V. Methods for the identification of urban, rural and peri-urban areas in Europe: An overview. J. Urban Regen. Renew. 2021, 14, 240–246. [Google Scholar]
- Nowak, S. Methodology of Sociological Research; Springer: Dordrecht, The Netherlands, 1977. [Google Scholar]
- Hartigan, J.A. Clustering Algorithms; John Wiley and Sons: New York, NY, USA, 1975. [Google Scholar]
- Kaufman, L.; Rousseeuw, P.J. Finding Groups in Data: An Introduction to Cluster Analysis; John Wiley & Sons: New York, NY, USA, 1990. [Google Scholar]
- Murtagh, F.; Legendre, P. Ward’s Hierarchical Agglomerative Clustering Method: Which Algorithms Implement Ward’s Criterion? J. Classif. 2014, 31, 274–295. [Google Scholar] [CrossRef]
- Gülagiz, F.K.; Sahin, S. Comparison of Hierarchical and Non-Hierarchical Clustering Algorithms. Int. J. Comput. Eng. Inf. Technol. 2017, 9, 6–14. [Google Scholar]
- MacQueen, J. Some methods for classification and analysis of multivariate observations. In Proceedings of the 5th Berkeley Symposium on Mathematical Statistics and Probability, the Statistical Laboratory, University of California, Oakland, CA, USA, 21 June–18 July 1965; Le Cam, L.M., Neyman, J., Eds.; University of California Press: Berkeley, CA, USA, 1967; pp. 281–297. [Google Scholar]
- Murtagh, F.; Heck, A. Multivariate Data Analysis; D. Reidel Publishing Co.: Dordrecht, The Netherlands, 1987. [Google Scholar]
- Imaizumi, T.; Okada, A.; Miyamoto, S.; Sakaori, F.; Yamamoto, Y.; Vichi, M. (Eds.) Advanced Studies in Classification and Data Science; Springer: Singapore, 2020. [Google Scholar]
- Copus, A.; Psaltopoulos, D.; Skuras, D.; Terluin, I.; Weingarten, P. Approaches to Rural Typology in the European Union. JRC Sci. Tech. Rep. 2008, 48464, 47–54. [Google Scholar]
- Weingarten, P.; Copus, A.; Psaltopoulos, D.; Skuras, D.; Terluin, I. Typology of European Rural Areas for Spatial Impact Assessment of Policies. JRC Sci. Tech. Rep. 2010, 58493. [Google Scholar]
- Hopkins, J.; Copus, A. Definitions, Measurement Approaches and Typologies of Rural Areas and Small Towns: A Review; The James Hutton Institute: Aberdeen, UK, 2018. [Google Scholar]
- Perlín, R.; Kucerova, S.; Kucera, Z. A typology of rural space in Czechia according to its potential for development. Geografie 2010, 115, 161–187. [Google Scholar] [CrossRef]
- Klufová, R. Current Delimitation and Typology of the Czech Countryside and its Importance for Rural Development. East. Eur. Countrys. 2016, 22, 229–251. [Google Scholar] [CrossRef]
- Mikhaylova, S.; Budazhanayeva, M.T.; Sarycheva, T.V.; Bakumenko, L.P. Typology of Rural Territories of the Russian Federation Subjects. Mediterr. J. Soc. Sci. 2015, 6, 205–212. [Google Scholar] [CrossRef]
- Bański, J.; Mazur, M. Classification of rural areas in Poland as an instrument of territorial policy. Land Use Policy 2016, 54, 1–17. [Google Scholar] [CrossRef]
- SYKE. Urban-Rural Classification. 2020. Available online: https://www.ymparisto.fi/en-US/Living_environment_and_planning/Community_structure/Information_about_the_community_structure/Urbanrural_classification (accessed on 4 June 2021).
- Gajić, A.; Krunić, N.; Protić, B. Classification of Rural Areas in Serbia: Framework and Implications for Spatial Planning. Sustainability 2021, 13, 1596. [Google Scholar] [CrossRef]
- Van Eupen, M.; Metzger, M.J.; Pérez-Soba, M.; Verburg, P.H.; Van Doorn, A.; Bunce, R.G.H. A rural typology for strategic European policies. Land Use Policy 2012, 29, 473–482. [Google Scholar] [CrossRef]
- Wiggins, S.; Proctor, S. How special are rural areas? The economic implications of locations for rural development. Dev. Policy Rev. 2001, 19, 427–436. [Google Scholar] [CrossRef]
- Santacroce, P. Atlante dei Comuni d’Italia: Relativo Alle Modifiche Edilizio-Abitative ed Agricole Negli Anni Settanta e Primi Anni Ottanta; Franco Angeli: Milan, Italy, 1989. [Google Scholar]
- Andrychowicz, B.; Conte, A.; Frenkel, I.; Rosner, A.; Santacroce, P. Atlas Demograficzny i Społeczno-Zawodowy Obszarów Wiejskich w Polsce, PTD; IRWiR PAN: Warsaw, Poland, 1995. [Google Scholar]
- OECD. Rural Policy Reviews: Poland 2018; OECD Publishing: Paris, France, 2018; Available online: https://www.oecd-ilibrary.org/urban-rural-and-regional-development/oecd-rural-policy-reviews-poland-2018_9789264289925-en (accessed on 1 June 2021).
- Freshwater, D. The importance of improving incentives and employment opportunities for farm households in Poland. WiR 2017, 176, 11–33. [Google Scholar] [CrossRef]
- Rosner, A.; Stanny, M. Rozważania o pojęciu i procesie dezagraryzacji polskiej wsi. WiR 2018, 2, 281–292. [Google Scholar] [CrossRef]
- Gorlach, K.; Starosta, P. De-peasantisation or repeasantisation? Changing rural social structures in Poland after World War II. In Europe’s Green Ring; Granberg, I., Kovách, I., Tovey, H., Eds.; Ashgate Publishing: Farnham, UK, 2001; pp. 42–66. [Google Scholar]
- Local Data Bank of Statistics Poland (BDL GUS). Available online: https://bdl.stat.gov.pl/BDL/start (accessed on 1 June 2021).
- Henningsen, A. Why is the Polish farm sector still so underdeveloped? Post Communist Econ. 2009, 21, 47–64. [Google Scholar] [CrossRef]
- Halamska, M. The evolution of family farms in Poland: Present time and the weight of the past. East. Eur. Countrys. 2016, 22, 27–51. [Google Scholar] [CrossRef]
- Rosner, A.; Stanny, M. Socio-Economic Development of Rural Areas in Poland; EFRWP; IRWiR PAN: Warsaw, Poland, 2017; Available online: http://www.irwirpan.waw.pl/dir_upload/site/files/Lukasz/MROW_en_2017.pdf (accessed on 4 July 2021).
- Stanny, M.; Rosner, A.; Komorowski, Ł. Monitoring Rozwoju Obszarów Wiejskich. Etap III. Struktury Społeczno-Gospodarcze, Ich Przestrzenne Zróżnicowanie i Dynamika; EFRWP; IRWiR PAN: Warsaw, Poland, 2018. [Google Scholar]
- Sneath, P.H.A.; Sokal, R.R. Numerical Taxonomy: The Principles and Practice of Numerical Classification; W.H. Freeman and Co.: San Francisco, CA, USA, 1973. [Google Scholar]
- Parysek, J.J.; Wojtasiewicz, L. Metody Analizy Regionalnej i Metody Planowania Regionalnego; PWN: Warsaw, Poland, 1979. [Google Scholar]
- Kukuła, K.; Bogocz, D. Zero unitarization method and its application in ranking research in agriculture. Econ. Reg. Stud. 2014, 7, 5–13. [Google Scholar]
- Wang, B.; Zhang, S. A Subjective and Objective Integration Approach of Determining Weights for Trustworthy Measurement. IEEE Access 2018, 6, 25829–25835. [Google Scholar] [CrossRef]
- Diday, E. The dynamic clusters method in nonhierarchical clustering. Int. J. Comput. Inf. Sci. 1973, 2, 61–88. [Google Scholar] [CrossRef]
- Liberti, L.; Lavor, C. Euclidean Distance Geometry: An Introduction; Springer: Cham, Switzerland, 2017. [Google Scholar]
- Siegel, S.; Castellan, N.J. Nonparametric Statistics for the Behavioral Sciences; McGraw-Hill: New York, NY, USA, 1988. [Google Scholar]
- Abdi, H. Kendall rank correlation. In Encyclopedia of Measurement and Statistics; Salkind, N.J., Ed.; SAGE Publications: Thousand Oaks, CA, USA, 2007. [Google Scholar]
- Stasiak, A.; Mirowski, W. (Eds.) The processes of depopulation of rural areas in central and eastern europe. In Proceedings of the International Seminar on Rural Depopulation, Szymbark, Poland, September 1989; Institute of Geography and Spatial Organization Polish Academy of Sciences: Warsaw, Poland, 1990. [Google Scholar]
- Stanny, M. Spatial diversification of the balance on the labour market in rural areas in Poland. Bull. Geography. Socio-Econ. Ser. 2010, 14, 103–111. [Google Scholar] [CrossRef][Green Version]
- Wandycz, P.S. The Lands of Partitioned Poland, 1795–1918; A History of East Central Europe; University of Washington Press: Washington, WA, USA, 1974; Volume 7. [Google Scholar]
- Koryś, P. Poland from Partitions to EU Accession: A Modern Economic History, 1772–2004; Palgrave Macmillan: Cham, Switzerland, 2018. [Google Scholar]
- Stanny, M.; Rosner, A.; Kozdroń, E. Changes in the Spatial Distribution of the Level and Dynamics of Socio-Economic Development of Rural Areas in Poland. WiR 2016, 4, 29–47. [Google Scholar] [CrossRef]
- Gorlach, K. The peasant issue in contemporary Poland. Pol. Sociol. Rev. 1995, 110, 139–158. [Google Scholar]
- Rosner, A.; Wesołowska, M. Deagrarianisation of the Economic Structure and the Evolution of Rural Settlement Patterns in Poland. Land 2020, 9, 523. [Google Scholar] [CrossRef]
- Binder, P. Młodzi a Bieda: Strategie Radzenia Sobie w Doświadczeniu Młodego Pokolenia Wsi Pokołchozowych i Popegeerowskich; IFiS PAN: Warsaw, Poland, 2014. [Google Scholar]
- Tarkowska, E. Poverty and education risk of “inheritance” of poverty in the former state farms in Poland. Pol. Sociol. Rev. 2002, 138, 203–215. [Google Scholar]
- Rosner, A. Migracje Wieś—Miasto a Przepływy Między Typami Gospodarstw Domowych Ludności Wiejskiej; IRWiR PAN: Warsaw, Poland, 1991. [Google Scholar]
- Okólski, M. Spatial mobility from the perspective of the incomplete migration concept. Cent. East. Eur. Migr. Rev. 2012, 1, 11–35. [Google Scholar]
- Kołodziejczak, A.; Kacprzak, E.; Maćkiewicz, B. Problemy rolnictwa na obszarach metropolitalnych. Rozw. Reg. Polityka Reg. 2019, 47, 37–56. [Google Scholar] [CrossRef]
- Zwęglińska-Gałecka, D. Gentryfikacja wsi i jej zasięg. WiR 2019, 2, 57–87. [Google Scholar] [CrossRef]
- Cattivelli, V. Institutional Methods for the Identification of Urban and Rural Areas—A Review for Italy. Smart Sustain. Plan. Cities Reg. 2019, 187–207. [Google Scholar] [CrossRef]
- OECD. Principles on Urban Policy and on Rural Policy. In Megatrends: Building Better Futures for Regions, Cities and Rural Area; OECD Regional Development Ministerial: Athens, Greece, 2019; Available online: https://www.oecd.org/regional/ministerial/documents/urban-rural-Principles.pdf (accessed on 1 June 2021).
- SHERPA. Long-Term Vision for Rural Areas: Contribution from 20 Science-Society-Policy Platforms, SHERPA Discussion Paper. 2020. Available online: https://rural-interfaces.eu/wp-content/uploads/2020/11/SHERPA_Discussion-Paper_Long-term-vision-rural-areas.pdf (accessed on 30 June 2021).
- EC. A Long-Term Vision for the EU’s Rural Areas—Towards Stronger, Connected, Resilient and Prosperous Rural Areas by 2040; COM 345 Final; EC: Brussels, Belgium, 2021. [Google Scholar]
- Li, Y.; Westlund, H.; Liu, Y. Why some rural areas decline while some others not: An overview of rural evolution in the world. J. Rural Stud. 2019, 68, 135–143. [Google Scholar] [CrossRef]
- ESPON. ESCAPE—European Shrinking Rural Areas: Challenges, Actions and Perspectives for Territorial Governance. Applied Research. Synthesis Report. 2020. Available online: https://www.espon.eu/escape (accessed on 1 July 2021).
- MFiPR. Wpływ Polityki Spójności na Rozwój Obszarów Wiejskich; MFiPR: Warsaw, Poland, 2019. [Google Scholar]
- Rosner, A.; Stanny, M.; Komorowski, Ł. Zróżnicowanie Przestrzenne Poziomu Rozwoju Społeczno-Gospodarczego Obszarów Wiejskich Wielkopolski Oraz Ich Pozycja na tle Obszarów Wiejskich Kraju; WROT UMWW: Poznań, Poland, 2018. [Google Scholar]


| Components of Socio-Economic Development | Type | Overall Profile | ||||||
|---|---|---|---|---|---|---|---|---|
| 1 | 2 | 3 | 4 | 5 | 6 | 7 | ||
| Type characteristics | ||||||||
| Spatial accessibility | 88 | 91 | 99 | 105 | 99 | 113 | 118 | 100 |
| Deagrarianisation of the local economy | 47 | 97 | 72 | 112 | 111 | 144 | 169 | 100 |
| Farm sector | 102 | 121 | 96 | 75 | 110 | 91 | 101 | 100 |
| Non-farm sector | 75 | 93 | 88 | 98 | 109 | 119 | 150 | 100 |
| Local public finance | 58 | 83 | 73 | 76 | 112 | 151 | 224 | 100 |
| Demographic issues | 82 | 100 | 93 | 106 | 106 | 105 | 126 | 100 |
| Labour market balance | 86 | 85 | 97 | 104 | 105 | 112 | 129 | 100 |
| Educational issues | 85 | 87 | 101 | 106 | 97 | 117 | 125 | 100 |
| Societal activity | 84 | 88 | 98 | 103 | 101 | 116 | 133 | 100 |
| Social cohesion | 82 | 80 | 95 | 104 | 103 | 120 | 143 | 100 |
| Living conditions | 75 | 99 | 89 | 100 | 109 | 116 | 131 | 100 |
| General characteristics | ||||||||
| Number of gminas | 474 | 381 | 449 | 161 | 433 | 227 | 48 | ∑2173 |
| % of gminas | 22 | 18 | 21 | 7 | 20 | 10 | 2 | ∑100 |
| Weight % (population) | 12 | 14 | 17 | 10 | 23 | 19 | 5 | ∑100 |
| Population density (people/sq. km) | 36 | 30 | 56 | 111 | 49 | 107 | 159 | M52.4 |
| Component | 1. | 2. | 3. | 4. | 5. | 6. | 7. | 8. | 9. | 10. | 11. |
|---|---|---|---|---|---|---|---|---|---|---|---|
| 1. Spatial accessibility | 1 | ||||||||||
| 2. Deagrarianisation of the local economy | 0.274 | 1 | |||||||||
| 3. Farm sector | −0.154 | −0.025 | 1 | ||||||||
| 4. Non-farm sector | 0.200 | 0.484 | −0.024 | 1 | |||||||
| 5. Local public finance | 0.234 | 0.477 | 0.052 | 0.410 | 1 | ||||||
| 6. Demographic issues | 0.184 | 0.380 | 0.059 | 0.304 | 0.202 | 1 | |||||
| 7. Labour market balance | 0.275 | 0.257 | −0.180 | 0.321 | 0.289 | 0.348 | 1 | ||||
| 8. Educational issues | 0.244 | 0.318 | −0.225 | 0.252 | 0.289 | 0.108 | 0.265 | 1 | |||
| 9. Societal activity | 0.174 | 0.250 | −0.159 | 0.200 | 0.314 | 0.159 | 0.294 | 0.246 | 1 | ||
| 10. Social cohesion | 0.284 | 0.317 | −0.217 | 0.357 | 0.380 | 0.239 | 0.587 | 0.381 | 0.336 | 1 | |
| 11. Living conditions | 0.274 | 0.517 | 0.082 | 0.421 | 0.438 | 0.436 | 0.348 | 0.238 | 0.245 | 0.403 | 1 |
Publisher’s Note: MDPI stays neutral with regard to jurisdictional claims in published maps and institutional affiliations. |
© 2021 by the authors. Licensee MDPI, Basel, Switzerland. This article is an open access article distributed under the terms and conditions of the Creative Commons Attribution (CC BY) license (https://creativecommons.org/licenses/by/4.0/).
Share and Cite
Stanny, M.; Komorowski, Ł.; Rosner, A. The Socio-Economic Heterogeneity of Rural Areas: Towards a Rural Typology of Poland. Energies 2021, 14, 5030. https://doi.org/10.3390/en14165030
Stanny M, Komorowski Ł, Rosner A. The Socio-Economic Heterogeneity of Rural Areas: Towards a Rural Typology of Poland. Energies. 2021; 14(16):5030. https://doi.org/10.3390/en14165030
Chicago/Turabian StyleStanny, Monika, Łukasz Komorowski, and Andrzej Rosner. 2021. "The Socio-Economic Heterogeneity of Rural Areas: Towards a Rural Typology of Poland" Energies 14, no. 16: 5030. https://doi.org/10.3390/en14165030
APA StyleStanny, M., Komorowski, Ł., & Rosner, A. (2021). The Socio-Economic Heterogeneity of Rural Areas: Towards a Rural Typology of Poland. Energies, 14(16), 5030. https://doi.org/10.3390/en14165030