
Failure Diagnosis and Root-Cause Analysis of In-Service and Defective Distribution Transformers


Abstract
:1. Introduction
2. Existing Literature
2.1. Significance of Distribution Transformers in Distributed Generation
2.2. Significance of Diagnostic Measurements
2.3. Current Focus on Distribution Transformers
2.4. Failures in Distribution Transformers
2.5. Currently Practiced Maintenance Test Methods
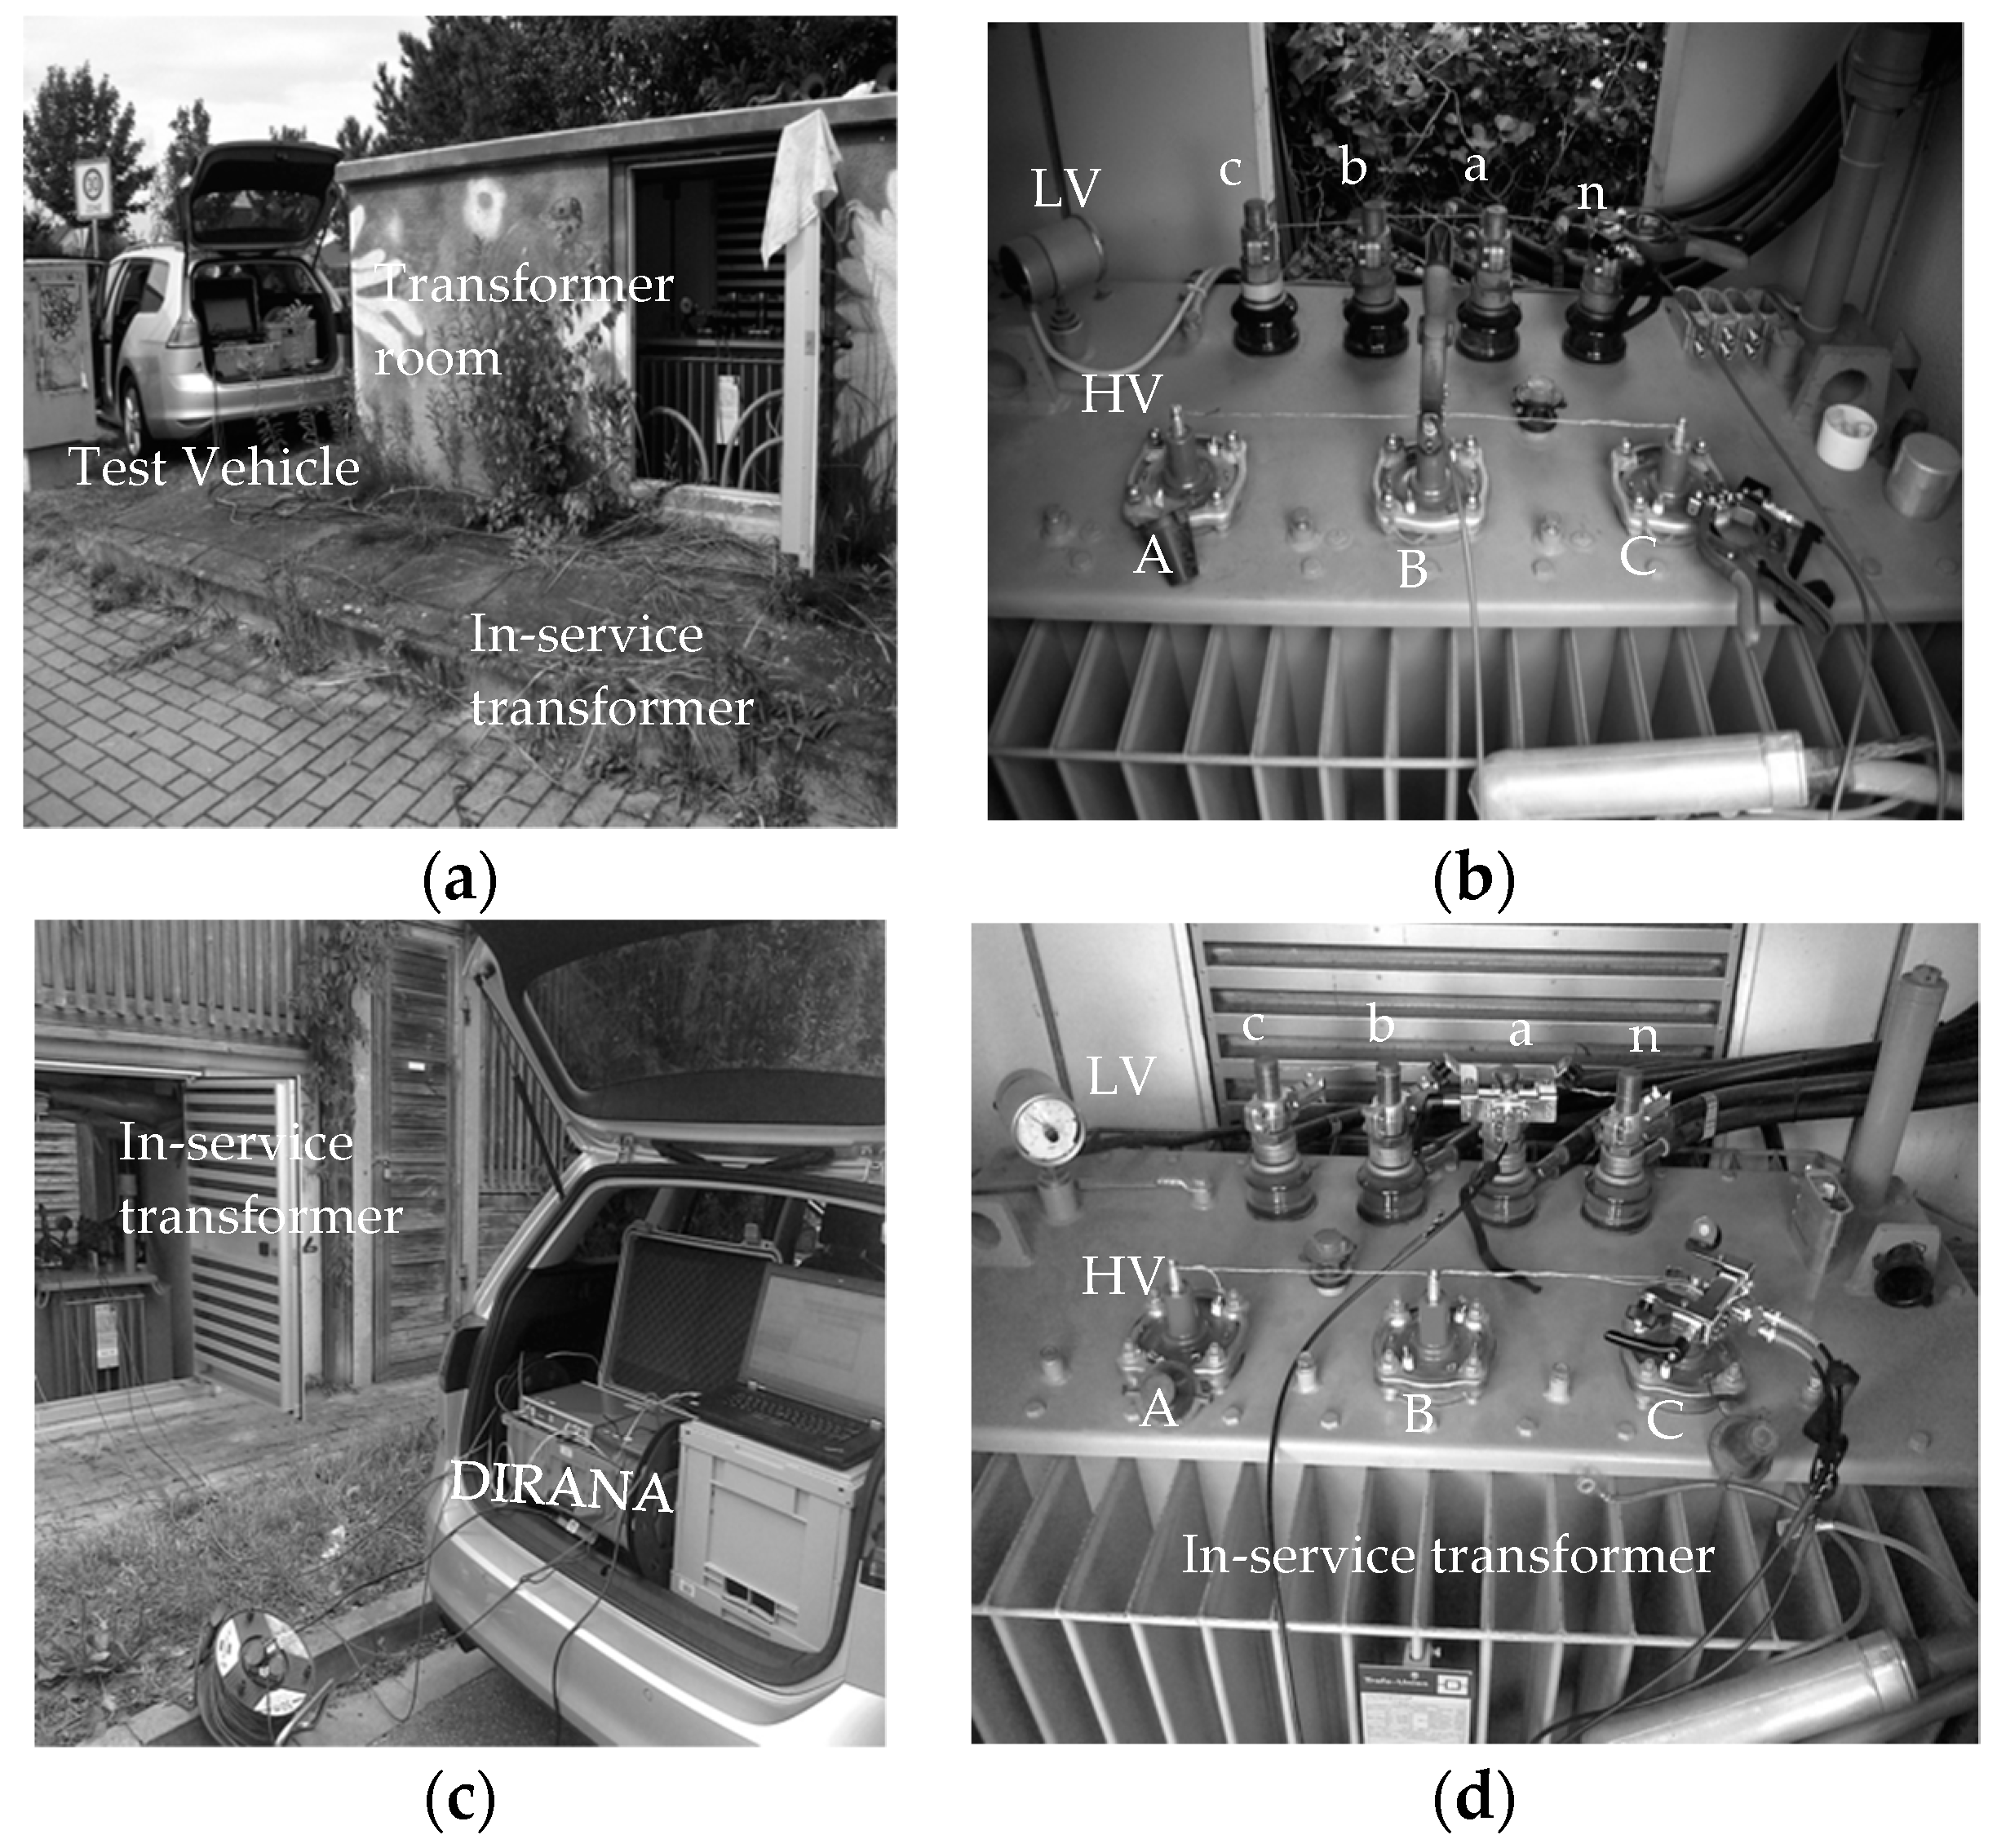
3. Onsite Transformers
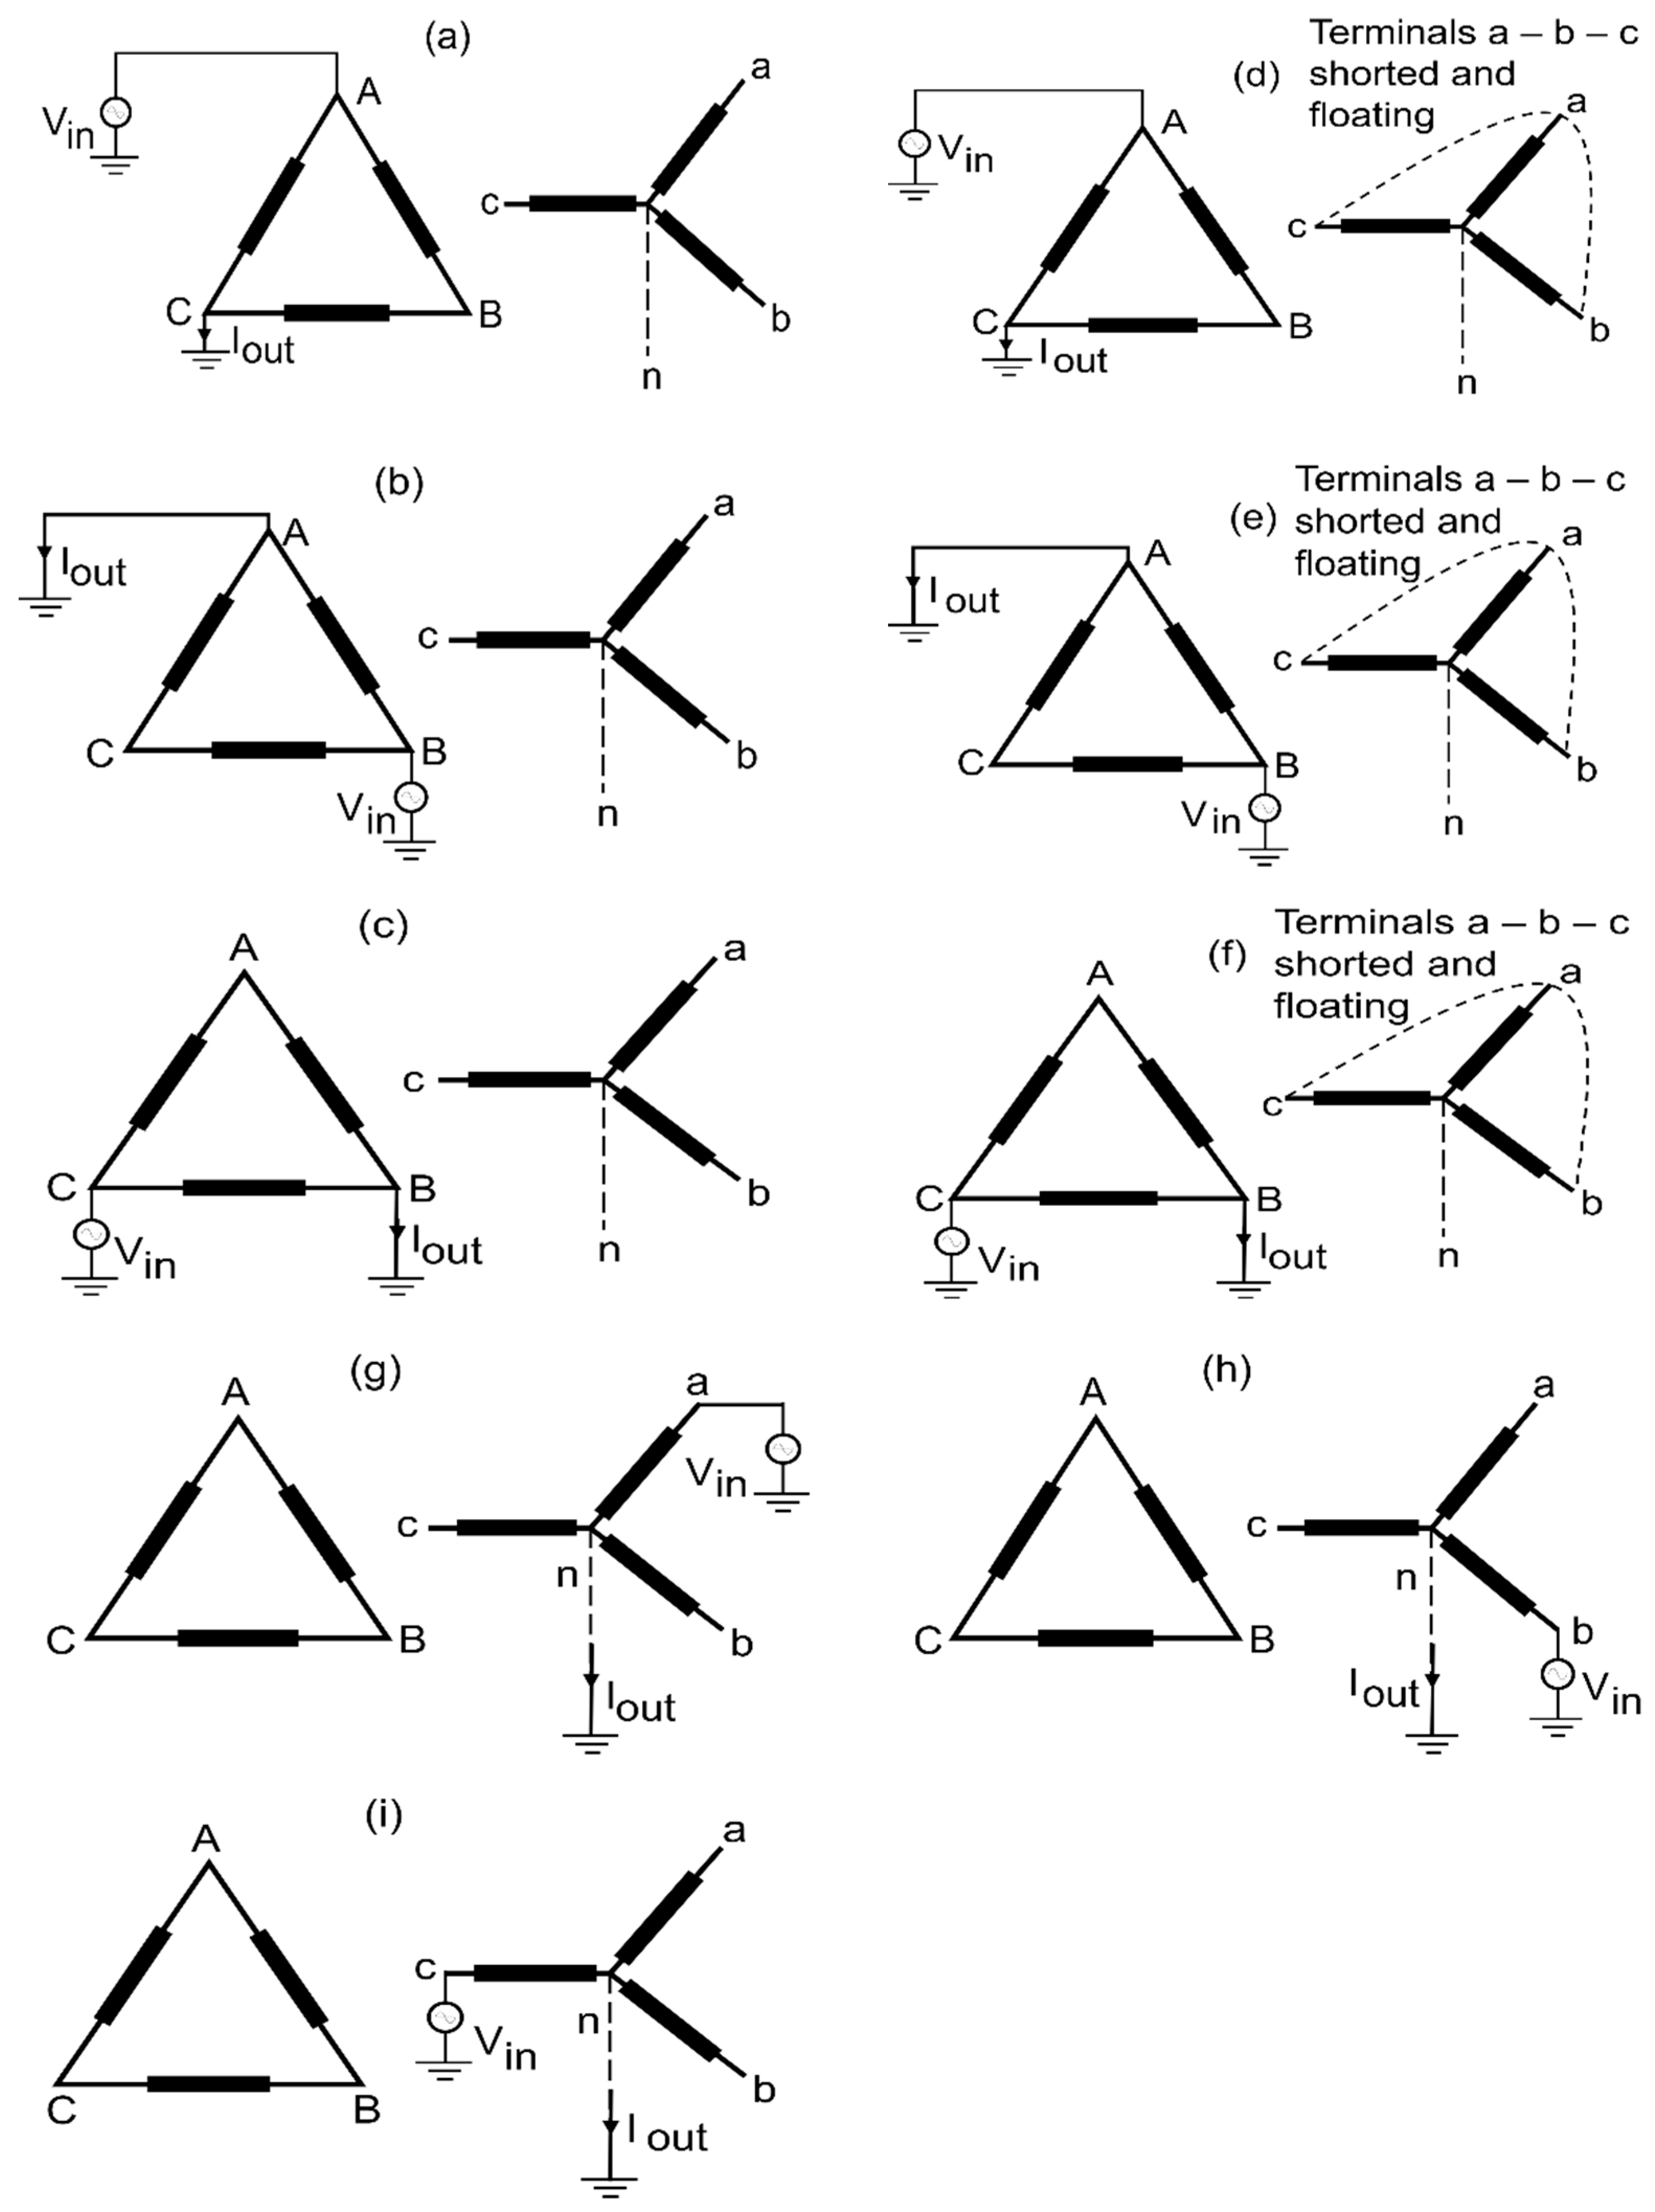
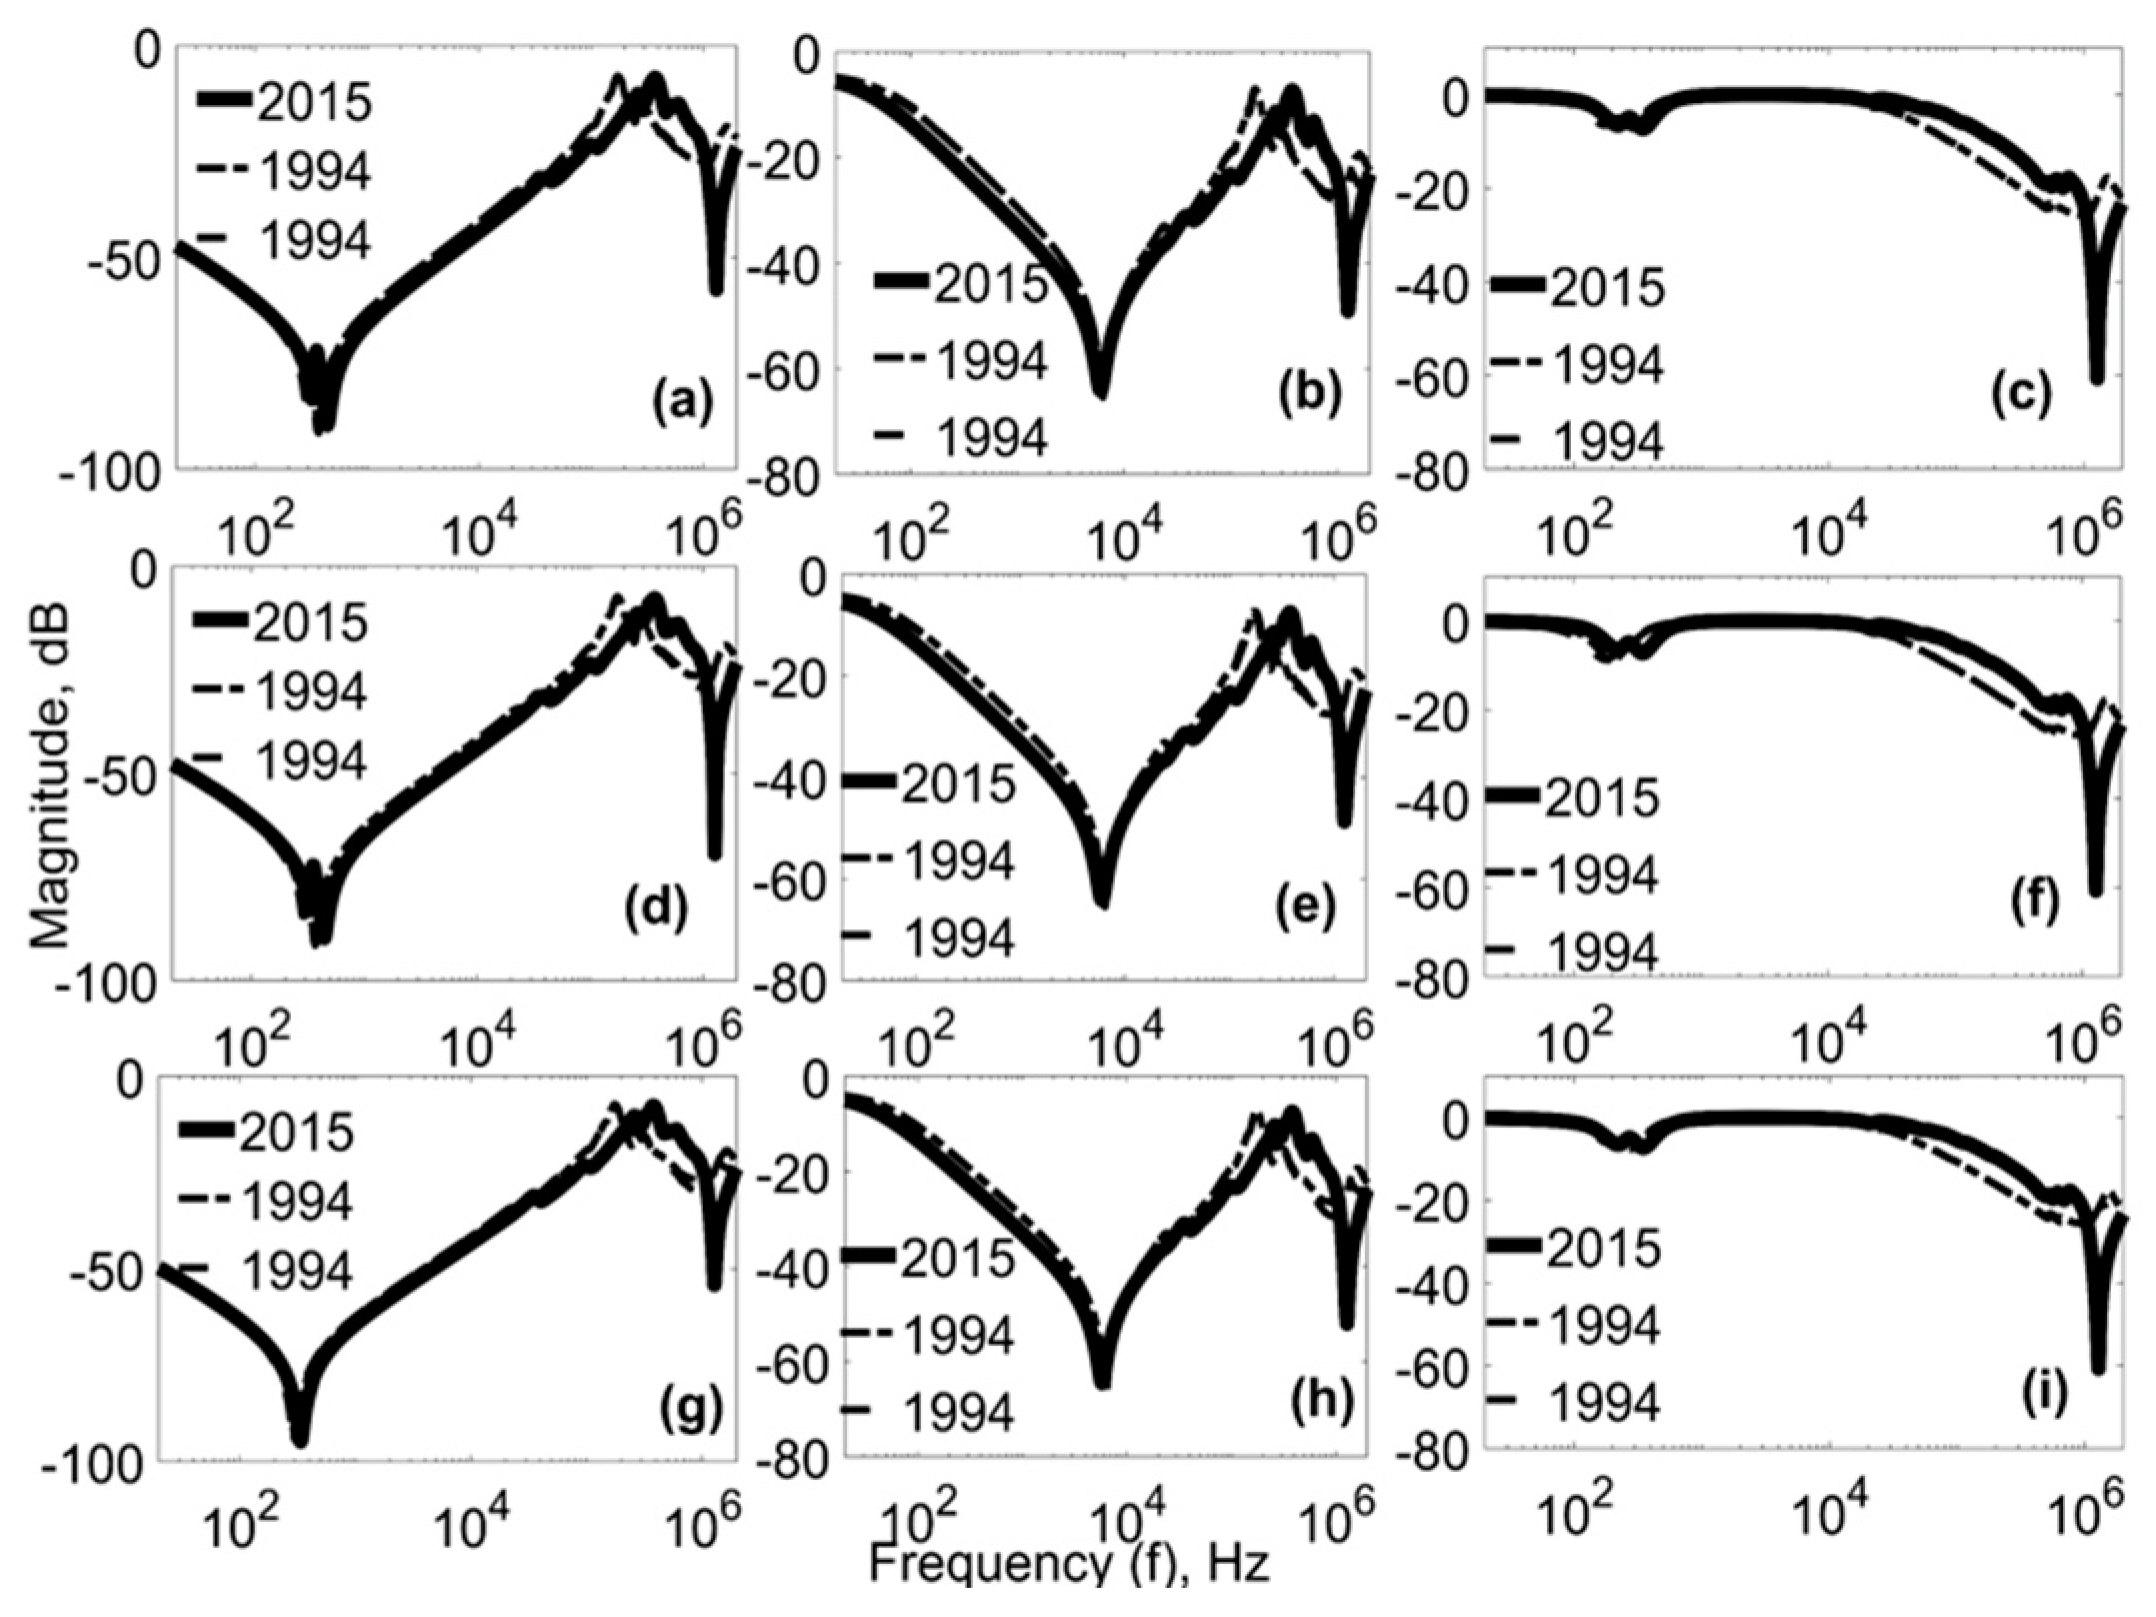
4. Measurements and Analysis
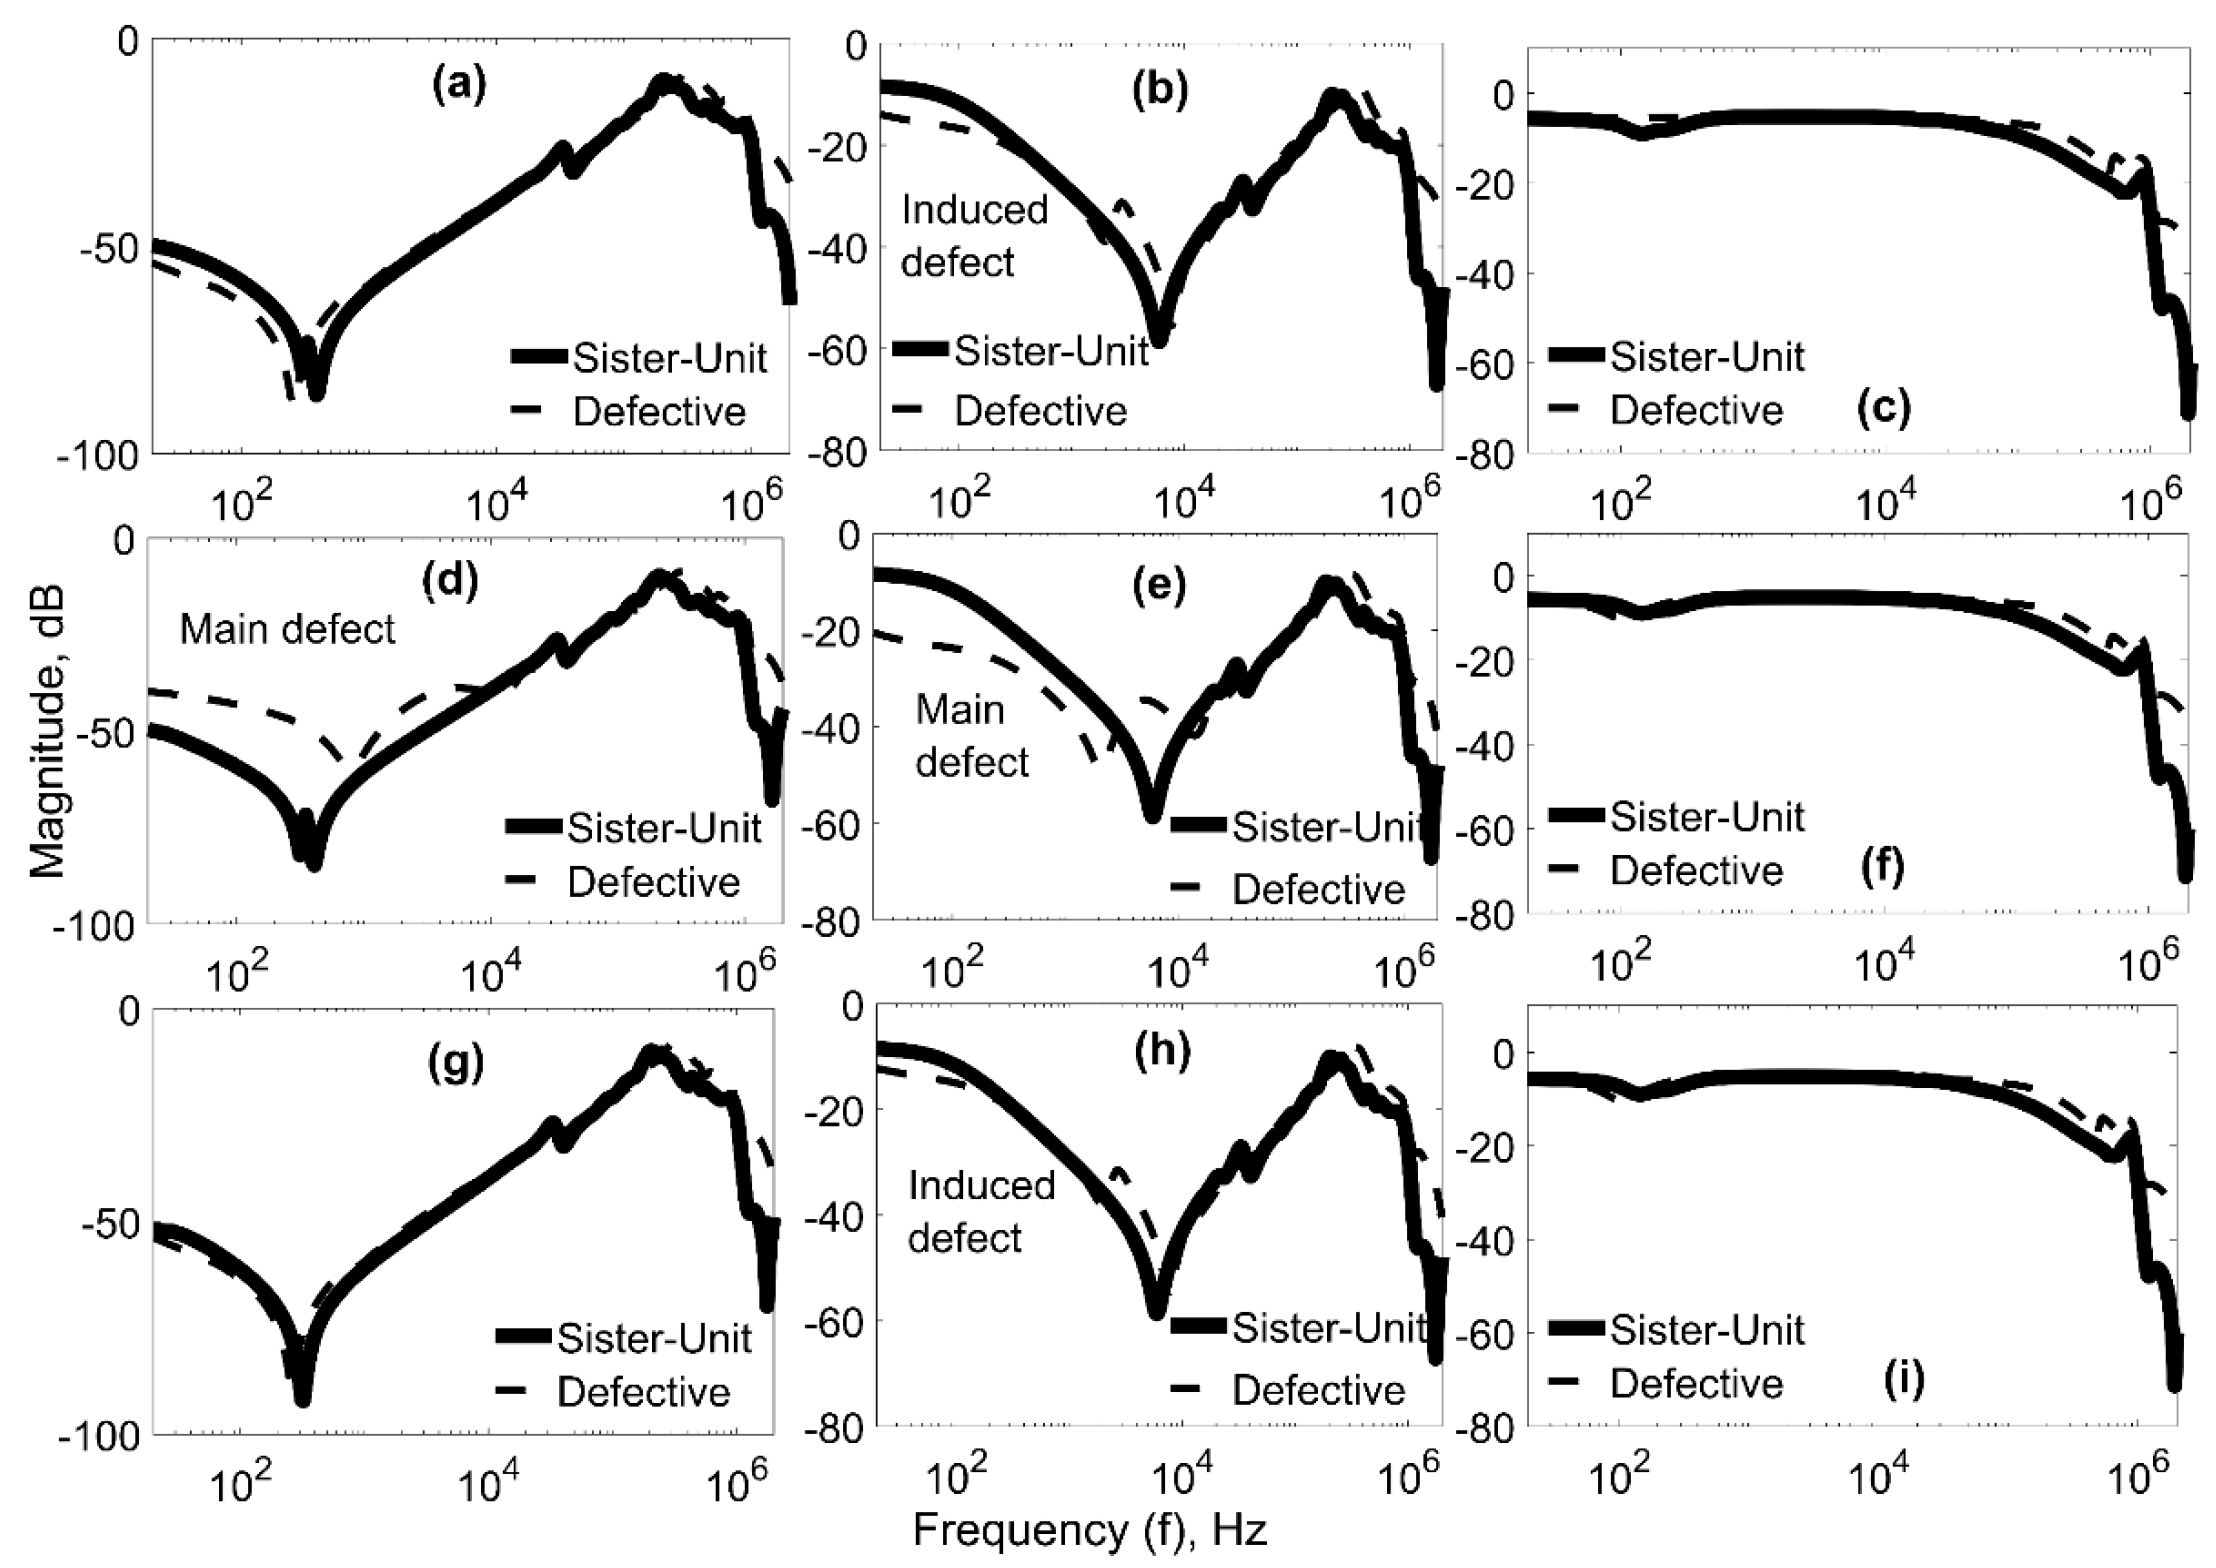
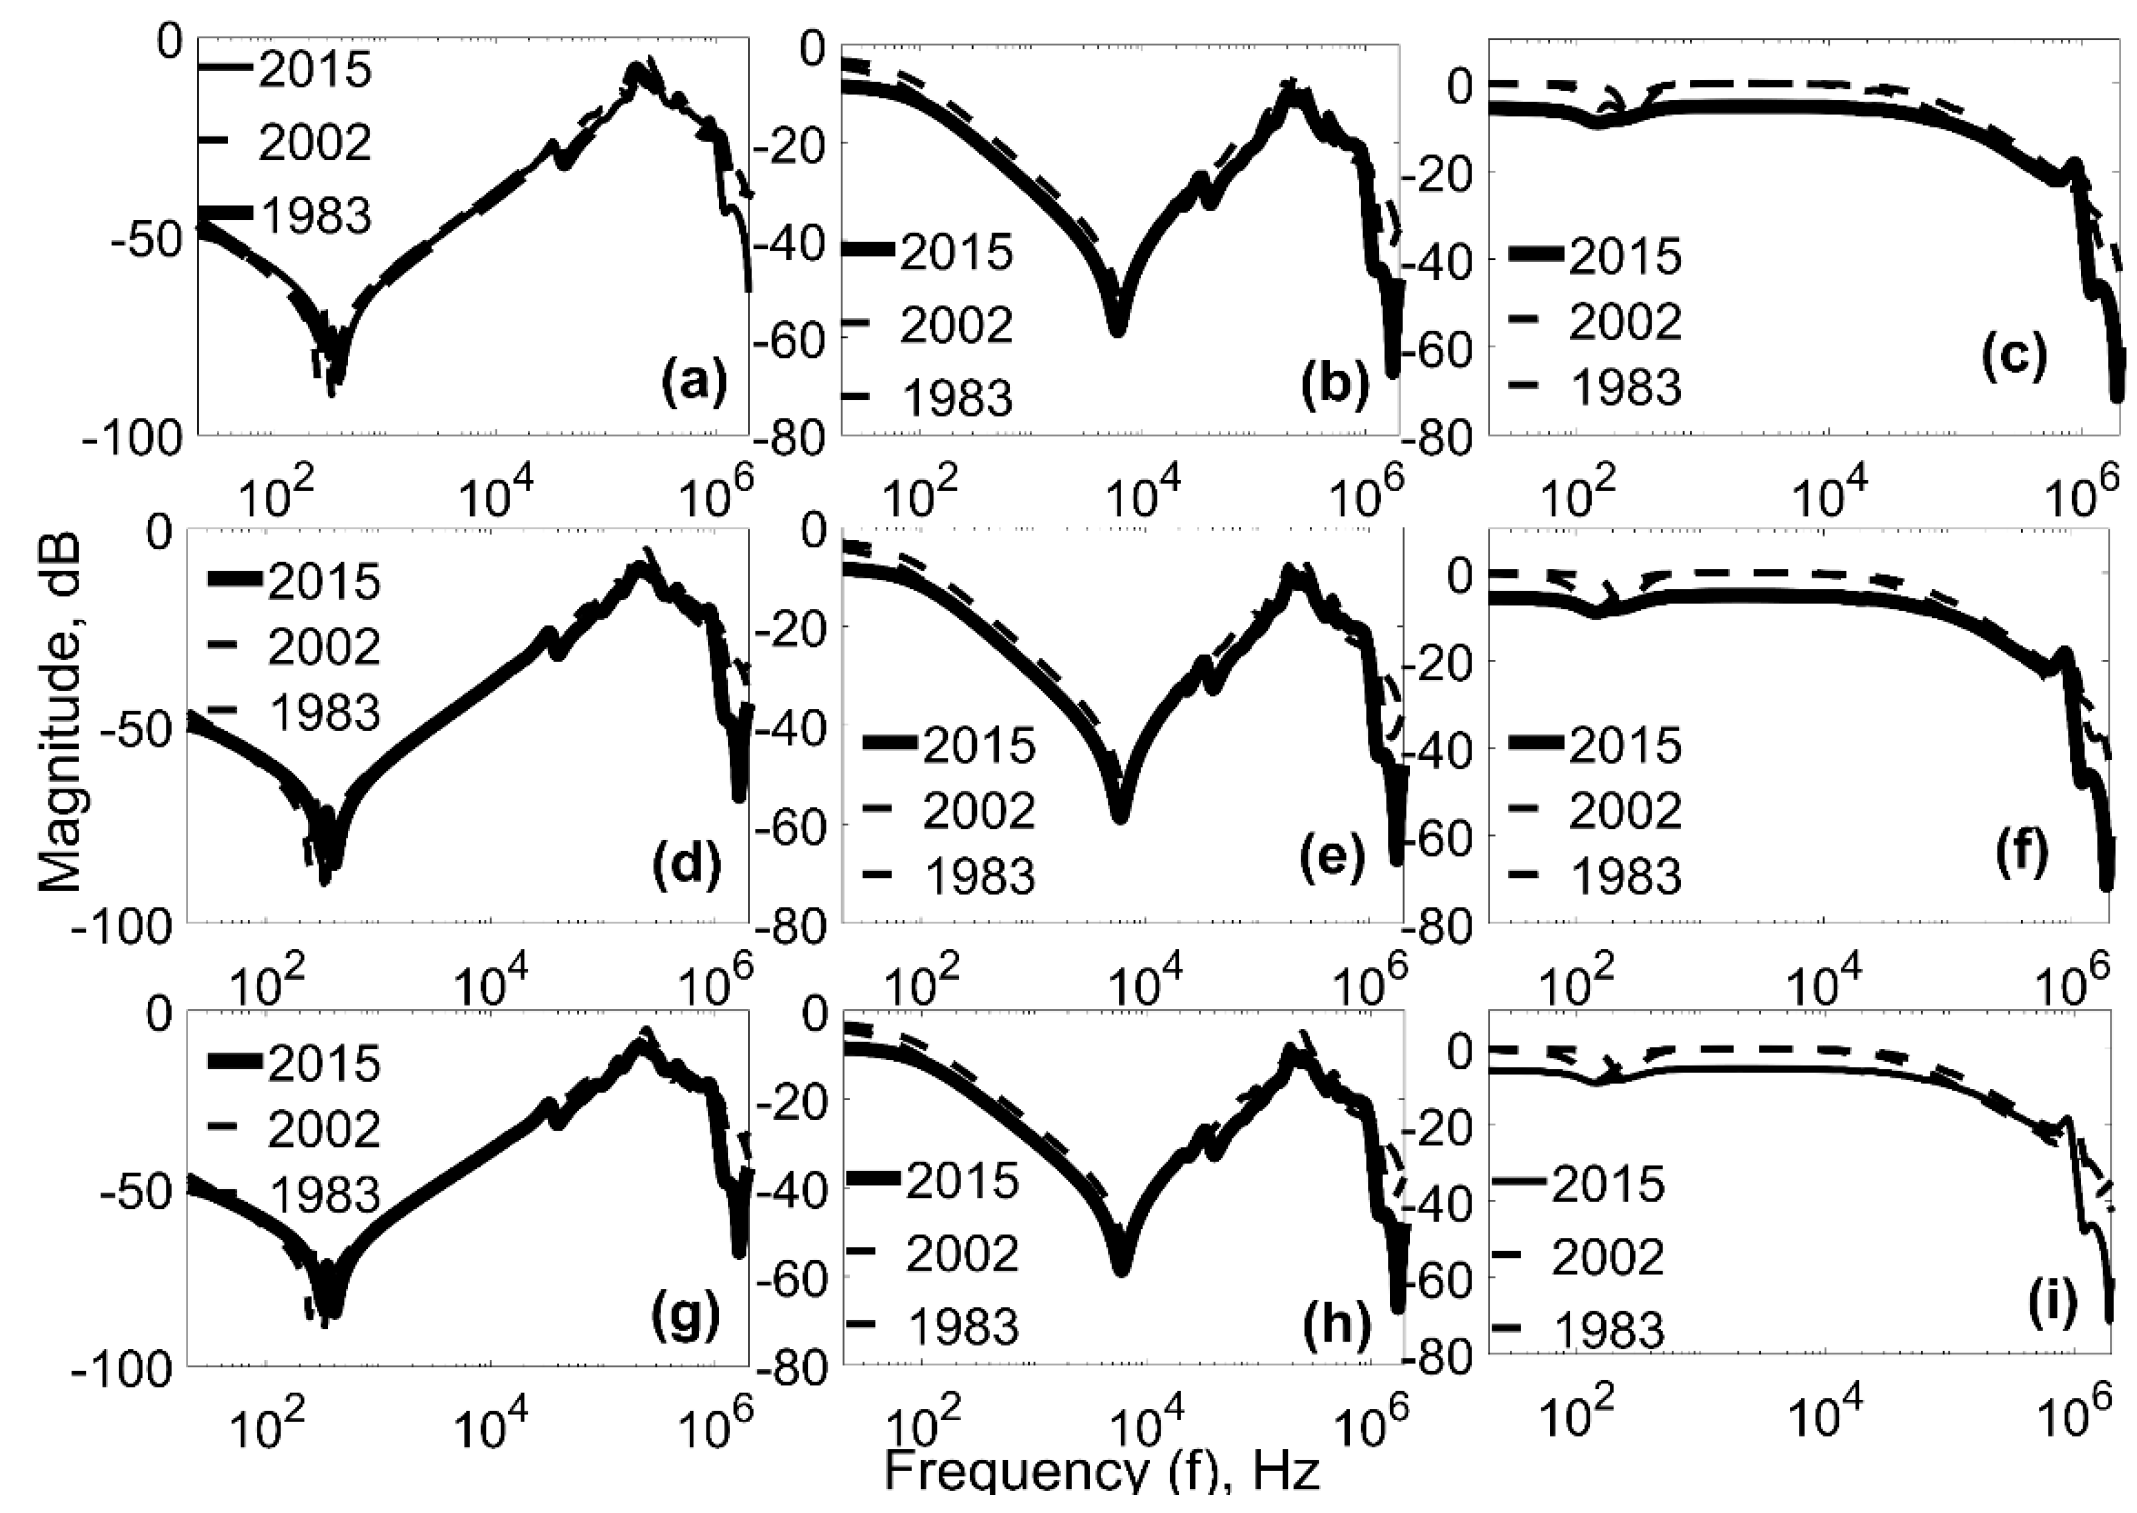
4.1. In-Service Transformer Units
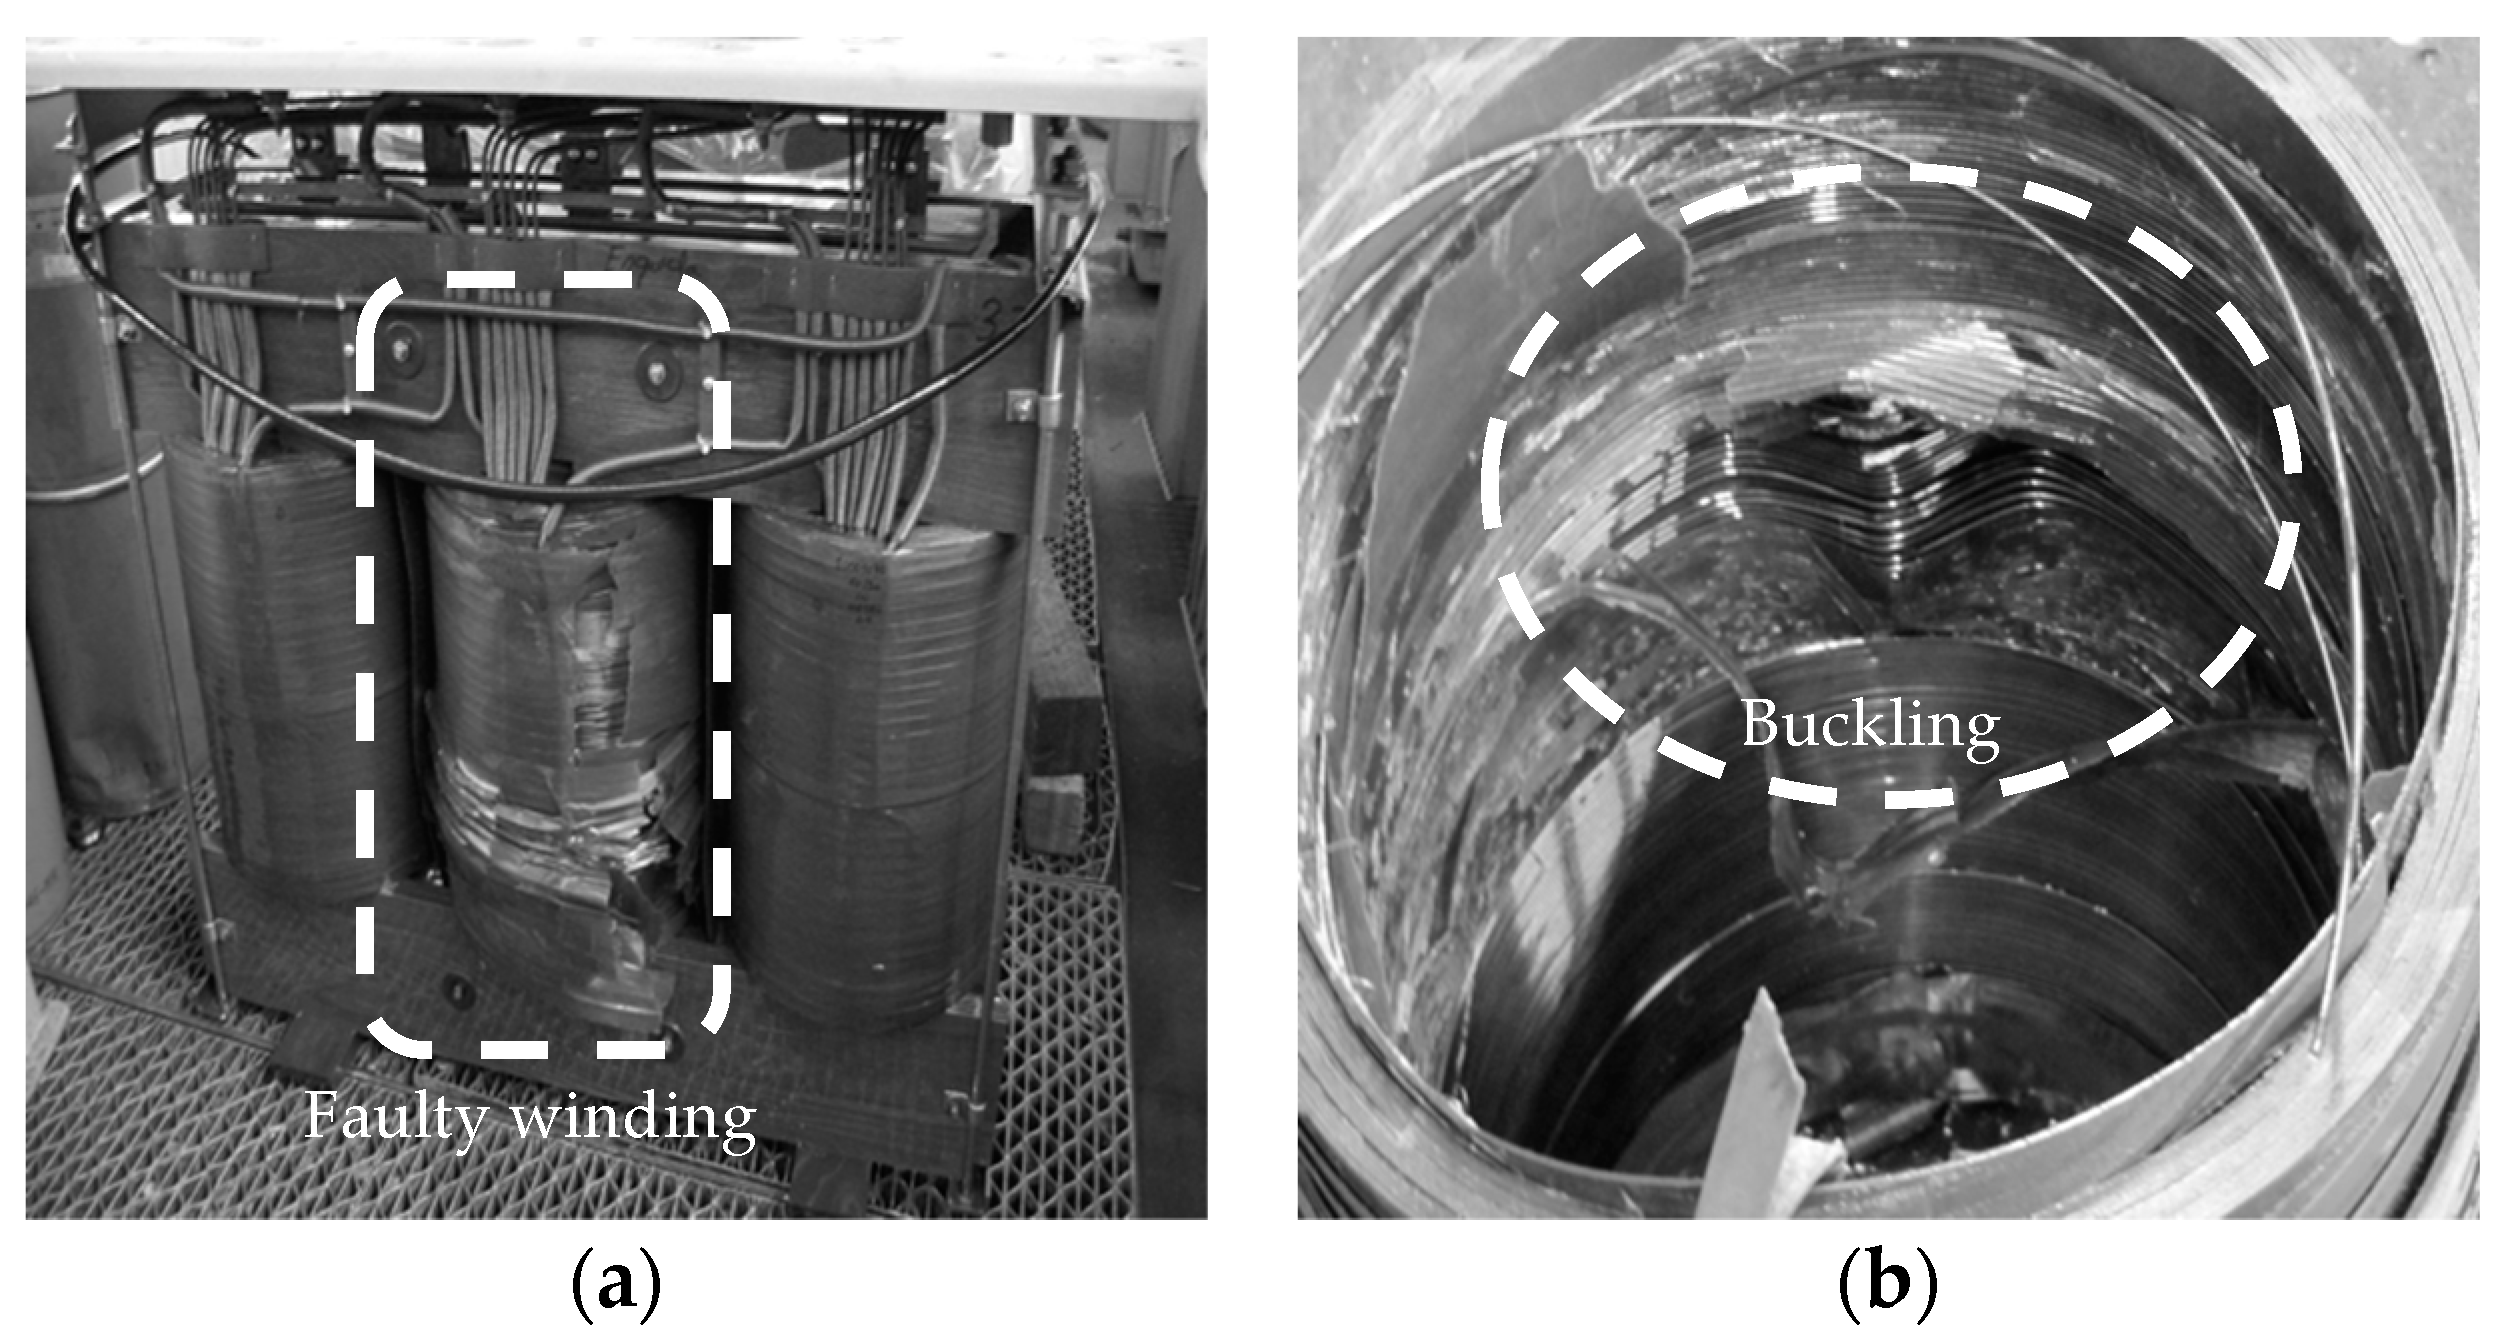
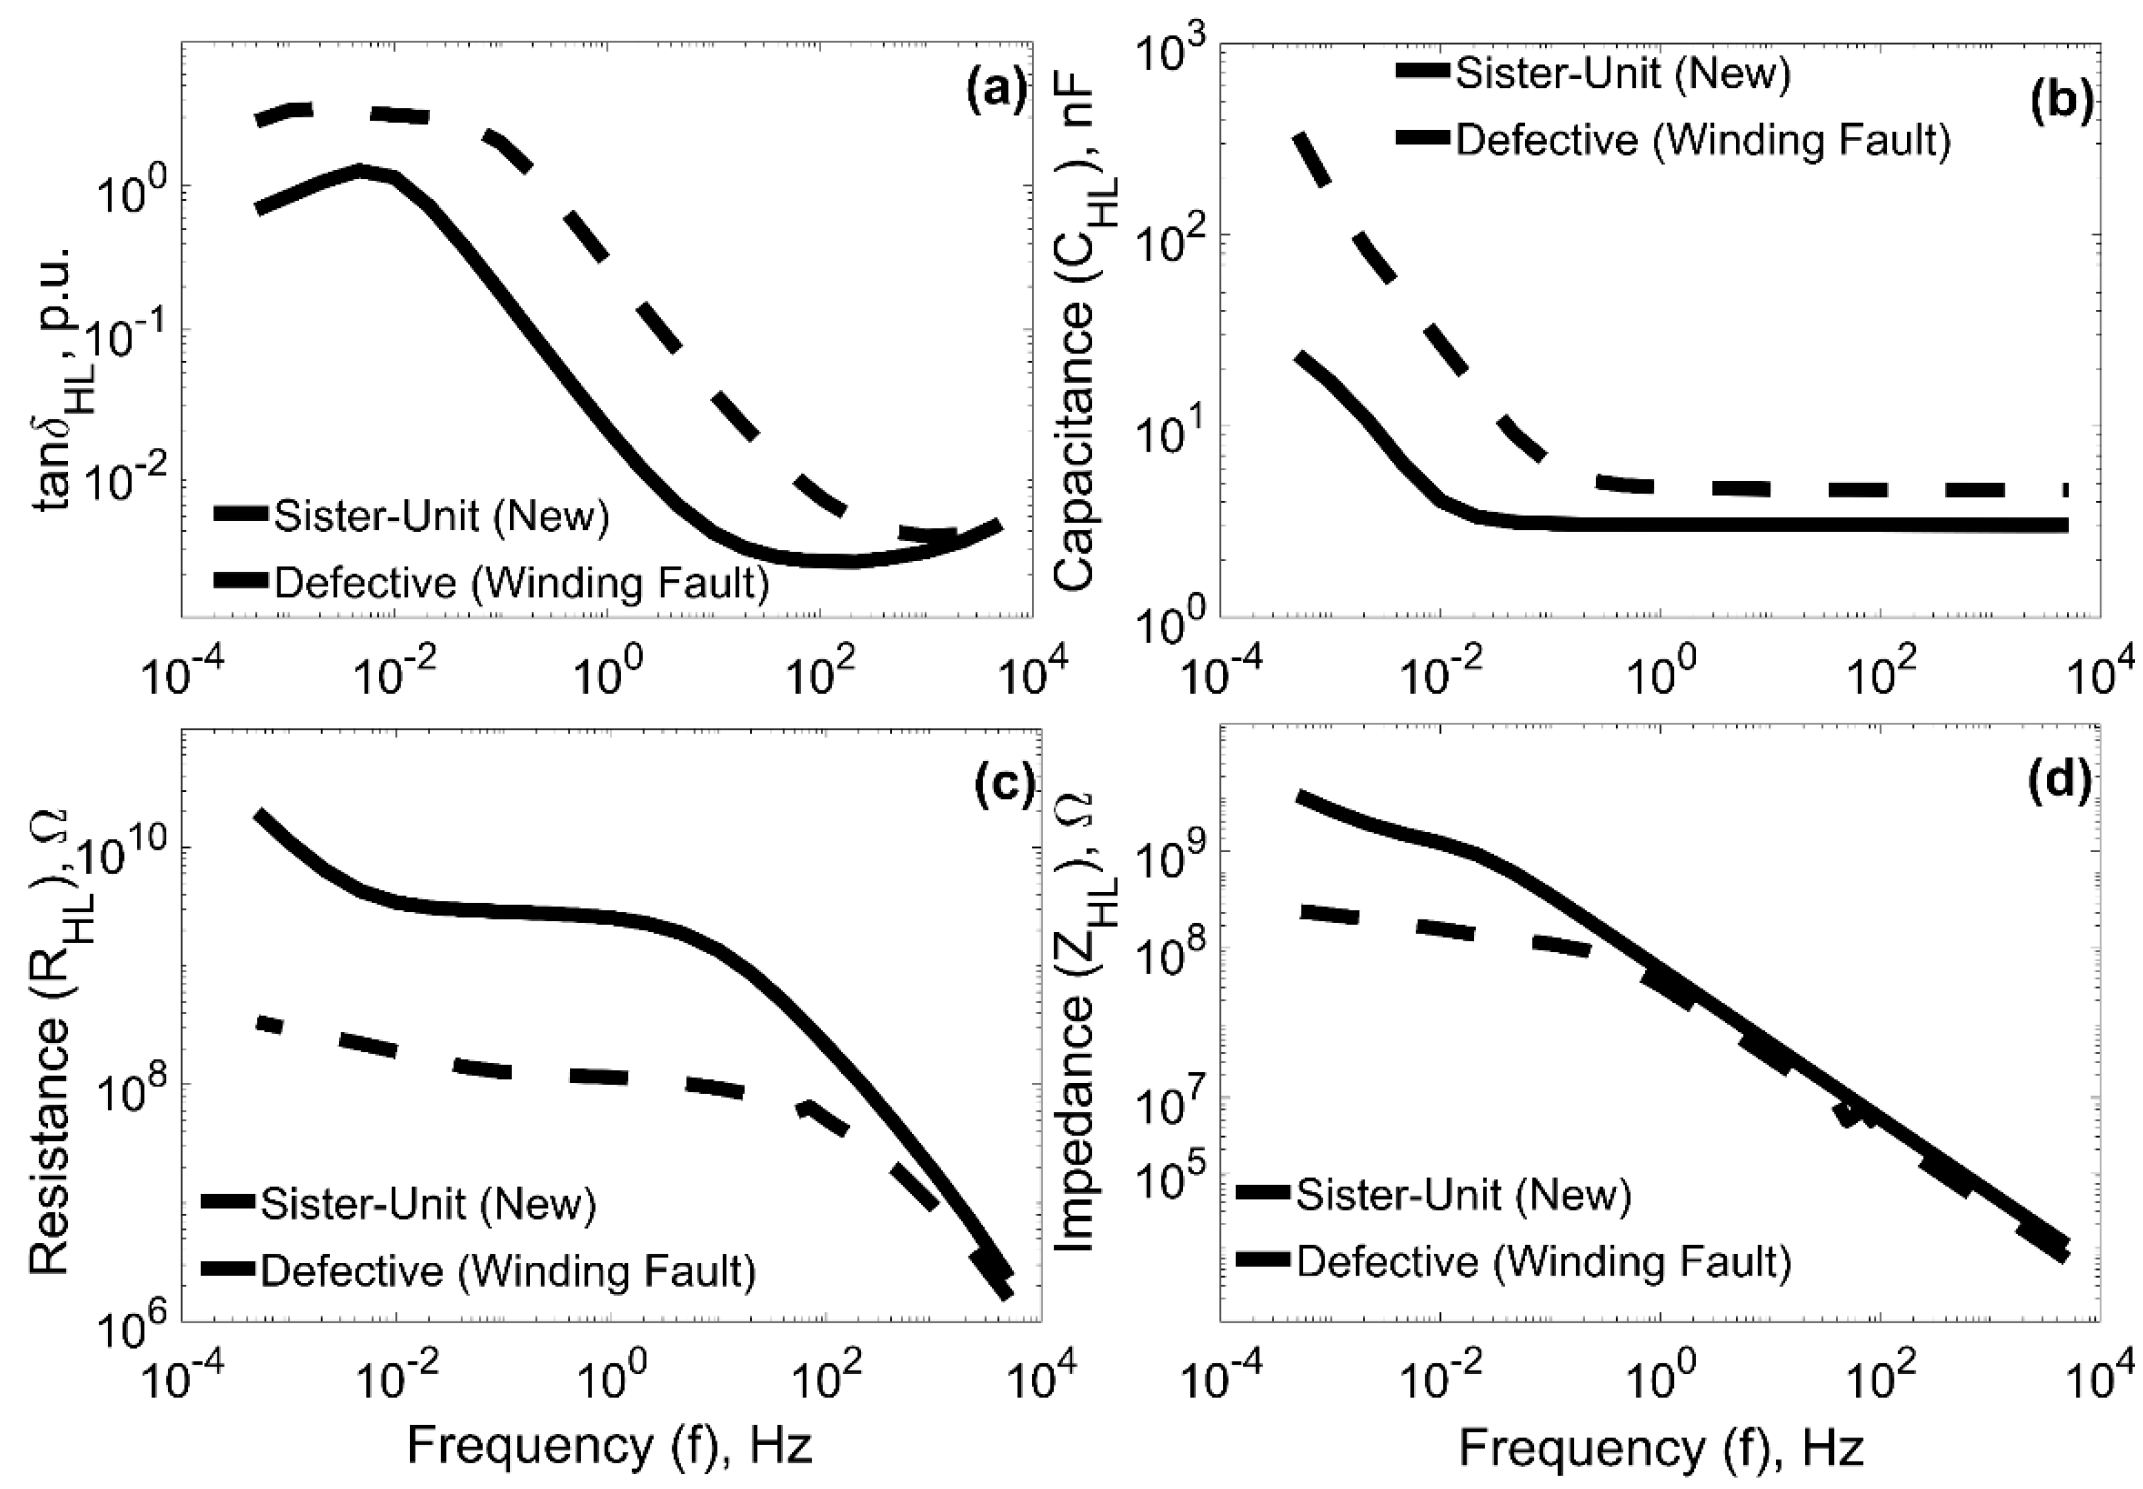
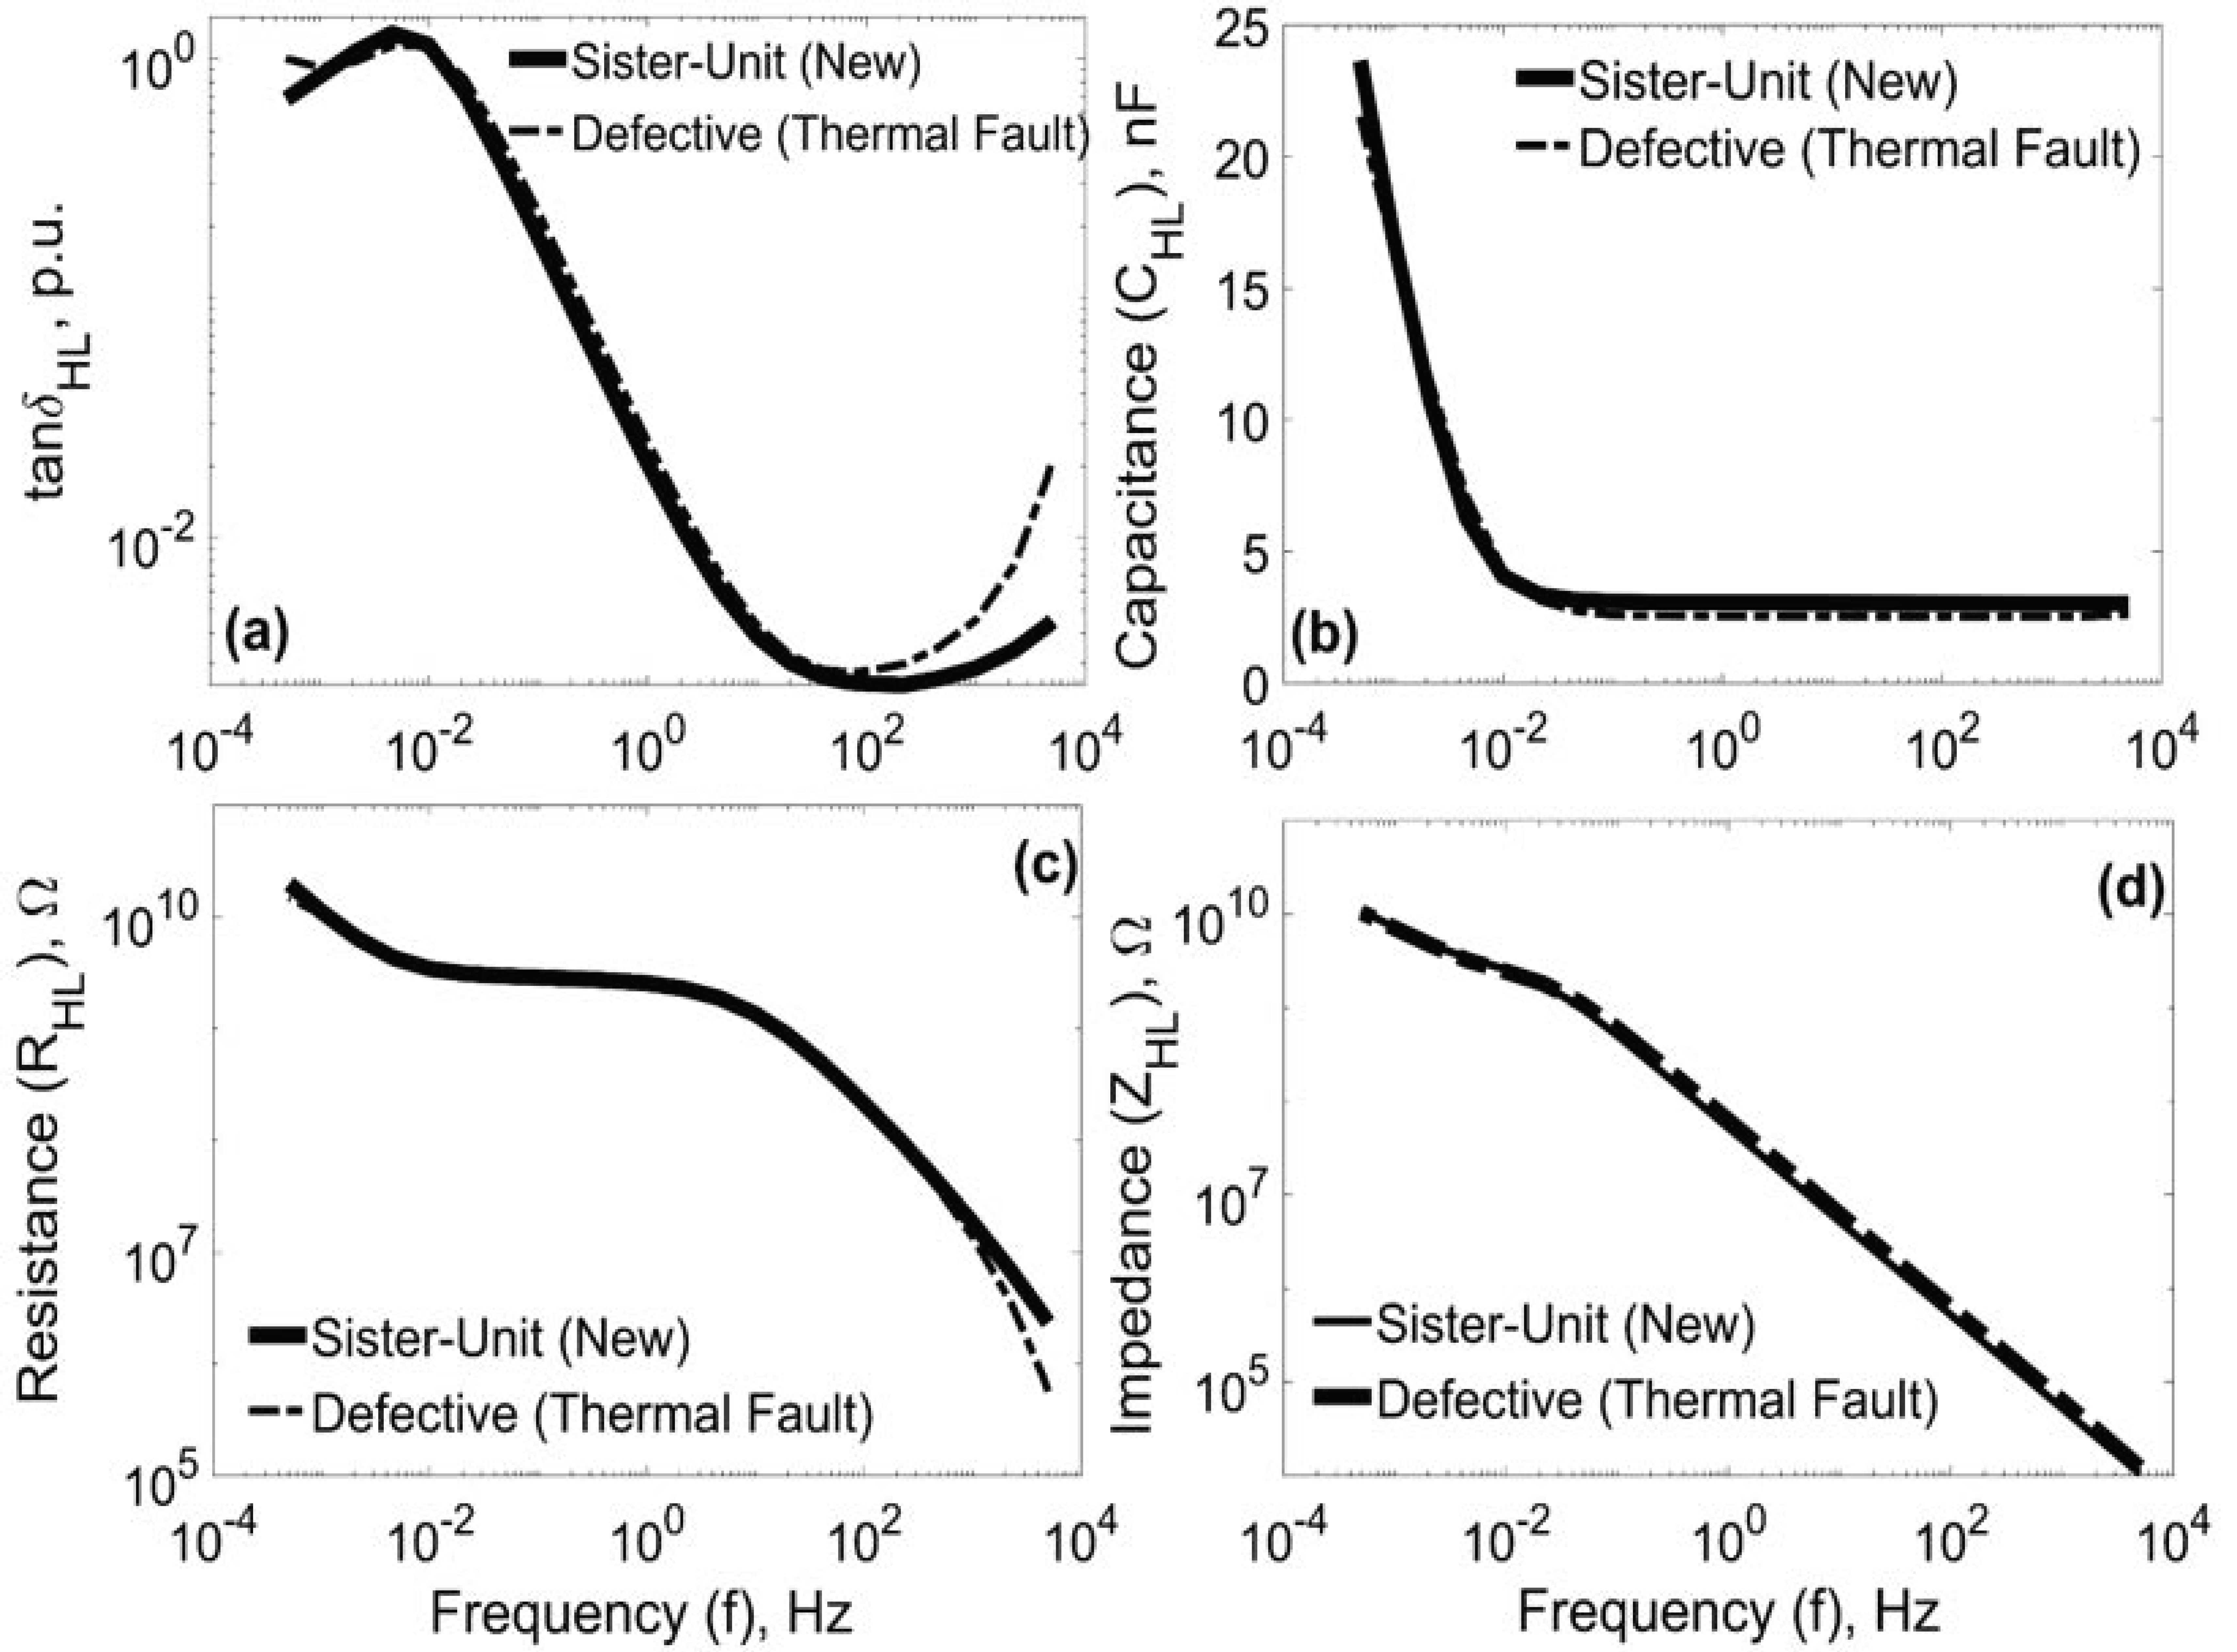
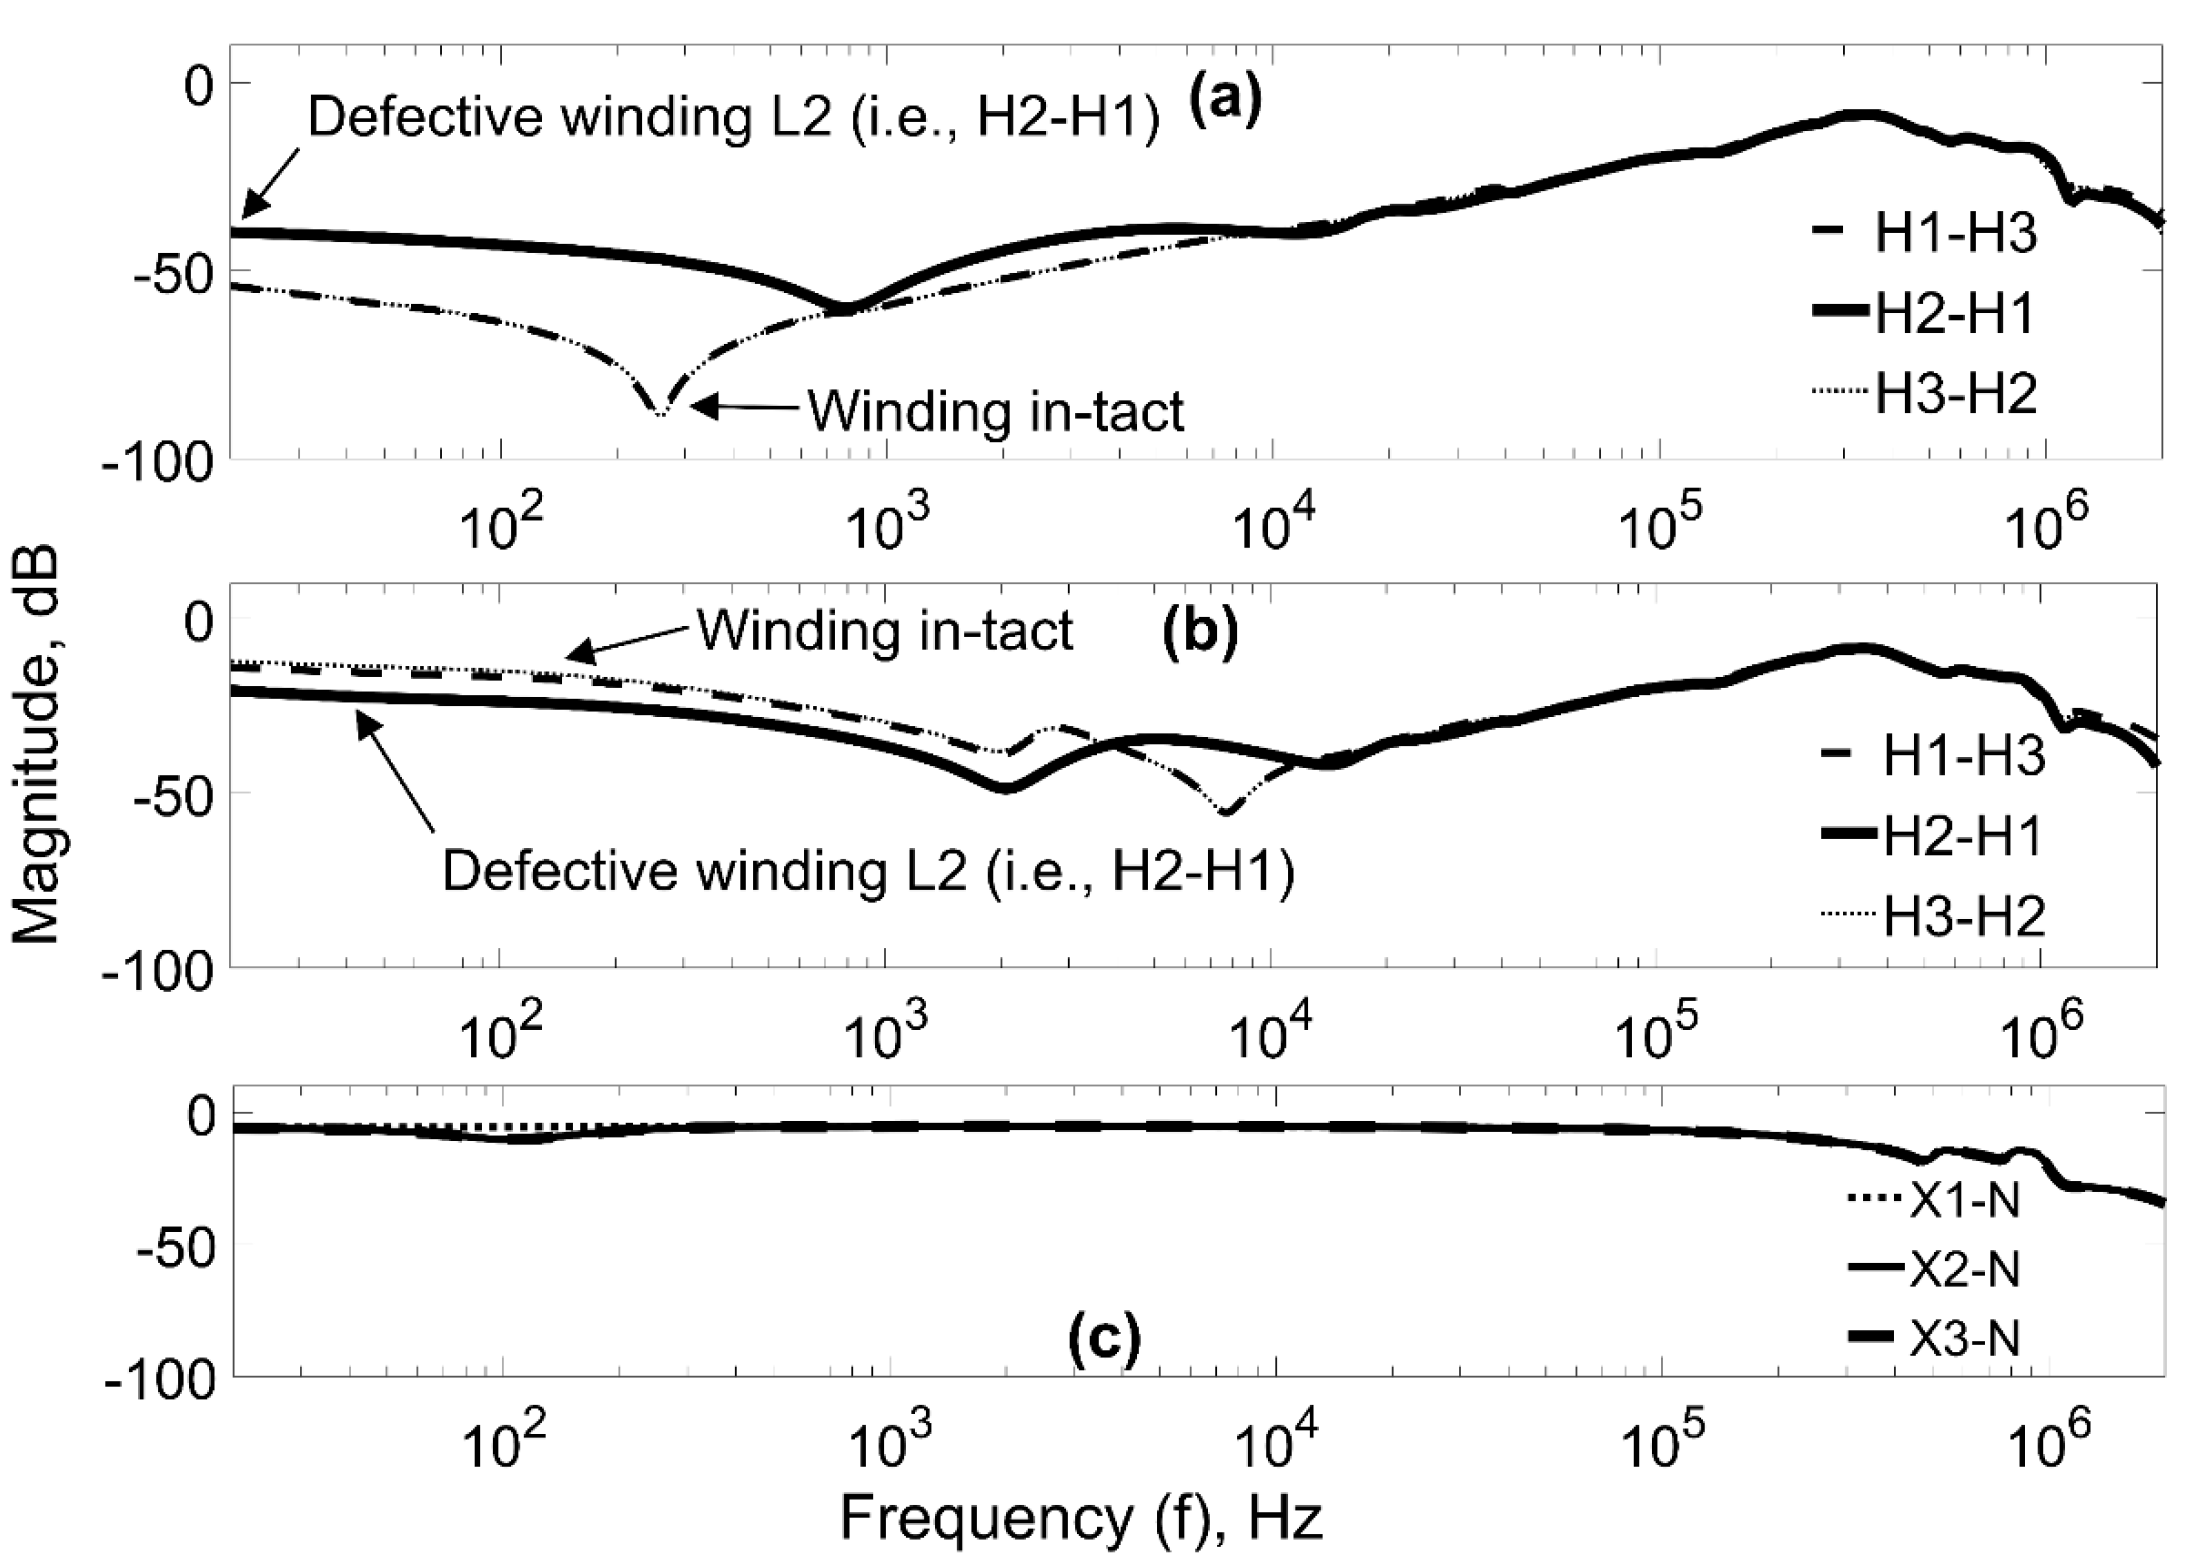
4.2. Defective Distribution Transformer Units
5. Discussion of Failure Root-Cause Analysis
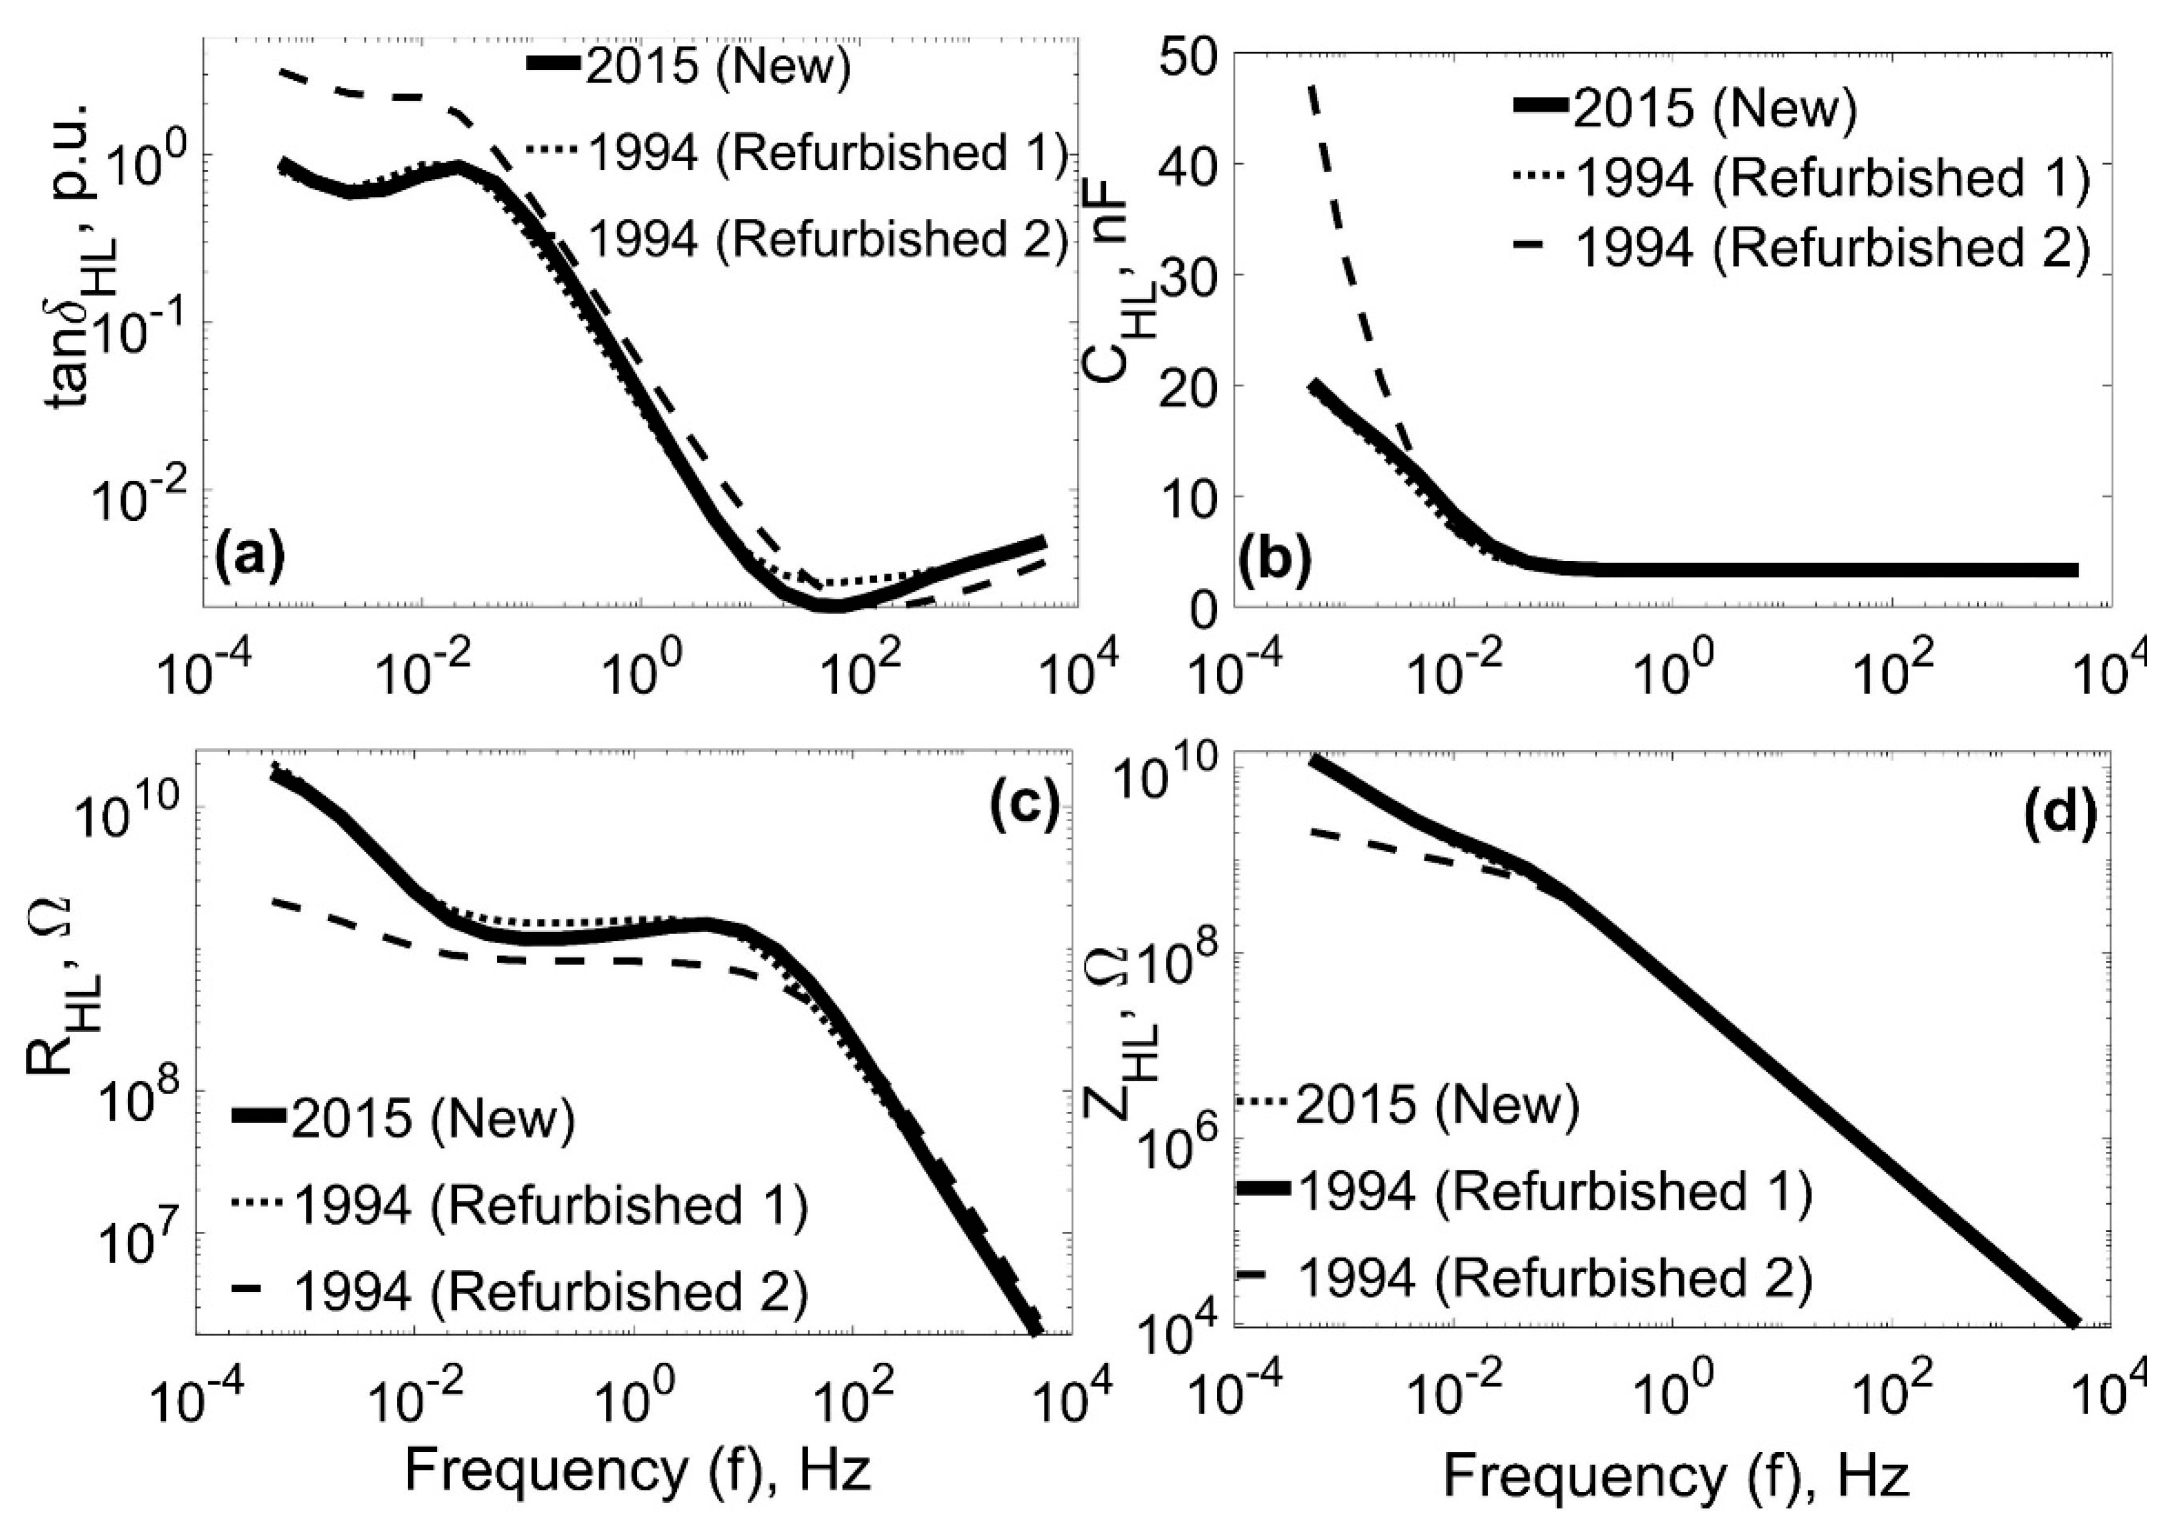
5.1. Defect Condition—1: Thermal Failure (Set-3/1994)
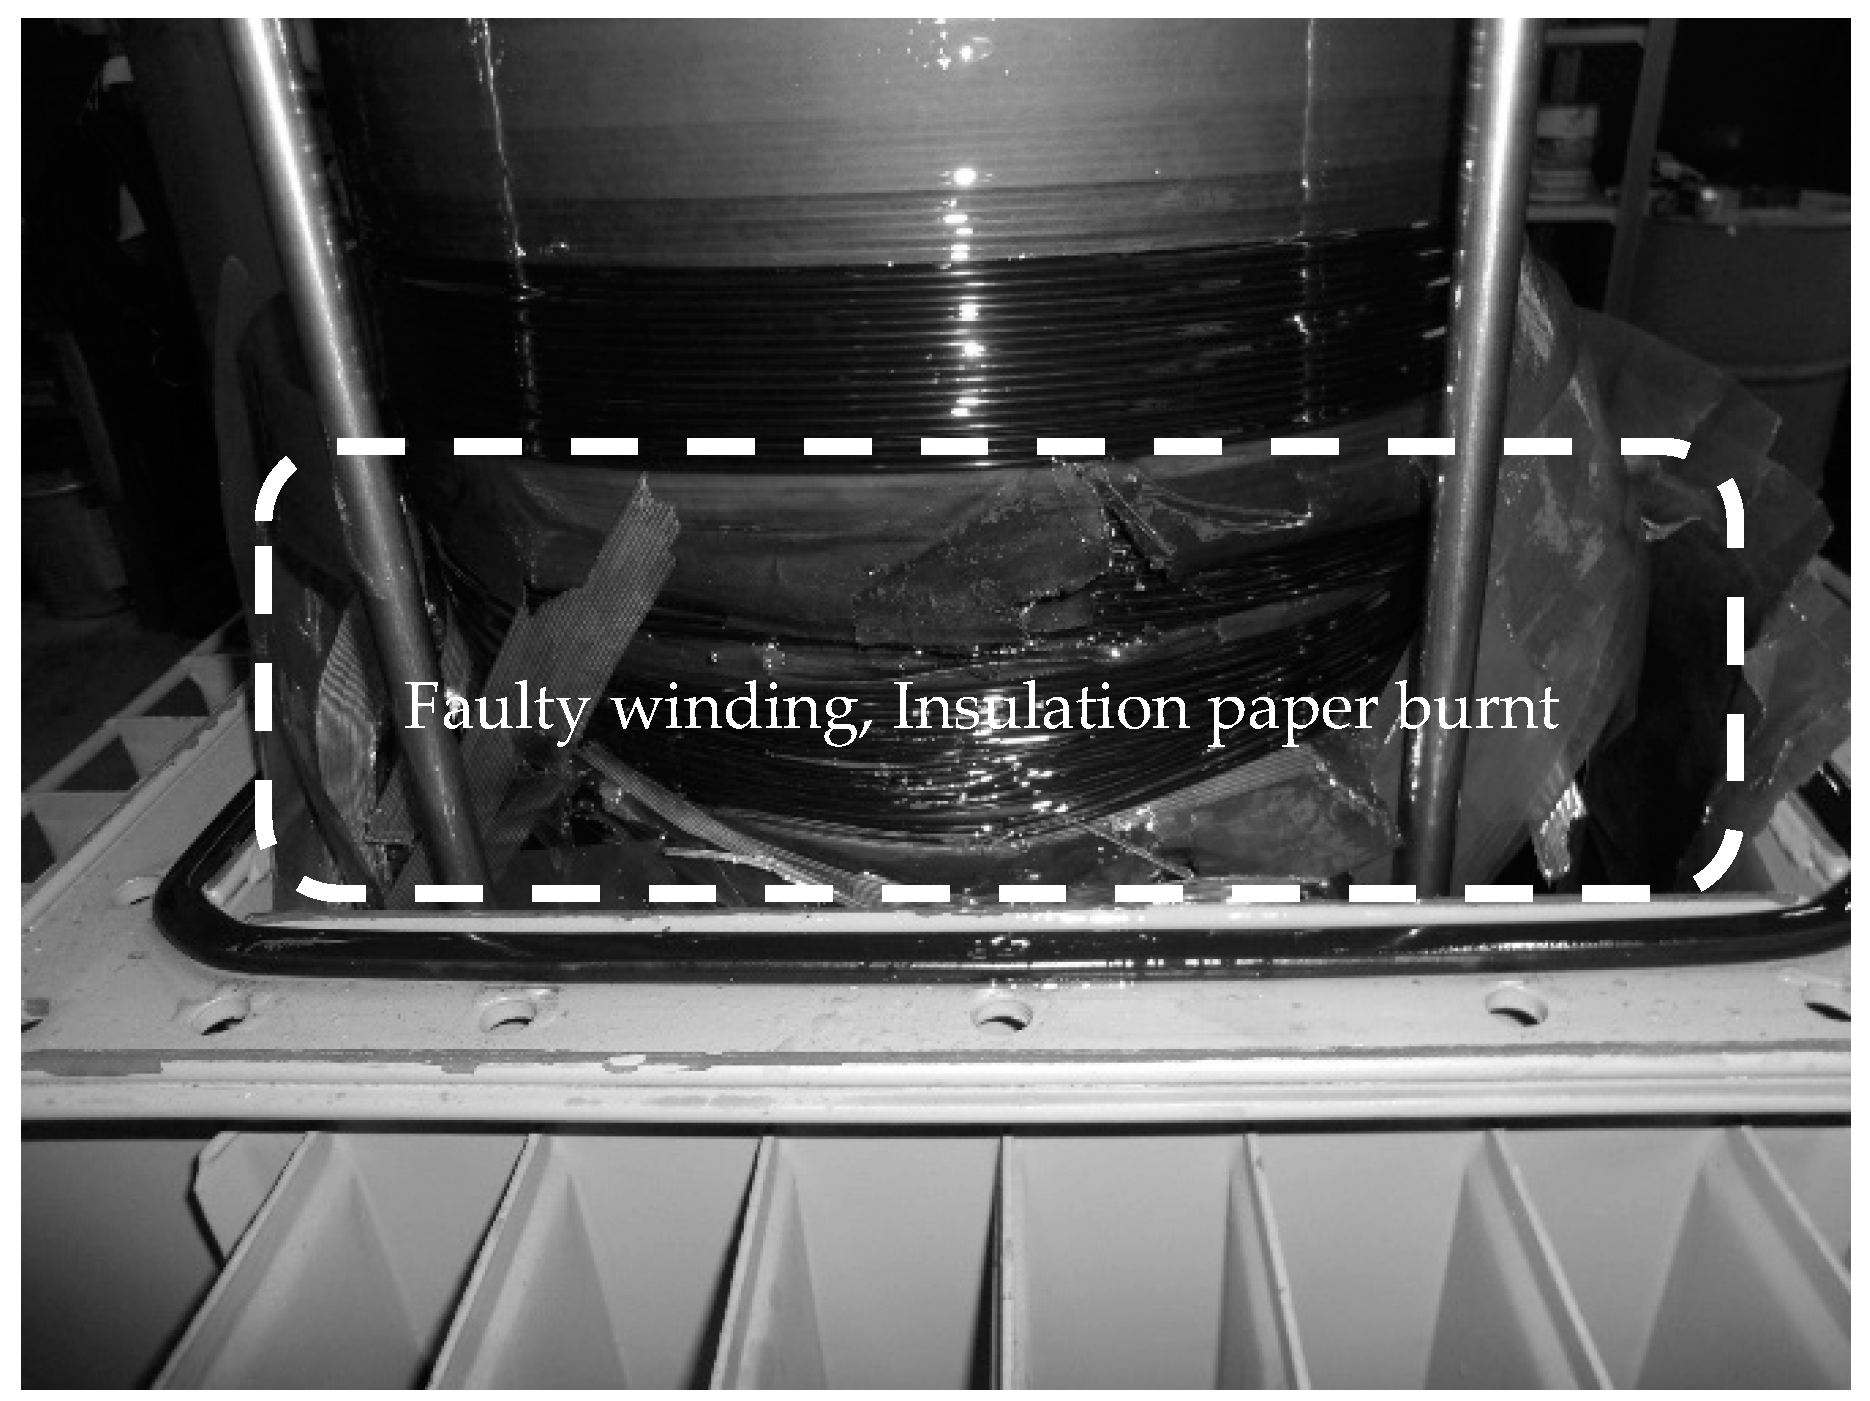
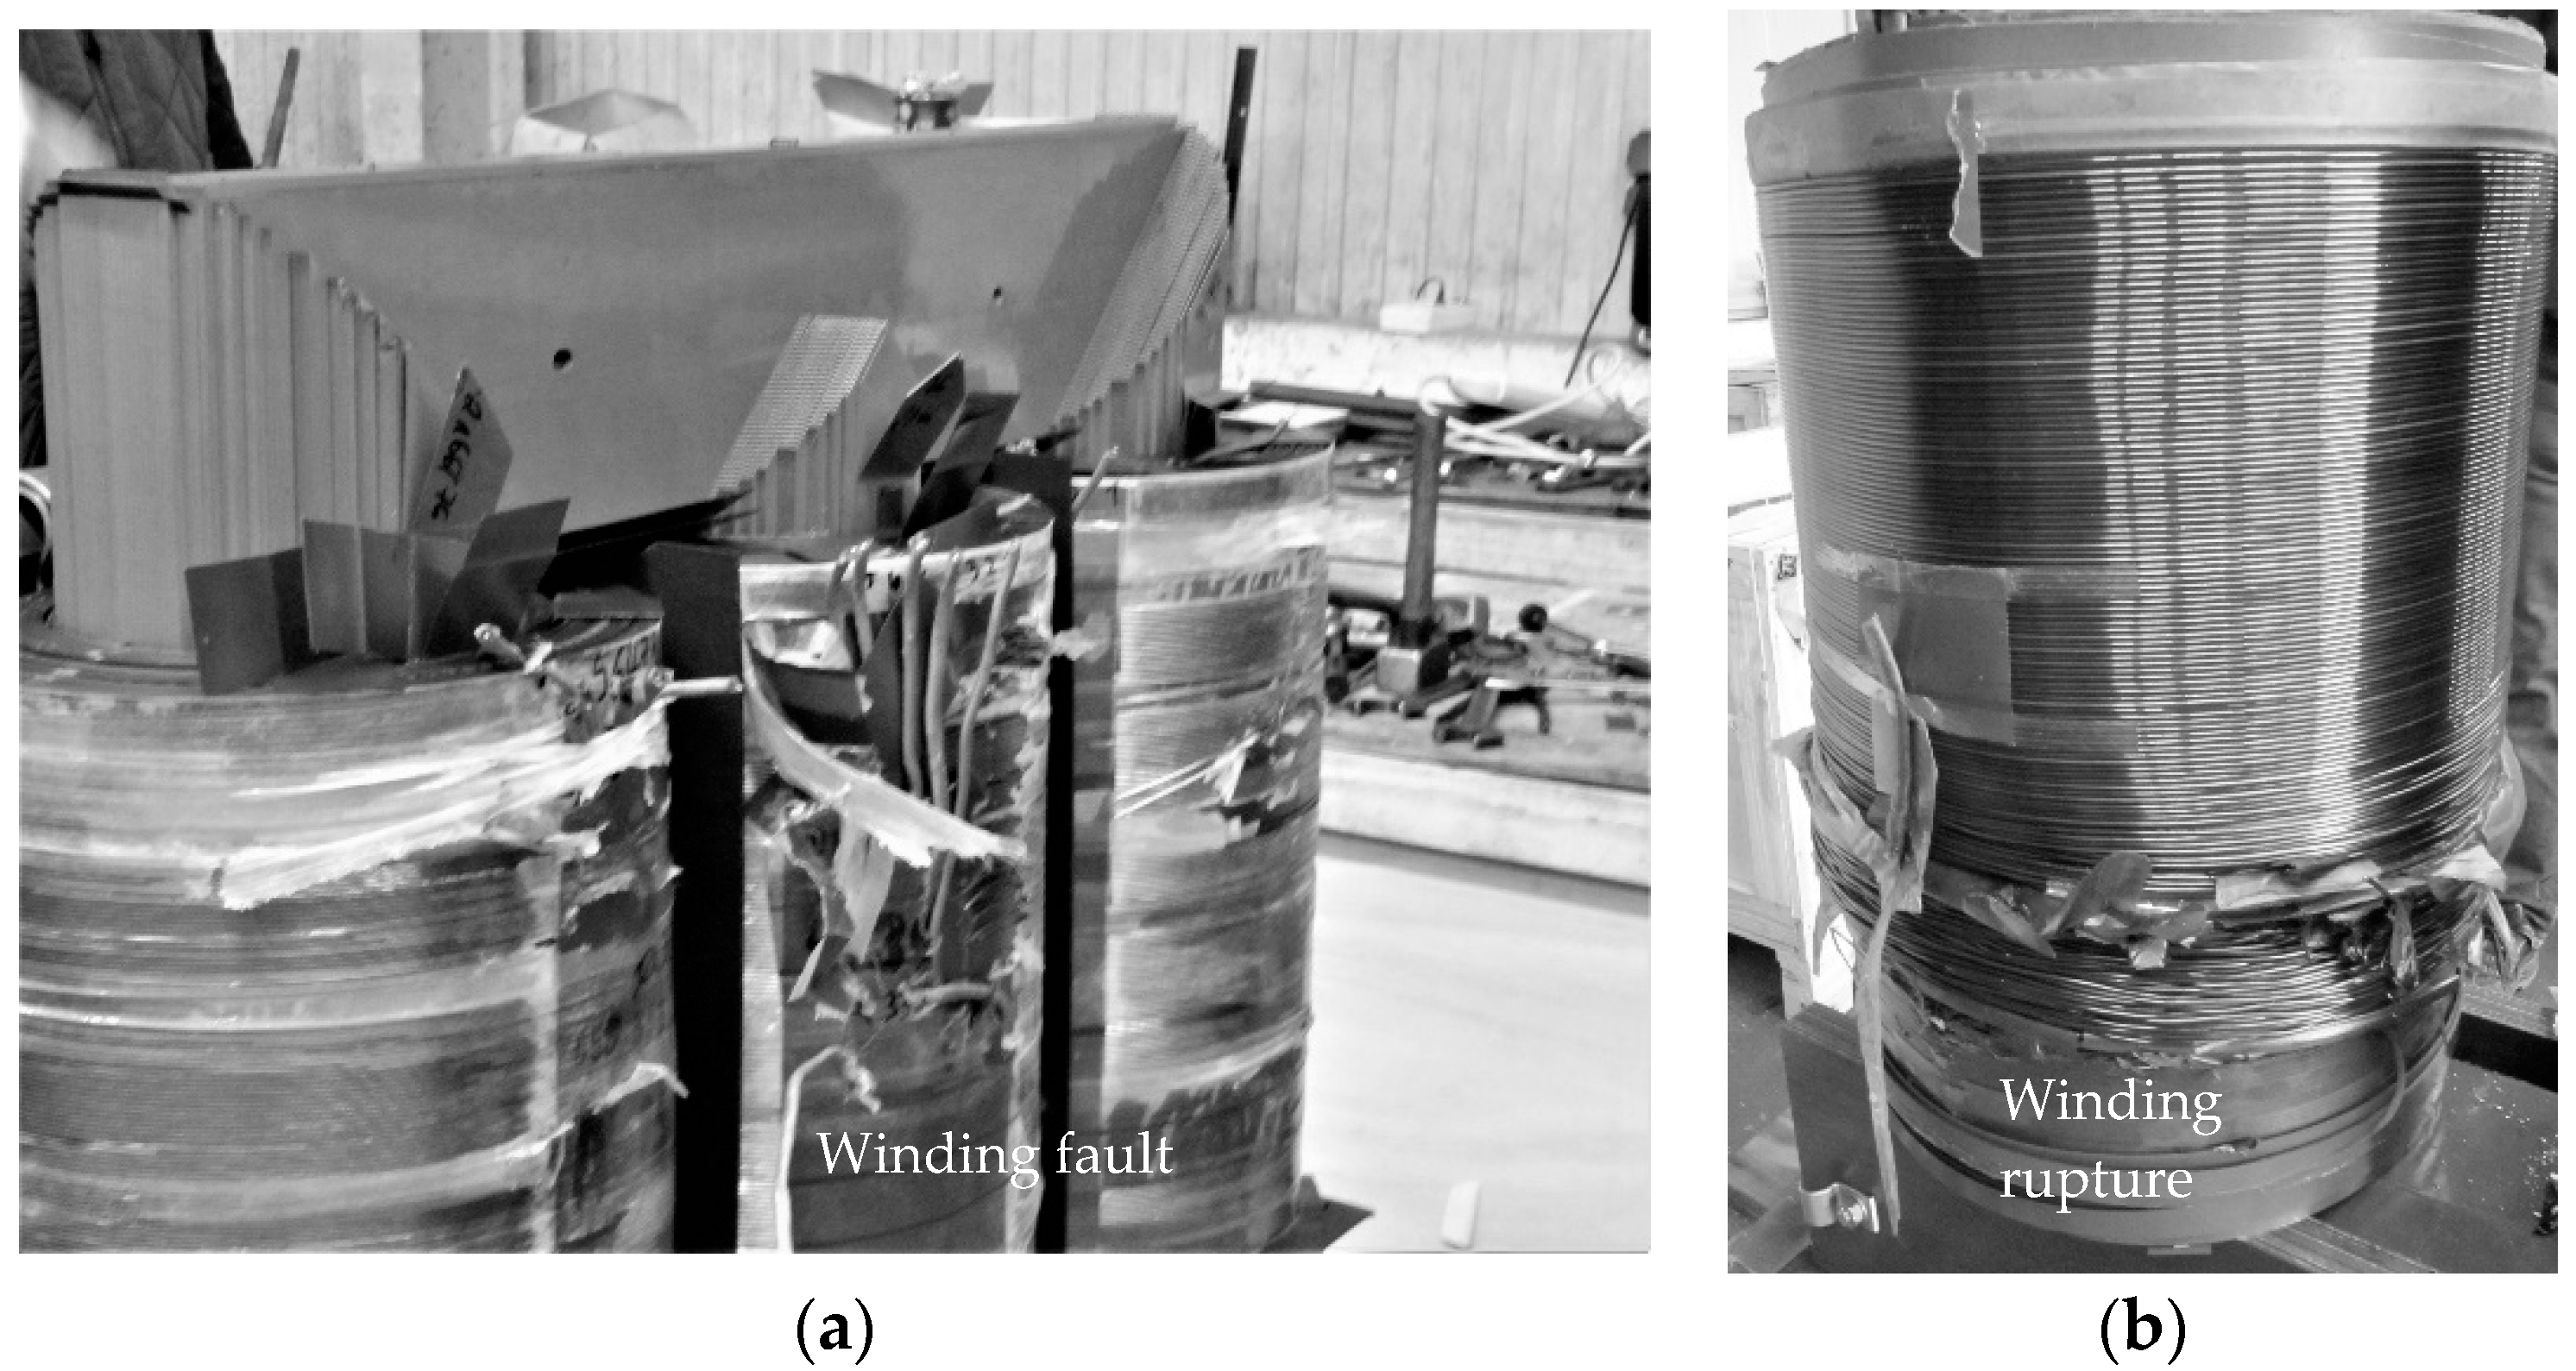
5.2. Defect Condition—2: Winding Failure (Set-3/1998)
6. Conclusions
Funding
Conflicts of Interest
References
- Chang, R.F.; Leou, R.C.; Lu, C.N. Distribution transformer load modeling using load research data. IEEE Trans. Power Deliv. 2002, 17, 655–661. [Google Scholar] [CrossRef]
- Humayun, M.; Degefa, M.Z.; Safdarian, A.; Lehtonen, M. Utilization Improvement of Transformers Using Demand Response. IEEE Trans. Power Deliv. 2015, 30, 202–210. [Google Scholar] [CrossRef]
- Zhang, X.; Gockenbach, E. Asset-Management of Transformers Based on Condition Monitoring and Standard Diagnosis. IEEE Electr. Insul. Mag. 2008, 24, 26–40. [Google Scholar] [CrossRef]
- Abu-Elanien, A.E.B.; Salama, M.M.A. Asset management techniques for transformers. J. Electr. Power Syst. Res. 2010, 80, 456–464. [Google Scholar] [CrossRef]
- Arumugam, S.; Gorchakov, S.; Schoenemann, T. Field Experience on Diagnostic Condition Assessment of Three Phase Distribution Class Transformers Over a Wide Frequency. In Proceedings of the IEEE Electrical Insulation Conference (EIC), Montreal, QC, Canada, 19–22 June 2016; pp. 237–240. [Google Scholar]
- IEEE Guide for Failure Investigation, Analysis, and Reporting for Power Transformers and Shunt Reactors, IEEE Std C57.125-2015 (Revision of IEEE Std C57.125-1991); IEEE Power and Energy Society: Piscataway, NJ, USA, 2015.
- Arritt, R.F.; Dugan, R.C. Distributed generation interconnection transformer and grounding selection. In Proceedings of the 2008 IEEE Power and Energy Society General Meeting-Conversion and Delivery of Electrical Energy in the 21st Century, Pittsburgh, PA, USA, 20–24 July 2008; pp. 1–7. [Google Scholar]
- Bhargavi, R.N.; Kumar, P.R.; Swarupa, M.L.; Shravani, C. Effect of Transformer connections in Distributed Generation system. In Proceedings of the International Conference on Renewable Energy Integration into Smart Grids: A Multidisciplinary Approach to Technology Modelling and Simulation (ICREISG), Bhubaneshwar, India, 14–15 February 2020; pp. 95–98. [Google Scholar]
- Heathcote, M. J and P Transformer Book, 13th ed.; Newnes: Burlington, MA, USA, 2011; pp. 230–249. [Google Scholar]
- Bossi, A.; Dind, J.E.; Frisson, J.M.; Khoudiakov, U.; Light, H.F.; Narke, D.V. An international survey on failures in large power transformers in service. Cigré Electra 1983, 88, 21–48. [Google Scholar]
- Christina, A.J.; Salam, M.A.; Rahman, Q.M.; Wen, F.; Ang, S.P.; Voon, W. Causes of transformer failures and diagnostic methods—A review. Renew. Sustain. Energy Rev. 2018, 82, 1442–1445. [Google Scholar]
- IEEE Guide for the Application and Interpretation of Frequency Response Analysis of Oil-Immersed Transformers, IEEE Std C57.149TM-2012; IEEE Power and Energy Society: Piscataway, NJ, USA, 2012.
- Clark, P.W. Detecting Distribution Transformer Faults; IFD Corp.: Vancouver, BC, Canada, 2005; pp. 1–19. [Google Scholar]
- Wang, H.; Butler, K.L. Finite element analysis of internal winding faults in distribution transformers. IEEE Trans. Power Deliv. 2001, 16, 422–428. [Google Scholar] [CrossRef]
- Bhowmick, S.; Nandi, S. Online Detection of an Interturn Winding Fault in Distribution Transformers Using a Terminal Measurement-Based Modeling Technique. IEEE Trans. Power Deliv. 2015, 30, 1007–1015. [Google Scholar] [CrossRef]
- Jaiswal, G.C.; Ballal, M.S.; Tutakne, D.R.; Vishnu, P. Intelligent condition monitoring system for distribution transformer and health status diagnosis. In Proceedings of the International Conference on Power, Instrumentation, Control and Computing Conference (PICC), Kerala, India, 18–20 January 2018; pp. 1–6. [Google Scholar]
- Hamzeh, M.; Vahidi, B.; Askarian-Abyaneh, H. Reliability evaluation of distribution transformers with high penetration of distributed generation. J. Electr. Power Energy Syst. 2015, 73, 163–169. [Google Scholar] [CrossRef]
- Agah, S.M.; Abyaneh, H.A. Distribution Transformer Loss-of-Life Reduction by Increasing Penetration of Distributed Generation. IEEE Trans. Power Deliv. 2011, 26, 1128–1136. [Google Scholar] [CrossRef]
- Agah, S.M.M.; Abyaneh, H.A. Quantification of the Distribution Transformer Life Extension Value of Distributed Generation. IEEE Trans. Power Deliv. 2011, 26, 1820–1828. [Google Scholar] [CrossRef]
- Awadallah, S.K.E.; Milanović, J.V.; Jarman, P.N. The Influence of Modeling Transformer Age Related Failures on System Reliability. IEEE Trans. Power Syst. 2015, 30, 970–979. [Google Scholar] [CrossRef]
- Cho, N.; Yun, S.; Jung, J. Determining the reverse fault current by the type of transformer and Distributed Generation in distribution system during the single-line to ground fault. Renew. Sustain. Energy Rev. 2019, 109, 102–115. [Google Scholar] [CrossRef]
- Shahzad, U.; Kahrobaee, S.; Asgarpoor, S. Protection of Distributed Generation: Challenges and Solutions. Energy Power Eng. 2017, 9, 614–653. [Google Scholar] [CrossRef] [Green Version]
- Bakshi, A.; Kulkarni, S.V. Analysis of Buckling Strength of Inner Windings in Transformers Under Radial Short-Circuit Forces. IEEE Trans. Power Deliv. 2014, 29, 241–245. [Google Scholar] [CrossRef]
- Bagheri, M.; Phung, B.T.; Blackburn, T. Influence of temperature and moisture content on frequency response analysis of transformer winding. IEEE Trans. Dielectr. Electr. Insul. 2014, 21, 1393–1404. [Google Scholar] [CrossRef]
- Satish, L.; Saravanakumar, A. Identification of Terminal Connection and System function Pair for Making Sensitive SFR Measurements. IEEE Trans. Power Deliv. 2008, 23, 742–750. [Google Scholar] [CrossRef]
- Arumugam, S. Experimental Investigation on Terminal Connection and System Function Pair during SFRA Testing on three phase transformers. J. Electr. Power Energy Syst. 2014, 58, 101–110. [Google Scholar] [CrossRef]
- Arumugam, S. Theoretical Considerations While Applying FRA Method in Determining the Inter-Winding Capacitance of Power Transformers at Higher Frequencies. Eng. Rep. 2019, 1, e12036. [Google Scholar]
- Arumugam, S. Experimental validation of using frequency response analysis method in measuring interwinding capacitance of power transformers. Eng. Rep. 2019, 1, e12079. [Google Scholar] [CrossRef] [Green Version]
- Koch, M. Reliable Moisture Determination in Power Transformer. Ph.D. Thesis, University of Stuttgart, Stuttgart, Germany, 2008; pp. 77–79. [Google Scholar]
- Koch, M.; Krueger, M. A Fast and Reliable Dielectric Diagnostic Method to Determine Moisture in Power Transformers. In Proceedings of the International Conference on Condition Monitoring and Diagnosis (CMD 2008), Peking, China, 21–24 April 2008. [Google Scholar]
- Pandey, S.B.; Lin, C. Estimation of life model of transformer insulation under combined electrical and thermal stress. IEEE Trans. Reliab. 1992, 41, 466–468. [Google Scholar] [CrossRef]
- Raetzke, S.; Koch, M.; Krueger, M. Condition assessment of instrument transformer using dielectric response analysis. E I Elektrotechnik Und Inf. 2013, 1–5. [Google Scholar] [CrossRef]
- Zhang, X.; Gockenbach, E. Assessment of the actual condition of the electrical components in medium-voltage networks. IEEE Trans. Reliab. 2006, 55, 361–368. [Google Scholar] [CrossRef]
- Milutinovich, J.S.; Mahon, W.T. Some Thoughts on Minimizing Cost of Arc-Furnace Transformers. IEEE Trans. Reliab. 1975, 24, 251–254. [Google Scholar] [CrossRef]


| Set | Transformer | Year | Ratings | Tap/Total | ||
|---|---|---|---|---|---|---|
| kVA | kV | A | ||||
| 1 a | 3φ, 2-winding, Δ/Y-n | 2015 | 400 | 20/0.4 | 20/900 | 3/5 |
| 1994 | ||||||
| 1994 | ||||||
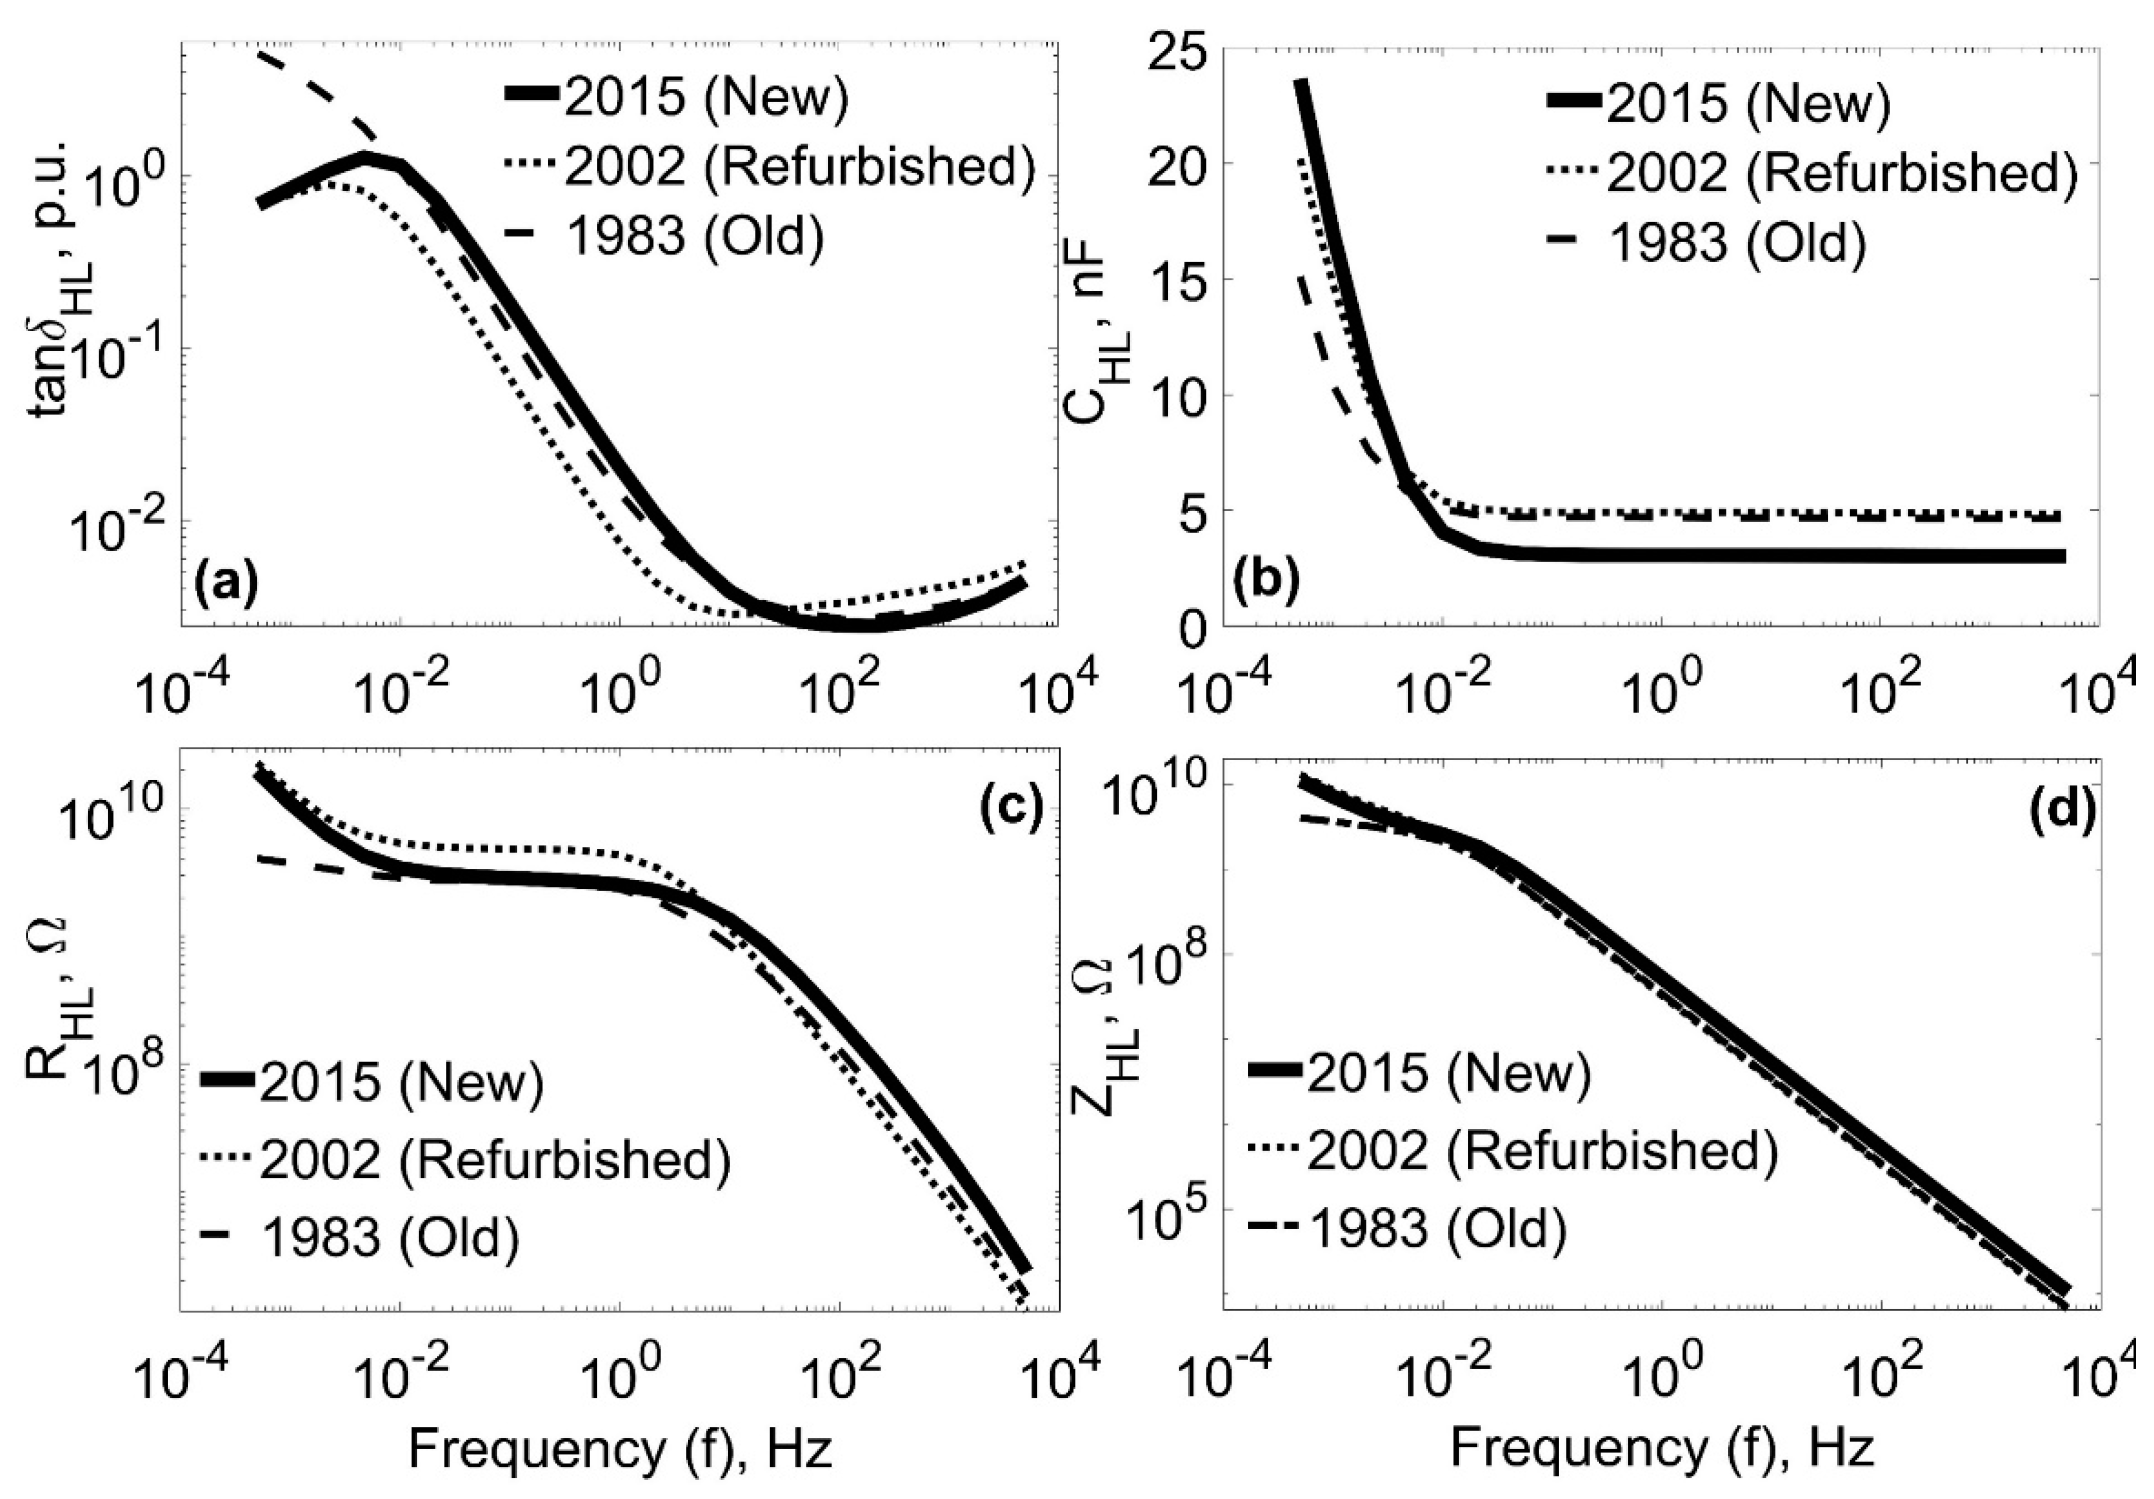
| 2 b | 3φ, 2-winding, Δ/Y-n | 2015 | 630 | 20/0.4 | 18/900 | 3/5 |
| 2002 | ||||||
| 1983 | ||||||
| 3 c | 3φ, 2-winding, Δ/Y-n | 1994 © | 630 | 20/0.4 | 18/900 | 3/5 |
| 1998 § | ||||||
| Set | Year | Insulation | Loss Factor (50 Hz) | Oil Conductivity | Moisture | ||
|---|---|---|---|---|---|---|---|
| σ | Status | Estimation | Status | ||||
| p.u. | pS | % | |||||
| 1 a | 2015 | CHL | 0.003 | 1.3 | Good | 1.1 | Dry |
| 1994 | 0.002 | 1.7 | Good | 1.3 | Dry | ||
| 1994 | 0.003 | 3.7 | Good | 3.6 | Moderately wet | ||
| 2 b | 2015 | CHL | 0.003 | 6.1 | Good | 2.3 | Wet |
| 2002 | 0.003 | 7.2 | Good | 2.0 | Moderately wet | ||
| 1983 | 0.003 | 6.1 | Good | 3.6 | Moderately wet | ||
| Gas in Oil | Sampling Interval | Reference Values | Remarks | |||
|---|---|---|---|---|---|---|
| 1 | 2 | Actual | Normal | Caution | ||
| ppm | ppm | ppm | <ppm | <ppm | ||
| H2 | 14 | 103 | 150 | 150 | 1000 | Discharge |
| O2 | 5024 | 2266 | n. a. | – | – | Leakage in gasket |
| N2 | 79,985 | 85,683 | n. a. | – | – | – |
| CO | 57 | 74 | 1000 | 10,000 | 15,000 | Carbon |
| CO2 | 4979 | 5385 | 12,000 | 10,000 | 15,000 | Moisture |
| CH4 | 32 | 65 | 100 | 25 | 80 | Sparking |
| C2H6 | 208 | 228 | 300 | 10 | 35 | Localized heating |
| C2H4 | 6 | 47 | 30 | 20 | 150 | Surface heating |
| C2H2 | <1 | <1 | 500 | 15 | 70 | Hot spot |
| Set | Year | Insulation | Loss Factor | Oil Conductivity | Moisture | ||
|---|---|---|---|---|---|---|---|
| σ | Status | Estim. | Status | ||||
| p.u. | pS | – | % | – | |||
| 3 c | 1994 * | CHL | 0.003 | 3.2 | Good | 4.6 | Wet |
| 1998 § | CHL | 0.002 | 28 | Satisfy | 4.5 | Wet | |
Publisher’s Note: MDPI stays neutral with regard to jurisdictional claims in published maps and institutional affiliations. |
© 2021 by the author. Licensee MDPI, Basel, Switzerland. This article is an open access article distributed under the terms and conditions of the Creative Commons Attribution (CC BY) license (https://creativecommons.org/licenses/by/4.0/).
Share and Cite
Arumugam, S. Failure Diagnosis and Root-Cause Analysis of In-Service and Defective Distribution Transformers. Energies 2021, 14, 4997. https://doi.org/10.3390/en14164997
Arumugam S. Failure Diagnosis and Root-Cause Analysis of In-Service and Defective Distribution Transformers. Energies. 2021; 14(16):4997. https://doi.org/10.3390/en14164997
Chicago/Turabian StyleArumugam, Saravanakumar. 2021. "Failure Diagnosis and Root-Cause Analysis of In-Service and Defective Distribution Transformers" Energies 14, no. 16: 4997. https://doi.org/10.3390/en14164997
APA StyleArumugam, S. (2021). Failure Diagnosis and Root-Cause Analysis of In-Service and Defective Distribution Transformers. Energies, 14(16), 4997. https://doi.org/10.3390/en14164997