
Temperature Distribution in the Insulation System of Condenser-Type HV Bushing—Its Effect on Dielectric Response in the Frequency Domain


Abstract
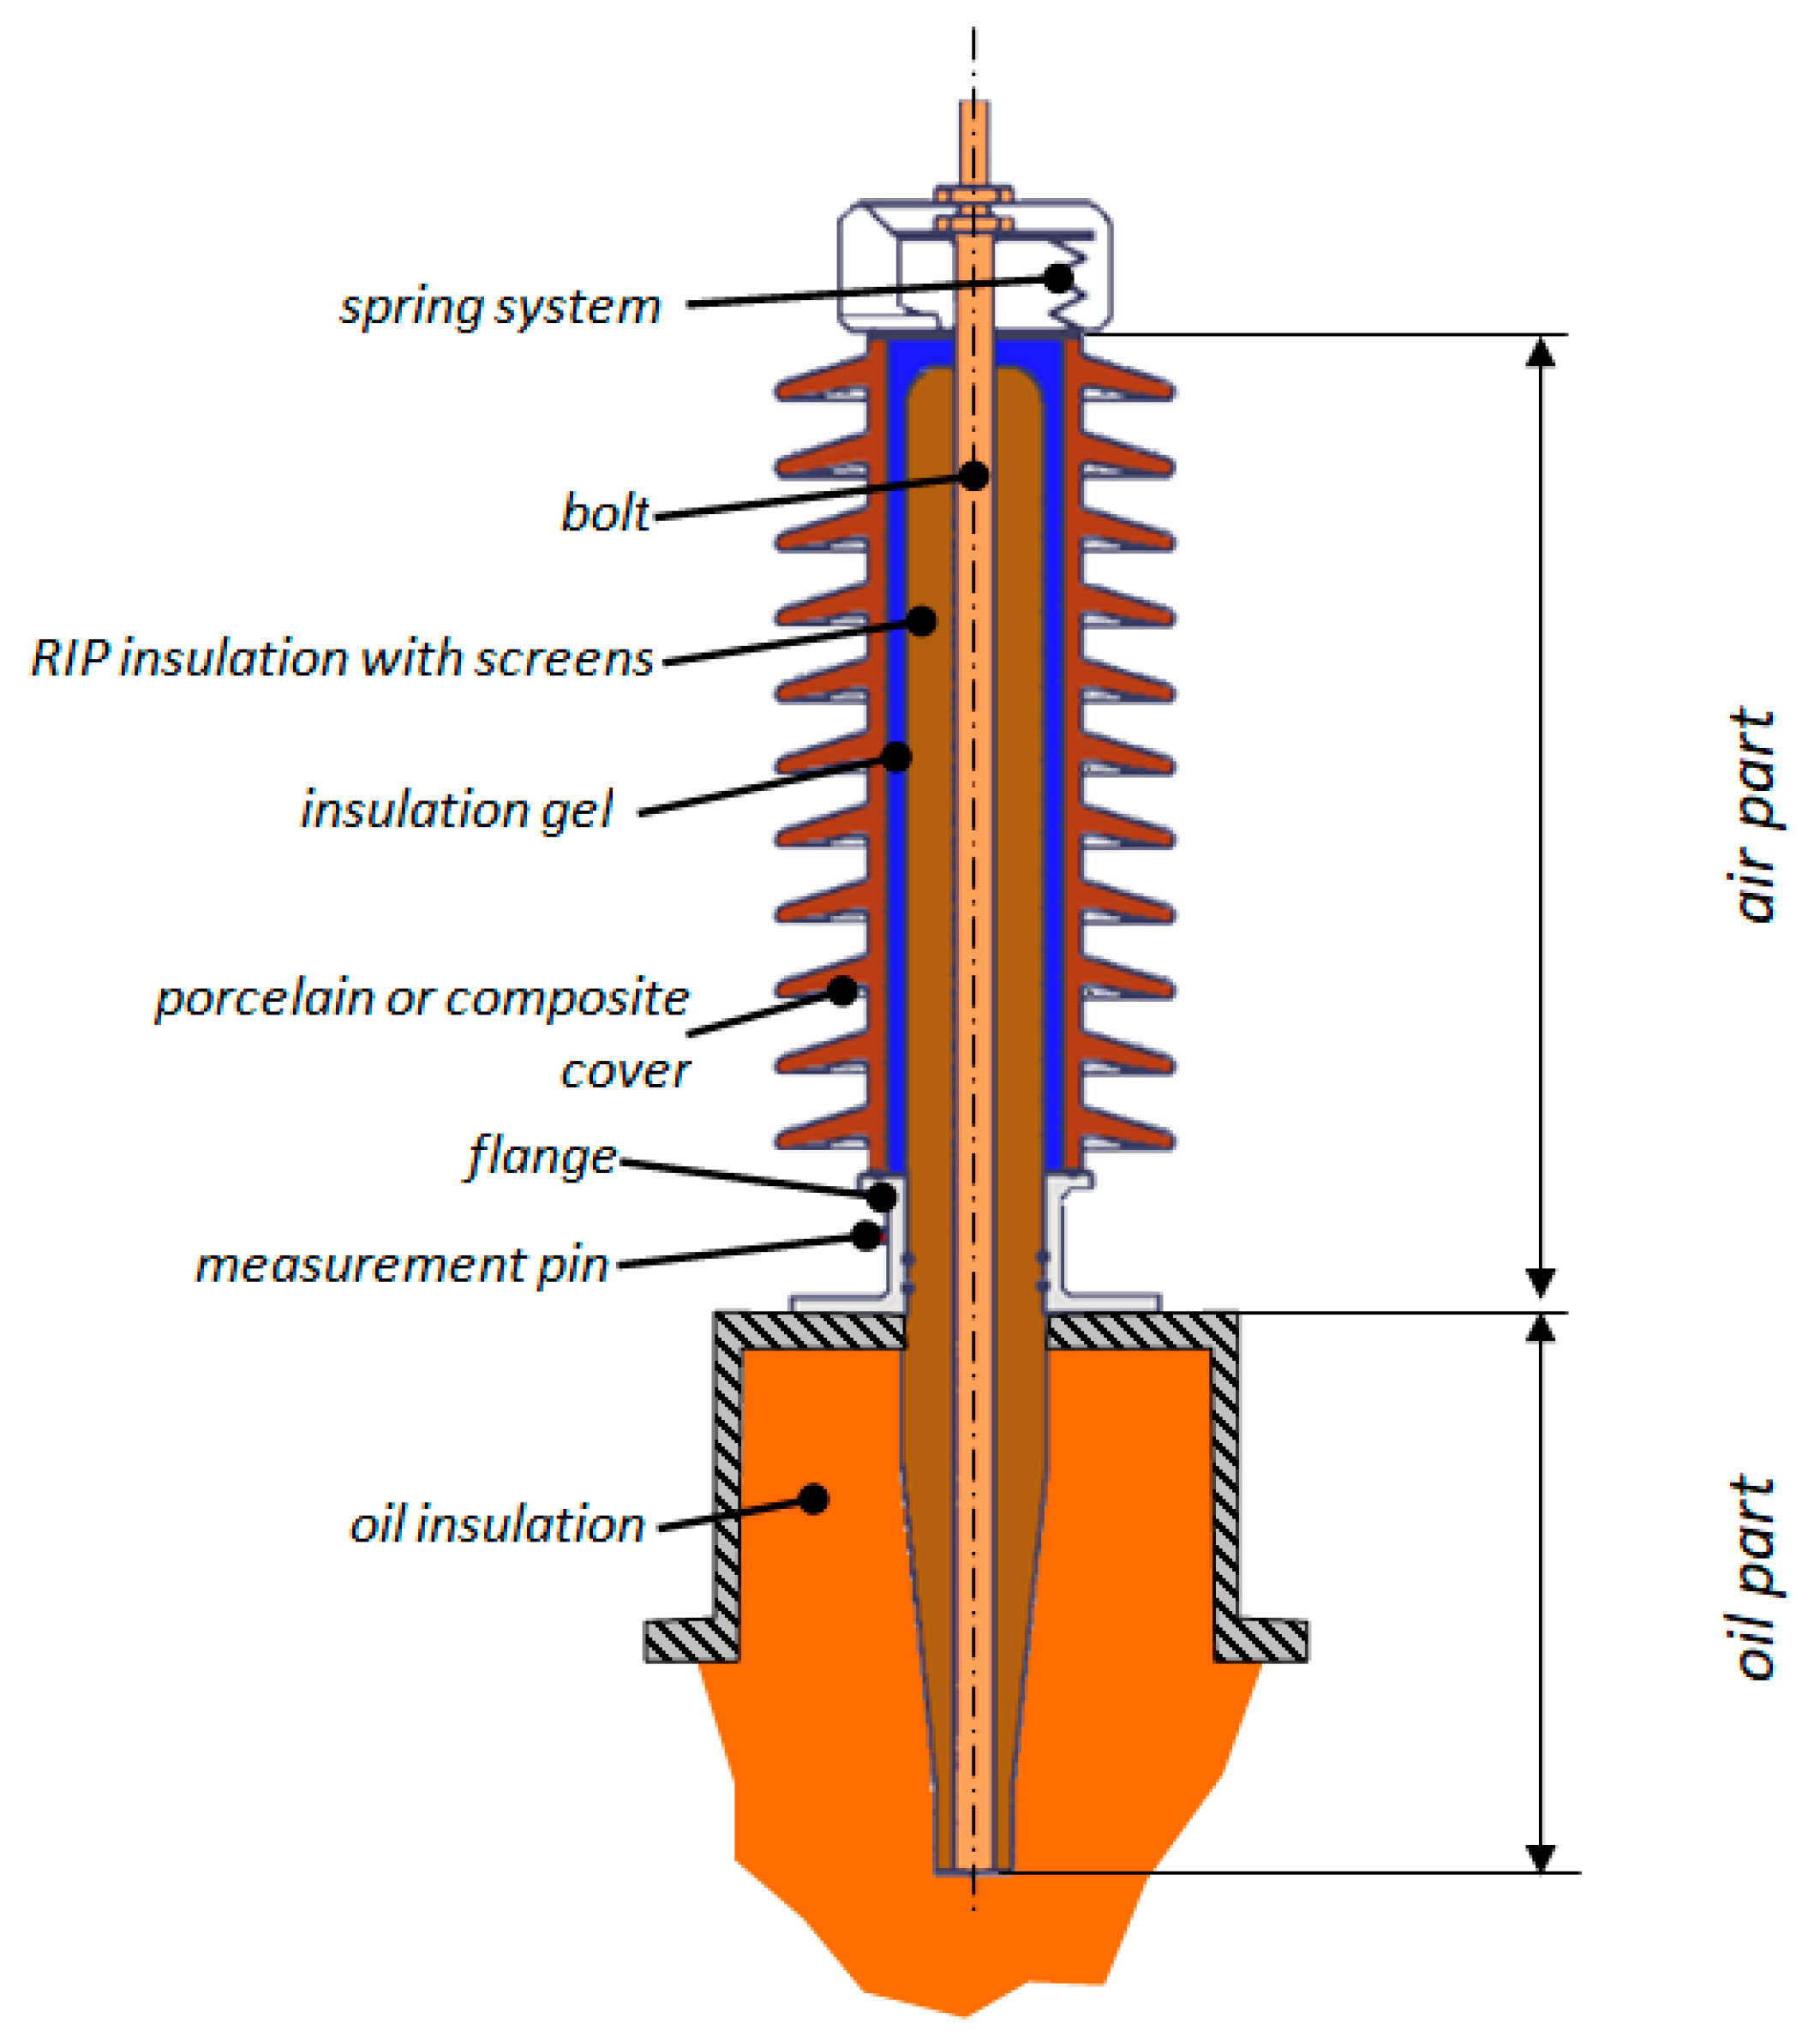
:1. Introduction
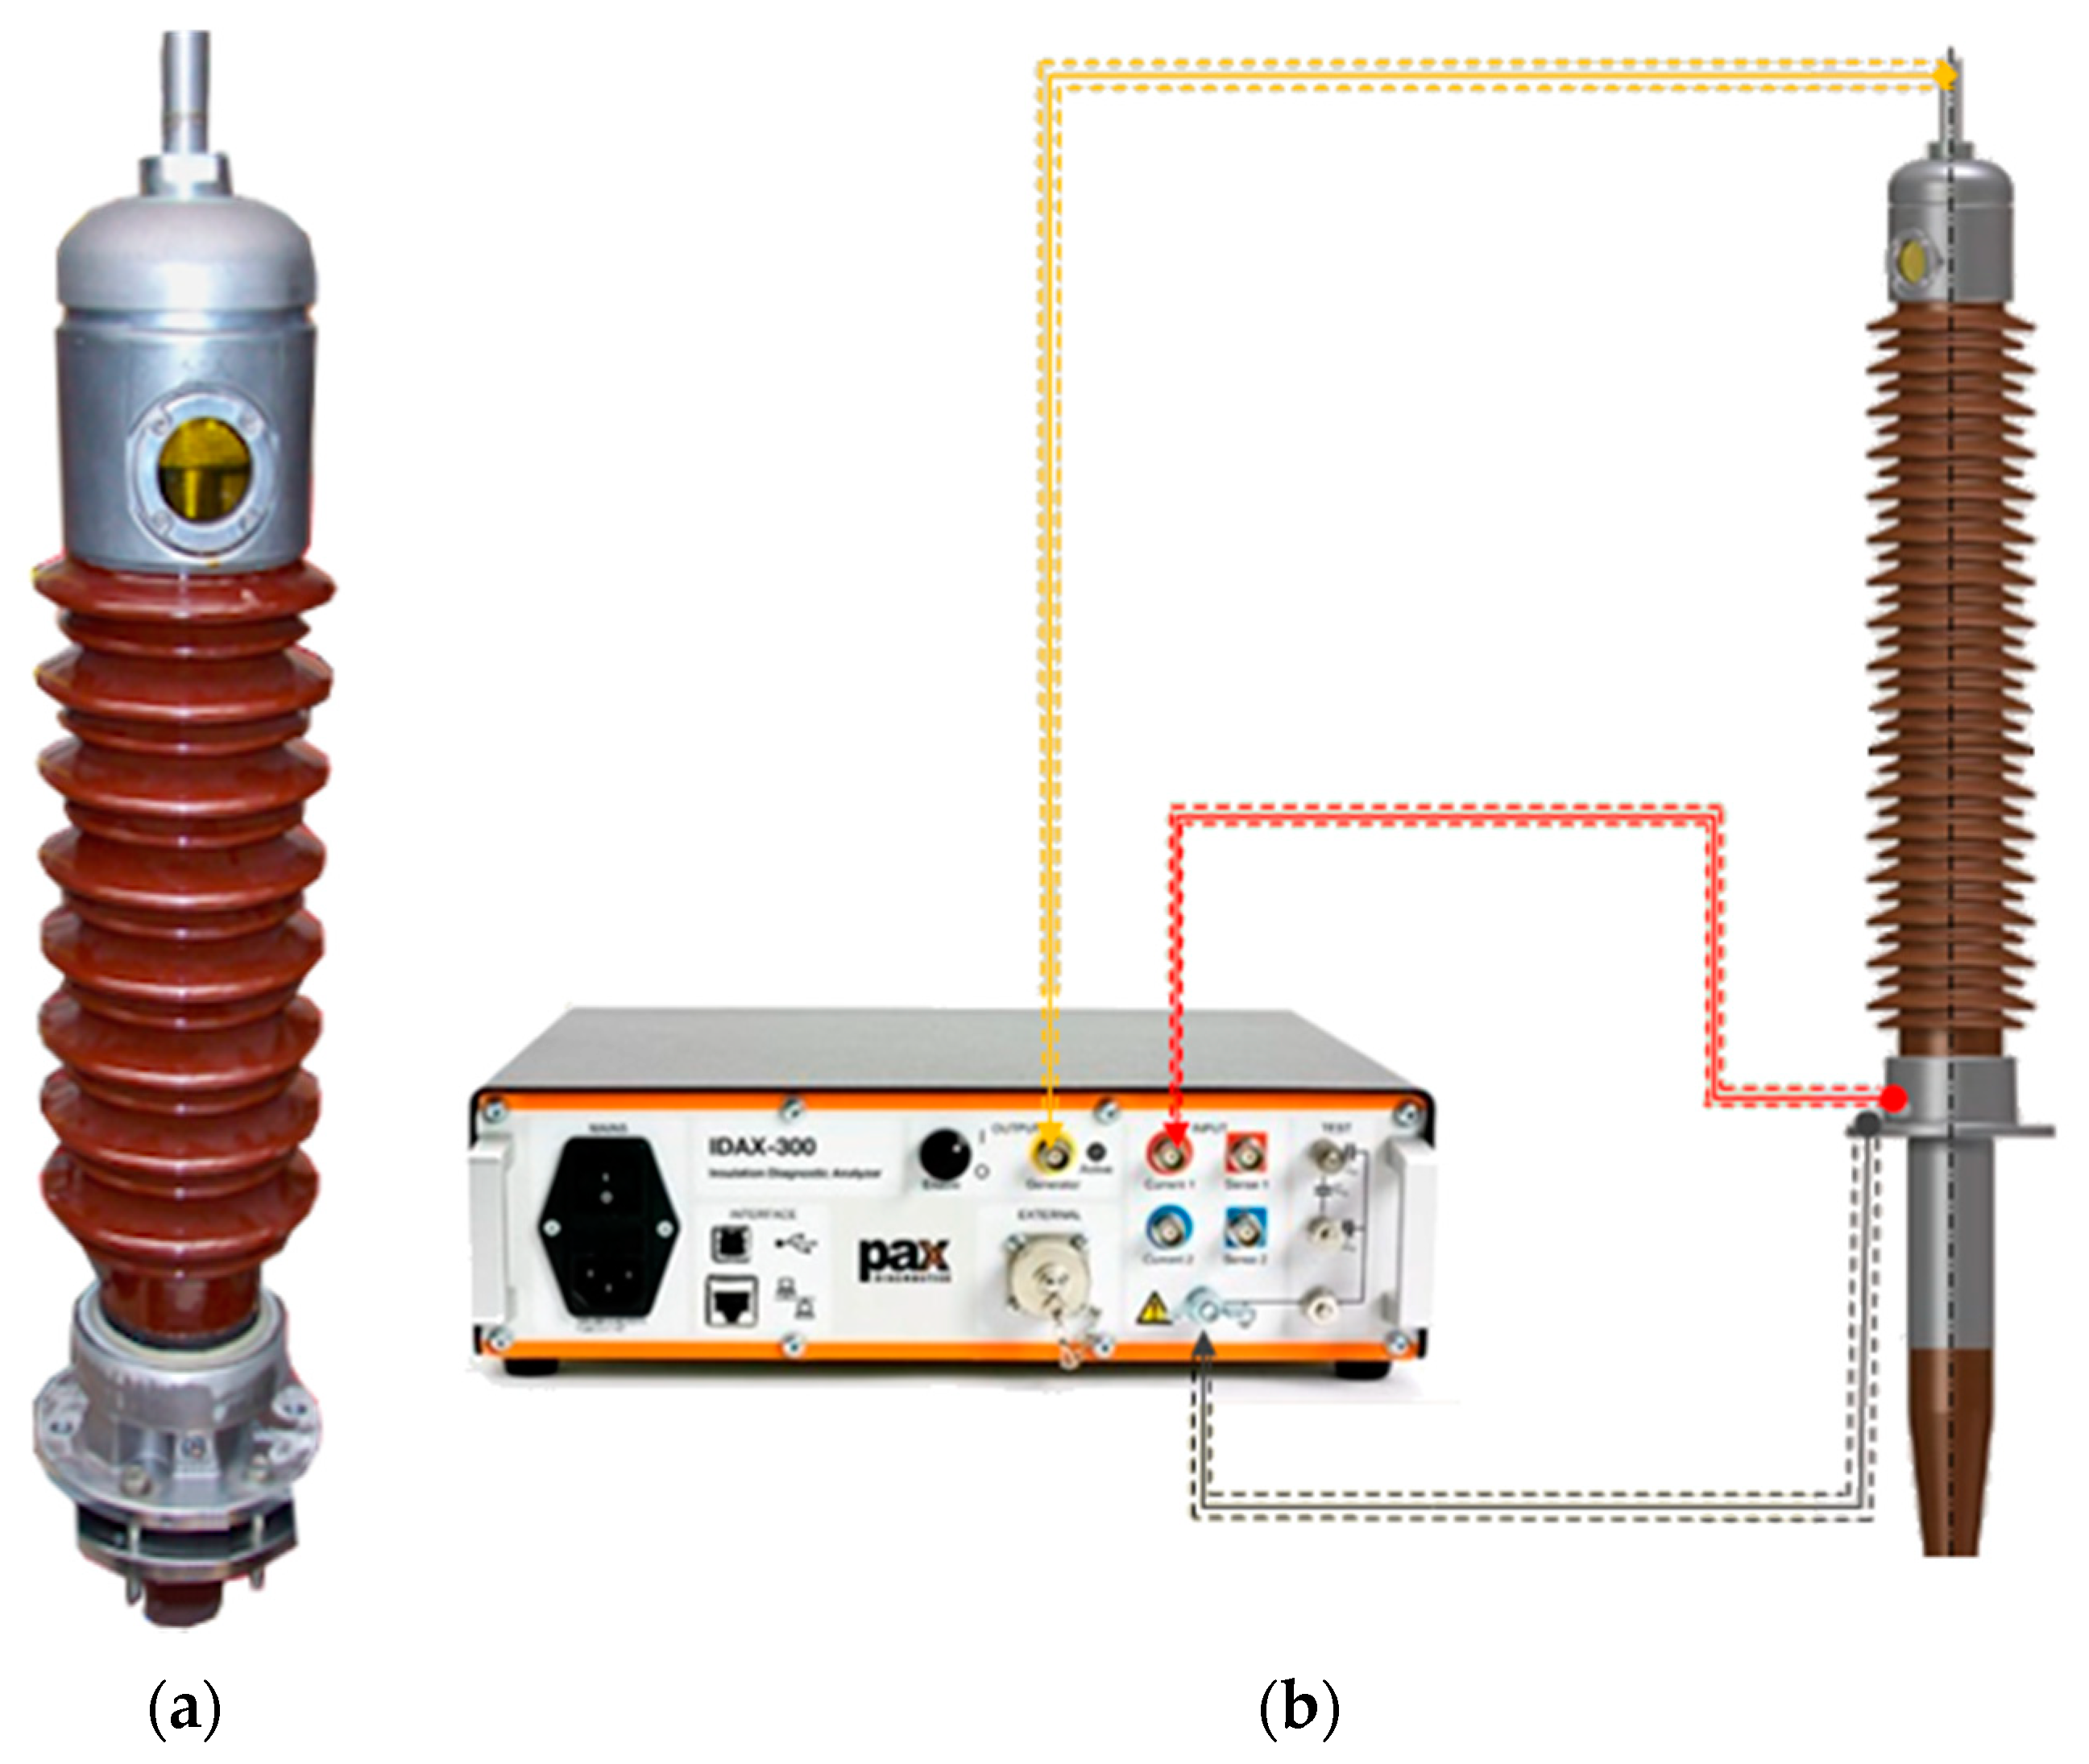
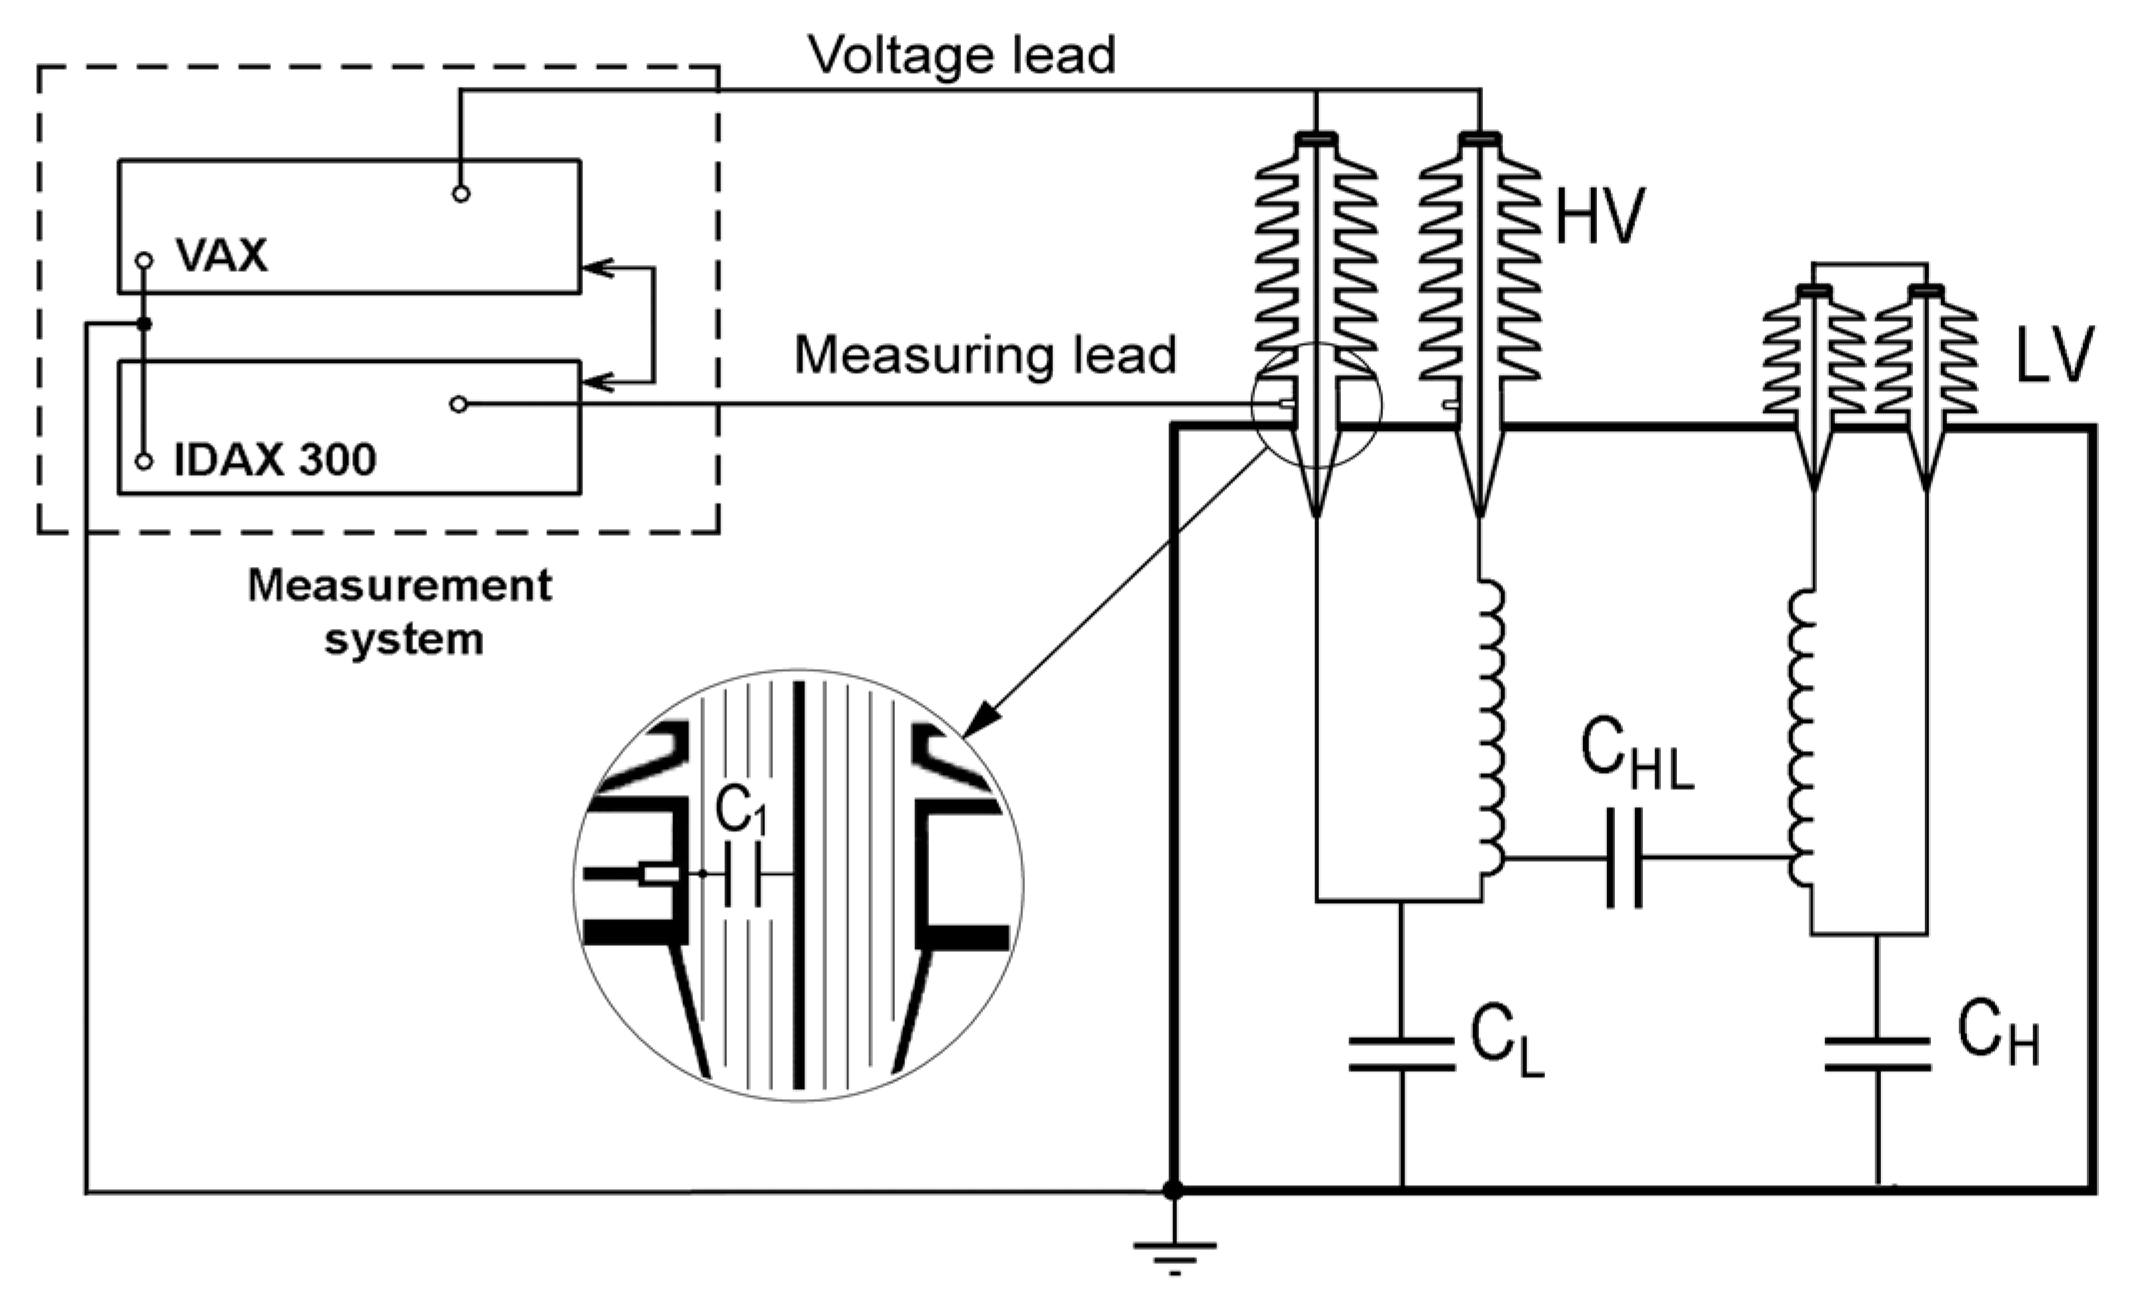
2. Materials and Methods
3. Results
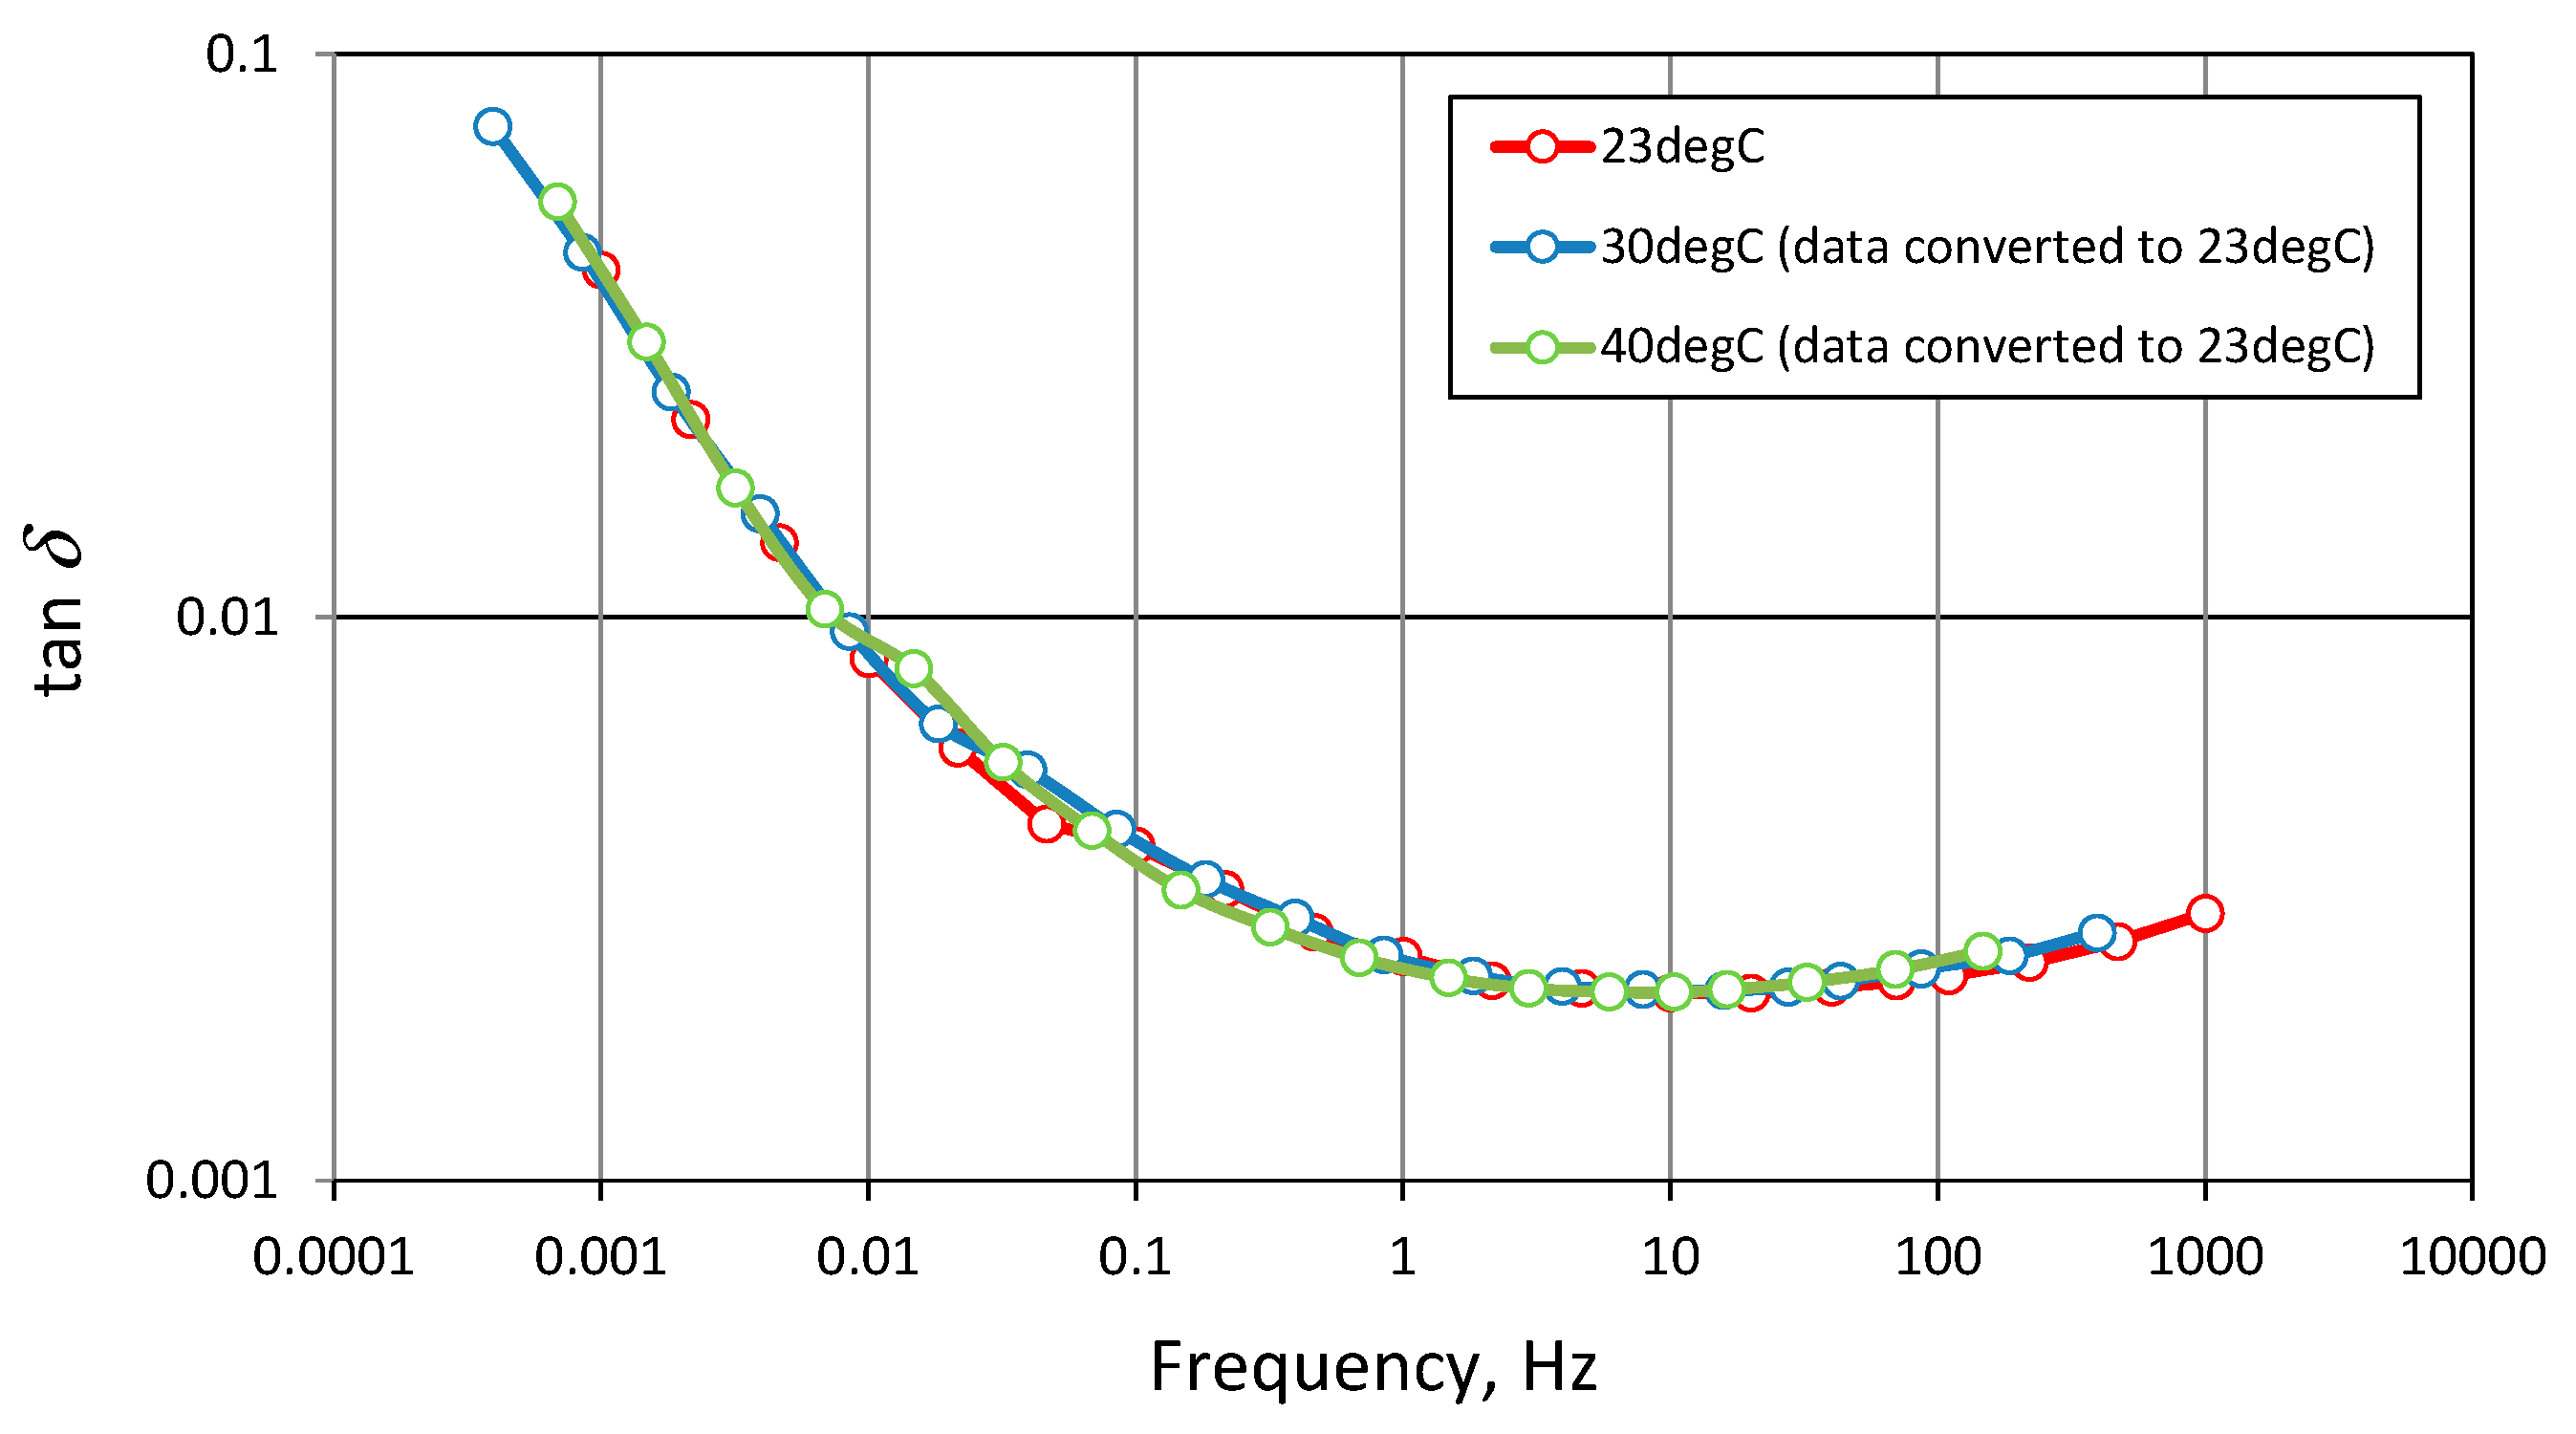
3.1. Measurements with Uniform Temperature Distribution
- -
- tan δ—loss tangent;
- -
- Ae—activation energy;
- -
- T—temperature;
- -
- K—Boltzman’s constant.
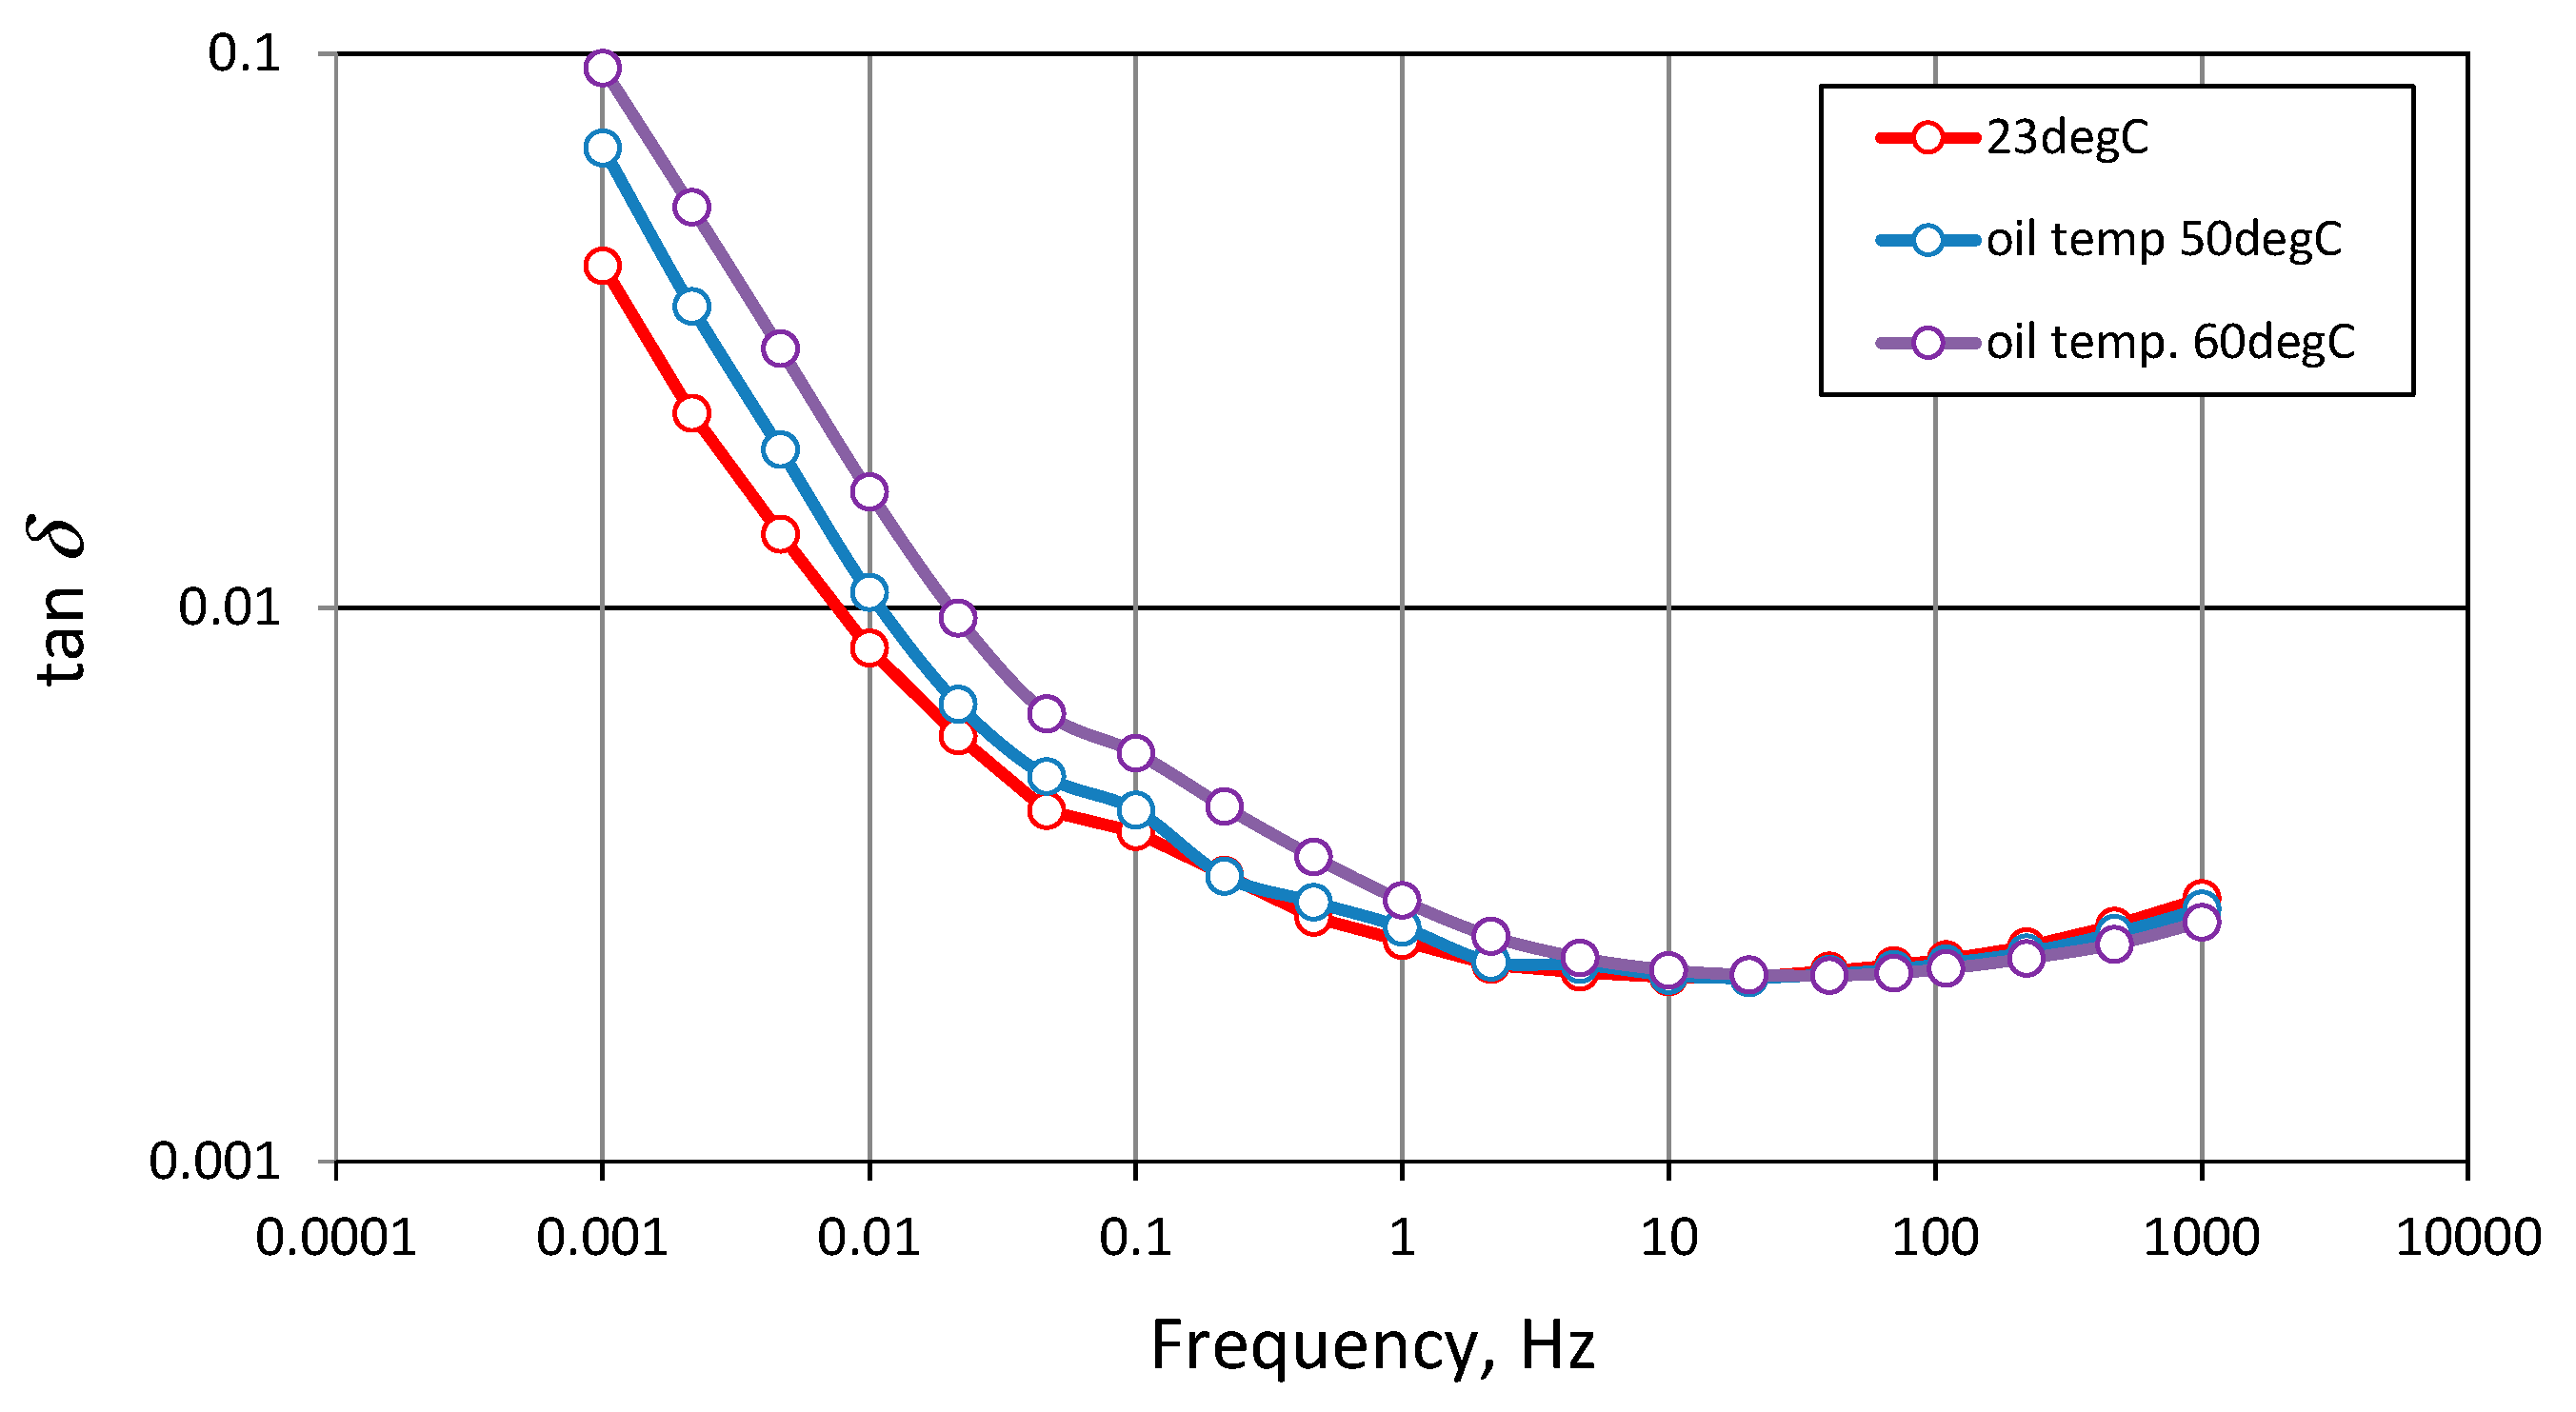
3.2. Measurements with Nonuniform Temperature Distribution
4. Discussion
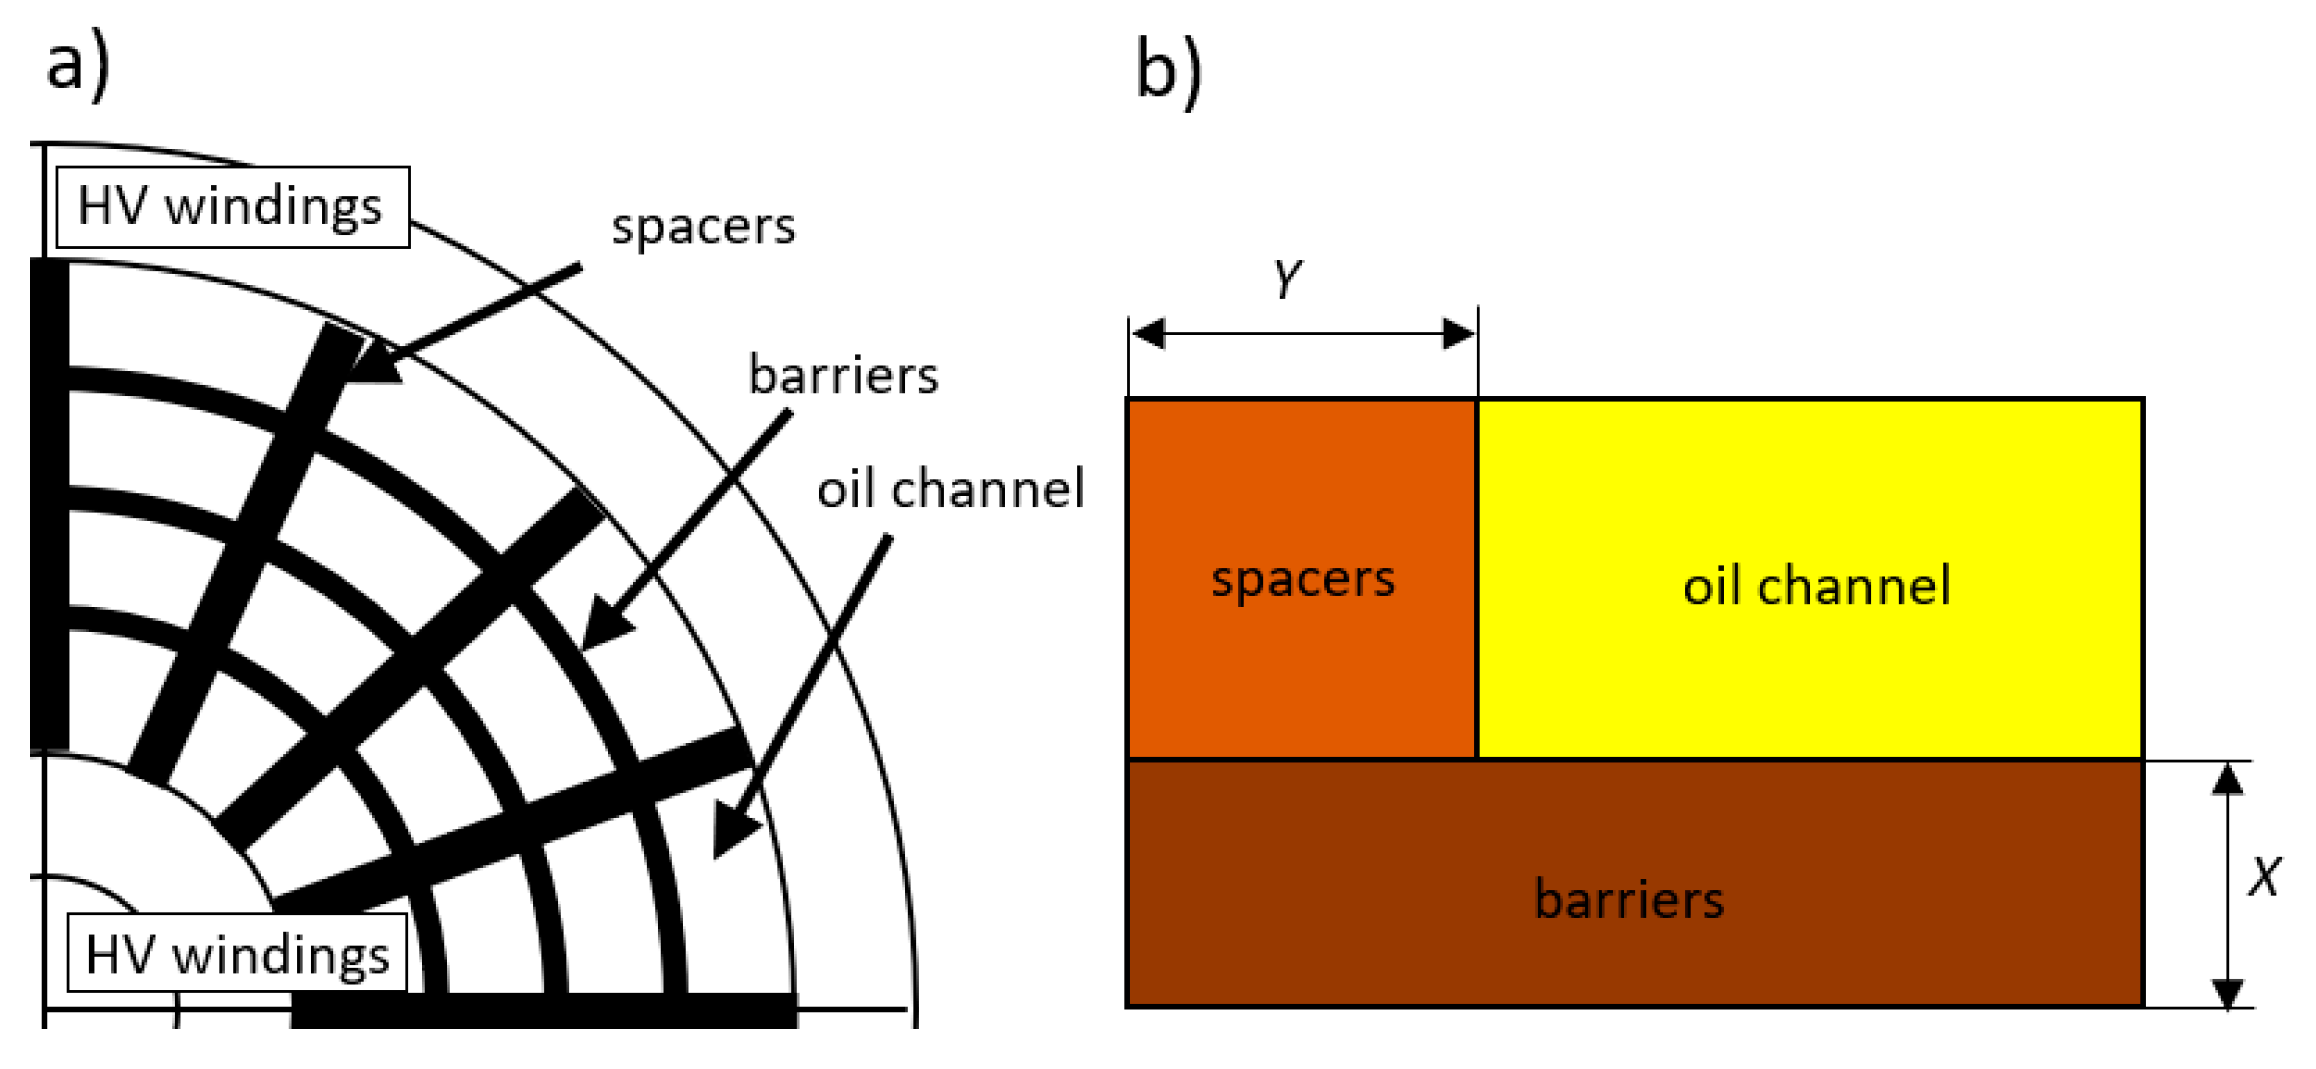
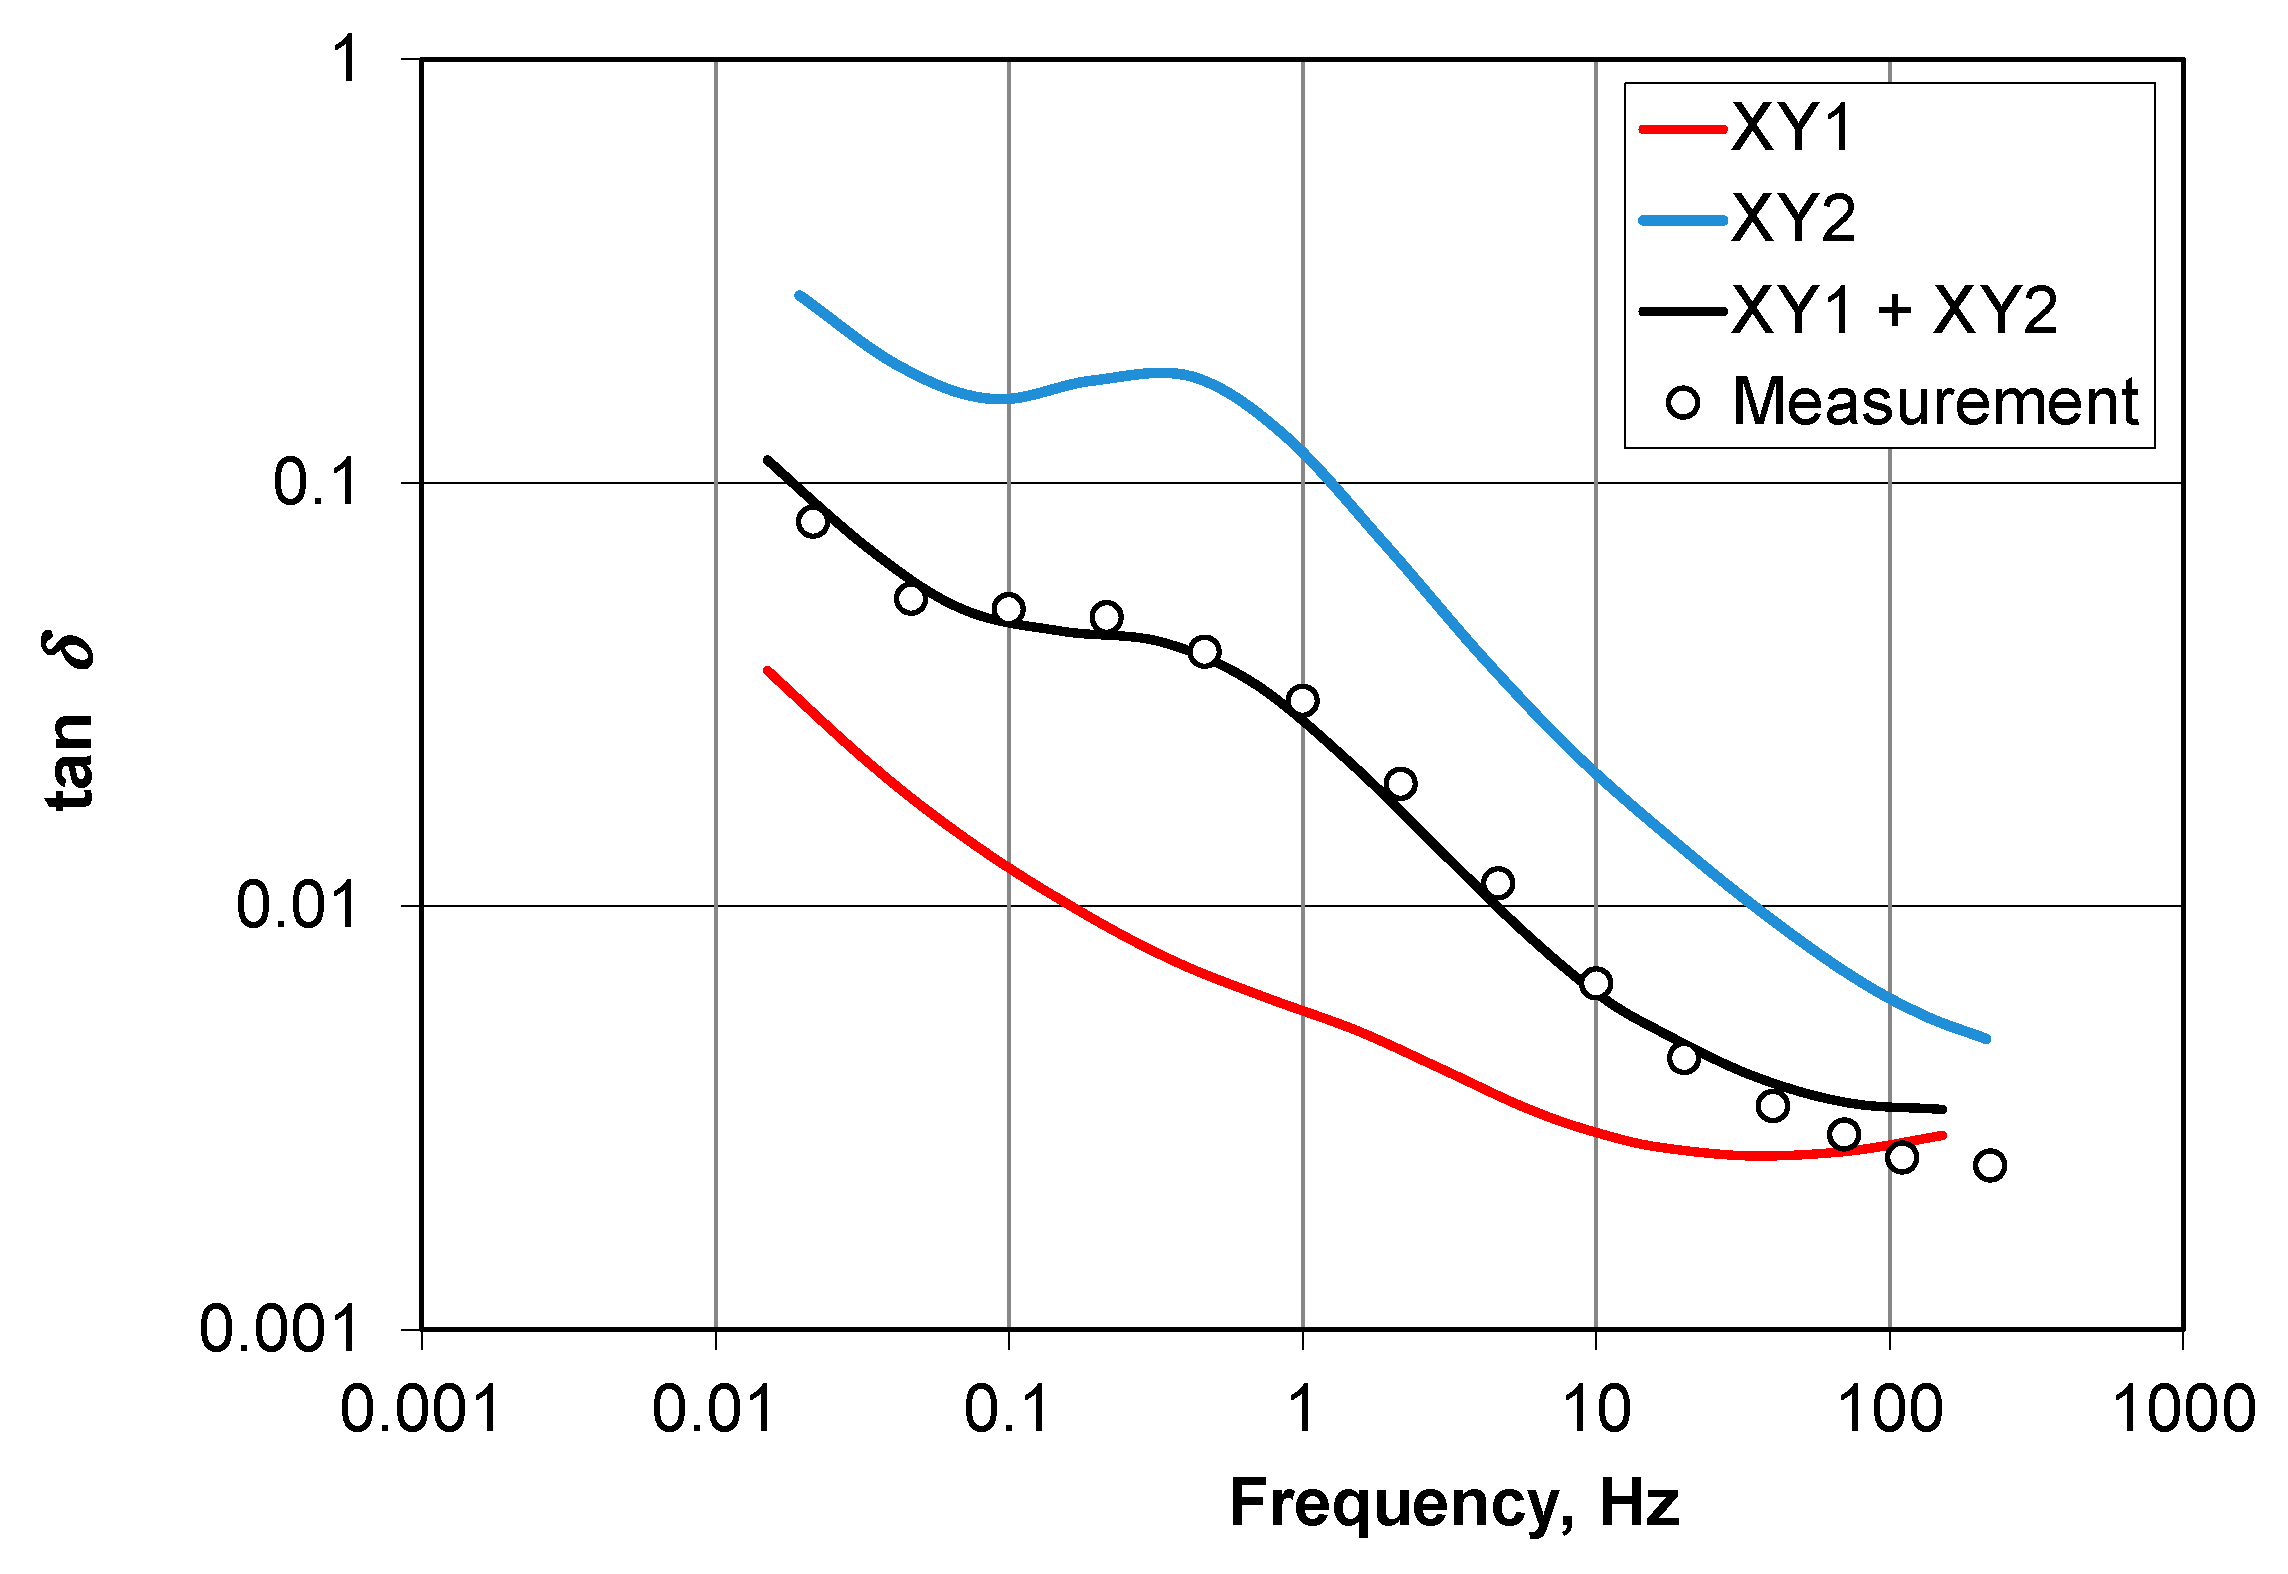
4.1. Modeling the Dielectric Response of the Bushing Insulation in the Case of Significant Temperature Distribution along Its Axis
- -
- ε∗P(ϖ,T)—complex permittivity of paper impregnated with mineral oil;
- -
- ε∗U(ϖ,T)—complex permittivity representing areas of the leakage nature (oil, shield);
- -
- X1, Y1, X2, Y2—geometric parameters describing the participation of the paper in the whole modeled space.
- -
- —the real part of permittivity calculated respectively for the areas of temperatures T1 and T2 according to Formulae (1) and (2);
- -
- —the imaginary part of permittivity calculated respectively for the areas of temperatures T1 and T2 according to Formulae (1) and (2).
- -
- A—participation of the area of temperature T1 in the whole volume of the insulator;
- -
- tan δXY1, tan δXY2—tangent of the dielectric loss angle of the areas of temperatures T1 and T2.
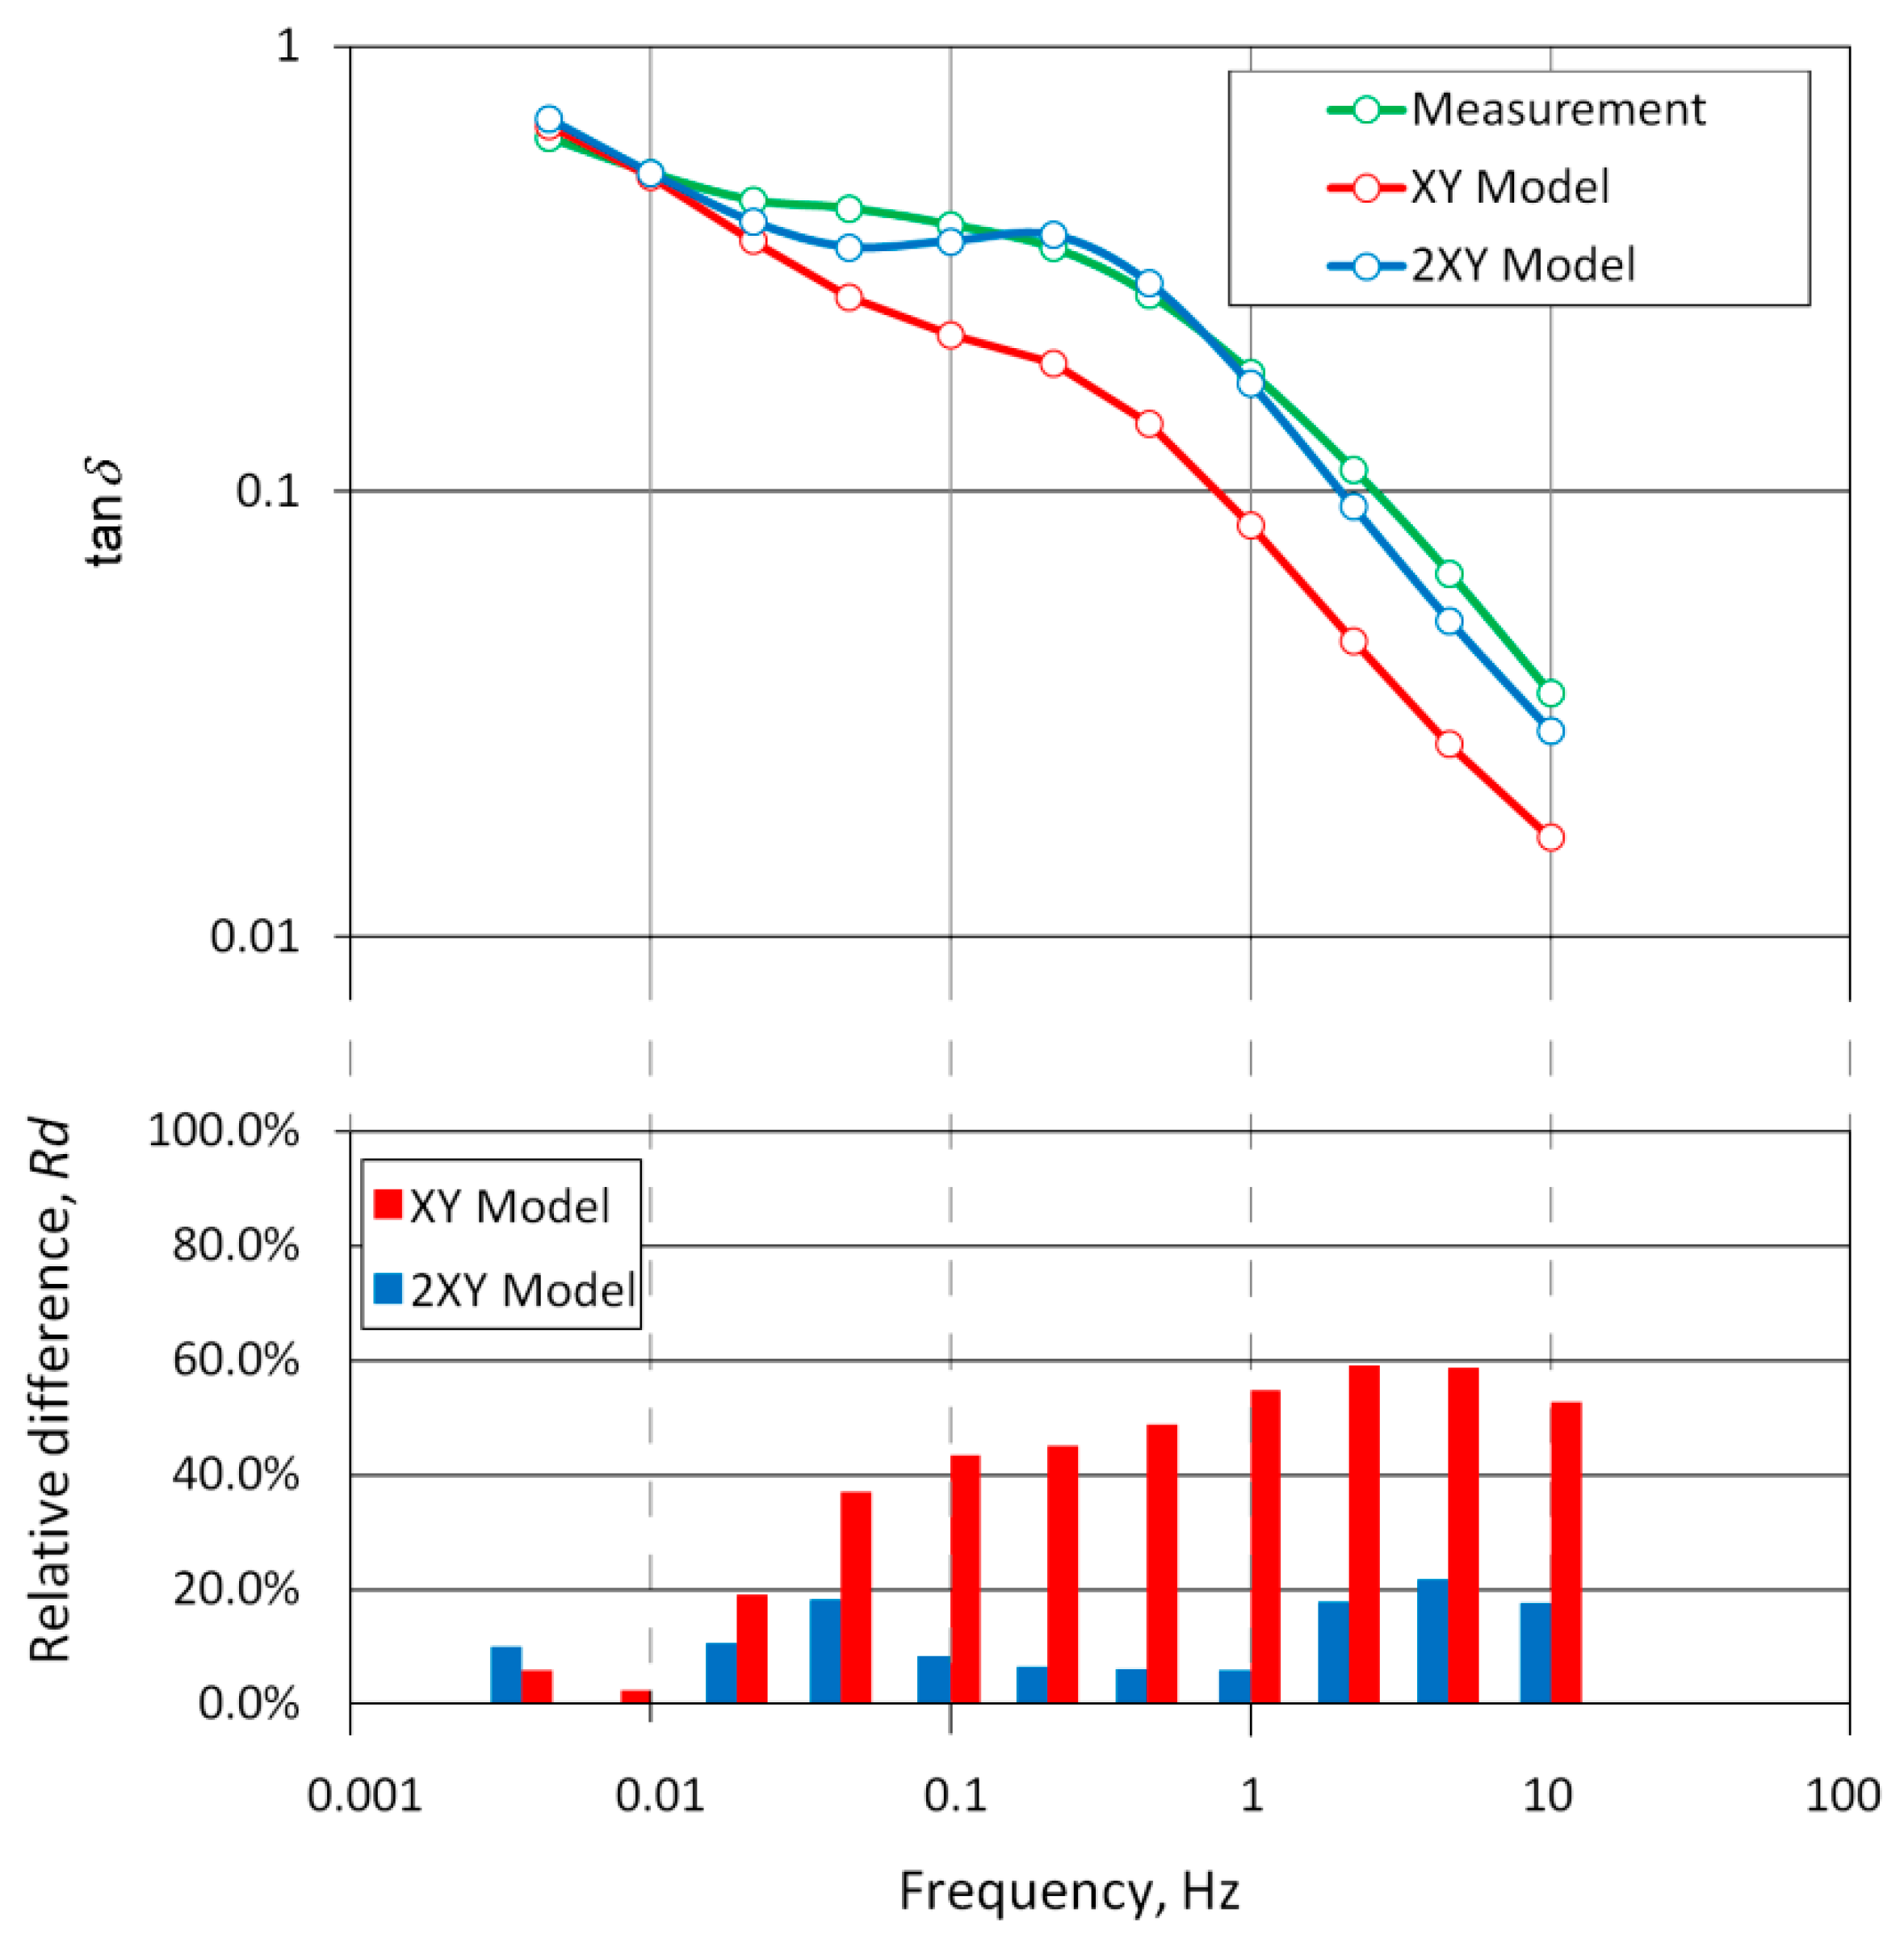
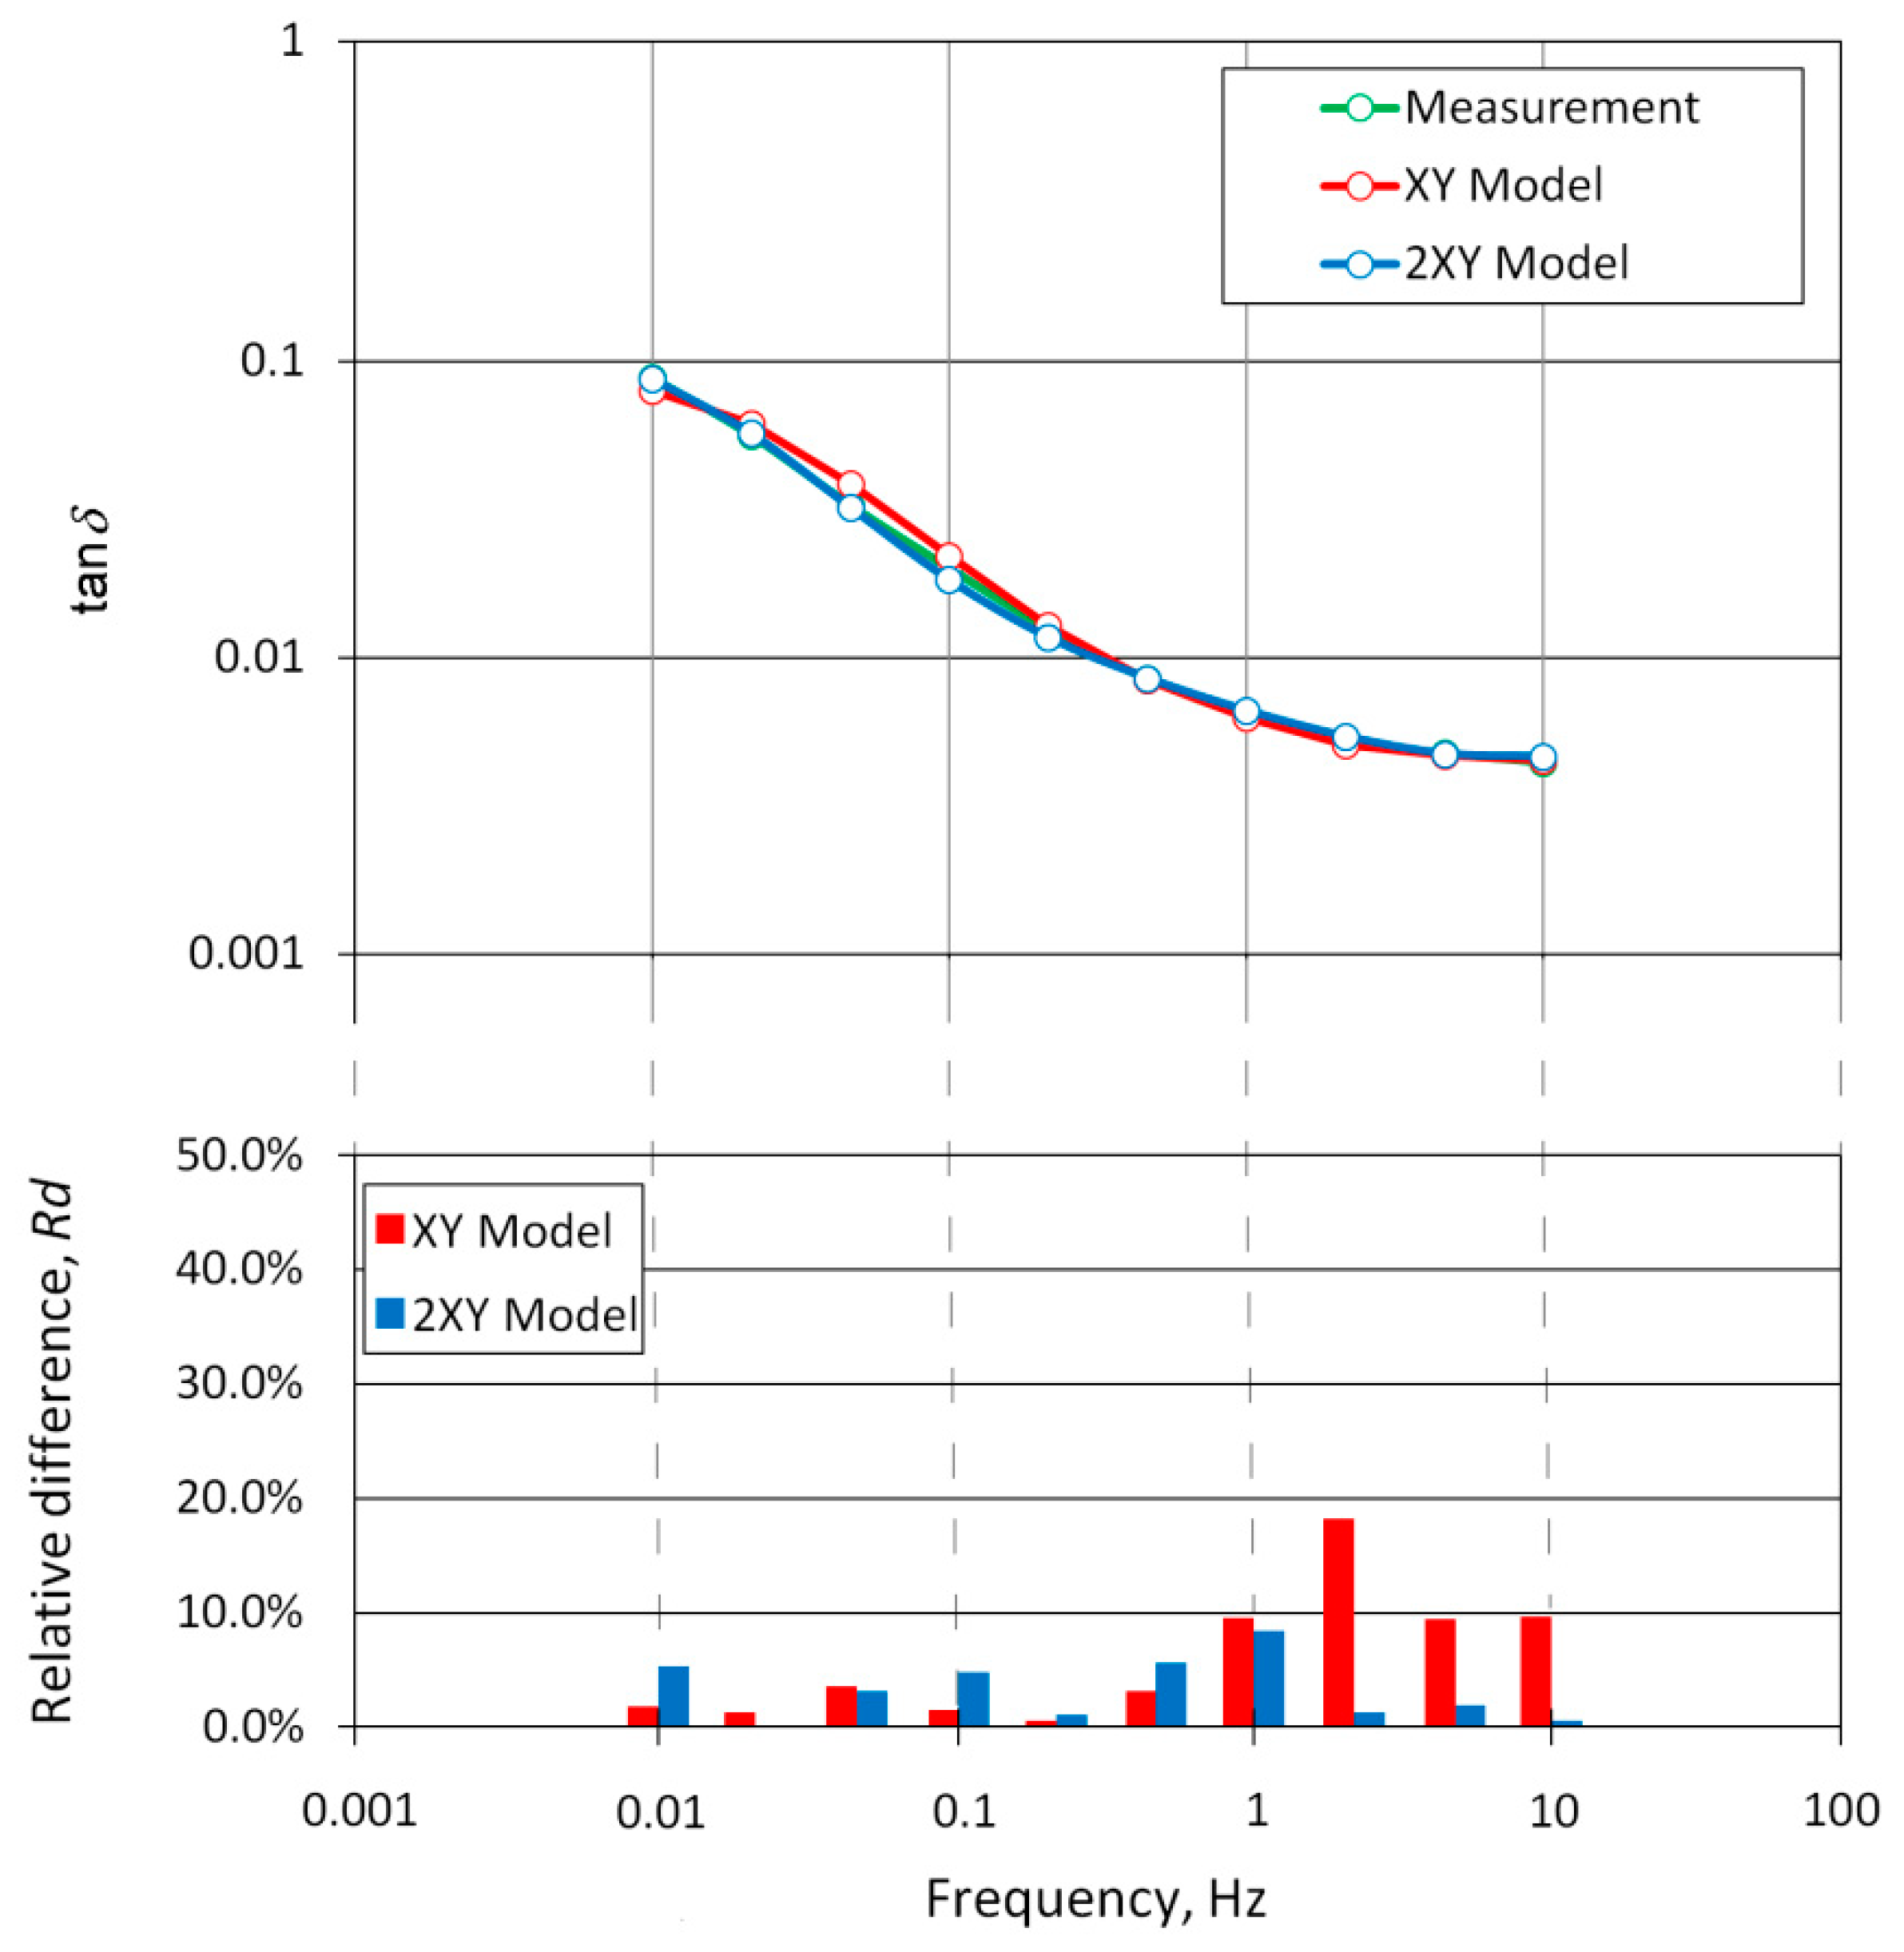
4.2. Verification of the 2XY Model on Insulators in Service
- -
- —loss tangent measured for a specific frequency;
- -
- —loss tangent calculated for a specific frequency based on XY or 2XY model;
- -
- —number of points for which measurements and calculations were carried out.
- -
- —loss tangent measured for a specific frequency;
- -
- —loss tangent calculated for a specific frequency based on XY or 2XY model;
- -
- —number of points for which measurements and calculations were carried out.
- -
- —oil conductivity in the air part (at T1 temperature);
- -
- —oil conductivity in the oil part (at T2 temperature);
- -
- —activation energy equal to 0.4 eV;
- -
- —Boltzmann constant.
5. Conclusions
Author Contributions
Funding
Institutional Review Board Statement
Informed Consent Statement
Data Availability Statement
Conflicts of Interest
Nomenclature
| Variable | Symbol | Units |
|---|---|---|
| Complex permitivity | F/m | |
| Real part of complex permitivity | F/m | |
| Imaginary part of complex permitivity | F/m | |
| Relative content of barriers | X | % |
| Relative content of spacers | Y | % |
| Loss tangent | - | |
| Mean of the absolute difference modules | MADM | % |
| Correlation coefficient | r | - |
| Relative differences | Rd | % |
| Temperature | T | °C |
| Frequency | f | Hz |
| Voltage | U | V |
| Activation energy | Ae | eV |
| Participation of the air part in the whole volume of the insulator | A | % |
| Conductivity | σ | S/m |
| Moisture content in paper | Mc | % |
References
- Micafil Transformer Bushings, AirRIP, 2021. Available online: https://www.hitachiabb-powergrids.com/pl/pl/offering/product-and-system/transformer-insulation-and-components/bushings/resin-impregnated-paper-rip/ac-bushing-type-airrip-flex (accessed on 30 June 2021).
- Septyani, H.I.; Arifianto, I.; Purnomoadi, A.P. High voltage transformer bushing problems. In Proceedings of the 2011 International Conference on Electrical Engineering and Informatics, Bandung, Indonesia, 7–19 July 2011; pp. 1–4. [Google Scholar] [CrossRef]
- Wankowicz, J.; Bielecki, J.; Szrot, M.; Subocz, J.; Malewski, R. HV Bushing Failure in Service, Diagnostics and Modeling of Oil-type Bushings. In Proceedings of the CIGRE Session, Paris, France, 22–27 August 2010; pp. 1–10. [Google Scholar]
- CIGRÉ WG A2.37. Transformer Reliability Survey; CIGRE Brochure: Paris, France, 2015. [Google Scholar]
- Chen, M.; Liu, X.; Xu, P.; Wen, T. Local Inter-foil Insulation Deterioration Diagnosis and Simulation of RIP Bushing Based on FDS Method. Cond. Monit. Diagn. (CMD) 2018, 1–5. [Google Scholar] [CrossRef]
- Huang, Z.; Fu, M.; Zhuo, R.; Jing, Y.; Luo, Y.; Wang, G.; La, Y.; Dong, X. Research on the Wetting Mechanism of Oil-Paper Insulated Bushings and the Application of FDS Method. In Proceedings of the IEEE Sustainable Power and Energy Conference (iSPEC), Beijing, China, 21–23 November 2019; pp. 1903–1908. [Google Scholar] [CrossRef]
- Zhang, L.; Han, Y.; Zhao, H.; Zhang, H.; Zhang, D.; Mu, H. Simulation Study on the FDS Characteristics of Non-uniform Dampened Oil-paper Bushing. In Proceedings of the IEEE International Conference on High Voltage Engineering and Application (ICHVE), Beijing, China, 6–10 September 2020; pp. 1–4. [Google Scholar] [CrossRef]
- Long, G.; Mu, H.; Zhang, D.; Li, Y.; Zhang, G. Moisture Location of Oil-Paper Insulated Bushing Based on Polarization and Depolarization Current Analysis. In Proceedings of the IEEE 3rd International Conference on Dielectrics (ICD), Virtual, Valencia, Spain, 5–31 July 2020; pp. 692–695. [Google Scholar] [CrossRef]
- Qi, B.; Dai, Q.; Li, C.; Zeng, Z.; Fu, M.; Zhuo, R. The Mechanism and Diagnosis of Insulation Deterioration Caused by Moisture Ingress into Oil-Impregnated Paper Bushing. Energies 2018, 11, 1496. [Google Scholar] [CrossRef] [Green Version]
- Yang, F.; Du, L.; Yang, L.; Wei, C.; Wang, Y.; Ran, L.; He, P. A Parameterization Approach for the Dielectric Response Model of Oil Paper Insulation Using FDS Measurements. Energies 2018, 11, 622. [Google Scholar] [CrossRef] [Green Version]
- Wei, C.; Liao, C.; Du, L.; Chen, X. Influence of Moisture on Dielectric Responses of Oil-Impregnated Paper Condenser Bushings. In Proceedings of the 5th International Conference on Electric Power Equipment—Switching Technology (ICEPE-ST), Kitakyushu, Japan, 13–16 October 2019; pp. 709–712. [Google Scholar] [CrossRef]
- Enciso, L.; Martínez, J.L.; Arce, P. Life expectancy of high voltage bushings based on incipient failure detections: A practical approach. In Proceedings of the 2020 IEEE Electrical Insulation Conference (EIC), Knoxville, TN, USA, 22 June–3 July 2020; pp. 325–328. [Google Scholar] [CrossRef]
- Buchacz, J.; Cichon, A.; Skubis, J. Detection of conductive layers short circuit in HV condenser bushings using Frequency Domain Spectroscopy. IEEE Trans. Dielectr. Electr. Insul. 2017, 24, 552–558. [Google Scholar] [CrossRef]
- Subocz, J.; Mrozik, A.; Bohatyrewicz, P.; Zenker, M. Condition Assessment of HV Bushings with Solid Insulation based on the SVM and the FDS Methods. Energies 2020, 13, 853. [Google Scholar] [CrossRef] [Green Version]
- Standard No: PN-EN 60584-1:2014-04. In Thermocouples—Part 1: EMF Specifications and Tolerances; PKN: Warsaw, Poland, 2014.
- Jonscher, A.K. Dielectric relaxation in solids. J. Phys. D Appl. Phys. 1999, 32, 57–70. Available online: https://iopscience.iop.org/article/10.1088/0022-3727/32/14/201 (accessed on 30 June 2021). [CrossRef]
- Dielectric Frequency Response (DFR) Task Force—Final Report. IEEE Transformers Committee, 07 June 2012. Available online: https://grouper.ieee.org/groups//transformers/subcommittees/dielectric_test/F13-C57.161-DFR-TF-Final%20Report.pdf (accessed on 30 June 2021).
- Liu, J.; Fan, X.; Zhang, Y.; Zheng, H.; Yao, H.; Zhang, C.; Zhang, Y.; Li, D. A Novel Universal Approach for Temperature Correction on Frequency Domain Spectroscopy Curve of Transformer Polymer Insulation. Polymers 2019, 11, 1126. [Google Scholar] [CrossRef] [PubMed] [Green Version]
- Du, Y.; Yang, L.; Liu, X.; Wang, Y.; Gao, J.; Yao, R. Effect of moisture and thermal degradation on the activation energy of oil-paper insulation in frequency domain spectroscopy measurement. IET Gener. Transm. Distrib. 2016, 10, 2042–2049. Available online: https://ietresearch.onlinelibrary.wiley.com/doi/10.1049/iet-gtd.2015.0946 (accessed on 30 June 2021).
- Ekanayake, C.; Gubanski, S.M.; Graczkowski, A.; Walczak, K. Frequency response of oil impregnated pressboard and paper samples for estimating moisture in transformer insulation. IEEE Trans. Power Deliv. 2006, 21, 1309–1317. [Google Scholar] [CrossRef]
- Liu, J.; Fan, X.; Zhang, Y.; Zheng, H.; Jiao, J. Temperature correction to dielectric modulus and activation energy prediction of oil-immersed cellulose insulation. IEEE Trans. Dielectr. Electr. Insul. 2020, 27, 956–963. [Google Scholar] [CrossRef]
- Gielniak, J.; Graczkowski, A.; Gubanski, S.; Moranda, H.; Mościcka-Grzesiak, H.; Walczak, K. Influence of thermal ageing on dielectric response of oil-paper insulation. Mater. Sci.-Poland 2009, 27, 1199–1205. [Google Scholar]
- Ekanayake, C.; Graczkowski, A.; Walczak, K.; Gubanski, S.M. Dielectric spectroscopy measurements on oil impregnated paper/pressboard samples. In Proceedings of the International Conference APTADM, Wroclaw, Poland, 15–17 September 2004; pp. 113–120. [Google Scholar]
- Gielniak, J.; Ekanayake, C.; Walczak, K.; Graczkowski, A.; Gubanski, S.M. Dielectric response of new and aged transformer pressboard in dry and wet states. In Proceedings of the International Symposium on Electrical Insulating Materials ISEIM 2005, Kitakyushu, Japan, 5–9 June 2005; Volume 2, pp. 386–389. [Google Scholar] [CrossRef]
- Xie, J.; Dong, M.; Yu, B.; Hu, Y.; Yang, K.; Xia, C. Physical Model for Frequency Domain Spectroscopy of Oil–Paper Insulation in a Wide Temperature Range by a Novel Analysis Approach. Energies 2020, 13, 4530. [Google Scholar] [CrossRef]
- Gafvert, U.; Frimpong, G.; Fuhr, J. Modelling of Dielectric Measurements on Power Transformers. In Proceedings of the CIGRE Session, Paris, France, 1998; pp. 15–103. Available online: https://e-cigre.org/publication/SESSION1998-1998-cigre-session (accessed on 3 July 2021).
- Gafvert, U.; Adeen, L.; Tapper, M.; Ghasemi, P.; Jonsson, B. Dielectric Spectroscopy in Time and Frequency Domain Applied to Diagnostics of Power Transformers. In Proceedings of the International Conference on Properties and Applications of Dielectric Materials, Xi’an, China, 21–26 June 2000; pp. 825–830. [Google Scholar] [CrossRef]
- Gielniak, J.; Graczkowski, A.; Moranda, H.; Przybylek, P.; Walczak, K.; Nadolny, Z.; Moscicka-Grzesiak, H.; Feser, K.; Gubanski, S.M. Moisture in cellulose insulation of power transformers—statistics. IEEE Trans. Dielectr. Electr. Insul. 2003, 20, 982. [Google Scholar] [CrossRef]
- Gielniak, J. Influence of geometrical parameters and temperature of oil-paper insulation on analysis results by means dielectric response method. Przeglad Elektrotechniczny 2010, 86, 220–222. [Google Scholar]
- Framework Instruction for Operation of Transformers; Energopomiar—Elektryka: Gliwice, Poland, 2012.
- Johnson, R.; Kuby, P.J. Elementary Statistics, 11th ed.; Cengage Learning: Boston, MA, USA, 2011. [Google Scholar]


| Temperature (°C) | ||
|---|---|---|
| Case N° | Oil | Air |
| 1 | 23 | 23 |
| 2 | 30 | 30 |
| 3 | 40 | 40 |
| 4 | 50 | 23 |
| 5 | 60 | 23 |
| Temperature (°C) | |||
|---|---|---|---|
| Sensor N° | Case 1 | Case 2 | Case 3 |
| 1 | 22.7 | 30.4 | 40.4 |
| 2 | 22.7 | 28.3 | 37.9 |
| 3 | 22.9 | 29.6 | 40.7 |
| 4 | 23.2 | 30.5 | 43.1 |
| 5 | 23.8 | 31.3 | 41.3 |
| Average | 23.1 | 30.1 | 40.7 |
| Temperature (°C) | ||
|---|---|---|
| Case N° | Case 4 | Case 5 |
| Oil | 50.0 | 60.1 |
| 1 | 25.4 | 29.2 |
| 2 | 23.6 | 25.1 |
| 3 | 23.5 | 25.1 |
| 4 | 23.7 | 25.2 |
| 5 | 25.2 | 30.4 |
| № | XY Model | |||||
|---|---|---|---|---|---|---|
| X/Y, % | T, °C | σ, S/m | Mc, % | r | MADM, % | |
| Bushing 1 | 85/45 | 30 | 7.79 × 10⁻¹³ | 2.3 | 0.980 | 46.5 |
| Bushing 2 | 90/0 | 22 | 2.72 × 10⁻¹¹ | 2.3 | 0.942 | 38.9 |
| Bushing 3 | 74/86 | 25 | 1.69 × 10⁻¹² | 1.0 | 0.991 | 5.9 |
| № | 2XY Model | ||||||||
|---|---|---|---|---|---|---|---|---|---|
| X1/Y1, % | X2/Y2, % | T1, °C | T2, °C | σ2, S/m | Mc1, % | Mc2, % | r | MADM, % | |
| Bushing 1 | 96/2 | 100/100 | 24 | 43 | 1.87 × 10⁻¹¹ | 2.5 | 2.5 | 0.985 | 14.6 |
| Bushing 2 | 31/69 | 100/100 | 15 | 36 | 1.60 × 10⁻⁹ | 3.7 | 3.6 | 0.983 | 11.3 |
| Bushing 3 | 94/0 | 98/33 | 18 | 38 | 9.37 × 10⁻¹² | 1.0 | 1.0 | 0.999 | 3.2 |
Publisher’s Note: MDPI stays neutral with regard to jurisdictional claims in published maps and institutional affiliations. |
© 2021 by the authors. Licensee MDPI, Basel, Switzerland. This article is an open access article distributed under the terms and conditions of the Creative Commons Attribution (CC BY) license (https://creativecommons.org/licenses/by/4.0/).
Share and Cite
Walczak, K.; Gielniak, J. Temperature Distribution in the Insulation System of Condenser-Type HV Bushing—Its Effect on Dielectric Response in the Frequency Domain. Energies 2021, 14, 4016. https://doi.org/10.3390/en14134016
Walczak K, Gielniak J. Temperature Distribution in the Insulation System of Condenser-Type HV Bushing—Its Effect on Dielectric Response in the Frequency Domain. Energies. 2021; 14(13):4016. https://doi.org/10.3390/en14134016
Chicago/Turabian StyleWalczak, Krzysztof, and Jaroslaw Gielniak. 2021. "Temperature Distribution in the Insulation System of Condenser-Type HV Bushing—Its Effect on Dielectric Response in the Frequency Domain" Energies 14, no. 13: 4016. https://doi.org/10.3390/en14134016
APA StyleWalczak, K., & Gielniak, J. (2021). Temperature Distribution in the Insulation System of Condenser-Type HV Bushing—Its Effect on Dielectric Response in the Frequency Domain. Energies, 14(13), 4016. https://doi.org/10.3390/en14134016