Article

Assessment of the Europe 2020 Strategy: A Multidimensional Indicator Analysis via Dynamic Relative Taxonomy

1
Department of Econometrics and Computer Science, Wroclaw University of Economics and Business, 53-345 Wroclaw, Poland
2
Department of Statistics, Poznan University of Economics and Business, 61-875 Poznan, Poland
3
Department of Regional Economy, Wroclaw University of Economics and Business, 53-345 Wroclaw, Poland
*
Author to whom correspondence should be addressed.
Energies 2021, 14(16), 4990; https://doi.org/10.3390/en14164990
Submission received: 7 July 2021 / Revised: 11 August 2021 / Accepted: 12 August 2021 / Published: 14 August 2021
(This article belongs to the Special Issue Investment Analysis of Renewable Energy)

Abstract

:
Since 2010, the European Union countries have been implementing the objectives of the Europe 2020 Strategy aimed at smart, sustainable, and inclusive growth. The Strategy formulates nine indicators that are systematically monitored and assessed. Not all the indicators of the Europe 2020 Strategy could be used in the analysis in a direct way. Due to the limited availability and comparability of statistical data, this problem is presented in detail in part 2 of the article. The assessment of the achievement level of the Europe 2020 Strategy targets, both at the level of the entire European Union (the EU-level targets approach) and its individual Member States (the national-level targets approach) is the primary research purpose of the study. The composite index proposed and constructed on the basis of a dynamic relative taxonomy was used in the conducted research to present the diversified distance of the individual European Union countries in relation to the EU-level targets as well as the national-level targets of the Europe 2020 Strategy. The research methodology allows conducting the analysis taking into account the missing data. Most methods of ordering objects based on aggregate measures are compensatory in nature. This problem was significantly reduced by taking into account the geometric mean in the construction of the aggregate measure. The research findings revealed that in the years 2010–2019 an ongoing improvement in the implementation of both the EU and the national targets of the Europe 2020 Strategy was observed. In addition, the differences existing between the European Union Member States were reduced. However, none of the countries achieved the EU-level targets. Their highest implementation level was recorded in Denmark, Sweden, Austria, and Finland. The achievement level of the strategic goals regarding the national-level targets was influenced by the choice of one of the two approaches indicated in the study and adopted by the individual EU Member States in determining the set target values of the indicators, i.e., either prudential or optimistic.

1. Introduction and Motivation

1.1. The EU2020 Strategy

The policy of multi-faceted development presented by the individual European Union Member States is closely related to the strategic priorities of integrating Europe. In this context, pursuing the objectives of the Europe 2020 Strategy is of particular importance. The draft of the Strategy was presented by the European Commission on 3 March 2010 and approved on 17 June 2010 at the Brussels summit by the European Council [1]. The Strategy covers the following three interrelated priorities [2] (p. 8):
  • smart growth: the development of knowledge-based economy and innovation-based economy,
  • sustainable development: promoting a more resource-efficient, greener, and more competitive economy,
  • inclusive growth: fostering a high-employment economy delivering social and territorial cohesion.
The Europe 2020 Strategy is a long-term orientation of the European Union countries and regions towards smart, sustainable, and inclusive growth. Moreover, the European Commission indicated that the above-mentioned objectives should be measurable and reflect the diversity of the Member States and also be based on the sufficiently reliable data allowing long-term observation, comparative analysis, and evaluation. On the basis of these requirements, the targets related to five areas were defined, which were assigned the appropriate monitoring indicators (see Table 1).
The objectives identified in the Europe 2020 Strategy remain correlated. Achieving the targets in the area of education, including a higher level of education, does increase the chances (especially of the youth) on the labour market, and along with the growth in the employment rate of the population aged 20–64, contributes towards reducing the level of poverty and social exclusion. On the other hand, greater opportunities (primarily the financial ones) for conducting research and development as well as the innovation activities in all sectors of the economy create important conditions for the increased competitiveness of the individual European Union countries and facilitate opening new jobs. In turn, ecological projects, such as low-carbon technologies, renewable energy sources, and increased energy efficiency, improve the condition of the natural environment, increase the effectiveness of counteracting climate change, and strengthen the potential in terms of entrepreneurship and employment [4].
Taking into account the fact that each of the European Union Member States is different regarding the attained level of socio-economic development and the specificity of internal development conditions, the European Commission decided to refrain from “measuring all of them with one measure alone”. In addition to the goals of the Europe 2020 Strategy for the entire European Union, the individual Member States, within the framework of their national reform programs, presented their own target levels of indicators for achieving the objectives of the Europe 2020 Strategy.

1.2. The Purpose of the Paper

Both the European Union as a whole and each of the analysed Member States implement the priorities and objectives of the Europe 2020 Strategy to a varying extent. Presenting this issue indicates the need to apply different research approaches. This is also confirmed by the literature studies (see Section 1.3). In this regard, it is possible to distinguish the three following methodological approaches:
  • aggregate approach showing the aggregate level of achieving either all or the area-specific indicators by the individual countries. This approach allows presenting the ranking of the analysed countries based on the aggregate measure value of all the indicators (diagnostic features) illustrating the implementation level of the individual priorities as well as the EU and national targets of the Europe 2020 Strategy. This approach is presented in the studies by, e.g., [5,6,7,8,9,10,11,12,13,14,15];
  • aggregate approach taking into account the EU-level targets, in which national values of the individual monitoring indicators are referred to their target values defined for the European Union (EU-level targets 2020). Following this approach, achieving more favourable monitoring indicators by a given country than the EU-level targets 2020 is not included in the analysis (values that are more favourable for the national monitoring indicators are replaced with their target values set out for the entire European Union). Such an approach was presented, e.g., in the study by Becker et al. [16];
  • aggregate approach taking into account the national-level targets, in which national values of individual monitoring indicators are referred to their target values defined for a given country for 2020. In this approach, achieving more favourable values of the monitoring indicators by a given country than the target values adopted in a given country is not considered in the analysis (values more favourable for the national monitoring indicators are replaced with their target values defined for an individual country—national-level targets 2020). Such an approach was presented, e.g., in the study by Becker et al. [16] where only the level of meeting the target monitoring indicators defined by the individual EU Member States was analysed. A different approach is possible here, following which the countries are arranged based on the implementation level of individual monitoring indicators in the analysed period, and the level of meeting the target monitoring indicators defined by the individual EU countries is presented.
The aggregate approach takes into account the possibility of accumulating the range of positive and negative deviations from the target values of individual indicators. Hence, the countries in which, e.g., several indicators were clearly exceeded, and the majority were not achieved, can be identified as the countries characterised by the high achievement of the targets set out in the Europe 2020 Strategy. Therefore, the weakness of this approach is reflected in its compensatory nature. The aggregate approaches considering the EU-level targets and the national-level targets significantly reduce the compensation characteristic for the aggregate approach. Due to the fact that the EU-level targets approach does not take into account national priorities, and the national-level targets approach the EU priorities of the Europe 2020 Strategy, they should be carried out jointly in one study. The study described in the presented article is an attempt to fill in a part of this gap.
The implementation of the identified priorities and the achievement of the set targets included in the Europe 2020 Strategy requires numerous activities performed both at the EU level and in the individual countries and regions. The assessment of the achievement level of the Europe 2020 Strategy targets, both at the level of the entire European Union (EU-level targets) and its individual Member States (national-level targets) remains the basic research purpose of the study. The conducted analyses applied the aggregate index proposed and constructed based on the dynamic relative taxonomy (Section 3 of the paper). The time range of the study covers the years 2010–2019, whereas the spatial scope includes 28 European Union countries and the average data for the European Union. The research includes Croatia, which joined the European Union in 2013, as well as Great Britain, which officially left the European Union at the end of January 2020.
One of the Europe 2020 Strategy topics is climate change and energy; hence this Strategy co-creates, i.e., the renewable energy development mechanisms. Our findings are relevant to the aims and the scope of the Energies Journal.

1.3. Literature Review

Most frequently, in assessing the implementation of the Europe 2020 Strategy the aggregate measures (composite indices) are used, on the basis of which the analysed objects can be ranked from “the best” to “the worst” according to a complex phenomenon that is not subject to direct measurement (the so-called latent variable—see [17]). Here, a complex phenomenon is the level of the Europe 2020 Strategy implementation, described using the set of preferential variables (in this case, it is 9 headline indicators). The function which aggregates partial information included in the individual variables is the tool for the linear ordering methods.
Linear ordering of objects based on aggregate measures is used in many research areas, such as innovation, competitiveness, well-being, social cohesion, sustainable development, poverty and social exclusion, social inclusion, customer satisfaction, air quality, quality of life.
The problems of constructing aggregate measures are addressed in, e.g., the following studies [18,19,20,21,22,23].
The application of aggregate measures in assessing the level of the Europe 2020 Strategy implementation is presented, i.e., in the studies by [5,6,7,8,9,10,11,12,13,14,15].
Pasimeni [5,6] proposed a synthetic composite index based on three thematic sub-indices. These sub-indices comprise the three dimensions of growth defined as the main pillars of the Europe 2020 Strategy, which are built on the eight official headline indicators representing economic, environmental, and social dimensions. The indicators are calculated at the national level and allow comparing the states with each other and over time. The composite measure is defined as the geometric average of three indices. The use of the geometric average was supposed to eliminate the heterogeneity that can be observed in the progress of indicator values. Each component is normalized within the [0, 1] closed interval creating the Smart Growth Index, the Sustainable Growth Index, and the Inclusive Growth Index for each country as the results of unweighted averages. This synthetic index is defined and referred to as the Europe 2020 Index.
The index developed by Pasimeni was used by Pasimeni and Pasimeni [9] in order to indicate which factors, economic or institutional ones, are more likely to determine success or failure in the Europe 2020 Strategy. The analysis confirmed the key importance of formal and informal institutions compared with the other considered factors. Institutional variables turned out to be the most significant ones and had the strongest estimated effects. It is worth emphasizing that the findings did not prove that the economic growth factors (levels of GDP per capita, fiscal sustainability) are not the important objectives per se.
C¸olak and Ege [7] proposed a composite indicator methodology to observe how distant the states are from reaching the targets and growth priorities of the EU 2020 Strategy, making a distinction between the EU 15 and the new Member States as well. There are two main differences from Pasimeni [6] approach. The composite index was constructed by assigning different weights to each original indicator considering each target and priority.
The complex phenomenon of fulfilling the goals of the Europe 2020 Strategy was addressed by Balcerzak [8]. The performance of individual countries was assessed by the taxonomic dynamic analysis using the normalisation of variables with the zero unitarisation method. The normalisation of variables was based on the constant reference point for the whole analysed period, which provided the possibility of dynamic analysis and enabled comparing the values of the synthetic index for all the years.
Rappai [10] developed a complex (composite) indicator that also considers correlations and the heterogeneity of improvements within and between each category of goals and constitutes a valuable contribution to this field, measuring progress in a complex way, i.e., by taking the relationships and heterogeneity of goals across the EU Member States into account.
Fura, Wojnar, and Kasprzyk [11] created a synthetic indicator with a median to measure the level of the Europe 2020 Strategy implementation in the EU Member States. This positioning measure is particularly useful in situations where descriptive features of the phenomena are hugely diversified. In the next step, all the countries were ranked based on their level of implementation and further classified into four equally populated groups. The multidimensional approach and longitudinal perspective allow for comparisons across nations and over time.
The assessment of the progress being made by the EU Member States in meeting the Europe 2020 was performed by Stec and Grzebyk [12] who applied a synthetic measure in dynamic terms calculated as an arithmetic mean, based on the zero unitarization method. This allows an objective comparison of the EU Member States using 10 major statistical indicators.
Walheer [13] proposed the opposite approach—a decomposition of the composite index—arguing that relying only on the composite index can be easily confused. He proposed distinguishing between the three factors of the composite index: (1) a country-specific index showing how each country performs with respect to the best performer for each year, (2) a group-specific index that indicates how the group performs for every year, and (3) an objective-specific index which says if, in principle, the targets are accomplished for the given period. The author argues that the decomposition allows better quantifying, measuring, and monitoring the progress of the European countries towards the achievement of the Europe 2020 objectives.
Another approach to the analysis of the states’ progress towards the national EU 2020 Strategy targets is presented by Rogge [14]. The author used Van Puyenbroeck and Rogge’s [24] ‘indirect’ geometric Benefit-of-the-Doubt (BoD)-method to construct the geometric composite index with Benefit-of-the-Doubt weights as a measure of the Member State’s overall performance on the EU 2020 headline indicators. As the authors point out, it is a pragmatic tool for evaluating country performances, in particular, under the subsidiarity principle that the traditions and political instruments are still largely situated at the national level.
Becker et al. [16] adopted the composite indicator approach, which aggregates the distance of each country or region to the politically agreed targets. This enabled the assessment both in a synthetic, general dimension and in the detailed trends at national and regional levels, considering the degree of urbanisation and development. Two weighing schemes for the indicators were investigated including equal and unequal weights. Additionally, to analyse the uncertainty of the weighting, a sensitivity analysis was performed, investigating the choice of a weighting scenario across the indicators. The results show that the weighting does have a significant impact on the results, although the top and bottom-ranked countries remain fairly stable.
A dynamic approach based on the exploratory factor analysis and clustering technique was proposed by Landaluce-Calvo i Gozalo-Delgado [15]. It focuses on the construction of the composite (synthetic) indicators merging both the spatial and the time dimension of the data. The use of exploratory factor analysis enables a comparative trend analysis of several spatial units. The proposal includes both the composite indicators for each moment in time and the Global Dynamic Indicator for the entire period. It allowed the visualisation and measurement of the joint progress of the states, as well as their individual positions in the EU ranking separately for each of the selected years (trajectories).
The source literature includes not only scientific studies but also publications by the European Commission and the national statistical offices. The European Commission, Eurostat, or the European Committee of the Regions cover in their publications, among others, various aspects of the Europe 2020 Strategy implementation in the pan-European, national and regional dimensions (cf., i.e., [25,26]), and also the possibility of measuring the level of achieving the priorities and objectives of the Strategy (cf., i.e., [3,27]).

2. Variables, Data Availability and Target Levels

Not all the indicators presented in Table 1 can be directly applied in the dynamic multidimensional cross-country comparative analysis to measure the achievement level of the indicator targets in the Europe 2020 Strategy. This refers to four indicators: Greenhouse gas emissions (index 1990 = 100), Primary energy consumption (Million tonnes of oil equivalent), Final energy consumption (Million tonnes of oil equivalent), People at risk of poverty or social exclusion (Million people—compared with 2008).
The change in the greenhouse gas emission reduction indicator results directly from the decision of the European Parliament and the Council referring to the Effort Sharing Decision (ESD) setting out the annual greenhouse gas emission targets for the Member States in the period 2013–2020 [28]. These targets address the emissions from the majority of sectors not covered by the EU Emissions Trading System (EU ETS), such as transport, buildings, agriculture, and waste. Hence, in place of the Greenhouse gas emissions indicator (index 1990 = 100), the indicator of Greenhouse gas emissions in ESD sectors (Index 1990 = 100) was adopted to measure the achievement level of this thematic goal.
The indicators showing changes in energy efficiency (Primary energy consumption, Final energy consumption) are expressed in absolute units (Million tonnes of oil equivalent). In this form, they are incomparable between the individual EU countries due to their different size. In this case, the indexes of changes in primary and final energy consumption were used in comparing the status in 2005: Primary energy consumption (Index 2005 = 100), Final energy consumption (Index 2005 = 100).
The indicator presenting the risk of poverty and social exclusion also required adjustment. The assumptions for the monitoring of the Europe 2020 Strategy indicate that the measurement of this thematic goal will be based on the change in the number of people at risk of poverty and social exclusion (compared to 2008). However, taking into account the significant diversity of the European Union countries in terms of the population number and the population at risk of poverty and social exclusion, it was decided that the indicator “People at risk of poverty or social exclusion (% of the population)” will be an appropriate one.
Table 2 presents the variables and their preferences used to measure the achievement of the main goals included in the Europe 2020 Strategy.
It is worth emphasizing that each of the European Union Member States adopted the implementation of the target values for the individual indicators in the Europe 2020 Strategy.
Due to the absence of data for the EU-level 2020 target and national-level 2020 targets, the estimates were required for the x9 variable (see the last column of Table 3), performed based on the below formula:
P S E c = P 2008 , c R c P 2008 , c · PP 2008 , c ,
where:
P 2008 , c —people at risk of poverty or social exclusion in the 2008 year (Thousand persons),
R c —target reduction of people at risk of poverty or social exclusion in 2020 (Thousand persons),
P P 2008 , c —people at risk of poverty or social exclusion (% of population in 2008),
c = 1 , , 29 —EU and country number from Table 3.
In Formula (1), the reference point for Croatia was the year 2010. On the Eurostat website, the data for Croatia referring to the variable “People at risk of poverty or social exclusion” are available starting from 2010. Due to the absence of the data on R c   target reduction for Germany and Great Britain, the values of P S E c indicator, determined for the European Union ( E U = 19.62 ) , were adopted for these countries. The value of P S E c was adopted for Estonia, Slovakia, and Sweden, whereas for Finland and Croatia the value of R c was provided in the study [3]. In addition, the UK did not set out the targets for the other four indicators (x1, x2, x7, x8 in Table 3). Hence, the target values defined for the year 2020 for the European Union were adopted for this country.
Table 3 presents the target values of the indicators used in monitoring the goals of the Europe 2020 Strategy, both for the entire European Union and its individual Member States.
The target, national levels of indicators for achieving the Europe 2020 Strategy goals are significantly diversified, as they take into account social, economic, and environmental conditions specific to the individual European Union countries.
The study covered the years 2010–2019. The statistics were taken from Eurostat. The missing data refer to x3 variable for 2010 and x9 variable for 2019 for Great Britain alone. The research methodology proposed in point 3 of the study allows conducting the analysis taking into account the missing data (NA).

3. Constructing the Composite Index—Dynamic Relative Taxonomy

The relative taxonomy method in the classical approach was proposed by S. Wydymus [29], and its positional version was developed by J. Lira [30]. Both versions of the relative taxonomy method use the static approach despite applying it for the panel data. The relative taxonomy method applications in static terms are presented, i.e., in the following studies: Szopik-Depczyńska et al. [31], Ziolo et al. [32], Cheba [33].
The modification of relative taxonomy for the dynamic approach presented in the study by Walesiak and Dehnel [34] will be applied in the paper. In the static version (see [29,30]) the relativization in Formula (6) is performed separately for each period of the study t = 1 , , T . In the dynamic version, the relativization of the j-th variable value is carried out jointly based on the data matrix from T periods.
The relative taxonomy procedure in the dynamic version, after taking into account step 3 and the geometric mean in steps 6 and 7, takes the following form:
  • The observations of m variables for n analysed objects and T periods are combined into one data matrix:
    [ y i j t ] n · T × m = [ y 111 y 121 y 1 m 1 y n 11 y n 21 y n m 1 y 11 T y 12 T y 1 m T y n 1 T y n 2 T y n m T ] ,
    where: i = 1 , , n —object’s number ( n = 29 : data for the European Union and 28 European Union countries),
    • j = 1 , , m —variable’s number ( m = 9 : variables describing the targets of the Europe 2020 Strategy—see Table 2),
    • t = 1 , , T −1—period’s number (years 2010–2019),
    • T —year 2020 presenting the targets of the Europe 2020 Strategy: EU-level targets or national-level targets.
  • The identification of stimulants and destimulants in the set of variables. The term of a stimulant and destimulant was introduced by Hellwig [35]. Mazziotta and Pareto [19], instead of the term stimulant and destimulant, use the concept of ‘positive polarity’ (increasing values of the index correspond to the phenomenon improvement) and ‘negative polarity’ (increasing values of the index correspond to the phenomenon worsening). In turn, Hwang and Yoon [36] (p. 130) use the concepts of ‘benefit’ (the larger value of a variable, the greater preference) and ‘cost’ (the larger value of variable, the less the preference).
  • The observations on individual variables are replaced if the values of the variables in the data matrix (1) for t = 1 , , T 1 reach the EU-level target or the national-level target:
    x i j t = { y i j T for y i j t > y i j T y i j t for y i j t y i j T ,   for stimulants ,
    x i j t = { y i j T   for   y i j t < y i j T y i j t   for   y i j t y i j T ,   for destimulants ,
    where: y i j T —EU-level target 2020 or national-level target 2020.
    • For each variable, values higher than the Strategy goals (for stimulants) and lower than the Strategy goals (for destimulants) are replaced with the values of the Strategy goals (EU-level targets 2020 or national-level targets 2020, respectively). This operation can be called one-sided Winsorization of the data (see, e.g., [37]).
  • Destimulants ( D ) are replaced with stimulants using ratio transformation (see, e.g., [38] (p. 18):
    x i j t = ( x i j t D ) 1
  • The values of j-th variable are relativized according to the formula:
    [ x 1 j 1 x i j t , , x n j T x i j t ]   for   i = 1 , , n   and   t = 1 , , T
    thus obtaining, for j-th variable, the matrix of relativized values presenting n · T × n · T dimensions. As a result of relativization, the values of variables are dimensionless.
  • The average similarity of a given relativized observation against other relativized observations of the j-th variable is calculated using the geometric mean.
    [ z i j t ] = [ t = 1 T i = 1 n x 111 x i 1 t n · T t = 1 T i = 1 n x 1 m 1 x i m t n · T t = 1 T i = 1 n x n 1 T x i 1 t n · T t = 1 T i = 1 n x n m T x i m t n · T ]
    Matrix [ z i j t ] is equivalent to a normalised matrix in multivariate statistical analysis.
  • The values of S M i t aggregate measures are calculated:
    S M i t = j = 1 m 1 z i j t m
    The values of S M i t aggregate measure taking the form (8) can be higher or lower than 1. The lower the value of S M i t measure the better the position of i object against the other objects in the time interval from t = 1 to t = T . Contrary to the static approach, the dynamic approach not only shows the relationships between the objects in particular periods but also the changes which occurred in the level of the analysed phenomenon between the objects in the entire examined time interval. The dynamic version allows for missing data. This type of data ( N A ) is not included in the calculation process of S M i t aggregate measure.
Compared to many methods of linear ordering, the method of dynamic relative taxonomy has certain limitations:
it can only be used for the variables measured on the ratio scale (their possible values are included in the set of positive real numbers). Measurement scales can be divided into metric and non-metric ones [39]. Metric scales can be further subdivided into ratio and interval scales. Hence, it cannot be applied to the interval variables. This is not a serious limitation, as the ratio variables are by far the most common category of variables in the analysis of economic phenomena;
S M i t aggregate measures do not have an upper limit. This does not disqualify them.
The values of composite indices based on dynamic relative taxonomy not only show the relations between objects in particular periods but also the changes in the level of the phenomenon over the entire reference period. In other words, this approach is suitable for tracking changes from a cross-sectional and longitudinal perspective, offering the possibility of assessing the relations between objects in each studied period. Another important benefit of the proposed method is that it can be applied to the datasets containing NA values. Most methods of ordering objects based on aggregate measures are compensatory in nature. This problem was significantly reduced by taking into account the geometric mean in the construction of the aggregate measure (8). The aggregate approaches considering the EU-level targets and the national-level targets (see Section 1.2) additionally reduce the compensation characteristic for the aggregate approach.

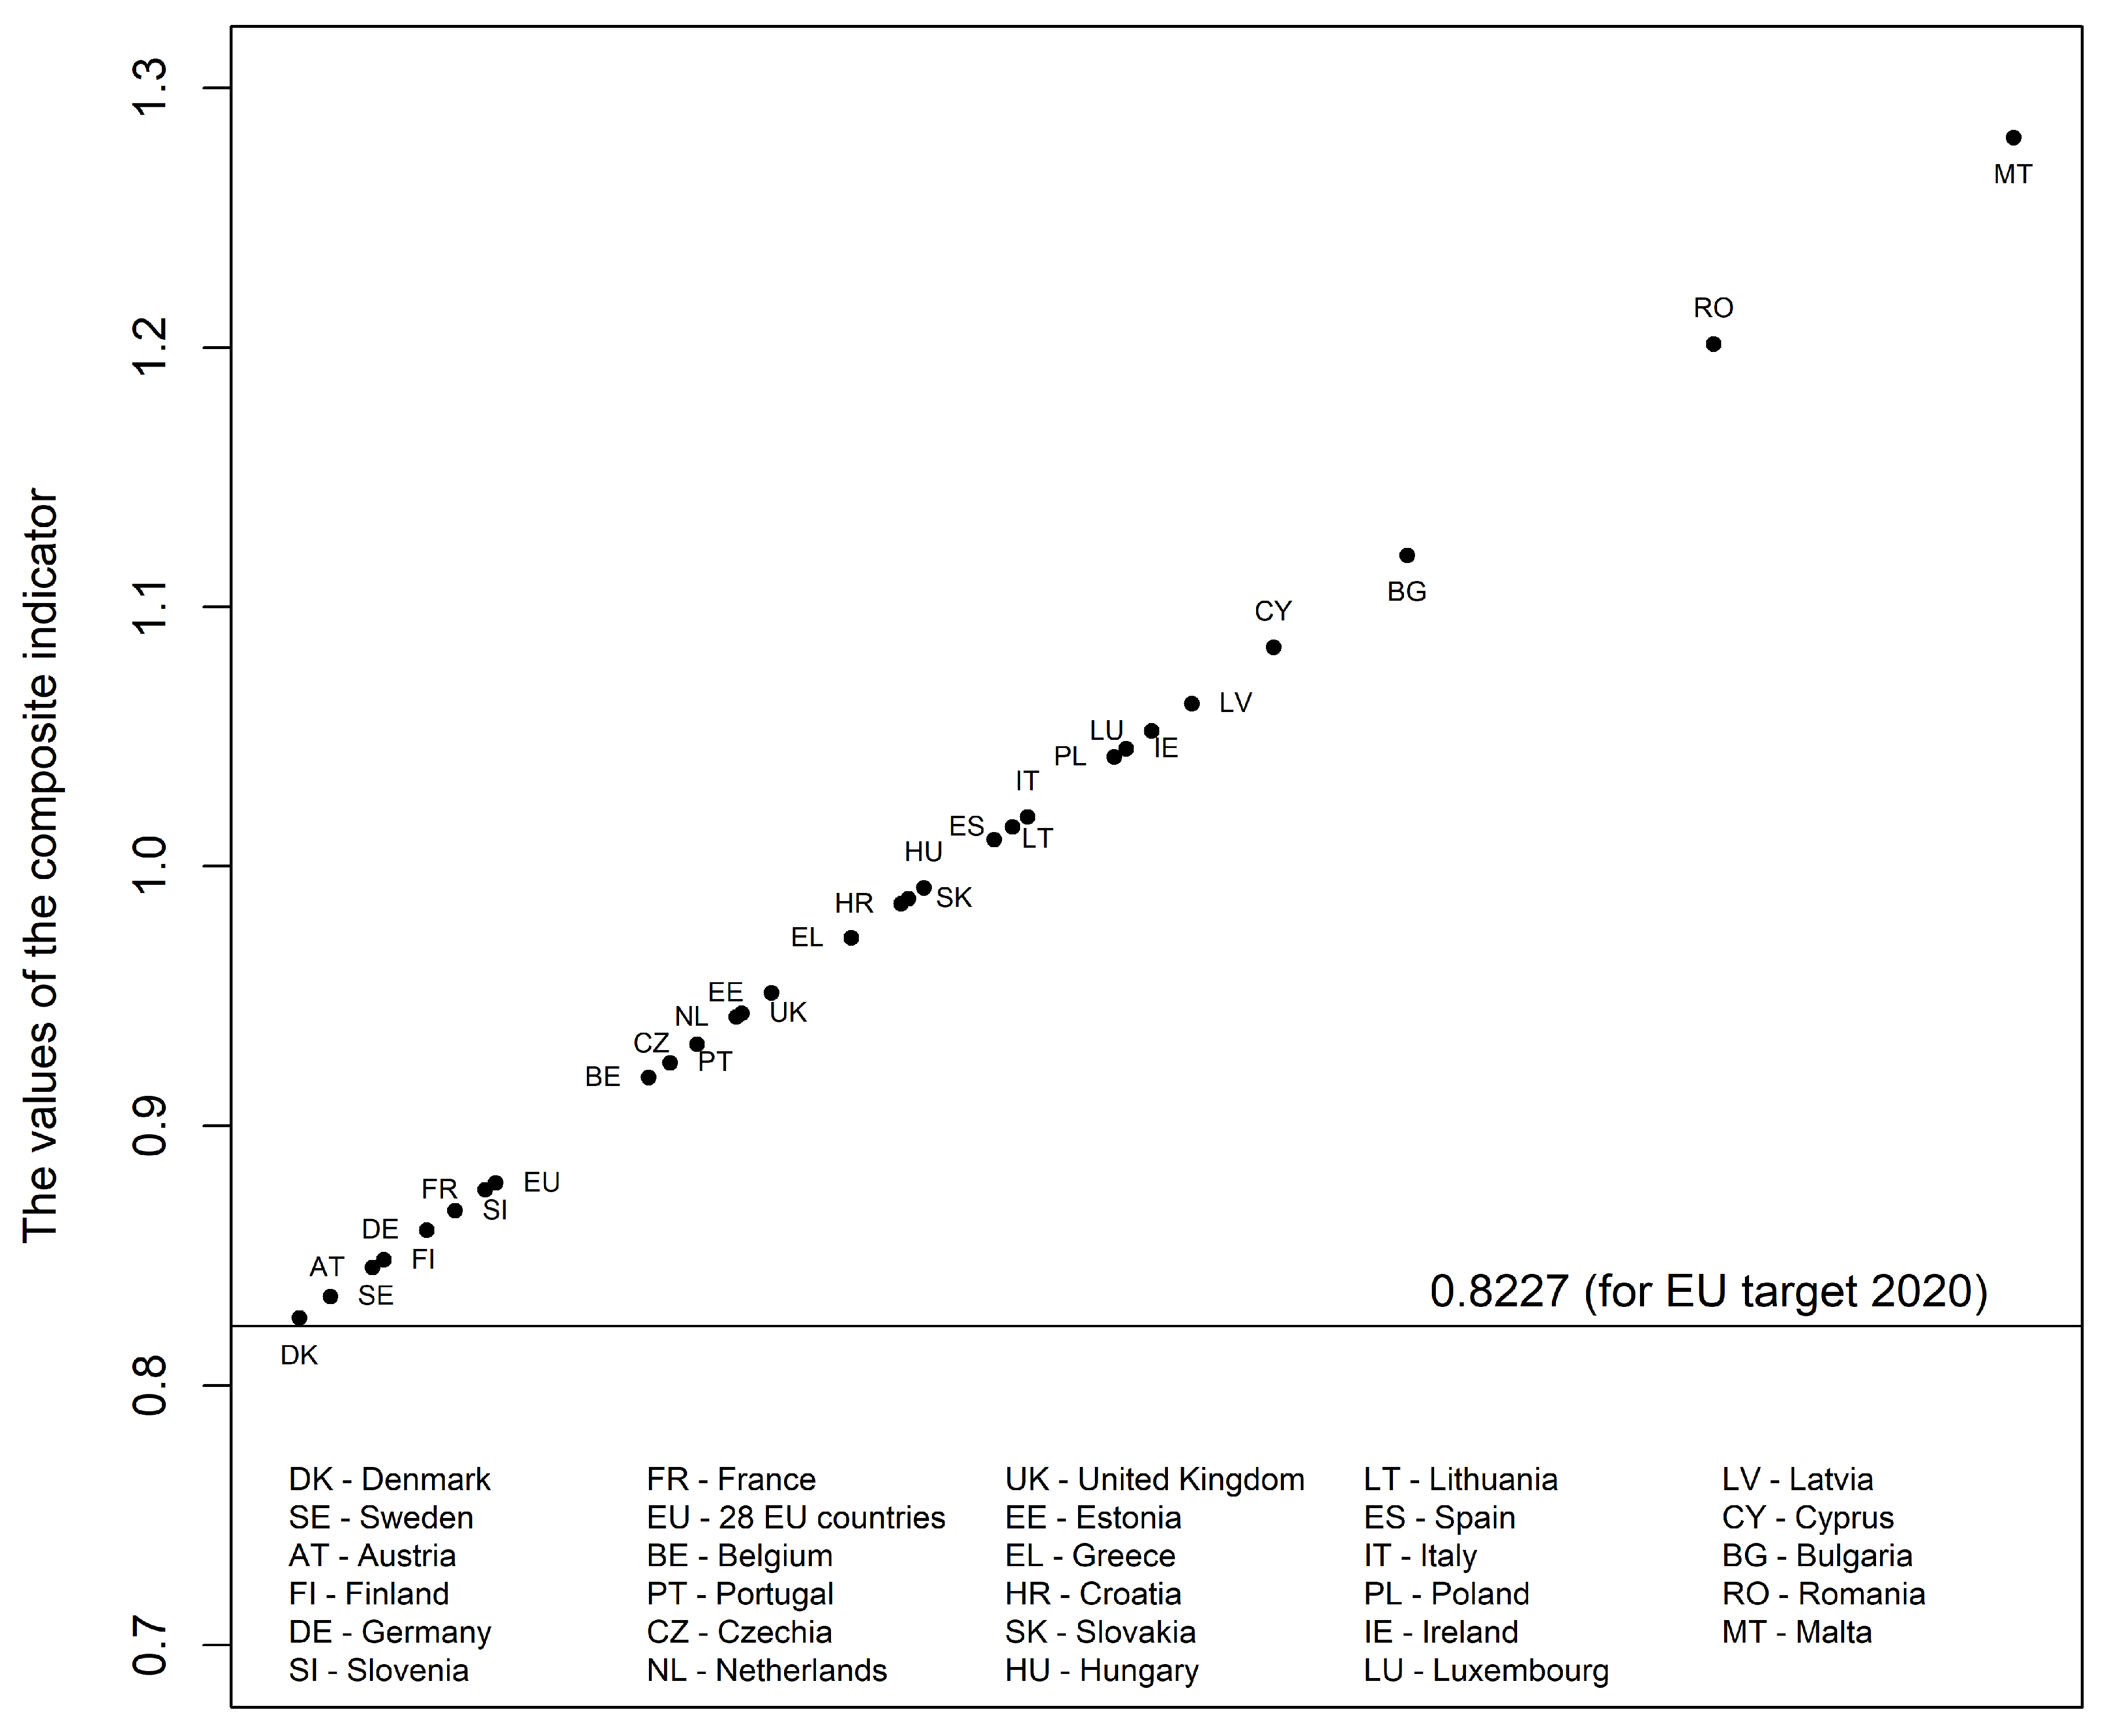
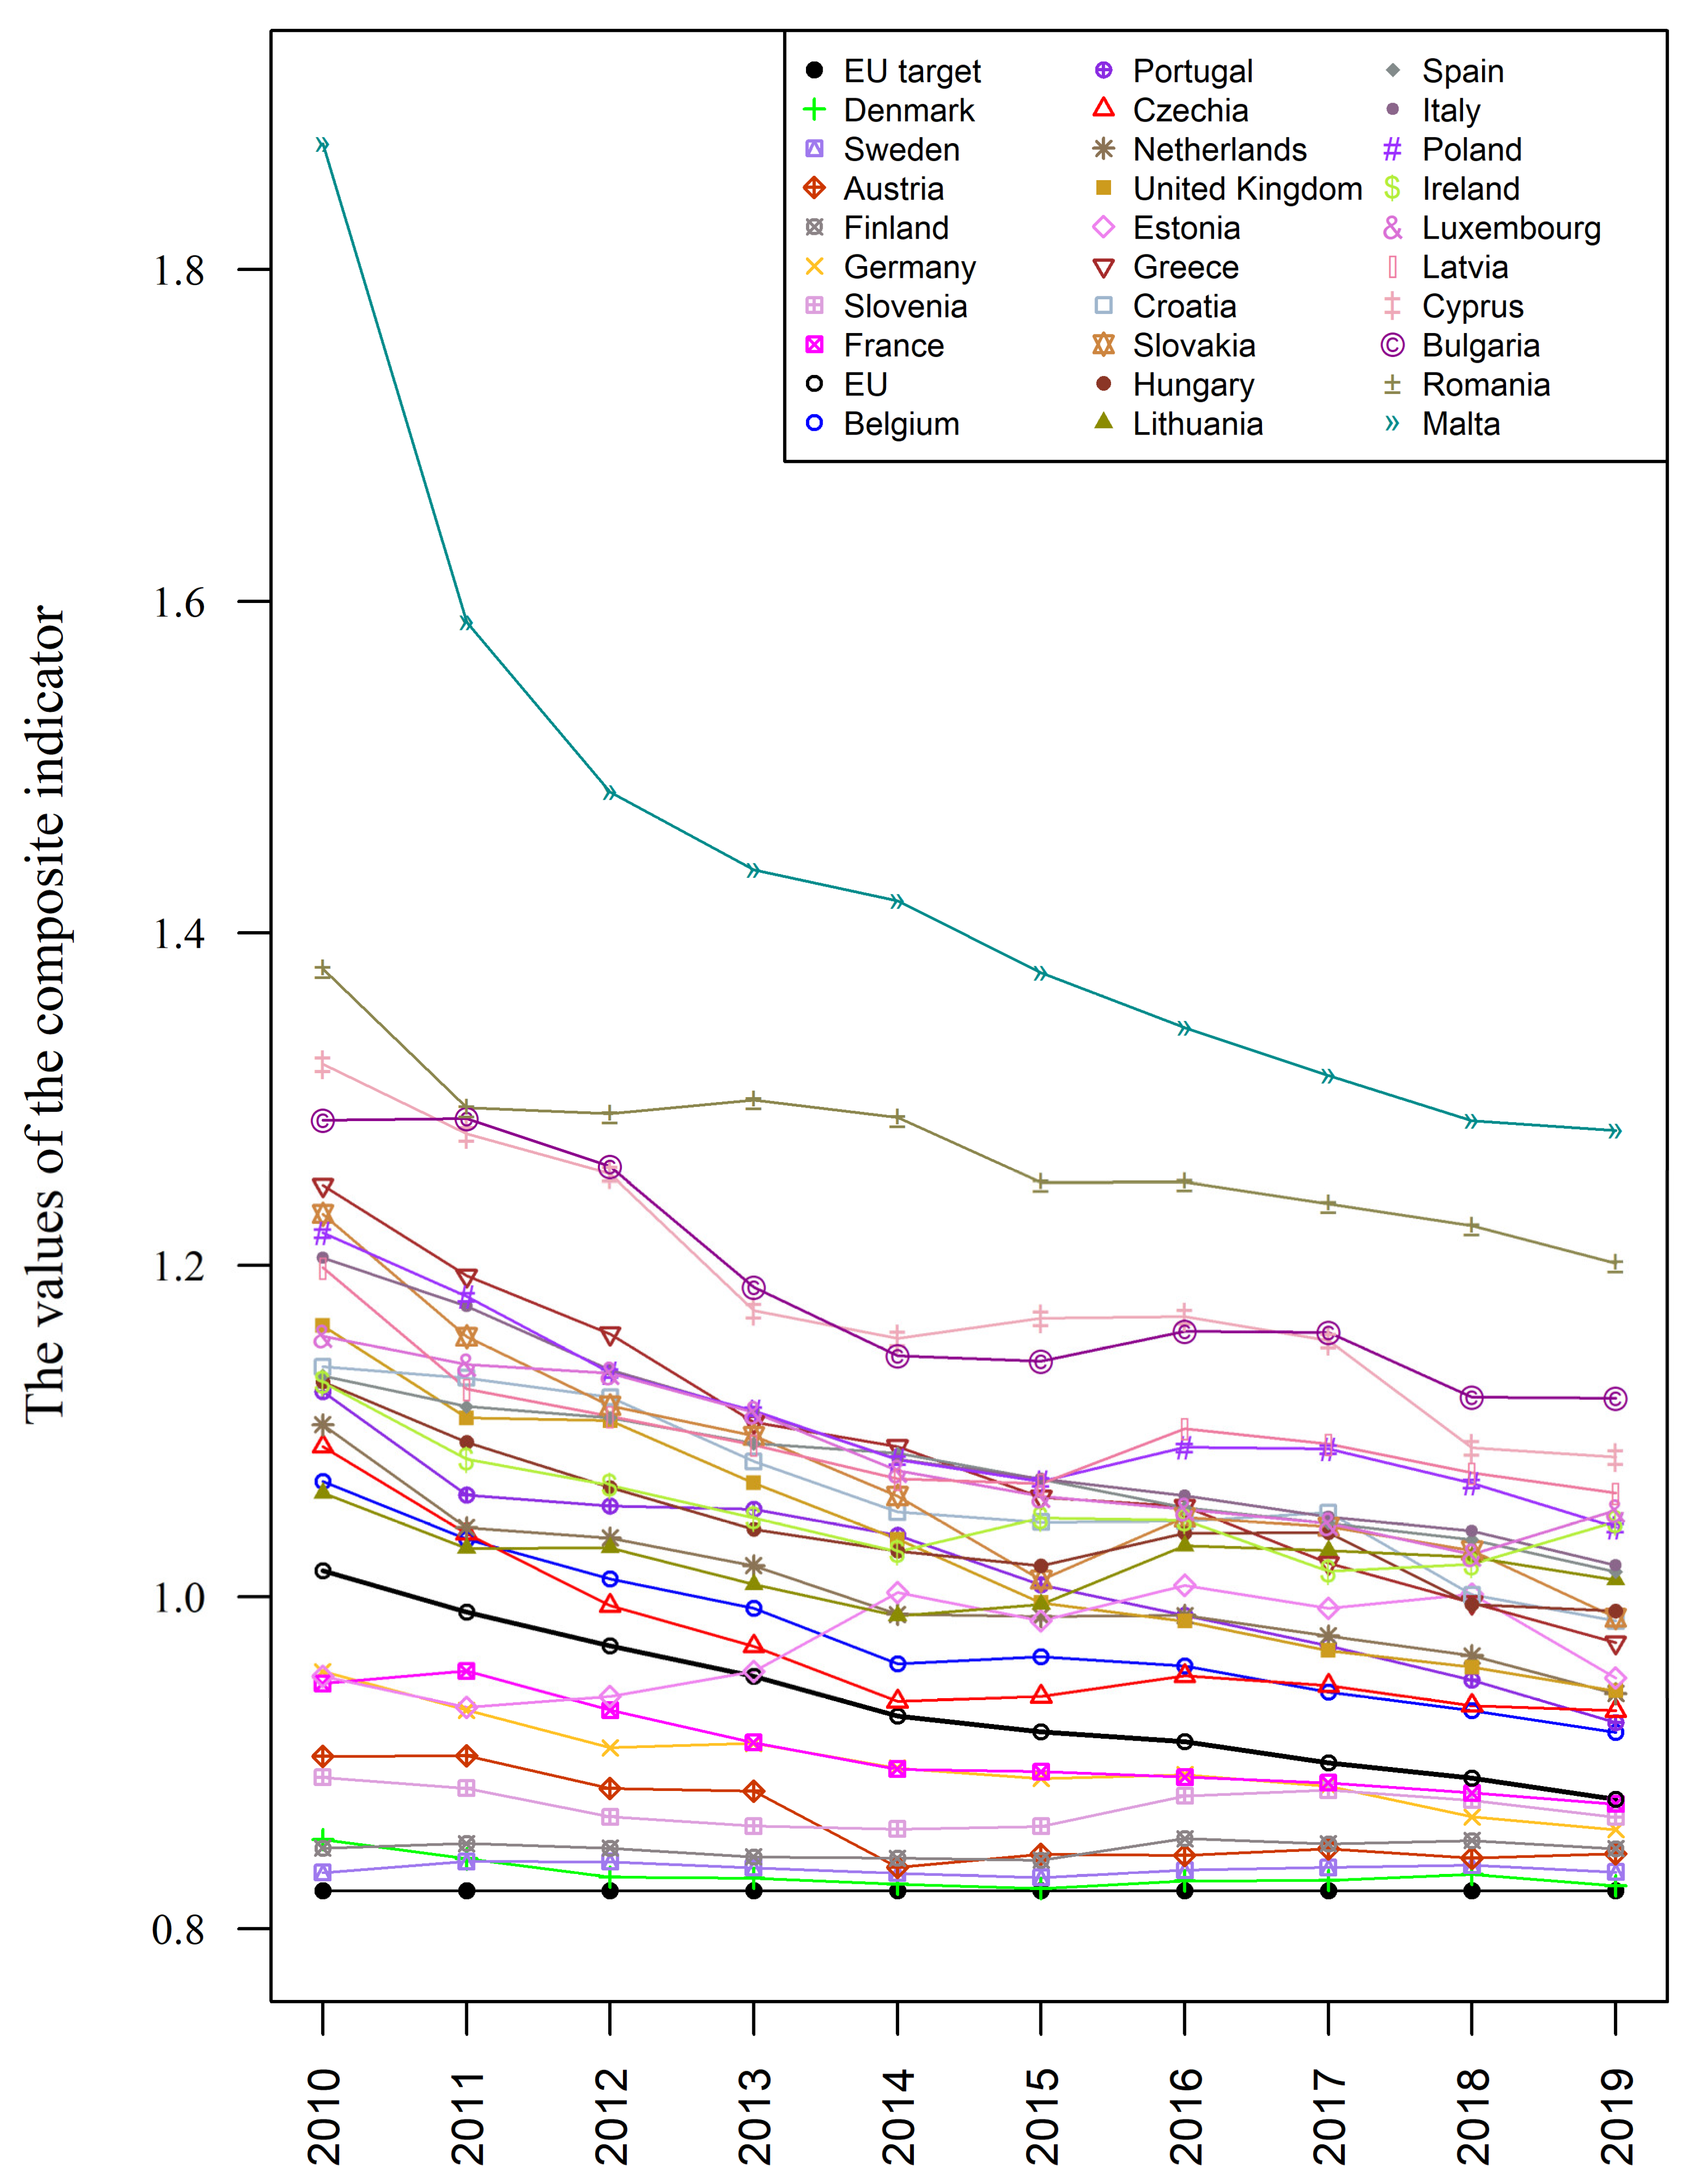
4. Results for the EU-Level Target Analysis

Table 4 presents the values of S M i t aggregate measure showing changes in the implementation level of the Europe 2020 Strategy for the EU-level target analysis in the years 2010–2019. The lower the value of S M i t measure, the better the position of i object against other objects in the individual analysed years and in the entire analysed period 2010–2019. The dynamic approach shows not only the relationships between the objects in particular periods but also the changes which took place in the level of the analysed phenomenon between the objects in the entire examined time interval.
The graphic presentation showing the ranking of 28 European Union countries regarding the level of the Europe 2020 Strategy implementation for the EU-level target analysis covering 2019 ( S M i t aggregate measure values) in the context of the object presenting the EU average and the object presenting the target values of the Europe 2020 Strategy (EU target 2020) is shown in Figure 1. None of the EU countries achieved the target values of the Europe 2020 Strategy (EU target 2020), although Denmark came the closest. The top seven included the Scandinavian countries, Austria, France, Slovenia, and Germany. Among these countries, Austria and Sweden achieved 7 EU targets each until 2019, Denmark and Finland 6 EU targets each, and France and Slovenia 5 EU targets each. Germany, ranked at the 5th position, achieved only 3 EU targets by 2019, however, the implementation of the remaining targets only slightly deviated from the established standards. Malta and Romania, placed at the bottom of the ranking, achieved only one EU target each by 2019. Lithuania, ranked as 19, is among the countries which achieved 5 EU targets by 2019. This was due to the values of variables significantly different from the EU target values of the variables in the following order: x6, x9, x3, and x2 (see the symbols in Table 2).
The graphic presentation (Figure 2) showing changes in the implementation level of the Europe 2020 Strategy for the EU-level target analysis, in the years 2010–2019, is presented in the form of line charts for the 28 European Union countries in the context of the object presenting the EU average and the object presenting the target values of the Europe 2020 Strategy (EU target 2020).
Throughout the entire analysed period, a systematic decrease in both the mean value of the aggregate measure and its differentiation can be observed (see Table 4, Figure 2). This proves that, firstly, a systematic improvement in the implementation level of the Europe 2020 Strategy can be observed. Secondly, the differences between the European Union countries are decreasing (standard deviation values in Table 4).
The highest improvement in the value of the composite indicator in the years 2010–2019 was recorded by Malta ranked at the last position. Greece moved up significantly from the end of the list in 2010 to the middle of the ranking in 2019. Regarding the top seven countries, Germany and France recorded a significant improvement in the period 2010–2019. The most turbulent development was observed in the years 2010–2019 in Estonia for which, de facto, the aggregate measure value in 2019 did not change.

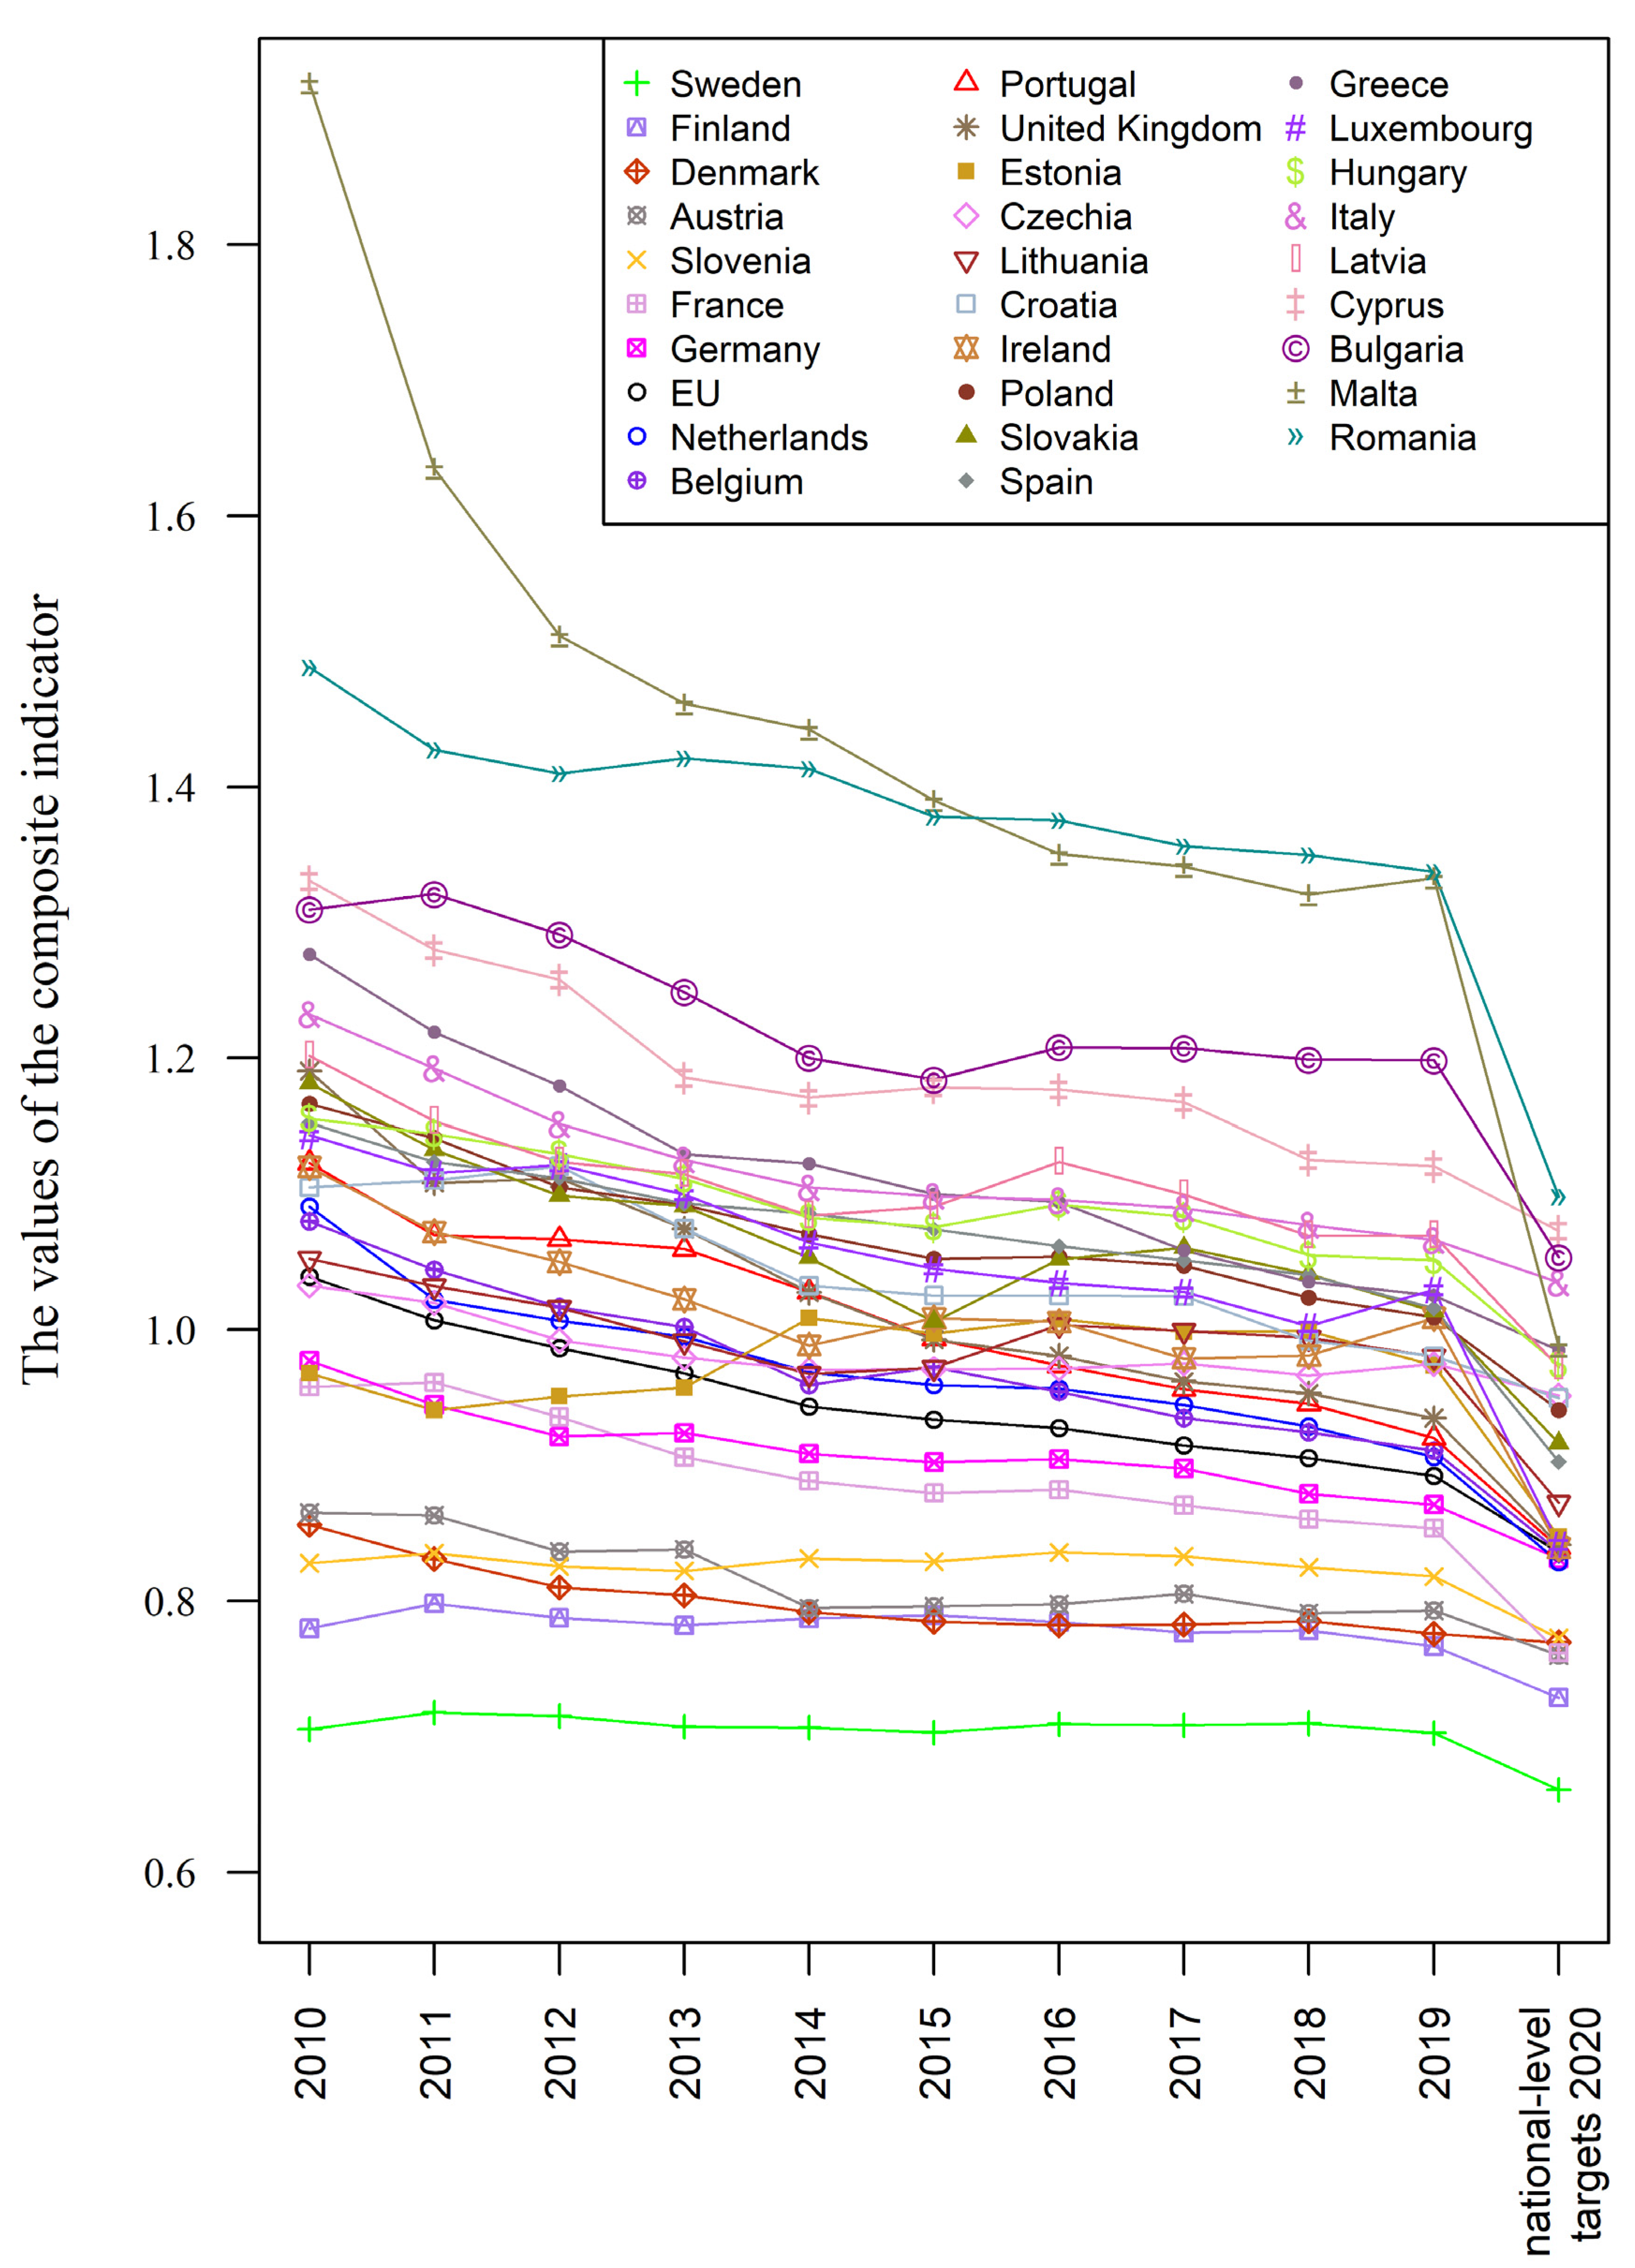
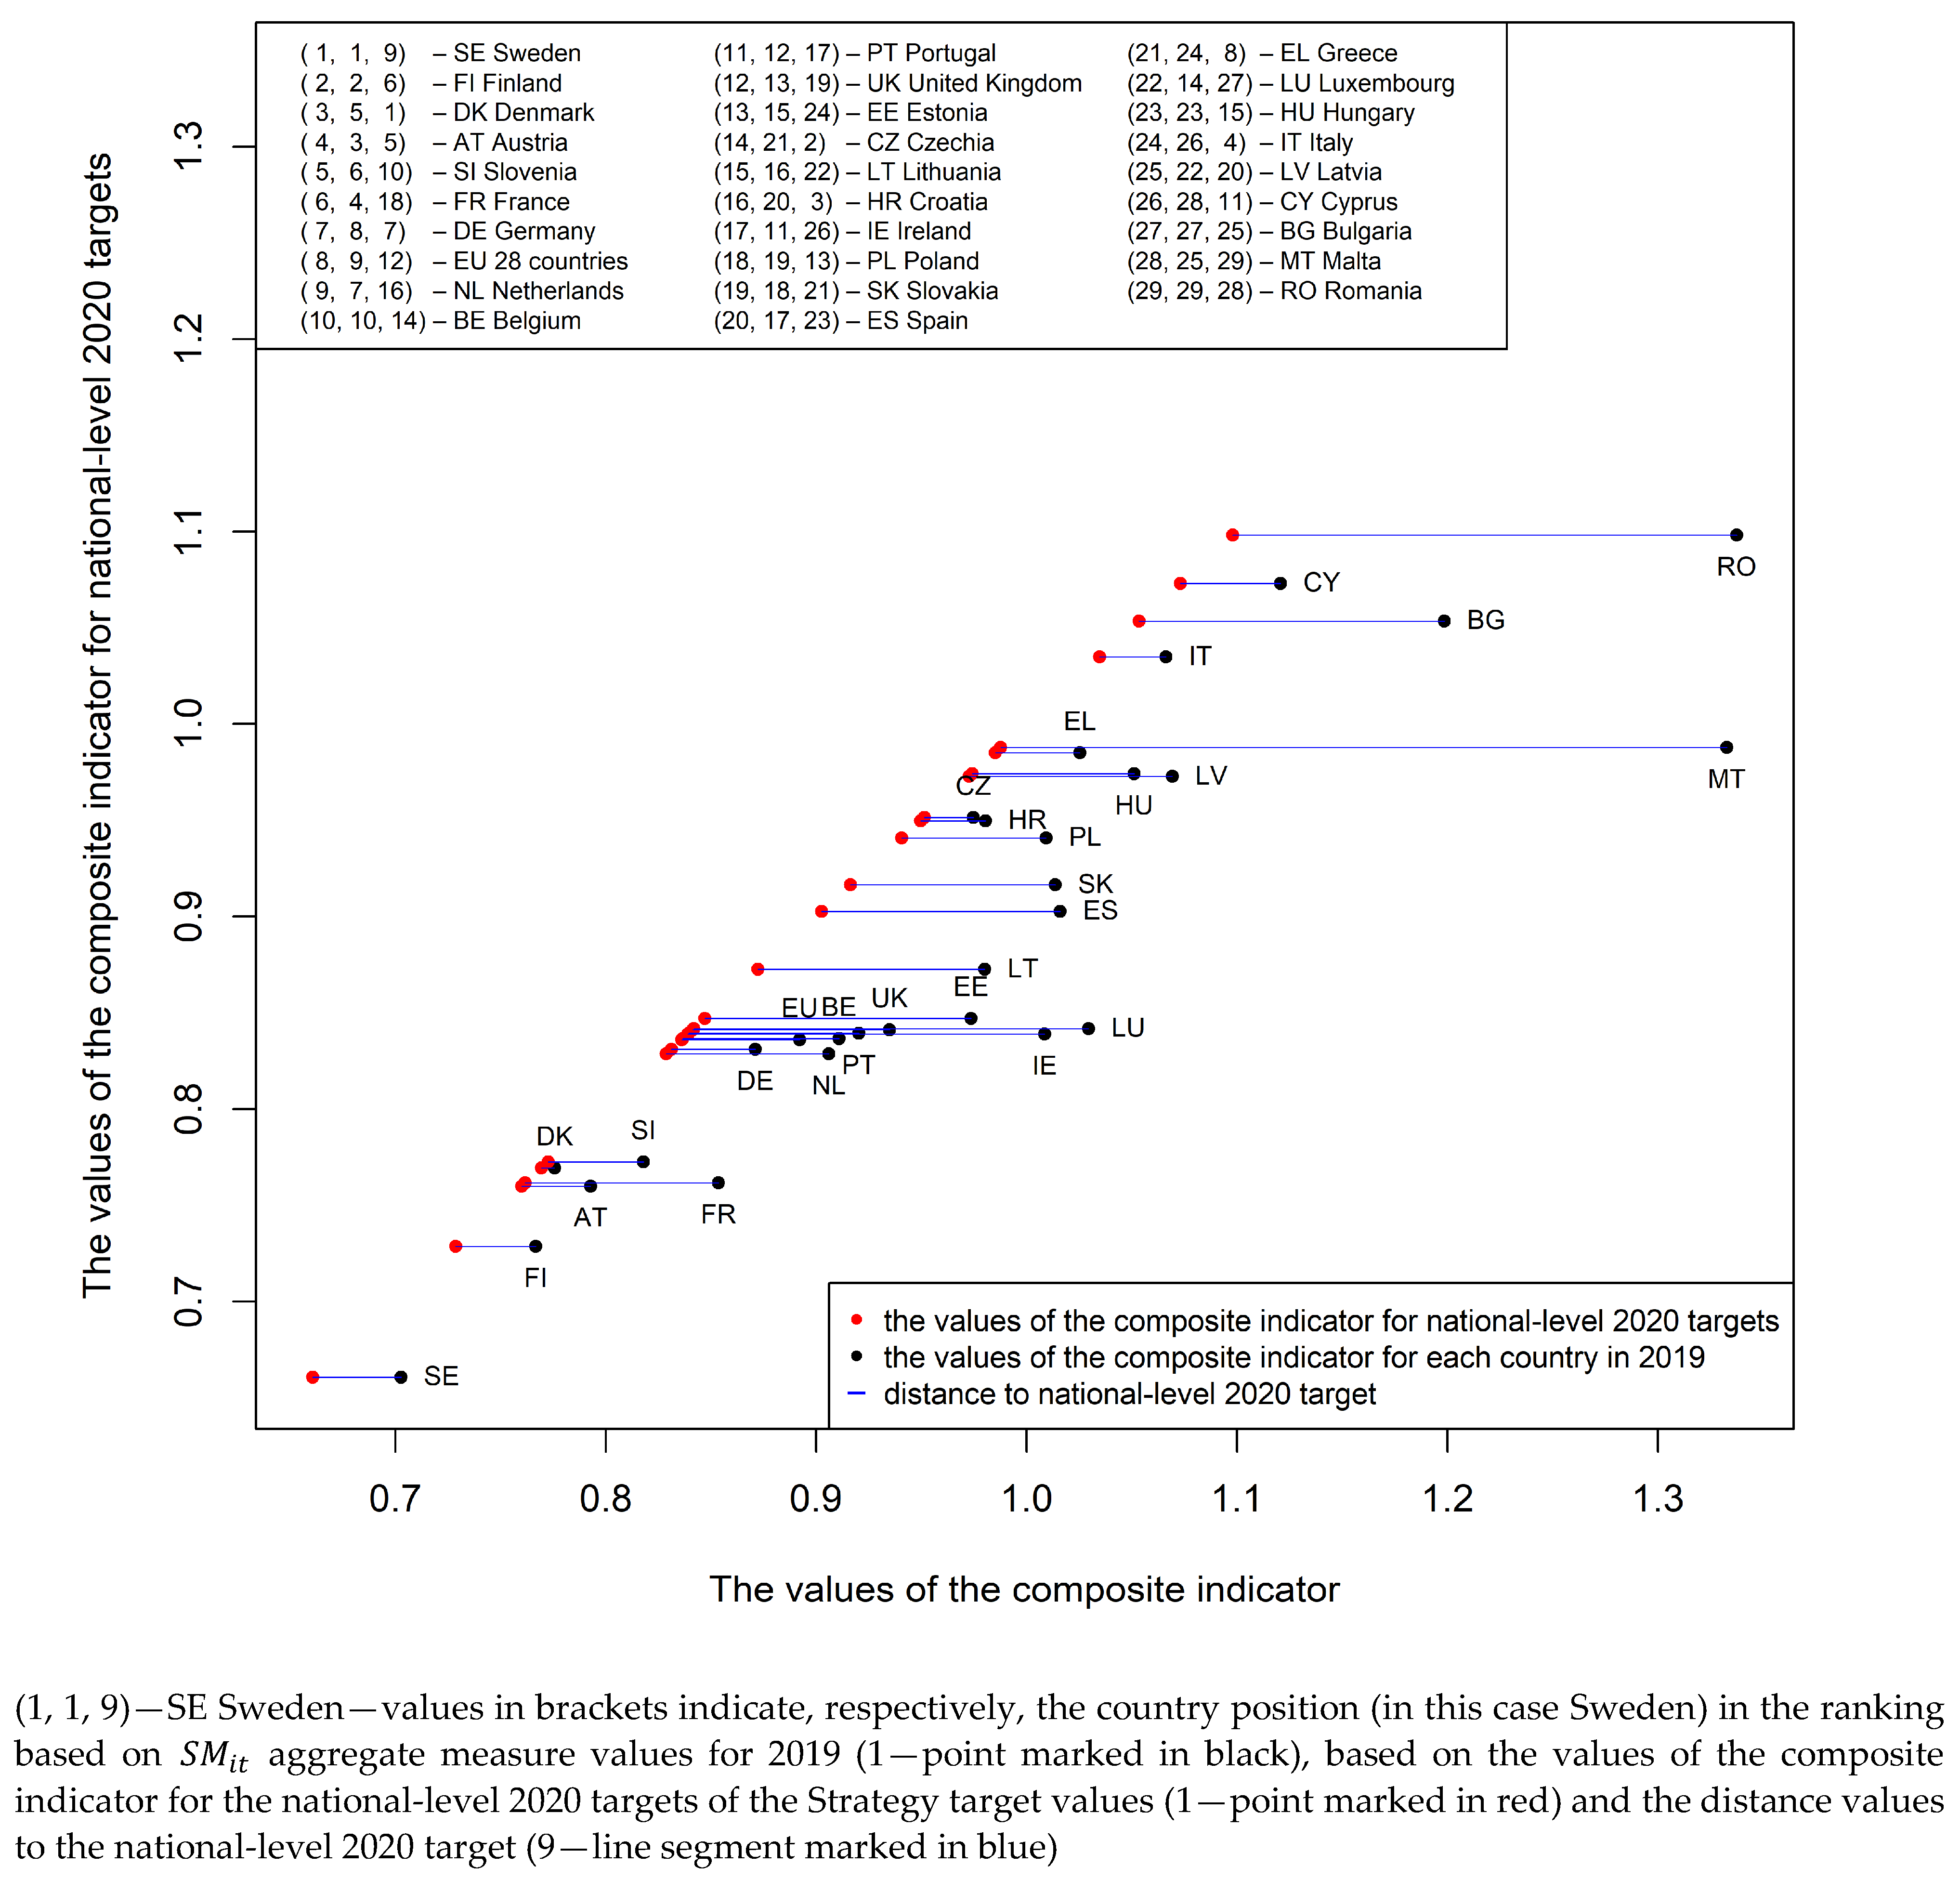
5. Results for the National-Level Target Analysis

Table 5 presents the values of S M i t aggregate measure showing changes in the implementation level of the Europe 2020 Strategy for the national-level target analysis in the years 2010–2019.
Figure 3 shows the graphic presentation of the ranking including 28 European Union countries regarding the level of the Europe 2020 Strategy implementation for the national-level target analysis covering 2019 ( S M i t aggregate measure values—points marked in black) in the context of the object (points marked in red) presenting the aggregate measure values of the Europe 2020 Strategy for the national-level 2020 targets.
The points marked in red, presented on the main diagonal in Figure 3, show the target values of the monitoring indicators for the individual EU countries. The points located lower refer to the countries which set out the target values of individual monitoring indicators at a higher level (Sweden, Finland, Austria, France, respectively). In turn, the points located higher refer to the countries which defined the target values of individual monitoring indicators at a lower level (Romania, Cyprus, Bulgaria, Italy, respectively).
Some countries, which adopted the prudential level of monitoring indicators show higher levels of the target values achievement. The prudential level of monitoring indicators for such countries as Czechia (position 21), Croatia (position 20), Italy (position 26), Greece (position 24), Cyprus (position 28) results in a higher level of the target values implementation (Czechia—position 2, Croatia—position 3, Italy—position 4, Greece—position 8, Cyprus—position 11). The prudential levels of monitoring indicators were also adopted by other countries (Romania—position 29, Bulgaria—position 27, Malta—position 25) and yet, in 2019, they were far from the target values in terms of the aggregate measure value (Romania—position 29, Bulgaria—position 25, Malta—position 28). Some countries adopted overly optimistic target values of monitoring indicators (France—position 4, Netherlands—position 7, Ireland—position 11, Luxembourg—position 14, Estonia—position 15) and, as a result, in relation to the level of their implementation in 2019 they were placed lower in the ranking (France—position 18, Netherlands—position 16, Ireland—position 26, Luxembourg—position 27, Estonia—position 24).
The graphic presentation (Figure 4) showing changes in the implementation level of the Europe 2020 Strategy for the national-level target analysis, in the years 2010–2019, is presented in the form of line charts for the 28 European Union countries in the context of the object presenting the EU average and the object presenting the national-level targets 2020 of the Europe 2020 Strategy.
Throughout the entire analysed period, a systematic decrease in both the mean value of the aggregate measure and its differentiation can be observed (see Table 5, Figure 4). This proves that, firstly, a systematic improvement in the implementation level of the national values included in the Europe 2020 Strategy can be observed. Secondly, the differences between the European Union countries are decreasing (standard deviation values in Table 5).

6. Discussion and Conclusions

Since 2010, the European Union countries have been implementing the objectives of the Europe 2020 Strategy aimed at smart, sustainable, and inclusive growth. The assessment of the implementation level of this Strategy is most frequently based on using aggregate measures (composite indices), which allows ranking the European Union countries according to the level of a complex phenomenon—in this case, the implementation level of the objectives of the Europe 2020 Strategy described using a set of preferential variables (nine indicators were formulated in the Strategy).
Three methodological approaches were identified, namely: aggregate approach indicating the summary achievement level of all the indicators by the individual countries, the EU-level targets approach, following which the national values of individual monitoring indicators are referred to their target values specified for the European Union (EU-level targets 2020) and the national-level targets approach, in which the national values of individual monitoring indicators are compared to their target values defined for a given country for 2020. Each of the above-mentioned research approaches presents both strengths and weaknesses. Nevertheless, each of them shows a significant practical utility in shaping and implementing the strategic development goals of the individual countries and the European Union as a whole.
Assessing the achievement level of the Europe 2020 Strategy targets, both at the level of the entire European Union (EU-level targets approach) as well as its individual countries (national-level targets approach) has been the primary research purpose of the study. The application of the methodology of dynamic relative taxonomy confirmed its practical usefulness and allowed for the realization of the purpose of the study. The conducted research applied the aggregate index proposed and constructed based on the dynamic relative taxonomy (Section 3 of the paper), which was used to show the different distances of the individual European Union countries in relation to both the EU-level targets and national-level targets in the Europe 2020 Strategy.
In the years 2010–2019, a systematic improvement in the implementation of both the EU and the national targets set out in the Europe 2020 Strategy was recorded. The differences in the achievement level of the Europe 2020 Strategy targets were visible, however, the distance in this respect between the European Union countries was decreasing. It should also be highlighted that none of the EU countries achieved the target values of the Strategy defined for 2020.
The highest level of the Strategy implementation regarding the EU level targets approach was observed for the Scandinavian countries as well as Austria, Germany, Slovenia, and France (they achieved higher levels than the EU). The achievement level of the strategic targets defined at the national levels (national-level targets approach) was significantly influenced by the approach of individual countries in determining the target values of the Strategy indicators. The countries (Czechia, Croatia, Italy, Greece, Cyprus) which were prudential in defining their target levels of monitoring indicators showed, in practice, higher levels of meeting them, whereas the countries (France, Netherlands, Ireland, Luxembourg, Estonia) which set out overly optimistic targets for the particular monitoring indicators recorded lower levels of meeting them.
The application of the Kendall’s tau correlation coefficient allowed assessing the compatibility of the rankings prepared according to the implementation level of the Europe 2020 Strategy for the EU-level target analysis (Section 4) and for the national-level target analysis covering 2019 (Section 5). The value of Kendall’s tau correlation coefficient amounts to 0.8424. This, generally, indicates that the two rankings of the EU countries are highly compatible. The countries such as Greece (drop by six places compared to the ranking of the EU-level target analysis for 2019) lost the most in the ranking regarding the implementation level of the Europe 2020 Strategy in relation to the national-level target analysis for 2019 because of their prudential approach to the monitoring indicators, Hungary (drop by five places), Czechia (drop by three places), Italy (drop by three places), Denmark (loss of the leading position—drop by two places). These countries which adopted the prudential approach to monitoring indicators in the Europe 2020 Strategy and, simultaneously, achieved higher values of these indicators found themselves in a disadvantaged position. In turn, the countries which adopted the optimistic target values of individual monitoring indicators (Ireland—up by six places; Lithuania and Poland—up by four places, Sweden—up to the clear leader of the ranking) were at an advantaged position.
The novelty of the study consists in identifying three research approaches in the assessment of the Europe 2020 Strategy as well as the implementation of two of them (the EU-level targets and the national-level targets). Moreover, an aggregate index constructed based on the dynamic relative taxonomy was proposed in the carried out research.
The conducted study has also its limitations. Due to the limited availability and comparability of the statistical data, not all the indicators of the Europe 2020 Strategy could have been used directly in the analysis. This problem has been presented in detail in Section 2 of the paper. The year 2020 has not been included in the study because the data for several variables have not yet been published by Eurostat. Another limitation of the conducted analysis is related to the applied method of dynamic relative taxonomy. In the construction of the aggregate measure in the form (8), equal weights were adopted for the individual variables. However, there were no substantive grounds for introducing the differentiated weights. The disadvantage of aggregate methods is their compensatory nature (the possibility of accumulating the range of positive and negative deviations from the target values of individual indicators). This problem was significantly reduced by including the geometric mean in the construction of the aggregate measure and by the operation called one-sided Winsorization of the data presented by Formulas (3) and (4).
In general, the presented and practically applied research approach allowed not only to assess the degree of achievement of the goals of the Europe 2020 Strategy but also to indicate, in each of the European Union countries, the areas requiring strengthening and dynamisation in the context of current and future challenges. In addition, the prudential or optimistic approach towards achieving the goals of the Europe 2020 Strategy reveals the prioritisation of the development goals of the individual European Union Member States in various social and economic areas, and thus also the contemporary orientation as well as challenges for the relevant national public policies. The scope of these public policies is quite wide and covers, i.e., innovation policy, employment and labour market policy, educational policy, many aspects of social policy, environmental policy, or energy policy. Hence, the practical usability of the conducted research and its results refer not only to the Europe 2020 Strategy but also to the national public policies and the strategic development programs to be created in the near and more distant future.

Author Contributions

Conceptualization, M.W. and M.O.; methodology, M.W. and G.D.; software, M.W., validation, M.W., M.O. and G.D.; formal analysis, M.W., M.O. and G.D.; investigation, M.W. and G.D.; resources, M.W. and M.O.; data curation, M.W. and M.O.; writing—original draft preparation, M.W., M.O. and G.D.; writing—review and editing, M.W., M.O. and G.D.; visualization, M.W.; supervision, M.W. All authors have read and agreed to the published version of the manuscript.

Funding

The project is financed by the Ministry of Science and Higher Education in Poland under the programme “Regional Initiative of Excellence” 2019–2022. Project number 015/RID/2018/19. Total funding amount 10 721 040.00 PLN.

Institutional Review Board Statement

Not applicable.

Informed Consent Statement

Not applicable.

Data Availability Statement

The authors have used publicly archived Eurostat dataset named Europe 2020 Headline Indicators. The dataset is available at https://ec.europa.eu/eurostat/web/europe-2020-indicators/europe-2020-strategy/main-tables (accessed on 13 August 2021).

Conflicts of Interest

The authors declare no conflict of interest.

References

  1. European Council Conclusions, EUCO 13/10, CO EUR 9, CONCL 2, 17 June 2010, Brussels, 2010. Available online: https://ec.europa.eu/eu2020/pdf/council_conclusion_17_june_en.pdf (accessed on 6 July 2021).
  2. Europe 2020: A Strategy for Smart. Sustainable and Inclusive Growth, European Commission; Publications Office of the European Union: Luxembourg, 2010; Available online: https://eur-lex.europa.eu/legal-content/EN/ALL/?uri=celex:52010DC2020 (accessed on 6 July 2021).
  3. Smarter. Greener. More Inclusive? Indicators to Support the Europe 2020 Strategy; Publications Office of the European Union: Luxembourg, 2019; Available online: https://ec.europa.eu/eurostat/web/products-statistical-books/-/KS-04-19-559 (accessed on 6 July 2021).
  4. Caldés, N.; Del Río, P.; Lechón, Y.; Gerbeti, A. Renewable Energy Cooperation in Europe: What Next? Drivers and Barriers to the Use of Cooperation Mechanisms. Energies 2019, 12, 70. [Google Scholar] [CrossRef] [Green Version]
  5. Pasimeni, P. Measuring Europe 2020: A new tool to assess the strategy. Int. J. Innov. Reg. Dev. 2012, 4, 365–385. [Google Scholar] [CrossRef] [Green Version]
  6. Pasimeni, P. The Europe 2020 Index. Soc. Indic. Res. 2013, 110, 613–635. [Google Scholar] [CrossRef]
  7. C¸olak, M.S.; Ege, A. An Assessment of the EU 2020 Strategy: Too Far to Reach? Soc. Indic. Res. 2013, 110, 659–680. [Google Scholar] [CrossRef]
  8. Balcerzak, A.P. Europe 2020 Strategy and structural diversity between old and new Member States. Application of zero unitarization method for dynamic analysis in the years 2004–2013. Econ. Sociol. 2015, 8, 190–210. [Google Scholar] [CrossRef] [PubMed]
  9. Pasimeni, F.; Pasimeni, P. An Institutional Analysis of the Europe 2020 Strategy. Soc. Indic. Res. 2016, 127, 1021–1038. [Google Scholar] [CrossRef]
  10. Rappai, R. Europe En Route to 2020: A New Way of Evaluating the Overall Fulfilment of the Europe 2020 Strategic Goals. Soc. Indic. Res. 2016, 129, 77–93. [Google Scholar] [CrossRef]
  11. Fura, B.; Wojnar, J.; Kasprzyk, B. Ranking and classification of the EU countries regarding their levels of implementation of the Europe 2020 Strategy. J. Clean. Prod. 2017, 165, 968–979. [Google Scholar] [CrossRef]
  12. Stec, M.; Grzebyk, M. The implementation of the Strategy Europe 2020 objectives in the European Union countries: The concept analysis and statistical evaluation. Qual. Quant. 2018, 52, 119–133. [Google Scholar] [CrossRef] [PubMed] [Green Version]
  13. Walheer, B. Decomposing the Europe 2020 index. Soc. Indic. Res. 2018, 140, 875–905. [Google Scholar] [CrossRef]
  14. Rogge, N. EU countries’ progress towards ‘Europe 2020 Strategy targets. J. Policy Model. 2019, 41, 255–272. [Google Scholar] [CrossRef]
  15. Landaluce-Calvo, M.I.; Gozalo-Delgado, M. Proposal for a Dynamic Composite Indicator: Application in a Comparative Analysis of Trends in the EU Member States Towards the Europe 2020 Strategy. Soc. Indic. Res. 2021, 154, 1031–1053. [Google Scholar] [CrossRef]
  16. Becker, W.; Norlen, H.; Dijkstra, L.; Athanasoglou, S. Wrapping up the Europe 2020 Strategy: A multidimensional indicator analysis. Environ. Sustain. Indic. 2020, 8, 100075. [Google Scholar] [CrossRef]
  17. Paruolo, P.; Saisana, M.; Saltelli, A. Ratings and rankings: Voodoo or science? J. R. Stat. Soc. Ser. A 2013, 176, 609–634. [Google Scholar] [CrossRef] [Green Version]
  18. Nardo, M.; Saisana, M.; Saltelli, A.; Tarantola, S.; Hoffman, A.; Giovannini, E. Handbook on Constructing Composite Indicators; OECD Publishing: Paris, France, 2005; Available online: http://ina.bnu.edu.cn/docs/20140604161231083481.pdf (accessed on 6 July 2021).
  19. Mazziotta, M.; Pareto, A. On a generalized non-compensatory composite index for measuring socio-economic phenomena. Soc. Indic. Res. 2016, 127, 983–1003. [Google Scholar] [CrossRef]
  20. Maggino, F. (Ed.) Complexity in Society: From Indicators Construction to Their Synthesis; Springer: Cham, Switzerland, 2017. [Google Scholar] [CrossRef]
  21. Becker, W.; Saisana, M.; Paruolo, P.; Vandecasteele, I. Weights and importance in composite indicators: Closing the gap. Ecol. Indic. 2017, 80, 12–22. [Google Scholar] [CrossRef]
  22. El Gibari, S.; Gómez, T.; Ruiz, F. Building composite indicators using multicriteria methods: A review. J. Bus. Econ. 2019, 89, 1–24. [Google Scholar] [CrossRef]
  23. Greco, S.; Ishizaka, A.; Tasiou, M.; Torrisi, G. On the Methodological Framework of Composite Indices: A Review of the Issues of Weighting, Aggregation, and Robustness. Soc. Indic. Res. 2019, 141, 61–94. [Google Scholar] [CrossRef] [Green Version]
  24. Van Puyenbroeck, T.; Rogge, N. Geometric mean quantity index numbers with benefit-of-the-doubt weights. Eur. J. Oper. Res. 2017, 256, 1004–1014. [Google Scholar] [CrossRef]
  25. Frazer, H.; Marlier, E. Assessment of Progress towards the Europe 2020 Social Inclusion Objectives: Main Findings and Suggestions on the Way Forward; Publications Office of the European Union: Luxembourg, 2014. [Google Scholar] [CrossRef]
  26. Assessment of the Europe 2020 Strategy; Joint Report of the Employment Committee (EMCO) and Social Protection Committee (SPC); Publications Office of the European Union: Luxembourg, 2019. [CrossRef]
  27. An Indicator for Measuring Regional Progress towards the Europe 2020 Targets; The Committee of the Regions, European Union: Brussels, Belgium, June 2014. [CrossRef]
  28. Decision No 406/2009/EC of the European Parliament and of the Council of 23 April 2009 on the Effort of Member States to Reduce Their Greenhouse Gas Emissions to Meet the Community’s Greenhouse Gas Emission Reduction Commitments up to 2020. Official Journal of the European Union L 140/136—5 June 2009. Available online: https://eur-lex.europa.eu/LexUriServ/LexUriServ.do?uri=OJ:L:2009:140:0136:0148:EN:PDF (accessed on 6 July 2021).
  29. Wydymus, S. Rozwój gospodarczy a poziom wynagrodzeń w krajach Unii Europejskiej—analiza taksonomiczna [Economic development and income level in the EU countries—taxonomic analysis]. Res. J. Univ. Szczec. 2013, 756, 631–645. Available online: https://wneiz.pl/nauka_wneiz/frfu/57-2013/FRFU-57-631.pdf (accessed on 6 July 2021).
  30. Lira, J. A comparison of the methods of relative taxonomy for the assessment of infrastructural development of counties in Wielkopolskie voivodship. Quant. Methods Econ. 2015, 16, 53–62. Available online: http://qme.sggw.pl/pdf/MIBE_T16_z2.pdf (accessed on 6 July 2021).
  31. Szopik-Depczyńska, K.; Cheba, K.; Bąk, I.; Kiba-Janiak, M.; Saniuk, S.; Dembińska, I.; Ioppolo, G. The application of relative taxonomy to the study of disproportions in the area of sustainable development of the European Union. Land Use Policy 2017, 68, 481–491. [Google Scholar] [CrossRef]
  32. Ziolo, M.; Filipiak, B.Z.; Bąk, I.; Cheba, K.; Tîrca, D.M.; Novo-Corti, I. Finance. sustainability and negative externalities. An overview of the European context. Sustainability 2019, 11, 4249. [Google Scholar] [CrossRef] [Green Version]
  33. Cheba, K. The applications of dynamic relative taxonomy methods to assess the effectiveness of transnational corporations’ strategies. Eur. J. Int. Manag. 2020, 4, 924–940. [Google Scholar] [CrossRef]
  34. Walesiak, M.; Dehnel, G. A dynamic approach to relative taxonomy in the assessment of changes in the social cohesion of Polish provinces in 2010–2018. Argum. Oeconomica. in press.
  35. Hellwig, Z. Procedure of Evaluating High-Level Manpower Data and Typology of Countries by Means of the Taxonomic Method. In Towards a system of Human Resources Indicators for Less Developed Countries; Gostkowski, Z., Ed.; Papers Prepared for UNESCO Research Project; Ossolineum, The Polish Academy of Sciences Press: Wrocław, Poland, 1972; pp. 115–134. [Google Scholar]
  36. Hwang, C.L.; Yoon, K. Multiple Attribute Decision Making—Methods and Applications. A State-of-the-Art Survey; Springer: New York, NY, USA, 1981. [Google Scholar] [CrossRef]
  37. Chambers, R.; Kokic, P.; Smith, P.; Cruddas, M. Winsorization for Identifying and Treating Outliers in Business Surveys. In Proceedings of the Second International Conference on Establishment Surveys (ICES II), Buffalo, NY, USA, 17–21 June 2000; pp. 717–726. Available online: https://www.researchgate.net/publication/307632859_Winsorization_for_Identifying_and_Treating_Outliers_in_Business_Surveys (accessed on 6 July 2021).
  38. Walesiak, M. Uogólniona Miara Odległości w Statystycznej Analizie Wielowymiarowej [The Generalized Distance Measure in Multivariate Statistical Analysis]; University of Economics in Wrocław Publishing House: Wrocław, Poland, 2002; Available online: http://keii.ue.wroc.pl/pracownicy/mw/2002_Walesiak_Uogolniona_miara_odleglosci_wyd_1.pdf (accessed on 6 July 2021).
  39. Stevens, S.S. On the theory of scales of measurement. Science 1946, 103, 677–680. [Google Scholar] [CrossRef] [PubMed]
  40. R Core Team. R: A Language and Environment for Statistical Computing; R Foundation for Statistical Computing: Vienna, Austria, 2021; Available online: https://www.R-project.org (accessed on 19 March 2021).
Figure 1. Ranking of the 28 European Union countries for 2019 based on the value of S M i t aggregate measure for the EU-level target analysis. Source: authors’ compilation.
Energies 14 04990 g001
Figure 2. Graphic presentation of the changes from 2010 to 2019 in the level of the EU Strategy implementation. based on S M i t composite indicator for the European Union countries. Source: authors’ compilation.
Energies 14 04990 g002
Figure 3. S M i t aggregate measure values for 2019 vs. aggregate measure values defined based on the national-level 2020 targets. Source: authors’ compilation.
Energies 14 04990 g003
Figure 4. Graphic presentation of the changes in S M i t aggregate value for the national-level target analysis, showing changes in the implementation of the EU Strategy from 2010 to 2019, for the European Union countries. Source: authors’ compilation.
Energies 14 04990 g004
Table 1. Targets, topics and indicators of the Europe 2020 Strategy.
TargetsTopicsHeadline IndicatorsEU Target 2020
Smart growthR&DGross domestic expenditure on R&D (% of GDP)3
EducationEarly leavers from education and training (% of population aged 18–24) < 10
Tertiary educational attainment (% of population aged 30–34) 40
Sustainable growthClimate change and EnergyGreenhouse gas emissions (index 1990 = 100)80
Share of renewable energy in gross final energy consumption (%)20
Primary energy consumption (Million tonnes of oil equivalent)1483
Final energy consumption (Million tonnes of oil equivalent)1086
Inclusive growthEmploymentEmployment rate age group 20–64, total (% of population)75
Poverty and social exclusionPeople at risk of poverty or social exclusion (Million people—compared with 2008)20
Source: authors’ compilation based on: [1] (Annex I, pp. 11–12), [2] (pp. 8–9), [3] (p. 9).
Table 2. The variables used in the assessment of the Europe 2020.
SymbolHeadline IndicatorsPreference
x1Employment rate age group 20–64, total (% of population)S
x2Gross domestic expenditure on R&D (% of GDP)S
x3Greenhouse gas emissions in ESD sectors (Index 1990 = 100)D
x4Share of renewable energy in gross final energy consumption (%)S
x5Primary energy consumption (Index 2005 = 100)D
x6Final energy consumption (Index 2005 = 100)D
x7Early leavers from education and training (% of population aged 18–24)D
x8Tertiary educational attainment (% of population aged 30–34)S
x9People at risk of poverty or social exclusion (% of population)D
S—stimulants (where higher values are more preferred), D—destimulants (where lower values are more preferred). Source: authors’ compilation.
Table 3. The EU-level and national-level 2020 targets.
No.CountryIndicator
x1x2x3x4x5x6x7x8x9
1EU75390.72086.1790.98104019.62
2Belgium73.23851384.7688.809.54717.20
3Bulgaria761.51201687.9384.81113641.40
4Czechia7511091393.1596.755.53214.32
5Denmark803803089.4692.90104015.90
6Germany773861886.0088.44104219.62
7Estonia76311125128.9797.569.54015.00
8Ireland692801692.9892.7886019.19
9Greece701.2961881.5587.54103223.95
10Spain742902088.0681.63154420.71
11France753862384.2882.069.55015.35
12Croatia62.91.411120121.9996.6943528.70
13Italy671.53871787.3790.37162621.78
14Cyprus750.5951388.7198.36104619.82
15Latvia731.511740120.27111.94103428.61
16Lithuania72.81.91152380.7592.0894923.01
17Luxembourg732.3801194.3493.75106614.21
18Hungary751.81101391.5076.84103423.66
19Malta7021051076.09108.70103318.47
20Netherlands802.5841486.5896.5484014.29
21Austria773.76843496.3090.099.53817.75
22Poland711.711415109.60122.414.54526.52
23Portugal752.71013190.5491.53104024.11
24Romania70211924119.25123.1711.32741.39
25Slovenia75310425100.6999.4254016.45
26Slovakia721.21131494.2077.8564017.20
27Finland7848438106.97105.8784214.72
28Sweden804834988.5991.1674514.00
29UK753841579.4784.46104019.62
Source: authors’ compilation.
Table 4. S M i t aggregate measure values for the EU-level target analysis, showing changes in the implementation of the EU Strategy from 2010 to 2019, and sorted by 2019 values.
i Country S M i t Aggregate   Measure   Values Δ
20102011201220132014201520162017201820192020 *
1Denmark0.85360.84210.83100.83030.82670.82410.82860.82910.83280.82580.8227−0.0279
2Sweden0.83370.84050.84040.83680.83350.83080.83520.83690.83820.83410.82270.0005
3Austria0.90380.90430.88460.88290.83700.84490.84430.84800.84250.84520.8227−0.0587
4Finland0.84850.85130.84860.84330.84250.84140.85430.85110.85310.84820.8227−0.0003
5Germany0.95490.93170.90900.91180.89680.89040.89270.88590.86750.85970.8227−0.0953
6Slovenia0.89110.88460.86740.86190.86010.86160.88000.88340.87740.86720.8227−0.0239
7France0.94780.95530.93170.91220.89600.89460.89140.88790.88190.87520.8227−0.0726
8EU1.01580.99090.97050.95220.92820.91870.91270.90000.89090.87790.8227−0.1379
9Belgium1.06951.03491.01100.99320.95980.96400.95830.94250.93160.91850.8227−0.1510
10Portugal1.12381.06141.05471.05281.03711.00730.98900.97050.94990.92420.8227−0.1996
11Czechia1.09071.03810.99470.97020.93700.93990.95240.94650.93460.93140.8227−0.1593
12Netherlands1.10381.04181.03551.01880.98950.98830.98890.97650.96450.94180.8227−0.1620
13UK1.16351.10791.10621.06881.03470.99650.98530.96760.95760.94330.8227−0.2202
14Estonia0.95210.93340.94010.95511.00270.98561.00710.99321.00170.95110.8227−0.0010
15Greece1.24801.19361.15861.10531.09061.06021.05461.02030.99650.97230.8227−0.2757
16Croatia1.13881.13211.12031.08171.05111.04501.04551.05091.00120.98550.8227−0.1533
17Slovakia1.23091.15681.11521.09701.06081.01041.04791.04221.02790.98750.8227−0.2434
18Hungary1.12951.09341.06591.04061.02771.01881.03831.03870.99530.99160.8227−0.1379
19Lithuania1.06261.02931.02961.00750.98870.99541.03091.02801.02401.01030.8227−0.0522
20Spain1.13331.11491.10791.09251.08651.07101.05401.04451.03441.01510.8227−0.1182
21Italy1.20451.17541.13691.11171.08321.07131.06101.04831.03961.01910.8227−0.1854
22Poland1.21971.18111.13521.11231.08281.06951.09041.08931.06871.04210.8227−0.1775
23Ireland1.12951.08301.06741.04771.02731.04751.04621.01551.01971.04530.8227−0.0842
24Luxembourg1.15721.14011.13511.11141.07611.06091.05301.04431.02551.05210.8227−0.1052
25Latvia1.19841.12541.10901.09171.07121.06821.10151.09221.07471.06270.8227−0.1357
26Cyprus1.32091.27911.25491.17251.15581.16811.16901.15471.09011.08440.8227−0.2366
27Bulgaria1.28711.28821.25941.18661.14551.14211.16001.15961.12051.11990.8227−0.1672
28Romania1.37851.29471.29101.29941.28881.24991.25011.23711.22371.20130.8227−0.1772
29Malta1.87591.58741.48501.43811.41951.37621.34301.31411.28701.28090.8227−0.5950
Parameters
mean281.12331.08221.06161.04051.02181.01161.01621.00710.99150.9798
sd280.20530.16230.14970.13690.13340.12490.12120.11680.10860.1079
*—aggregate measure values for the EU-level 2020 targets ( S M i 2020 ); Δ = S M i 2019 S M i 2010 ; mean28 and sd28—arithmetic mean and standard deviation for the 28 EU countries. Source: authors’ compilation using R package [40].
Table 5. S M i t aggregate measure values for the national-level target analysis, showing changes in the implementation of the EU 2020 Strategy from 2010 to 2019, and sorted by 2019 values.
i Country S M i t Aggregate   Measure   Values Δ Rank ( Δ )
20102011201220132014201520162017201820192020 *
1Sweden0.70550.71780.71520.70720.70660.70300.70920.70850.70970.70270.66070.04209
2Finland0.77980.79820.78750.78200.78700.78930.78430.77670.77820.76670.72870.03796
3Denmark0.85610.83090.81010.80430.79180.78500.78220.78260.78530.77580.76950.00631
4Austria0.86510.86310.83650.83810.79480.79620.79770.80520.79120.79290.76000.03285
5Slovenia0.82790.83530.82550.82220.83140.82910.83590.83290.82470.81800.77260.045510
6France0.95790.96110.93570.90610.88850.87960.88200.87060.86030.85360.76170.091918
7Germany0.97710.94480.92120.92390.90870.90230.90460.89760.87900.87110.83120.04007
8EU1.03931.00700.98630.96770.94330.93360.92760.91460.90540.89220.83610.056112
9Netherlands1.09081.02231.00670.99500.96880.95920.95670.94470.92870.90610.82880.077316
10Belgium1.08011.04441.01691.00210.95930.97250.95430.93500.92460.91100.83660.074414
11Portugal1.12301.06971.06671.05961.02790.99340.97350.95630.94530.92030.83950.080817
12UK1.19051.10841.11161.07441.02750.99270.98080.96190.95320.93490.84130.093619
13Estonia0.96800.94080.95100.95731.00870.99721.00770.99860.99940.97360.84720.126424
14Czechia1.03271.02000.99220.97940.97060.97100.97130.97540.96640.97480.95140.02342
15Lithuania1.05231.03211.01620.99140.96730.97201.00360.99920.99410.98020.87240.107822
16Croatia1.10501.11031.12061.07471.03251.02531.02521.02480.99200.98050.94960.03093
17Ireland1.12001.07211.04991.02250.98841.00851.00570.97880.98101.00870.83900.169726
18Poland1.16661.14141.10501.09191.07051.05241.05411.04721.02361.00930.94070.068513
19Slovakia1.18151.13261.09901.09111.05321.00591.05221.06051.04111.01370.91630.097421
20Spain1.15251.12371.11191.09311.08591.07431.06161.05121.04041.01600.90260.113423
21Greece1.27641.21921.17981.12951.12251.10001.09421.05861.03521.02530.98510.04028
22Luxembourg1.14341.11551.12141.09991.06431.04521.03461.02811.00291.02960.84190.187727
23Hungary1.15571.14441.12971.11121.08271.07581.09251.08341.05511.05120.97410.077015
24Italy1.23251.19261.15151.12551.10501.09861.09571.08981.07731.06621.03480.03144
25Latvia1.20181.15381.12361.11481.08421.09081.12391.09961.06931.06930.97270.096620
26Cyprus1.33071.27991.25801.18581.17101.17861.17701.16771.12551.12071.07310.047611
27Bulgaria1.30971.32111.29121.24881.20021.18421.20811.20751.19891.19851.05350.145025
28Malta1.91931.63491.51151.46151.44261.39001.35061.34151.32061.33290.98770.345229
29Romania1.48831.42731.40991.42121.41351.37801.37561.35631.35001.33761.09810.239528
Parameters
mean281.11481.07811.05661.03731.01721.00631.00770.99840.98480.9770
sd280.22820.18820.17520.16630.16230.15390.15210.14940.14470.1469
*—aggregate measure values for the national-level 2020 targets by country i ( S M i 2020 ); Δ = S M i 2019 S M i 2020 . Source: author’s compilation.
Publisher’s Note: MDPI stays neutral with regard to jurisdictional claims in published maps and institutional affiliations.

