Article

Influence of Different Sites on Impact Response of Steel-Plate Concrete Containment against a Large Commercial Aircraft

1
Faculty of Infrastructure Engineering, Dalian University of Technology, Dalian 116024, China
2
Nuclear and Radiation Safety Center, Ministry of Ecology and Environment, Beijing 100082, China
*
Author to whom correspondence should be addressed.
Energies 2021, 14(16), 4957; https://doi.org/10.3390/en14164957
Submission received: 9 June 2021 / Revised: 1 July 2021 / Accepted: 26 July 2021 / Published: 12 August 2021
(This article belongs to the Special Issue Design and Safety Issues of Nuclear Plants and Installations)

Abstract

:
This paper aimed at evaluating the influence of different site conditions on the impact response of the structure of nuclear power plants (NPPs) against a large commercial aircraft. The lumped parameter site dynamic model recommended by the code of ASCE 4-98 was used to consider the different homogeneous sites. With respect to the excellent impact resistant performance of steel-plate concrete (SC) structure, the full SC containment is selected as the research object. The impact analysis of the full SC containment against a large commercial aircraft under different site conditions was carried out, based on the force time-history analysis method. The numerical results in terms of the displacement, plastic strain, local concrete damage, and different values of energy were evaluated. The results showed that: (1) For the relatively thin full SC containment, the impact response under the fixed boundary is the largest, while that calculated by other, different sites varies greatly, and there is no consistent rule, the boundary condition which is assumed to be fixed is relatively conservative. (2) For the thicker full SC containment, the displacement response decreased with the increasing of the site shear wave velocity, which is the smallest when the fixed boundary is considered. When the shear wave velocity of the site is large enough, its boundary condition which is assumed to be the fixed constraint is reasonable. (3) For the relatively thin full SC containment, the site damping effect has a significant effect on the structural impact response. Nevertheless, the impact response of the thicker containment is slightly influenced by the site damping effect. (4) For the impact analysis of the structures of NPPs against a large commercial aircraft, it is suggested that both the specific site condition and fixed boundary should be considered.

1. Introduction

After the 9/11 incident, nuclear power plants (NPPs) against the malicious impact of a large commercial aircraft has become a significant focus of nuclear safety. Under these circumstances, the US Nuclear Regulatory Commission (NRC) regulations issued in 2009 required a licensee to perform a specific assessment regarding the impact of a large commercial aircraft on the facility as a beyond design basis event [1]. The technology guidance of NEI 07-13 [2] provided an acceptable method to satisfy the NRC regulations of 10 CFR 50.150. For the nonlinear dynamic analysis, the global structure response of the target structure can be evaluated based on the force time-history analysis method or missile-target interaction analysis method. China’s nuclear safety regulation of HAF102 [3] specified the relevant requirement for NPP to resist the malicious commercial aircraft attack, which clearly stated that if the terrain conditions of the NPP location made it possible to suffer the malicious impact of a commercial aircraft, the assessment of such an impact should be considered as a beyond design basis event.
In the 1960s, Riera [4] proposed a simplified theory model for the force time-history analysis method based on the reaction versus time relationship of the aircraft impact against a rigid wall. Subsequently, extensive experimental and analytical research work is performed on the impact analysis of reinforced concrete (RC) structure against the intentional aircraft crash by domestic and abroad researchers for the last several decades [5,6,7,8,9]. Jiang and Chorzepa [10] reviewed the available numerical and experimental studies and summarized the investigation which may be used to benchmark an aircraft impact simulation. Kyoungsoo et al. [11] presented the results of nonlinear dynamic analyses of prestressed concrete containment under the impact of a large commercial aircraft Boeing 747 based on the missile-target interaction analysis method. The preliminary evaluation of the military and civil aircrafts impact on a near term NPP was conducted using the force time-history analysis method [12]. The global and local structural safety of a nuclear auxiliary building under the crash of Boeing 767-400 was ensured with regards to different impact scenarios [13]. The aircraft impact analysis of primary auxiliary buildings was performed, and floor response spectra and the structure integrity of the external wall against the aircraft impact were analyzed [14]. For the steel-plate concrete (SC) structure, some tests and a numerical study of the impact resistance performance have been carried out. The test study for the impact resistance of SC panels with different thickness was achieved by a series of impact tests using 1/7.5 scale models, and it was confirmed that SC panels have much a better impact resistant performance than conventional RC panels, enabling the thickness of protection panels to be reduced by approximately 30% [15]. Mullapudi et al. [16] conducted a series of numerical studies to evaluate the effect of several parameters affecting the behavior of SC walls based on the force time-history analysis method. The parametric study was also performed to investigate the influences on the damage to the SC structure shield building subjected to the attack of Boeing 767-200ER [17]. Sadiq et al. [18] investigated the effectiveness of multiple barriers employed in safety-related RC and SC structures of NPPs against the aircraft impact. In one such study by the authors, the effect of material and geometric parameters of SC containment on its impact resistant performance was conducted based on the force time-history analysis method [19]. Although a considerable amount of work has been performed on the military and commercial aircraft impact of RC and SC structures, all the boundary conditions in the above research were to set the bottom nodes of the raft foundation as the fixed constraint. In other words, the site was assumed to be infinitely rigid. However, few studies have been carried out to consider the influence of the site condition on the structural response under impact loadings.
In the dynamic analysis of important engineering, especially for the buildings of NPP with large weight and stiffness, it is often necessary to consider the radiation damping and the elastic performance of semi-infinite soil for the site of non-hard rock. Nevertheless, there was few literature involved the influence of site conditions on the impact response of the NPP structures against a large commercial aircraft. Therefore, the influence of site condition on the impact response needs further study, and it is important to explore the influence rule on the impact response of buildings. As an extended research for the previous work [19], the same relatively thin and thick full SC containments are selected in this study. As the first step, the lumped parameter site dynamic model recommended by the code is adopted to simulate the different homogeneous sites. The numerical analysis of full SC containment with a fixed boundary and considering different site conditions is carried out, respectively. Subsequently, the influence of site damping on the impact response is also studied.

2. Numerical Analysis Method and Models

2.1. Impact Force Time-History Function

For the force time-history analysis method, the impact force time-history function is firstly determined based on the aircraft crushing strength information and impulse conservation principles. In this paper, the impact force time-history function of a large commercial aircraft Boeing 747, in which the total mass is 400 t and impact velocity is 100 m/s, is selected as shown in Figure 1 [20]. It is seen that the first peak is due to the crushing of fuselage, while the second much more severe peak is related to the impact of fuselage and the much more stiff engines, and after that only the fuselage load is continued until the end. Therefore, according to the character of commercial aircraft, the impact effect can be divided in two parts of fuselage and two wings, in which the action area of each part is 50 m2. The time varying uniform impact pressure for fuselage and two wings can be obtained as shown in Figure 2.

2.2. Numerical Model of Semi-Infinite Site

In the dynamic analysis, a variety of numerical models for simulating the semi-infinite site have been developed. For instance, the massless foundation model [21], transmitting boundaries model [22], viscous-spring dynamic artificial boundaries model [23], and lumped parameter site dynamic model [24,25] are all widely used to simulate the semi-infinite site. In this paper, after comprehensive consideration of the advantage and disadvantage of the above dynamic models for site simulation and its implementation in the nonlinear finite element (FE) code of ANSYS/LS-DYNA [26], the lumped parameter site dynamic model proposed by ASCE 4-98 is adopted to simulate the semi-infinite site in the impact analysis.
The dynamic model proposed by ASCE 4-98 [25] is expressed by six independent parallel connection systems of spring and damper. These equivalent spring stiffness and damping coefficients were used to simulate the relationship of the force and displacement for the degrees of freedoms (DoFs) of translation, rocking, and torsion. In the specific analysis, to determine the corresponding constants of spring and damper, the size of basemat, the material parameters of site such as density, Poisson’s ratio, and the dynamic shear modulus are needed. Since the circular raft foundation of containment is meshed by solid elements, each node only has three translational DoFs. Hence, the dynamic stiffness for three translational DoFs are only needed to calculate. The specific formulas are provided as follows.
The lumped spring stiffness K H and damping coefficient C H for the horizontal direction are as follows [25]:
K H = 32 ( 1 ν ) G R 7 8 ν
C H = 0.576 K H R ρ / G
The lumped spring stiffness K V and damping coefficient C V for the vertical direction are as follows [25]:
K V = 4 G R 1 ν
C V = 0.85 K V R ρ / G
where G is the dynamic shear modulus, υ is Poisson’s ratio, ρ is the mass density, and R is the radius of circular basemat.
The raft foundation of containment was assumed to be rigid due to its large thickness. How to discretize the lumped dynamic stiffness reasonably to all bottom nodes of the raft foundation is described below.
Since the spring stiffness for three translational DoFs cannot cause the bending moment effect, the spring stiffness can be discretized proportionally according to the control area of each node at the bottom of the raft foundation. Assuming that the lumped spring stiffness in the X, Y, and Z direction is marked as K X , K Y , and K Z , respectively, the total number of bottom nodes of the raft foundation is n , the control area represented by the node number of i is marked as A i , and the total area of bottom surface of raft foundation is A = A i ( i = 1 , , n ) . Thus, the spring stiffness assigned for the node number of i in the three translational directions is respectively as follows:
K X i = A i A × K X ;   K Y i = A i A × K Y ;   K Z i = A i A × K Z
The lumped damping coefficient can also be discretized approximately in the same way as the spring stiffness. Assuming that the lumped damping coefficient in the X, Y, and Z direction is marked as C X , C Y , and C Z , respectively. Thus, the damping coefficient assigned for the node number of i in the three translational directions is respectively as follows:
C X i = A i A × C X ;   C Y i = A i A × C Y ;   C Z i = A i A × C Z
Five types of homogeneous sites were assumed in this study, the shear wave velocity V s for each site is 1000, 1500, 2000, 2500, and 3000 m/s, respectively. The material properties and the corresponding lumped spring stiffness and damping coefficient are listed in Table 1. Through Equations (5) and (6), the spring stiffness and damping coefficient assigned for each bottom node of the raft foundation can be obtained.

2.3. Finite Element Model

The geometrical dimensions of full SC containment used in this paper are as follows: The total height is 67.2 m, the outer diameter and height of cylinder is 51.2 and 55.8 m, and the thickness of the inner and outer steel plate is 20 mm. Two models whose thickness of cylinder and dome is 0.9 and 1.0 m are considered separately in this paper. Due to the symmetry of containment structure and crash zone, the half model of full SC containment was built by the nonlinear FE code of ANSYS/LS-DYNA [26]. Of course, the symmetry constraints need to be applied to the symmetry plane of containment. Concrete was modeled by solid element Solid164, which was divided into four layers along the thickness direction, and the size along the other directions was about 0.6 × 0.67 m and 0.3 × 0.67 m. Steel plate was modeled by shell element Shell163. The connection between the steel plate element and the contact surface of concrete element was created by common nodes, so that the steel plate was glued to the concrete surface with strain compatible. A total number of 102,018 solid elements and 48,720 shell elements were meshed for this half model, as shown in Figure 3a. For the loading application of this model, the center zone on the middle of the cylinder where the impact pressure is applied is illustrated in Figure 3a,b. The area of half fuselage and one wing is 25 m2, respectively. The impact pressure of fuselage and wing as shown in Figure 2 is separately applied to these corresponding elements as shown in Figure 4.
For the boundary condition, the fixed boundary at the bottom of raft foundation was applied by restraining translation DoFs, in the case without considering the site condition. When the different site conditions are considered, the spring-damper element COMBI165 is used to simulate the semi-infinite site. Since it is not allowed to define both the spring and damper properties for the same element, a total of six elements are set for each bottom node of the raft foundation, in which three elements are used to simulate the spring stiffness and the other three elements are used to simulate the damping coefficient for three translation DoFs. Each element includes two nodes, in which one node is shared with the bottom node of raft foundation, and the other node is set to be 0.5 m away from the bottom node and fixed constraint for the boundary condition. Hence, a total number of 10,446 spring-damper elements are arranged beneath the raft foundation, and the length of each element is 0.5 m, as shown in Figure 3c. Thus, the spring stiffness and damping coefficient can be realized by defining material attributes of *MAT_SPRING_ELASTIC and *MAT_DAMPER_VISCOUS [26] for different elements, respectively.

2.4. Numerical Material Models of Full SC Contaiment

2.4.1. Constitutive Model of Concrete and Steel Plate

To realistically predict the behavior of SC structure under the impact load, it is necessary to study the nonlinear constitutive model and failure criterion. The nonlinear FE code of ANSYS/LS-DYNA provides various material models developed for specific applications which require an appropriate set of input parameters [26]. In this study, the Winfrith concrete model (*MAT_WINFRITH_CONCRETE), which was based upon the so-called four parameter model proposed by Ottosen [27], was selected as the concrete constitutive model. For the failure criterion, *MAT_ADD_EROSION option provides a way of controlling the material failure. The damaged element is removed from the model when the damage variable reaches the predetermined critical value. Since the strength of concrete changes with the strain rate, and the concrete is mainly damaged for pressure under the impact load, the maximum principal strain is chosen as the failure criterion of concrete.
For the steel constitutive model, Cowper-Symonds model which is corresponding to *MAT_PLASTIC_KINEMATIC from the ANSYS/LS-DYNA material library is suited to model the isotropic and kinematic hardening plasticity with the option of the including rate effect [26]. The failure criterion is defined by the effective plastic strain, and the damaged element is deleted from the model when it reaches the predetermined value.

2.4.2. Validation of Material Models

According to NEI07-13 [2], the accuracy of the constitutive models can be judged on a review of the sample validation cases (against test results). Based on our previous work, the simulation analysis of the 1/7.5 scale aircraft impact test against SC and RC panels with different thickness was carried out [28]. Details of the experimental study of the 1/7.5 scale model of aircraft and RC and SC panels with different thickness were provided in the previous literatures [15,29]. The simulation results in terms of damage modes of panels, velocity time-history curves of engine, and damage to the aircraft correlated well with the test results, especially for the constitutive concrete model of Winfrith [28]. Therefore, the level of accuracy of the constitutive models of the above concrete and steel had been effectively validated. In this study, we continued to use the same constitutive models of concrete and steel plate to conduct the simulation for full SC containment.

2.4.3. Material Properties of Full SC Containment

For the dynamic analysis of impact effects on structure, an increase of strength due to the high strain rate involved in the deformation process is appropriate. The static design strength values should be increased using dynamic increase factors (DIFs) according to NEI 07-13 [2]. The material properties of C50 concrete and Q335 steel plate defined in full SC containment for the impact analysis are listed in Table 2 and Table 3, respectively.

3. Results and Discussion

For the different homogeneous site conditions and fixed boundary at the bottom of raft foundation, the impact response can be obtained under the impact pressure applied on the middle of the cylinder, as illustrated in Figure 3a. Two cases with respect to the variety of concrete thickness of 0.9 and 1.0 m were investigated independently. The comparison analysis of the impact response for each case was conducted in this section.

3.1. Comparison Analysis of Different Site Conditions

In this section, five site conditions with shear wave velocities of 1000, 1500, 2000, 2500, and 3000 m/s, and fixed boundary at the bottom of raft foundation were considered. The influence of different site conditions on the impact response of the relatively thin and thick full SC containments was analyzed, respectively.

3.1.1. Full SC Containment with Thickness of 0.9 m

For the relatively thin containment whose thickness of cylinder and dome is 0.9 m, the contours of the maximum impact displacement and concrete peeling off area is shown in Figure 5. It can be seen that the concrete at the front and rear face of the fuselage impacted area fell off, and the steel plate at the inner and outer sides turned to a plastic state without tearing. In addition, local penetration occurred at the fuselage impacted zone for the sites of Vs = 1000, 1500, 2500, 3000 m/s and the fixed boundary. For the site of Vs = 2000 m/s, the concrete damage is the most slightly, only there is a large area of concrete debris falling off on the rear face of the cylinder, and small pieces of concrete falling off on the front face of the cylinder.
The time-histories of maximum displacement of the containment and plastic strain of steel plate at the impact area are shown in Figure 6 and Figure 7, respectively. It is observed that both the peak displacement and plastic strain of the containment under the fixed boundary is the largest, and that for the site of Vs = 2000 m/s is the smallest. The order of the peak displacement is as follows: FIXED > Vs = 1500 > Vs = 1000 > Vs = 2500 > Vs = 3000 > Vs = 2000 m/s. The order of the plastic strain of steel plate is as follows: FIXED > Vs = 3000 > Vs = 1500 > Vs = 2500 > Vs = 1000 > Vs = 2000 m/s. Specially, the peak displacement of containment and the peak plastic strain of steel plate are summarized in Table 4. It is found that the peak displacement and plastic strain calculated by the containment with considering different sites was respectively reduced by 6.1~49.6% and 3.1~65.2%, compared with that of containment under the fixed boundary.
In addition, the time-histories of the spring-damper energy, internal energy, and total energy of containment for different site conditions are plotted in Figure 8. It is clear that the spring-damper energy decreased with the increasing of the site shear wave velocity. The internal energy and total energy of containment with the site of Vs = 1000 m/s is the largest. Overall, the order of the total energy of system is as follows: Vs = 1000 > Vs = 1500 > FIXED > Vs = 2500 > Vs = 3000 > Vs = 2000 m/s. In particular, the comparison of the peak values of spring-damper energy, internal energy, and total energy of containment are summarized in Table 4. From the above comparison, it can be concluded that the impact response of this relatively thin containment with the fixed boundary is the largest, while that calculated by other different sites varies greatly, and there is no obvious and consistent rule.

3.1.2. Full SC containment with Thickness of 1.0 m

For the relatively thick containment with a thickness of 1.0 m, the maximum displacement occurred at the location of the fuselage impacted zone, and the maximum displacement time-history of a node located at the center of the impact area for the above different sites is plotted in Figure 9. It can be obtained that the displacement amplitudes calculated for the site with Vs = 1000, 1500, 2000, 2500, and 3000 m/s and the fixed boundary are 13.47, 12.75, 12.18, 11.92, 11.77, and 11.52 cm, respectively. It is evident that the displacement response of the containment decreased with the increasing of the site shear wave velocity, and the displacement response was the minimum for the fixed boundary. Additionally, the time-histories of maximum plastic strain of concrete and the contours for the maximum plastic strain are plotted in Figure 10 and Figure 11, respectively. It is observed that the maximum plastic strain occurs at the location of fuselage and wing impacted zone. As summarized in Table 5, it can be obtained that the peak displacement calculated by the containment with different sites was increased by 2.2~16.9%, compared with that of the containment under the fixed boundary. Both the peak displacement and the peak plastic strain of concrete calculated by the site of Vs = 1000 m/s is the largest, and that for the site of Vs = 3000 m/s is closest to that for the fixed boundary, only with 2.2% and 2.4% difference.
Moreover, the time-histories of the spring-damper energy, internal energy, and total energy of containment for different site conditions are plotted in Figure 12. It is clear that they all decreased with the increasing of the site shear wave velocity. When the fixed boundary is considered, the internal energy and total energy value are the smallest. It is consistent with the fact that the impact response and damage degree of the containment with the site of Vs = 1000 m/s is the largest. Specially, the comparison of the peak values of spring-damper energy, internal energy, and total energy of containment were summarized in Table 5.
From the above comparison, it can be inferred that when the shear wave velocity of the site is large enough, that is, the site is hard rock (such as site of Vs = 3000 m/s), the impact response is similar to that of the fixed boundary. Therefore, it is reasonable to assume that its boundary condition is the fixed constraint. On the contrary, when the shear wave velocity of the site is relatively small, that is, the site consists of soft soil, both the impact response and the energy curve are different from those of the fixed boundary.

3.2. Analysis of Site Damping on the Impact Response

In this section, to study the influence of site damping on the impact response, the damping effects of the two sites are considered respectively for both the relatively thin and thick containment.

3.2.1. Full SC Containment with Thickness of 0.9 m

For the relatively thin containment, two sites with shear wave velocity of 1000 and 2000 m/s were considered, respectively. The impact analysis with and without considering the damping effect of the above two sites were carried out herein. Figure 13 showed contours of the maximum impact displacement and concrete peeling off area under the sites without considering the damping effect. It can be seen from Figure 13a that the concrete at the front and rear face of the fuselage impacted area fell off, and local penetration occurred. For Figure 13b, a large area of concrete at the front and rear face of the fuselage impacted area falls off, without penetration. Compared to Figure 5a,c, it can be found that the local damage of concrete calculated without considering the site damping effect is more serious. Figure 14 shows the comparison of the internal energy absorbed by concrete between the sites with and without considering the damping effect, in which the legend “S-1000 m/s” denoted for the site of Vs = 1000 m/s and the damping effect is ignored and only the spring effect is considered, and the legend “S-D-1000 m/s” denoted for both the site damping and spring effect for the site of Vs = 1000 m/s, are considered. It is observed that the internal energy absorbed by the concrete of containment without considering the site damping was larger than that of considering the site damping effect, which is consistent with the local damage of concrete.
The time-histories of maximum displacement of containment and plastic strain of steel plate at the impact zone are shown in Figure 15 and Figure 16, respectively. It was found that the peak displacement of containment for the site of Vs = 1000 m/s with only considering the spring effect is 35.42 cm, which is 4.8% lower than that of considering both the spring and damping effect. However, for the site of Vs = 2000 m/s, the peak displacement of containment with only considering the spring effect is 27.72 cm, which is increased by 33.9%. Furthermore, it can be seen from Figure 16 that the change rule of the maximum plastic strain of steel plate is quite different with the peak displacement response. Additionally, the time-histories of the spring-damper energy and spring energy are plotted in Figure 17. It is clear that when only the spring effect of the site is considered, its own energy is markedly smaller than that of both the spring and damping effect simultaneously considered. The time-histories of internal energy and total energy of this full SC containment with the above two sites are plotted in Figure 18. It is observed that the peak values of internal energy for the containment with and without considering the damping effect are equivalent, and then the internal energy calculated by considering both the spring and damping effect is slightly larger for the site of Vs = 1000 m/s, while the internal energy calculated by considering both the spring and damping effect is slightly smaller for the site of Vs = 2000 m/s. As can be seen in Figure 18b, the change rule of the total energy is similar to the internal energy of containment.
To sum up, the above results illustrated that the damping effect of the site has a significant effect on the structural impact response (i.e., displacement, plastic strain, and local concrete damage). The variation of the internal energy and total energy of this full SC containment is consistent with the impact displacement response.

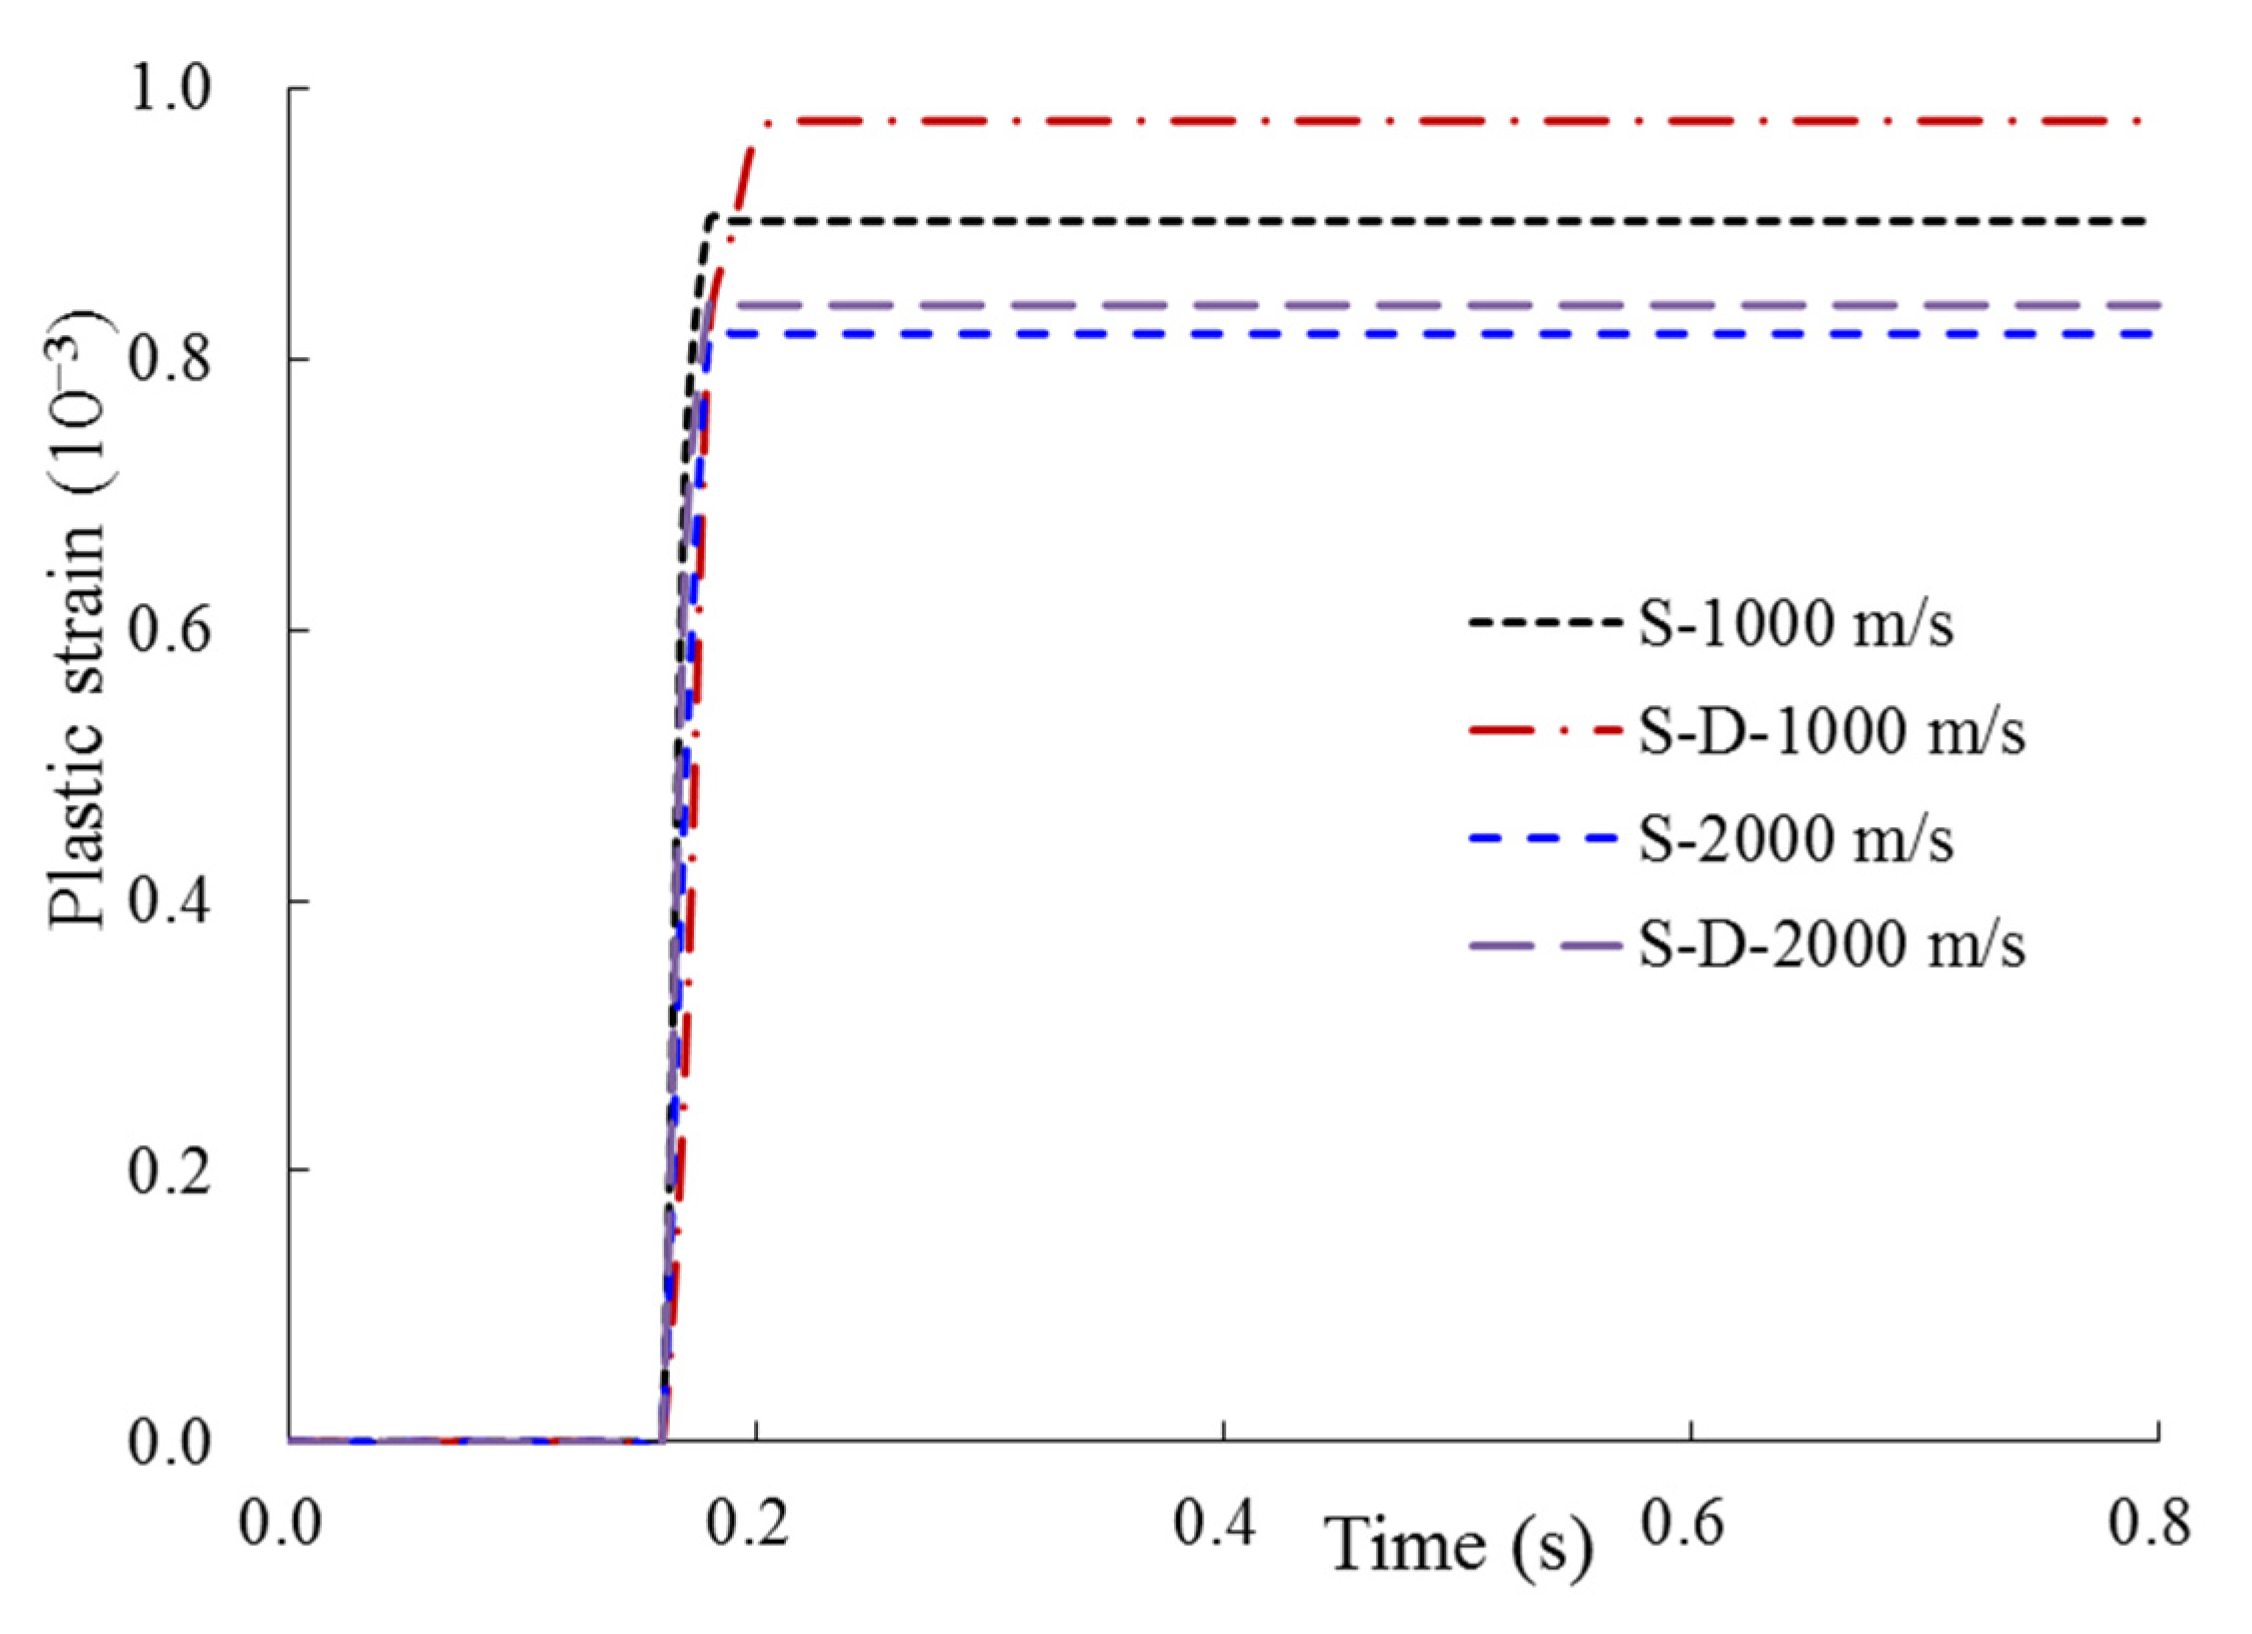
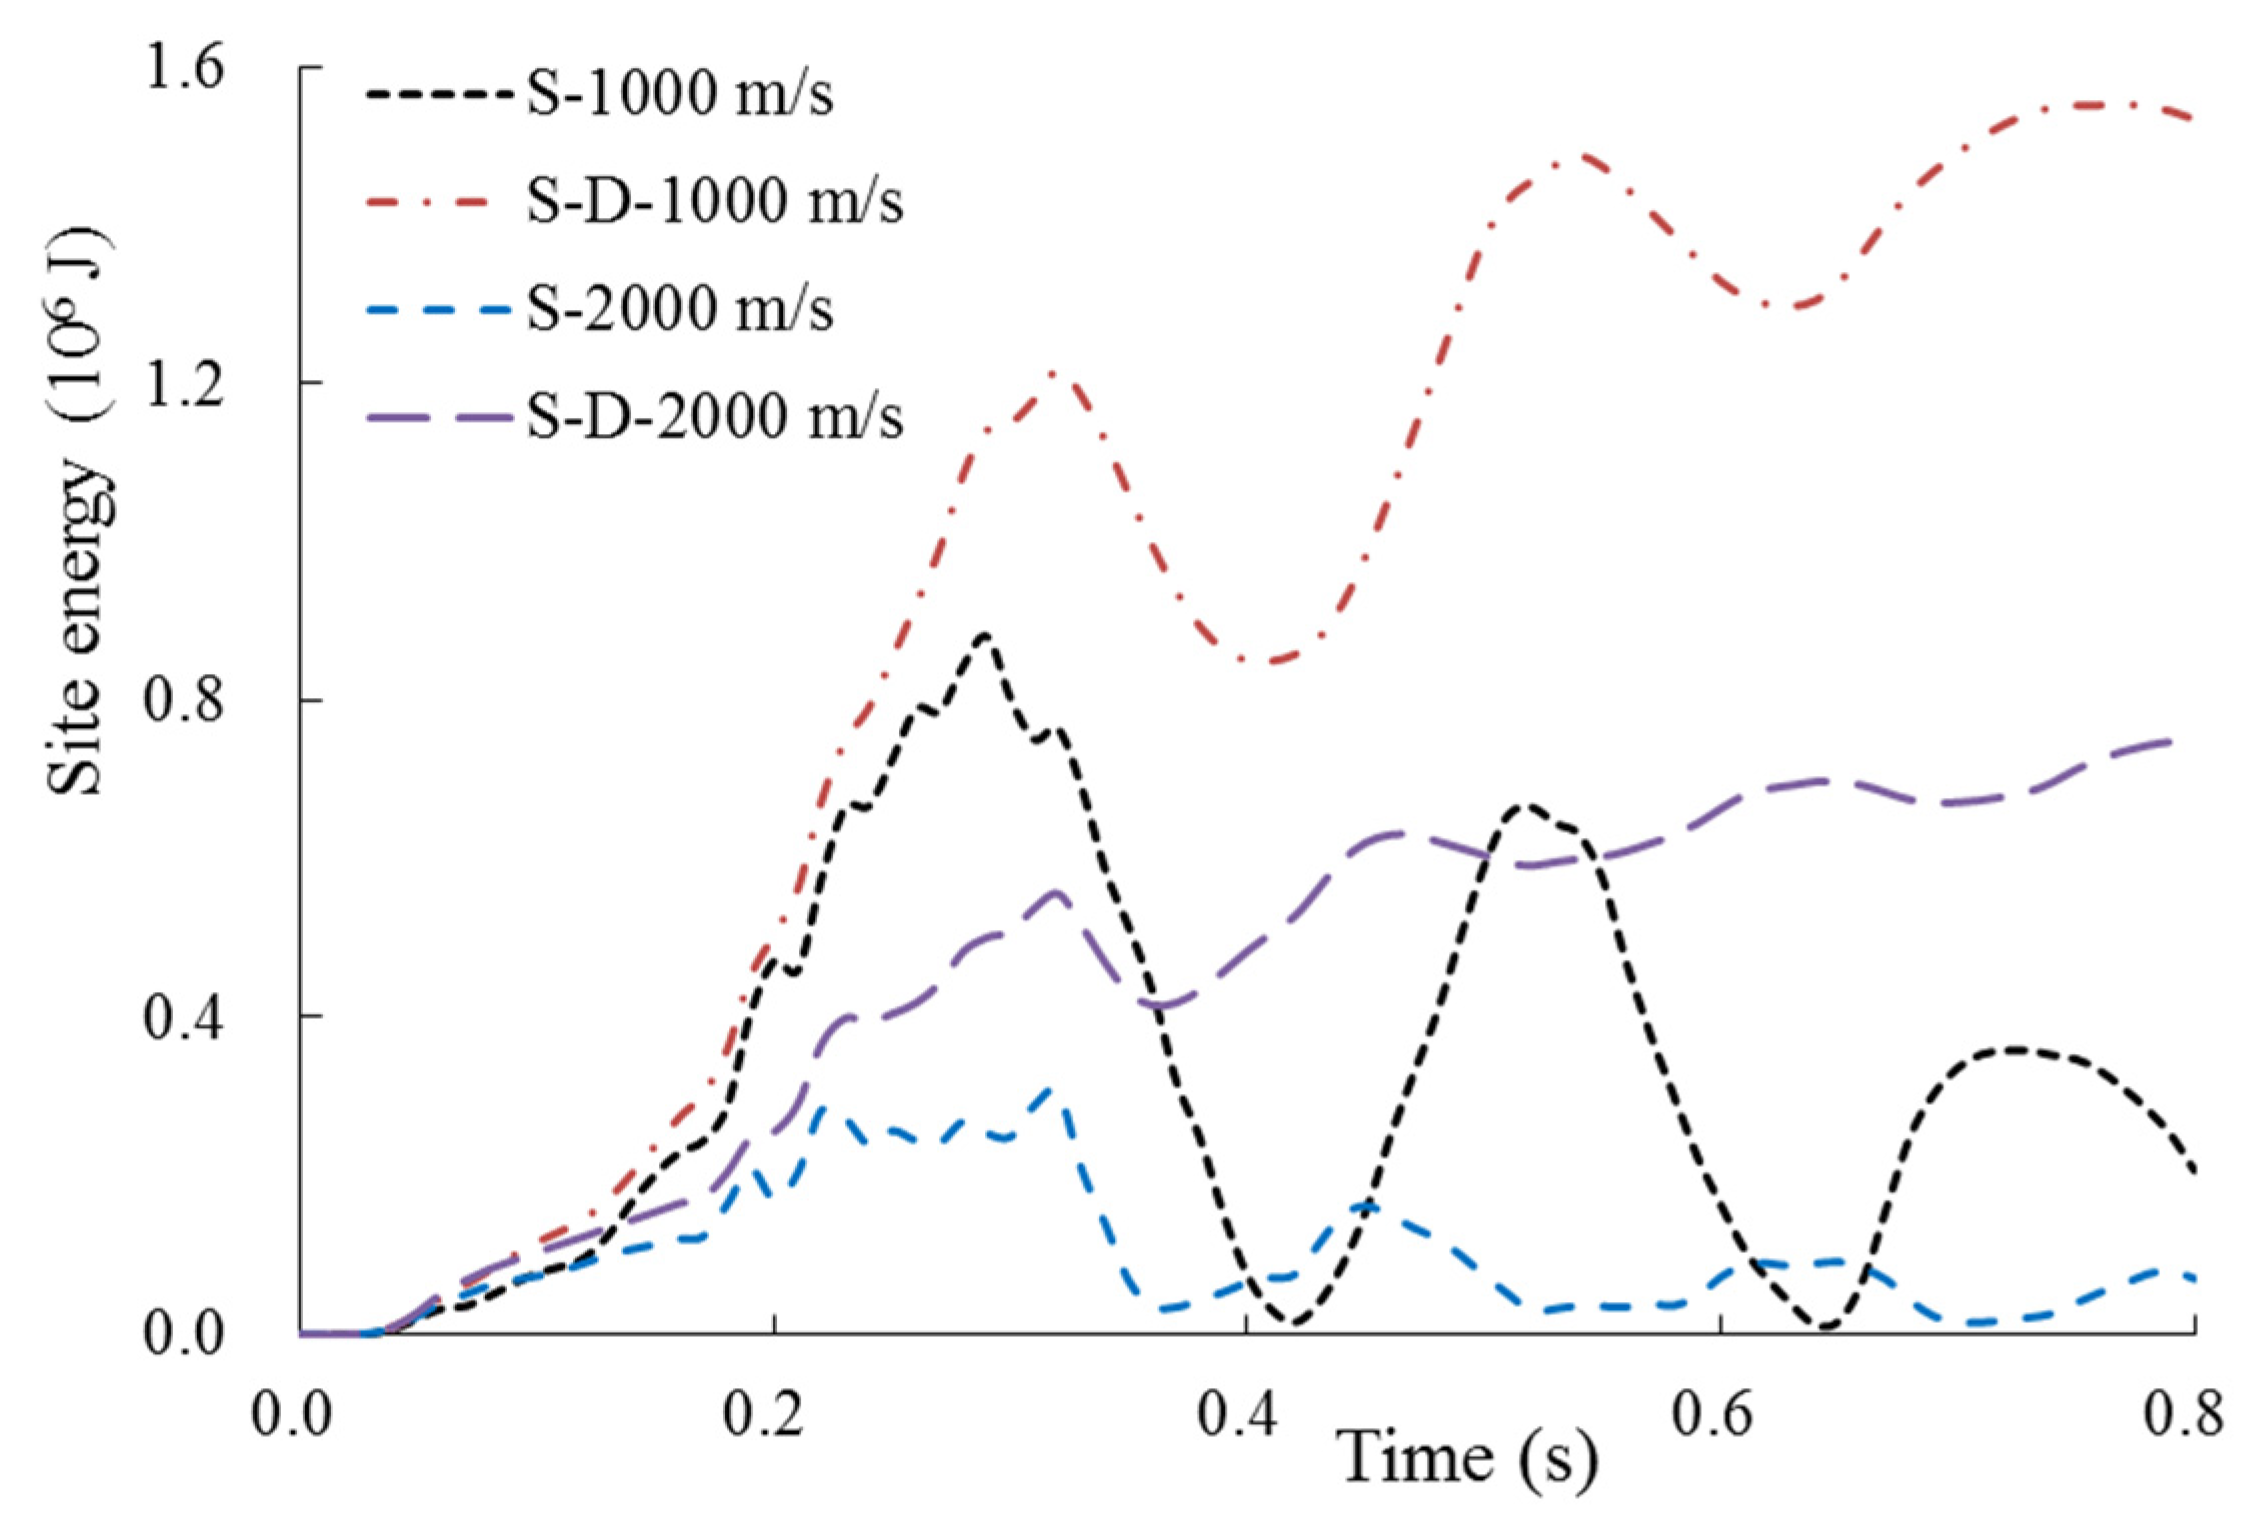
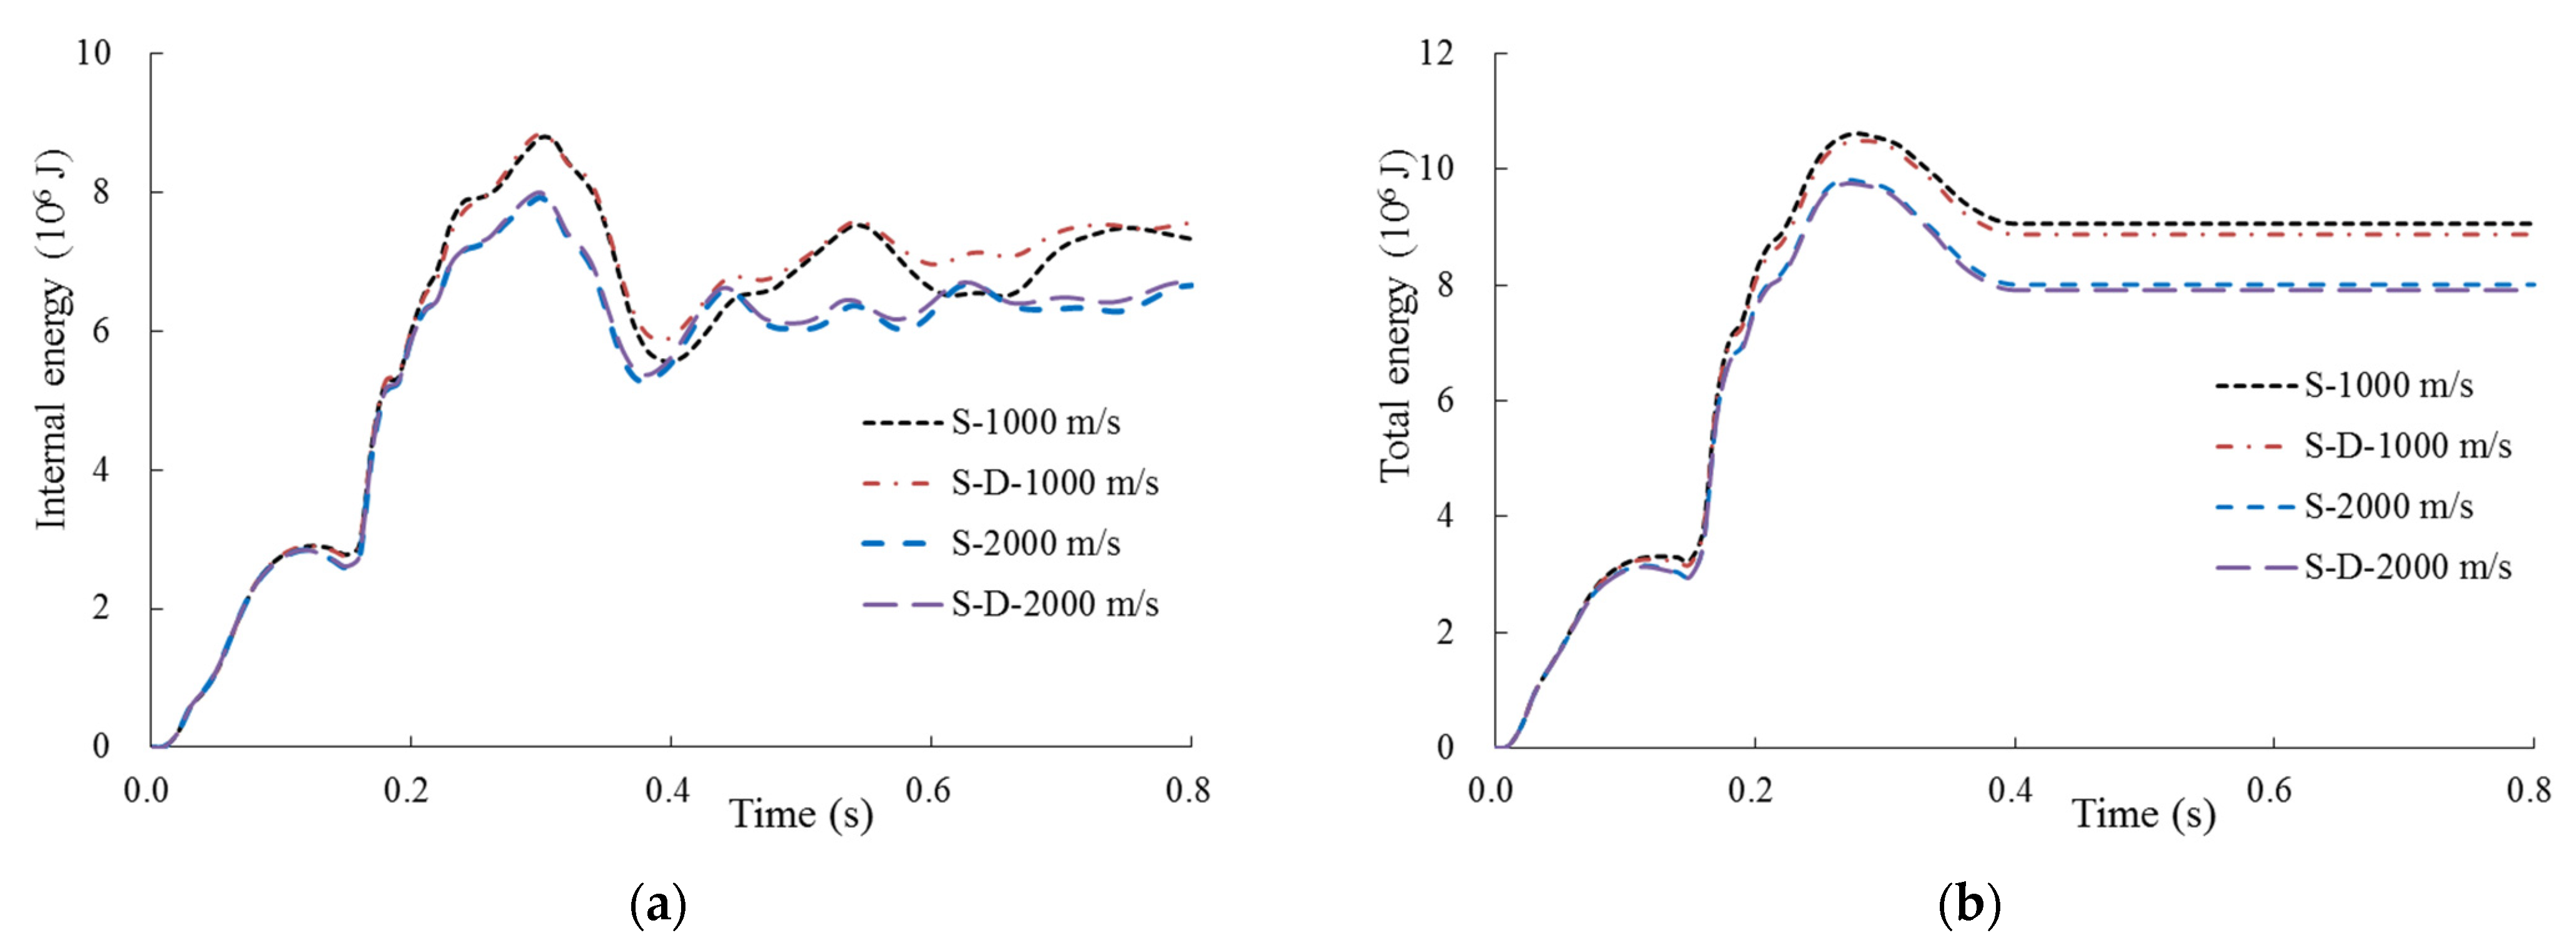
3.2.2. Full SC Containment with Thickness of 1.0 m

For the relatively thick containment, two sites with shear wave velocities of 1000 and 2000 m/s were considered, respectively. The impact analysis with and without considering the damping effect of the above two sites was carried out herein. The time-histories of maximum displacement and plastic strain of concrete at the impact zone are shown in Figure 19 and Figure 20, respectively. It is observed that the displacement response for both sites was almost the same for the calculation with and without considering the site damping effect. It means that the site damping effect has no influence on the impact displacement for this thicker containment. Figure 20 showed that the maximum plastic strain of concrete calculated by only considering the spring effect is decreased by 7.5% and 2.5% for the site of Vs = 1000 and 2000 m/s, respectively.
Furthermore, the time-histories of the spring-damper energy and spring energy are plotted in Figure 21. It is evident that when only the spring effect of the site is considered, its own energy is obviously smaller than that of both the spring and damping effect simultaneously considered. The time-histories of internal energy and total energy of this full SC containment the above two sites are plotted in Figure 22. It was observed that both the internal energy and the total energy curves of the containment calculated with and without considering the damping effect basically coincide. Overall, it can be confirmed whether considering the site damping effect has a minimal effect on the impact response of this thicker containment, especially for the impact displacement.

4. Conclusions

This study aimed at evaluating the influence of different site conditions on the impact response of the full SC containment subjected to a large commercial aircraft impact. The lumped parameter site dynamic model recommended by the code was used to simulate the different homogeneous sites. The impact analysis of the full SC containment under different site conditions was performed, based on the force time-history analysis method. Through the comparison results in terms of the displacement, plastic strain, local concrete damage, and different energies, some conclusions may be drawn as follows:
(1)
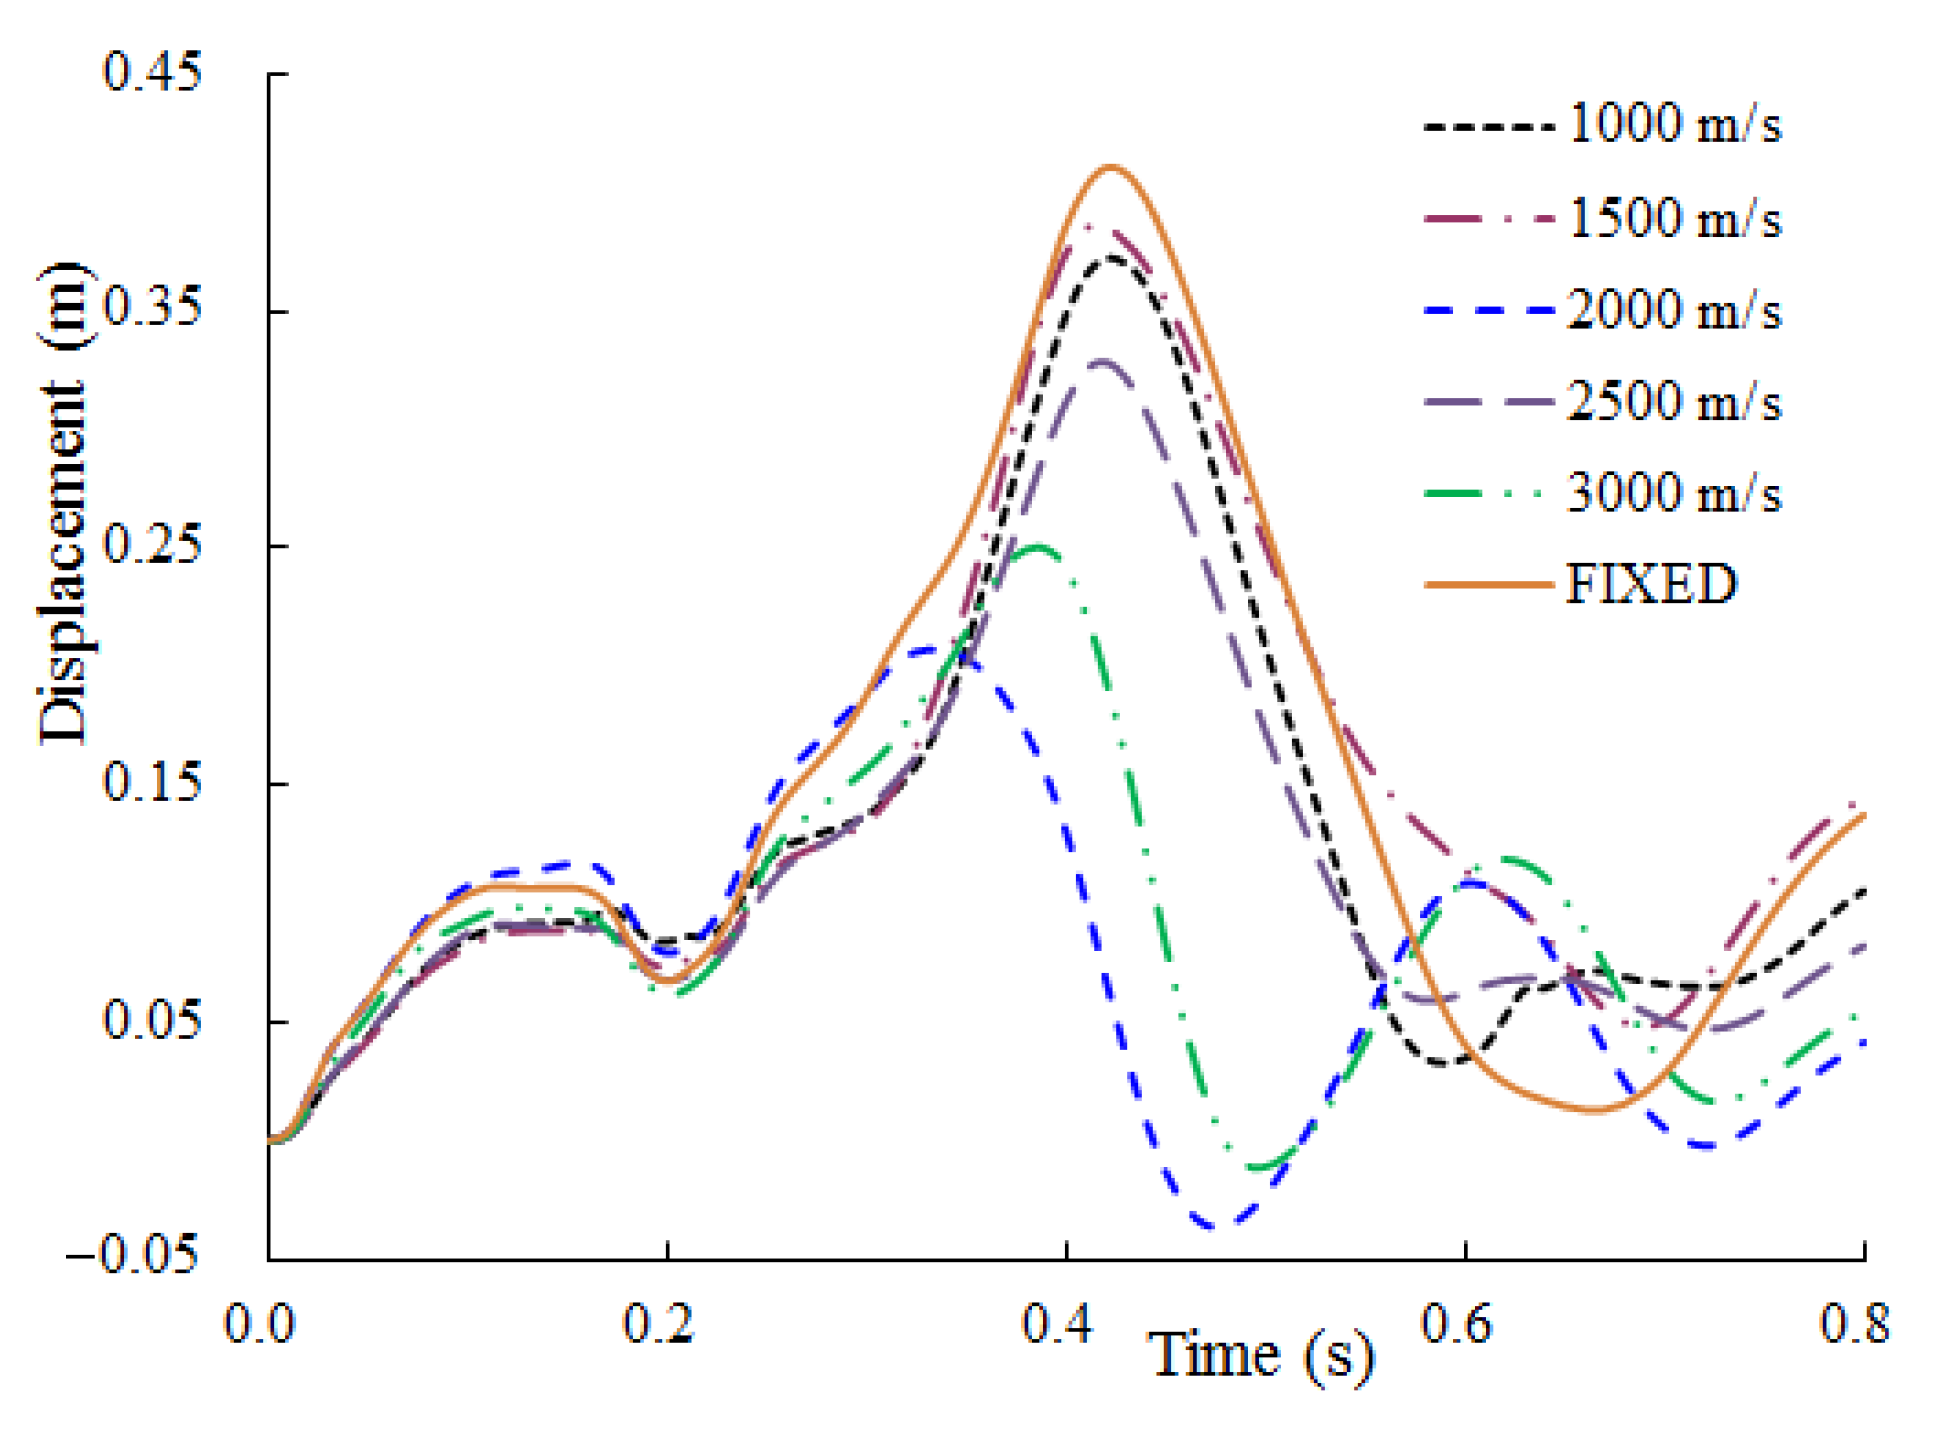
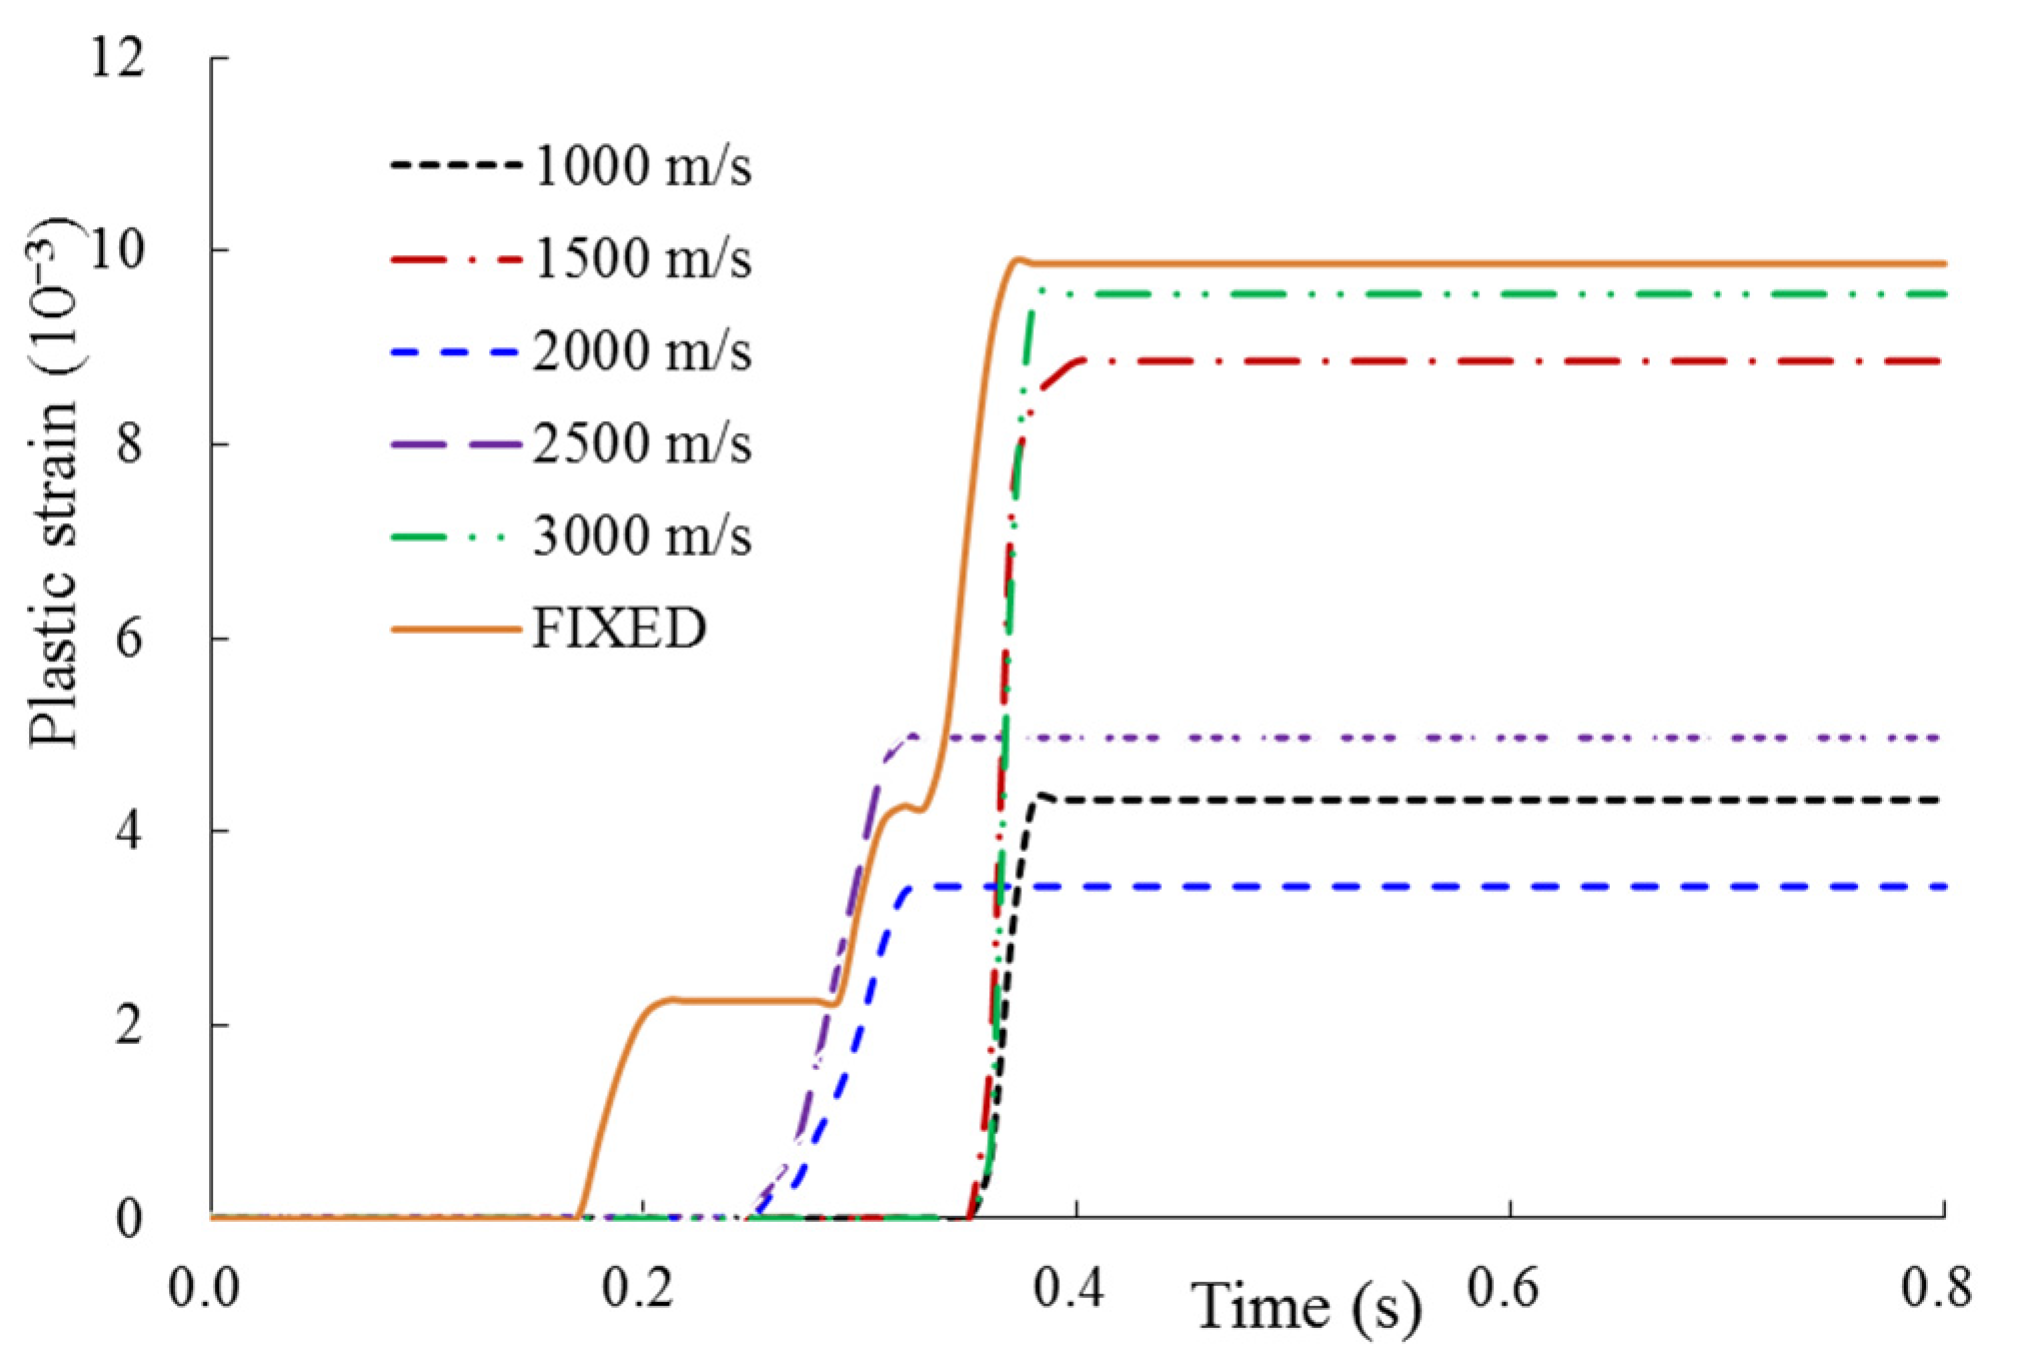
For the relatively thin full SC containment, both the displacement and plastic strain under the fixed boundary are the largest, while the impact response calculated by other, different sites varies greatly, and there is no consistent rule. Overall, the boundary condition of this relatively thin containment, which is assumed to be fixed is relatively conservative.
(2)
For the thicker full SC containment, it is clear that the displacement response of containment decreased with the increasing of shear wave velocity, and that is the smallest when the fixed boundary is considered. The displacement and plastic strain of concrete calculated by the site of Vs = 3000 m/s is closest to that for the fixed boundary, only with 2.2% and 2.4% difference. Hence, when the shear wave velocity of the site is large enough, that is, the site is hard rock, its boundary condition which is assumed to be the fixed constraint is reasonable.
(3)
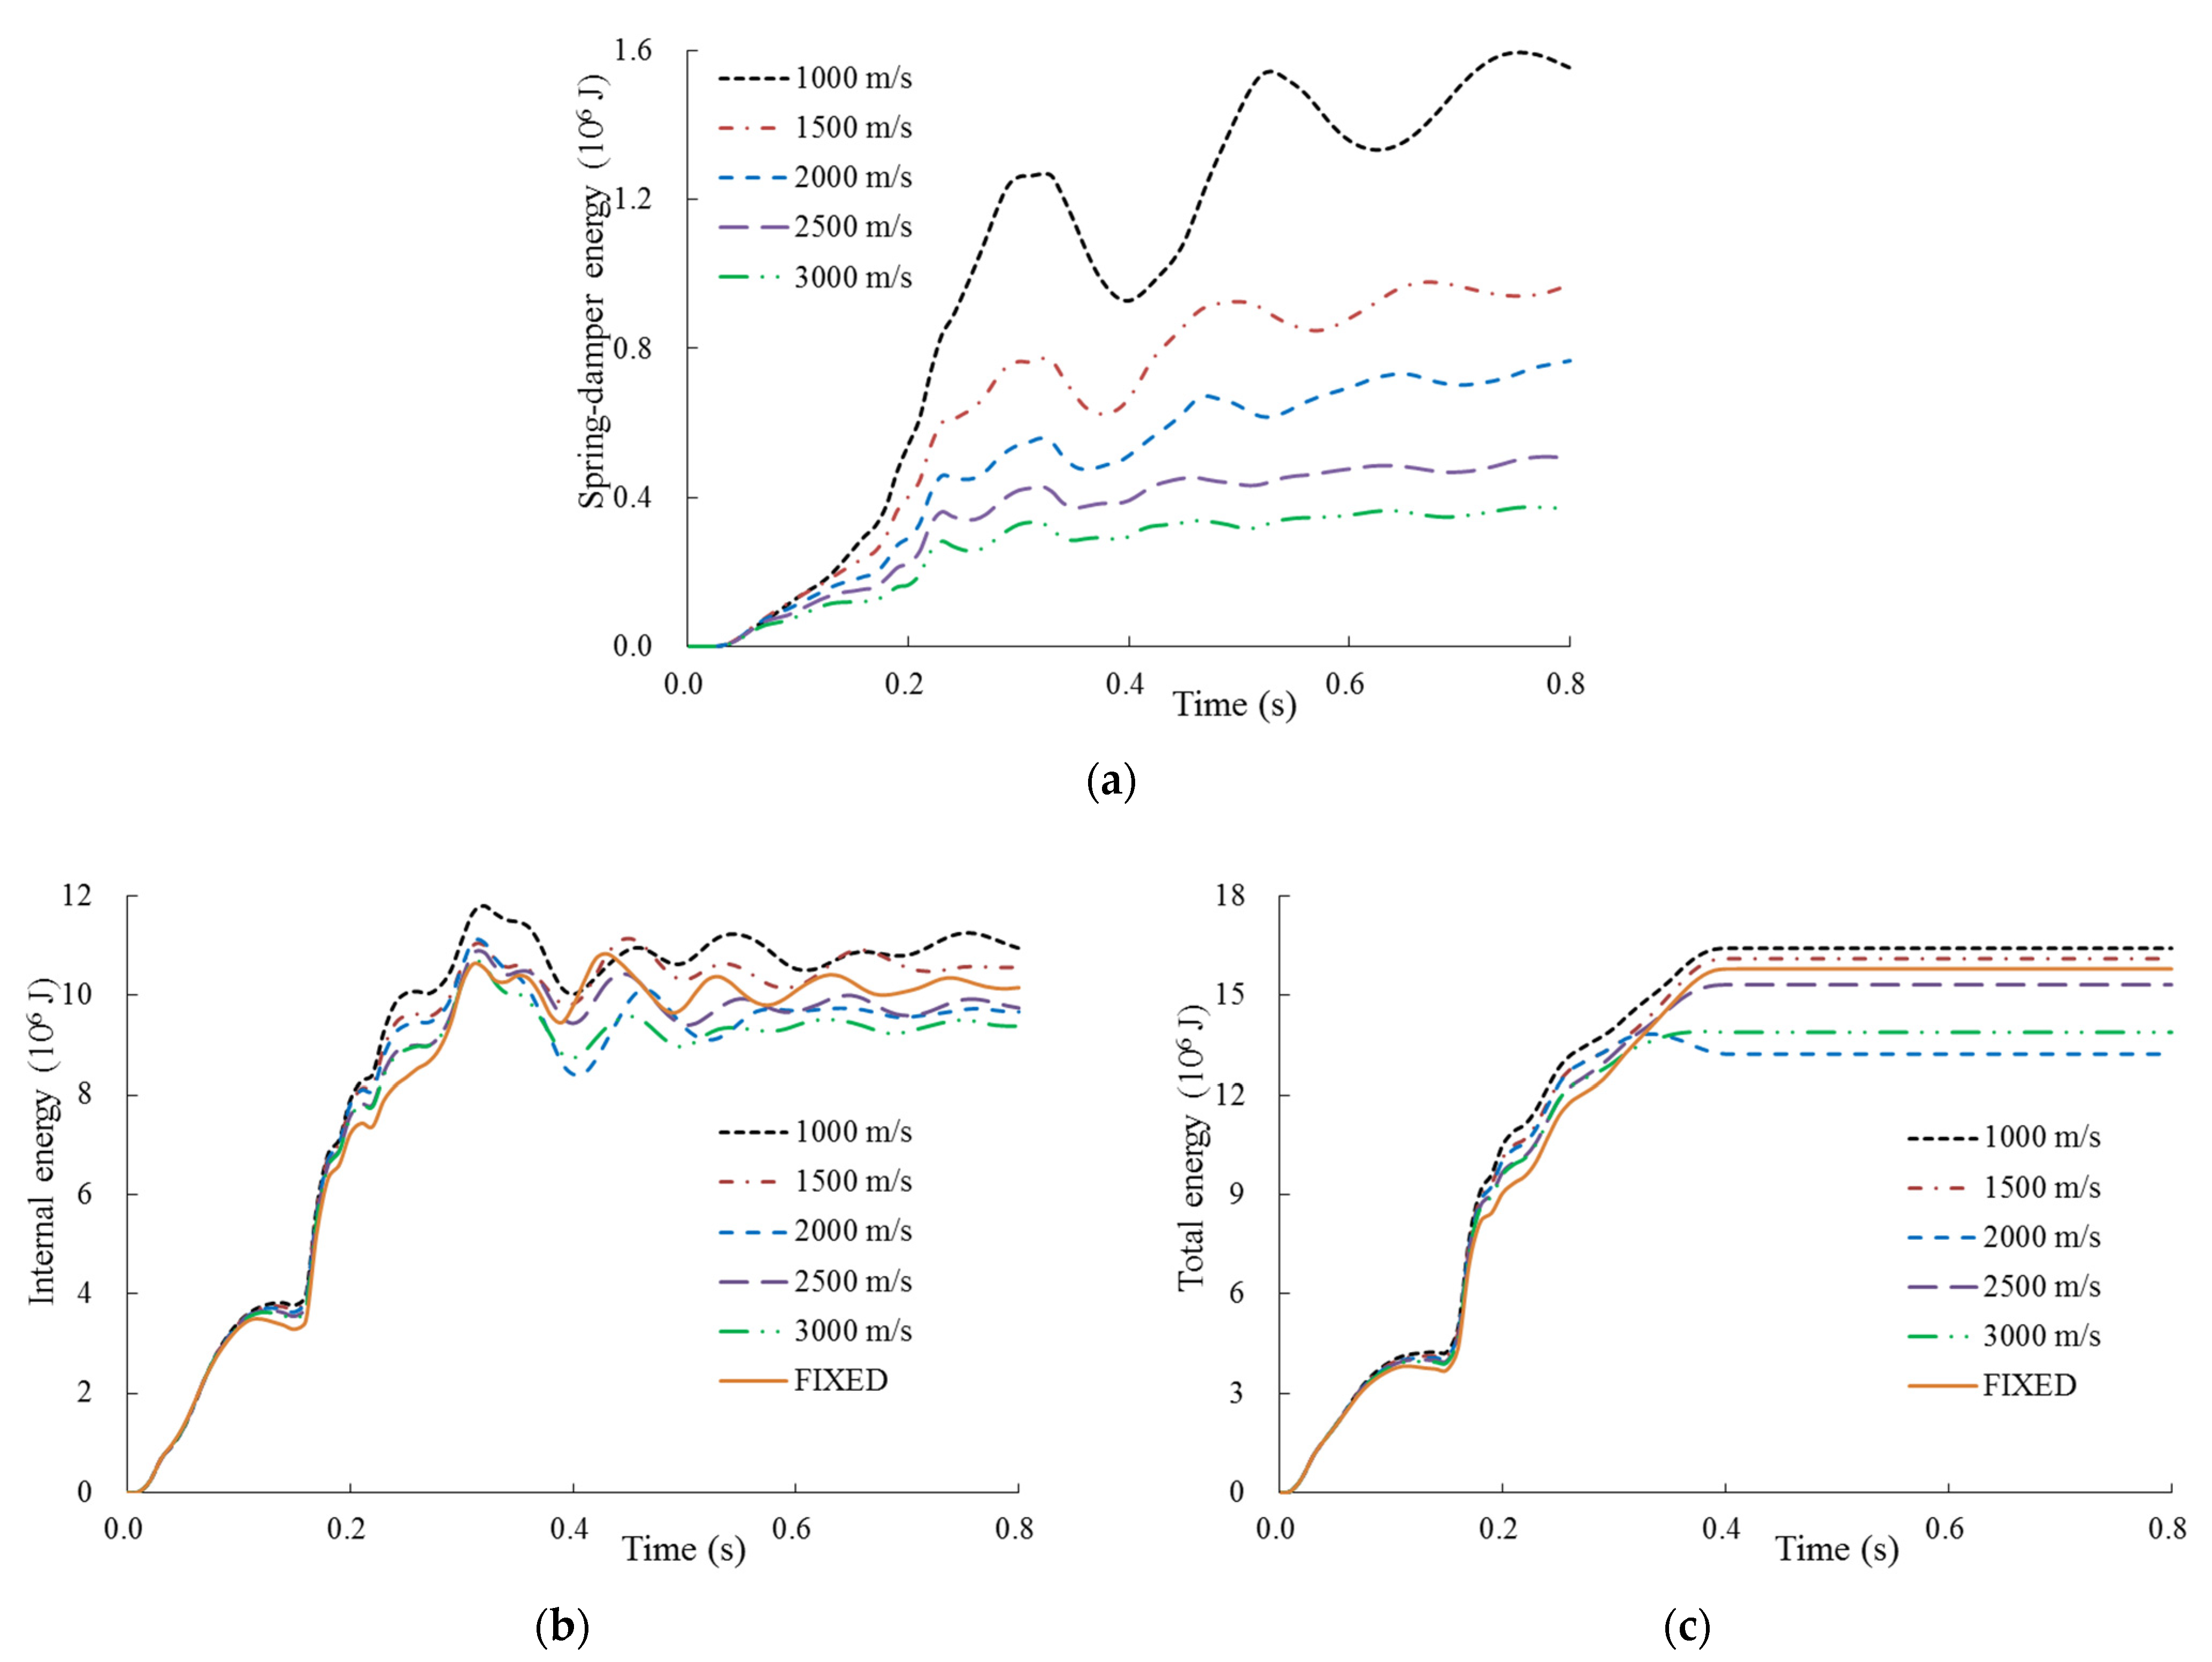
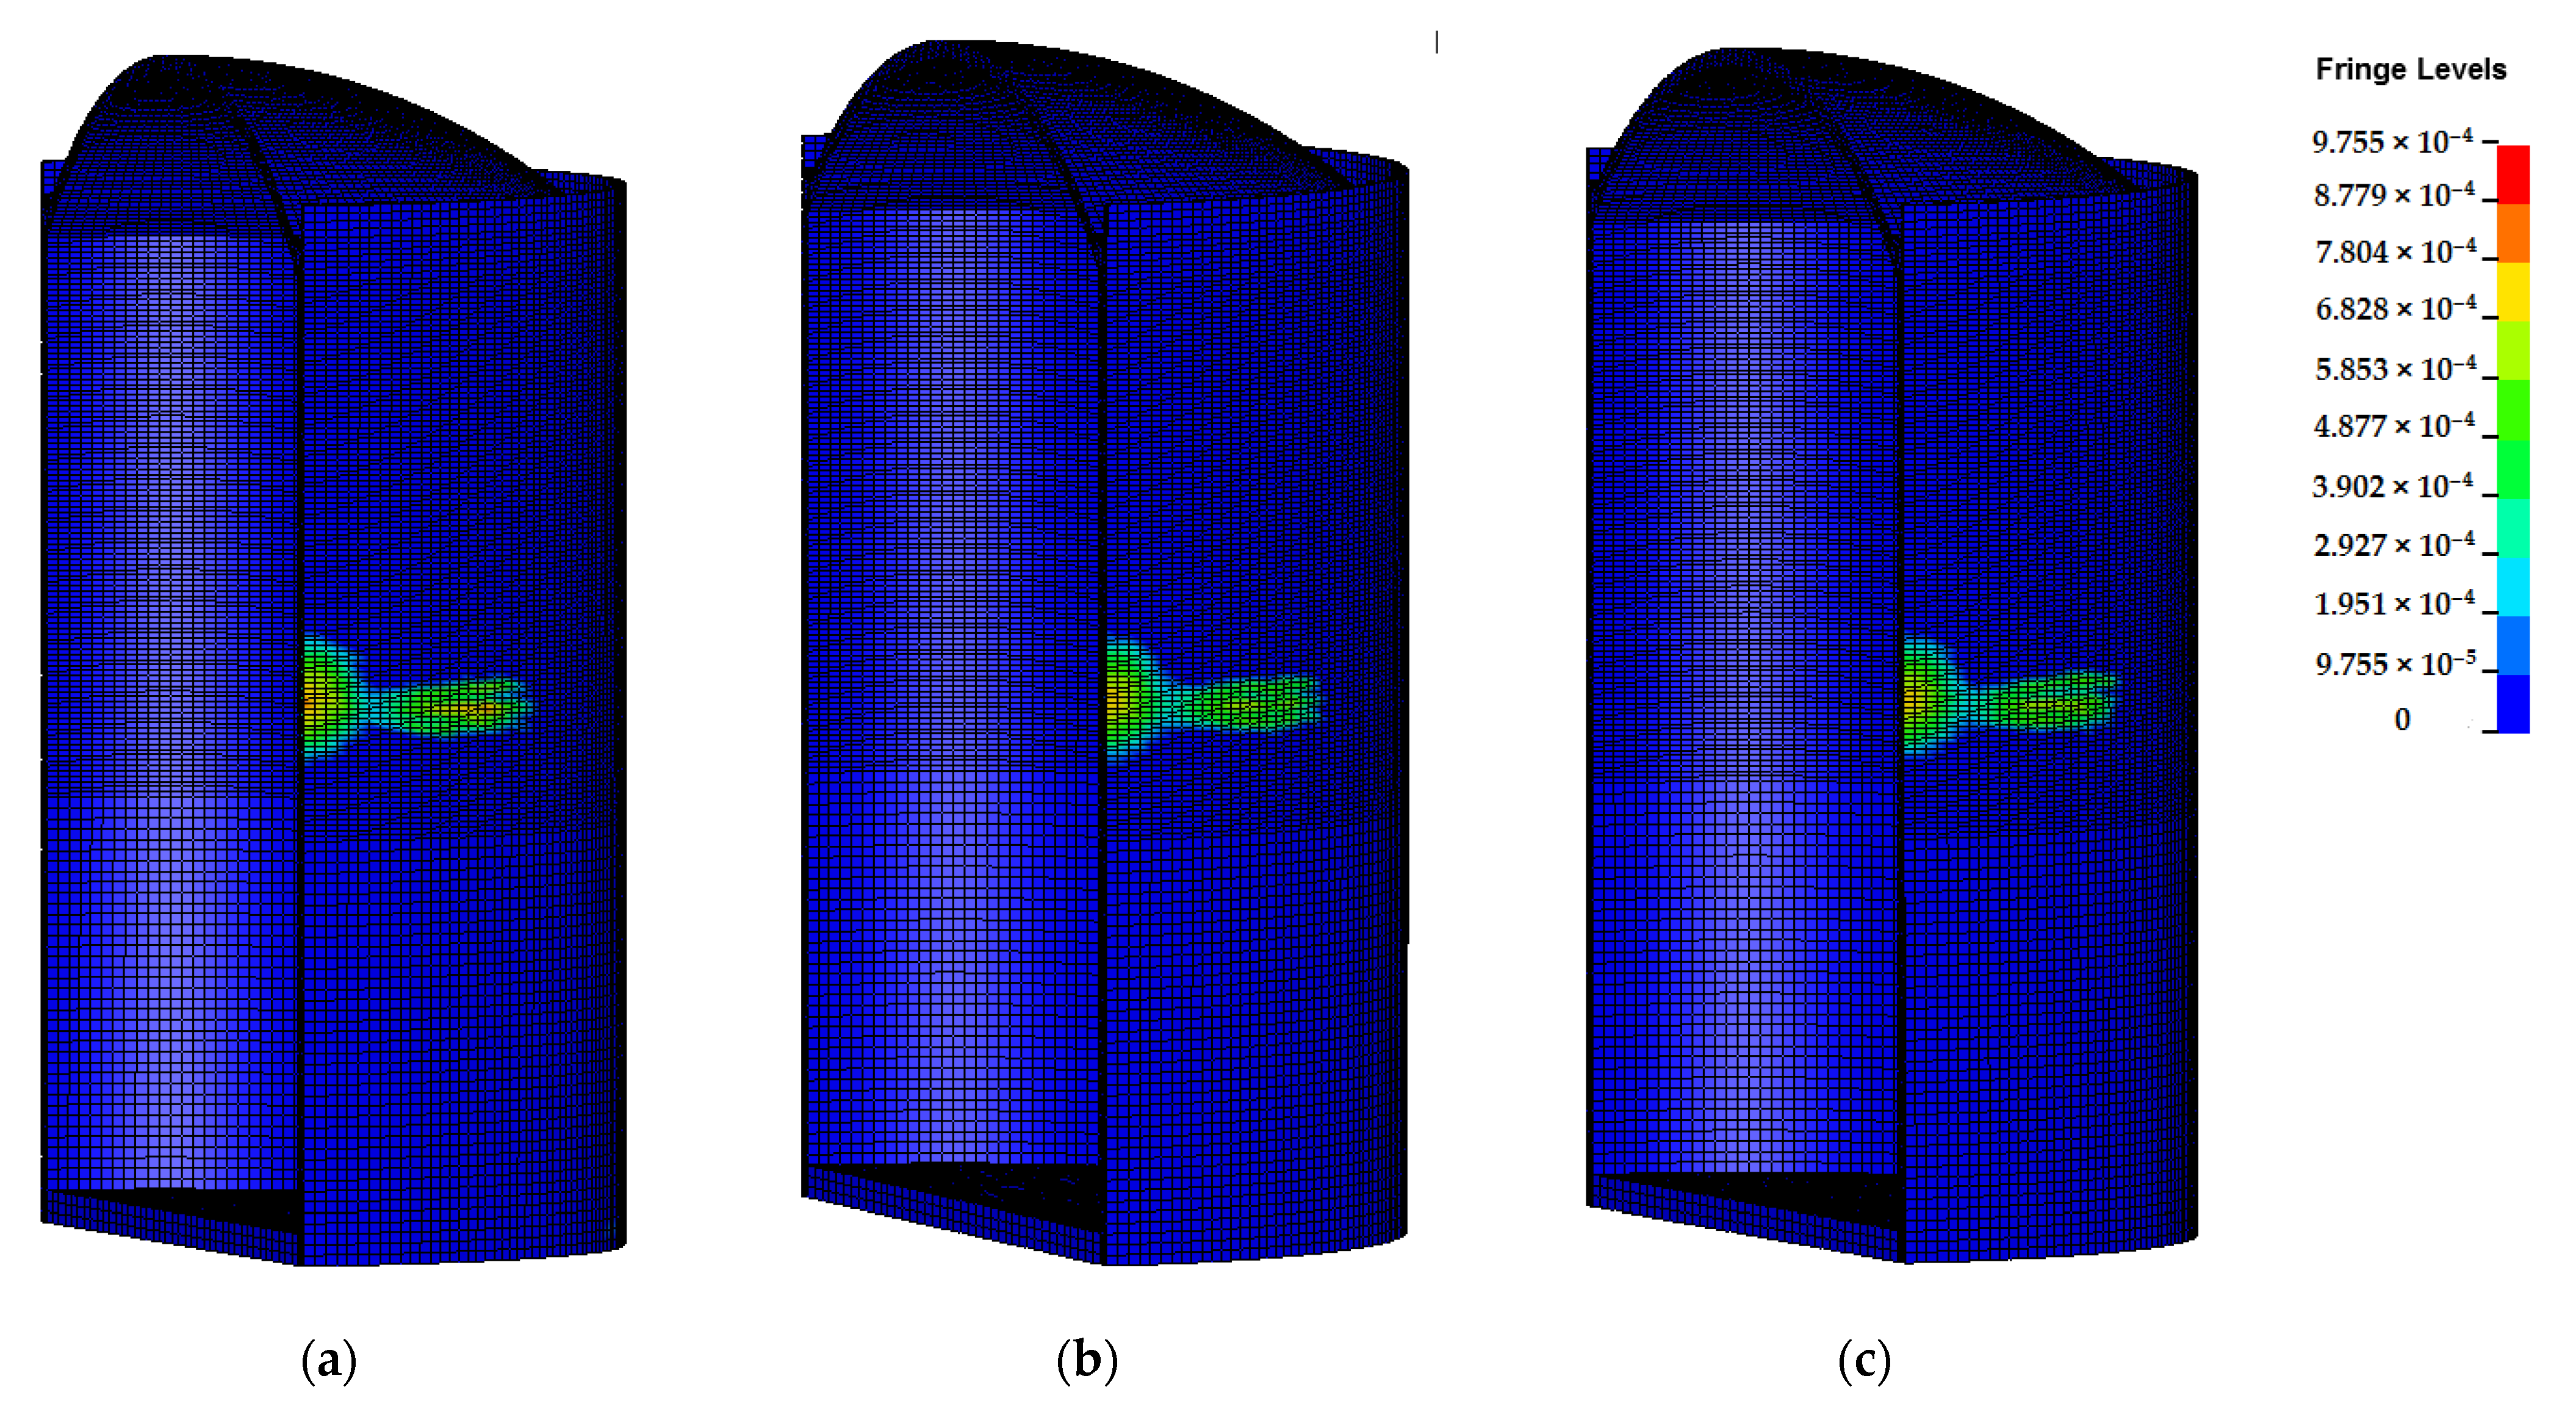
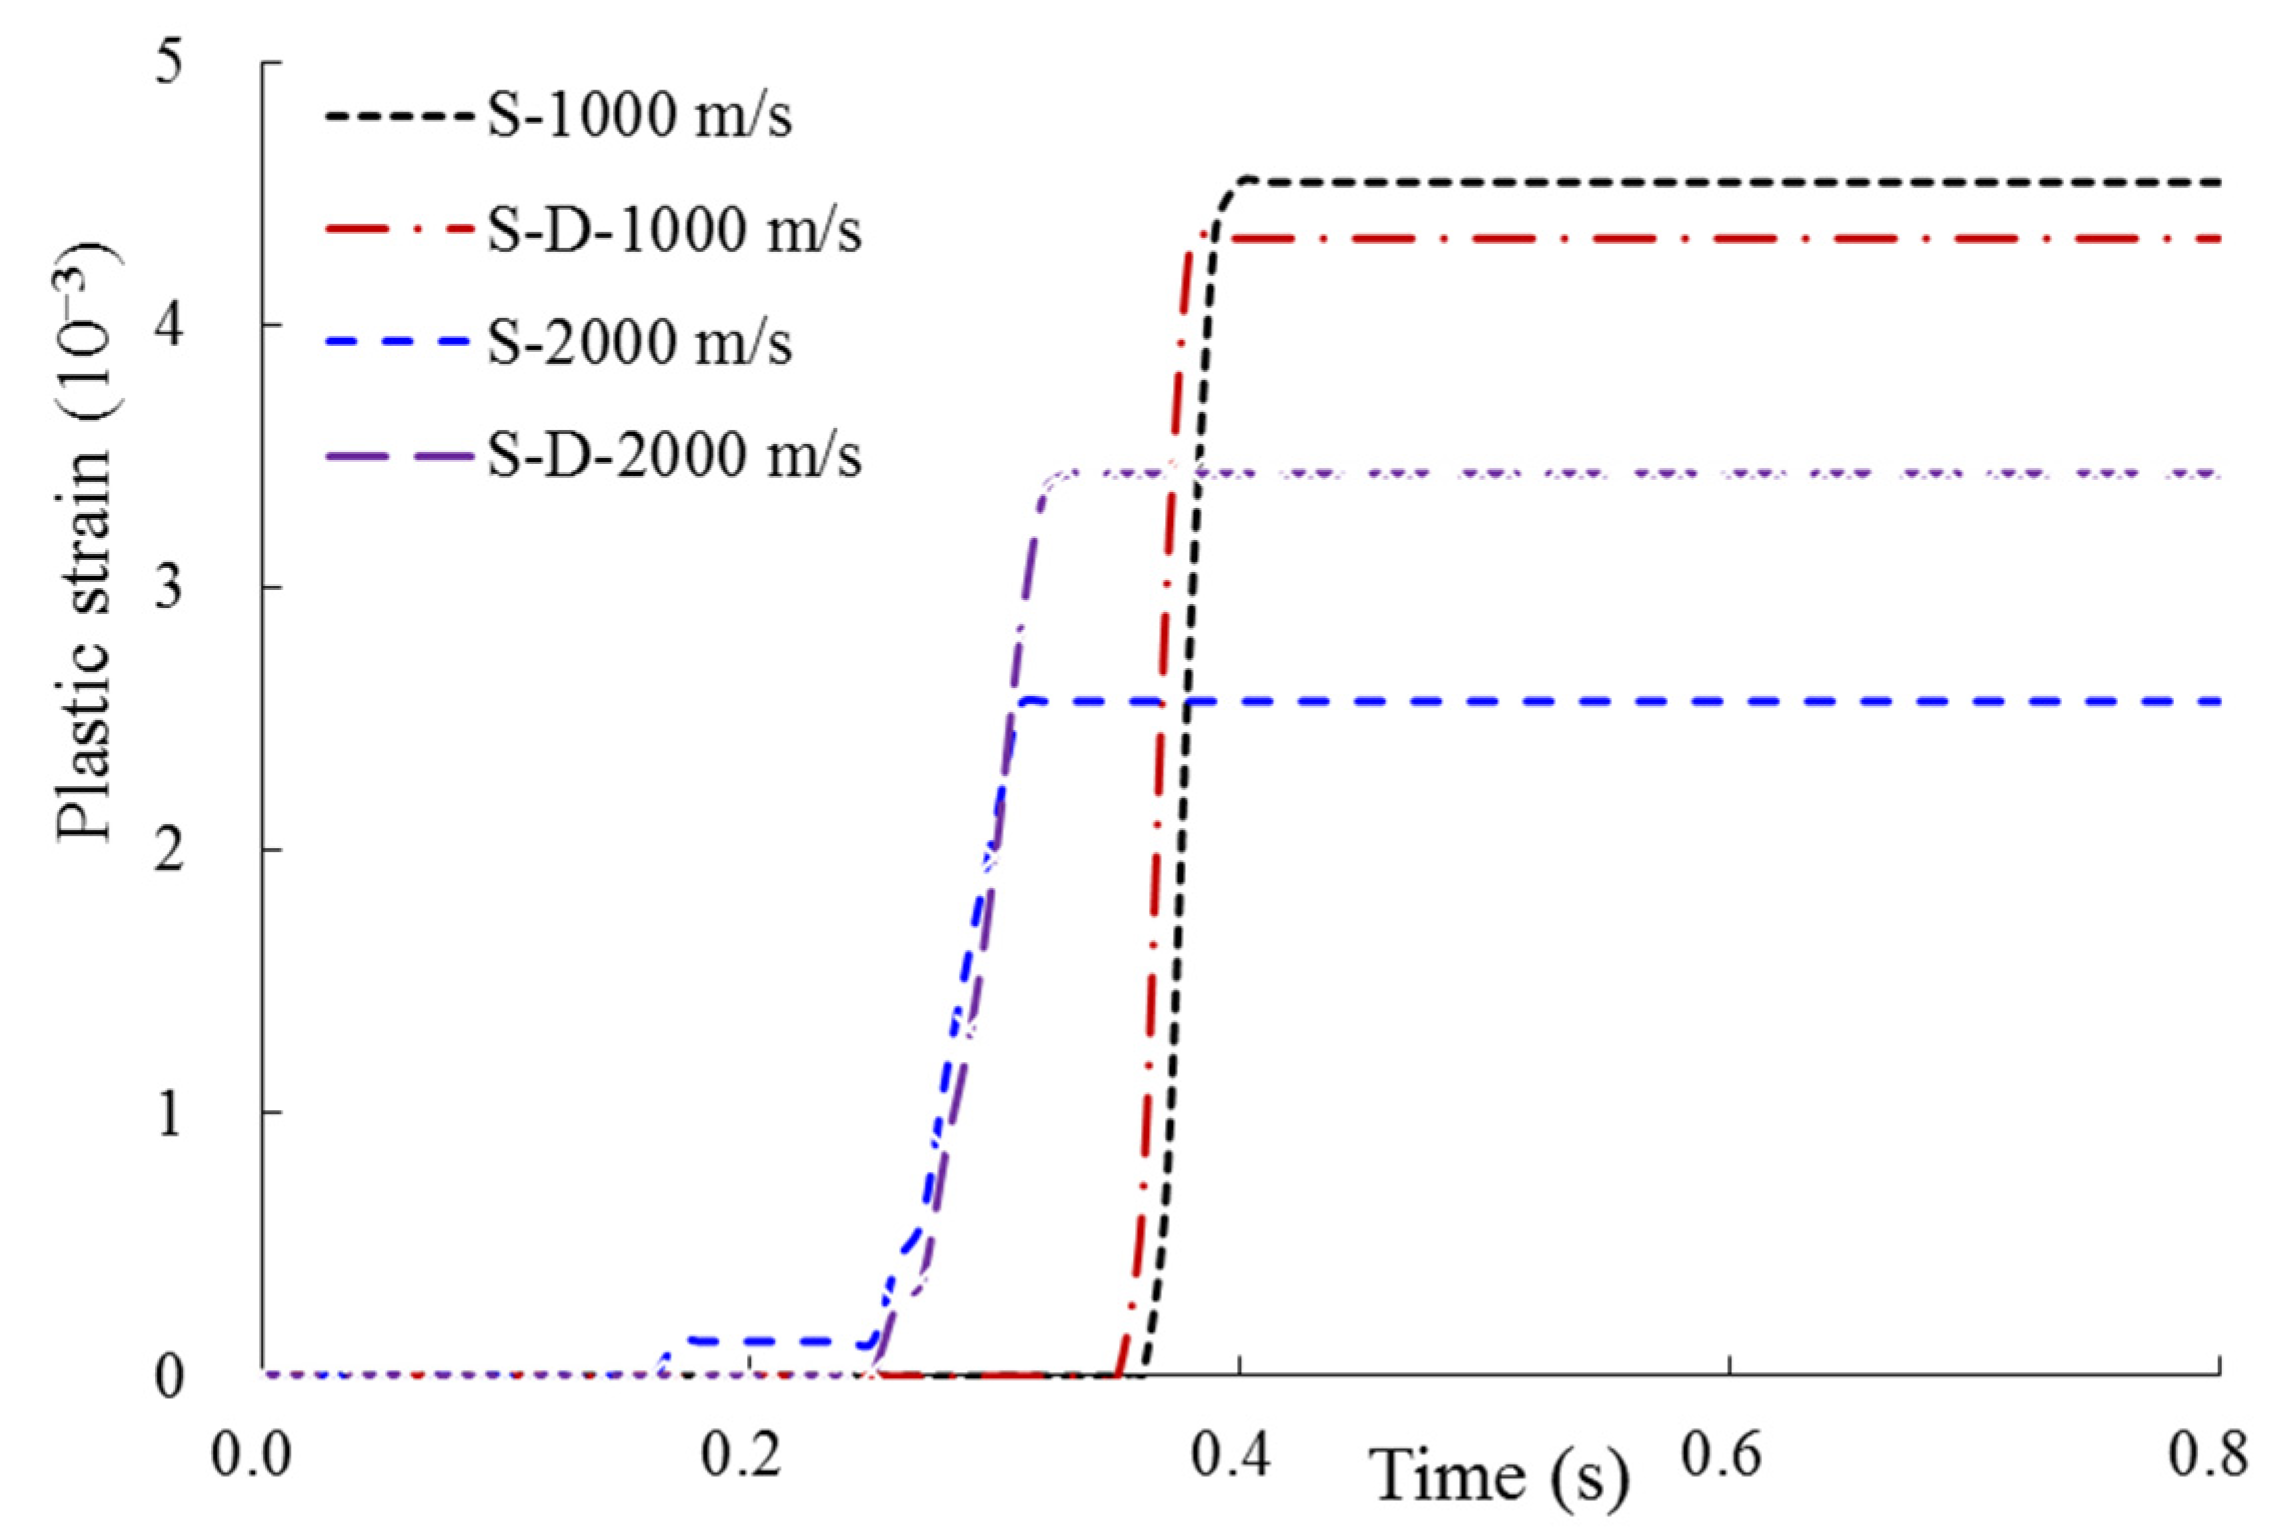
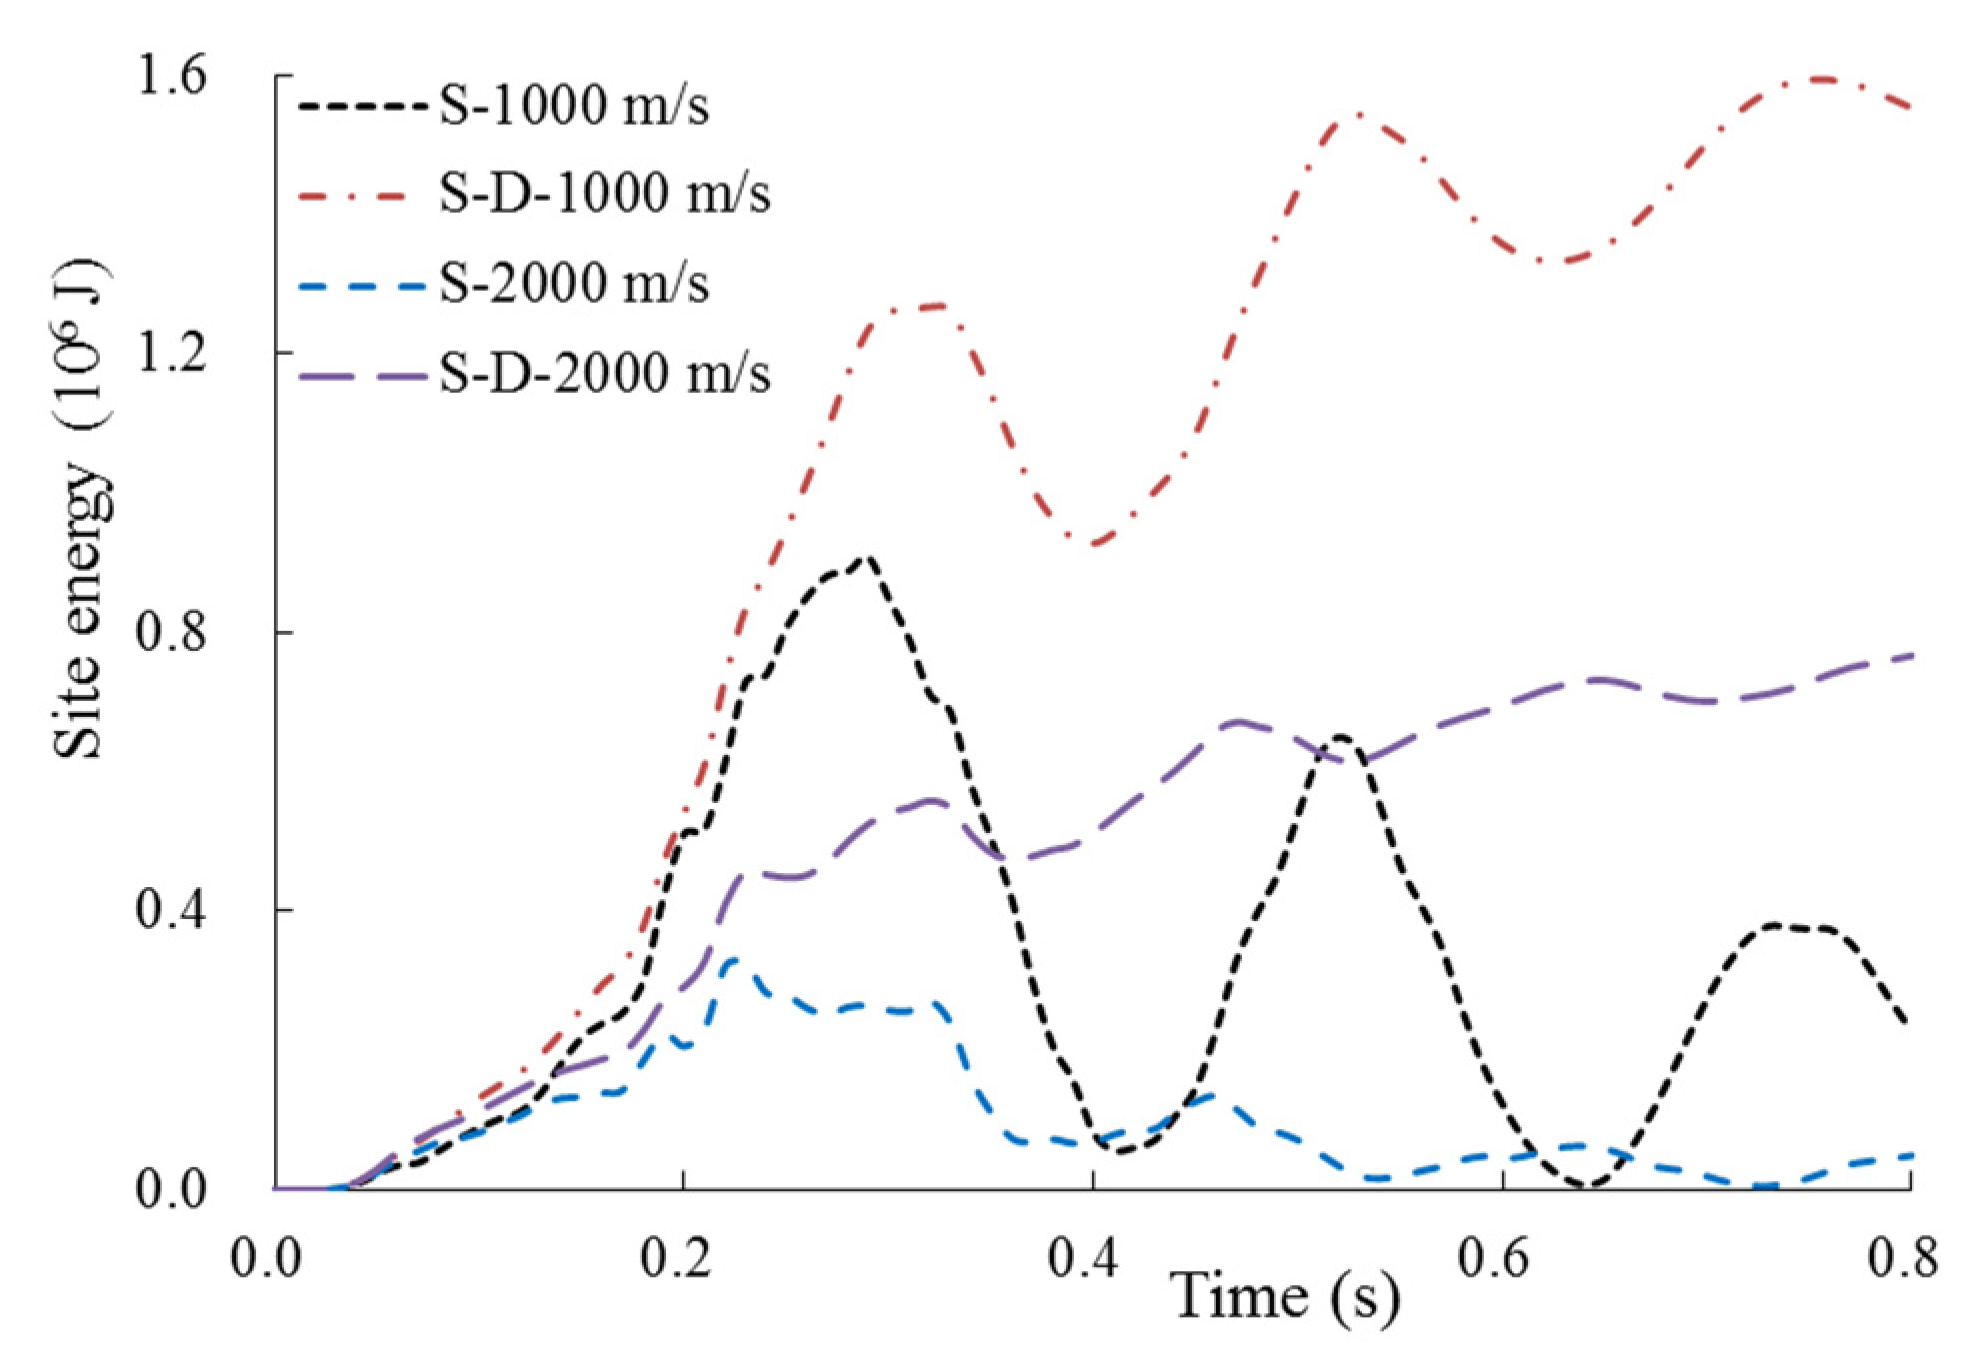
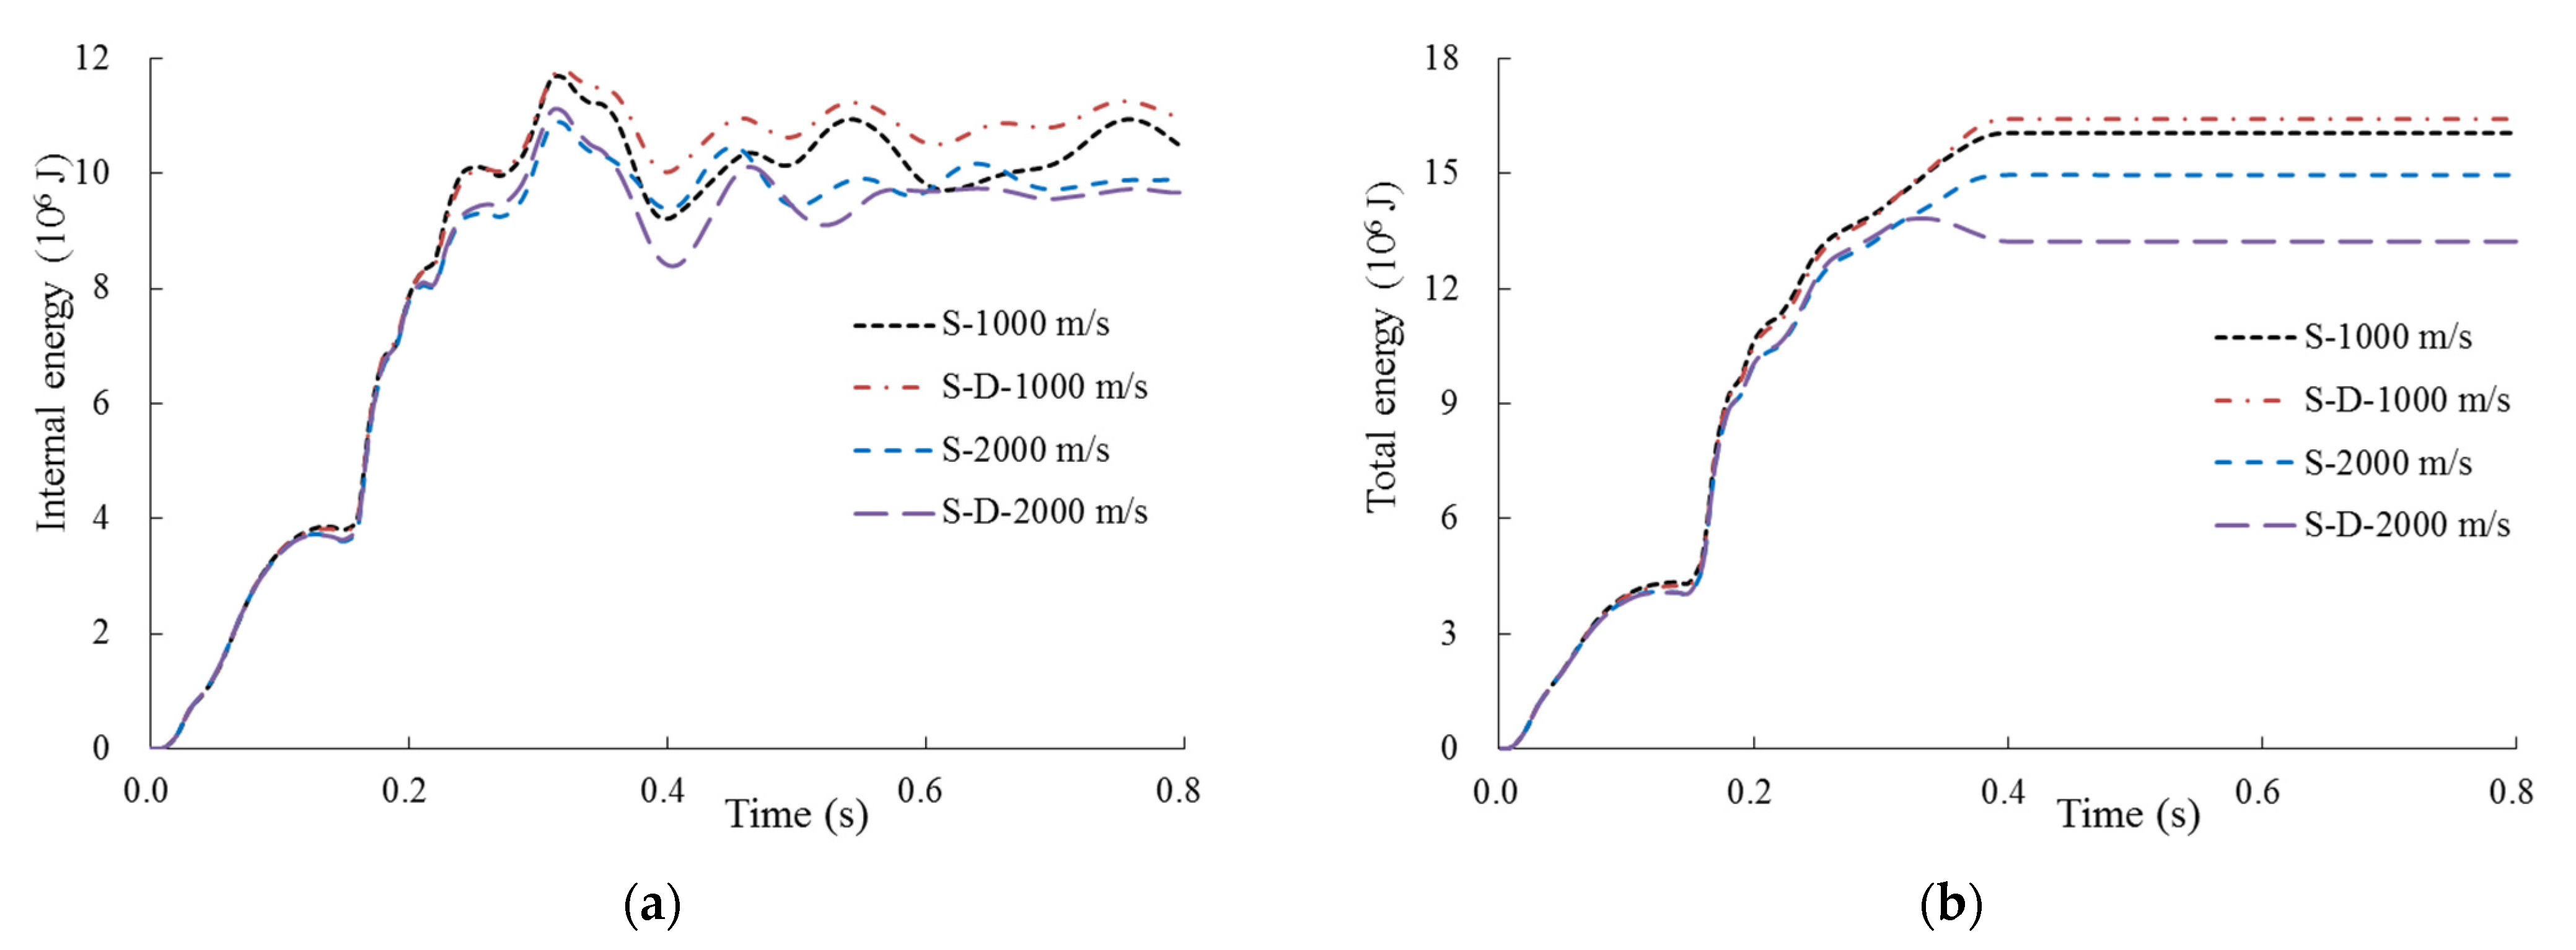
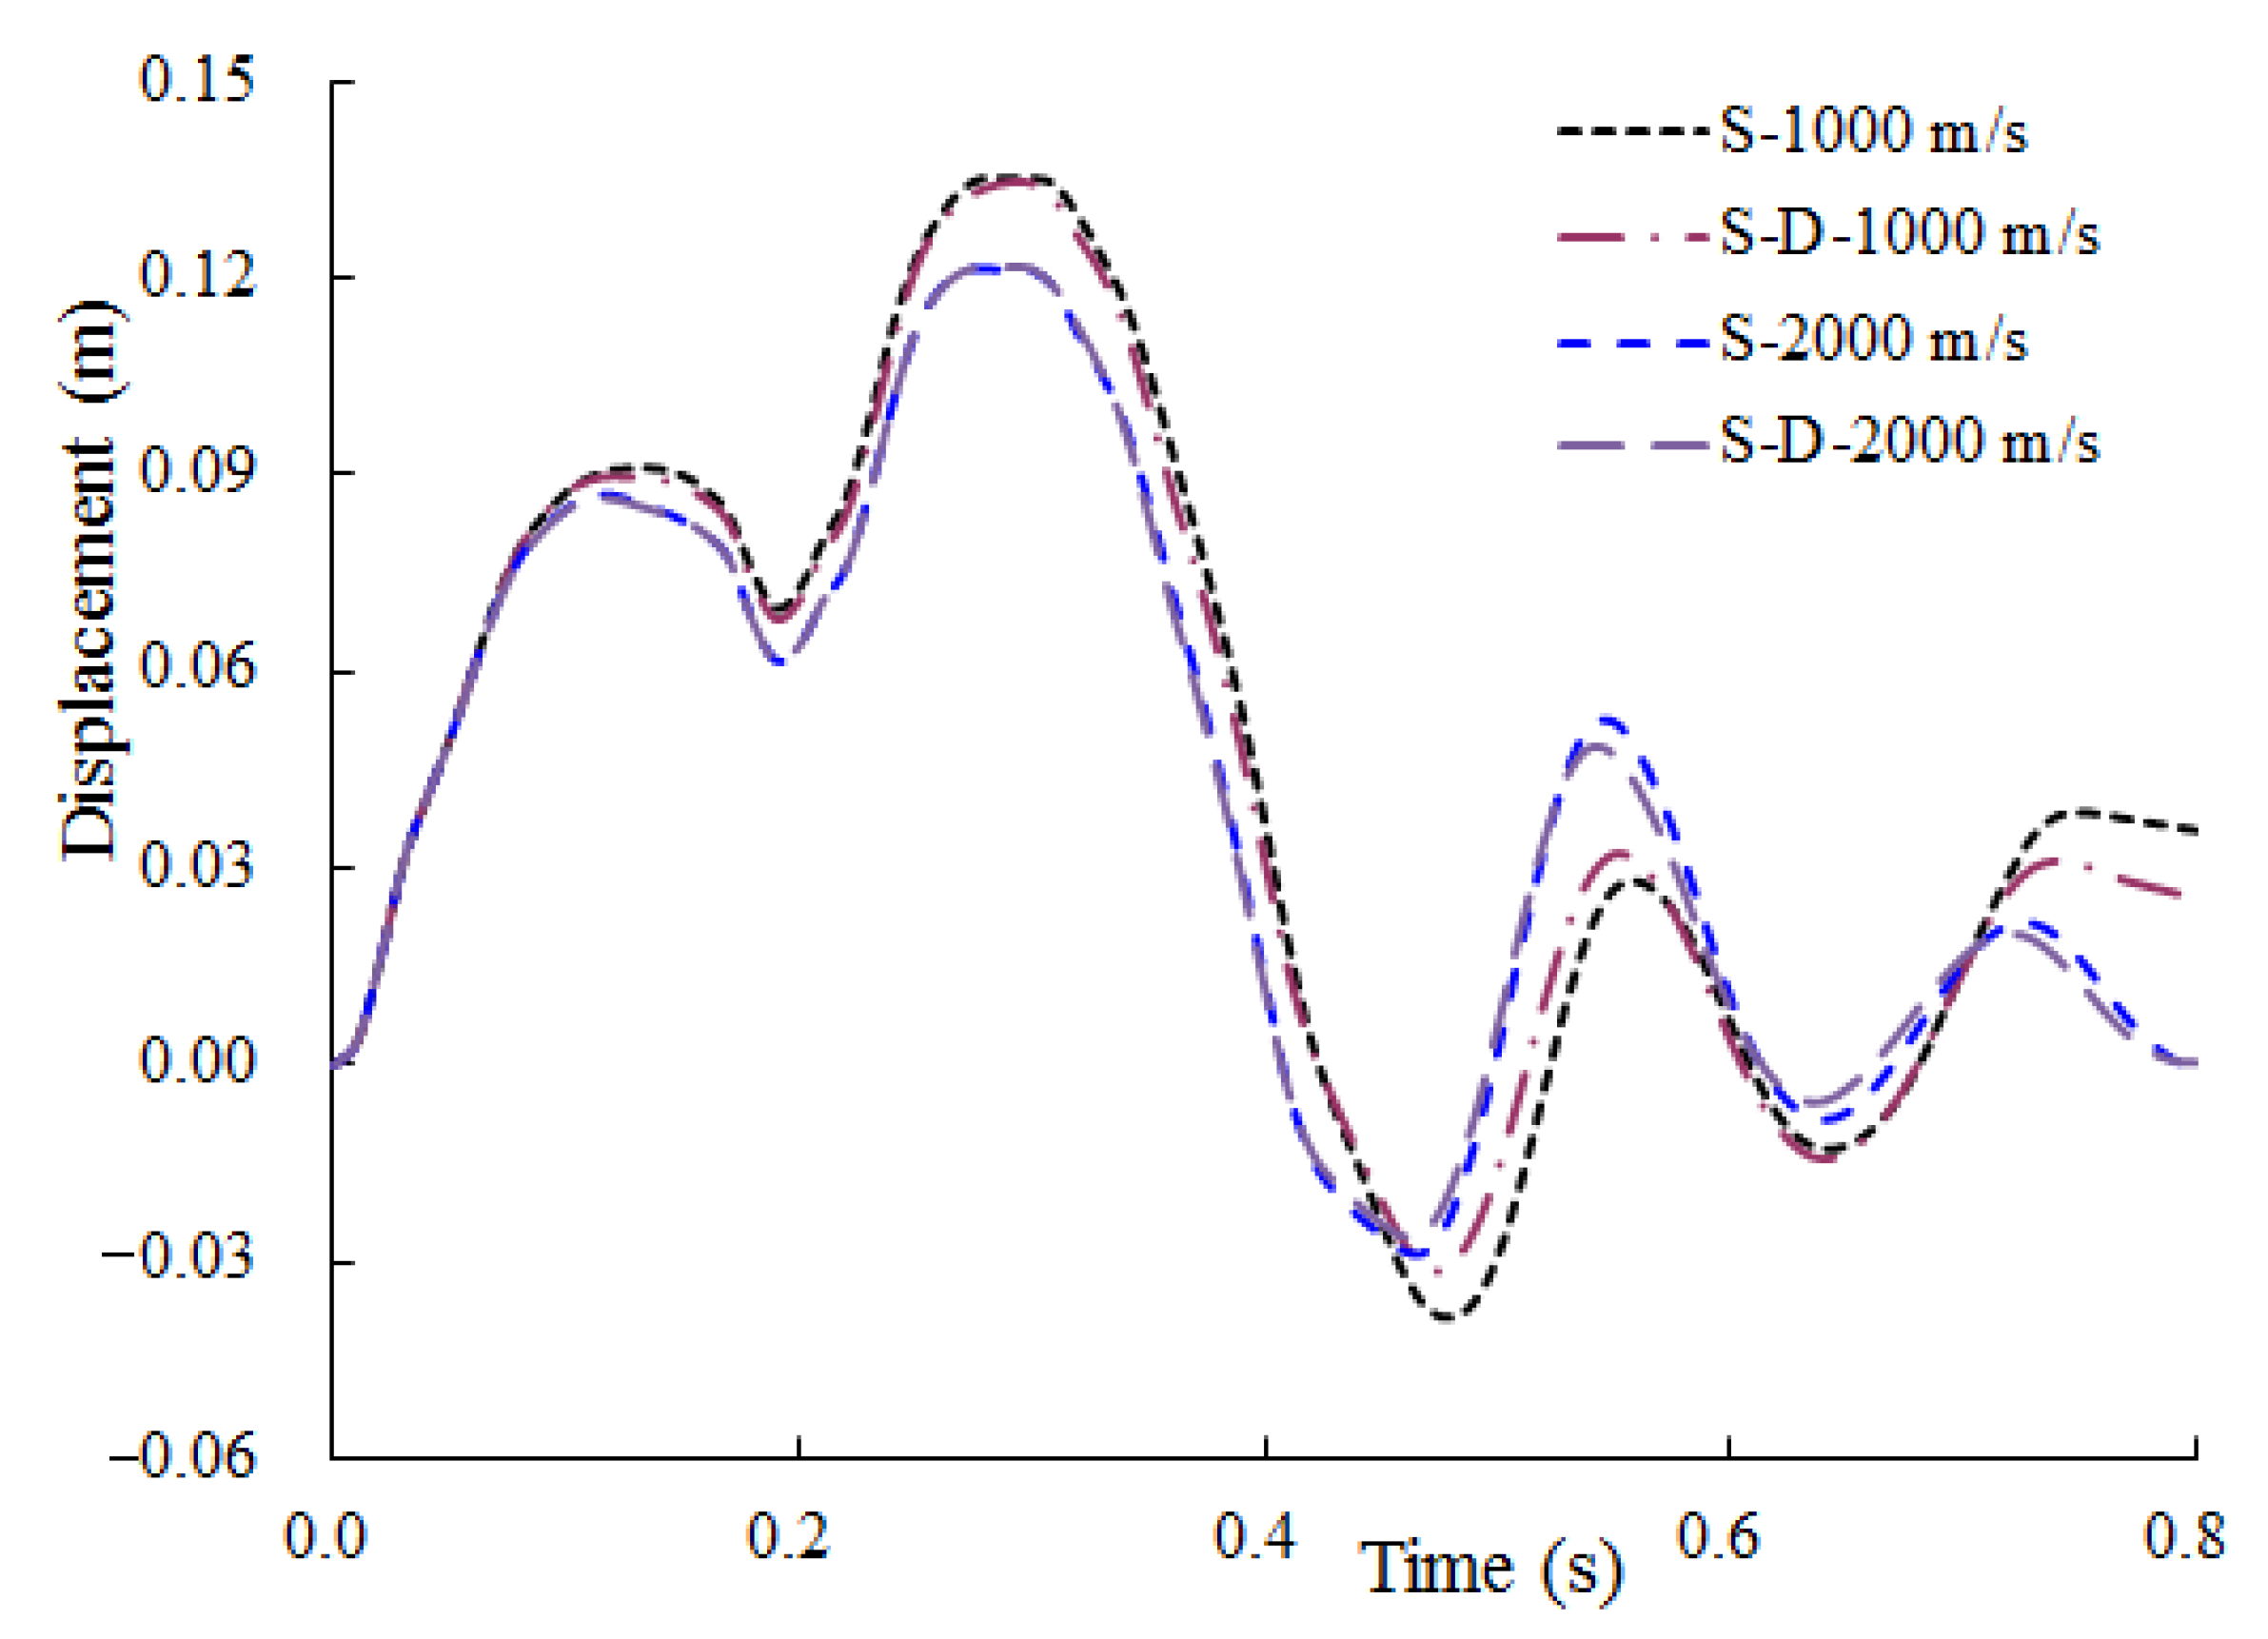
For the relatively thin full SC containment, the damping effect of the site has a significant effect on the structural impact response (i.e., displacement, plastic strain, and local concrete damage). Nevertheless, the impact response of the thicker containment is slightly influenced by the site damping effect, especially for the impact displacement.
(4)
For the impact analysis of the structures of NPPs against a large commercial aircraft, it is suggested that both the specific site condition and fixed boundary should be considered. The reason is that for different site conditions, the impact response calculated by assuming the fixed constraint is not necessarily conservative.

Author Contributions

Conceptualization, X.Z. and G.L.; methodology, X.Z. and J.L.; software, X.Z.; validation, X.Z.; writing—original draft preparation, X.Z. and J.L.; writing—review and editing, G.L. and R.P.; data curation, L.L. All authors have read and agreed to the published version of the manuscript.

Funding

This research was funded by the National Science and Technology Major Project of advanced technology research on structural health inspection and evaluation of nuclear power plants (grant no. 2018ZX06002008). This financial support is gratefully acknowledged.

Institutional Review Board Statement

Not applicable.

Data Availability Statement

Not applicable.

Conflicts of Interest

The authors declare no conflict of interest.

References

  1. 10CFR50.150. Aircraft Impact Assessment; Nuclear Regulatory Commission: Washington, DC, USA, 2009. [Google Scholar]
  2. ERIN Engineering & Research. Methodology for Performing Aircraft Impact Assessments for New Plant Designs; NEI 07-13, Revision 8P; Nuclear Energy Institute: Walnut Creek, CA, USA, 2011. [Google Scholar]
  3. HAF102. Design Safety Regulations for Nuclear Power Plants; National Nuclear Safety Administration: Beijing, China, 2016. [Google Scholar]
  4. Riera, J.D. On the stress analysis of structures subjected to aircraft impact forces. Nucl. Eng. Des. 1968, 8, 415–426. [Google Scholar] [CrossRef]
  5. Abbas, H.; Paul, D.K.; Godbole, P.N.; Nayak, G.C. Reaction-time response of aircraft crash. Comput. Struct. 1995, 55, 809–817. [Google Scholar] [CrossRef]
  6. Arros, J.; Doumbalski, N. Analysis of aircraft impact to concrete structures. Nucl. Eng. Des. 2007, 237, 1241–1249. [Google Scholar] [CrossRef]
  7. Sugano, T.; Tsubota, H.; Kasai, Y.; Koshika, N.; Orui, S.; Von Riesemann, W.A.; Bickel, D.C.; Parks, M.B. Full scale aircraft impact test for evaluation of impact force. Nucl. Eng. Des. 1993, 140, 373–385. [Google Scholar] [CrossRef]
  8. Tennant, D.; Levine, H.; Mould, J.; Vaughan, D. Rapid evaluation of buildings and infrastructure to accidental and deliberate aircraft impact. Nucl. Eng. Des. 2014, 269, 142–148. [Google Scholar] [CrossRef]
  9. Zhang, T.; Wu, H.; Fang, Q.; Gong, Z.M. Influences of nuclear containment radius on the aircraft impact force based on the Riera function. Nucl. Eng. Des. 2015, 293, 196–204. [Google Scholar] [CrossRef]
  10. Jiang, H.; Chorzepa, M.G. Aircraft impact analysis of nuclear safety-related concrete structures: A review. Eng. Fail. Anal. 2014, 46, 118–133. [Google Scholar] [CrossRef]
  11. Lee, K.; Hanb, S.E.; Hong, J.-W. Analysis of impact of large commercial aircraft on a prestressed containment building. Nucl. Eng. Des. 2013, 265, 431–449. [Google Scholar] [CrossRef]
  12. Frano, R.L.; Forasassi, G. Preliminary evaluation of aircraft impact on a near term nuclear power plant. Nucl. Eng. Des. 2011, 241, 5245–5250. [Google Scholar] [CrossRef]
  13. Thai, D.K.; Kim, S.E. Safety assessment of a nuclear power plant building subjected to an aircraft crash. Nucl. Eng. Des. 2015, 293, 38–52. [Google Scholar] [CrossRef]
  14. Shin, S.S.; Hahm, D.; Park, T. Shock vibration and damage responses of primary auxiliary buildings from aircraft impact. Nucl. Eng. Des. 2016, 310, 57–68. [Google Scholar] [CrossRef]
  15. Mizuno, J.; Koshika, N.; Sawamoto, Y.; Niwa, N.; Suzuki, A.; Yamashita, T. Investigations on impact resistance of steel plate reinforced concrete barriers against aircraft impact Part 1: Test program and results. In Proceedings of the Transactions of the 18th International Conference on Structural Mechanics in Reactor Technology, Beijing, China, 7–12 August 2005; pp. 2566–2579. [Google Scholar]
  16. Mullapudi, T.; Summers, P.; Moon, I.-H. Impact analysis of steel plated concrete wall. Struct. Congr. 2012, 1881–1893. [Google Scholar] [CrossRef] [Green Version]
  17. Liu, J.; Han, P. Numerical analysis of a shield building subjected to a large commercial aircraft impact. Shock. Vib. 2018, 2018, 7854969. [Google Scholar]
  18. Sadiq, M.; Khaliq, W.; Ilyas, M.; Khushnood, R.A.; Khan, S.A.; Rong, P. Analysis of full-scale aircraft impact to reinforced concrete and steel plate reinforced concrete multiple barriers protecting nuclear power plants. Structures 2020, 27, 732–746. [Google Scholar] [CrossRef]
  19. Zhu, X.; Li, J.; Lin, G.; Pan, R.; Li, L. Sensitivity analysis of steel-plate concrete containment against a large commercial aircraft. Energies 2021, 14, 2829. [Google Scholar] [CrossRef]
  20. Huang, T.; Zhang, T.; Dong, Z.; Wu, H.; Fang, H. An analysis of the dynamic response of nuclear containment under the impact of a large commercial aircraft. J. Vib. Shock. 2018, 37, 8–14. [Google Scholar]
  21. Clough, R.W. Non-linear mechanisms in the seismic response of arch dams. In Proceedings of the International Research Conference Earthquake Engineering, Skopje, Yugoslavia, 30 June–3 July 1980; pp. 669–684. [Google Scholar]
  22. Deeks, A.J.; Randolph, M.F. Axisymmetric time-domain transmitting boundaries. J. Eng. Mech. 1994, 120, 25–42. [Google Scholar] [CrossRef]
  23. Liu, J.; Lu, Y. A direct method for analysis of dynamic soil-structure interaction. China Civ. Eng. J. 1998, 31, 55–64. [Google Scholar]
  24. Jean, W.; Lin, T.; Penzien, J. System parameters of soil foundations for time domain dynamic analysis. Earthq. Eng. Struct. Dyn. 1990, 19, 541–553. [Google Scholar] [CrossRef]
  25. ASCE STANDARD, 4-98. Seismic Analysis of Safety-Related Nuclear Structures and Commentary; American Society of Civil Engineers: Reston, VA, USA, 1998. [Google Scholar]
  26. Ls-Dyna LSTC. LS-DYNA Keyword User’s Manual; Livermore Software Technology Corporation (LSTC): Livermore, CA, USA, 2010. [Google Scholar]
  27. Ottosen, N.S. Failure and Elasticity of Concrete; Danish Atomic Energy Commission; RISOE: Roskilde, Denmark, 1975; ISBN 8755003540. [Google Scholar]
  28. Sadiq, M.; Yun, Z.X.; Rong, P. Simulation analysis of impact tests of steel plate reinforced concrete and reinforced concrete slabs against aircraft impact and its validation with experimental results. Nucl. Eng. Des. 2014, 273, 653–667. [Google Scholar] [CrossRef]
  29. Tsubota, H.; Koshika, N.; Mizuno, J.; Sanai, M.; Peterson, B.; Saito, H.; Imamura, A. Scale model tests of multiple barriers against aircraft impact: Part 1. Experimental program and test results. In Proceedings of the Transactions of the 15th International Conference on Structural Mechanics in Reactor Technology (SMiRT-15), Seoul, Korea, 15–20 August 1999. [Google Scholar]
Figure 1. The impact force time-history function of Boeing 747 [20].
Energies 14 04957 g001
Figure 2. The impact pressure time-history function of fuselage and wing [20].
Energies 14 04957 g002
Figure 3. FE model of full SC containment considering the site condition. (a) Overall model. (b) Load area. (c) Distribution of COMBIN 165.
Energies 14 04957 g003
Figure 4. Crash zone of fuselage and wing.
Energies 14 04957 g004
Figure 5. Contours of the maximum impact displacement and concrete peeling off area of full SC containment. (a) Vs = 1000 m/s. (b) Vs = 1500 m/s. (c) Vs = 2000 m/s. (d) Vs = 2500 m/s. (e) Vs = 3000 m/s. (f) FIXED.
Energies 14 04957 g005
Figure 6. Max displacement time-histories of containment.
Energies 14 04957 g006
Figure 7. Max plastic strain time-histories of steel plate.
Energies 14 04957 g007
Figure 8. The spring-damper energy, internal energy, and total energy of containment for different site conditions. (a) Spring-damper energy. (b) Internal energy. (c) Total energy.
Energies 14 04957 g008
Figure 9. Max displacement time-histories of containment.
Energies 14 04957 g009
Figure 10. Max plastic strain time-histories of concrete.
Energies 14 04957 g010
Figure 11. Contours of the maximum plastic strain of concrete of full SC containment for different site conditions. (a) Vs = 1000 m/s. (b) Vs = 1500 m/s. (c) Vs = 2000 m/s. (d) Vs = 2500 m/s. (e) Vs = 3000 m/s. (f) FIXED.
Energies 14 04957 g011aEnergies 14 04957 g011b
Figure 12. The spring-damper energy, internal energy, and total energy of containment for different site conditions. (a) Spring-damper energy. (b) Internal energy. (c) Total energy.
Energies 14 04957 g012
Figure 13. Contours of the maximum impact displacement and concrete peeling off area of full SC containment. (a) Vs = 1000 m/s. (b) Vs = 2000 m/s.
Energies 14 04957 g013
Figure 14. The internal energy time-histories of concrete.
Energies 14 04957 g014
Figure 15. Max displacement time-histories of containment.
Energies 14 04957 g015
Figure 16. Max plastic strain time-histories of steel plate.
Energies 14 04957 g016
Figure 17. The spring-damper energy and spring energy for the sites of Vs = 1000 and 2000 m/s.
Energies 14 04957 g017
Figure 18. The internal energy and total energy of containment for the sites of Vs = 1000 and 2000 m/s. (a) Internal energy. (b) Total energy.
Energies 14 04957 g018
Figure 19. Max displacement time-histories of containment.
Energies 14 04957 g019
Figure 20. Max plastic strain time-histories of concrete.
Energies 14 04957 g020
Figure 21. The spring-damper energy and spring energy for the sites of Vs = 1000 and 2000 m/s.
Energies 14 04957 g021
Figure 22. The internal energy and total energy of containment for the sites of Vs = 1000 and 2000 m/s. (a) Internal energy. (b) Total energy.
Energies 14 04957 g022
Table 1. Material properties and the corresponding lumped spring stiffness and damping coefficient of different sites.
Shear Wave Velocity (m/s)Dynamic Shear Modulus (GPa)Poisson’s RatioDensity
(kg/m3)
K H
(N/m)
K V
(N/m)
C H
(N.s/m)
C V
(N.s/m)
10002.100.3421002.653 × 10113.258 × 10113.912 × 1097.090 × 109
15004.950.3222006.210 × 10117.454 × 10116.105 × 1091.081 × 1010
20009.600.3124001.201 × 10121.425 × 10128.851 × 1091.550 × 1010
250015.630.3025001.948 × 10122.286 × 10121.149 × 10101.989 × 1010
300024.300.2827003.011 × 10123.456 × 10121.480 × 10102.507 × 1010
Table 2. Material properties of concrete.
Density (kg/m3)Young’s Modulus (GPa)Poisson’s RatioCompressive Strength (MPa)Tensile Strength (MPa)Aggregate Radius (mm)
2400350.246.73.815
Table 3. Material properties of steel plate.
Density
(kg/m3)
Young’s Modulus
(GPa)
Poisson’s RatioYield Strength
(MPa)
78002060.3430
Table 4. The peak displacement, plastic strain, spring-damper energy, internal energy, and total energy.
SitesDisplacement (cm)Plastic StrainSpring-Damper Energy (J)Internal Energy (J)Total Energy (J)
Vs = 1000 m/s37.214.328 × 10−31.594 × 10611.799 × 10616.420 × 106
Vs = 1500 m/s38.538.861 × 10−30.978 × 10611.143 × 10616.105 × 106
Vs = 2000 m/s20.703.433 × 10−30.767 × 10611.081 × 10613.227 × 106
Vs = 2500 m/s32.834.967 × 10−30.509 × 10610.865 × 10615.319 × 106
Vs = 3000 m/s24.969.553 × 10−30.374 × 10610.680 × 10613.885 × 106
FIXED41.039.867 × 10−3/10.835 × 10615.795 × 106
Table 5. The peak displacement, plastic strain, spring-damper energy, internal energy, and total energy.
SitesDisplacement (cm)Plastic StrainSpring-Damper Energy (J)Internal Energy (J)Total Energy (J)
Vs = 1000 m/s13.470.975 × 10−31.553 × 1068.841 × 10610.489 × 106
Vs = 1500 m/s12.750.811 × 10−31.009 × 1068.312 × 10610.044 × 106
Vs = 2000 m/s12.180.839 × 10−30.748 × 1067.992 × 1069.751 × 106
Vs = 2500 m/s11.920.856 × 10−30.554 × 1067.807 × 1069.550 × 106
Vs = 3000 m/s11.770.905 × 10−30.412 × 1067.684 × 1069.420 × 106
FIXED11.520.927 × 10−3/5.806 × 1069.109 × 106
Publisher’s Note: MDPI stays neutral with regard to jurisdictional claims in published maps and institutional affiliations.

