Article

Uncertainty and Sensitivity Analysis of the In-Vessel Hydrogen Generation for Gen-III PWR and Phebus FPT-1 with MELCOR 2.2

1
Institute of Heat Engineering, Warsaw University of Technology, Nowowiejska 21/25, 00-665 Warsaw, Poland
2
National Atomic Energy Agency, Bonifraterska 17, 00-203 Warsaw, Poland
*
Author to whom correspondence should be addressed.
Energies 2021, 14(16), 4884; https://doi.org/10.3390/en14164884
Submission received: 31 May 2021 / Revised: 21 July 2021 / Accepted: 22 July 2021 / Published: 10 August 2021
(This article belongs to the Special Issue Design and Safety Issues of Nuclear Plants and Installations)

Abstract

:
In this study, uncertainty and sensitivity analyses were performed with MELCOR 2.2.18 to study the hydrogen generation (figure-of-merit (FoM)) during the in-vessel phase of a severe accident in a light water reactor. The focus of this work was laid on a large generation-III pressurized water reactor (PWR) and a double-ended hot leg (HL) large break loss of coolant accident (LB-LOCA) without a safety injection (SI). The FPT-1 Phebus integral experiment emulating LOCA was studied, where the experiment outcomes were applied for the plant scale modelling. The best estimate calculations were supplemented with an uncertainty analysis (UA) based on 400 input-decks and Latin hypercube sampling (LHS). Additionally, the sensitivity analysis (SA) utilizing the linear regression and linear and rank correlation coefficients was performed. The study was prepared with a new open-source MELCOR sensitivity and uncertainty tool (MelSUA), which was supplemented with this work. The FPT-1 best-estimate model results were within the 10% experimental uncertainty band for the final FoM. It was shown that the hydrogen generation uncertainties in PWR were similar to the FPT-1, with the 95% percentile being covered inside a ~50% band and the 50% percentile inside a ~25% band around the FoM median. Two different power profiles for PWR were compared, indicating its impact on the uncertainty but also on the sensitivity results. Despite a similar setup, different uncertainty parameters impacted FoM, showing the difference between scales but also a significant impact of boundary conditions on the sensitivity analysis.

1. Introduction

1.1. Hydrogen during a Severe Accident

In the course of a severe accident (SA) in a light water reactor (LWR), large quantities of hydrogen gas can be generated. Prior to the reactor pressure vessel (RPV) failure, hydrogen is generated during core degradation because of the exothermic oxidation of core materials. The primary source is the interaction of zirconium, mainly from cladding, with steam by the exothermic reaction: Zr + 2H2O → 2H2 +ZrO2. Other less essential reactions are present, which generate some hydrogen–steam interaction with steel and steam reaction with control poison (e.g., B4C). After the RPV failure, hydrogen can be the product of various ex-vessel molten core concrete interactions (MCCI). In principle, it can also be generated by radiolysis of water. Hydrogen production is a problem for both pressurized water reactors (PWR) and boiling water reactors (BWR), as it was observed during the partial meltdown in Three Mile Island 2 and during a series of meltdowns in the Fukushima Daiichi plant [1,2,3].
In nuclear power plants (NPP) with PWR reactors, the hydrogen is a threat for safety barriers and especially containment buildings. It creates a risk of global hydrogen combustion (detonation or deflagration), which can compromise the containment integrity. This containment failure mode is traditionally called gamma mode [1,2,3]. Typically, to reduce the risk of gamma mode, special measures and devices are designed. In modern plants, dedicated engineering safety features (ESF) are applied, commonly passive autocatalytic recombiners (PARs), which consume hydrogen. In designs, devices like mixing dumpers, rupture foils, and fan coolers mix gases and reduce local hydrogen concentrations. Additionally, special spark plugs can be installed to burn gases in a controlled manner and avoid short, violent events. The recent advancement in LWR technology introduces innovative accident-tolerant fuels (ATF) with a lowered potential for hydrogen production and a high-temperature resistance, which reduces the hydrogen production or changes its dynamics [4]. Nevertheless, even if the risk of a global violent combustion in a containment can be reduced to a minimum, local hydrogen events cannot be entirely ruled out. However, all ESFs mentioned above also reduce the possibility of a local combustion. It can be considered a less severe threat, but still, it is an issue that has to be appropriately considered. Hydrogen non-violent combustion can be a source of additional heat, affecting different phenomena, e.g., radionuclides physics, and can change containment thermodynamic states, pressures, and temperatures and cause other loads. Even without combustion, hydrogen is non-condensable gas with a low specific volume, and it can accelerate containment pressurization. In the process of a plant design or as a part of safety studies, the evolution of the atmospheric composition during possible accidents should be studied carefully to predict and understand possible containment states.
After the Fukushima Daiichi accident, much attention was paid to study the hydrogen production process in all LWR reactors. Recently, several studies were published about the in-vessel progression and the hydrogen production during severe accidents, including analytical case studies, uncertainty studies, and sensitivity studies or crosswalks with different severe accident codes, e.g., [5,6,7,8,9,10,11,12,13]. A single severe accident integral code run provides deterministic results, which has to be treated with a large margin of confidence. It allows the estimation of different phenomena but cannot be trusted in the same way as typical DSA results provided by the thermal–hydraulic system codes for design basis analysis. It is the case even when best estimate parameters, computer codes, and mechanistic models are used. The complexity of phenomenology, modelling with several orders of magnitude difference in time scales, randomness, and a lack of knowledge in several aspects are significant. We have to remember that even relatively small initial disturbances can propagate with accident progression to substantial differences. It is one reason why severe accident studies with integral codes should be supplemented with uncertainty studies and sensitivity when possible. Nowadays, growing and easy access to cheap computational resources makes it possible.

1.2. Scope and Motivation

This study focused on NPPs with PWR reactors, and the scope was limited to a severe accident phase before the RPV failure (in-vessel phase). The hydrogen generation was studied for the FPT-1 experiment, and its outcomes were applied to the analysis of the PWR reactor with uncertainty and sensitivity analysis.
The motivation of this work was to evaluate the magnitude of the uncertainty in predictions of the in-vessel hydrogen generation and especially the impact of different MELCOR specific modelling parameters. Additionally, sensitivity computations based on the traditional first-order approach were performed to study the sources of these uncertainties. The observation supports that a large variation of hydrogen production can be found among different MELCOR references in the literature, and it may be confusing for analysts or researchers. What is more, a lower mass for PWR [14] or a larger mass for BWR [15,16] can be predicted, and results can vary when different code versions are used. The code typically produces a different hydrogen mass than other severe accident codes, especially MAAP code, and it commonly puzzles code users.
Another motivation of this work was to use the modelling approach for the integral scale Phebus FPT-1 experiment, data, and results to justify the assumptions and modelling strategy and to support the plant scale simulations. Moreover, the comparative analysis was executed to evaluate the differences between the PWR plant and the integral test scale results. In effect, the obtained results were based not only on code output and best practices, as it is a popular approach, but also on experimental data foundations. The uncertainty analysis allowed us to evaluate differences between the experiment and the plant scale hydrogen generation results when the same MELCOR physical modelling approach was utilized. The other outcome of this work is the benchmark of FPT-1 and the large gen-III PWR plant model for the recent MELCOR 2.2.18.
The second Phébus experiment, the FPT-1 test, was an integral experiment dedicated to studying severe accident phenomena in PWR reactors [17,18,19,20,21,22]. The experiment’s critical feature was a realistic representation of the fuel design details and a realistic progression of the core degradation and, in effect, the hydrogen production. Conditions during FPT-1 were similar to the hot leg loss of coolant accident, characterized by steam-rich and low-pressure conditions. A similar sequence was studied in this work for the PWR reactor.
This work was a part of a research effort, which had the ultimate goal to compare a more traditional uncertainty analysis approach (e.g., Wilks-based or Monte Carlo) with more sophisticated global methods, which allowed more detailed studies of uncertainty sources [23,24,25,26]. It was performed in the framework of the New Approach to Reactor Safety Improvements (NARSIS) Horizon-2020 research project [27].

2. Methodology

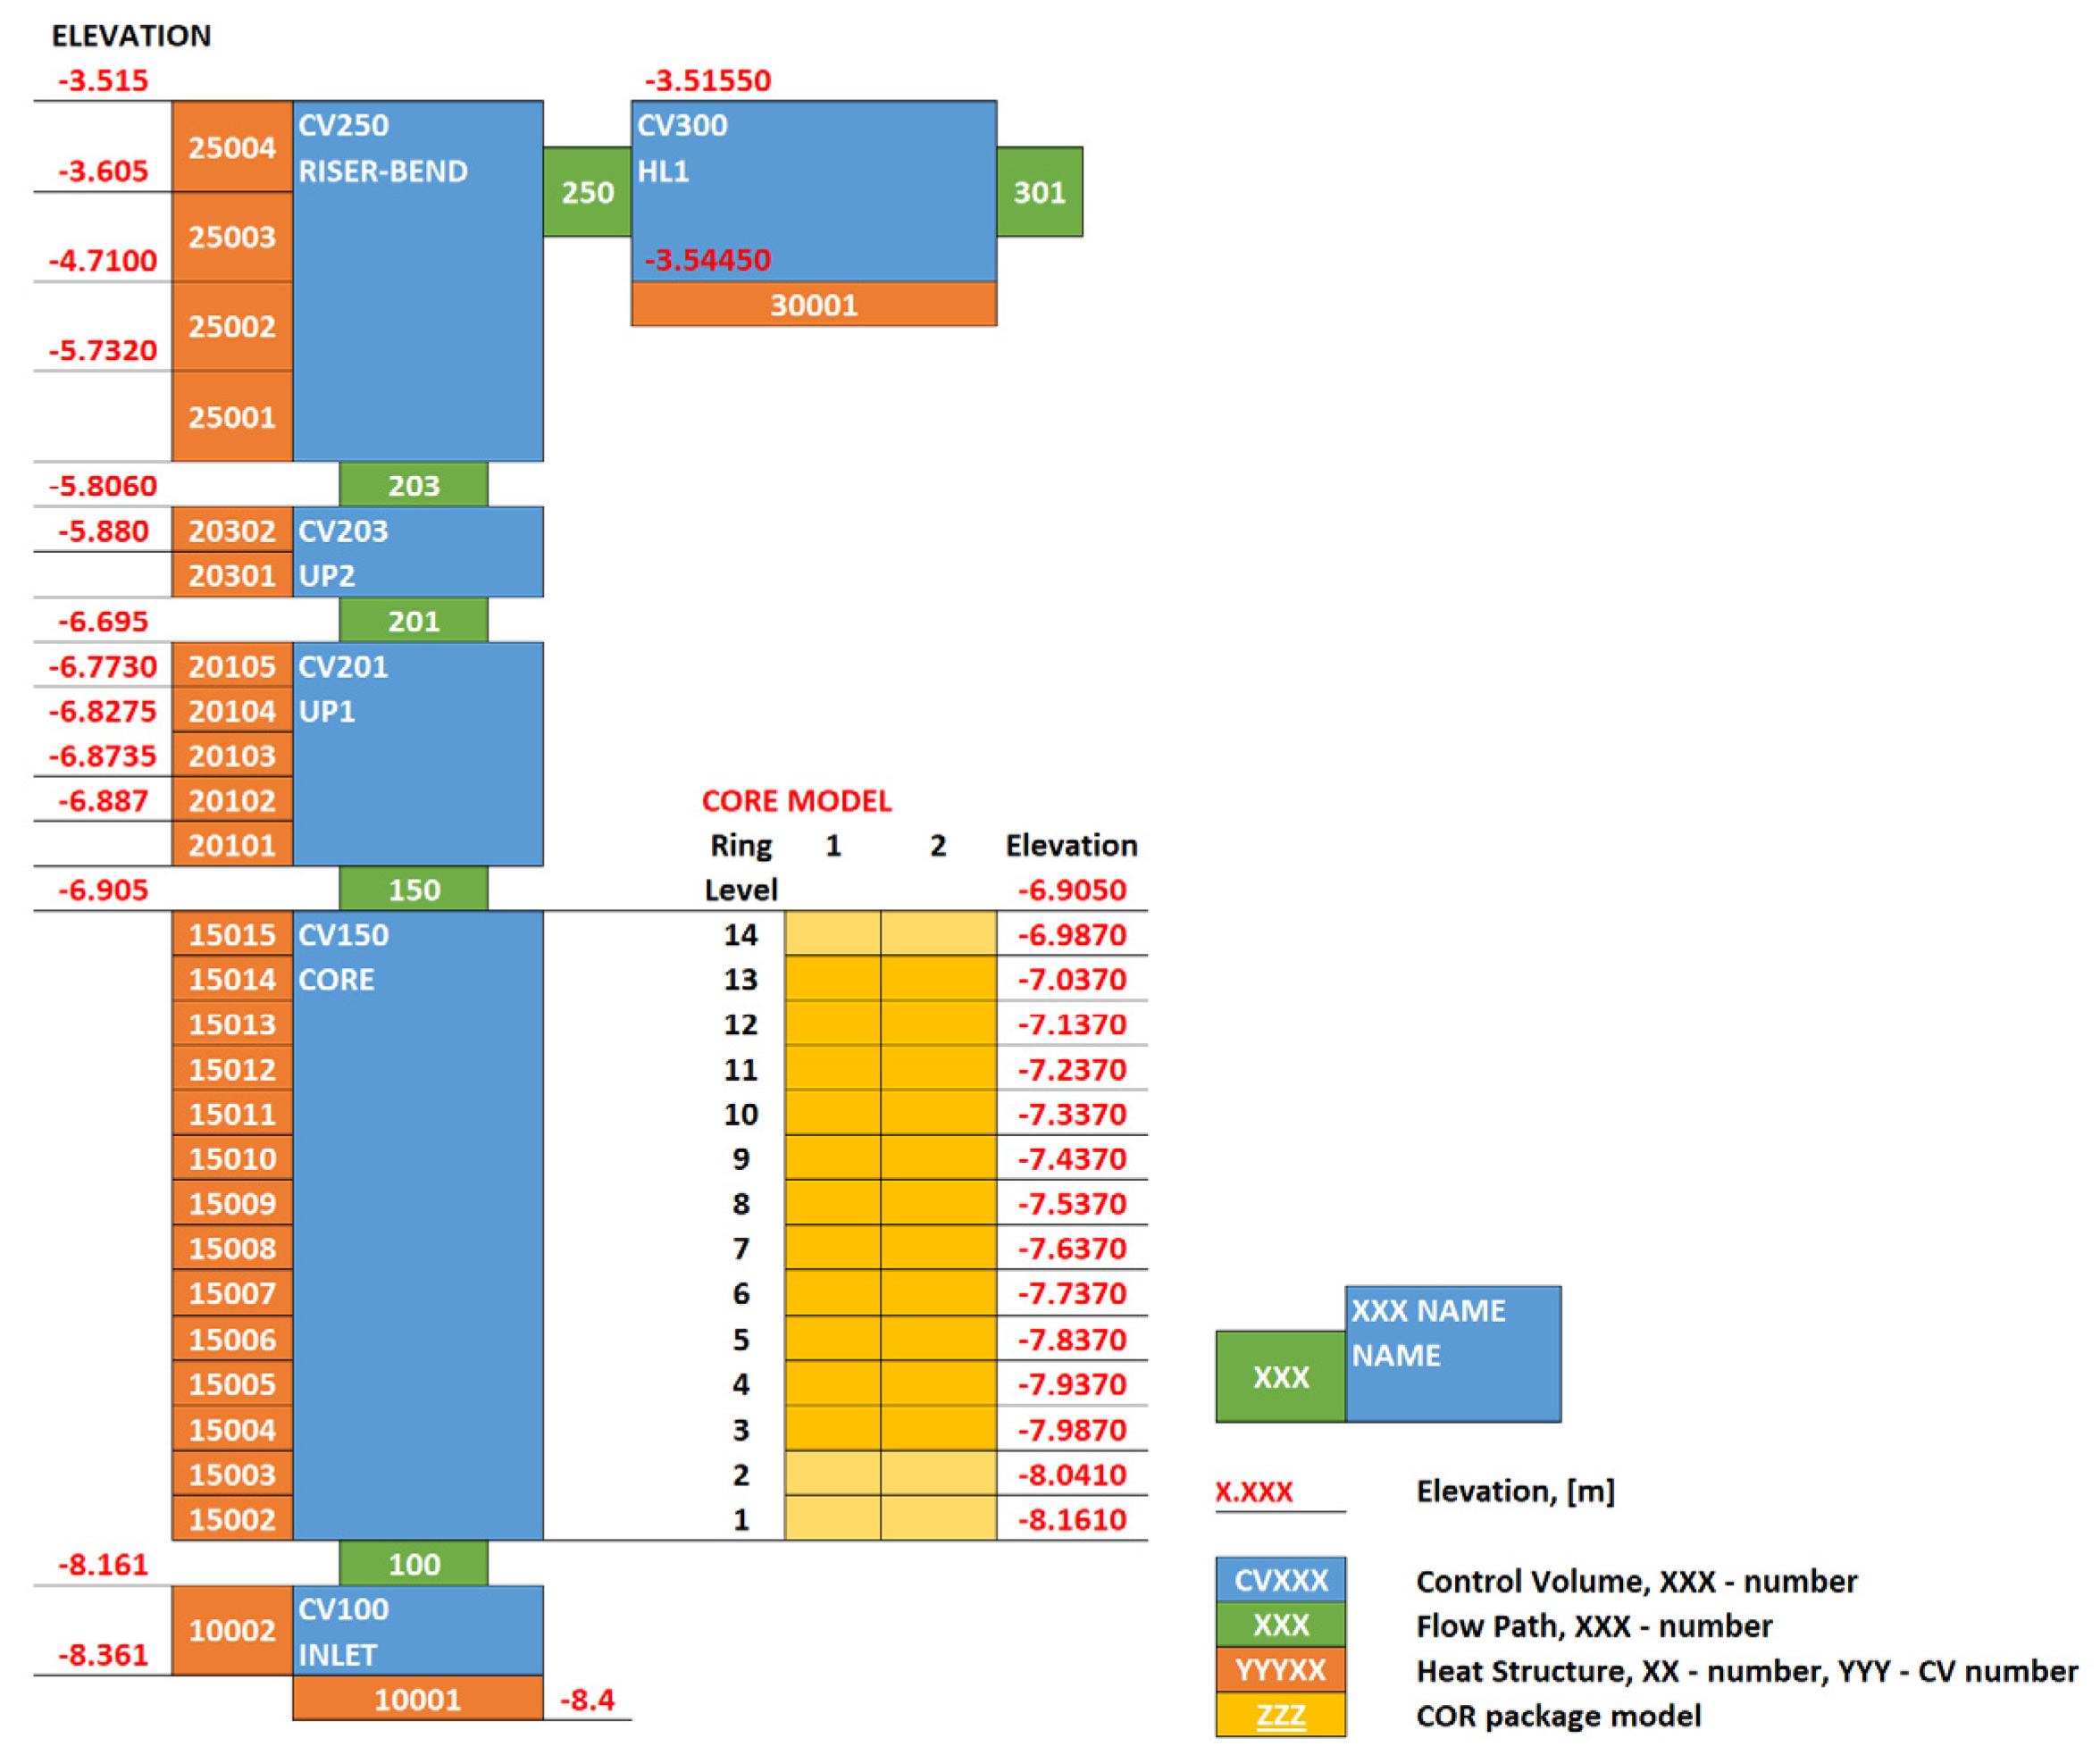
2.1. Phébus FPT-1 Model

The Phébus FPT-1 input deck was developed during previous research [28,29] and updated to be used with the recent MELCOR 2.2.18. The primary design data source was the ISP-46 report [30].
The model details are presented and discussed in [29] and are not reproduced in this article. Modifications were introduced, including modelling details for uncertainty parameters described in the following chapter and minor changes in the interactive model setup for eutectic reactions modelled with an MP_PRC card. The necessary modifications were the deactivation of the RN package and silver release model. The nodalization for the bundle section of the test apparatus and model details are presented in Figure 1. The power profile applied in this model is presented in Figure 2. The core was modelled with a single thermal–hydraulic control volume (CV). This approach was able to predict the proper mass of hydrogen as discussed in previous works [29].

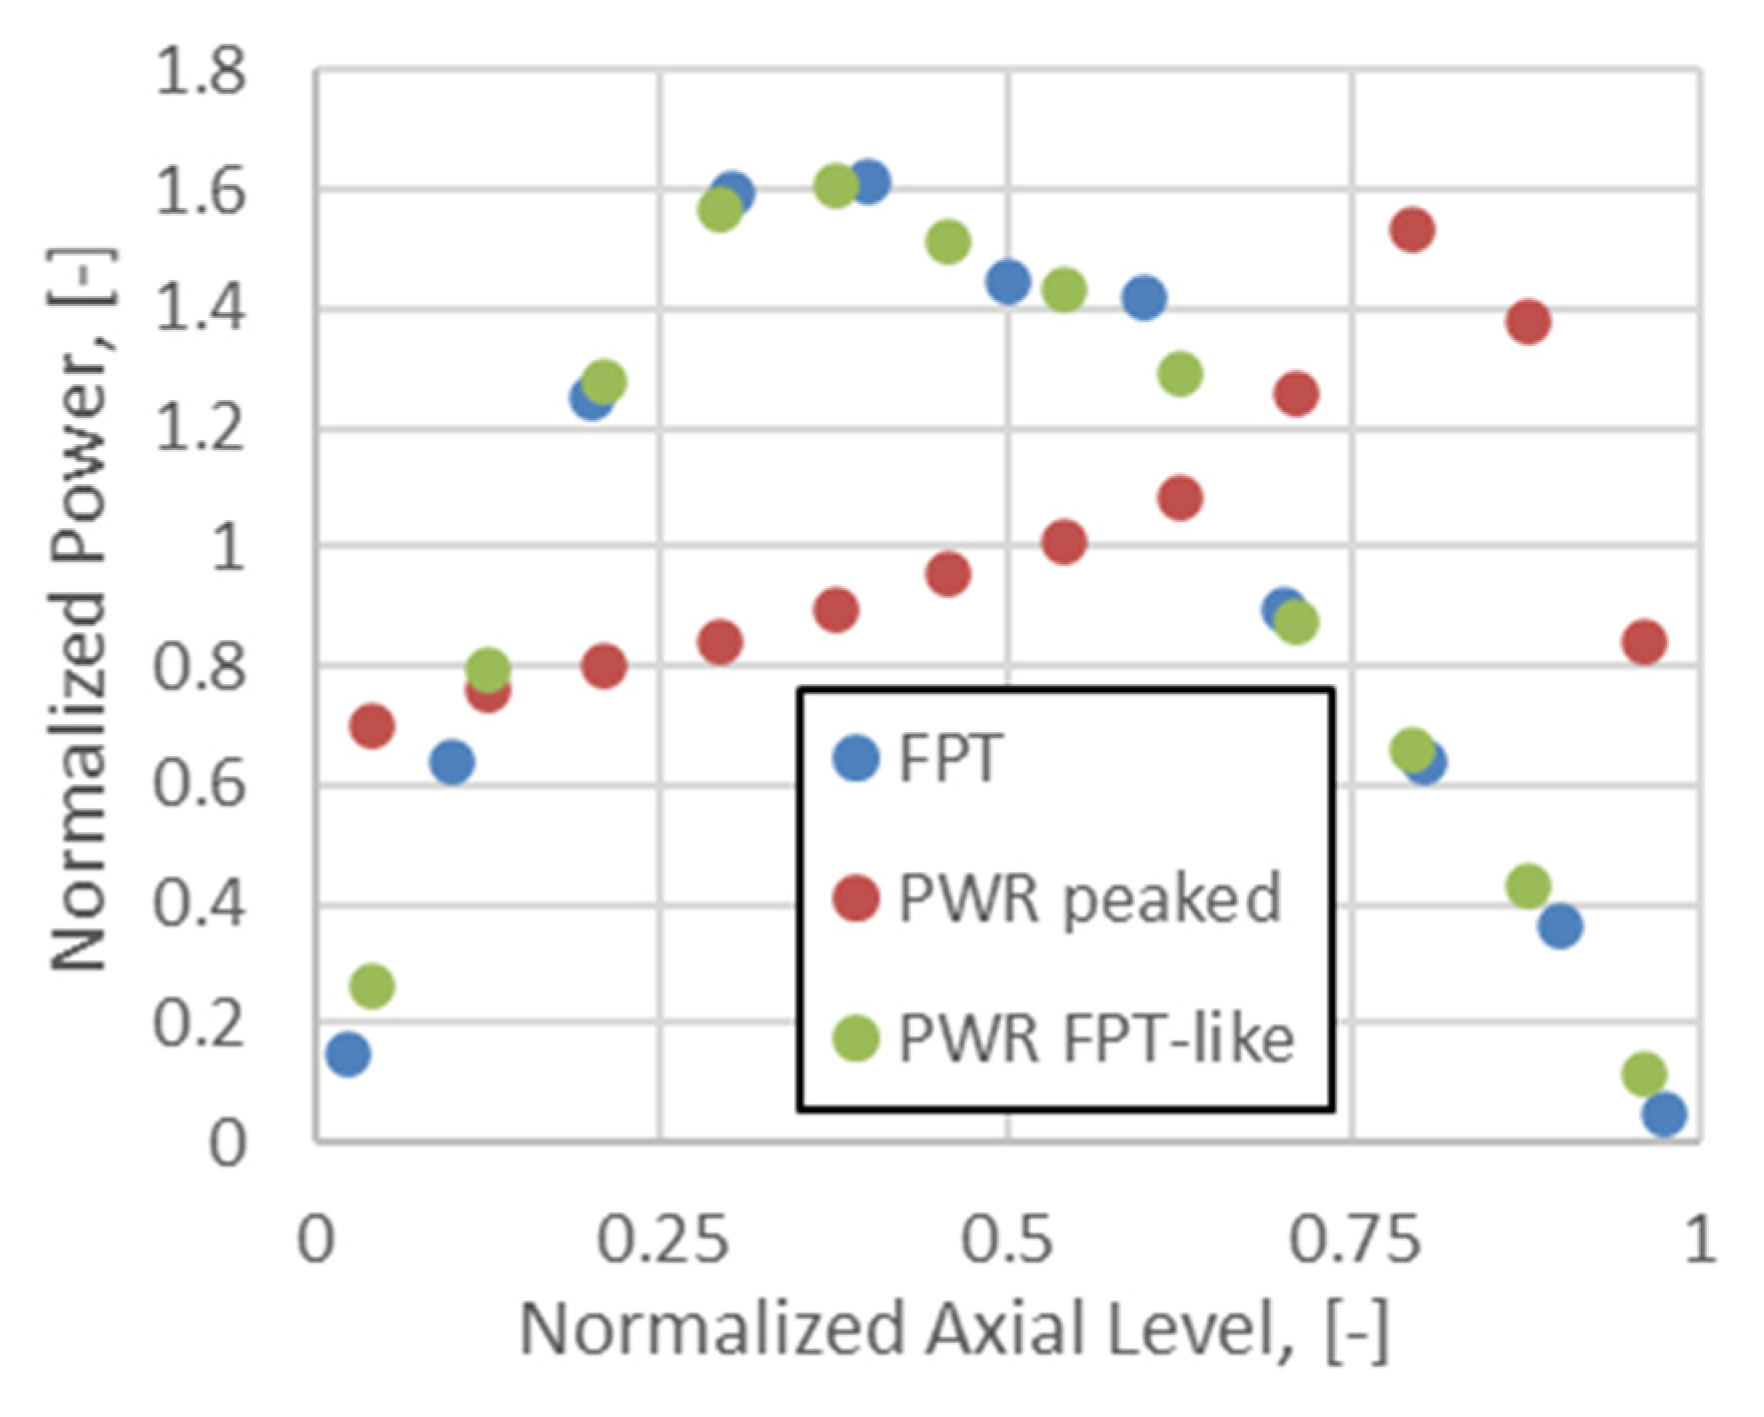
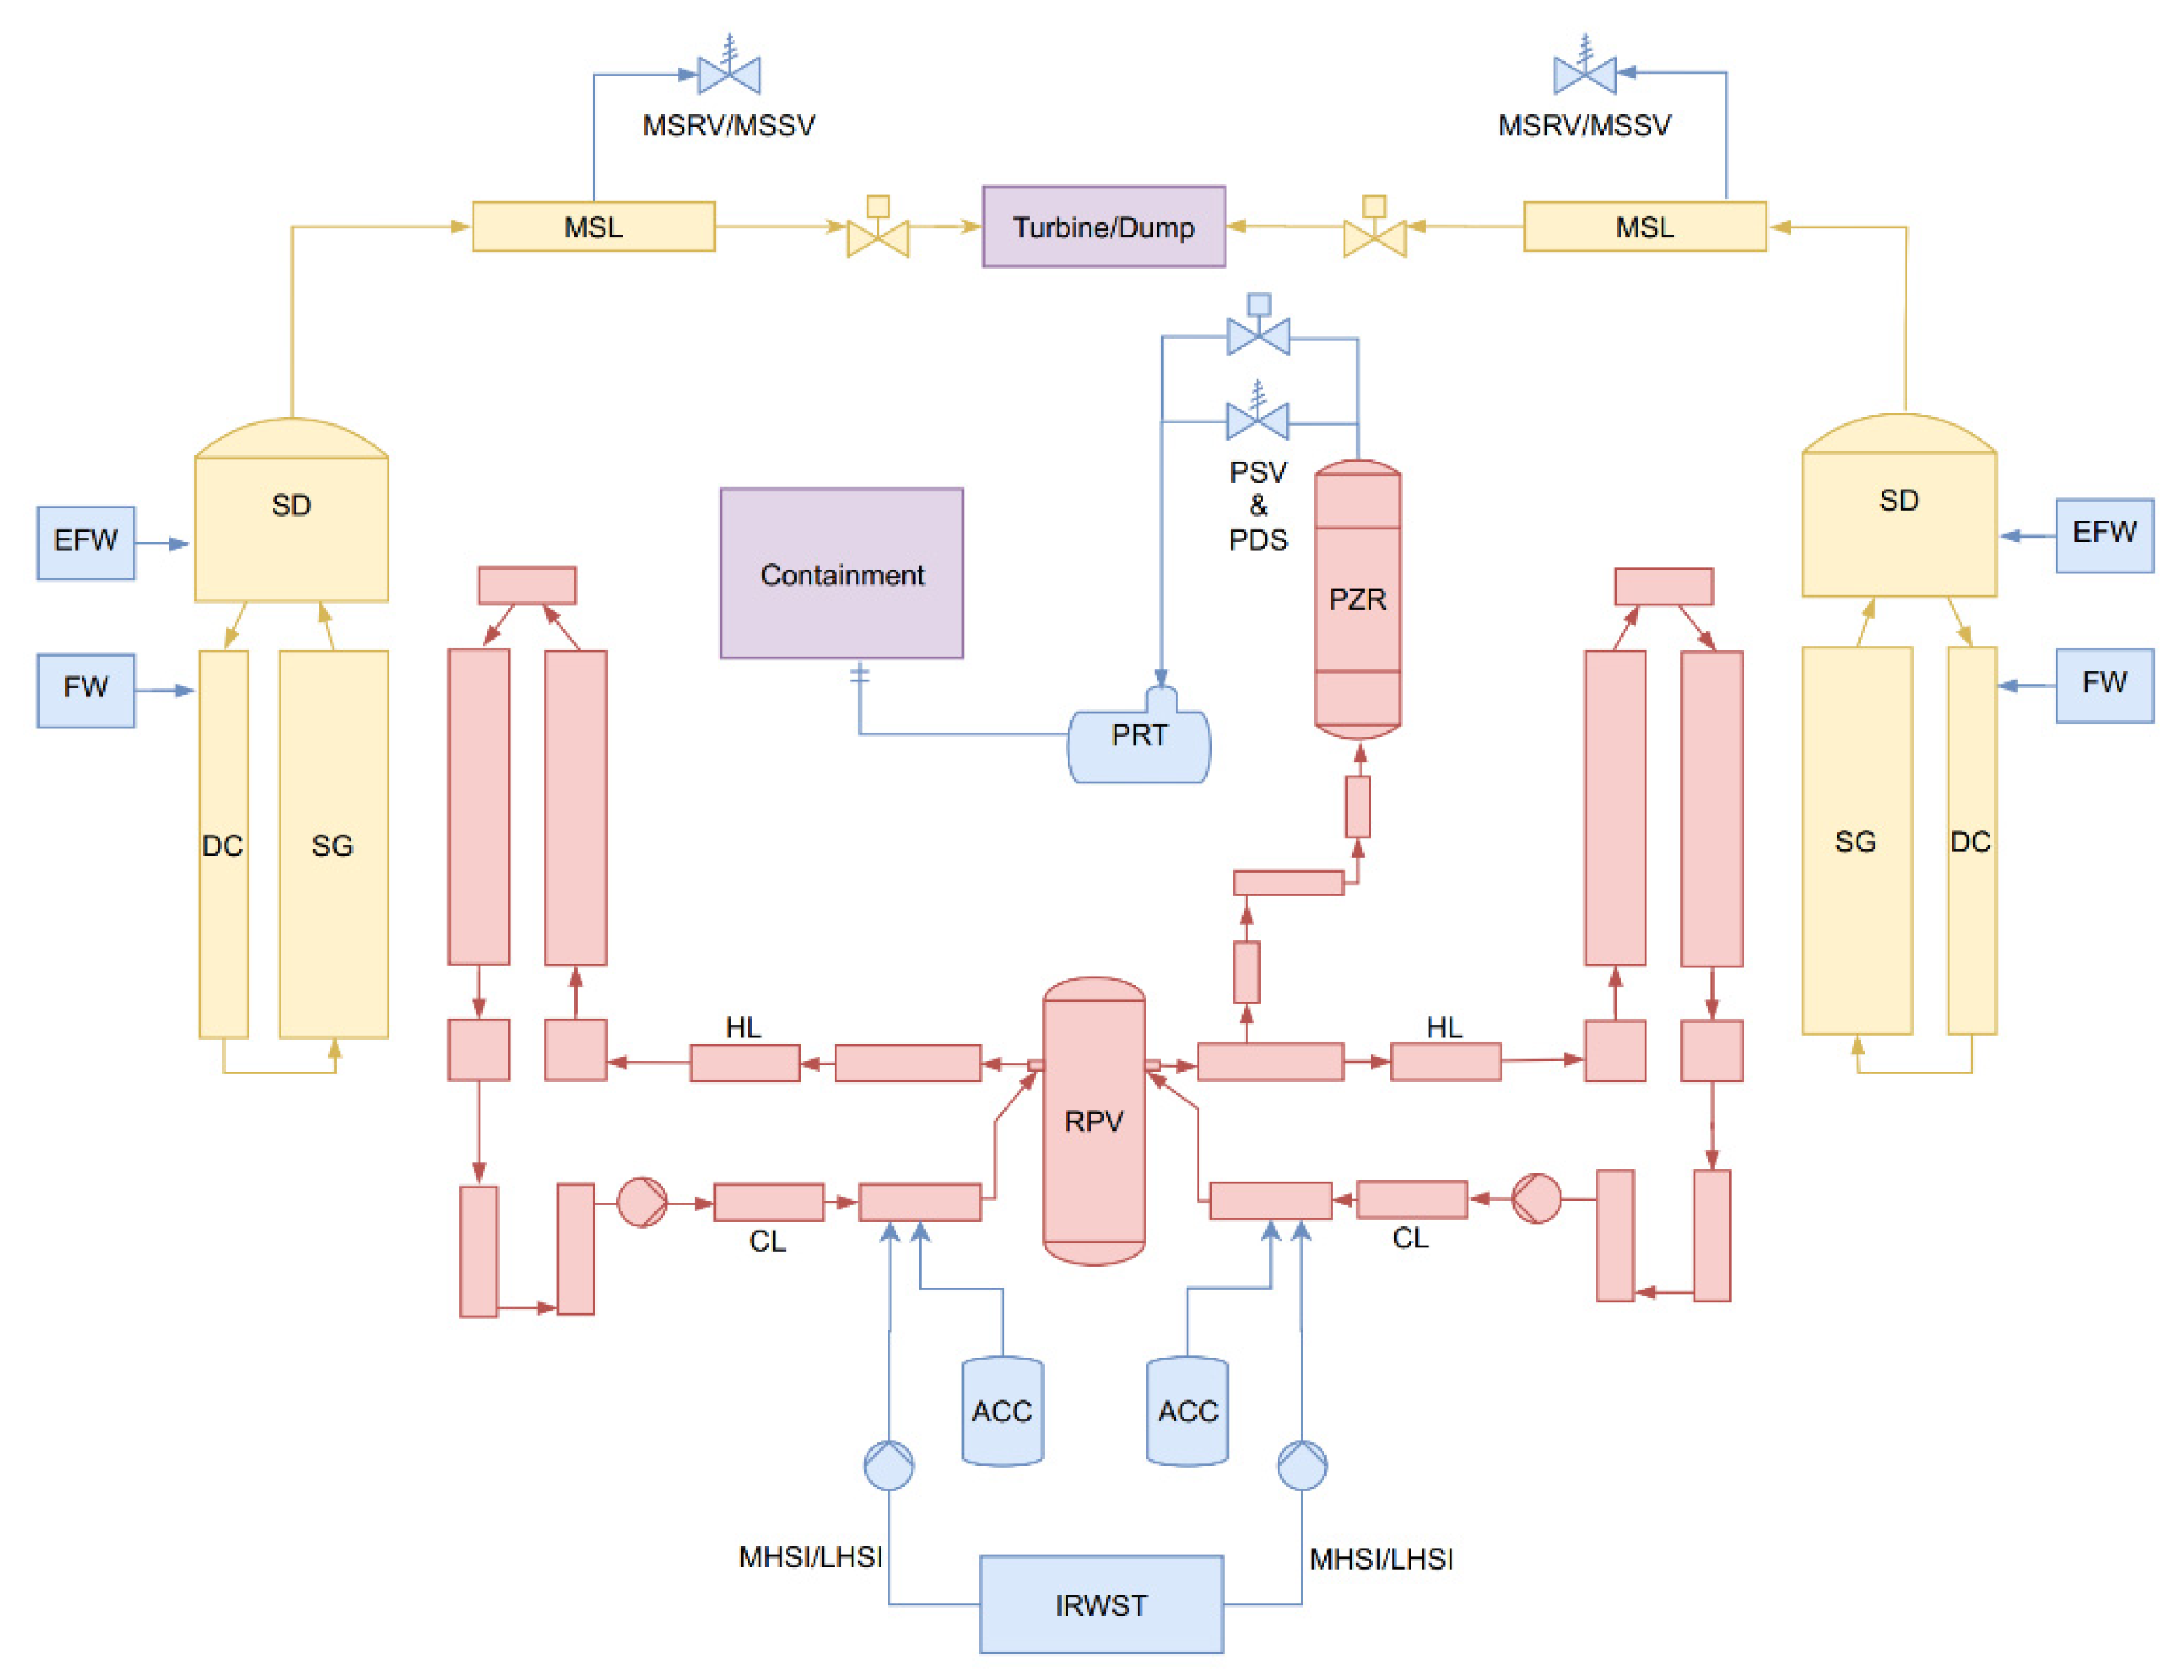
2.2. Gen-III PWR Model

The basic idea was to use outcomes of the FPT-1 modelling in plant scale simulations. In consequence, the gained experience was applied with the PWR model studied in this work. The plant is a generic four-loop unit with thermal power of 4500 MWth and is considered as a representative for the generation III European NPP fleet (see Table 1). It was defined and developed in the NARSIS research project [27,31]. An earlier version of the model with a complex containment nodalizaton scheme was studied for an SBO accident in [32]. In this work, the model was updated, a simple single node containment was added to reduce computational effort, and the core setup was based on FPT-1 outcomes and recent MELCOR practices. Figure 3 presents the RPV nodalization scheme for thermal–hydraulics and flow packages (CVH + FL), the core modelling (COR) package, and the heat structures package (HS).
The COR package model has nineteen axial levels and six rings. The active core region has twelve axial levels (7–18) and one non-active fuel level above and below the active core (6 and 19). The core support plate is modelled by level 5, and the levels below are part of the lower plenum. The core region has five CVs, each per one ring. The CVH model was not divided into axial levels to improve computational efficiency, and the approach is equivalent to the FPT-1 modelling approach (Figure 3). Despite being simple, it is expected to represent the typical plant model for LB-LOCA and it is considered to be detailed enough for a low-pressure large LOCA-type scenario.
Additionally, models contain a core bypass volume and single downcomer, lower plenum, upper plenum, and upper head volumes—see Figure 3. The lower plenum volume, which is essential, contains the core plate COR model, and it was observed to have a significant effect on model convergence and hydrogen generation. Two models were studied, one with a peaked power profile and one with a power profile similar to FPT-1—see Figure 2. The power profile was not studied as a part of uncertainty analysis, as the impact of the initial and boundary conditions was not part of this research.
The reactor coolant system (RCS) model is presented in Figure 4. The model has two loops; one is a single loop with a pressurizer, called “broken,” and the second is a combination of three other loops, and it is called “intact.” The nodalization strategy is based on previous research [14,33]. Other plant details were also modelled, including the main steam line with safety valves, the pressurizer with safety valves and accident valves, the pressurizer relief tank connected with the containment, passive accumulators, main feedwater and auxiliary feedwater systems.
Stable steady-state conditions were obtained long before the accident, and they agreed with the plant definition [31]. The steady-state covered full power operation for ~5000 s before the event. The initiating event (IE) was a guillotine double-ended hot leg (HL) large break loss of coolant accident (LB-LOCA). The hot leg break is located on the broken loop with the pressurizer. It was postulated that all active safety injection systems were not available since the beginning of the event.

2.3. Uncertainty and Sensitivity Analysis Methodology

The methodology applied in this work is presented in Figure 5. At the same time, it was the workflow of the recently developed MelSUA tool, which is open software [34]. The approach is divided into several steps, which are discussed in this section. The approach is similar to the SNL methodology to uncertainty analysis [35].
The first step is selecting uncertainty parameters, then identifying appropriate distributions, and providing selection justification. In a more detailed approach, a screening analysis for parameters can be performed, which can be an analytical study, e.g., parametric type sensitivity analysis for all parameters expected to affect the studied phenomenology. The alternative but less systematic approach is to use outcomes obtained by a literature survey. The second path was applied in this work; distribution types and properties were based on the literature but appropriately modified to merge outcomes of different studies. Moreover, in this work, best-estimate distributions were selected for studied parameters. It can be argued that for the study of the modelling parameters, the application of the uniform distribution could be more reasonable. However, we aimed to obtain the best estimate results as far as possible.
The next step is the preparation of the template input deck and the best-estimate model for the considered system. The best-estimate analysis can proceed the whole methodology. At the same time, the analysis demands the determination of the sample size for the statistical significance of the uncertainty measures for the output variables. It is crucial when we have limited computational resources and are willing to apply a lower amount of input decks.
In a typical approach to the best estimate calculations, like the best estimate plus uncertainty (BEPU) methods, the so-called Wilks-based approach is utilized; the widespread realization is the GRS methodology [36]. This approach is common in design basis accident (DBA) studies [37], but there were attempts to use it in severe accident studies. It uses order statistics to estimate confidence intervals with reasonable probability. The number of models (input decks) is based on Wilks theorem [38], e.g., 93 input-decks in order to provide the two-sided 95%/95% probability and confidence level for two-sided coverage of the distribution, and sometimes it is called the standard tolerance limit (STL) [36].
In this work, considering uncertainty analysis, we calculated over 400 input decks per case, and this approach can be treated more like a typical Monte Carlo study with distributions based on statistics with relatively large samples. It is similar to SOARCA UA, where they studied about 900 input-decks [39]. It has to be highlighted that, in this work, we did not use Wilks. However, considering Wilks, for 400 input decks, it corresponds to a least 90%/99% confidence/probability for the two-sided statistical tolerance (at least 388 runs) for the FoM. The 95%/95% demands 93 runs, and 99%/95% demands 130 runs. Nevertheless, comparisons are not straightforward, and the reader should remember about limitations discussed in the previous paragraph.
In the next stage, the sampling of parameters with proper methods should be performed. The most popular approaches are simple random sampling (sometimes simply called “Monte Carlo”) or Latin hypercube sampling (LHS), but other more sophisticated approaches are available in the literature [40]. In this work, the LHS type sampling was applied to generate parameters based on selected probability distributions assuming that the parameters are independent. The LHS should not be used for tolerance limits estimation with Wilks type analysis, as argued in [41]. The primary motivation of applying LHS in this work was to cover an ample space of states with fewer samples. Severe accident analysis was considered, and we motivated our decision that it is more important to cover a larger space of solutions than to maintain rigor (resulting from pure random sampling). This approach can be questionable and considered an unnecessary complication. It can be argued that 400 samples are large enough to cover the proper space of solutions and that LHS is not needed.
For each parameter, 400 values were sampled and then introduced into the MELCOR model by the variable input functionality [42]. A detailed discussion of sampled parameters is presented in Section 2.4, which follows. It should be mentioned that each case was calculated with a different randomly selected seed for the random generator.
The further step is the automatic generation of a batch of models. Later, simulations are performed for models and output files are generated. The post-processing of output files is necessary. Then, phenomenological and statistical analysis covering distributions for a figure of merit, confidence intervals, and eventual study of outliers and correlations can be performed (see Figure 5).
Regarding sensitivity analysis, a simple approach was applied, using Pearson, Spearman, and Kendall correlation coefficients, dedicated to indicate simple first-order correlations. Additionally, a linear regression for the FoM was prepared with linear fits, where, in this study, the FoM was the final (MELCOR end time step) cumulative hydrogen mass generation.
The dedicated MATLAB-based automatic engine (MelSUA) for generating input decks, sampling, pre-processing, post-processing, and code running with PowerShell scripts were developed. The software is available in an open repository and Supplementary Material to this work [34,43]. Its main advantage is the use of a popular MATLAB environment and powerful statistical toolboxes. It allows using truncated distributions, dozens of different distributions, XML input files, MATLAB matrix-based mathematical functionality, and several other features.
Another critical issue for this work and also for MELCOR users are failed code runs. In uncertainty analysis with MELCOR, it is common to obtained failed cases. Unfortunately, as practice shows, it can be a substantial portion of all cases. What is more, the failure statistics can be substantially different with different code revisions for the same model. It is another factor, which is a struggle for SA codes users. In a typical DSA, discussion on how to work with failed cases is presented in a BEMUSE report [37]. It is essential for a regulatory process, as with failed cases, it is difficulty to guarantee tolerance limits, and statistics can be disturbed. However, in SA analysis, the choice of approach is not apparent, as the purpose of the analysis and requirements are different. The reasonable approach, which allows using results obtained with a failed case, is to study FoM and discard or accept failed runs according to its status. In this study, when FoM (hydrogen mass) was not expected to change significantly, which means that the failure occurred after the oxidation phase, we could use results in the analysis.

2.4. Studied Parameters and MELCOR Modelling

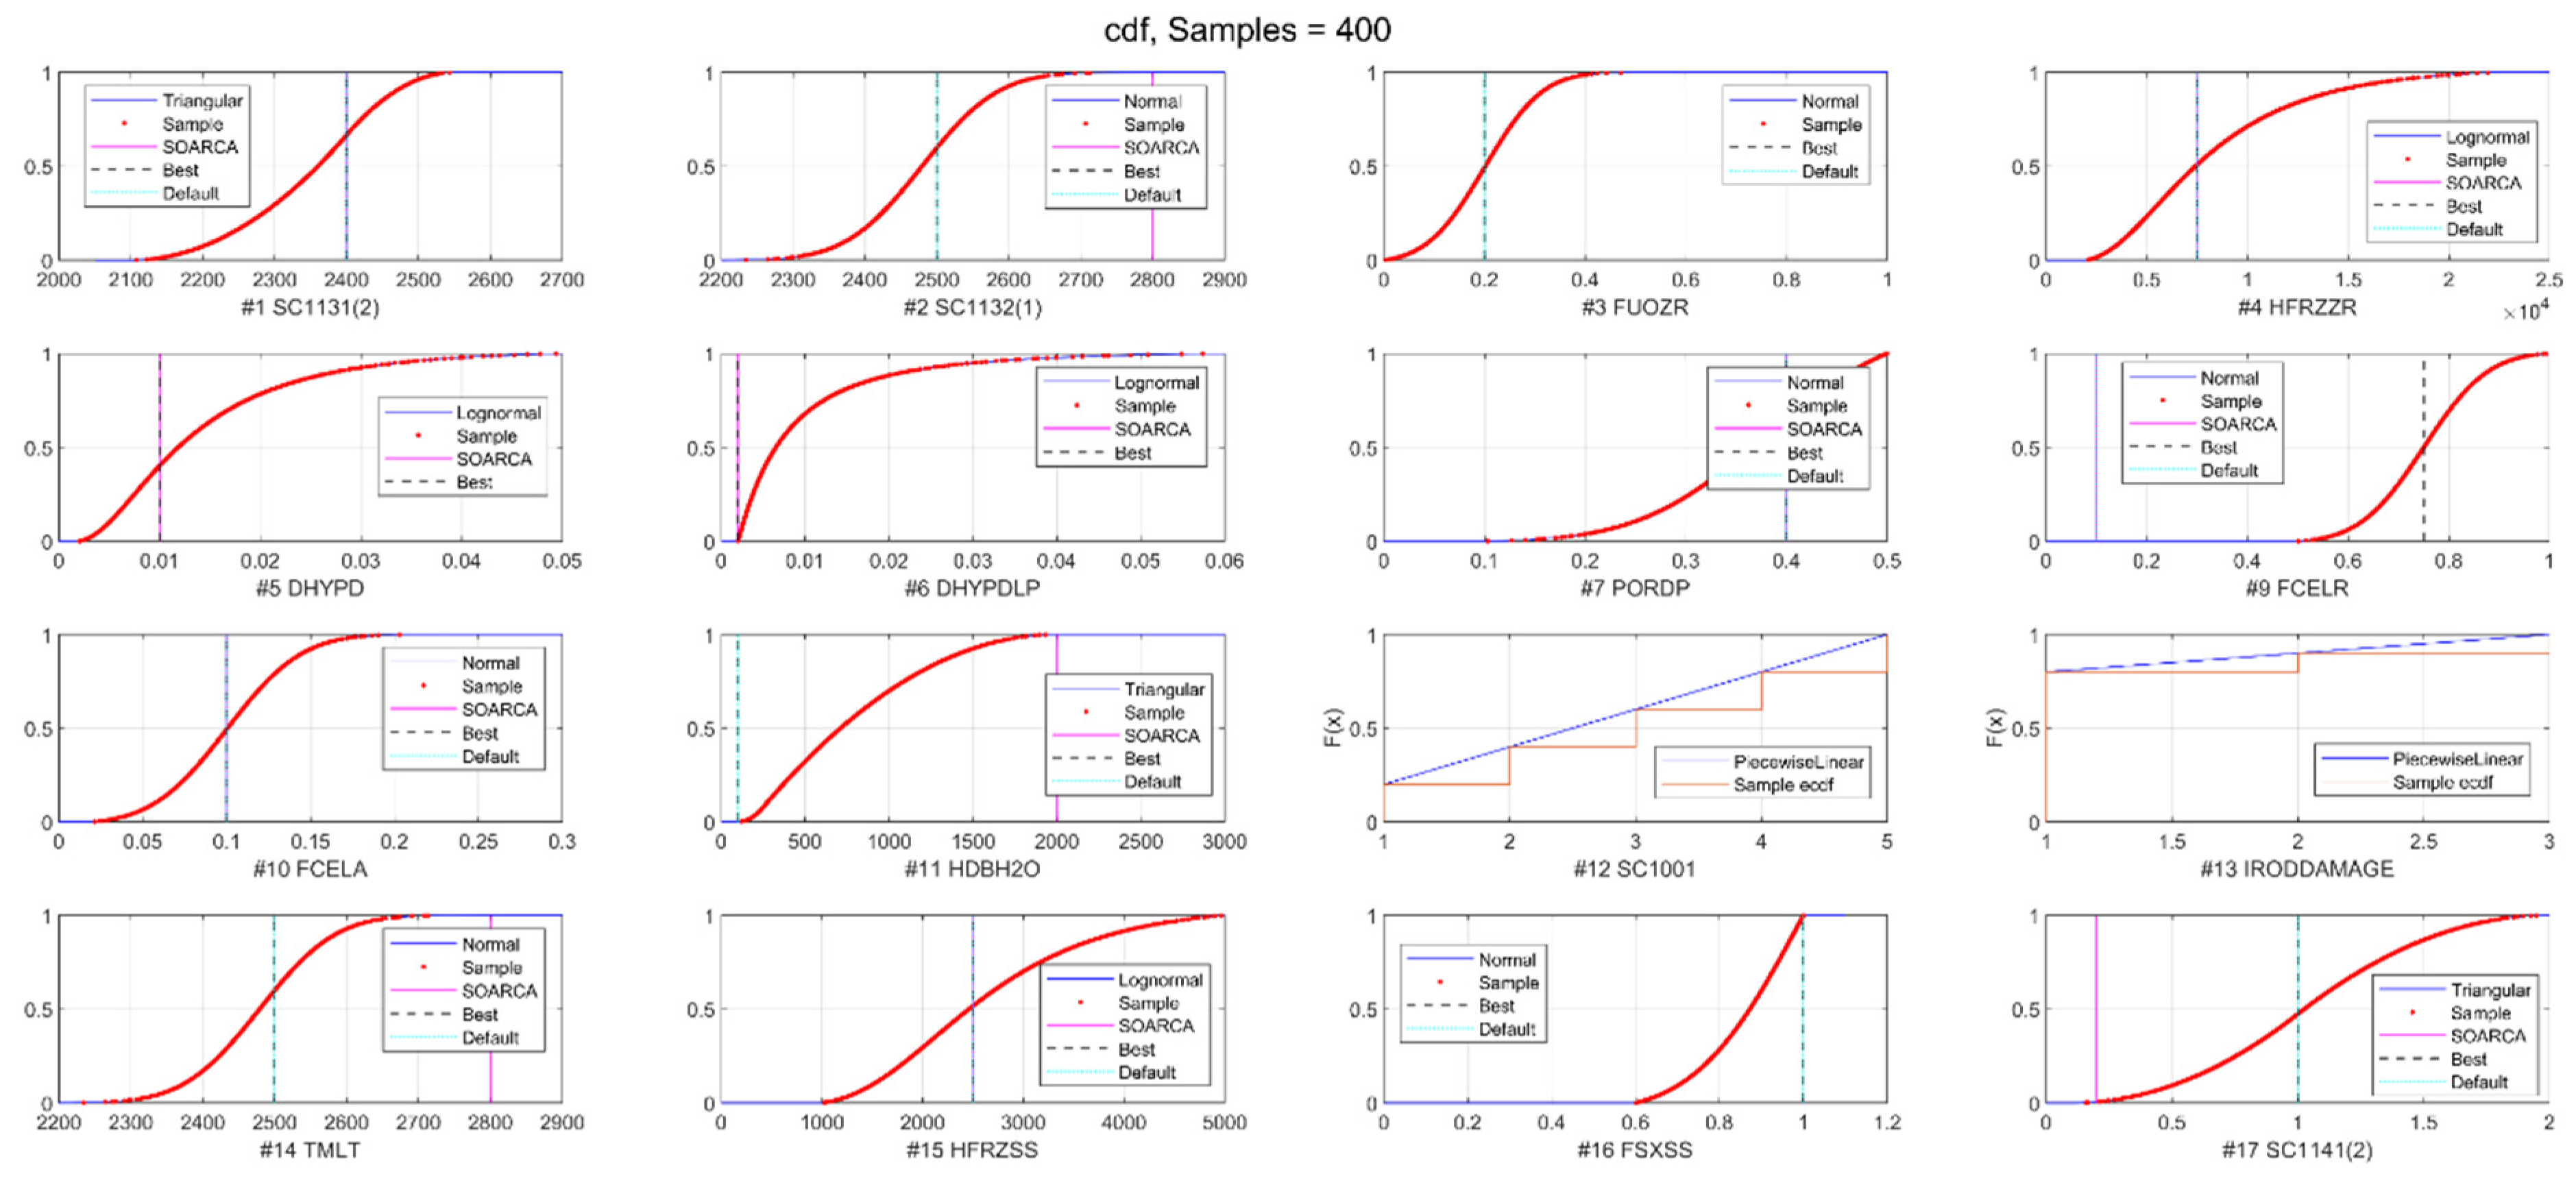
2.4.1. Studied Parameters

At the first stage of the analysis, the best-estimate simulations were performed. In the next step, hydrogen-generation-related MELCOR parameters were selected with the assignment of the probability distributions. The primary source of data for parameter selection was the available literature. It was decided to use the experience gained by other researchers to reduce the amount of work necessary during the initial step of the analysis. The principal reference but also inspiration for this study was the SNL report by Gauntt: “An Uncertainty Analysis of the Hydrogen Source Term for a Station Blackout Accident in Sequoyah Using MELCOR 1.8.5” [35] and a related study [44]. They describe and motivate parameters and phenomena selection and contain cumulative distributions. An additional source of parameters were the more recent SNL SOARCA Uncertainty Analysis Report [45] and studies by Gharari et al. [6,8], Galushin and Kudinov [10], and Itho et al. [11]. In this work, we focused on MELCOR parameters responsible for phenomenological modelling, and the best estimate approach, as far as possible, was applied. Initial and boundary conditions were not varied, and it should be treated as an assumption.
The probability distribution functions for parameters are presented in Table 2, and each is discussed in details in the following sections. The best estimate parameters are also provided. The plots of distributions for the studied parameters are available in the Appendix A.

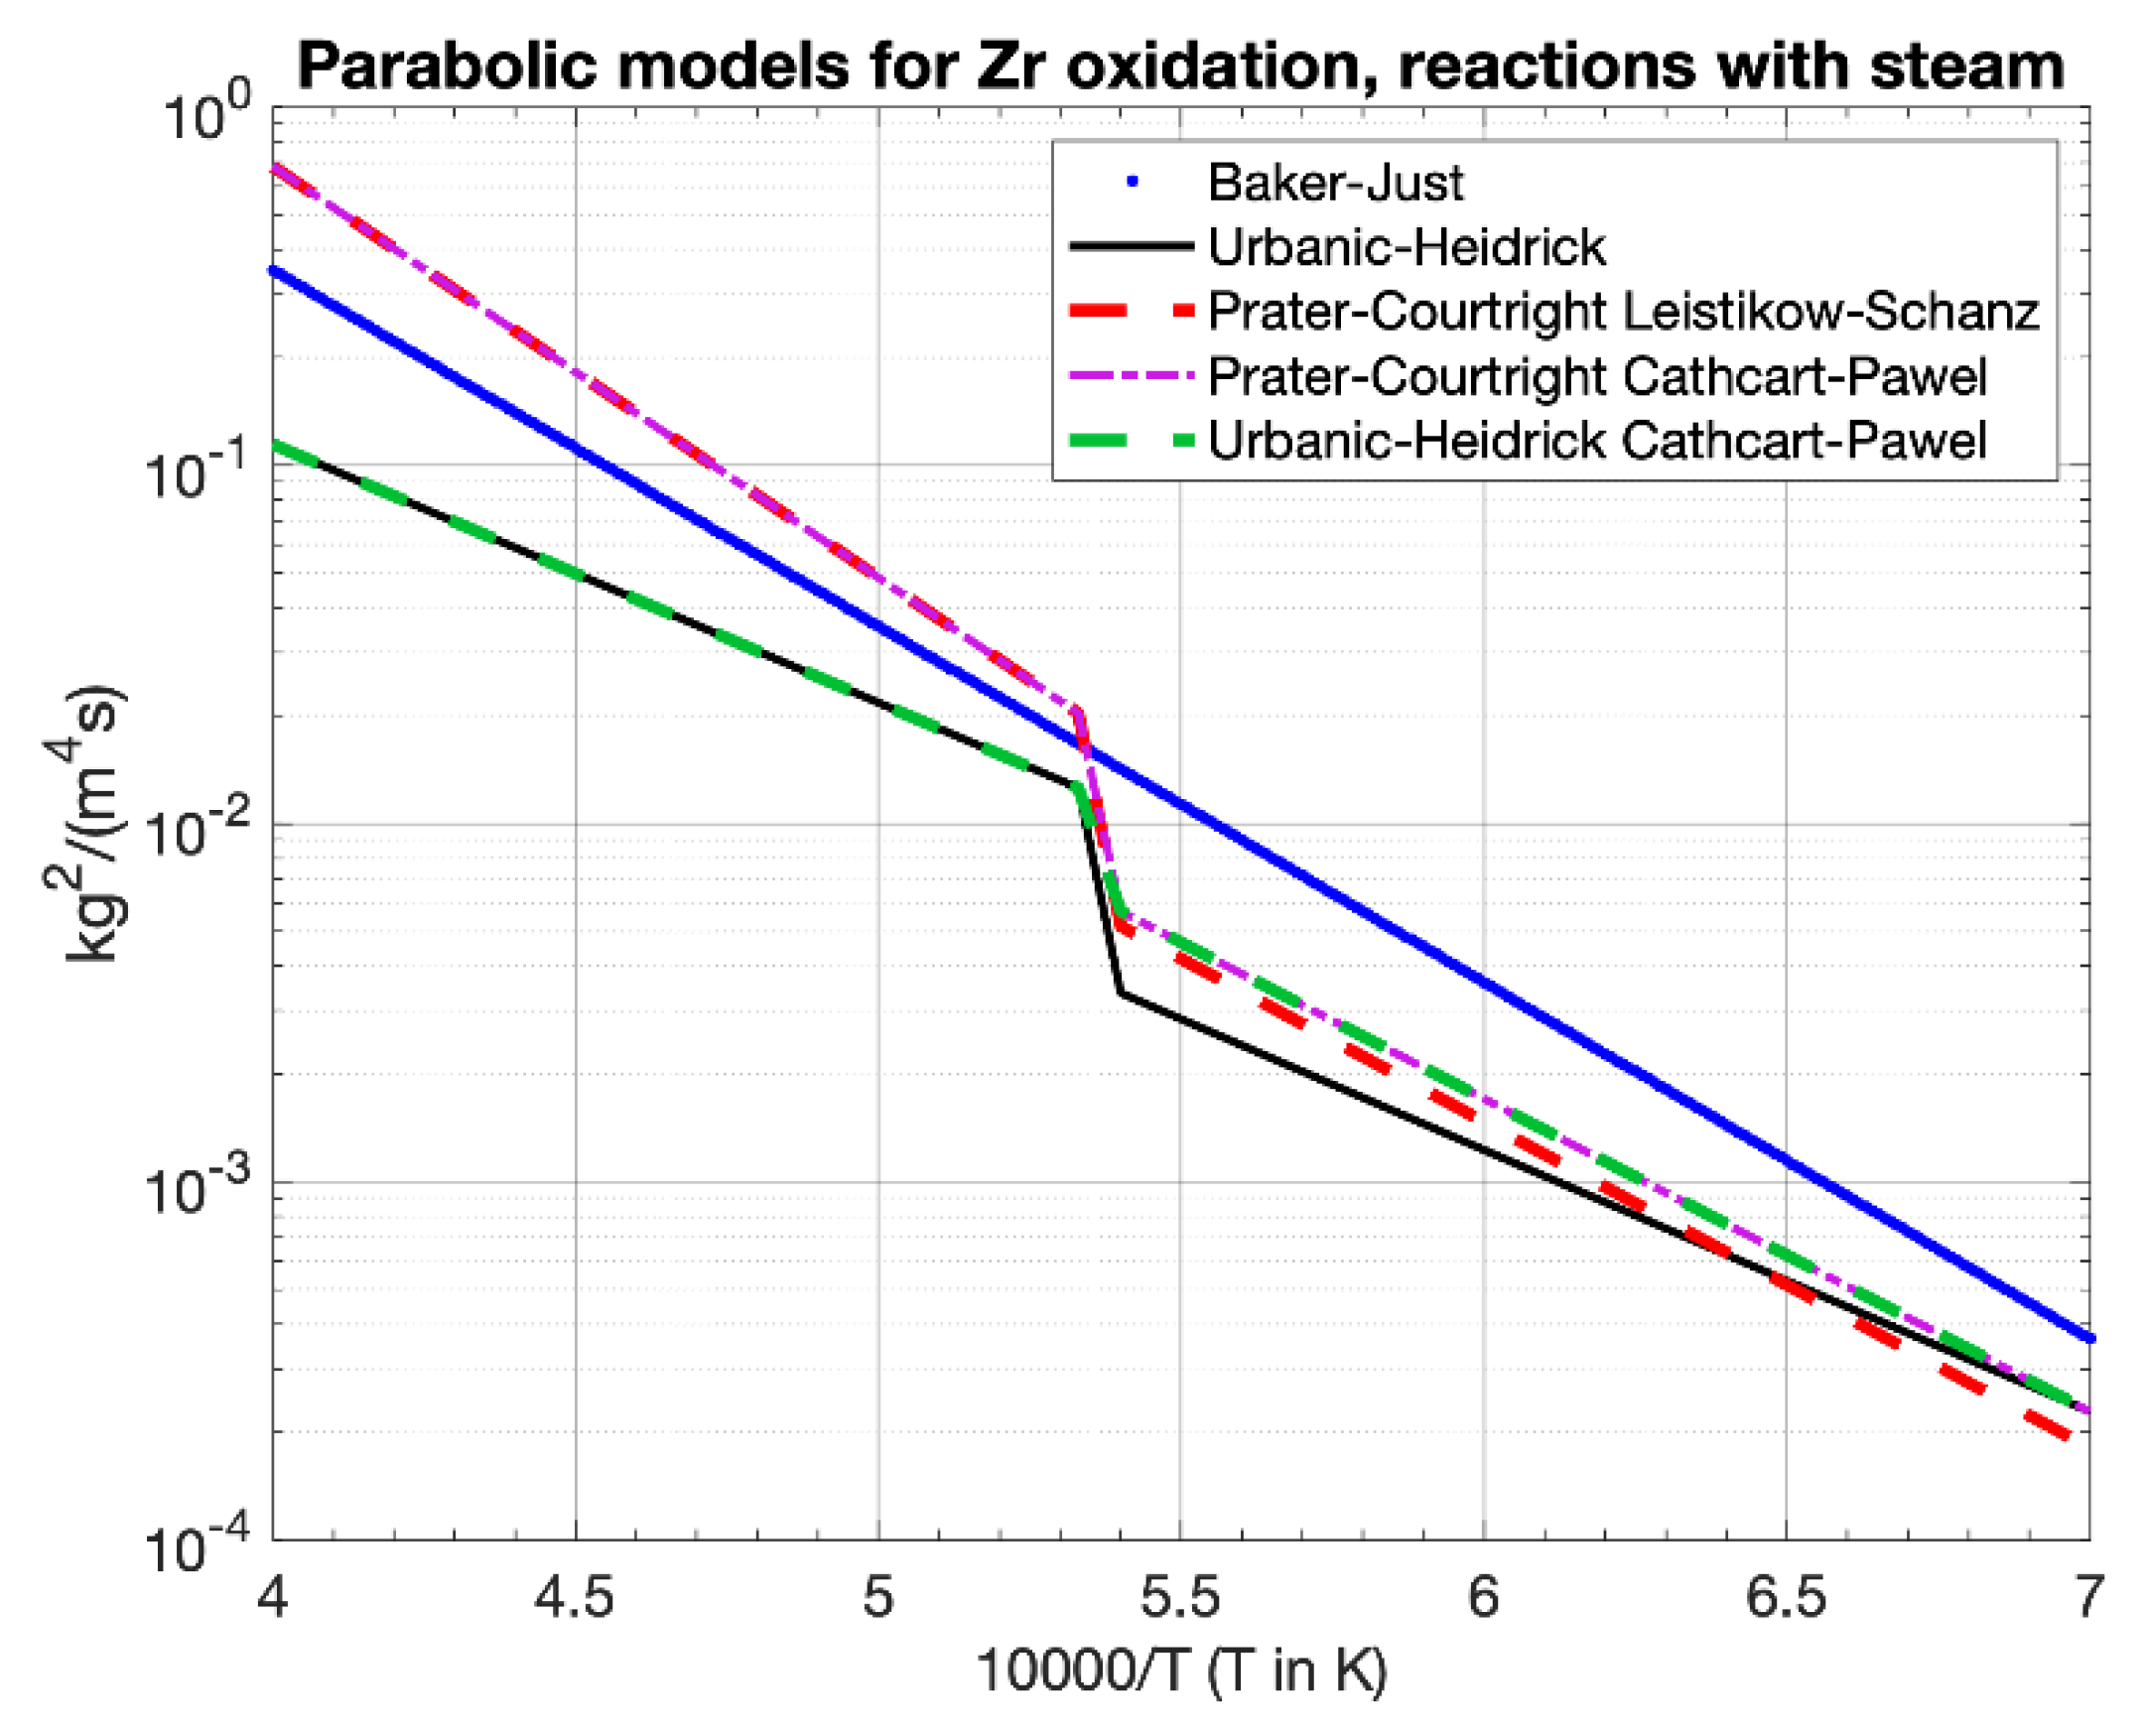
2.4.2. Zircaloy–Steam Oxidation Correlation—SC1001

Five different correlations for the zirconium–steam oxidation rate coefficient were selected (Table 3 and Figure 6). All were used in parabolic rate equations and were strongly dependent on the temperature. As shown in Figure 6, some differences were present and may have led to differences in mass production. Correlations are defined by proper MELCOR sensitivity coefficients (SC1001). The selection of correlations and interpolations in intermediate regions were inspired by [35,46]. However, the selection process can be assessed to be more or less arbitrary. Alternative selections are available in the literature ([6,8]). The discrete uniform distribution was applied in the uncertainty analysis, and correlations were assumed to be equally likely. However, the code default correlation was Urbanic–Heidrick, and it was the best estimate selection.

2.4.3. Zircalloy Melt Breakout Temperature—SC1131 (2)

An oxidized cladding creates a shell that can hold molten materials (Zr and fuel) inside the fuel rod until the ZrO2 thickness limit or temperature limit are violated. Then, the shell is breached and molten mass can candle and relocate. This parameter affects hydrogen production as it affects steam contact with zirconium and impacts flow blockages. The breakout temperature for the cladding component is available with field SC1131 (2). The distribution used in the SNL report ([35]) was normal-like with a median of 2400 K, in the range 2250–2550 K and SD ~50 K, but in [44] the range 2100–2550 K was considered. In a recent study [6], they considered uniform distribution with the same temperature range of 2250–2550 K. In this work, we applied a triangular distribution the same as in the more recent SOARCA UA for the Surry plant with median, lower, and upper limits equal to 2400 K, 2100 K, and 2550 K, respectively. The MELCOR 2.2 (M2.2) default and SOARCA recommendation were equal to 2400 K, and it was the best estimate value in this work [52,53].

2.4.4. Fuel Rod Collapse Temperature—SC1132 (1)

The temperature which causes fuel rods to collapse and form debris in the case when cladding is oxidized and there is no unoxidized Zr, was given by sensitivity coefficient SC1132 (1). It is the extended failure criteria for situations when metallic Zr candled [42,45,53,54,55,56]. It can affect accident progression and hydrogen production [35]. The SNL report applied a normal-like distribution with a median of 2550 K and lower and upper bounds equal to 2400 K and 2800 K, respectively, defined by experimental considerations and the eutectic melt temperature [35]. In contrast, Gharari applied a collapse temperature between 2400–2700 K with a uniform distribution [6]. In SORCA UA for Surry [53], they applied a normal distribution with a mean equal to 2479 K and a standard deviation of 83 K, and we also applied it in this work. In SOARCA, the recommended value was 2800 K, and it was the default for older code versions [52]. The new M2.2 default value is equal to 2500 K, and it was selected as the best estimate value.

2.4.5. Fractional Dissolution of materials—FUOZR and FSXSS

Two parameters that identify the fraction of the local dissolution of materials during relocation were studied. The uranium dioxide dissolution in molten zirconium (FUOZR) and molten steel oxide dissolution in molten steel (FSXSS). These are the secondary material transport parameters defined in the COR_CMT card. Selection is motivated by the fact that the decay heat source changes ([6]), and it affects accident progression and is responsible for core degradation. In this work, for the FUOZR, the truncated normal distribution was fitted to Gauntt data [35], with a given median of 0.2 and limits equal to 0.0 and 0.5. Gauntt justifies these values by the U-Zr-O phase diagram, and similar values were also used by [6]. In Itoh et al. [11], it was shown that the steel oxide transport in molten steel can play a role in the hydrogen production; they applied an FSXSS range equal to 0.6–1.0. This parameter was also studied, with truncated normal distribution, with a median and upper limit equal to 1.0 (the most probable) and a lower limit equal to 0.6.

2.4.6. Candling/Refreezing HTC—HFRZZR and HFRZSS

In the MELCOR (COR_CHT card), the user defines a set of refreezing/candling heat transfer coefficients. It affects core blockage during the relocation of molten materials, which affects steam flow and oxidation. In the studied references, some ambiguities were present, as all coefficients were part of the same MELCOR field, and typically it is not explicitly defined. In the SNL study [35,44], it was suggested that only the Zr refreezing coefficient was varied. In Gharari et al. [6], it can be deduced that all candling coefficients were modified. In Itoh et al. [11], HTC coefficients for zircalloy and steel (HFRZZR and HFRZSS) were studied, and, similarly, in [10,54], both Zr and steel coefficients were studied. In this work, it was decided to vary the molten zirconium and steel coefficients (HFRZZR and HFRZSS) only. Distributions for both parameters were selected to be truncated log-normal, as in the Gauntt study [35] for Zr. Median values for Zr and Steel were equal to 7500 and 2500 W∙m−2∙K−1 respectively, as both were default values in M2.2. The low and high values for Zr were based on Gauntt and equal to 2000 and 22,000 W∙m−2∙K−1. In the case of steel, the low value was 1000, and, as in Galushin and the old MELCOR default, the upper limit was 5000 W∙m−2∙K−1, which was arbitrarily selected as the higher value than the median and was considered reasonable.
For simplicity, the coefficients for other materials were assumed to be equal to the best estimate SOARCA, which were, in fact, the defaults for M2.2 [42,52]. The values were the following: 7500 W∙m−2∙K−1 for Zr, ZrO2, and UO2 and 2500 W∙m−2∙K−1 for SS, SSOX, and CRP components. In the case of the FPT-1 model presented in this work, a candling HTC modification was introduced, as described in the MELCOR2.1 assessment report for FPT-1 [55]. HTCs for ZrO2 and UO2 were modified and equal to 20,000 W∙m−2∙K−1 and 30,000 W∙m−2∙K−1, respectively. In our previous studies ([28,29]), we assumed a candling heat transfer of 20,000 W∙m−2∙K−1 for metallic Zr (COR_CHT (1)), and the uncertain parameter was the same as this modified value. It was a mistake; the ZrO2 (COR_CHT (2)) should have been modified instead. The issue was corrected in the model studied in this work.

2.4.7. Debris Diameter—DHYPD and DHYPDLP

Two characteristic particulate debris lengths are present in the COR package (COR_EDF card), and both affect the heat transfer, blockages and, in effect, the oxidation calculations. The first is the debris diameter in the core region (DHYPD), and the second is the debris diameter in the lower plenum (DHYPDLP). The parameter range is not obvious because contradictory information is present in the literature. In the SNL reports, [35,44] the core region debris was in a range of 0.2–5 cm, with a median of ~1 cm and a log-normal distribution. The median size was justified to be close to a pellet size, and the limits were based on experimental observations. A smaller plenum debris size was log-normal distributed with limits of 1–6 cm and a median of 2.5 cm, which was justified as representing sintered fragments larger than fuel pellets. The same values were used in the VVER reactor study [6]. On the contrary, Galushin [10] studied BWR lower plenum debris diameters in a range of 0.2–0.5 cm, where other experimental data by Magallon and Kudinov justified the selection. In the best practices report [52], the recommended best-estimate diameter for the core region was 1 cm, and for the lower plenum, it was 0.2 cm, and FARO experiments support the second value. Moreover, in [11], the considered debris median size for both the core and the lower plenum was considered to be 0.5 cm.
For the core region, a truncated log-normal distribution was fitted to Gauntt data [35,44] with a median of 1.2 cm, and upper and lower limits were equal to 2 mm and 5 cm, respectively. The selection was not evident for the lower plenum region; a truncated log-normal distribution with a median of 0.5 cm and a range variability of 0.2–6 cm were selected, with the low value corresponding to a SOARCA recommendation and the high value being the maximum diameter provided by Gauntt [35]. The median value was a compromise between more recent studies based on experimental data and code default with low values and older Gauntt data, where the justification for larger particles was reasonable.

2.4.8. Debris Porosity—PORDP

Core debris porosity affects the heat transfer of debris, coolability, blockage formation, and oxidation. The best estimate, code default, and SOARCA value were all equal to 0.4. In this study, the truncated normal distribution was fitted to Gauntt data with a median of 0.38 and limits equal to 0.1–0.5 (the limits and the median value were provided explicitly in [35,44]). The distribution type was not provided, the upper limit represents an unstable bed, and the lower limit was not realizable for the packing of solid particles [35,44]. Gharari assumed a log-normal distribution with the same parameter range and the same median. Galushin and Kudinov applied the reduced range of 0.3–0.5 without information about distribution [10].

2.4.9. Radiation Exchange Factors—FCELA and FCELR

As it was motivated by Gauntt, radiation exchange factors for radial (FCELR) and axial (FCELA) exchange between COR package cells affects hydrogen production [35,44]. Gharari also applied these parameters, but it was not used by Galushin (the study was not focused on hydrogen). In the SNL study [35,44], Gauntt applied a range of 0.02–0.18 with a median of ~0.1 for both parameters. Gharari applied a normal distribution with lower and upper bounds of 0.02–0.3 with a default of 0.25 for FCELA and a normal distribution with 0.01–0.3 limits for FCELR and a default of 0.25.
In this work, a truncated-normal distribution was applied for the axial factor (FCELA), with a median of 0.1, a lower boundary of 0.02 (identical as Gauntt), an upper boundary of 0.3 (as in Gharari), and a corresponding standard deviation of ~0.035. For the radial factor (FCELR), different distributions were applied for PWR and FPT-1. The MELCOR assessment report justifies that this parameter has to be more significant for the Phebus facility than for a typical NPP [55]. Consequently, for the PWR reactor, a normal-like distribution was applied with parameters the same as for FCELA. On the contrary, for FPT-1, it was a normal-like distribution with a median equal to the recommended value of 0.75, arbitrarily selected upper and lower boundaries set to 0.5 and 1.0, respectively, and a standard deviation of 0.1. The current best estimate, code default, and SOARCA values were all equal to 0.1 for both parameters, and these were applied for PWR best estimate model. In the best estimate FPT-1 model, the FCELR 0.75 and FCELA 0.1 values were applied. In older MELCOR versions, default values were equal to 0.25.

2.4.10. In-Vessel Falling Debris HTC—HDBH2O

Debris fragments falling in the lower plenum transfer heat to the surrounding water and it is modelled by in-vessel falling debris HTC parameter (field HDBH2O in COR_LP card). Eventual fragmentation and steam generation are factors that can enhance oxidization and influence hydrogen generation. It is only significant for the PWR reactor model. For this parameter, there is no consensus in the applied literature. The default value for M2.2 is currently 100 W∙m−2∙K−1; earlier in SOARCA [52], the recommendation was 2000 W∙m−2∙K−1. In our modelling, we assumed the best estimate value to be 2000 W∙m−2∙K−1.
Gauntt reports [35,44] a range between 125–400 W∙m−2∙K−1, which was applied without explicit information about the distribution. Using the fitting, we found that it was likely a triangular distribution with a mode equal to 150 W∙m−2∙K−1. Itoh applied 100 W∙m−2∙K−1 with a normal distribution and an SD equal to 10. Galushin, in [54], applied values in the range of 200–2000 W∙m−2∙K−1. Gharari applied a normal-like distribution with a range of 100–400 W∙m−2∙K−1, and the default value was 400 W∙m−2∙K−1. In this work, we assumed a triangular distribution with a lower boundary of 100 W∙m−2∙K−1, corresponding to an M2.2 default value and an upper boundary of 2000 W∙m−2∙K−1, which was equal to SOARCA recommendation and the Galushin upper value [54]. The lower boundary from [54], equal to 200 W∙m−2∙K−1, was selected as a mode (most probable value) for the triangular distribution.

2.4.11. Time-at-Temperature Model—IRODDAMAGE

The time to fuel rod collapse model (time-at-temperature) was applied because it is recommended [52]. It controls core degradation and can affect hydrogen generation. It is defined by the COR_ROD card and the IRODDAMAGE field, and it is dedicated to simulating fuel failure at prolonged high-temperature cladding conditions. Three alternative models were applied and taken from the Peach Bottom SOARCA UA [45,56] and are reproduced in Table 4. Model #0 is based on SOARCA recommendation (best-estimate model) [52], and two others are with temperatures reduced or increased by 100 K. In this study, similarly to the reference report, the discrete distribution was applied with a probability of 0.8 for the basic model and a probability of 0.1 for the two other models.

2.4.12. Interactive Model Melting/Eutectic Temperature—TMLT

The interactive (INT) model was applied to mimic the eutectic temperature of the ZrO2–UO2 binary mixture. The temperature of the eutectic reaction affects the dynamics of blockage by candling materials. When this model is not used, the melting point of the material is provided by the enthalpy step change at the pure materials melting point, where, for ZrO2, the melting temperature is about 2990 K, and for UO2, it is 3113 K. For the INT model, two unique materials were introduced, UO2-INT and ZRO2-INT with an eutectic temperature of 2500 K, as recommended by SNL [52]. This temperature was also applied as the best estimate value. It is defined in the TMLT field in the MP_PRC card used to define new materials and model in the COR_MAT card. In previous research [29] for FPT-1, we applied different tables based on the MP_PRTF card; here, it was simplified with MP_PRC as discussed in [57].
In this work, we assumed that the eutectic temperature (TMLT) has the same values as the fuel rod failure temperature (SC1132 (1)), with the same distribution and limits. Hence, this parameter was not directly sampled. This assumption was introduced and motivated in the SOARCA uncertainty study for Surry NPP [53].
The recent M2.2 contains a new, more mechanistic eutectic model (COR_EUT). It was tested in this work, but the presented PWR model had problems to properly converge, with a large portion of models failing to converge during calculations. In order to preserve accurate statistics, we decided that the interactive model was enough for the presented study, as using it is still the current practice and popular approach.

2.4.13. Maximum Melt Flow Rate after Breakthrough—SC1141 (2)

The core melt breakthrough candling parameter—the maximum melt flow rate per unit width after breakthrough—was studied by some researchers and indicated as influential. It was studied by Itoh [11] and shown to be important for hydrogen in BWRs with M1.86. It was also studied in SOARCA studies, and Kudinov and Galushin considered it in their studies of the lower head [10]. Because of the lack of valid data about distribution, we selected a uniform distribution for a range of parameters suggested by Galushin—0.1–2.0 kg∙m−1∙s−1. In the SOARCA recommendations, the SC1141(2) was equal to 0.2 kg∙m−1∙s−1, but the new M2.2 default value was 1.0 kg∙m−1∙s−1, and this value was applied as a best estimate [52].

3. Results and Discussion

3.1. Best Estimate Results

3.1.1. BE Results for FPT-1

The best estimate (BE) results for the FPT-1 were compared with two experimental datasets ([18,29,30,58]) and selected best-estimate results found in the literature—see Figure 7 (Left). The final hydrogen mass provided in ISP-46 was equal to 96.7 g ± 10%, and the best estimate result was ~12% higher and equal to 108.0 g.
Studying Figure 7 (Left), we can observe that the hydrogen production kinetics before the oxidation peak (~11,000 s) was simulated accurately. In the experiment, an oxidation peak corresponded to ~50 g of H2, and then we can observe the decrease in the oxidation rate. Similar behavior was present for the best estimate MELCOR model, but the oxidation peak ended at ~80 g (see Figure 7). A reduction in the oxidation occurred because of blockages of the flow, and it was also the case for PWRs; see [14,59,60]. The best-estimate model provides reasonable results close to the upper experiment uncertainty limit, and the results are comparable to the literature results for M2.2 and M2.1 (see Figure 7).
Moreover, we can see that the BE model used in this work provided almost the same results as the previous model calculated with MELCOR 2.2.11 [29], despite updates in heat-transfer parameters and deactivation of the RN package and the silver release model. It was observed that the zirconium oxidation was responsible for 98% of the total hydrogen. Investigations of the FPT-1 model, including thermal–hydraulics, are available in previous works [28,29].

3.1.2. BE Results for PWR

The BE results for the PWR reactor, for both the peaked and the FPT-like power profiles, are presented in Figure 7(Right). The difference between these two cases can be observed with the final H2 masses equal to 286 kg and 232 kg for the peaked and the FPT-like, respectively. Interestingly, the process was more rapid for the top peaked case, and at the same time, more H2 mass was produced. The difference was due to the power profile and the location of the peak (see Figure 2). The peak defines the place where the first blockage occurs. When it is located at a lower elevation, less oxidation occurs because of reduced steam access to unoxidized upper parts of the core. For the top-peaked case, the power across the core has a low profile, and fewer blockages are expected at the lower part, which allows more oxidation globally. The top-peaked model produced ~24% (~55 kg) more hydrogen.
The generation kinetics were slightly different in comparison to the FPT-1. After the occurrence of the oxidation peak and blockage, only a slight amount of hydrogen was generated (less than 10%), contrary FPT-1, for which more than 30% of H2 was produced after the peak (Figure 7). In general, Zirconium is responsible for 98% and 97% of the hydrogen mass for the top-peaked and the FPT-like cases, respectively. For the Phebus model, the oxidation was much more efficient considering the mass of available Zr (see Table 1), which was ~70%, but, for PWR, it was only ~13% and ~16%. The core degradation for PWR was very fast, and no forced flow was present. The experimental flow was forced, and power and other conditions were controlled.
The obtained mass of H2 may seem low compared to alternative MELCOR computations presented in the literature, and it is worth investigating. The literature was reviewed, and selected available results for severe accidents in PWR reactors are collected in Table 5. It is not easy to compare results for different reactors, studies, and code versions. Limited data about the plant designs are available, user effects exist, and there are substantial differences between code releases, code nodalizations, and applied practices or default values. Despite that, a simple indicator was introduced—the ratio between in-vessel hydrogen mass generation and total core thermal power. Large cores are expected to be able to produce more hydrogen because of the larger mass of zirconium. Thermal power is directly related to the core size, and, to some extent, it is proportional to the mass of zirconium in the core and can be considered characteristic of the core. The oxidation efficiency concerning Zr mass or maximum H2 would be a better indication, but proper design details are usually unavailable.
In Table 5, it can be observed that the SBO or SBLOCA produces more hydrogen than LB-LOCA. It should have been expected because of a longer accident time and easier access to water/steam during the oxidation phase, eventual sources of additional water, and, in general, a slower core degradation progression. The studied MELCOR results for LB-LOCA predicted between 0.04–0.11 kg H2/MWth, and our results were within this range. In principle, it is more difficult to assess more recent MELCOR versions for LB-LOCA as limited data are available. In the recent and extensive PWR reactor study [68], the COR package nodalizations were studied for LB-LOCA in a three-loop Westinghouse type plant, and similar values were predicted in the range of 0.07–0.1 kg H2/MWth. For the BE results with a hydrogen-to-power ratio equal to 0.05 and 0.06, our model predicted a low hydrogen mass but was still comparable to other LB-LOCA simulations.

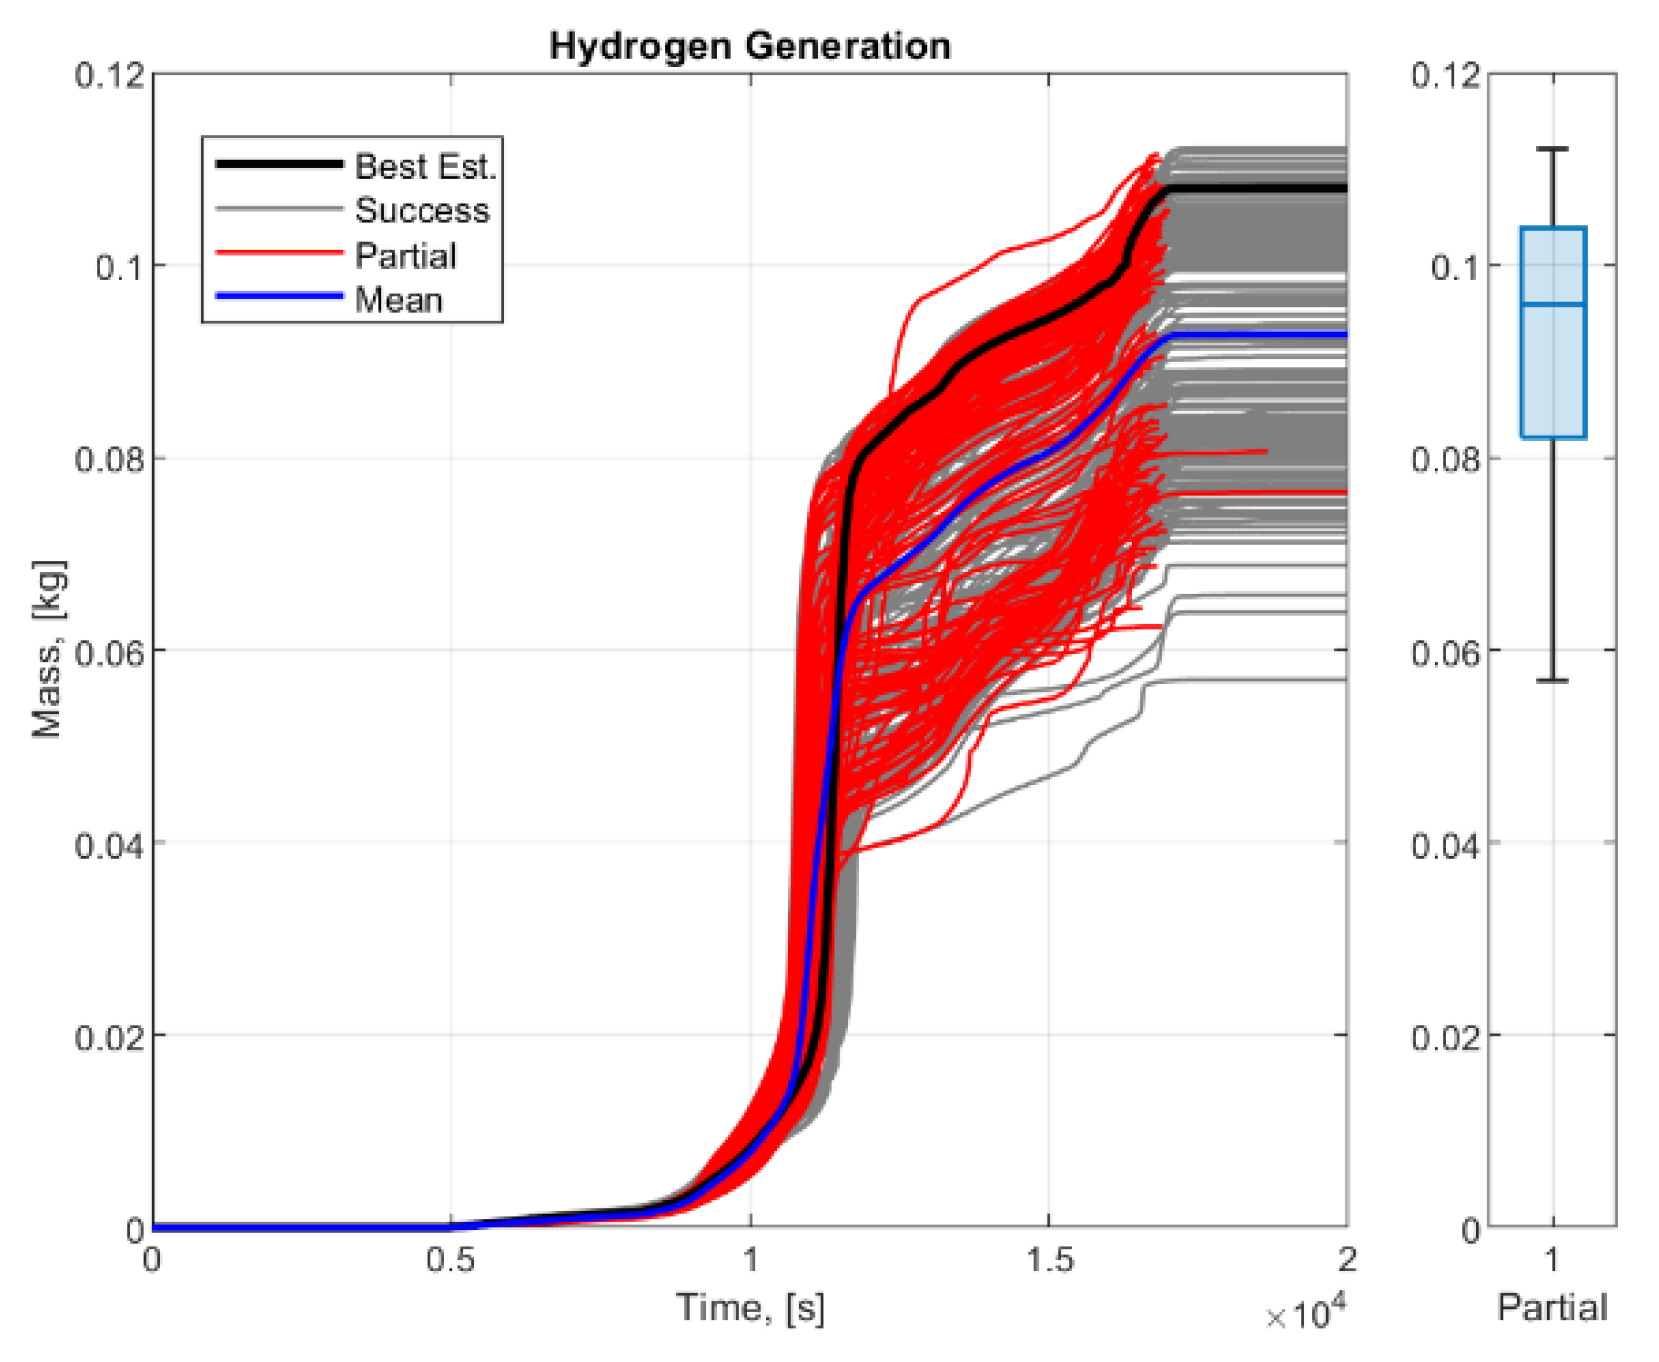
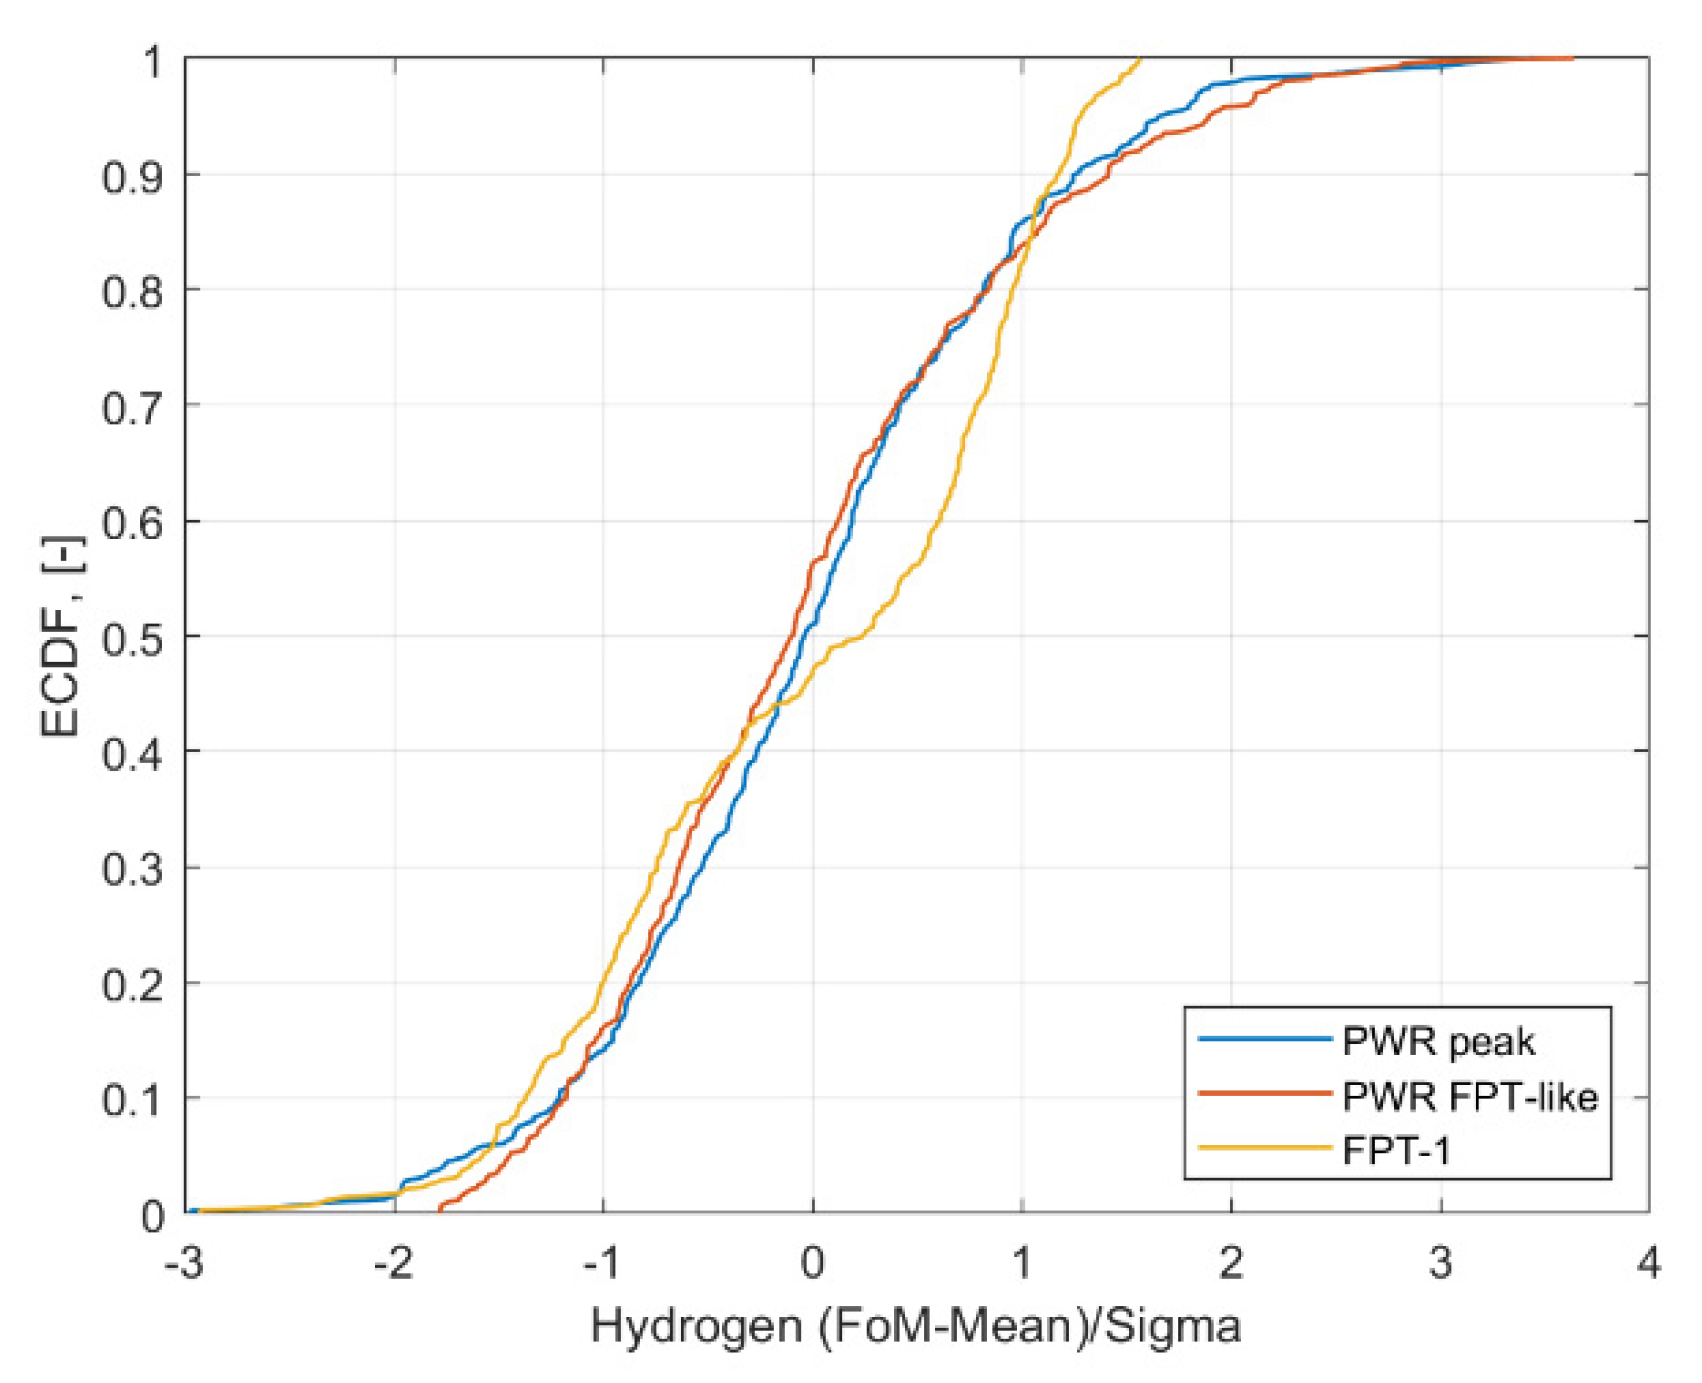
3.2. Uncertainty Analysis

Uncertainty analysis was performed for datasets with all successfully calculated cases (grey lines) and partially successful (red lines) cases screened for hydrogen mass convergence (FoM)—see Figure 8 and Figure 9. The screening limit for PWR was 2500 s, and for FPT-1 it was 16,500 s. Limits were selected for the time when most of the oxidation was completed while also considering code failures.
For PWR cases (Figure 8), the first that can be observed was the significant impact of the power profile, and the relative difference between medians, for both models, was ~25% (~69 kg), which was similar to the difference observed for BE cases (Figure 7). For the PWR with an FPT-like profile, the final mean was 279 kg, and the median was 277 kg with lower and upper quartiles in the range of 257–299 kg and whiskers in the range of 225–360 kg. The best estimate result equal to 232 kg was below the two-quartile region and substantially below the median. Outliers were observed only for the upper values with the highest value of 392 kg, and the lowest observed value was 225 kg. In the case with a top-peaked power profile, the final mean and median were 348 kg and 346 kg, respectively. The quartile box (upper and lower quartiles around the median) was in range of 319–374 kg and the whiskers were in the range of 237–457 kg. The best estimate result, 286 kg, was in the lower values region and out of the quartiles box, significantly below the median, similarly to the previous case. A few outliers above and one below were observed; the maximum value predicted was 496 kg, and the minimum was equal to 220 kg. Interestingly, the FoM mean value was very close to the median value for all cases.
For the FPT-1 model, the final median FoM was 95.9 g, being very close to the experimental value (96.7 g, ~0.8% difference). The mean value was 92.7 g, the minimum and maximum values were equal to 56.9 g and 112.1 g, respectively, and the 50% percentile box was in the range of 82.1–103.7 g. It is worth observing that the BE result was out of the quartiles box and even close to the maximum value obtained in the analysis.
In order to compare cases, the FoM was normalized by the final mean value, and time was normalized by the end of the oxidation time; outcomes are presented in Figure 10. For the PWR reactor, it can be observed that the shape is practically the same for both models, and observed uncertainties had the same magnitude being close to ~20–25% of the median value for the 95% percentile band, and the 50% percentile band had less than a 10% band around the median. In the case of FPT-1, we observed a similar outcome. The 95% percentile was within 20–25% of the mean value, and 50% was within the ~10% band around the median value.
The properties of the distributions were confirmed by normalized empirical cumulative distribution functions (ECDF)—Figure 11. We observed the normal-like distributions for both PWR reactor results—with the mean equal to the median being a characteristic of a normal distribution. Nevertheless, for the FPT-1, we observed different, non-normal behavior. At first sight, Figure 11 suggests that it is likely that the FoM deviation from a normal distribution is caused by the fact that the screening limit was too artificial and that a larger portion of cases failed, which would cause deviation in the statistics from the normal distribution. However, studying earlier points in time, when practically all cases were successful, we also observed similar deviations from a normal distribution (which can also be observed in Figure 10 (Right)). The source of this discrepancy was not identified, but we should remember that the PWR scenario can be considered simpler than the FPT-1 experiment sequence. The issue of failed cases is elaborated below as it is an important practical problem for severe accident U&SA.
For the PWR with the top peak profile, 340 cases were calculated fully successfully (87.5%); 54 partially successfully, considering the FoM limit (the 2500 s) success ratio was 98.5% (394); and only 6 cases failed. For the case with the FPT-like profile, 333 cases were successful (83.25%), and 65 cases succeeded partially; 99.5% of cases reached the assumed oxidation time limit. Figure 8 indicates that most of the partially successful cases failed much later than the end of oxidation.
The situation was worse in the case of FPT-1; only 212 (53%) cases were fully successful, 128 (32%) were partially successful (totally 85%), and 60 cases failed. Because many failed cases were near the limit (see Figure 9), we can conclude that the final results are slightly underestimated and that the statistics deviate. Most of the failures occurred at the moment of bundle power reduction (effectively) to zero, when no more hydrogen was produced. However, we failed to find the reason for this effect. Typical procedures like the reduction in maximum and minimum time-steps were applied without success. Despite that, the FoM was expected to be close to the converged state, but it was slightly underestimated in at least part of the failed cases, as can be deduced by studying Figure 9. The reader should be aware of this fact and should have a proper margin of confidence. It was assessed that the introduced error was less than 5 g (~5%) of the FoM for partially successful cases.
Moreover, when simulations (not reported here) were repeated with an older code version, different outcomes were observed. For the PWR model, when M2.2.15 was used, it failed in substantially more cases than for the recent revision M2.2.18. On the contrary, when the FPT-1 model was calculated with, e.g., M2.2.11, it was more efficient in terms of successful cases. Despite that, in this work, we decided to use only the most recent M2.2.18 to maintain consistency between PWR and FPT-1 results. MELCOR users should be aware of the observation that the different code versions can provide different results.

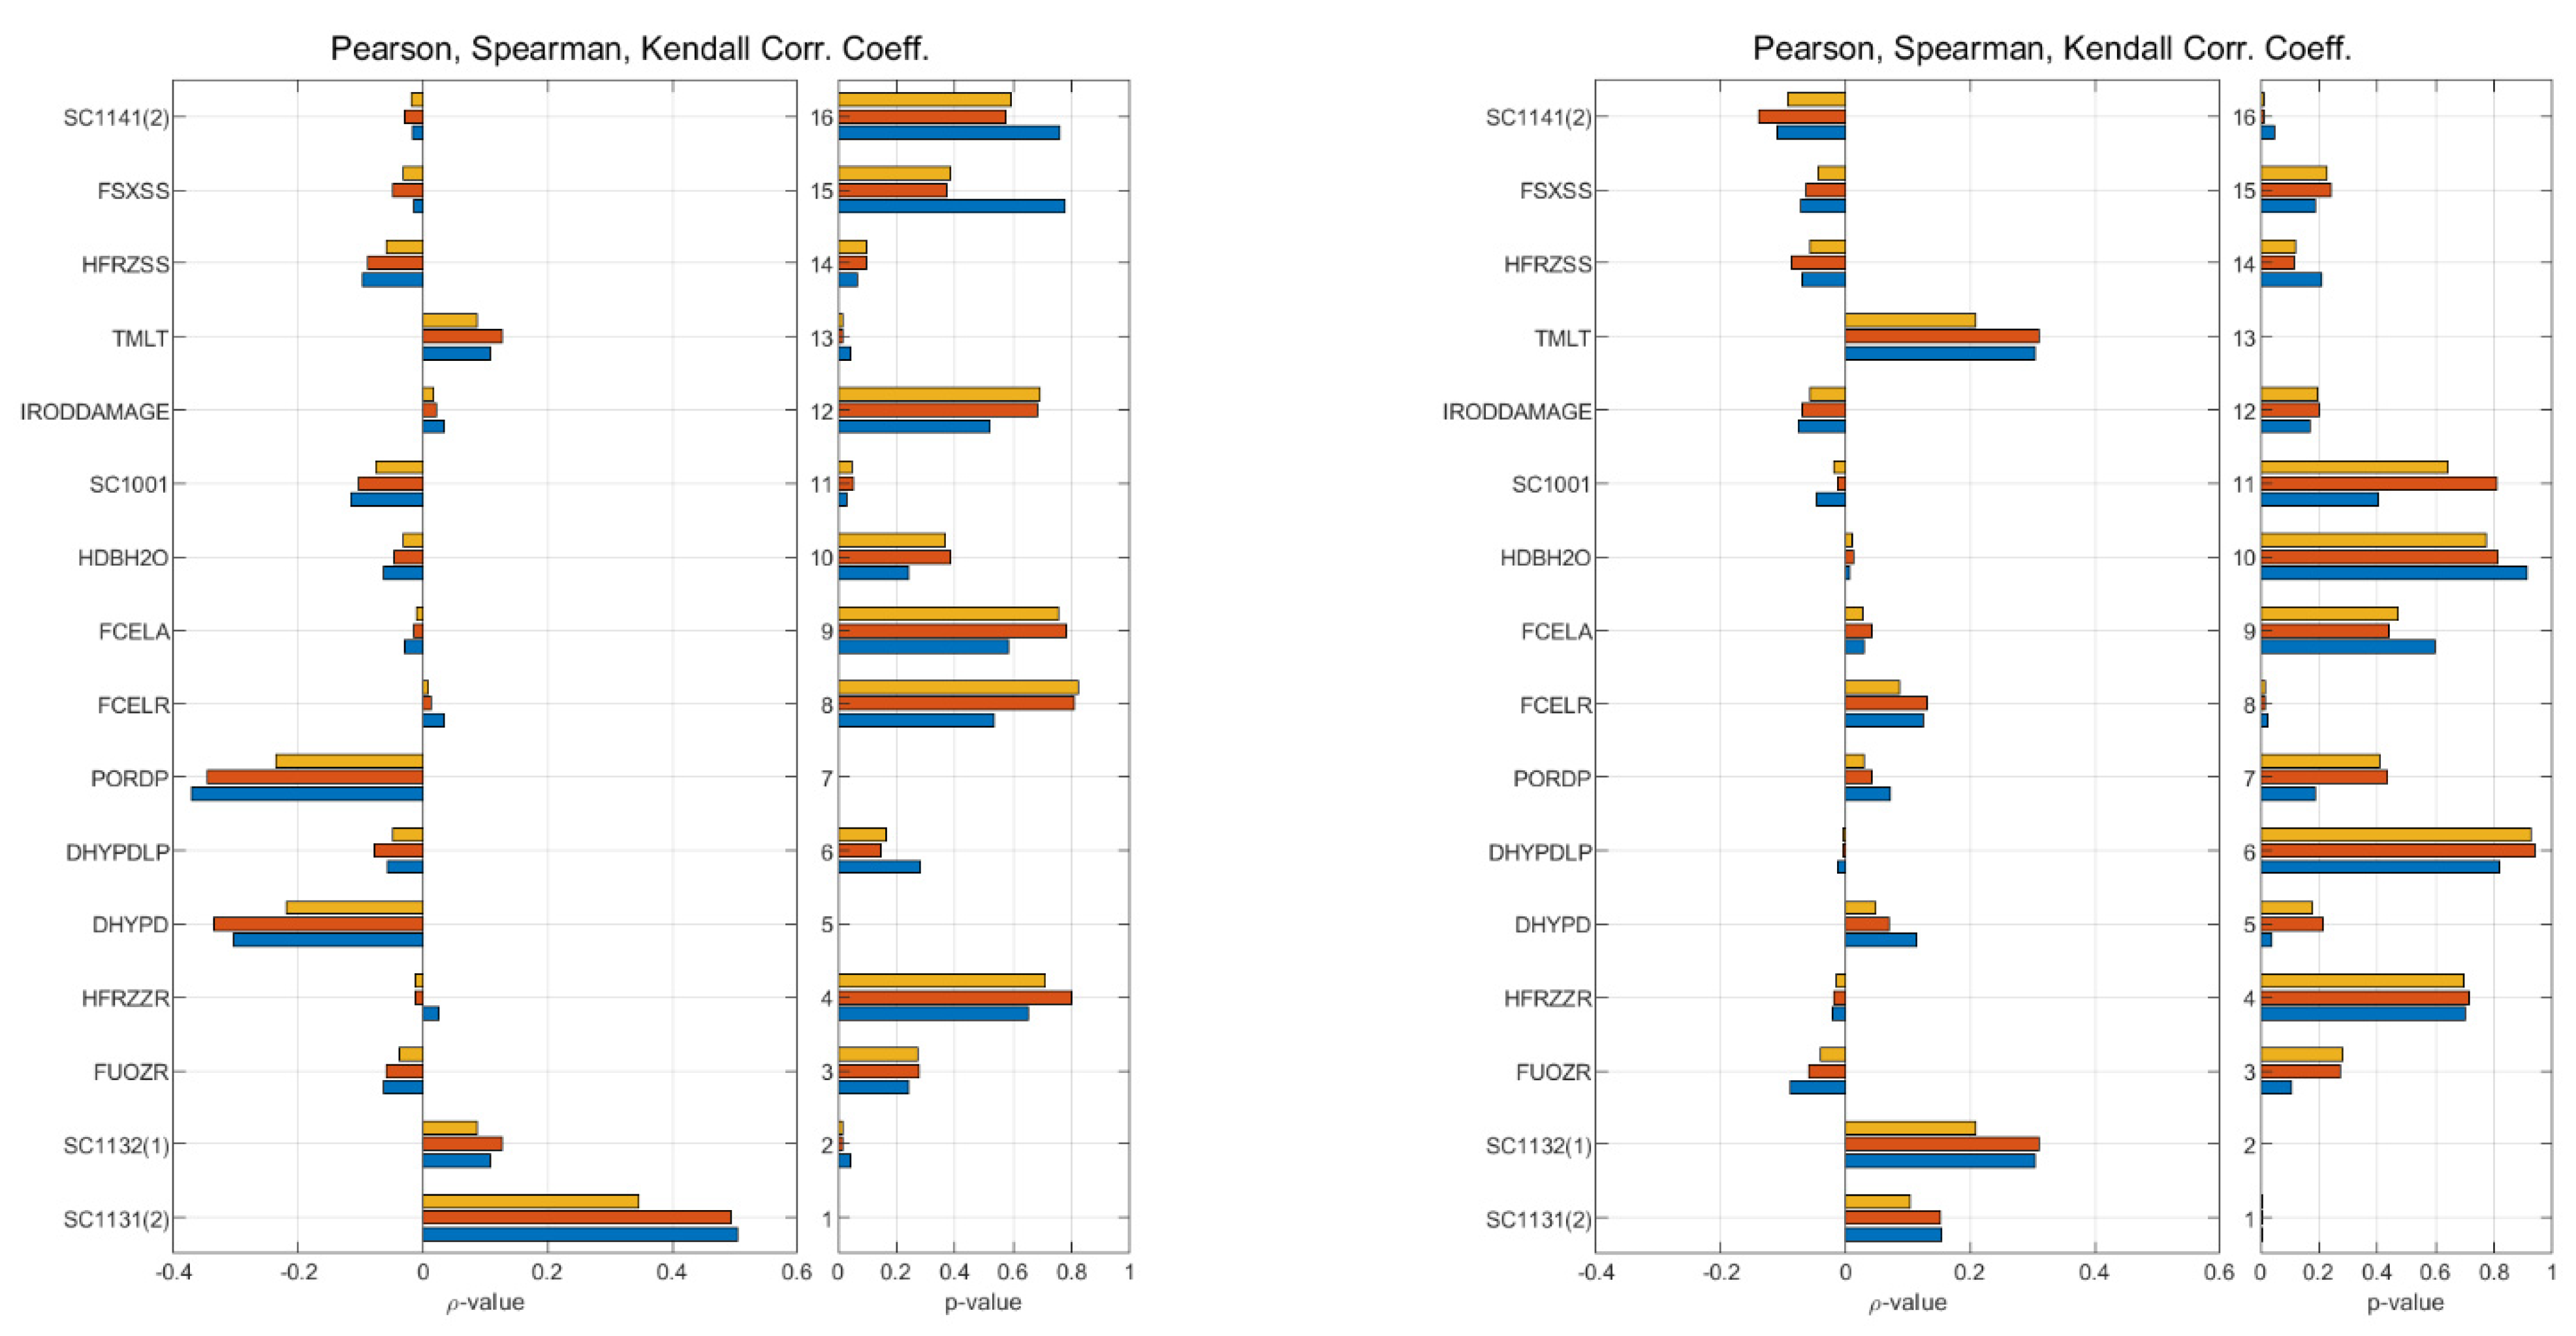
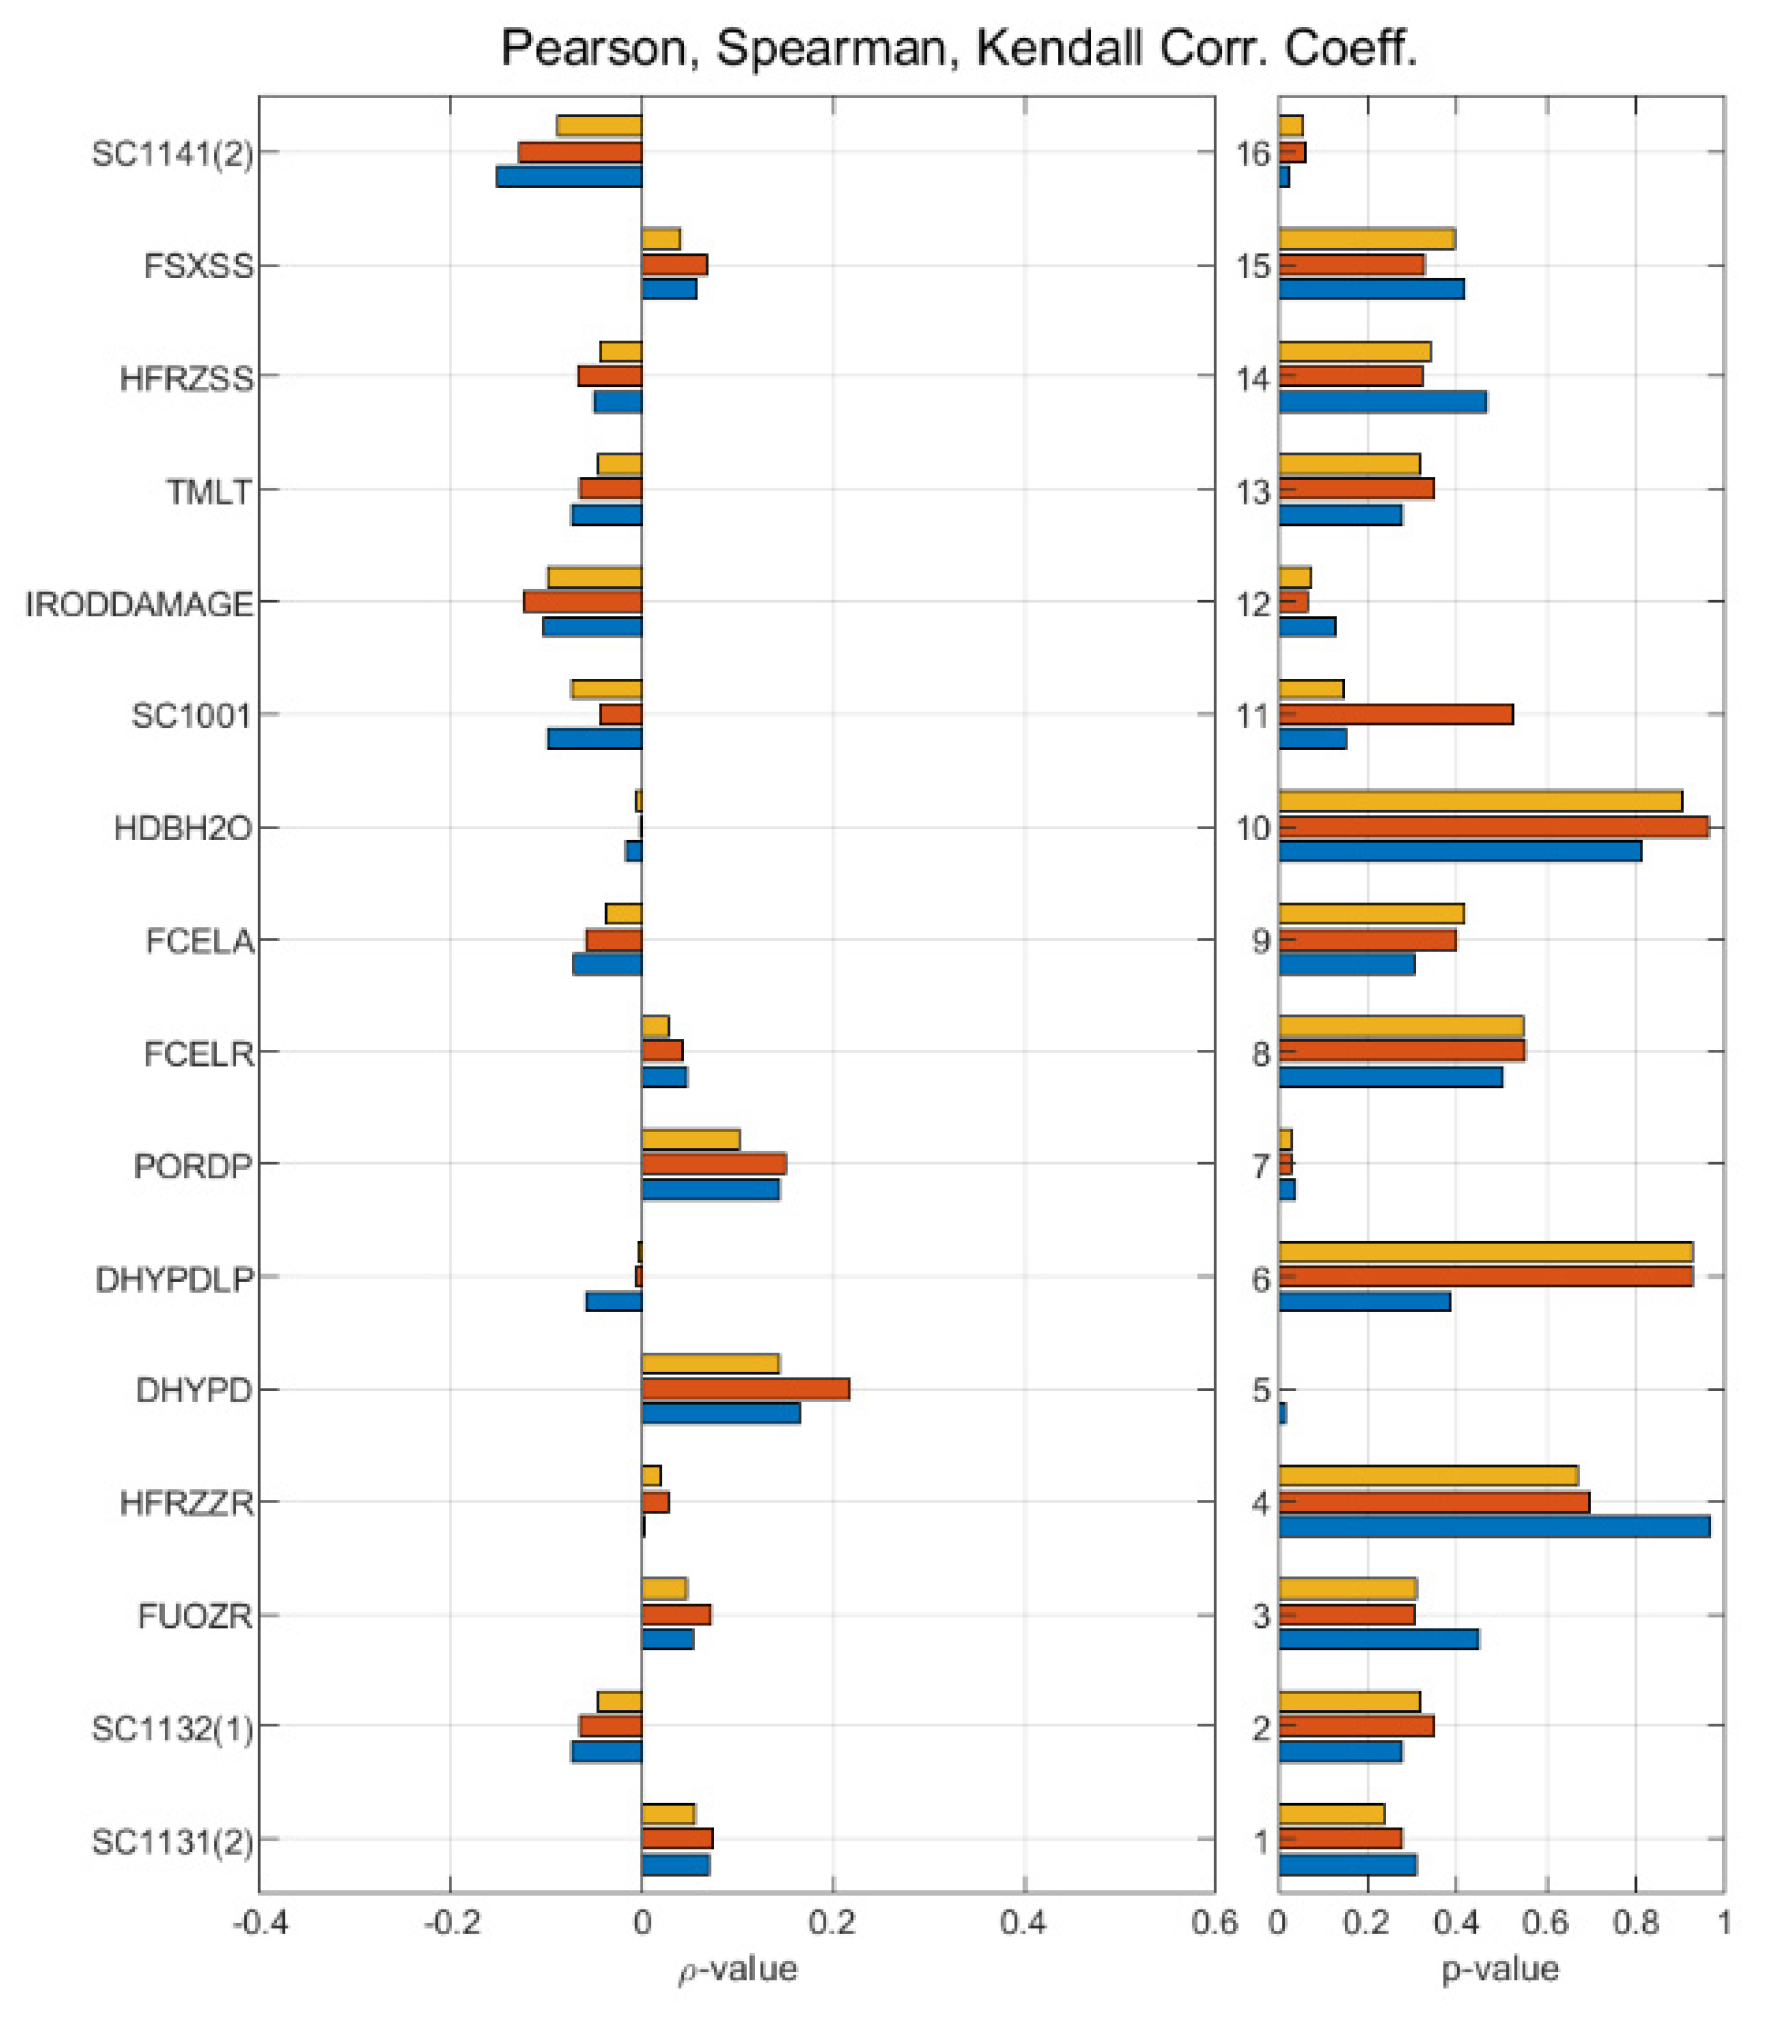
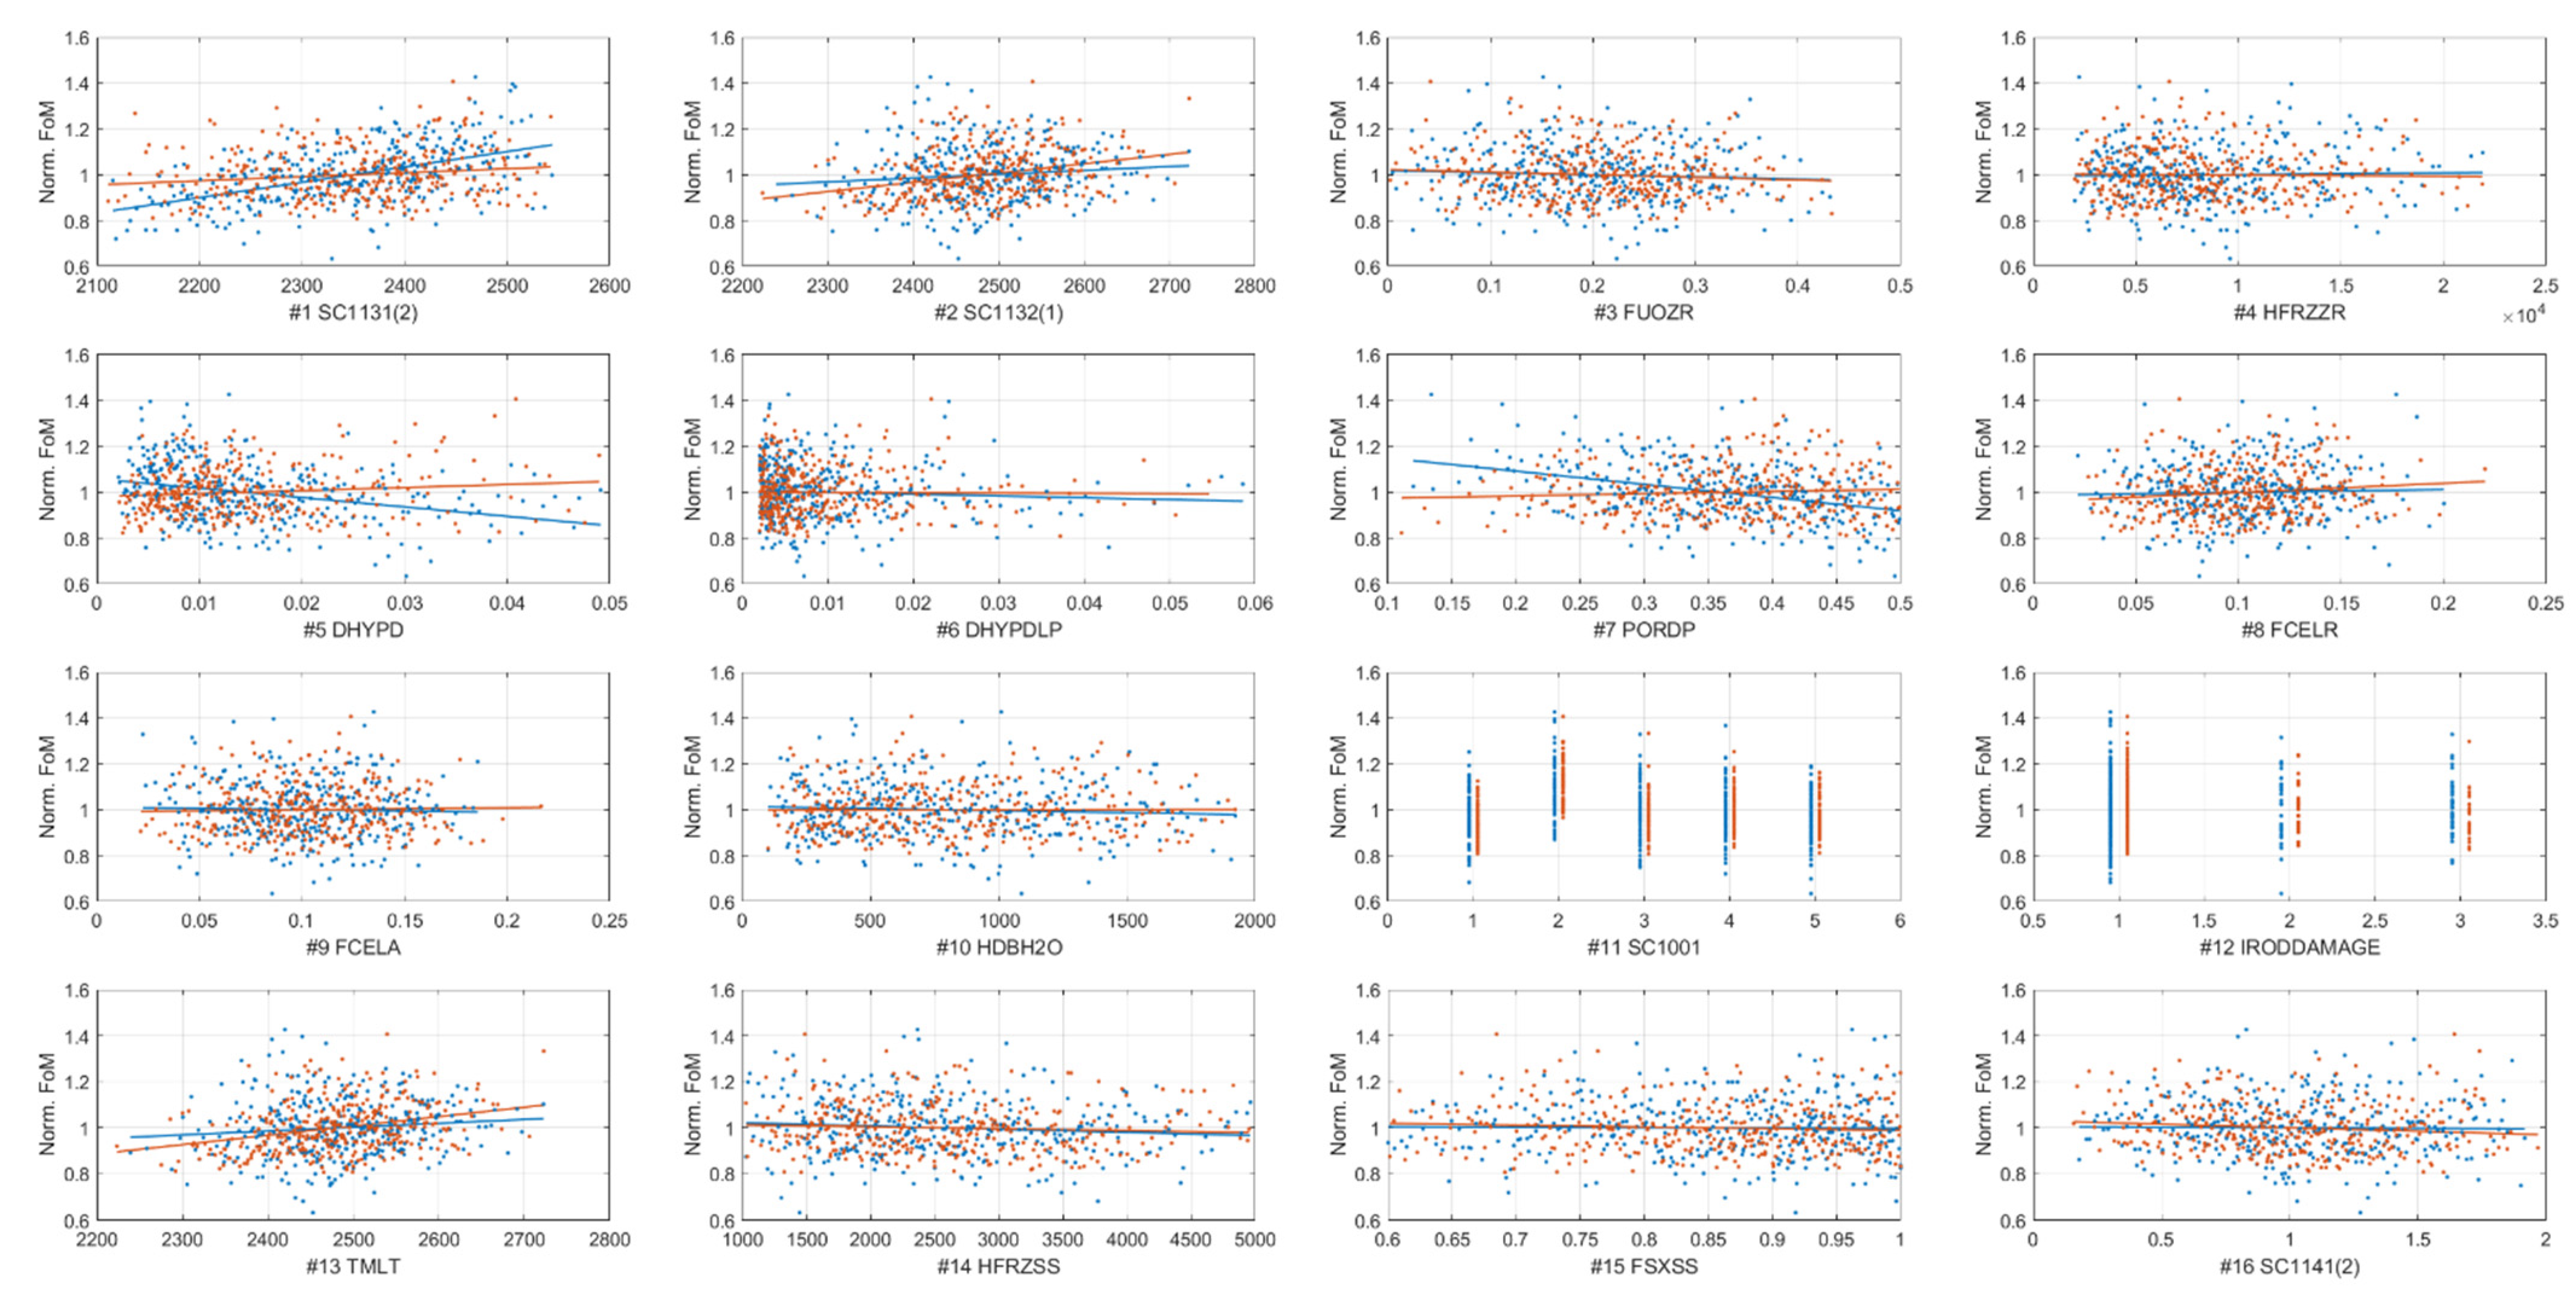
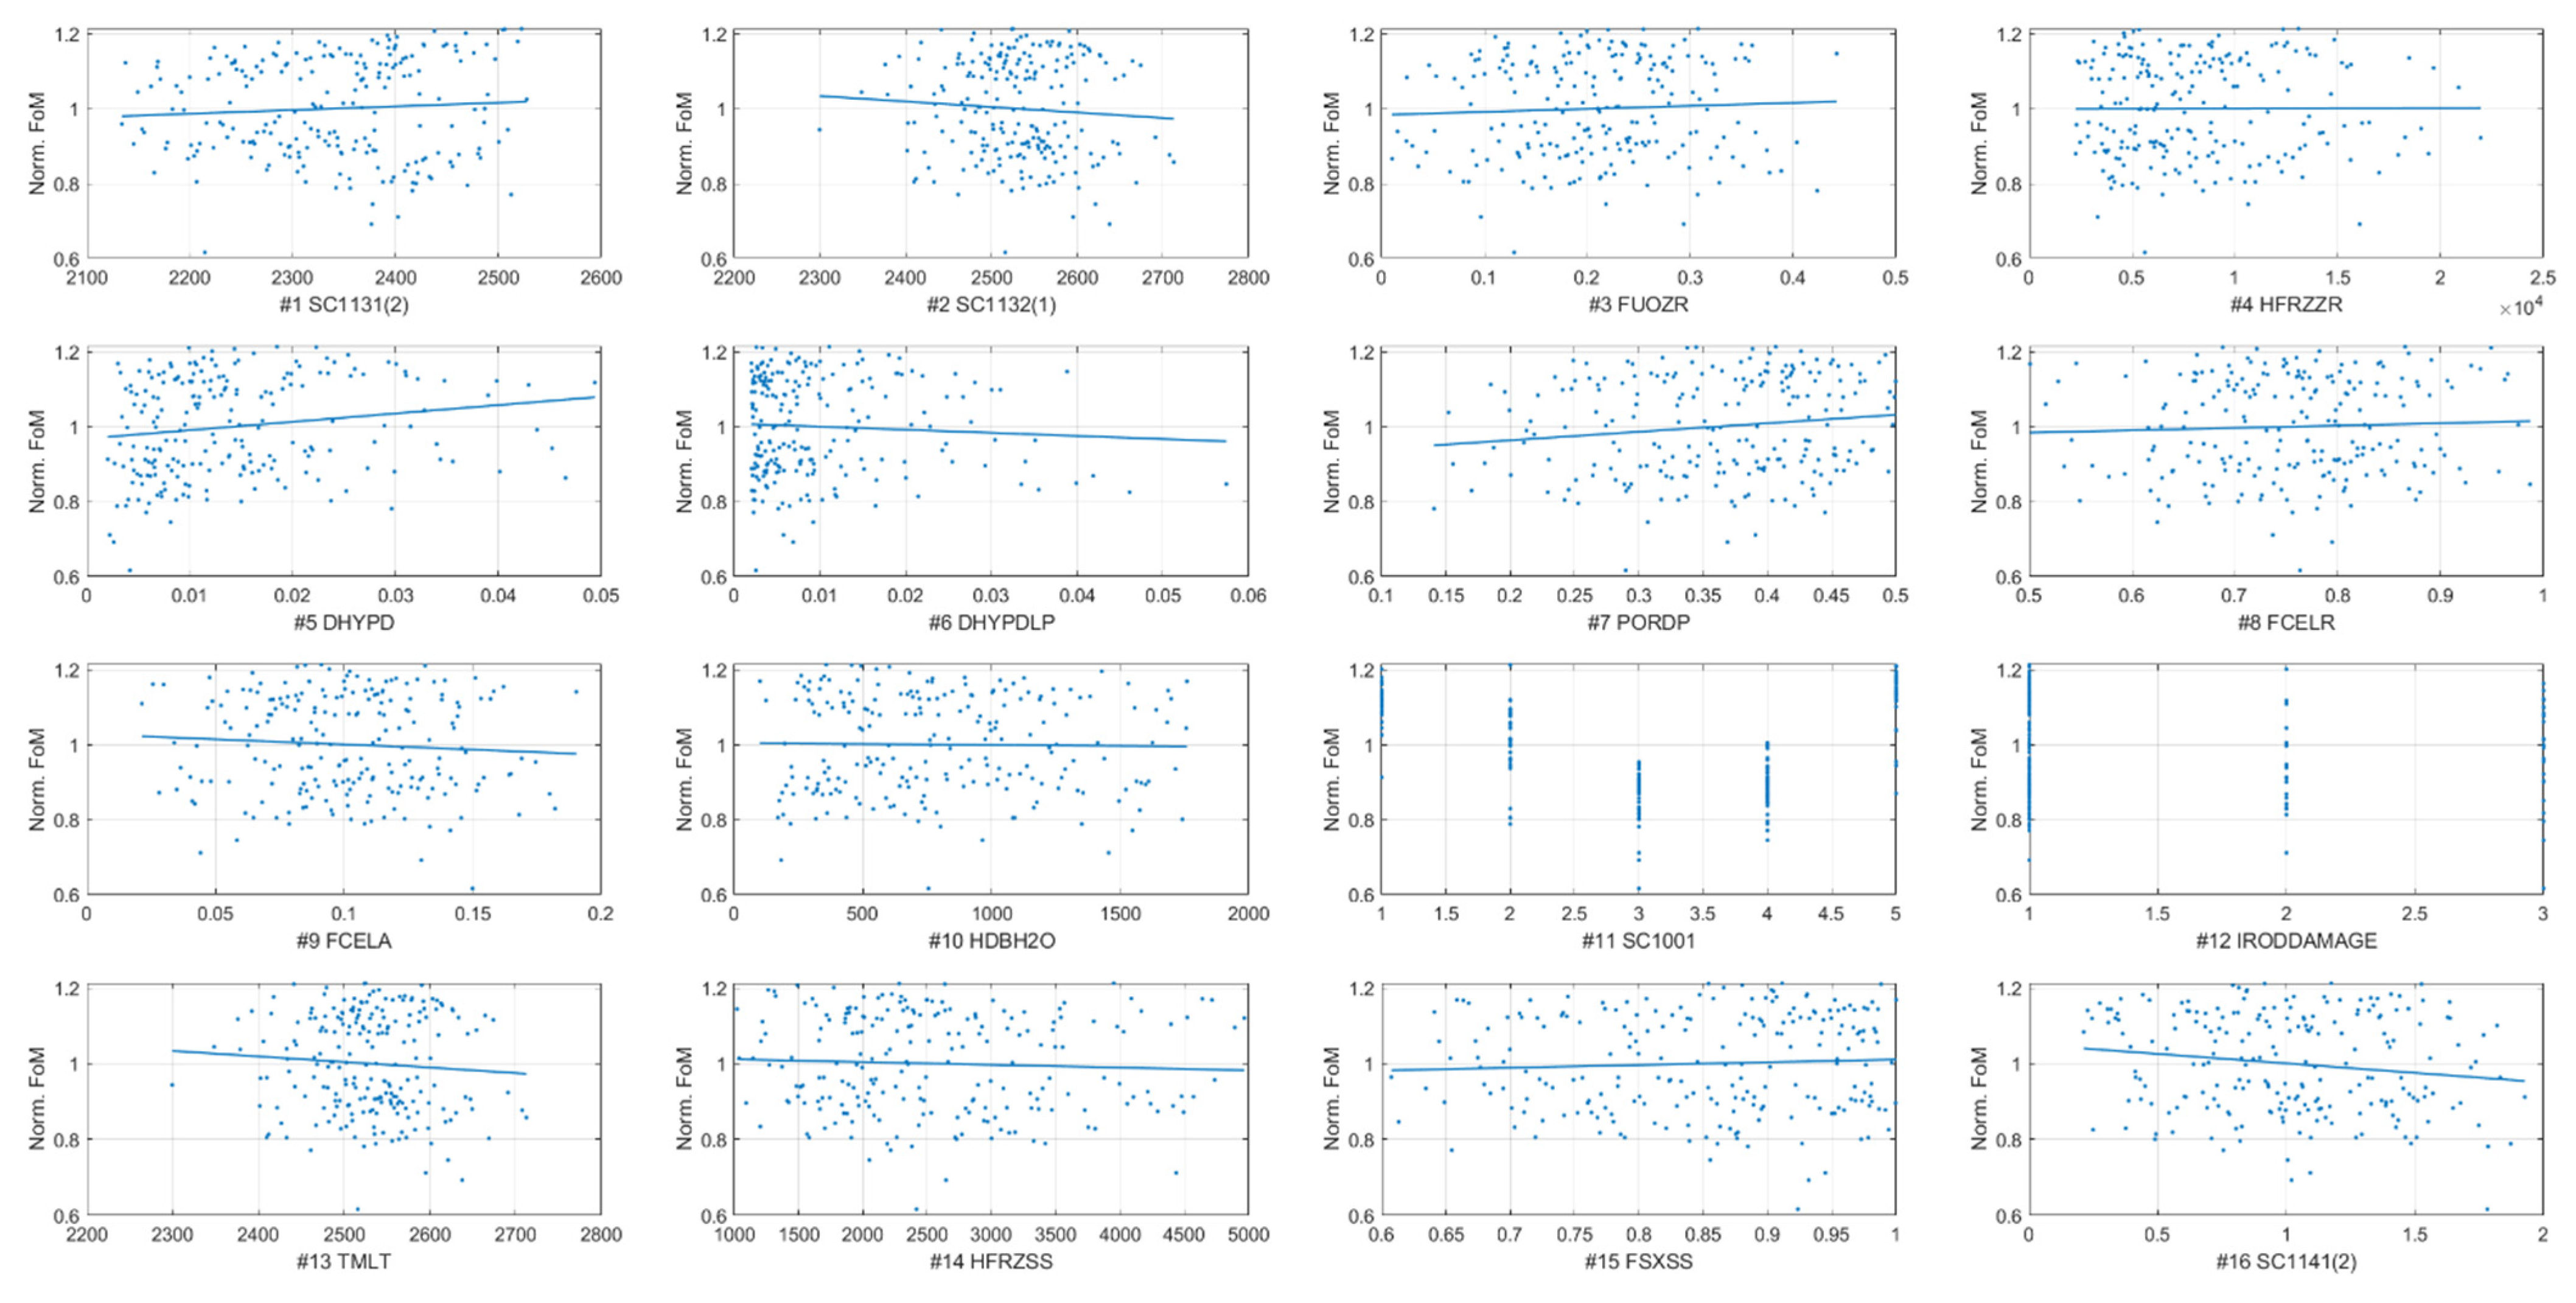
3.3. Sensitivity Analysis

Interpretation of correlation coefficients is not obvious and different practices are present in publications and in various fields. In the literature, it is possible to find various limits for levels of correlation (e.g., [69,70,71,72,73,74]). In principle, each coefficient can also have different limits. For simplicity and clarity of the analysis, we assumed the same levels of correlation for all considered coefficients, and a similar approach was used in [69,72,75]. We assumed that |ρ| < 0.2 indicates no reasonable correlation (or a very weak correlation), and it was also applied by Itoh and Zheng [11,75] for various coefficients, by Freixa et al. [74] for Pearson, and by Joo at al. for Spearman [71]. The assumed limit for low and moderate correlations was |ρ| < 0.4 and |ρ| < 0.7, respectively, and it was based on Joo [71] and Schober [72]. In some special circumstances when the p-value was very low or similar correlation patterns were observed for PWR and FPT-1, we considered a very weak correlation for |ρ| > 0.1 and |ρ| < 0.2. However, these cases should be treated with a large margin of confidence, and they are rather unreasonable correlations. In some references, researchers consider weak correlation for cases with |ρ| > 0.1 [72].
Figure 12 and Figure 13 presents three different correlation coefficients: linear Pearson, non-linear Spearman rank, and Kendall coefficients for all studied uncertainty parameters. Figure 14 and Figure 15 present a normalized FoM as a function of uncertainty parameters with linear-regression-generated trendlines. Thanks to normalization by the final FoM mean, the comparison is more comprehensible. It should be highlighted that for the discrete parameters SC1001 and IRODDAMAGE correlation coefficients have no meaning.
In this work, the correlation was considered statistically significant when p < 0.05. However, the reader should be aware that different practices can be found in the literature. In principle, a high ρ with a low p indicates a correlation.
In the case of the peaked PWR, we can observe (Figure 12 (left)) that the negative weak correlation exists for the porosity (PORDP) and the core region hydraulic diameter of debris (DHYPD). It is also supported by Figure 14 (blue curves, #5 and #7). We can attempt to explain it by the fact that the smaller debris particles have a larger area of contact with their surroundings, and oxidation is more likely, leading to a larger hydrogen generation. The decrease in porosity may, counterintuitively, lead to a higher hydrogen mass. On the one side, a larger porosity should allow steam to access and oxidize debris more easily but also to cool it more effectively. However, a larger porosity allows steam to rapidly leave the debris surroundings and decrease the chance of contact. What is also important is that lower porosity should lead to higher temperatures, and because oxidation is driven by temperature-dependent parabolic kinetics, more violent reactions should occur. Unfortunately, this type of explanations fail when compared with the PWR case with an FPT-like profile, which shows no correlations (Figure 12 (right) and Figure 14)), and, in general, no negative type correlation was observed. The power profile shifted towards lower portions of the core, which simply do not allow these effects to emerge at a proper scale.
In Figure 12 (left), for the peaked profile case, we can observe a moderate positive correlation for SC1131 (2) (zircalloy melt breakout temperature). It shows that the delay of candling affects hydrogen production because of the physical separation of steam and Zr. In the case of the FPT-like profile (Figure 12 (right)), for SC1131 (2), correlation is much less significant and was below the weak correlation limit; but, its p-value was almost zero, and it can be considered as a very weak correlation. We can observe that correlations were stronger for the peaked profile (see #1 in Figure 14).
Similarly, for fully correlated variables SC1132 (1) (rod collapse temperature) and TMLT (eutectic temperature), a correlation with FoM is visible (#2 and #13 Figure 14). It is much stronger and above the weak correlation limit for the FPT-like profile but slightly below the limit (very weak) for the peaked profile (Figure 12). The impact was expected as this parameter affects candling and blockage occurrence.
Considering discrete parameters, the oxidation correlations (SC1001) have a similar spread of results (see Figure 14, #11), with Baker–Just (#2) being an exception, with apparently higher hydrogen production for both PWR models. Parameter #12 is inconclusive; the basic time-at-temperature model was much more probable than others.
In the case of the FPT-1 model (Figure 13), a very weak ( | ρ | > 0.1 and | ρ | < 0.2 ) negative correlation with p < 0.05 can be observed for SC1141 (2), and it is also present for PWR with an FPT-like profile but did not appear for the peaked PWR case. Positive very weak correlations with p < 0.05 existed for PORDP and DHYPD, and, on the contrary, they were not significant for PWR with the FPT profile (but, they existed for the peaked profile). For almost all parameters for FPT-1, the rho-value was lower than 0.2, and only the Spearman coefficient for DHYPD was larger than 0.2; so, it is the only reasonable correlation for this model.
We can observe the effects for all parameters by studying the linear regression results in Figure 15. Considering the discrete variables (#11 and #12), we can observe no evident effect for the time-at-temperature model; but, there was an impact of oxidation correlation (SC1001). Models 3 and 4, both using Prater–Courtright, were responsible for less hydrogen than other cases.
The main observation of the sensitivity analysis was the dependence of the results on the power profile being the boundary condition for the PWR model. It is an important lesson showing that the typical approach to sensitivity analysis should be used very carefully when someone attempts to draw any general conclusions about modelling parameters sensitivity. The same model can provide different results when different BC are used and can eventually lead to opposite observations. We can postulate that the researchers should not draw too general conclusions based on this type of analysis. Moreover, it was observed that the existence of a correlation for the experiment does not guarantee that we will observe the same correlation for plant scale simulations.
In principle, obtained correlations are partially in agreement with H2-focused studies by Gharari and Gauntt. In Gharari [6], (Figure 11) for the in-vessel (VVER) hydrogen production, they observed slight positive correlations for Zr melt release SC1131 (2) and debris particle size in the lower plenum (PORDPLP) and slight negative correlations for axial radiation exchange and falling debris HTC. In the Gauntt report [35,44], only moderate or weak correlations were observed for the in-vessel hydrogen generation with positive correlations on Zr melt release and candling HTC, and a negative dependence was observed on falling debris HTC and lower plenum debris. In this work, no significant correlations were observed for falling debris and lower plenum debris size.

4. Conclusions

In this work, simulations focused on hydrogen generation during a low-pressure LB-LOCA sequence were studied for both a large generation-III PWR reactor and integral experiment Phebus FPT-1. The FPT-1 experiment was analyzed (see also [28,29]), and subsequently, its outcomes were applied to the analysis of the PWR reactor. The scope was limited to a severe accident during the in-vessel phase before the RPV failure.
The Phebus FPT-1 experiment model was updated with MELCOR 2.2.18. The best estimate simulations were compared with alternative solutions, and reasonable agreement was observed. Similarly, PWR reactor simulations were performed, and obtained hydrogen masses were considered low but comparable with the literature data and assessed as reasonable.
The dedicated sensitivity and uncertainty analysis methodology and proper MATLAB-based open-software were developed and tested in this work. The uncertainty analysis was performed for sixteen different parameters selected after the literature review. Overall, more than 1200 MELCOR runs were executed, 400 per each studied case. Uncertainty analysis showed that, despite the differences in kinetics, and scale, the final variation of FoM (hydrogen mass) was similar in both FPT-1 and PWR. The 95% percentile band had boundaries being ±~25% value of the mean around the median, and the 50% percentile was within the 10% band around the median (see Figure 10); it was also indicated by empirical CDFs, which had very similar shapes for all cases (see Figure 11). It showed that the variation predicted by the experiment had a similar magnitude as the variation predicted at the plant scale.
Moreover, it was observed that the median values were close to the mean, and both were substantially different from the best estimate result obtained with the recent MELCOR best practices. Analysis of best-estimate parameters clearly showed that default and best-practices substantially changed during the years, and it introduced variation into the results obtained during different code versions and different practices. This work observed that the best estimate FPT-1 models predicted the FoM being larger than the experiment and substantially larger than the estimated median. The opposite was true for the PWR plant scale, where the best estimate results were substantially lower than the median.
For the PWR reactor, moderate or weak correlations were observed for debris porosity, debris hydraulic diameter in the core (both only for the peak-profile), the rod collapse/melting temperature (only the FPT-like profile), and the Zr melt breakout (only the FPT-like profile). Some dependence was observed for the oxidation correlation selection. Very weak correlations can be considered for the melt breakout temperature (FPT-like profile) and for some other parameters, but they should be considered with a large margin of confidence. For PWR models, moderate or weak correlations were present only for a few parameters. For the FPT-1, all coefficients were below the weak correlation limit. An exception was the debris diameter with a weak correlation but only for the Spearman coefficient. Eventually, a very weak correlation, below the 0.2 limit, could be considered for the debris porosity and the melt flow rate after the breakthrough. Similar uncertainty parameters were indicated by Gharari and Gauntt studies for other reactors but typically with different correlation levels.
In the literature, a large variation of hydrogen production can be found among different computer codes (like MELCOR vs. MAAP, e.g., see [16]) but also among the same code results (see Table 5). Different results can be obtained with different models, code versions, or accident scenarios, which may sometimes confuse the analyst. This work shows that even for the same model and code version, large variations can be observed when modelling parameters are changed and when significant boundary conditions are varied (e.g., power profile). Different uncertainty parameters can be more significant, and some can lose significance. In this research, the example of this was an observation of the role of a power profile change, where the observed difference for BE cases was ~25% in the mean FoM. It introduced an additional level of difficulty to study S&UA for different reactors, and it demands further research. Moreover, this study was focused only on modelling parameters, but, for full-scale uncertainty analysis, initial and boundary conditions should be investigated, and it should also be a matter of future research.
Regarding selection of uncertainty parameters, we applied outcomes of other studies, but we believe that a more systematic approach should be executed in the future. Proper guidelines for each MELCOR modelling parameter can be developed, but it demands a larger effort, likely selecting a large group of parameters and then systematically selecting important parameters on the basis of analytical studies and not on the basis of other research. A similar approach was proposed by Itoh [11]. Moreover, a sample of 400 input-decks is large, but we believe that larger samples could be used in the future with more detailed studies, larger than 1000, and similar to SOARCA [76].
As was indicated at the beginning of the section, the uncertainty analysis approach worked appropriately. The approaches based on Monte Carlo (eventually Wilks) allowed us to obtain confidence intervals, which is their significant advantage. However, in this study, the typical approach to sensitivity analysis proved to be not as efficient. We observed that using relatively simple and standard statistical tools for correlations (linear regression with Spearman or Pearson) do not provide conclusive answers about sources of uncertainty. These methods are very popular and were used by several researchers (e.g., [6,9]). It is difficult to indicate the main source of the observed variation in the final FoM. Even though the same shapes of hydrogen production were predicted for PWR, different parameters were indicated to be important with opposite correlations. In general, we can see that there is no single parameter responsible for the observed differences. We can speculate that the observed large variation in hydrogen generation is a cumulative effect of all varied parameters, as no single strong effect was observed. Additionally, in this study more than 300 runs were applied for a sensitivity study, but, for a typical approach, researchers use 59 or 93 runs, and it will likely magnify the observed issue.
Removal of failed cases is a problem for LHS sampling. The LHS method demands knowledge about the number of samples before the actual sampling procedure. In consequence, fully failed cases, which are inevitable with MELCOR, pose a problem for input space stratification. This topic is also discussed in more detail in [45,53]. Fortunately, in this work, fully failed cases were a minor percentage of all results, and bias was expected to be low. Nevertheless, considering this problem for future research, we recommend using SRS for studies with the number of input decks as large as those studied in this work.
Discussion of sensitivity indicates that more sophisticated statistical tools and methods should be considered. In order to identify sources of uncertainty, the global uncertainty and sensitivity methods can be used, and they will be applied in future research [10,23,24,26]. It can be expected that the effects are higher-order and that simpler first-order analysis, applied here, and common among other researchers is not enough. In the future, more advanced methods are necessary to indicate the source of the observed uncertainties.

Supplementary Materials

The following are available online at https://www.mdpi.com/article/10.3390/en14164884/s1. Supplementary data contains sampled parameters and proper plots. Other data are available on demand. The MELCOR dedicated MATLAB uncertainty and sensitivity engine (MelSUA) is a part of the larger X-Core Matlab Toolbox, being developed for nuclear safety applications. MelSUA is available at: https://gitlab.com/darczu/x-core/-/tree/master/Modules/MLC_package/SenstivityUncertanityAnalysis (accessed on July 2021).

Author Contributions

Conceptualization, P.D.; methodology, P.D. and P.M.; software, P.D.; validation, P.D.; formal analysis, P.D.; investigation, P.D.; resources, P.D. and P.M.; data curation, P.D.; writing—original draft preparation, P.D.; writing—review and editing, P.D. and P.M. and M.W.; visualization, P.D. and P.M.; supervision, P.D. and M.W.; project administration, P.D.; funding acquisition, P.D. and P.M. All authors have read and agreed to the published version of the manuscript.

Funding

This research project has received funding from the Euratom research and training programme 2014-2018 under Grant Agreement No. 755439—project Horizon 2020 NARSIS (New Approach to Reactor Safety Improvements). The APC was funded by Warsaw University of Technology—Program Open Science IDUB.

Institutional Review Board Statement

Not applicable.

Informed Consent Statement

Not applicable.

Data Availability Statement

Data available on demand.

Acknowledgments

The early version of the Phebus FPT-1 model used in this work was developed in 2018 during the project financed by the National Atomic Energy Agency (PAA, the Polish Nuclear Regulatory Body) under the contract: 304/2018/DBJ. First Author would like to acknowledge PAA for support of nuclear engineering research at WUT. The first author would like to acknowledge a very fruitful discussion during the European MELCOR User Group Meeting EMUG-2021 (during this meeting several topics connected to this work were discussed). We would like to thank the anonymous reviewers for their valuable comments and suggestions.

Conflicts of Interest

The authors declare no conflict of interest.

Appendix A

Figure A1. CDF functions and samples for PWR peaked profile model. For the PWR FPT-like profile, the same distributions were applied but with a different sampling seed.
Energies 14 04884 g0a1
Figure A2. CDF functions and samples for FPT-1 model.
Energies 14 04884 g0a2

References

  1. Sehgal, B.R. Nuclear Safety in Light Water Reactors Severe Accident Phenomenology; Academic Press: Cambridge, MA, USA, 2012. [Google Scholar]
  2. IRSN. Nuclear Power Reactor Core Melt Accidents; EDP Sciences: Paris, France, 2015.
  3. Lee, J.C.; McCormick, N.J. Risk and Safety Analysis of Nuclear Systems; Wiley and Sons: New York, NY, USA, 2011. [Google Scholar]
  4. IAEA. IAEA-TECDOC-1797 Accident Tolerant Fuel Concepts for Light Water Reactors; International Atomic Energy Agency: Vienna, Austria, 2016. [Google Scholar]
  5. Dehjourian, M.; Sayareh, R.; Rahgoshay, M.; Jahanfarnia, G.; Shirani, A.S.; Sayyareh, R. Investigation of a Hydrogen Mitigation System During Large Break Loss-of-Coolant Accident for a Two-Loop Pressurized Water Reactor. Nucl. Eng. Technol. 2016, 48, 1174–1183. [Google Scholar] [CrossRef] [Green Version]
  6. Gharari, R.; Kazeminejad, H.; Kojouri, N.M.; Hedayat, A.; Vand, M.H. Application of a severe accident code to the sensitivity and uncertainty analysis of hydrogen production in the WWER1000/V. Ann. Nucl. Energy 2021, 152, 108018. [Google Scholar] [CrossRef]
  7. Gharari, R.; Kazeminejad, H.; Kojouri, N.M.; Hedayat, A. A review on hydrogen generation, explosion, and mitigation during severe accidents in light water nuclear reactors. Int. J. Hydrogen Energy 2018, 43, 1939–1965. [Google Scholar] [CrossRef]
  8. Gharari, R.; Kazeminejad, H.; Kojouri, N.M.; Hedayat, A.; Vand, M.H.; Abadi, M.N.A.; Safarzadeh, O. Study the effects of various parameters on hydrogen production in the WWER1000/V. Prog. Nucl. Energy 2020, 124, 103370. [Google Scholar] [CrossRef]
  9. Foad, B.; Hassan, M.; Takeda, T. Uncertainty & sensitivity analyses for LOCA simulation of PHEBUS experiment FPT-1 using a modified SUNSET code. Ann. Nucl. Energy 2020, 144, 107575. [Google Scholar] [CrossRef]
  10. Galushin, S.; Kudinov, P. Sensitivity and uncertainty analysis of the vessel lower head failure mode and melt release conditions in Nordic BWR using MELCOR code. Ann. Nucl. Energy 2020, 135, 106976. [Google Scholar] [CrossRef]
  11. Itoh, H.; Zheng, X.; Tamaki, H.; Maruyama, Y. Influence of In-Vessel Melt Progression on Uncertainty of Source Term during a Severe Accident. In Proceedings of the ICONE22-2014 22nd International Conference on Nuclear Engineering, Prague, Czech Republic, 7–11 July 2014. [Google Scholar] [CrossRef]
  12. Saghafi, M.; Yousefpour, F.; Karimi, K.; Hoseyni, S.M. Determination of PAR configuration for PWR containment design: A hydrogen mitigation strategy. Int. J. Hydrogen Energy 2017, 42, 7104–7119. [Google Scholar] [CrossRef]
  13. Di Giuli, M.; Malicki, M.; Dejardin, P.; Corda, V.; Swaidan, A. MELCOR 2.2-ASTEC V2.2 crosswalk study reproducing SBLOCA and CSBO scenarios in a PWR1000-like reactor part I: Analysis of RCS thermal-hydraulics and in-vessel phenomena. Nucl. Eng. Des. 2021, 111248. [Google Scholar] [CrossRef]
  14. Darnowski, P.; Skrzypek, E.; Mazgaj, P.; Świrski, K.; Gandrille, P. Total loss of AC power analysis for EPR reactor. Nucl. Eng. Des. 2015, 289, 8–18. [Google Scholar] [CrossRef]
  15. EPRI. Modular Accident Analysis Program (MAAP)—MELCOR Crosswalk—Phase 1 Study; EPRI Report 3002004449; Electric Power Research Institute: Palo Alto, CA, USA, 2014. [Google Scholar]
  16. Luxat, D.L.; Kalanich, D.A.; Hanophy, J.T.; Gauntt, R.O.; Wachowiak, R.M. MAAP-MELCOR Crosswalk Phase 1 Study. Nucl. Technol. 2016, 196, 684–697. [Google Scholar] [CrossRef]
  17. De Luze, O.; Haste, T.; Barrachin, M.; Repetto, G. Early phase fuel degradation in Phébus FP: Initiating phenomena of degradation in fuel bundle tests. Ann. Nucl. Energy 2013, 61, 23–35. [Google Scholar] [CrossRef]
  18. Clement, B.; Haste, T.; Krausmann, E.; Dickinson, S.; Gyenes, G.; Duspiva, J.; De Rosa, F.; Paci, S.; Martín-Fuertes, F.; Scholytssek, W.; et al. Thematic network for a Phebus FPT1 international standard problem (THENPHEBISP). Nucl. Eng. Des. 2005, 235, 347–357. [Google Scholar] [CrossRef]
  19. Grégoire, A.-C.; Haste, T. Material release from the bundle in Phébus FP. Ann. Nucl. Energy 2013, 61, 63–74. [Google Scholar] [CrossRef]
  20. Dubourg, R.; Faure-Geors, H.; Nicaise, G.; Barrachin, M. Fission product release in the first two PHEBUS tests FPT0 and FPT. Nucl. Eng. Des. 2005, 235, 2183–2208. [Google Scholar] [CrossRef]
  21. Shwarz, C. Foreword—Final Seminar Phebus Project. Ann. Nucl. Energy 2013, 61, 1–3. [Google Scholar] [CrossRef]
  22. Clément, B.; Zeyen, R. The objectives of the Phébus FP experimental programme and main findings. Ann. Nucl. Energy 2013, 61, 4–10. [Google Scholar] [CrossRef]
  23. Spirzewski, M.; Domitr, P.; Darnowski, P. Global uncertainty and sensitivity analysis of MELCOR and TRACE critical flow models against MARVIKEN tests. Nucl. Eng. Des. 2021, 378, 111150. [Google Scholar] [CrossRef]
  24. Domitr, P.; Darnowski, P.; Spirzewski, M. The Assessment of Critical Flow Models of MELCOR2.2 and TRACE V5.0 Patch 5 against Marviken Critical Flow Tests. In Proceedings of the 18th International Topical Meeting on Nuclear Reactor Thermal Hydraulics NURETH 2019, Portland, OR, USA, 18–23 August 2019. [Google Scholar]
  25. Stano, P.M.; Spirzewski, M. Modular global uncertainty analysis of event-driven indicators of system’s availability. In Proceedings of the ESREL 2018, Trondheim, Norway, 17–21 June 2018. [Google Scholar] [CrossRef]
  26. Spirzewski, M.; Anglart, H.; Stano, P.M. Uncertainty and sensitivity analysis of a phenomenological dryout model implemented in DARIA system code. Nucl. Eng. Des. 2019, 355, 110281. [Google Scholar] [CrossRef]
  27. NARSIS. NARSIS Project. 2021. Available online: www.narsis.eu (accessed on 5 July 2021).
  28. Mazgaj, P.; Darnowski, P.; Niewinski, G. Uncertainty Analysis of the Hydrogen Production in the PHEBUS FPT-1. In Proceedings of the 28th International Conference Nuclear Energy for New Europe, Portoroz, Slovenia, 9–12 September 2019; pp. 1–8. [Google Scholar]
  29. Darnowski, P.; Włostowski, M.; Stępień, M.; Niewiński, G. Study of the material release during PHÉBUS FPT-1 bundle phase with MELCOR 2.2. Ann. Nucl. Energy 2020, 148, 107700. [Google Scholar] [CrossRef]
  30. Clement, B.; Haste, T. Thematic Network for a Phebus FPT-1 International Standard Problem—Comparison Report on International Standard Problem ISP-46; OECD/NEA Report; OECD Nuclear Energy Agency: Issy-les-Moulineaux, France, 2003. [Google Scholar]
  31. Bruneliere, H.; Barry, T.; Brandelet, J.Y.; Perrichon, L.; Duflot, N.; Guigeno, Y.; Darnowski, P.; Mazgaj, P.; Stępień, M. NARSIS WP4.1: Definition of a Simplified Theoretical NPP Representative of the European Fleet; Horizon 2020 Project Report; European Commission: Brussels, 2018. [Google Scholar]
  32. Darnowski, P.; Mazgaj, P.; Skrzypek, E. MELCOR Simulations of the SBO in Gen III PWR with EVMR. In Proceedings of the 28th International Conference Nuclear Energy for New Europe, Portoroz, Slovenia, 9–12 September 2019; pp. 1–8. [Google Scholar]
  33. Darnowski, P.; Skrzypek, E.; Mazgaj, P.; Gatkowski, M. Simulations of Large Break Loss of Coolant Accident without Safety Injection for EPR Reactor using MELCOR Computer Code. In Proceedings of the European Review Meeting on Severe Accident Research ERSMAR-2015, Marsille, France, 24–26 March 2015; pp. 24–26. [Google Scholar]
  34. Darnowski, P. MelSUA—MELCOR Senstivity and Uncertanity Toolbox, GitLab Repository. 2021. Available online: https://gitlab.com/darczu/x-core/-/tree/master/Modules/MLC_package/SenstivityUncertanityAnalysis (accessed on 6 July 2021).
  35. Gauntt, R.O.; Bixler, N.E.; Wagner, K.C. An Uncertainty Analysis of the Hydrogen Source Term for A Station Blackout Accident in Sequoyah using MELCOR 1.8.5; U.S. Department of Energy Office of Scientific and Technical Information: Washington, DC, USA, 2014. [CrossRef]
  36. Glaeser, H. GRS Method for Uncertainty and Sensitivity Evaluation of Code Results and Applications. Sci. Technol. Nucl. Install. 2008, 2008, 798901. [Google Scholar] [CrossRef] [Green Version]
  37. Perez, M.; Reventos, F.; Batet, L.; Guba, A.; Tóth, I.; Mieusset, T.; Bazin, P.; de Crécy, A.; Borisov, S.; Skorek, T.; et al. Uncertainty and sensitivity analysis of a LBLOCA in a PWR Nuclear Power Plant: Results of the Phase V of the BEMUSE programme. Nucl. Eng. Des. 2011, 241, 4206–4222. [Google Scholar] [CrossRef]
  38. Wilks, S.S. Determination of Sample Sizes for Setting Tolerance Limits. Ann. Math. Stat. 1941, 12, 91–96. [Google Scholar] [CrossRef]
  39. U.S. NRC. State-of-the-Art Reactor Consequence Analyses Project Volume 1: Peach Bottom Integrated Analysis; NUREG/CR-7110; SOARCA: Washington, DC, USA, 2013; Volume 1.
  40. Saltelli, A.; Ratto, M.; Andres, T.; Campolongo, F.; Cariboni, J.; Gatelli, D.; Saisana, M.; Tarantola, S. Global Sensitivity Analysis: The Primer; Wiley and Sons: New York, NY, USA, 2007. [Google Scholar] [CrossRef] [Green Version]
  41. CSNI. OECD/CSNI Workshop on Best Estimate Methods and Uncertainty Evaluations. 2013. Available online: https://www.oecd-nea.org/nsd/docs/2013/csni-r2013-8-part2.pdf (accessed on 10 May 2021).
  42. Sandia National Laboratories. MELCOR 2.2 Computer Code Manual—Volume 1: Primer and Users’ Guide; Sandia National Laboratories Report; Sandia National Laboratories: Albuquerque, NM, USA, 2017.
  43. Darnowski, P. X-Core Nuclear Engineering Matlab Toolbox, GitLab Repostory. 2021. Available online: https://gitlab.com/darczu/x-core (accessed on 6 July 2021).
  44. Gauntt, R.O. Uncertainty Analyses Using the MELCOR Severe Accident Analysis Code. In Proceedings of the OECD Workshop Evaluation of Uncertainties in Relation to Severe Accidents and Level-2 Probabilistic Safety Analysis, Aix-En-Provence, France, 7–9 November 2005. [Google Scholar]
  45. U.S. NRC. State-of-the-Art Reactor Consequence Analyses Project—Uncertainty Analysis of the Unmitigated Long-Term Station Blackout of the Peach Bottom Atomic Power Station; NUREG/CR-7155; SOARCA: Washington, DC, USA, 2018.
  46. Esmaili, H. NRC Severe Accident & MELCOR Activities, 10th Eur. MELCOR User Gr. Meet. 2018. Available online: https://www.psi.ch/emug/Emug2018EN/EMUG_2018_02.pdf (accessed on 10 May 2021).
  47. Urbanic, V.; Heidrick, T. High-temperature oxidation of zircaloy-2 and zircaloy-4 in steam. J. Nucl. Mater. 1978, 75, 251–261. [Google Scholar] [CrossRef]
  48. Baker, L.; Just, L.C. Studies of Metal-Water Reactions at High Temperatures, III. Experimental-and Theoretical Studies of the Zirconium-Water Reaction—Argonne National Laboratory Report ANL-6548; Argonne National Laboratory: Argonne, IL, USA, 1962.
  49. Prater, J.T.; Courtright, E.L. NUREG/CR-4889—Zircaloy-4 oxidation at 1300 to 2400 °C; Nuclear Regulatory Commission: Washington, DC, USA, 1987.
  50. Leistikow, S.; Schanz, G. Oxidation kinetics and related phenomena of zircaloy-4 fuel cladding exposed to high temperature steam and hydrogen-steam mixtures under PWR accident conditions. Nucl. Eng. Des. 1987, 103, 65–84. [Google Scholar] [CrossRef]
  51. Cathcart, J.; Pawel, R.E.; McKee, R.A.; Druschel, R.E.; Yurek, G.J.; Campbell, J.J.; Jury, S.H. ORNL/NUREG-17—Zirconium Metal-Water Oxidation kinetics IV; Reaction Rate Studies; Nuclear Regulatory Commission: Washington, DC, USA, 1977.
  52. SNL. MELCOR Best Practices as Applied in the State-of-the-Art Reactor Consequence Analyses; NUREG/CR-7008; Nuclear Regulatory Commission: Washington, DC, USA, 2014.
  53. Sandia National Laboratories. Draft State-of-the-Art Reactor Consequence Analyses Project—Uncertainty Analysis of the Unmitigated Short-Term Station Blackout of the Surry Power Station; Sandia National Laboratories Report; Sandia National Laboratories: Albuquerque, NM, USA, 2015.
  54. Galushin, S.; Kudinov, P. Sensitivity Analysis of the Vessel Lower Head Failure in Nordic BWR Using MELCOR Code. In Proceedings of the Probabilistic Safety Assessment and Management PSAM 14, Los Angeles, CA, USA, 16–21 September 2018. [Google Scholar]
  55. SNL. MELCOR 2.1 Computer Code Manual—Volume 3: MELCOR Assessment Problems; Sandia National Laboratories: Albuquerque, MN, USA, 2015.
  56. Tina Ghosh, S.; Mattie, P.D.; Gauntt, R.O.; Bixler, N.E.; Ross, K.W.; Sallaberry, C.J.; Osborn, D.M. SOARCA Peach Bottom Atomic Power Station Long-Term Station Blackout Uncertainty Analysis: Overview. In Proceedings of the Probabilistic Safety Assessment and Management PSAM 12, Honolulu, HI, USA, 22–27 June 2014. [Google Scholar]
  57. Humphries, L.L. MELCOR Code Development Status EMUG 2018—International Use of MELCOR, Presented by Larry Humphries during European MELCOR User Group Meeting (EMUG-2018), Zagreb, Croatia, April 25–27, 2018. Available online: https://www.psi.ch/sites/default/files/import/emug/Emug2018EN/EMUG_2018_01.pdf (accessed on 5 August 2021).
  58. Humphries, L.L. QUICKLOOK OVERVIEW OF CHANGES IN MELCOR 2.2: Rev 9496 to Rev 11932; Sandia National Laboratories: Albuquerque, NM, USA, 2018.
  59. Wang, J.; Wang, C.; Corradini, M.L.; Haskin, T.; Tian, W.; Su, G.; Qiu, S. PHEBUS FPT-1 simulation by using MELCOR and primary blockage model exploration. Nucl. Eng. Des. 2016, 307, 119–129. [Google Scholar] [CrossRef]
  60. Wang, J.; Corradini, M.L.; Fu, W.; Haskin, T.; Zhang, Y.; Tian, W.; Su, G.; Qiu, S. Simulation of the PHEBUS FPT-1 experiment using MELCOR and exploration of the primary core degradation mechanism. Ann. Nucl. Energy 2015, 85, 193–204. [Google Scholar] [CrossRef]
  61. Humphries, L.L. QUICKLOOK OVERVIEW OF CHANGES IN MELCOR 2.2: Rev 6342 to Rev 9496; Sandia National Laboratories: Albuquerque, NM, USA, 2018.
  62. Leonard, M.T.; Ashbaugh, S.G.; Cole, R.K.; Bergeron, K.D.; Nagashima, K. A direct comparison of MELCOR 1.8.3 and MAAP4 results for several PWR & BWR accident sequences. In Proceedings of the International Topical Meeting on Probabilistic Safety Assessment—Moving toward Risk Based Regulation, Park City, UT, USA, 29 September–3 October 1996; Available online: https://www.osti.gov/biblio/288425 (accessed on 1 May 2021).
  63. Ahn, K.-I.; Park, S.-Y.; Cho, S.-W. MELCOR 1.8.4 sensitivity analysis of the severe accident evolution during the APR 1400 LOCA. Ann. Nucl. Energy 2006, 33, 71–83. [Google Scholar] [CrossRef]
  64. Vierow, K.; Liao, Y.; Johnson, J.; Kenton, M.; Gauntt, R. Severe accident analysis of a PWR station blackout with the MELCOR, MAAP4 and SCDAP/RELAP5 codes. Nucl. Eng. Des. 2004, 234, 129–145. [Google Scholar] [CrossRef]
  65. SNL. MELCOR 1.8.5 Computer Code Manuals—Vol. 3: Demonstration Problems; Sandia National Laboratories: Albuquerque, NM, USA, 2000.
  66. Haste, T.; Birchley, J.; Cazzoli, E.; Vitazkova, J. Analysis of TMI-2 with MELCOR and SCDAPSIM. In Proceedings of the International Congress on Advances in Nuclear Power Plants 2005 ICAPP-05, Seoul, Korea, 15–19 May 2005. [Google Scholar]
  67. Šadek, D.; Grgi, Č.; Nikola, S. Analysis of In-Vessel Severe Accident Phenomena in NPP Krško Analysis of In-Vessel Severe Accident Phenomena in NPP Krško. In Proceedings of the 7th International Conference on Nuclear Option in Countries with Small and Medium Electricity Grids, Dubrovnik, Croatia, 25–29 May 2008. [Google Scholar]
  68. Zhao, N.; Chen, Y.; Ma, W.; Bechta, S.; Isaksson, P. A nodal sensitivity study of MELCOR simulation for severe accidents in a pressurized water reactor. Ann. Nucl. Energy 2021, 160, 108373. [Google Scholar] [CrossRef]
  69. Alexandra, A.E.; Gertman, E.; George, D.G.L.; Mesina, L. Uncertainty Analysis of RELAP5-3D. 2012. Available online: http://www.osti.gov/servlets/purl/1056002/ (accessed on 10 July 2021).
  70. Guo, Z.; Dailey, R.; Feng, T.; Zhou, Y.; Sun, Z.; Corradini, M.L.; Wang, J. Uncertainty analysis of ATF Cr-coated-Zircaloy on BWR in-vessel accident progression during a station blackout. Reliab. Eng. Syst. Saf. 2021, 213, 107770. [Google Scholar] [CrossRef]
  71. Joo, H.Y.; Kim, J.W.; Moon, J.H. Use of big data analysis to investigate the relationship between natural radiation dose rates and cancer incidences in Republic of Korea. Nucl. Eng. Technol. 2020, 52, 1798–1806. [Google Scholar] [CrossRef]
  72. Schober, P.; Boer, C.; Schwarte, L.A. Correlation Coefficients. Anesthesia Analg. 2018, 126, 1763–1768. [Google Scholar] [CrossRef]
  73. Akoglu, H. User’s guide to correlation coefficients. Turk. J. Emerg. Med. 2018, 18, 91–93. [Google Scholar] [CrossRef] [PubMed]
  74. Freixa, J.; Kim, T.-W.; Manera, A. Post-test thermal-hydraulic analysis of two intermediate LOCA tests at the ROSA facility including uncertainty evaluation. Nucl. Eng. Des. 2013, 264, 153–160. [Google Scholar] [CrossRef]
  75. Zheng, X.; Itoh, H.; Tamaki, H.; Maruyama, Y. Source term uncertainty analysis: Probabilistic approaches and applications to a BWR severe accident. Mech. Eng. J. 2015, 2, 15-00032. [Google Scholar] [CrossRef] [Green Version]
  76. Gauntt, K.W.; Ross, D.M.; Osborn, C.J.; Sallaberry, A.S.; Goldmann, J.N.; Cardoni, P.D.; Mattie, S.T.; Ghosh, E.; Fuller, S.; Andrew, J.N.; et al. SOARCA Peach Bottom Atomic Power Station long-term station blackout uncertainty analysis: MELCOR parameters and probabilistic results. In Proceedings of the International Topical Meeting on Probabilistic Safety Assessment and Analysis, Columbia, SC, USA, 22–26 September 2013; Volume 2, pp. 1310–1326. [Google Scholar]
Figure 1. The MELCOR nodalization of the bundle section, including CVH, HS, FL, and COR models. All dimensions in meters. Based on [29].
Energies 14 04884 g001
Figure 2. Comparison of axial power profiles. FPT-1 profile, top peaked PWR profile, and PWR FPT-like profile interpolated to normalized axial levels.
Energies 14 04884 g002
Figure 3. RPV and core nodalization for CVH, COR, and HS package models.
Energies 14 04884 g003
Figure 4. RCS model, including CVH, COR, and HS package models. ACC—accumulator, IRWST—in-containment refueling water system tank, HL—hot leg, CL—cold leg, SG—steam generators, DC—downcomer, SD—steam dome, EFW—emergency feedwater system, FW—feedwater, MSL—main steam line, PZR—pressurizer, PRT—pressurizer relief tank, PSV—pressurizer safety valve, PDS—pressurizer discharge system, MSRV—main steam relief valve, MSSV—main steam safety valve. Based on [32].
Energies 14 04884 g004
Figure 5. Workflow of the MelSUA code-based methodology.
Energies 14 04884 g005
Figure 6. Cladding zirconium–steam oxidation correlations applied in this study. Based on [28].
Energies 14 04884 g006
Figure 7. (Left)—Hydrogen generation best estimate calculations compared with FPT-1 experimental data. EXP#1 is data from ISP46 (SDHD701 sensor). EXP SNL#2 (SDHY700 sensor) alternative data used by SNL. Data taken from [18,29,30,58]. Wang M2.1 results [59,60]; SNL M2.2 [58,61]; WUT M2.2—MELCOR 2.2.11 results from [29]. (Right)—PWR hydrogen generation for two studied cases and Zr-only generation.
Energies 14 04884 g007
Figure 8. Hydrogen generation for PWR reactor. (Left)—peaked power profile. (Right)—FPT-like profile. Best estimate case (black line), mean value (blue line) based on interpolation and extrapolation for both fully and partially successful cases, fully successful cases (grey lines), and partially successful cases (red lines). Partially successful are cases that converged after the time limit—the 2500 s for PWR (394 (left) and 398 (right)). Box-charts are presented with the central bar being the median value for FoM, while the lower and upper quartiles (25–50%) are presented by a box, and the minimum and maximum values that are not outliers are presented by black whiskers and outliers with blue circles.
Energies 14 04884 g008
Figure 9. Hydrogen generation for FPT-1. Best estimate case (black line), mean value (blue line) based on interpolation and extrapolation for both fully and partially successful cases, fully successful cases (grey lines), and partially successful cases (red lines). Partially successful are cases that converged after the time limit of 16,500 s (340 cases). Box-charts are presented with the central bar being the median value for FoM, while the lower and upper quartiles are presented by a blue box, and minimum and maximum values that are not outliers are presented by black whiskers and outliers with blue circles.
Energies 14 04884 g009
Figure 10. Comparison of FoM, normalized by the mean value at the end of calculations. The time normalized by the value of the estimated oxidation phase time, in relation to the beginning of the transient. All data were processed, interpolated, and extrapolated for successful and partially successful data. The solid line presents the median value, and the dark shaded region is the 50% quartile; the light shaded region represents the 95% percentile. (Left)—PWR reactor; blue is the PWR top peak case, and red is the PWR with the FPT-like power profile. (Right)—blue FPT-1.
Energies 14 04884 g010
Figure 11. Empirical cumulative distribution function (ECDF) for the normalized hydrogen mass (FoM). Normalization by the mean and standard deviation.
Energies 14 04884 g011
Figure 12. Pearson (yellow), Spearman (red), and Kendall (blue) correlation coefficients for PWR models; H2 production (final core state) vs. uncertainty parameters. (Left)—top peaked power profile, (Right)—FPT-like power profile. Values for IRODDAMAGE and SC1001 have no meaning.
Energies 14 04884 g012
Figure 13. Pearson (yellow), Spearman (red), and Kendall (blue) correlation coefficients for FPT model; H2 production (final core state) vs. uncertainty parameters. Values for IRODDAMAGE and SC1001 have no meaning.
Energies 14 04884 g013
Figure 14. Hydrogen (FoM) mass normalized to average final FoM vs. uncertainty parameters with fitted linear regression for PWR reactor. Blue is the top peaked profile, and red is the FPT-like profile. All FoM results are for the final core state. Normalization by the FoM mean value.
Energies 14 04884 g014
Figure 15. Hydrogen (FoM) mass vs. uncertainty parameters with fitted linear regression for FPT-1. All FoM results are for the final core state. Normalization by the FoM mean value.
Energies 14 04884 g015
Table 1. Comparison of basic design details for PWR and FPT-1.
ParameterGen-III PWRFPT-1
Thermal power4500 MWthMaximum 34 kWth
Mass of uranium dioxide~144 tons10.4241 kg
Mass of zirconium~39 tons3.50435 kg
Maximum H2 due to Zr oxidation~1.7 tons0.154 kg
Table 2. Uncertainty parameters and distributions selected for the study.
NoMELCOR Field
Name
UnitTypeBest Est. ValueDistributionDistribution ParametersDistribution
Values
Truncation
Limits
1SC1131 (2)(K)Continuous2400.0Triangulara, b, c(2100.0, 2400.0, 2550.0)No
2SC1132 (1)(K)Continuous2500.0Normalmu, sigma(2479.0, 83.0)No
3FUOZR(-)Continuous0.2Normalmu, sigma(0.2, 0.09)(0.0, 0.5)
4HFRZZR(W∙m−2∙K−1)Continuous7500.0Lognormalmu, sigma(8.9227, 0.55962)
(ln(7500), ln(1.75))
(2000, 22,000)
5DHYPD(m)Continuous0.01Lognormalmu, sigma(−4.4228, 0.69315)
(ln(0.012), ln(2.0))
(0.002, 0.05)
6DHYPDLP(m)Continuous0.002Lognormalmu, sigma(−5.2983, 1.0986)
(ln(0.005), ln(3))
(0.0020, 0.060)
7PORDP(-)Continuous0.4Normalmu, sigma(0.38, 0.1)(0.10, 0.50)
8FCELR(-)Continuous0.1Normalmu, sigma(0.1, 0.035)(0.020, 0.30)
9aFCELA for FPT-1(-)Continuous0.75Normalmu, sigma(0.75, 0.1)(0.5, 1.0)
9bFCELA for PWR(-)Continuous0.1Normalmu, sigma(0.1, 0.035)(0.02, 0.3)
10HDBH2O(W∙m−2∙K−1) Continuous100.0Triangulara, b, c(100.0, 250.0, 2000.0)No
11SC1001(-)Discrete1.0Discrete1,2,3,4,5p = (0.2 0.2 0.2 0.2 0.2)No
12IRODDAMAGE(-)Discrete1.0Discrete1,2,3p = (0.8 0.1 0.1)No
13TMLT(K)Equal2500.0NormalSame as 2Same as 2Same as 2
14HFRZSS(W∙m−2∙K−1)Continuous2500.0Lognormalmu, sigma(7.824, 0.40547)
(ln(2500), ln(1.5))
(1000, 5000)
15FSXSS(-)Continuous1.0Normalmu, sigma(1.0, 0.2)(0.6, 1)
16SC1141 (2)(kg∙m−1∙s−1)Continuous1.0Triangulara, b, c(0.1, 1.0, 2.0)No
Table 3. Parabolic models for Zr oxidation, reactions with steam.
NoModelReaction Constant, Kp (kg2/(m4s))Reference
1Urbanic–Heidrick29.6 ∙ exp(−16,820/T), T < 1853 K[47]
(Default)87.9 ∙ exp(−16,610/T), T > 1873 K
2Baker–Just3330 ∙ exp(−22,897/T)[48]
3Prater–Courtright26,763.6 ∙ exp(−26,440/T), T > 1873 K[49]
Leistikow–Schanz425.8 ∙ exp(−20,962/T), T < 1853 K[50]
4Prater–Courtright26,763.6 ∙ exp(−26,440/T), T > 1873 K[49]
Cathcart–Pawel294.2 ∙ exp(−20,100/T) < 1853 K[51]
5Urbanic–Heidrick87.9 ∙ exp(−/T), T > 1873 K[47]
Cathcart–Pawel294.2 ∙ exp(−20,100/T) < 1853 K[51]
Table 4. Alternative versions of the time-at-temperature model. Model 0—best estimate.
Model #0Probability = 0.8Model #1Probability = 0.1Model #2Probability = 0.1
Temperature, (K)Time, (s)Temperature, (K)Time, (s)Temperature, (K)Time, (s)
2090.06.00 ∙ 10311990.06.00 ∙ 10312190.06.00 ∙ 1031
2100.03.60 ∙ 1042000.01.80 ∙ 1042200.07.20 ∙ 104
2500.03.60 ∙ 1032400.01.80 ∙ 1032600.07.20 ∙ 103
2600.03.00 ∙ 1022500.01.50 ∙ 1022700.06.00 ∙ 102
Table 5. Comparison of different MELCOR literature results for in-vessel H2 production.
ReactorCodeScenarioThermal PowerIn-Vessel Hydrogen MassH2-to-Power RatioReference
PWR W-3M1.8.3SBO26866000.22[62]
PWR APR1400M1.8.4LBLOCA40004200.11[63]
PWR ZionM1.8.5SBO32505300.16[64]
PWR SequoyahM1.8.5SBO3411456/7180.13/0.21[35,44]
PWR SurryM1.8.5LBLOCA25461000.04[65]
PWR ZionM1.8.5LBLOCA32502650.08[65]
PWR TMI-2M1.8.5SBLOCA2772330/4250.12/0.15[66]
PWR TMI-2M1.8.5SBLOCA27723500.13[65]
VVERM1.8.6SBO3000189/4560.06/0.15[6]
PWR KrshkoM1.8.6SBO2000160/2000.08/0.1[67]
PWR BeznauM1.8.6LBLOCA11301280.11[5]
PWRM2.1.5SBO45906000.13[14]
PWRM2.1.5LBLOCA45904900.1[33]
PWR W-3M2.2LBLOCA3152234/3280.07/0.10[68]
PWR W-3M2.2SBLOCA3152192/3150.06/0.10[68]
PWRM2.2.9SBO4500~5500.12[32] (*)
PWRM2.2.15SBO3000450/5100.15/0.17[13]
PWR, top peak M2.2.18LBLOCA4500BE 2860.06This work
power profileMin 220/Max 4950.05/0.11
PWR, FPT-like M2.2.18LBLOCA4500BE 2320.05This work
power profileMin 225/Max 3920.05/0.09
(*) The early version of the model used in this work.
Publisher’s Note: MDPI stays neutral with regard to jurisdictional claims in published maps and institutional affiliations.

