1. Introduction
The growth that renewable energy sources have experienced over the past decades has increased the need for cost effective electrical energy storage systems (ESS) that uncouple customer demand from energy generation, making possible a reliable supply to consumers at all times [
1,
2]. Large scale grid-connected storage requires durability for large number of charge/discharge cycles, high energy efficiency (at least 70%), and affordable capital costs [
3]. Redox flow batteries (RFB) are one of the proposed alternatives due to their particular ability to be scaled separately in terms of energy capacity and power.
Redox batteries are electrochemical systems that store energy in the form of oxidized and reduced electroactive species present in flowing media. The redox-active substances are contained in electrolyte, typically stored in external tanks. Therefore, the energy capacity is determined by the solution volume and concentration of the electroactive materials, whilst the power output is determined by the cell active area and number of cells.
The vanadium redox flow battery is the most studied and commercially used system to date. This system uses ions of the same element at various oxidation states in both half-cells, minimizing the changes in electrolyte concentration by diffusion through the membrane, an issue that prevailed during the early investigations in pioneer systems [
4]. Despite the major advances made in this research field, the all-vanadium RFB is still far from meeting the cost goals [
5]. A major cost driver associated with the energy storage capacity is the vanadium electrolyte [
6]. Alternative chemistries have been investigated as plausible low-cost solutions. Amongst those, the all-iron stands out due to the ready availability of the storage materials [
7]. Just as in all-vanadium RFB, the use of the same redox-active element eliminates cross-contamination problems (although current inefficiency is still to be considered). However, deposition and dissolution are slow, and the hydrogen evolution as side reaction poses additional challenges.
The hydrogen-bromine redox flow battery (H
2-Br
2 RFB) shows promise as a high-power system with considerably low electrolyte costs [
8]. Reactants are earth abundant and at least three times cheaper than All-Vanadium RFB (≈20 €/kWh) [
9,
10]. The gas phase H
2 electrode also simplifies the separation and recovery of crossover catholyte, which can be returned back to the catholyte tank [
11]. Additionally, the high HBr/Br
2 solubility and the fact that no supporting electrolyte is required (HBr works as both reactive material and electrolyte) lead to a high energy density, ranging from 70 Wh/L at 2 M bromine concentration [
9] to 200 Wh/L at 7.7 M HBr [
12]. Bromine concentrations and operating temperatures are typically kept at a moderate level, due to the high Br
2 vapor pressure and toxic nature [
13]. Nonetheless, the incorporation of bromine complexing agents has offered a pathway to making H
2-Br
2 RFBs safer [
14]. Studies on the electrode kinetics of bromine and hydrogen on platinum catalysts have shown that reaction kinetics of both H
2 and Br
2 are very fast and nearly reversible on Pt [
15,
16].
During discharge, the hydrogen is oxidized to hydronium ions (H
3O
+) and electrons on a Pt catalyst; the hydronium ions pass through the membrane to the positive side. Here, Br
2 is reduced to bromide (Br
−) thus producing hydrobromic acid with the electrons that pass through the external circuit. The reverse transport processes occur during charge. The electrochemical reactions and cell potentials of the H
2-Br
2 RFB are described in Equations (1)–(3).
H
2-Br
2 RFBs have been reported to show limiting current densities of approximately 2.5 A/cm
2 and peak power densities of 1.4 W/cm
2 at 80 °C [
17]. At a component level, the membrane has been found to be one of the crucial elements. For this chemistry, both proton exchange (PEM) and nanoporous (NP-PCM) membranes are applicable, the latter being a low-cost alternative to state-of-the-art Nafion membranes. The unique property of NP-PCM (its high-water permeability under hydraulic pressure) allows the excess water at the cathode to return back to the anode, which eliminates the need to humidify the hydrogen feed. However, it may cause extra electrolyte crossover [
18]. Low ionic selectivity results in bromide crossover to the anode compartment, leading to self-discharge and catalyst degradation [
19]. Life testing on the system has already demonstrated operational lifetimes of about 10,000 h [
20].
In regular operations, the limiting conditions of cells are difficult to probe. For instance, a study investigating the cyclic performance of H
2-Br
2 cells and the effects of operating conditions on cell efficiency indicated that a maximum in energy efficiency is met from 150 to 300 mA/cm
2 [
21]. This limitation was mainly attributed to the large overpotentials that arise at higher current densities, even though transport losses could also have played a role. The geometrical limitations of a cell responsible for these losses are hard to resolve with conventional characterization techniques.
In order to better understand these processes, advanced diagnostic techniques must be developed, particularly those helping the study of the operation performance (namely in situ characterization). One of these techniques is the measurement of localized current across the active area with segmented current collectors, often referred to as “segmented electrodes” in the literature [
22,
23].
Current distribution measurements have been extensively studied in fuel cells [
24,
25,
26] and have more recently been translated onto vanadium redox flow batteries [
23,
27,
28]. This was possible due to the similarities in cell configuration, and allowed the assessment of transport phenomena within the devices. Different methods of measuring current distribution in fuel cells have been reported, these include a printed circuit board (PCB), resistors network, and Hall effect sensors.
The resistor network approach consists of shunt resistors hard-wired on a segmented contact plate [
25]. The voltage drop at the shunt is measured to calculate the current density. This approach has been found to induce added contact resistance between the segments and the measurement system [
29].
Hall sensors operate by measuring the magnetic induction of the field surrounding an electric current [
30]. In this technique, one Hall effect sensor is linked to every single electrically isolated segment of the cell. This approach can be used to measure high currents in a wide range of temperatures.
The PCB technique for electrochemical characterization of fuel cells was introduced by Cleghorn et al. [
31]. The concept is based on replacing one of the current collectors with a PCB. Conventional PCB manufacturing techniques provide electrically insulated paths for individual current/voltage collection embedded on a flat surface, simplifying the assembly into the cell.
This work focused on the implementation of a printed circuit board (PCB) with built-in shunt resistors, given the repeatability of their fabrication method and assembly simplicity.
The implementation of the segmented electrode approach in all vanadium flow batteries raised an additional challenge, namely the utilization of ion-conductive electrolyte solutions than can cause unwanted current spread [
27]. In addition, such electrolytes are often highly corrosive, thus compromising the integrity of the measuring device. The H
2-Br
2 has the advantage of being a two-phase RFB, thus offering the flexibility of realizing the measurement of localized currents on a gaseous electrolyte half-cell. The PCB technique offers the possibility to incorporate flow fields directly on the board, integrating the functions of the flow field and the current collector and therefore reducing the number of components needed for the assembly of the cell. Additionally, the current measurement occurs closer to the reaction site as the PCB is in direct contact with the gas diffusion layer (GDL) [
24].
In ideal working conditions, a nearly uniform current distribution would be expected, meaning that sufficient electrolyte is homogeneously delivered across the active area. The stoichiometric flow factor defines the minimum required flow rate to fulfill this condition. In the case of insufficient electrolyte delivery (mass transport limitation), the concentration of active species is depleted (concentration polarization), voltage drops and considerable gradients in the current distribution arise, indicating that the cell can no longer maintain the performance.
In practice, the stoichiometric factor in flow batteries is typically set to a high value (λ > 5 for SOC ≅ 100%) to overcome this effect. This has proven effective in increasing cell voltage and power [
18] but comes at the expense of pumping losses. It is therefore necessary to investigate the conditions at which the reactants are fully utilized and the maximum amount of energy stored in the solution is recovered [
32].
The focus of this work was to establish current distribution measurement as a viable diagnostic technique for H2-Br2 RFBs. To this purpose, the relationship between transport and performance was analyzed with the intention of determining the optimum stoichiometry that both supplies the cell area with enough active species and efficiently reduces the pumping losses to the very minimum.
2. Materials and Methods
The experimental setup consisted of a 27.25 cm
2 single cell H
2-Br
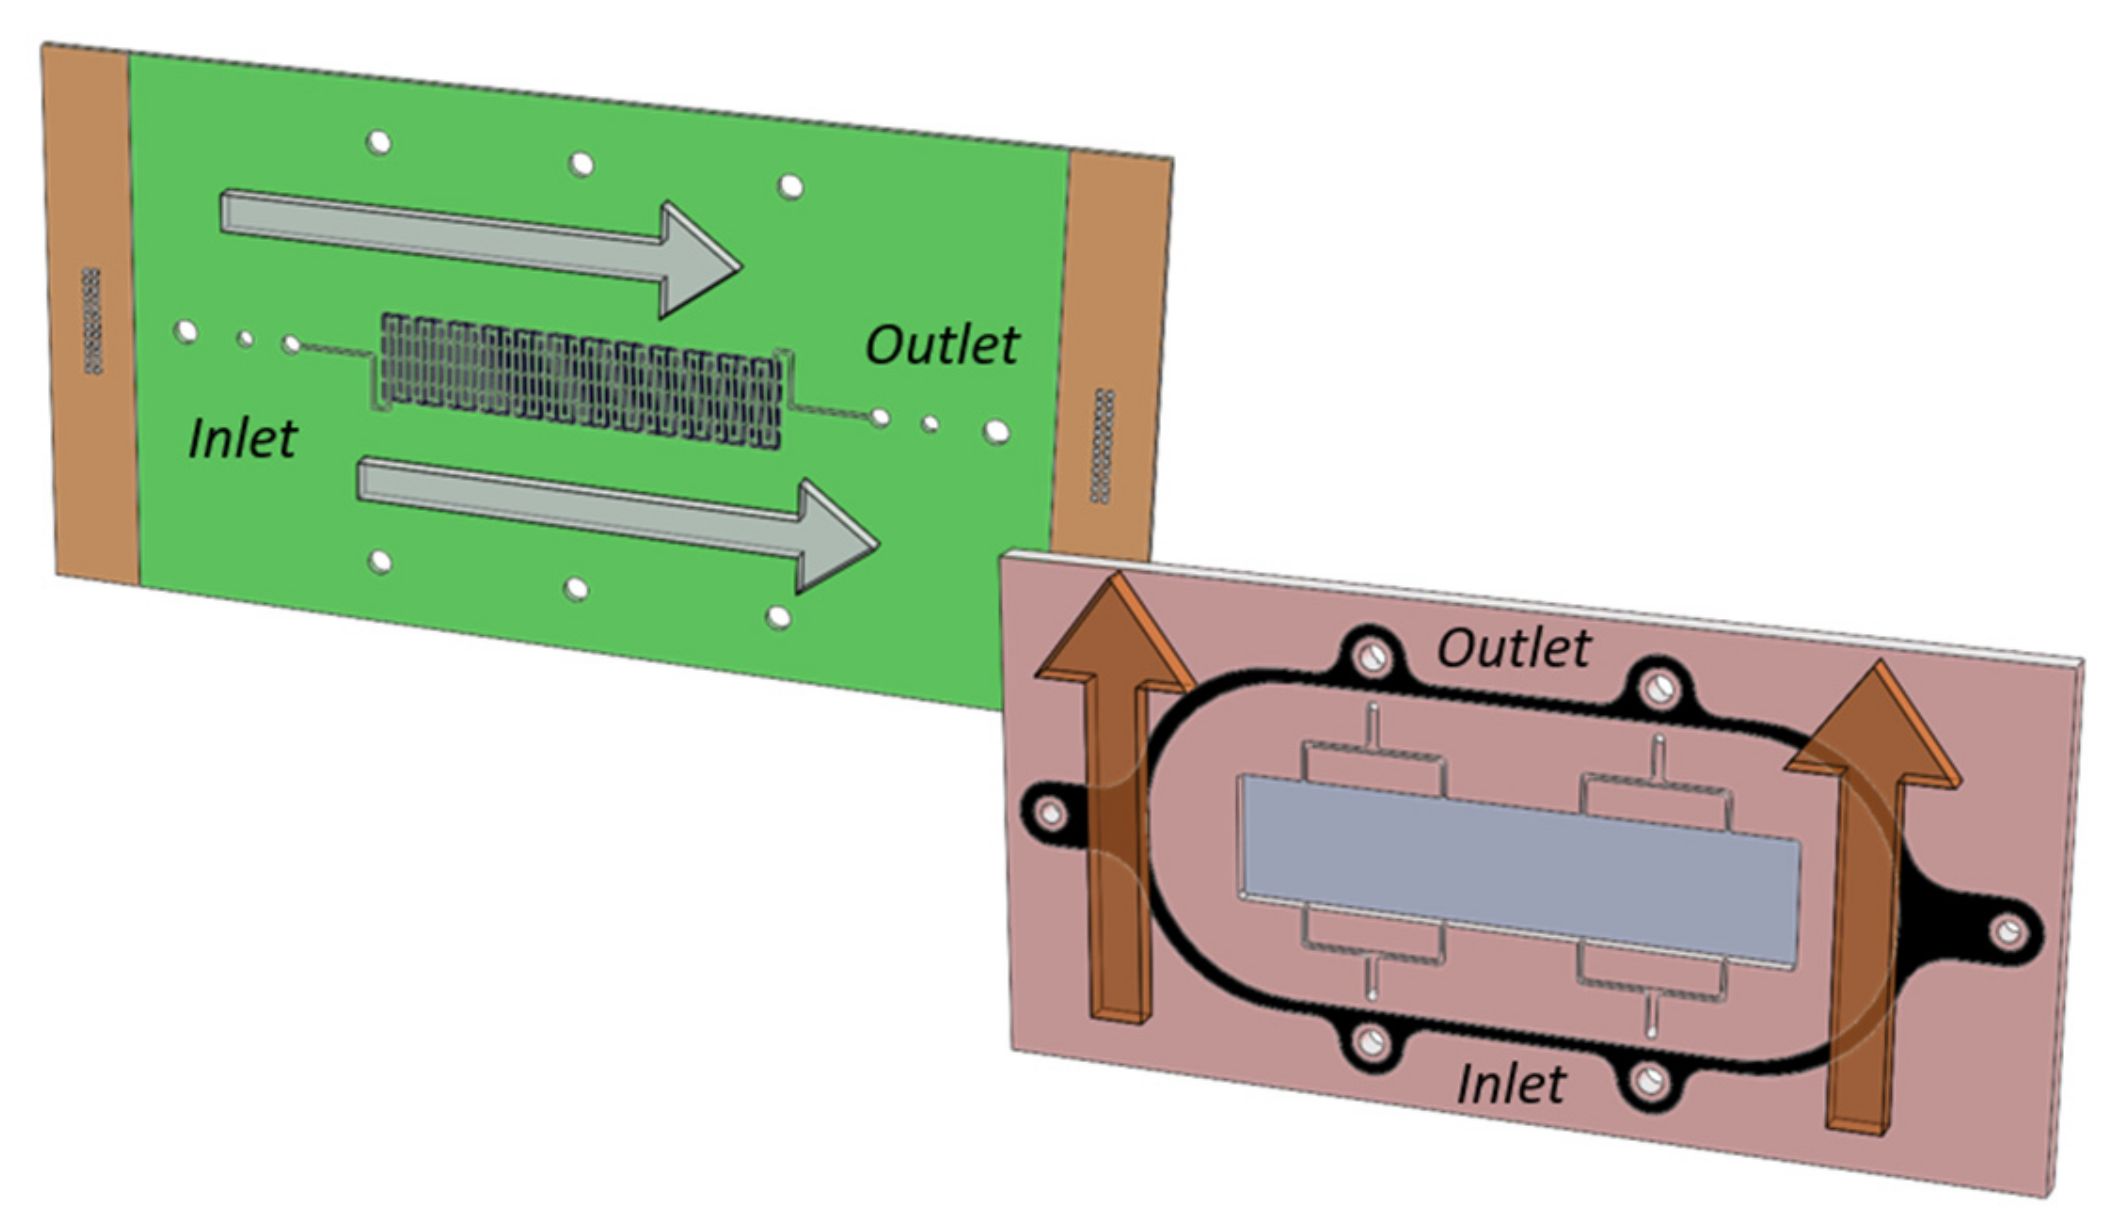
2 RFB. A typical cell consisted of graphite bipolar plates, with a serpentine (flow-by) flow channel architecture on the negative half-cell and a flow through configuration on the positive side. The bipolar plates were enclosed in ECTFE (ethylene chlorotrifluoroethylene) flow frames with extended flow paths to prevent shunt currents and sealed using FKM (fluorocarbon monomer) gaskets. In order to clearly distinguish and separate the effects of stoichiometry on each half cell, the electrolyte directions are designed to flow perpendicularly with the anolyte following the longer end (from left to right) and the catholyte following the shorter end (from bottom to top), as depicted in
Figure 1. For the collection of localized current densities, the PCB was placed on the negative half-cell.
All of the cells were assembled with F-1075-PK (Fumatech BWT GmbH, Bietigheim-Bissingen, Germany) membranes, coated in house with a Pt/C catalyst achieving a loading of 1.5 mg/cm2 via spraying technique. F-1075-PK are 80 μm cation exchange membranes with a 0.9 meq g−1 ion exchange capacity. A triple layer carbon paper electrode 29BC (SGL Group GmbH, Wiesbaden, Germany) —as received— was used on the anode and carbon felt GFA5 (SGL Group GmbH, Wiesbaden, Germany) —compressed to 75% of its original thickness— on the cathode. The cell was assembled with a clamping force of 3 Nm. Cells were operated with dry hydrogen and a 2.8 M HBr solution at a 50% State of charge (SOC). A high electrolyte volume (3 L) was used, thus the change in state of charge is considered to be negligible. The stoichiometric flow factor λ was calculated at the highest achieved current. Electrolyte was pumped through the cell with a syringe pump (Harvard Apparatus, Holliston, United States). Cell testing was conducted with open hydrogen loop (the outlet gas vented out to the fume hood). A ModuLab 2100 A potentiostat (Ametek GmbH, Meerbusch, Germany) was used to control cell current and record electrochemical impedance spectroscopy (EIS) measurements.
The PCB (elbe electronic GmbH, Ettlingen, Germany) has a spatial resolution of 48 segments, distributed to match with the cell active area in a matrix of 4 by 12. Each segment has a dimension of 8.1 by 5.25 mm and 1 mm wide spacing between segments. A single serpentine channel 1 mm wide and 1 mm deep was engraved on the board. Although the board is placed on the negative half cell (gas phase), a certain amount of electrolyte crossover is expected. The acidic nature of this solution can lead to the degradation of the segments. For this reason, the printed circuit board was coated with a protective carbon ink consisting of graphite and phenol resin via screen printing. These materials are typically used in commercial bipolar plates, therefore chemically stable in a wide range of electrolytes. Using the adapted coating for the PCB eliminates the need for significant modifications on the setup configuration (i.e., the utilization of flow plates).
Prior to assembly, the resistances of the individual traces between current collector and shunt resistors were measured via EIS using a ModuLab 2100 A potentiostat (Ametek GmbH, Meerbusch, Germany).
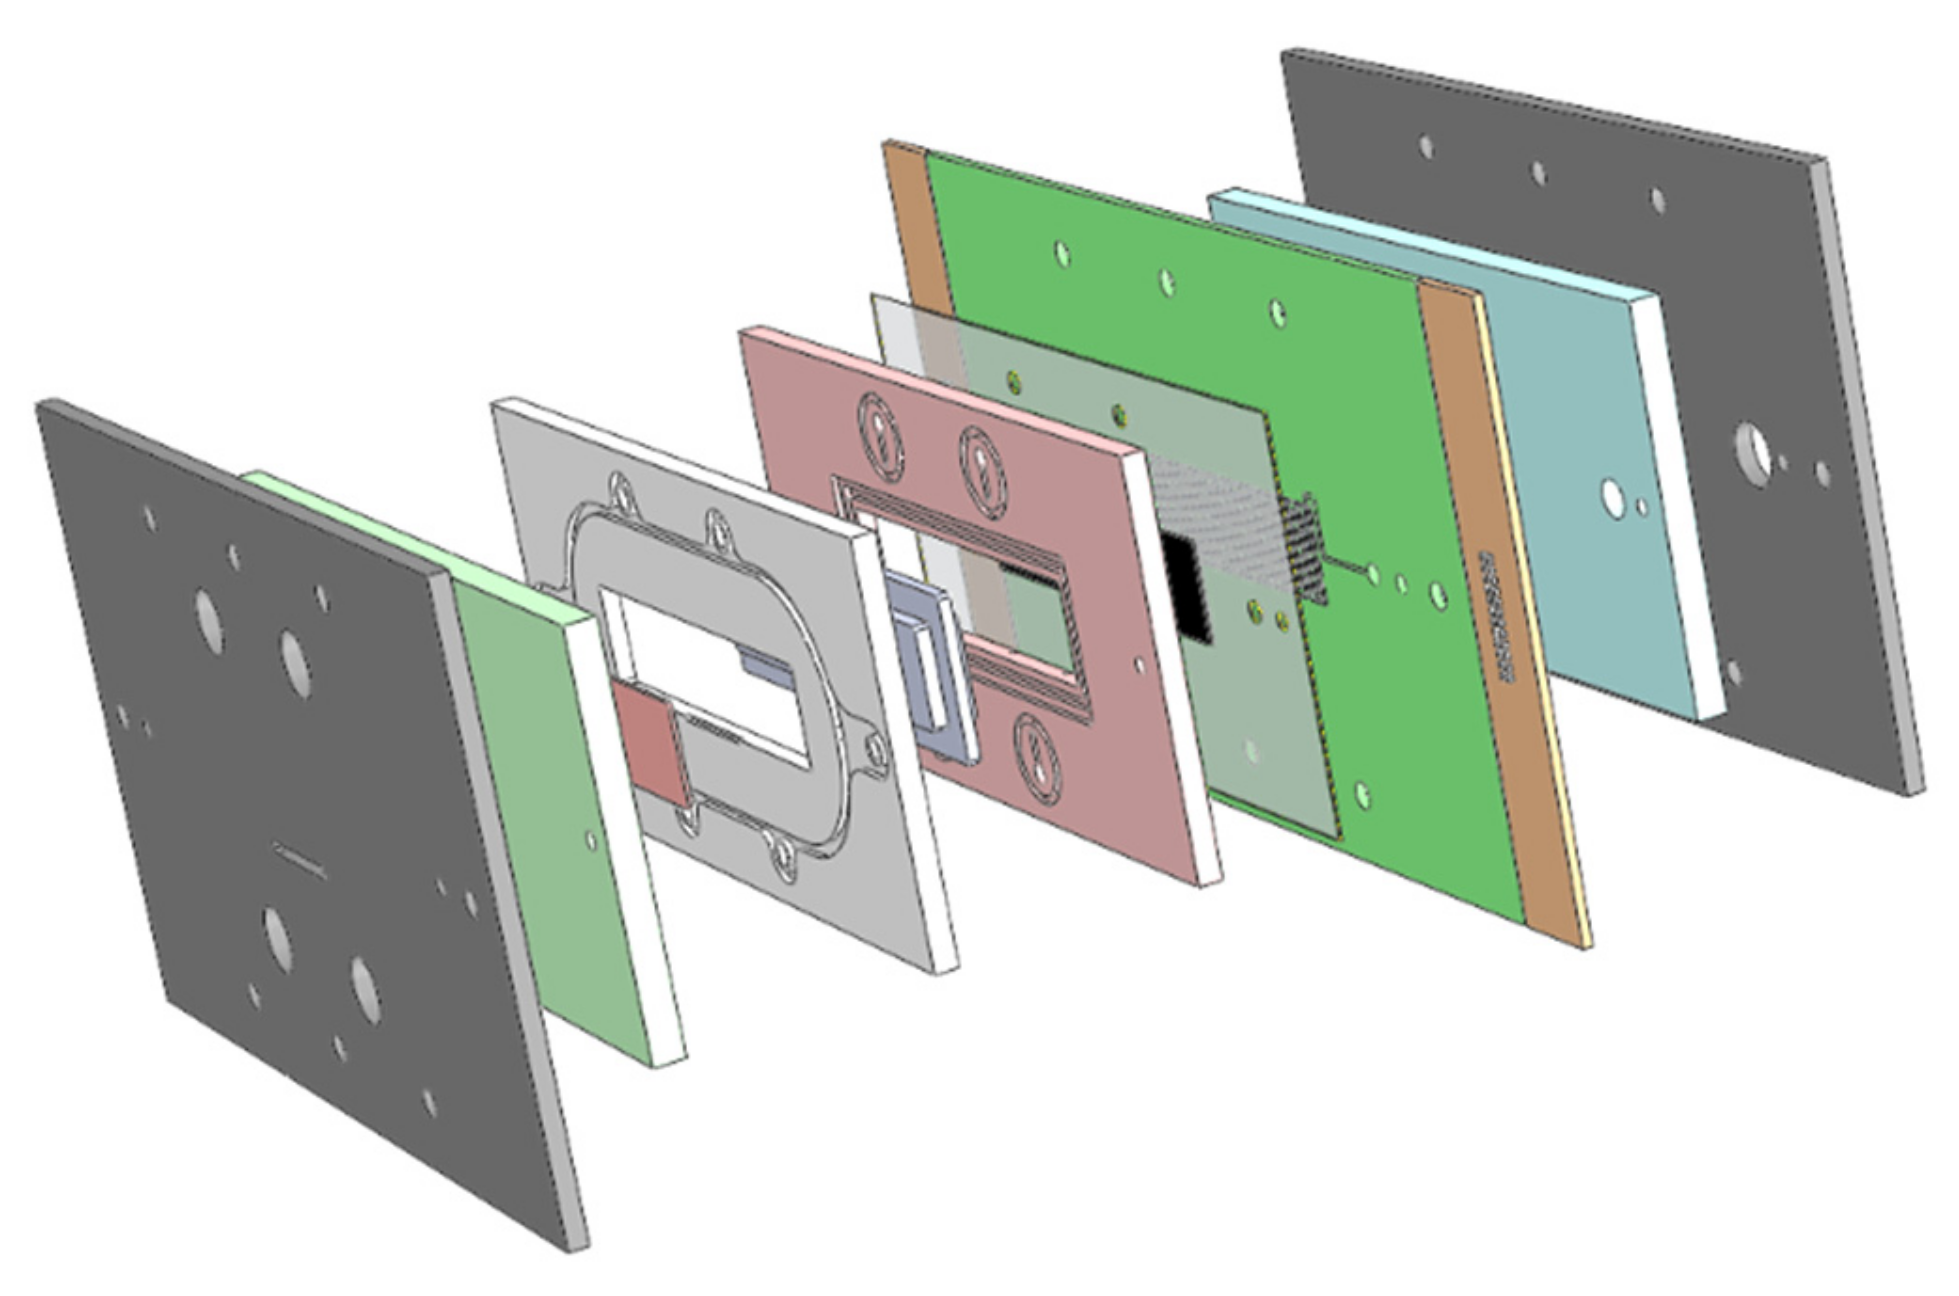
An exploded view of the experimental setup including the PCB is shown in
Figure 2.
The current was collected at the segment, then passed through a shunt resistor. The voltage drop data is read at this point and ultimately the current from all the segments is combined on the opposite side of the PCB.
A data acquisition system NI USB-6225 (National Instruments Germany GmbH, München, Germany) was used to collect data from the PCB in real time with a resolution of 15 bits. The datapoints were acquired and processed with a LabView interface program. The measurement data were recorded in 1 s intervals and averaged over 3 s. The raw data was processed via interpolation and presented as a smoothed current density contour plot, for an easier visualization of high and low current spots across the cell active area.
3. Results and Discussion
A polarization curve at a constant flow rate was performed to observe changes in the current distribution as the cell voltage changed. Cell operating conditions were varied significantly to determine what effect the flow rate would have on the current distribution of the cell, thus finding the optimum λ. Initially, the flow rate of H2 was stepwise adjusted, whilst the catholyte flow rate was set to VBr2 = 30 mL min−1 (equivalent to a stoichiometric flow factor of λ ≅ 20 at 10 A and 100% SOC utilization). During charge, Br− is converted to Br2 on the positive electrode, which forms additional polybromide ions with additional Br− ions. To equilibrate the charges, hydronium ions migrate across the membrane and recombine in the anode, effectively releasing H2. Consequently, a decrease in stoichiometry on the H2 supply is not expected to have a pronounced limiting influence on the cell performance or current distributions on charging operation.
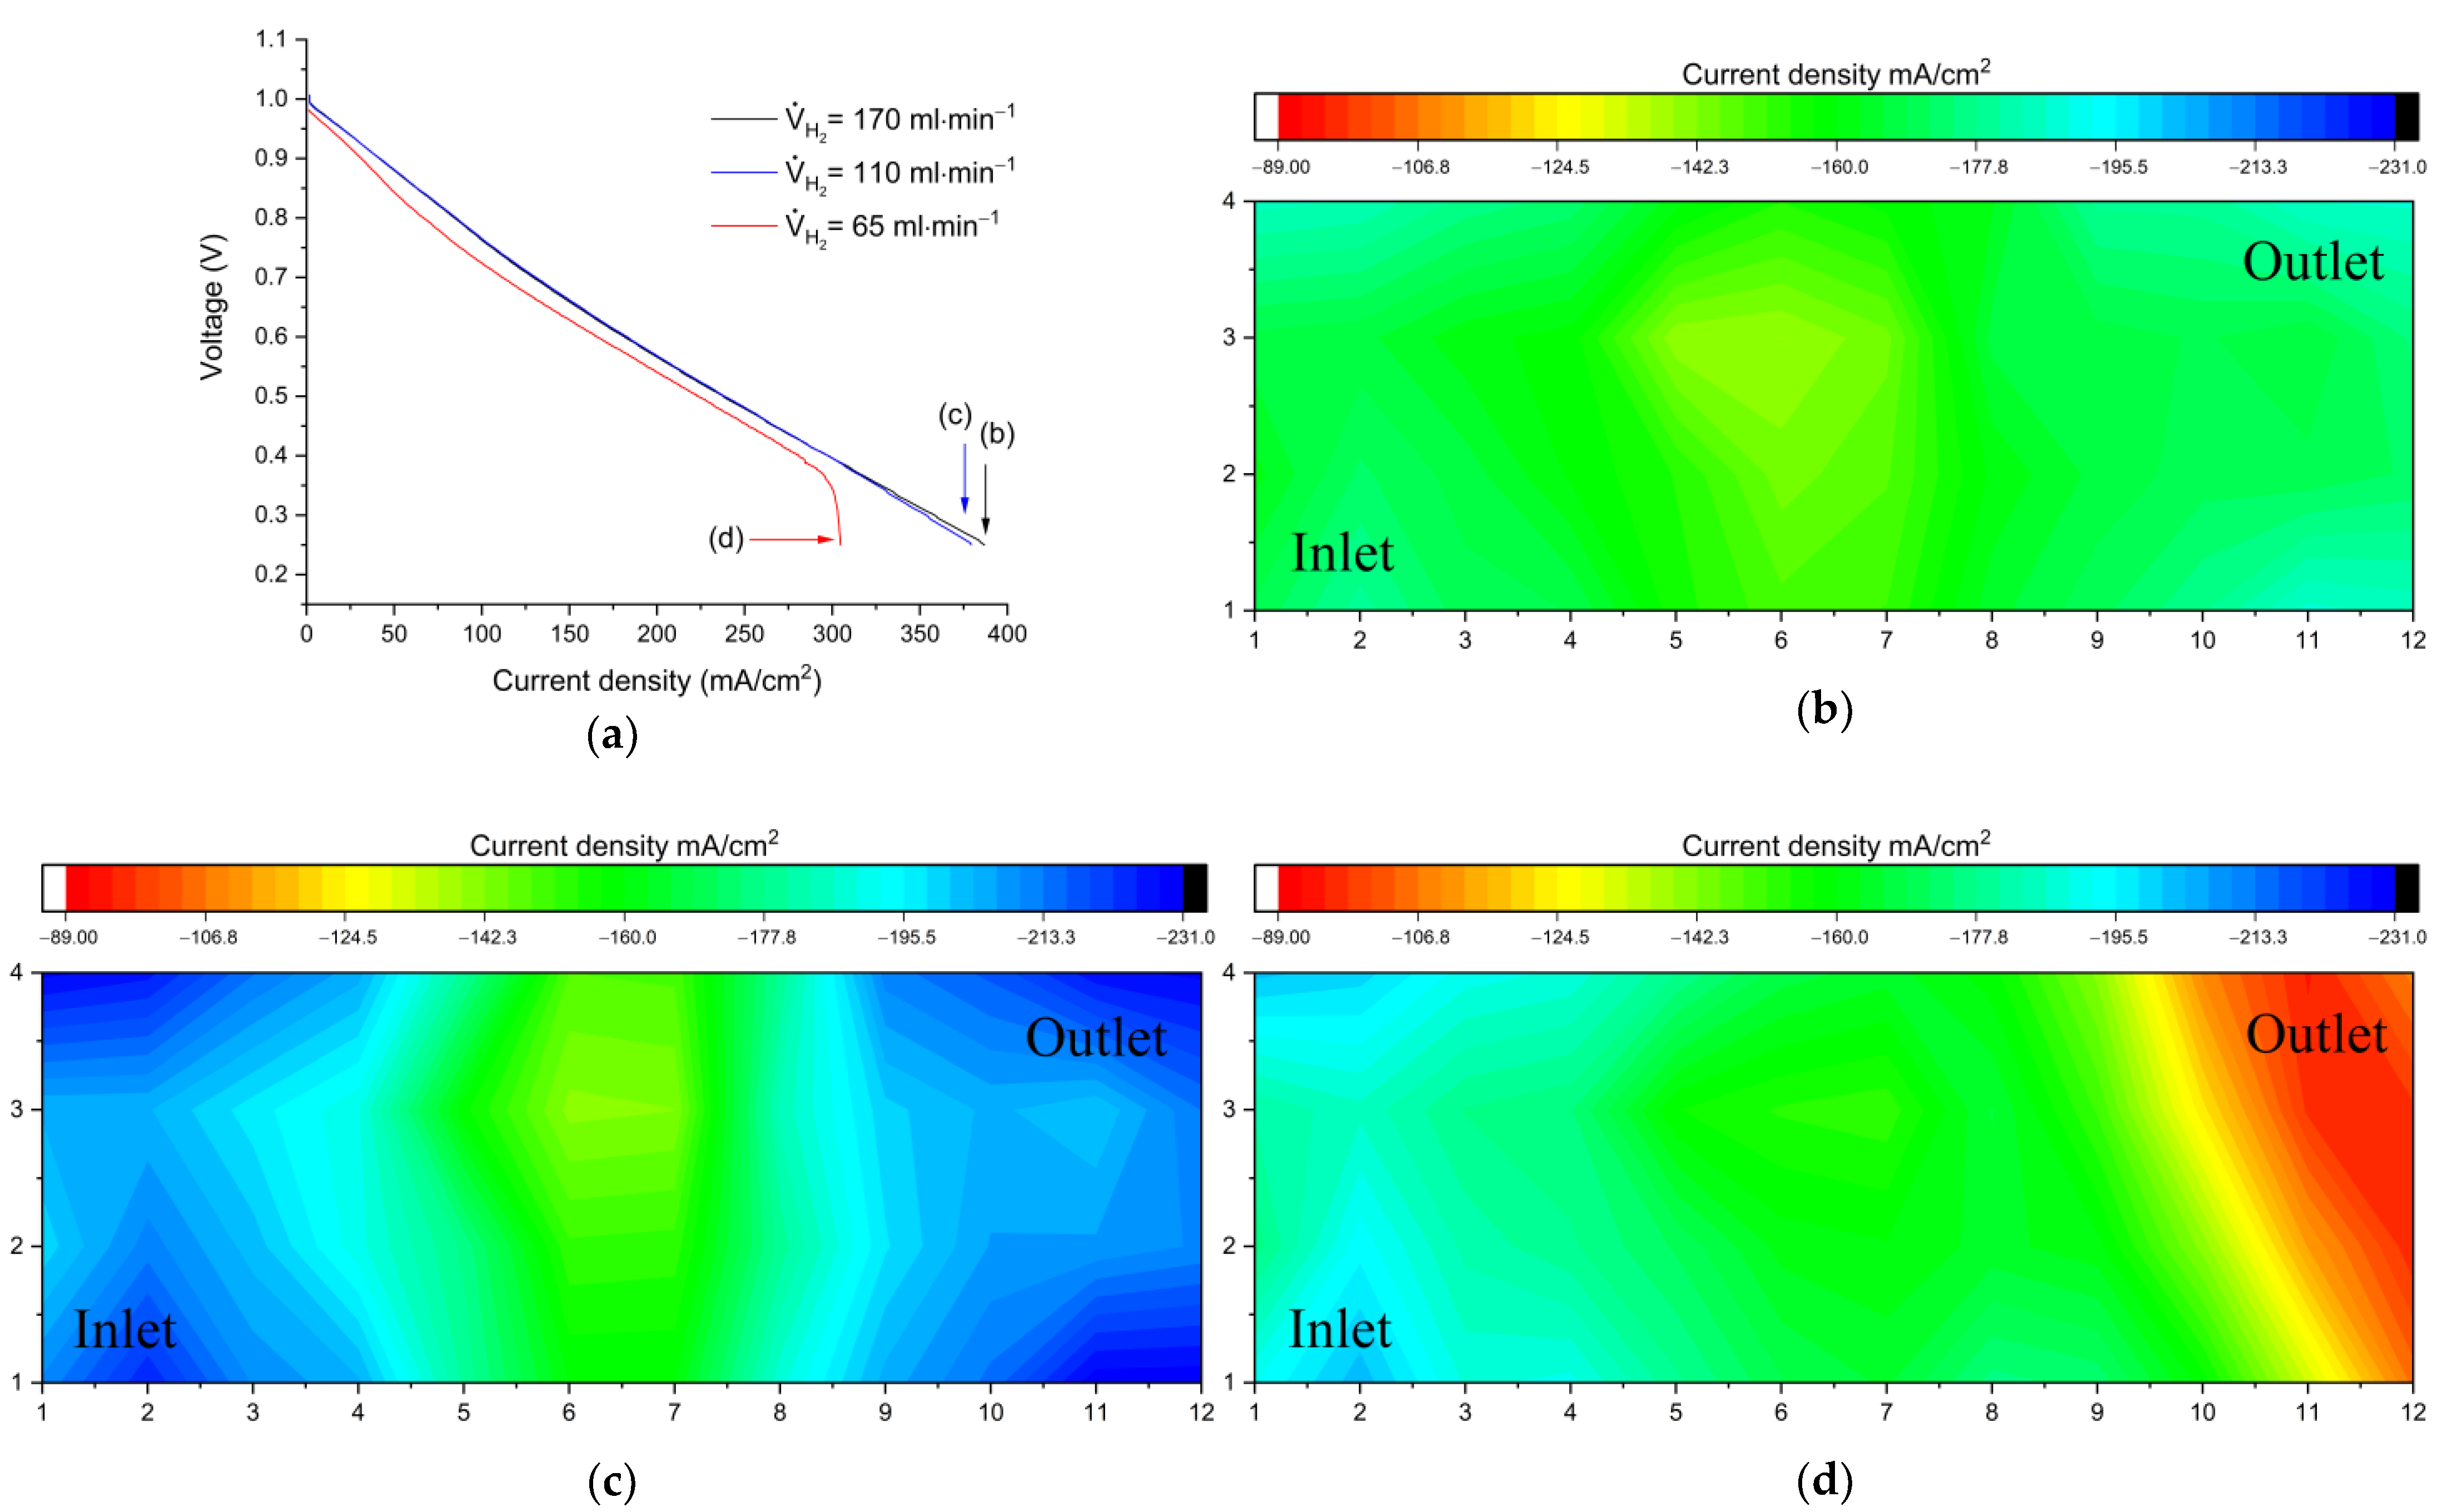
Figure 3 shows a comparison of performance and limiting current distribution as a function of anolyte flow rate.
Figure 3a shows polarization curves (charging) at three different flow rate values.
Figure 3b–d show the corresponding distributions under limiting current conditions at the end of the polarization curves.
During discharge, hydrogen is oxidized with water to form hydronium ions (H3O+) at the negative electrode and the polybromides react to bromide ions on the cathode. The hydronium ions again migrate to the cathode to equilibrate the charges. Different from charging operation, a sufficient hydrogen flow is necessary to sustain the reactions.
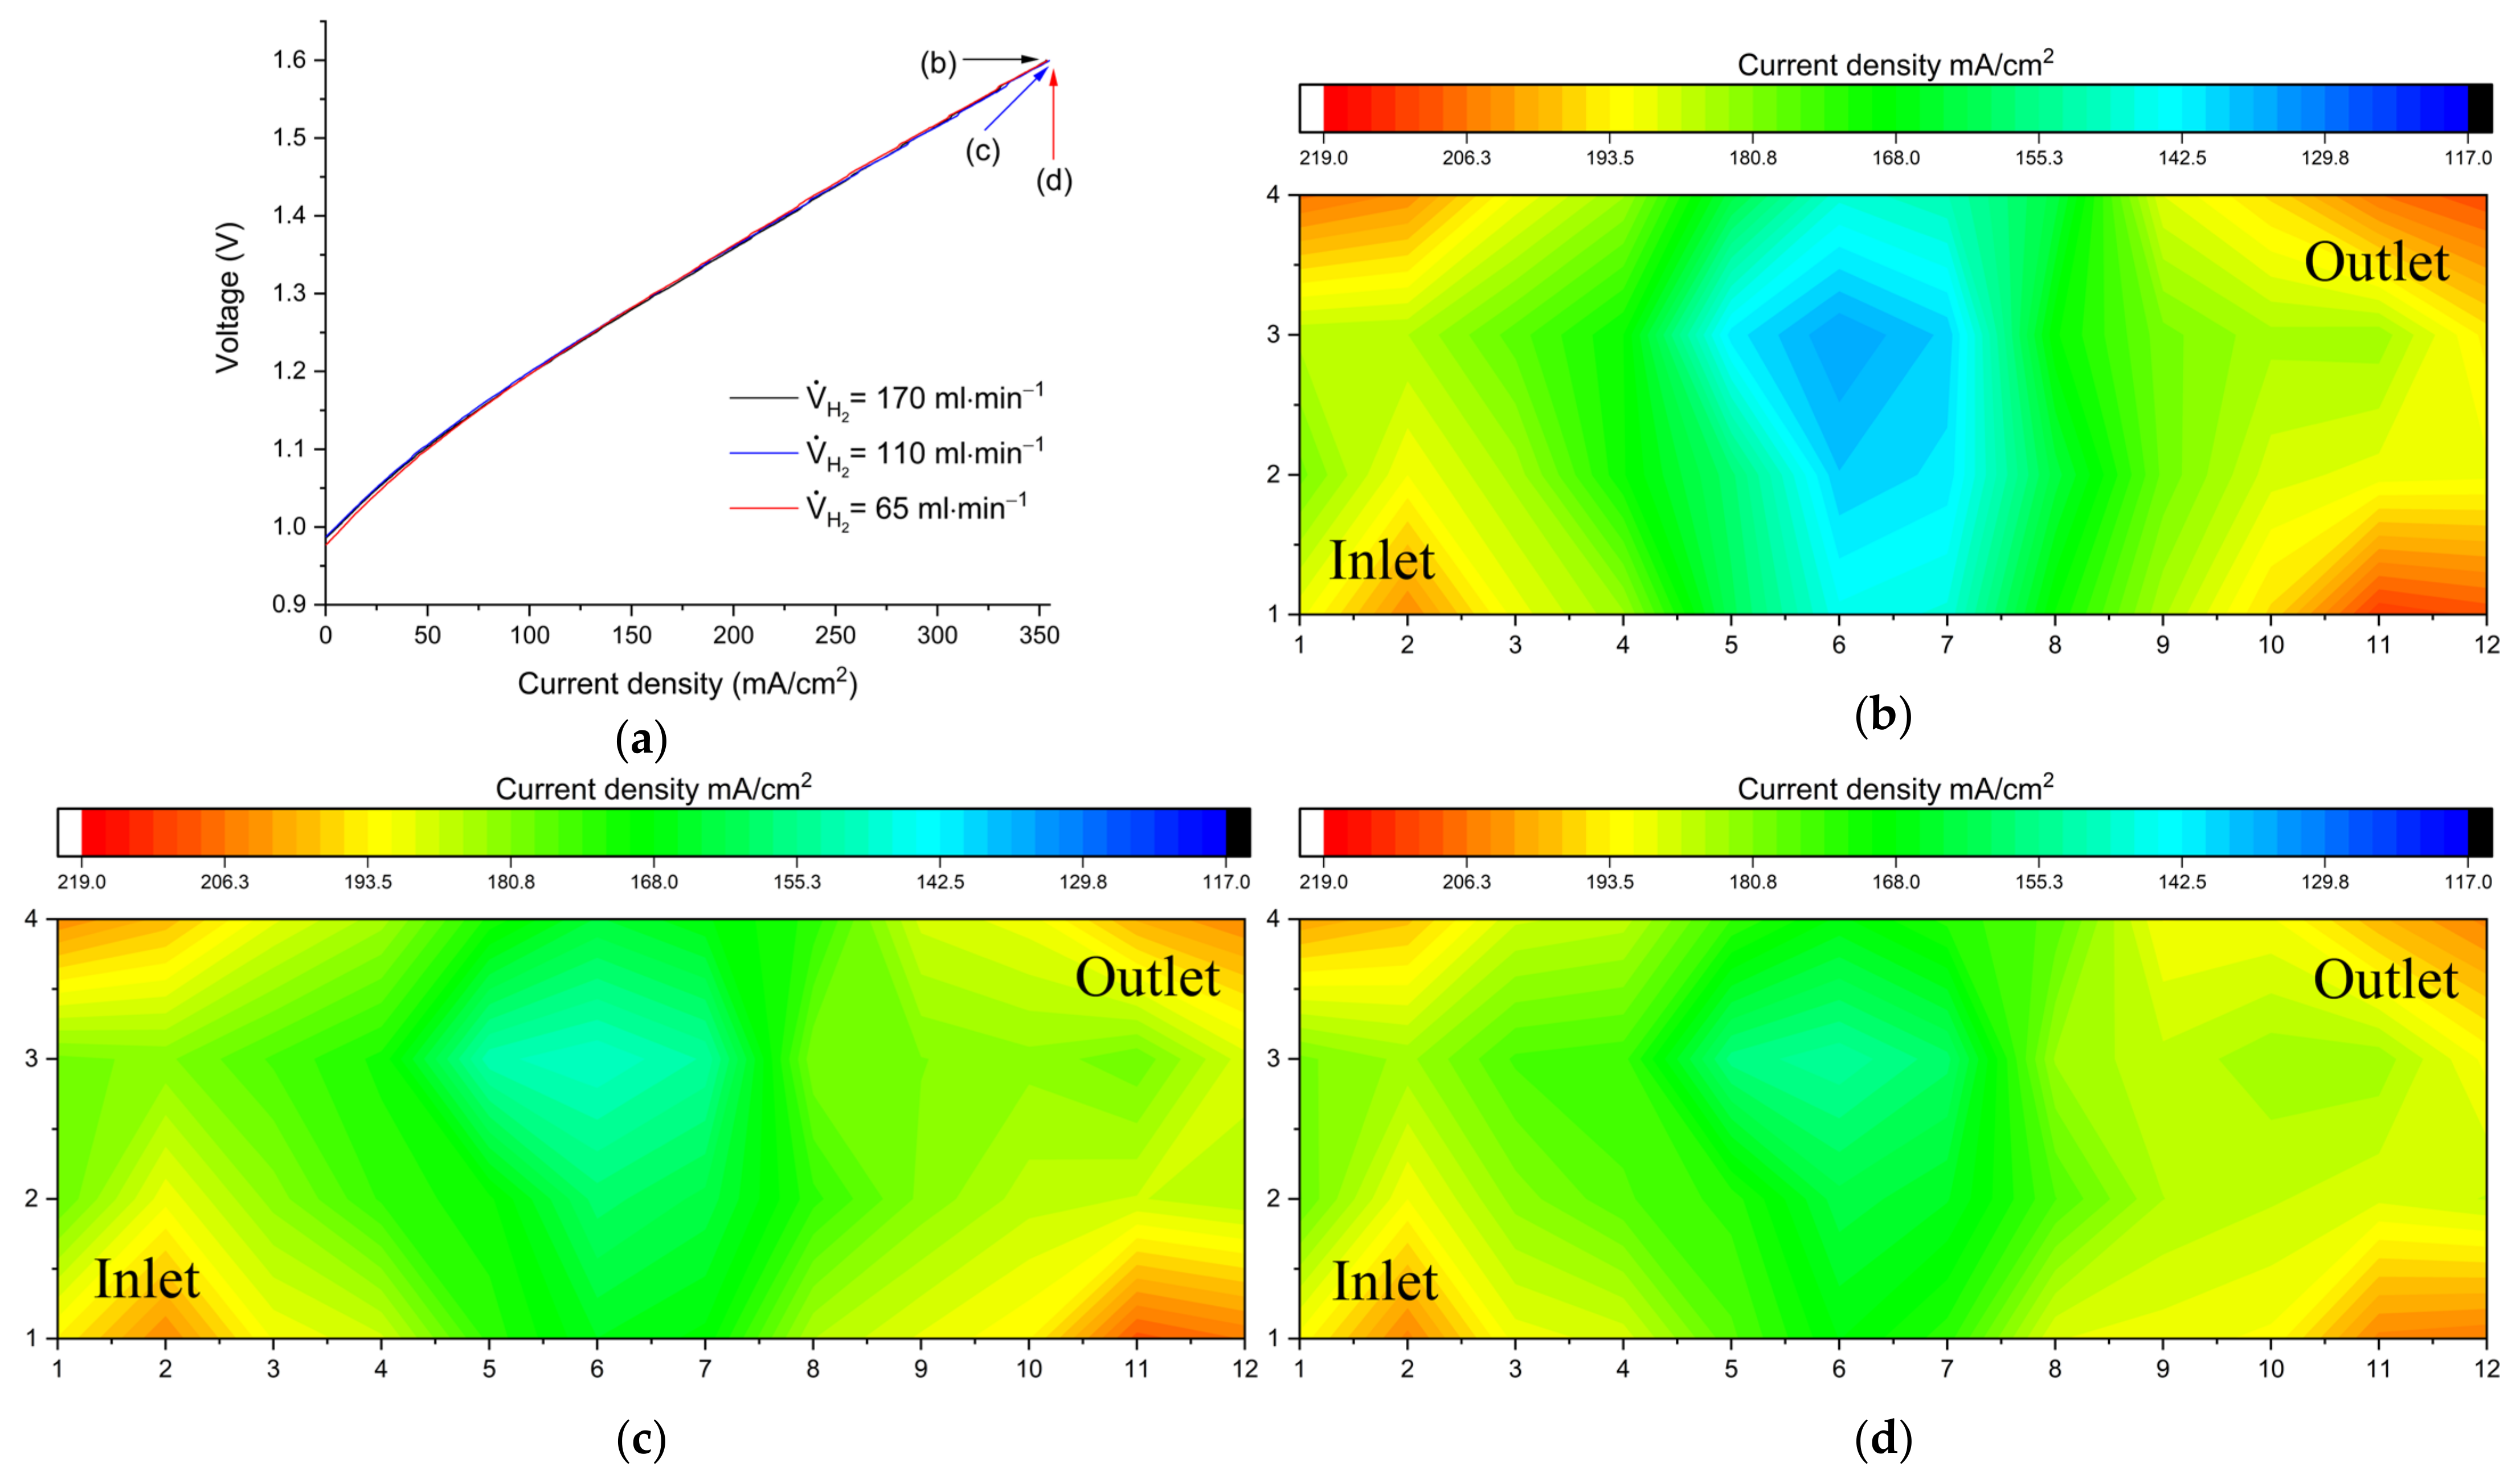
At a flow rate of V
2 = 170 mL min
−1 the polarization curve shows a nearly linear behavior, indicating that at high currents the cell is dominated by ohmic losses. The corresponding current distribution is rather homogeneous (
Figure 4b). A small decrease (V
H2 = 110 mL min
−1) barely limits the polarization curve but is already visible in the current density distribution in
Figure 4c. At V
H2 = 65 mL min
−1 (equivalent to a stoichiometric flow factor of λ ≅ 1) the polarization curve breaks in after 300 mA/cm
2, indicating considerable mass transport overpotential. This is clearly depicted in the limiting current distribution in
Figure 4d, with the lowest local current density near the H
2 outlet. These large gradients indicate a significant mass transport limitation because the left side of the electrode sustains a high current while the outlet region is underutilized, indicating a depletion of hydrogen on the anode side.
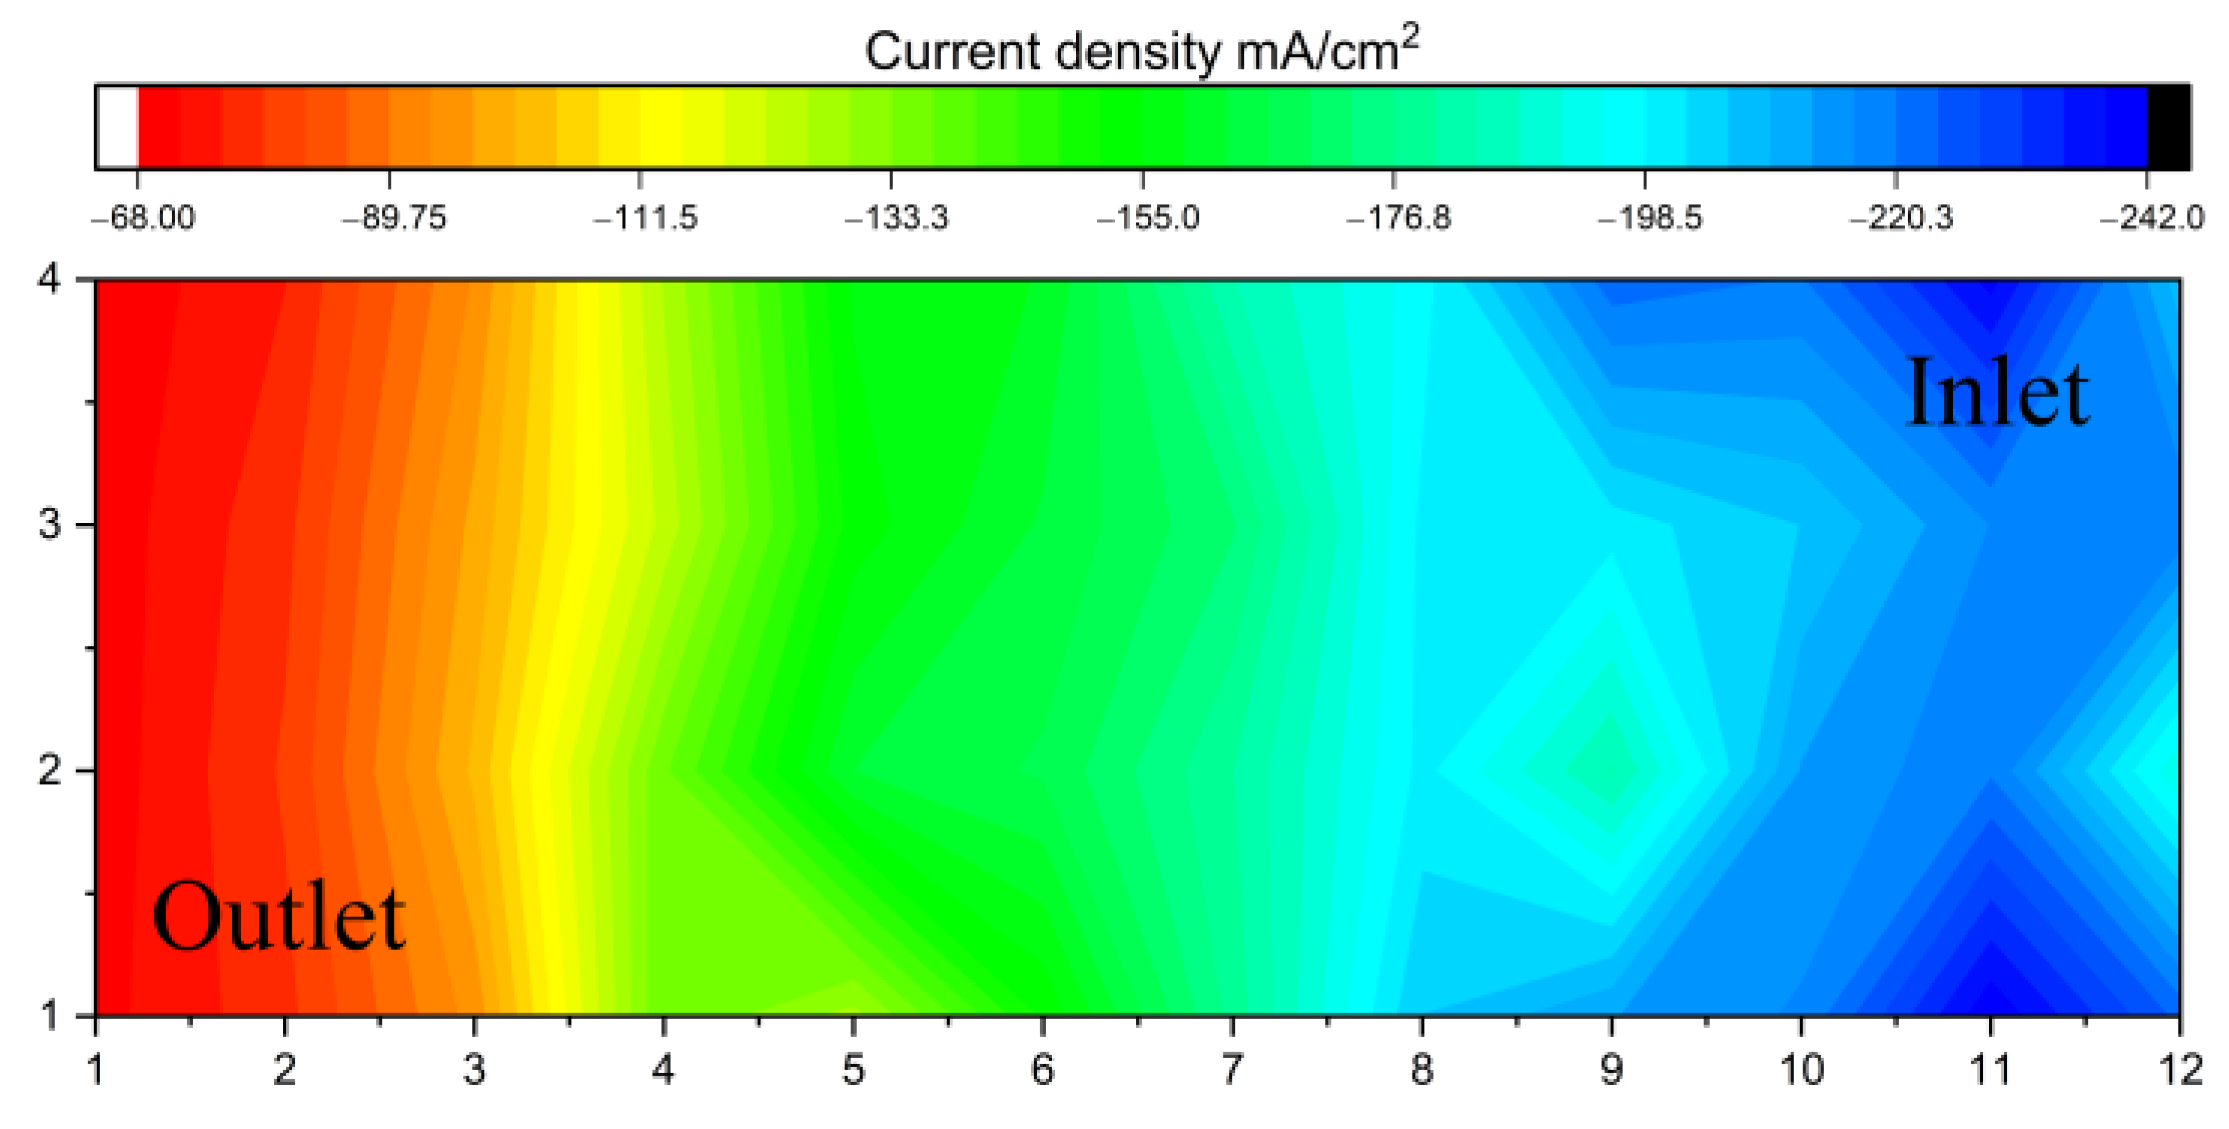
Figure 5 shows a current density distribution under the same operating conditions as
Figure 4d but with reversed H
2 flow (from right to left). The mapping shows that the high and low current density areas alternate, with the distribution uniformly decreasing towards the outlet.
The same approach was then applied to analyze the corresponding correlation for the catholyte. Therefore, the flow rate of Br2 was stepwise adjusted, whilst the anolyte flow rate was set to VH2 = 170 mL min−1 (equivalent to a stoichiometric flow factor of λ ≅ 2.5 at 10 A). A characteristic contrast between electrolytes must be highlighted; while the composition of the anolyte remains constant throughout the whole battery operation range, the catholyte properties strongly depend on the state of charge. During charge, a HBr aqueous solution is fed onto the cathode half-cell and converted to Br2 and polybromides, respectively, at the positive electrode. During discharge, a solution of Br2 and polybromides in HBr reacts to bromide ions. The supply of Br2/polybromide solution is thus essential both during charge and discharge operation.
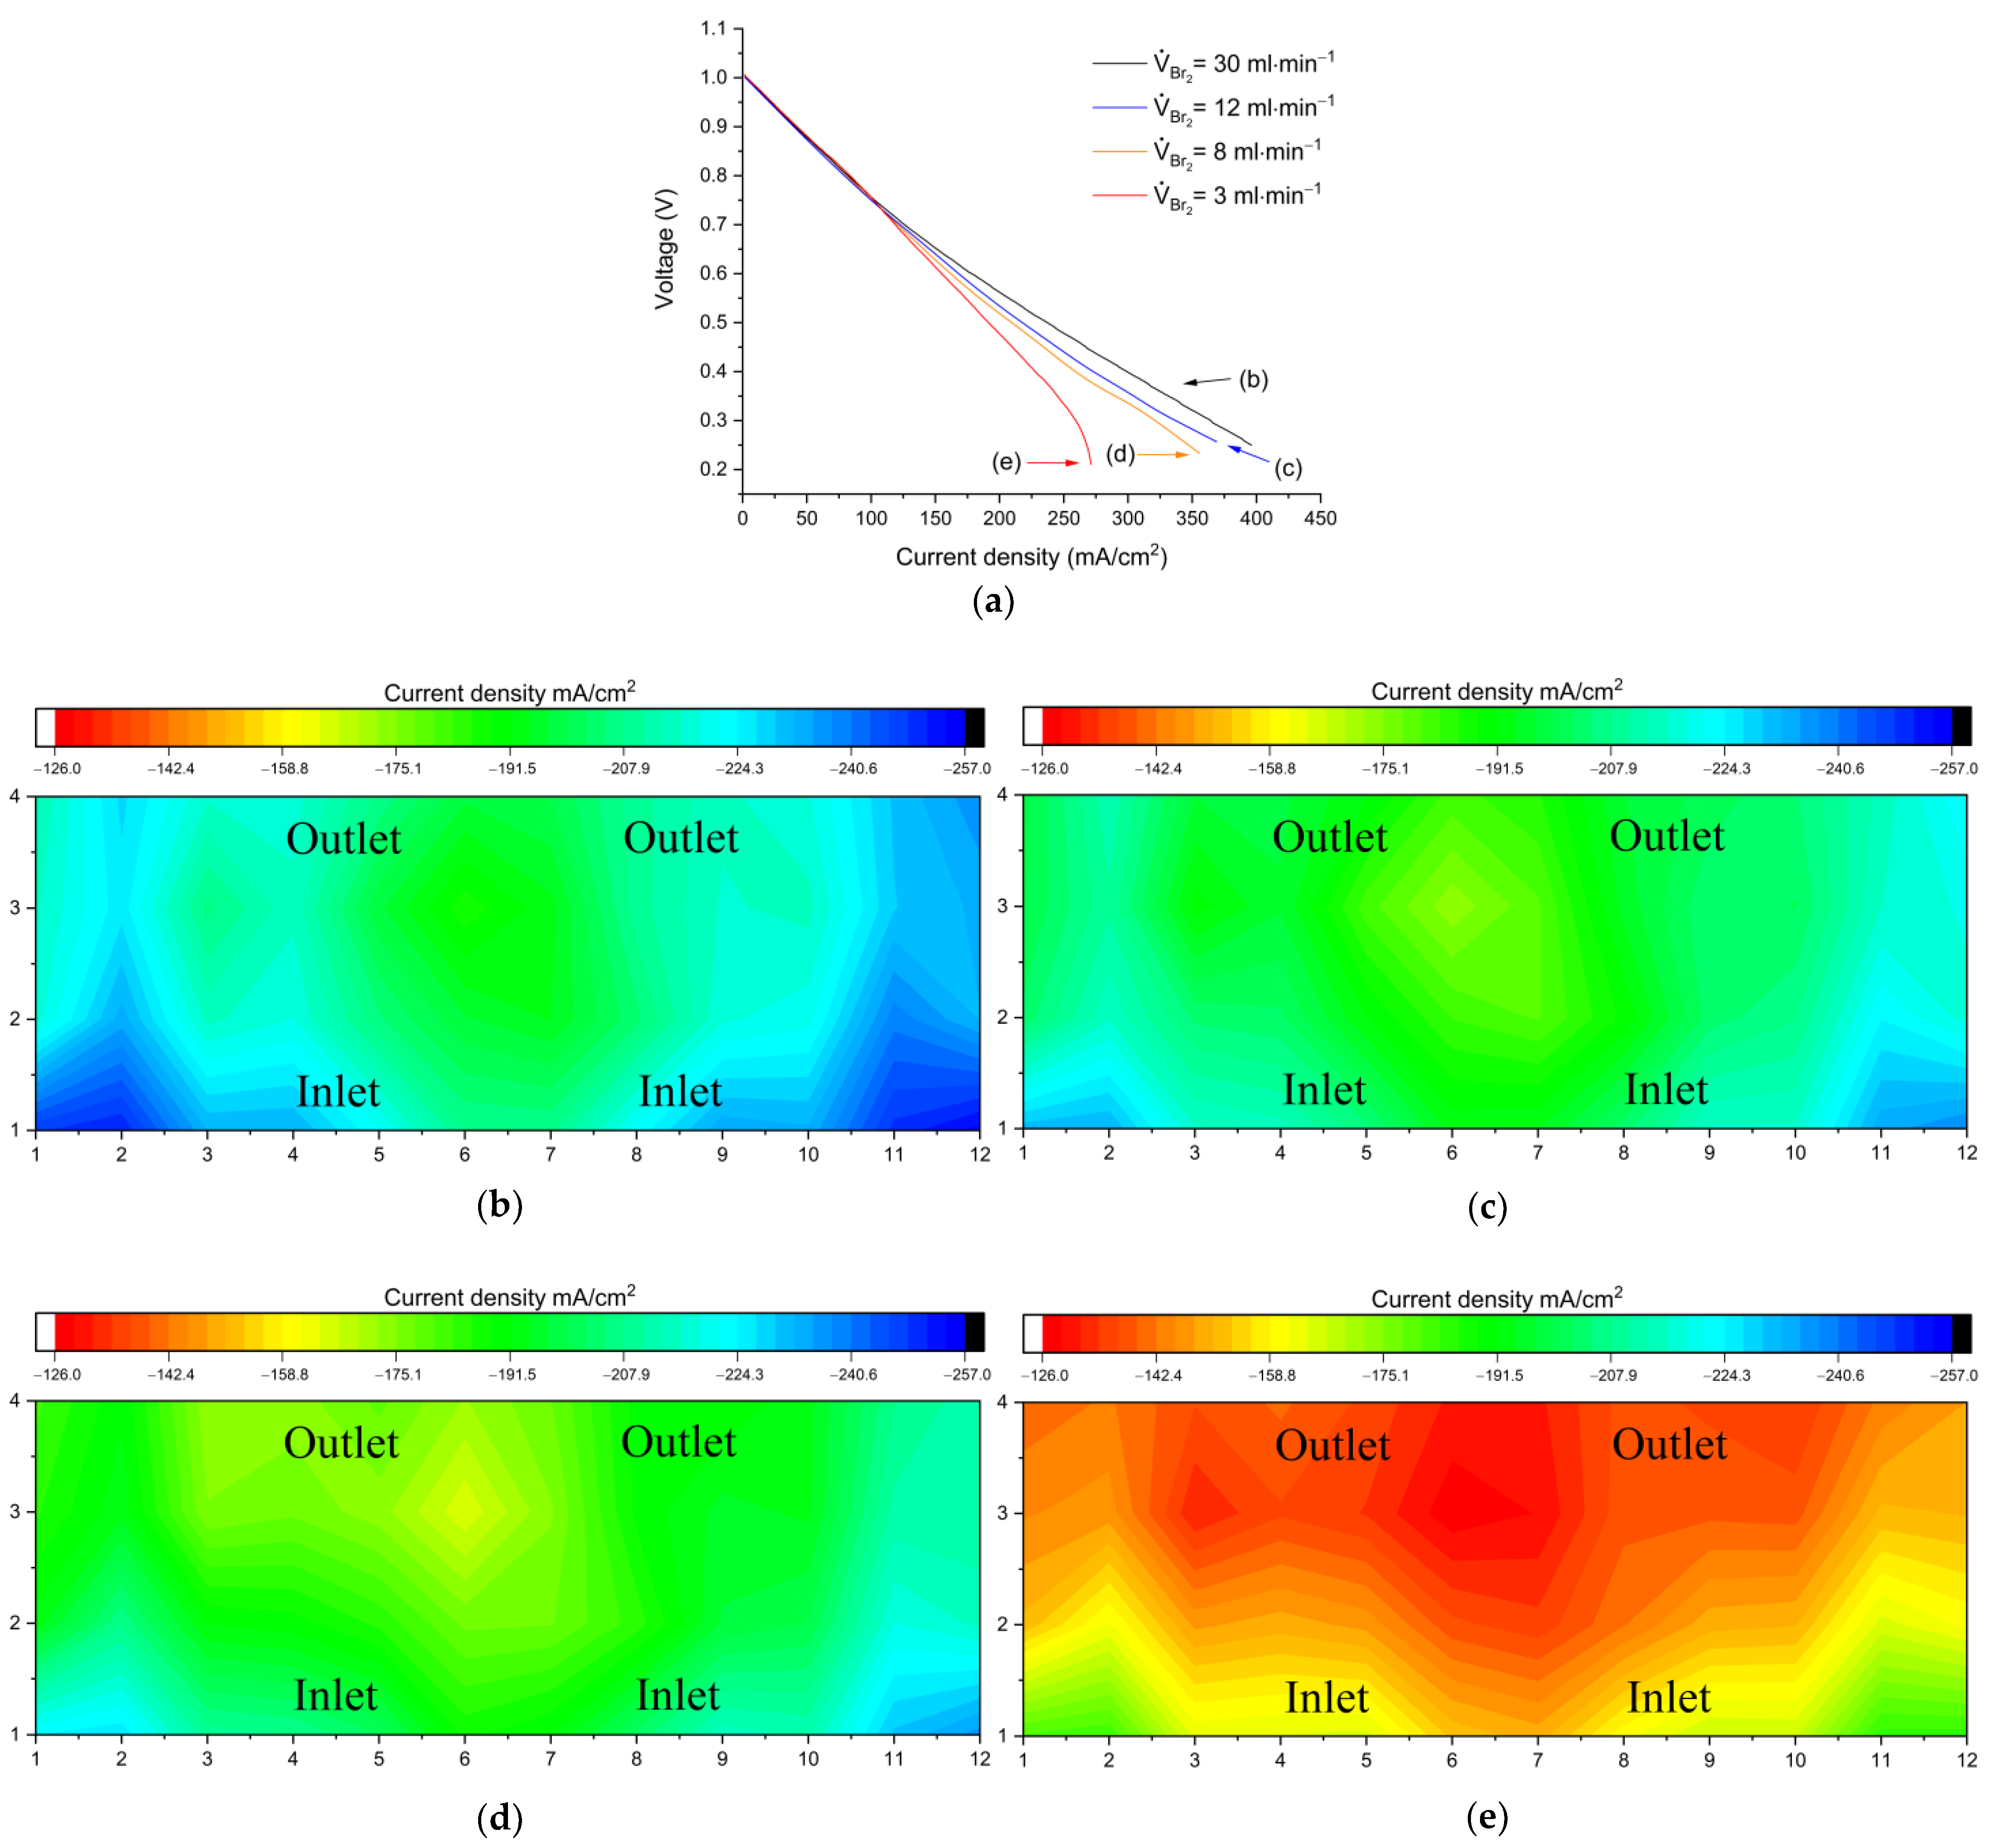
Figure 6 compares performance and limiting current distribution as a function of flow rate when the H
2 solution is not mass transport limited.
Figure 6a shows V-I curves (discharging) at different flow rate values.
Figure 6b–d show the corresponding distributions under limiting current conditions at the end of the polarization curves.
For single cell studies in RFBs, a commonly accepted practice is the setting of flow factors to high values (λ ≥ 5). The current density recorded at this condition can be found in
Figure 6c. A consistent distribution reflects that at these conditions, the electrode is being fed with sufficient electrolytes. An increase in stoichiometry has been proposed as a viable way of improving the cell performance [
18]. Upon testing, a twofold increment (V
Br2 = 30 mL min
−1, equivalent to λ ≥ 10 at 10 A) resulted in a 7% extension of the limiting current density, displaying still a consistently homogeneous distribution (
Figure 6b). Such supply overflows can be reasonable at the lab-scale level, but lead to considerable energy waste in the upscaling stage. It is thus interesting to investigate what is the minimum possible rate that reliably enables a satisfactory performance. The flow rate was therefore adjusted, limiting it below the original value (V
Br2 = 8 mL min
−1). The limit in current was slightly shifted (3.8%) and the current density remained mostly unaffected. The limiting flow rate was found at V
Br2 = 3 mL min
−1, equivalent to λ ≅ 1.5 at 8 A; at this point it is possible to identify a steep shift in the graph (
Figure 6a) as well as a current distribution that follows the direction of the electrolyte, with high currents at the cell inlet (bottom) that gradually decrease towards the outlet (top). This effect can be explained as a mass transport limitation, since the electrolyte utilization at the currents applied is relatively high (a cell with 50% SOC inlet, operating at 350 mA/cm
2 has a SOC of 75% at the outlet).
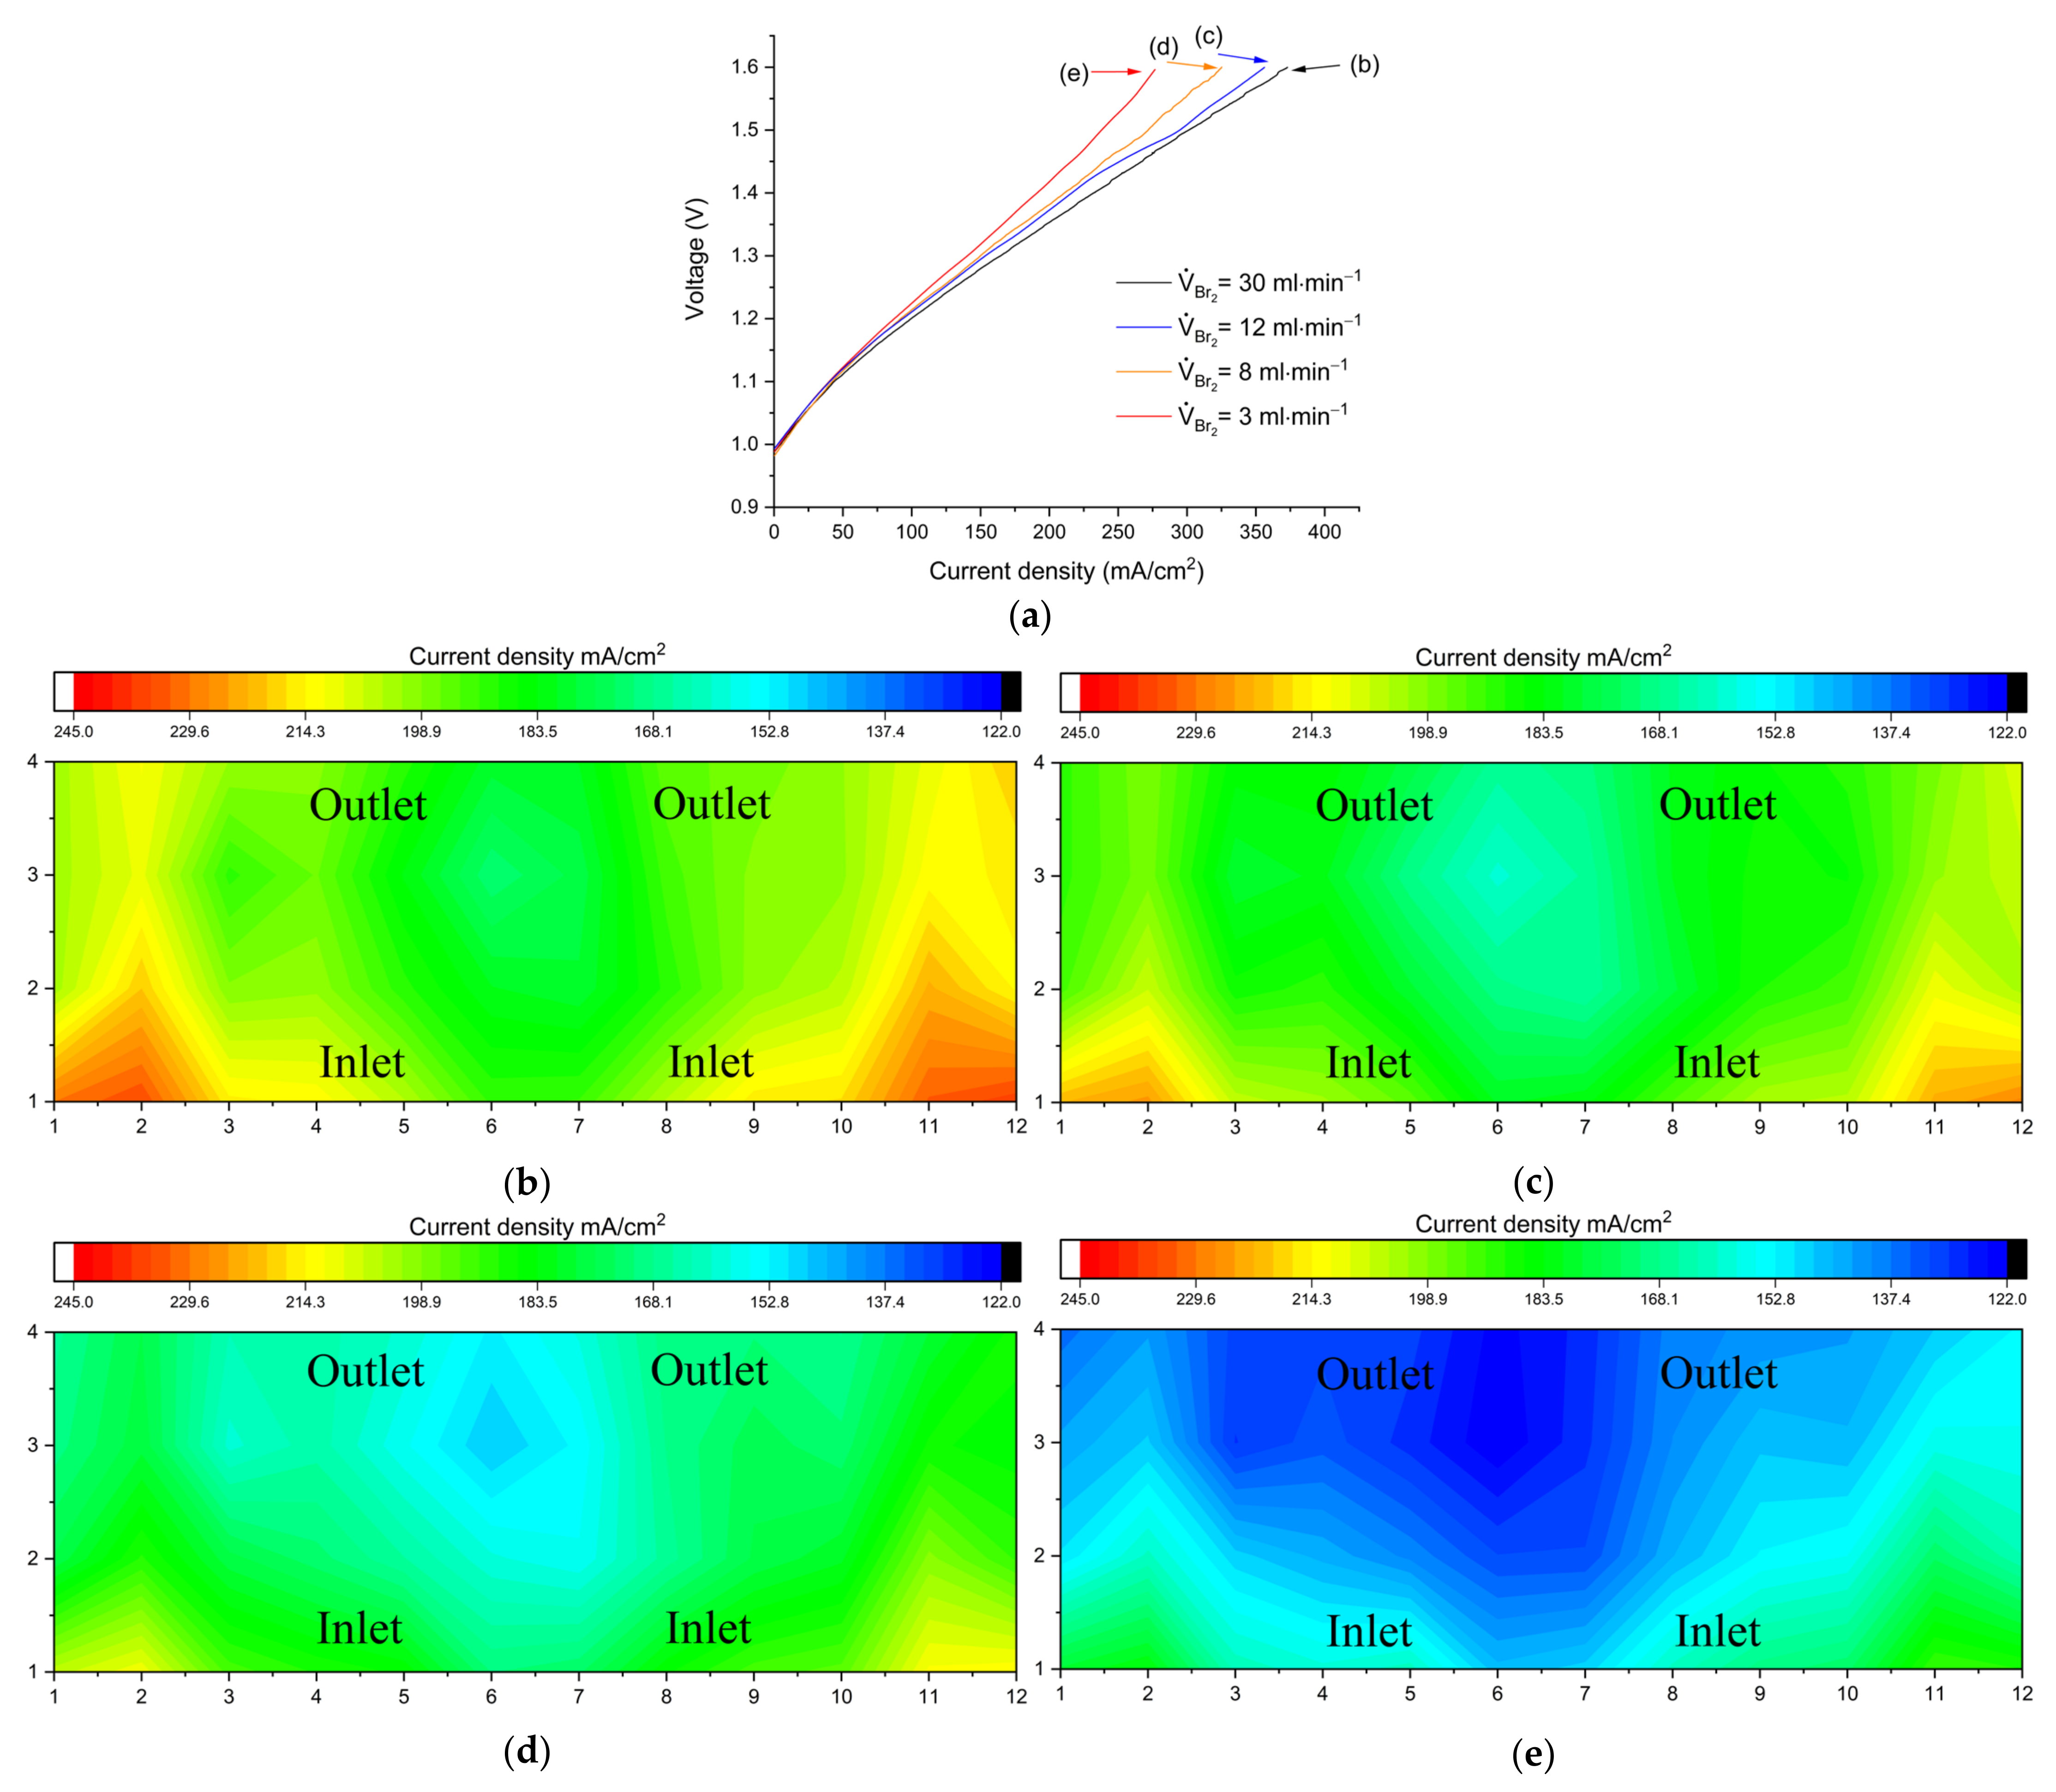
The same effect was investigated in the charge direction.
Figure 7a shows V-I curves (charging) at different flow rate values.
Figure 7b–d show the corresponding distributions under limiting current conditions at the end of the polarization curves.
The mass transport limitation induced by concentration changes from inlet to outlet can again be identified, but this time the maximum limiting current density reached at overflow conditions (VBr2 = 30 mL min−1) was 10% lower compared to the one obtained in the discharge direction, suggesting that additional processes take place during charging.
The conductivity of the electrolytes depends primarily on the high proton concentration. As the cell charges, Br
− is converted to Br
2 and protons are consumed in the production of H
2. This decreasing proton concentration is directly related to the electrolyte conductivity [
12].
4. Conclusions
The printed circuit board approach for the in-situ measurement of localized current densities of the H2-Br2 RFB was successfully implemented for the first time. This analytical tool was installed in the hydrogen half-cell and used to investigate the conditions limiting the performance of our in-house developed battery.
Mass-transport limiting current densities and their corresponding current distribution mappings as a function of the flow rate were analyzed in order to define the cell operational limits.
A strong decrease in H2 flow rate during charge did not affect the maximum current density, nor did it reflect heavily on the matching current distribution graphs. Such behavior was anticipated, for hydrogen is released as a result of the reduction of protons. Discharge operation, on the other hand, showed a clear correlation to electrolyte supply. At a stoichiometric flow factor of λ ≅ 1 and upon reaching 300 mA/cm2, the cell rapidly hit the cutoff voltage while a current gradient decreasing towards the H2 outlet was identified. Limiting areas that can be attributed to starvation of reaction media could be observed close to the outlet, in agreement with mass transport limitation. It was demonstrated that the observed distribution is highly dependent on electrolyte utilization and a defined mass transport limitation was identified at low flow rates and high currents.
An unexpected outcome was the sharply defined distributions found during the investigation of the limiting factors on the catholyte side, likely due to the enhancement created by the overlapping effects taking place on the positive half-cell.
While the anolyte composition remains constant throughout the whole cell operation range, catholyte continually reacts from pure HBr and water to incorporate Br2 (the latter being known as an insulator) during charge and in the opposite direction during discharge, giving the electrolyte a distinct dynamic nature.
By performing the same discharge experiment on the positive half-cell with a H2 overflow, mass transport limitations were detected around λ ≅ 1.5, characterized by high current density regions around the inlet that gradually fade onto low current spots by the outlet.
The gradient developed towards the outlet was more prominent in charging conditions. In this case, additional to reactants starvation, the electrolyte evolution must be considered. With bromide ions being converted to Br2, the proton concentration falls, thus lowering the conductivity. When the bromide concentration in the electrolyte decreases whilst the bromine concentration grows, the amount of free Br− ions is no longer sufficient to form polybromides, leading to the formation of non-conductive pure Br2 in the battery.
At the high currents reached at cutoff and the low flow rates explored in the current experiments, the conversion rate is considerably high; the reacted bromine cannot be expelled from the cell fast enough. Therefore, the marked rise in overvoltage during charge can be explained as a combination of mass transport and decreasing electrolyte conductivity.
This study demonstrates the potential of segmented current collectors as a powerful characterizing tool in the research and advancement of H2-Br2 redox flow batteries and highlights a promising improvement area in the operation of such cells.


 ,
, 