Article

Energy Efficiency and Life Cycle Assessment with System Dynamics of Electricity Production from Rice Straw Using a Combined Gasification and Internal Combustion Engine

by
Resmond L. Reaño
1,*,
Victor Antonio N. de Padua
1 and
Anthony B. Halog
2,*
1
Department of Engineering Science, College of Engineering and Agro-Industrial Technology, University of the Philippines Los Baños, Laguna 4031, Philippines
2
School of Earth and Environmental Sciences, University of Queensland, St. Lucia, QLD 4072, Australia
*
Authors to whom correspondence should be addressed.
Energies 2021, 14(16), 4942; https://doi.org/10.3390/en14164942
Submission received: 15 July 2021 / Revised: 10 August 2021 / Accepted: 10 August 2021 / Published: 12 August 2021
(This article belongs to the Section A: Sustainable Energy)

Abstract

:
This study assessed the environmental performance and energy efficiency of electricity generation from rice straw using a combined gasification and internal combustion engine (G/ICE). A life cycle assessment (LCA) was performed to consider the conversion to electricity of rice straw, the production of which was based on the Philippine farming practice. Rice straw is treated as a milled rice coproduct and assumes an environmental burden which is allocated by mass. The results of an impact assessment for climate change was used directly in a system dynamic model to plot the accumulated greenhouse gas emissions from the system and compare with various cases in order to perform sensitivity analyses. At a productivity of 334 kWh/t, the global warming potential (GWP) of the system is equal to 0.642 kg CO2-eq/MJ, which is 27% lower than the GWP of rice straw on-site burning. Mitigating biogenic methane emissions from flooded rice fields could reduce the GWP of the system by 34%, while zero net carbon emissions can be achieved at 2.78 kg CO2/kg of milled rice carbon sequestration. Other sources of greenhouse gas (GHG) emissions are the use of fossil fuels and production of chemicals for agricultural use. The use of agricultural machinery and transport lorries has the highest impact on eutrophication potential and human toxicity, while the application of pesticides and fertilizers has the highest impact on ecotoxicity. The biomass energy ratio (BER) and net energy ratio (NER) of the system is 0.065 and 1.64, respectively. The BER and NER can be improved at a higher engine efficiency from 22% to 50%. The use of electricity produced by the G/ICE system to supply farm and plant operations could reduce the environmental impact and efficiency of the process.

1. Introduction

The world energy scenario is characterized by depleting fuel source and environmental concerns associated with the use of fossil fuels [1,2]. Although the global COVID-19 pandemic resulted in a 5.8% decline in 2020 of carbon dioxide (CO2) emissions, carbon emissions are expected to reach about the same atmospheric level by 2023. This is the case, despite the fact that energy demand will lag in comparison to the pre-pandemic projected case, due to a three-year delay caused by the economic recovery scenario [3,4]. Continued operation of the currently-existing energy infrastructure until 2050 will produce an amount of CO2 that comprises 30% of the remaining emissions budget required to limit global warming to 1.5 °C, with a 50% probability. Coal-fired power plants produce about 20% of total global emissions, and account for 40% of the emissions from the electricity sector [3]. Renewable energies offer a promising solution to supply the high energy demand of the future and to reach the goal of net-zero carbon emissions by the year 2050. The share of renewables in electricity production is expected to increase from 29% in 2020 to nearly 70% in 2050, with Solar PV and wind energy expected to be the leading sources of renewable energy in the future, surpassing hydropower, which is currently the leading source of renewable energy globally [3,5]. Bioenergy produced from biomass is another viable resource which can contribute to meeting energy demand and mitigating CO2 emissions [6]. There have been issues regarding the carbon neutrality of biomass, creating varying degrees of confidence in its use as energy resource [7]. Currently, biomass is used as a cheap heat source, supplying 12% of global consumption in 2018. However, this application induces negative effects on human health and has adverse socio-economic and environmental impacts [5]. Biomass has a high availability and does not pose issues as an intermittent character, although competition for the use of arable land use is a main concern [8]. The conversion of agricultural biomass waste or residue into biofuels and bioelectricity could help to strengthen the energy security of agricultural countries, and avoid concerns about land-use competition with food crops. Rice straw has the potential to be used for various agricultural and industrial purposes, such as soil improvement through carbonization and composting, bio-energy production, and as a raw material to produce silica and bio-fiber, among other materials [1,9]. Recognizing the potential of rice straw as a source of alternative energy, various organizations have been conducting research intended to improve the rice straw management. The use of rice straw in bioenergy production results in more environmental benefits, while its use as animal feed only decreases its eutrophication potential, based on a life cycle assessment study of rice straw utilization practices [9].
Gasification is an interesting route through which to convert biomass and solid wastes into useful bioenergy. In gasification, carbonaceous feedstocks are partially oxidized at a higher temperature in order to produce a gas mixture of hydrogen (H2), carbon monoxide (CO), carbon dioxide (CO2), and methane (CH4), trace amounts of higher hydrocarbons, water, and nitrogen (N2) [1,10]. The producer gas exit temperature ranges from 700 °C to 1000 °C for downdraft gasifiers and 200 °C to 400 °C for updraft gasifiers. For a fluidized-bed gasifier, the gas exit temperature is about the same as its gasification temperature, which ranges from 700–900 °C [11]. Downdraft gasifiers have been widely studied and are considered to be a matured technology. They are considered to be highly efficient and produce less tar and particulate matter [12]. Producer gas is composed of combustible compounds such as H2, CO and CH4, with a calorific value (CV) of 11.0 MJ/Nm3, 12.7 MJ/Nm3 and 36 MJ/Nm3, respectively, with a high number of non-combustible components that include CO2 and N2. The typical lower heating value (LHV) of syngas produced using air or air/steam gasification ranges from 4–6 MJ/Nm3, thus it is considered to be a lean gas or low CV gas [12,13], with a cold efficiency of 50–70% [12].
A review of the maturity of biomass power generation technologies showed that 18.56% of combined gasification and internal combustion engines (G/ICE) exist at a technology readiness level (TRL) of nine, while more than 80% have a TRL equal to six. A TRL of six indicates that the system has been validated in the laboratory and a prototype demonstration has been completed, while a TRL of nine means that the technology is mature and operates successfully under all conditions, extents and ranges [8]. The overall efficiency of a 100% producer gas engine is within the range of 20–22%. A power generation efficiency of 21% was achieved using a 75 kW power generator operating at 85% load, and a fuel composed of 100% producer gas from the gasification of woody biomass. The fuel consumption rate is reported as 3.4 Nm3/kWh and 1.2 kg/kWh for the producer gas and fuel wood, respectively [13]. Using rice husk as a fuel source, the fuel consumption is reported as 1.7–1.9 kg rice husk per kWh and 3.76 Nm3 producer gas per kWh with gasification efficiency of 65% and a power generation efficiency of around 22% [14]. The main issue around using producer gas as a fuel includes the low energy density of producer gas/air mixture and the engine’s volumetric efficiency [12]. Other major issues include the presence of impurities such as tar, corrosive compounds, and hard solid particles [13,15]. In a 200-kW commercial gas engine, a maximum of 100 mg/Nm3 tar is allowable [14], while about 10–100 mg/Nm3 is an allowable range [13]. Available approaches to counter this include the use of perpetual engine cleaning and maintenance or keeping the producer gas temperature above its dew point, around 75 °C, until it is fed to the engine [15].
A life cycle assessment (LCA) methodology is used to calculate and analyze the environmental impacts associated with a product, process, activity, or system by compiling the material and energy flows through a defined life cycle boundary [16,17]. Despite the numerous available methods for calculating the environmental impacts of processes, LCA has become more popular due to its holistic and system-wide approach [18]. The major stages and processes of a product’s life cycle are traced, starting from mining operations and including raw material processing, manufacturing processes, product use and/or recycling, until its final disposal [17].
A cradle-to-gate LCA was applied on an electricity generation system from rice straw using direct combustion with a productivity of around 518 kWh/t rice straw. Electricity generation resulted in 36.09 g CO2-eq/MJ greenhouse gas emissions, while 40.75 g CO2-eq/MJ were reported for bioethanol production [19]. An LCA study using the CML methodology showed that the biorefinery of corn stover and wheat straw showed huge reductions in other impact categories, despite the low reduction in global warming potential as compared to fossil fuel counterparts [20]. Rice straw production and combustion in Malaysia was assessed using an LCA, with a global warming potential of 0.845 kg CO2-eq/kWh (~0.235 kg CO2-eq/MJ) electricity, while 224.48 g CO2-eq/kg was reported for rice straw production [21]. Singh and Basak [22] reported negative net GHG emissions for the various energy generation technologies from rice straw, due to the avoidance of open burning and fossil fuel use as the main emission sources.
System dynamics (SD) developed by Jay Forrester are used to create models from the interactions of variables, indicators, and metrics over time. SD simulation models have been applied to aid in decision-making of many organizations and institutions worldwide [23]. SD is used to design and simulate a system and examine its long-term behavior. SD enables the assessment of various “what-if” scenarios based on the created system model, which can be beneficial for future decisions and policy planning [24]. Studies were conducted wherein attributional LCA results were used directly in an SD model to simulate a circular environment and show dynamism [23]. Basically, the inventory and the impact assessment results are incorporated into the SD model as a stock or a variable in a flow. Climate change is the most common impact category that is tracked in an SD model, in order to show its accumulation over time [25].
The main goal of this study is to assess the environmental performance and energy efficiency of power generation using rice straw. A life cycle assessment is performed using the system boundary, starting from rice straw production, as a coproduct of milled rice, up to generation of electricity using the combined gasification and internal combustion engine. The environmental burden associated with rice straw is allocated by mass, focusing on the rice farming practices of the Philippines. Electricity is generated using an internal combustion engine using the product gas produced from the gasification of the rice straw as biomass feedstock. The greenhouse gas (GHG) emissions calculated using the LCA methodology are incorporated into a system dynamic model to show the accumulation of GHGs in the environment over a 30-year period. The efficiency of electricity generation is determined using the biomass energy ratio and net energy ratio.

2. Materials and Methods

2.1. Life Cycle Assessment–Goal and Scope Definition

The LCA includes an inventory of material and energy flows in order to assess the potential environmental impacts and energy performance of a process or product systems and to identify opportunities for improvement and aid in decision-making [26]. An LCA was performed following the procedure in the ISO 14040:2006 [26] and ISO 14044:2006 [27] guidelines, which comprise the goal and scope of the study, life cycle inventory, life cycle impact assessment and the interpretation of results. In this study, electricity production using rice straw as a feedstock was assessed based on the environmental performance, biomass energy utilization, and process energy efficiency. Megajoule (MJ) as a unit of energy was used as a functional unit, as it is the recommended unit for recording bioenergy production systems as it allows for the simple comparison of LCA results [16].
The LCA scope included a cradle-to-gate analysis of electricity production from rice straw. The material and energy flows were calculated on the following operations: production of rice straw with the burden allocated by mass, as a coproduct of milled-rice production based on the Philippine’s farming practices; land transport of rice straw; rice straw pre-processing operations, which include crushing and drying; rice straw gasification; tar cracking and gas cleaning; wastewater treatment; and electricity production in a pure producer gas-fed internal combustion engine. The manufacturing of materials used in each process, and the generation of electricity and diesel as a fuel source was also considered. Electricity was based on the Philippine power generation mix, composed mainly of coal power plants (which make up half of the power generation), while renewable energies (geothermal, hydroelectric, wind, and solar) and natural gas power plants make up the remaining portion of electricity generation [28].

2.2. Life Cycle Inventory

The LCI includes the calculation of the raw material input, energy acquisition, products, and emissions. The inventory data for the milled-rice production process is presented in Table 1 and Table 2 for material, fuel, and energy calculations, while Table 3 and Table 4 present the inventory data for rice straw pre-processing operations, the G/ICE process, and wastewater treatment operations. The material and energy flows were obtained from the literature, and calculated by performing material and energy balances, and using stoichiometric and thermodynamic models. The calculated amount of raw materials and energy input were entered in an OpenLCA v1.10.3 with Ecoinvent v3.7.1 database in order to compute the associated emissions during the manufacturing phase. Diesel was used as the main fuel source for transportation and for the machines used in farm and plant operations, while the electricity generation emissions were based on the Philippine power generation mix with the inventory available in the Ecoinvent v3.7.1 database [29]. Transportation emissions were calculated based on a truck with a capacity of about 7.5–16 t and adhering to EURO 4 emissions standards. All calculations were based on the annual production and consumption of 6,750,000 kg or rice straw to support the G/ICE plant capacity of 1500 kg/h biomass feed rate. The complete rice straw production and G/ICE plant operations for LCI are described in the following section.

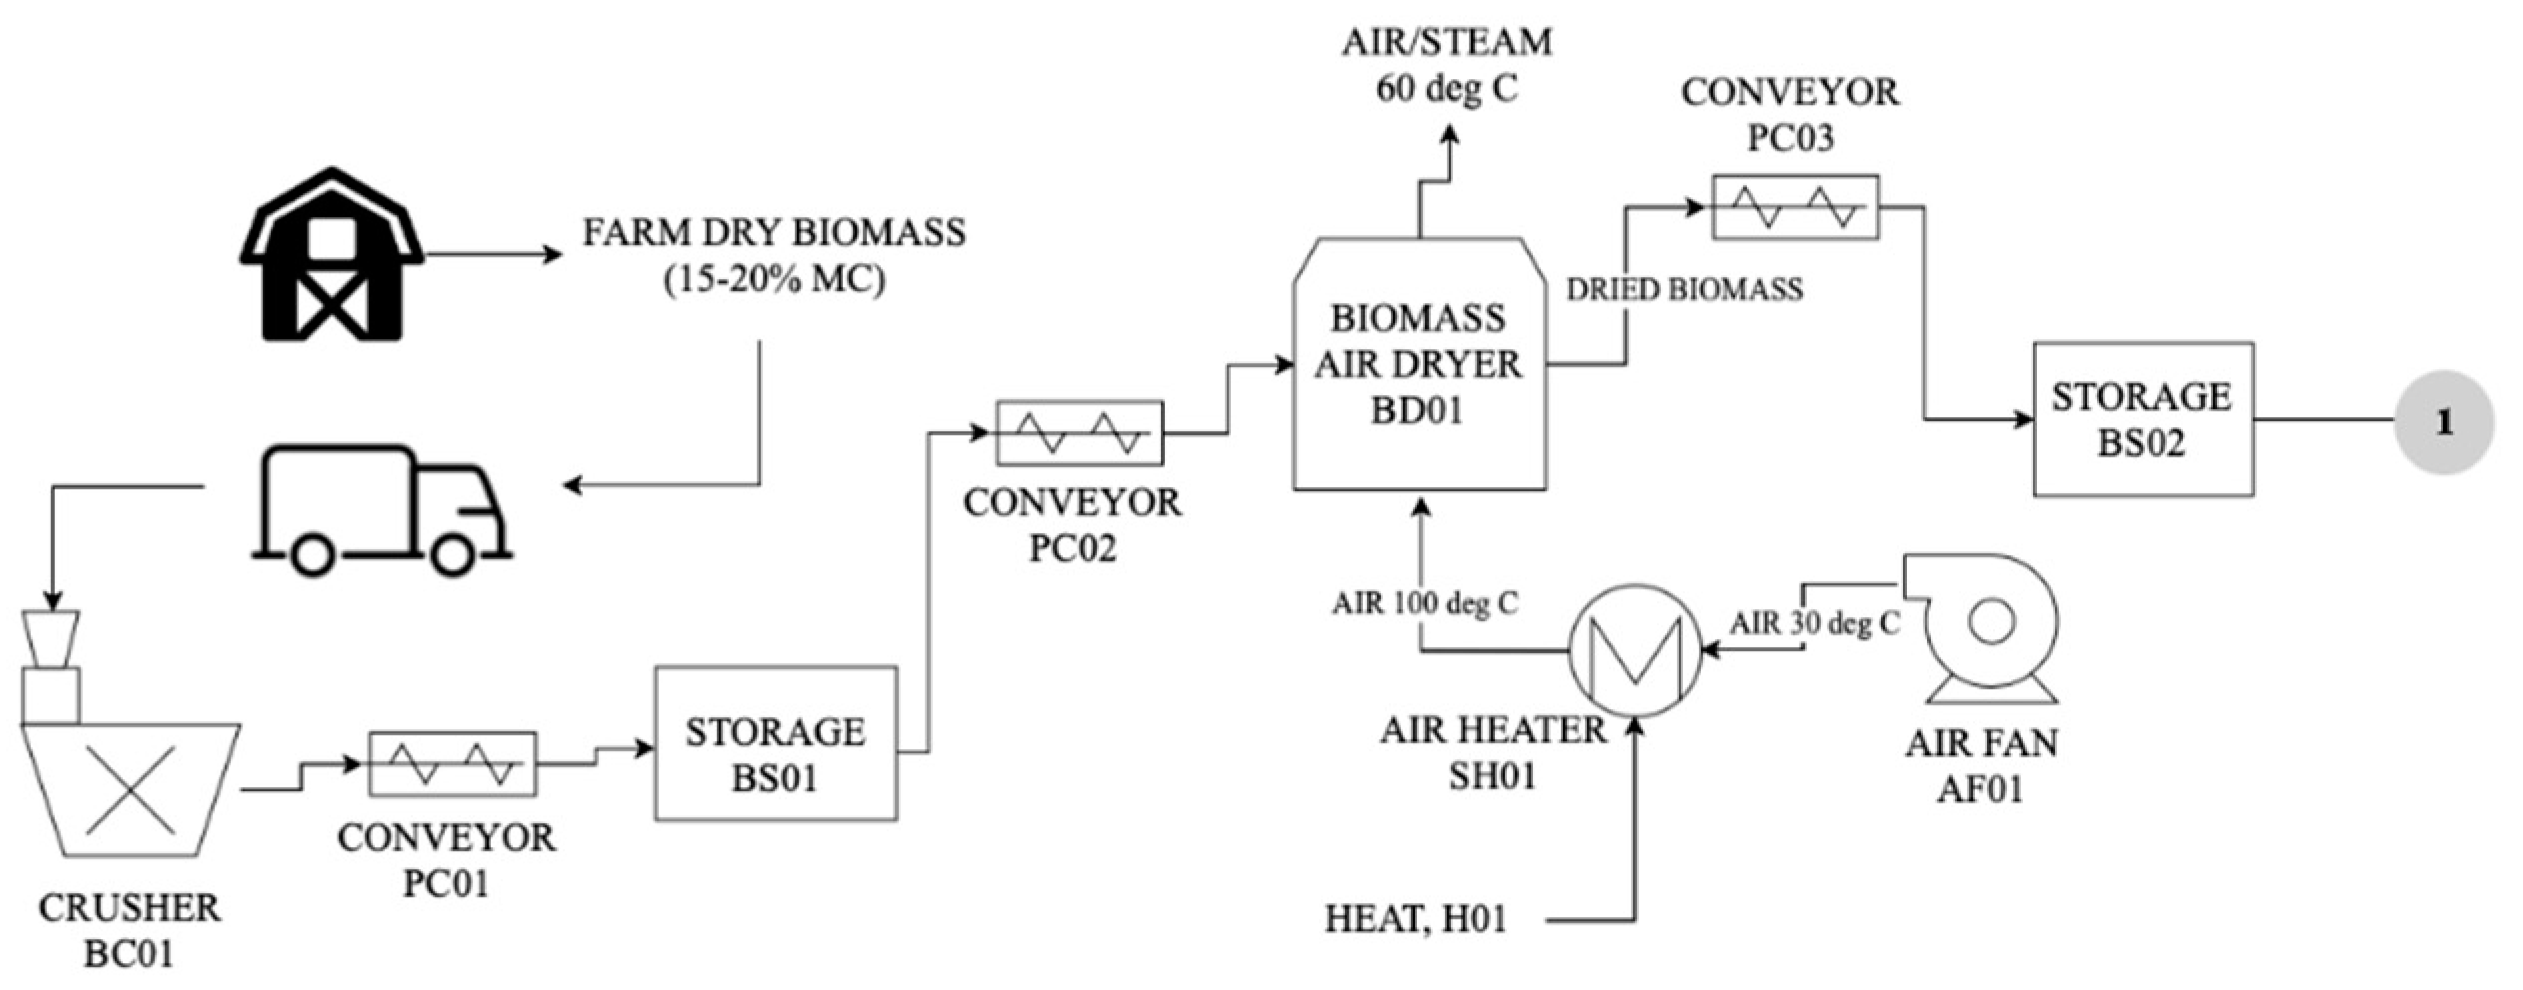
2.2.1. Rice Production in the Philippines

The Philippines has two seasons for rice production—the wet and dry season. Production is viable during dry season as around 70% of the total rice area is irrigated, while the remaining 30% is rainfed [30]. Common inputs in rice production in the country include fertilization, pesticide usage, and seeding, as shown in Table 1. Fertilization is a widespread practice in the country, with 95% of the total area planted for rice seeing fertilizer application throughout the period of 2017 to 2019. The four common types of inorganic fertilizer used are ammonium sulfate, ammonium phosphate, complete, and urea. Approximately five to six 50-kg-bags are used per ha [31]. Likewise, data from 2018 show that pesticide use is also prevalent, with around 90% of the total area planted seeing pesticide application. Common solid-form chemicals include insecticides and molluscicide, registering a usage of 0.36 kg/ha and 0.30 kg/ha, respectively. For liquids, herbicide was the major pesticide, followed by insecticide, with a volume of 1.29 L/ha and 0.97 L/ha, respectively. Lastly, the seeding rate depends on which planting method is applied. For direct seeding, the seeding rate increased from 112.81 to 120.62 kg/ha between 2017 and 2019, while for transplanting, less seeds are needed, ranging only from 62.12 kg/ha to 66.71 kg/ha for the same period [31].
The use of farm machinery is also widespread in the country, albeit not for every step of the production process. The most laborious operations are related to land preparation, including plowing, harrowing and seedbed preparation, and threshing, and are considered to be highly mechanized, with 79% and 93% respectively of paddy area/volume already mechanized. In contrast, crop establishment and crop care operations, including seedling preparation for transplanting, planting, fertilizer application, weeding, and spraying, are still done manually, with 0% of the land area mechanized. The drying and harvesting operation is lightly mechanized, with only 2% and 4% of the produced volume being mechanized [32]. Machine operation and its corresponding electricity and diesel energy use is shown in Table 2.
Post-harvest production includes harvesting, processing, and packaging. Harvesting consists of reaping, threshing, cleaning, and hauling. The majority of reaping is done through manual labor in the Philippines; however, some provinces are starting to use combined reapers. The bulk of rice paddy separated through threshing is mechanized, while cleaning and hauling are done manually or with the help of draft animals or tractors. After these operations, the wet rice paddy is produced. Drying, storage, milling and bagging are the next activities, prior to transport and consumption. Rice straw is left on the field after harvesting, and can be collected, burned, or left to decompose. Table 1 and Table 2 show the material and energy input for rice production in the Philippines, with the corresponding rice straw produced as a coproduct of the process. All calculations were performed based on the rate of 2.70 t/ha rice straw production, which is the minimum reported value [33] required to produce 6,750,000 kg dried rice straw.

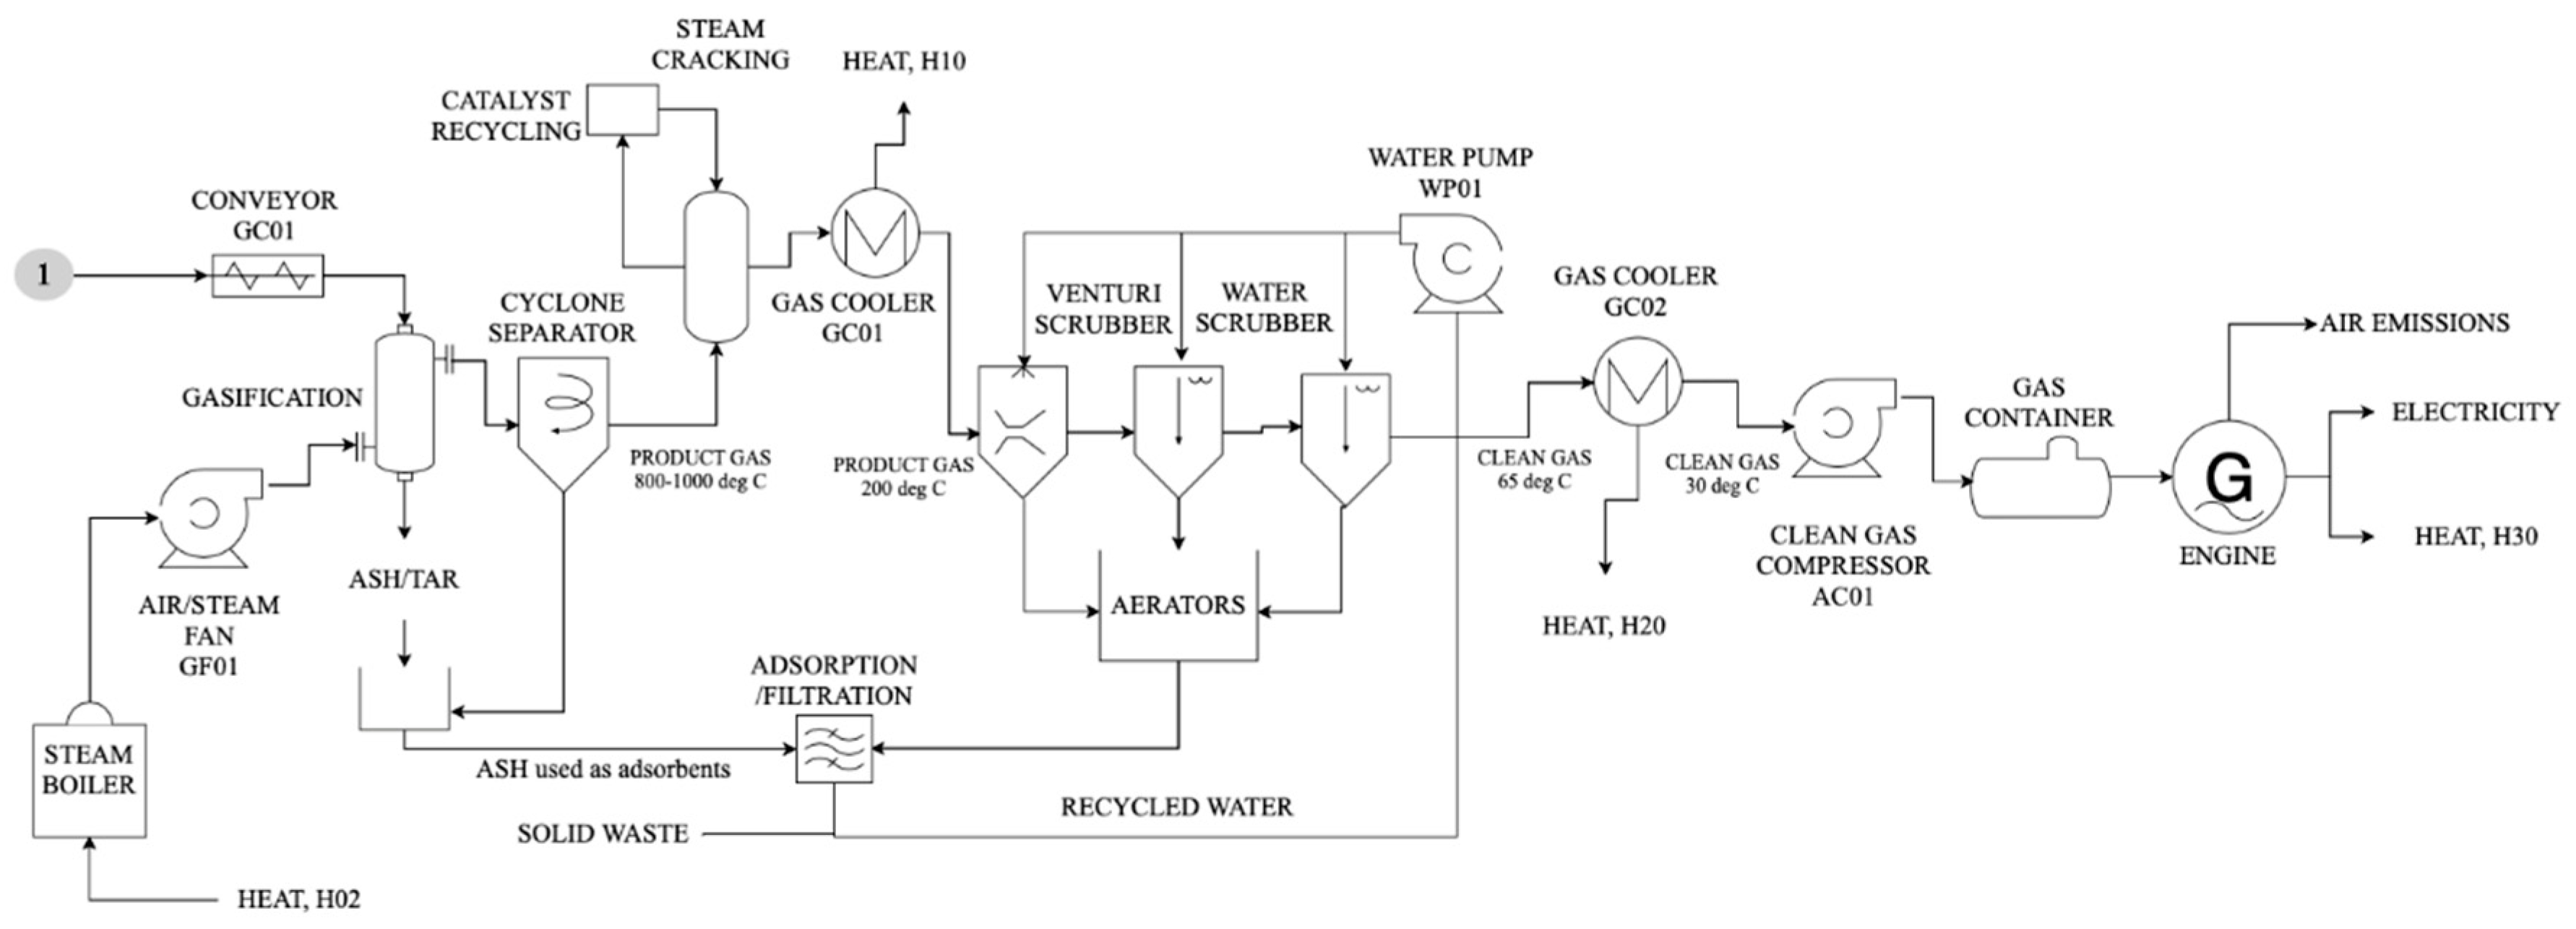
2.2.2. Rice Straw Gasification and Producer Gas Internal Combustion Engine

The material and energy flows for the G/ICE process were calculated based on the equipment capacity and specifications shown in Figure 1, with an annual plant capacity of 6,750,000 kg dried rice straw used for electricity production. At this stage, the materials and energy used in building and equipment construction, and other civil engineering works, were not accounted. G/ICE only includes operational data and assumes that the building and equipment to be used will be recycled from an existing plant with insignificant modifications performed.
Table 3 presents the operating parameters of the whole G/ICE plant, including the biomass pre-process and wastewater treatment facility. Acquired farm-dried rice straw is transported to the plant site and undergoes pre-processing operations to reduce its moisture content and particle size. Particle size is reduced to allow for easier material handling and to increase its bulk density. The final moisture content after drying and the ultimate analysis is presented in Table 3, which presents the properties of the feedstock that is used in the calculation of gasification products. The material and energy requirements were calculated based on the reduction of moisture content from 20% to 5.42%. The energy input and the equipment specifications for the rice straw crusher and for drying are shown in Table 4.
The feedstock is delivered to the downdraft gasifier using a conveyor at a rate of 1500 kg/h. The gasification parameters shown in Table 3 were used in a stoichiometric-thermodynamic equilibrium model developed by Rupesh et al. [38] to calculate the syngas composition based on the global gasification reaction shown in Equation (1), where α is the carbon conversion factor computed using Equation (2), as a function of the equivalence ratio (ER) and the gasification temperature (T).
C a H b O c N d + m H 2 O ( l ) + n O 2 O 2 + 3.76 n O 2 N 2 + s H 2 O ( s ) n H 2 H 2 + n C O C O + n C O 2 C O 2 + n C H 4 C H 4 + n N 2 N 2 + n H 2 O H 2 O ( g ) + n t a r C 6 H 6 + a ( 1 α ) C ,
α = 0.901 + 0.439 ( 1 e ( E R + 0.0003 T ) ) ,
In this model, rice straw is represented by C a H b O c N d , where a, b, c, and d refer to the number of atoms of elemental carbon (C), hydrogen (H), oxygen (O), and nitrogen (N) per mole of dry and ash-free biomass, obtained using the biomass ultimate analysis (wt.%, d.b.). The number of moles of biomass moisture content is represented by m, while s is the number of moles of steam supplied, based on the steam to biomass ratio (SBR). Tar is represented by benzene (C6H6) in order to simplify the calculations. Tar cracking by steam reforming products were computed using Equation (3) [39], with a process efficiency of 87.2%, while the catalysts used are recycled in the process [40].
C 6 H 6 + n H 2 O ( n + x 2 ) H 2 + n C O ,
The product gas leaves the gasifier at a temperature of 800–1000 °C, whereas it leaves the tar cracking at 700 °C. The product gas is then cooled to 200 °C before entering a series of venturi and water scrubbers, in which recycled water from the wastewater treatment facility is sprayed to precipitate water and produce a clean gas at a temperature of 60 °C. After the scrubber treatment, the impurities, including tar, are reduced to a level that is acceptable for the engine. The lower heating value (LHV) of the syngas and the clean gas, including the tar cracking products, is computed using Equation (4), based on the LHV of the producer gas components and multiplied by their respective composition in the producer gas.
L H V g a s = 10.79 Y H 2 + 12.26 Y C O + 35.81 Y C H 4
E L X = V g a s L H V g a s P e f f
The pure producer gas is cooled to an ambient temperature (30 °C) before being stored in a gas container. Producer gas is continuously fed into the internal combustion engine to generate electricity. The amount of electricity produced, in terms of energy (MJ), was calculated using Equation (5), using 22% as the power generation efficiency (Peff). Exhaust gas composition, mostly comprised of GHG emissions, was also computed and treated as a biogenic or source from biomass. The rest of the biogenic GHG emissions coming from the rice straw is released through the wastewater treatment facility after aeration, which was also accounted for in the calculation. The electricity used in the G/ICE process and the wastewater treatment facility is presented in Table 4.

2.3. Life Cycle Impact Assessment

Following the data on LCI, an impact assessment was performed in order to calculate the associated environmental implications of a product/process across the selected system boundary and impact categories [45]. LCIA aids in interpreting the results of LCA studies by grouping emissions and resource use based on their affected environment. Each emission or resource use is assigned a characterization factor—the impact measure per unit of the stressor—which would allow for calculating the total environmental impact score of each emission and resource use in a categorized group [46]. In this study, LCIA was performed using OpenLCA v.1.10 software, and the latest ReCiPe 2016 methodology, with characterization factors assessed at midpoint levels. Midpoint impact categories include climate change (GWP100), terrestrial acidification (TAP100), freshwater eutrophication (FEP), marine eutrophication (MEP), freshwater ecotoxicity (FEPinf), marine ecotoxicity (METPinf), terrestrial ecotoxicity (TETPinf), human toxicity (HTPinf), photochemical oxidant formation (POFP), and particulate matter formation (PMFP), assessed between the LCI and endpoint level [45]. Aside from climate change, several impact categories were selected in order to show the variation in contributions of all processes considered in the system boundary to the environmental impact of the whole system.

2.4. Energy Efficiency Calculation

The productivity and the energy performance of the system was also assessed. The biomass energy ratio (BER) in Equation (6) is the ratio of energy in the form of electricity (Eelx) produced by the system and the biomass energy density (Ebiomass), which is equal to the amount of dried rice straw used in generating the electricity multiplied by its reported LHV value in Table 3. The net energy ratio (NER) was computed using Equation (7) to understand the energy balance of the electricity production system. The NER is the ratio of the electricity produced and the total energy input in terms of electricity and fuel use. This does not account for the use, reuse, and production of heat around the system. In this case, heat is present in excess due to the high amount of heat that is generated during the biomass gasification process and combustion in gas engine. The NER also disregards the energy content of biomass converted to electricity and the energy that is lost to the environment during its generation or conversion.
B E R = E e l x E b i o m a s s = E e l x m b i o m a s s L H V b i o m a s s ,
N E R = E e l x E i n p u t ,

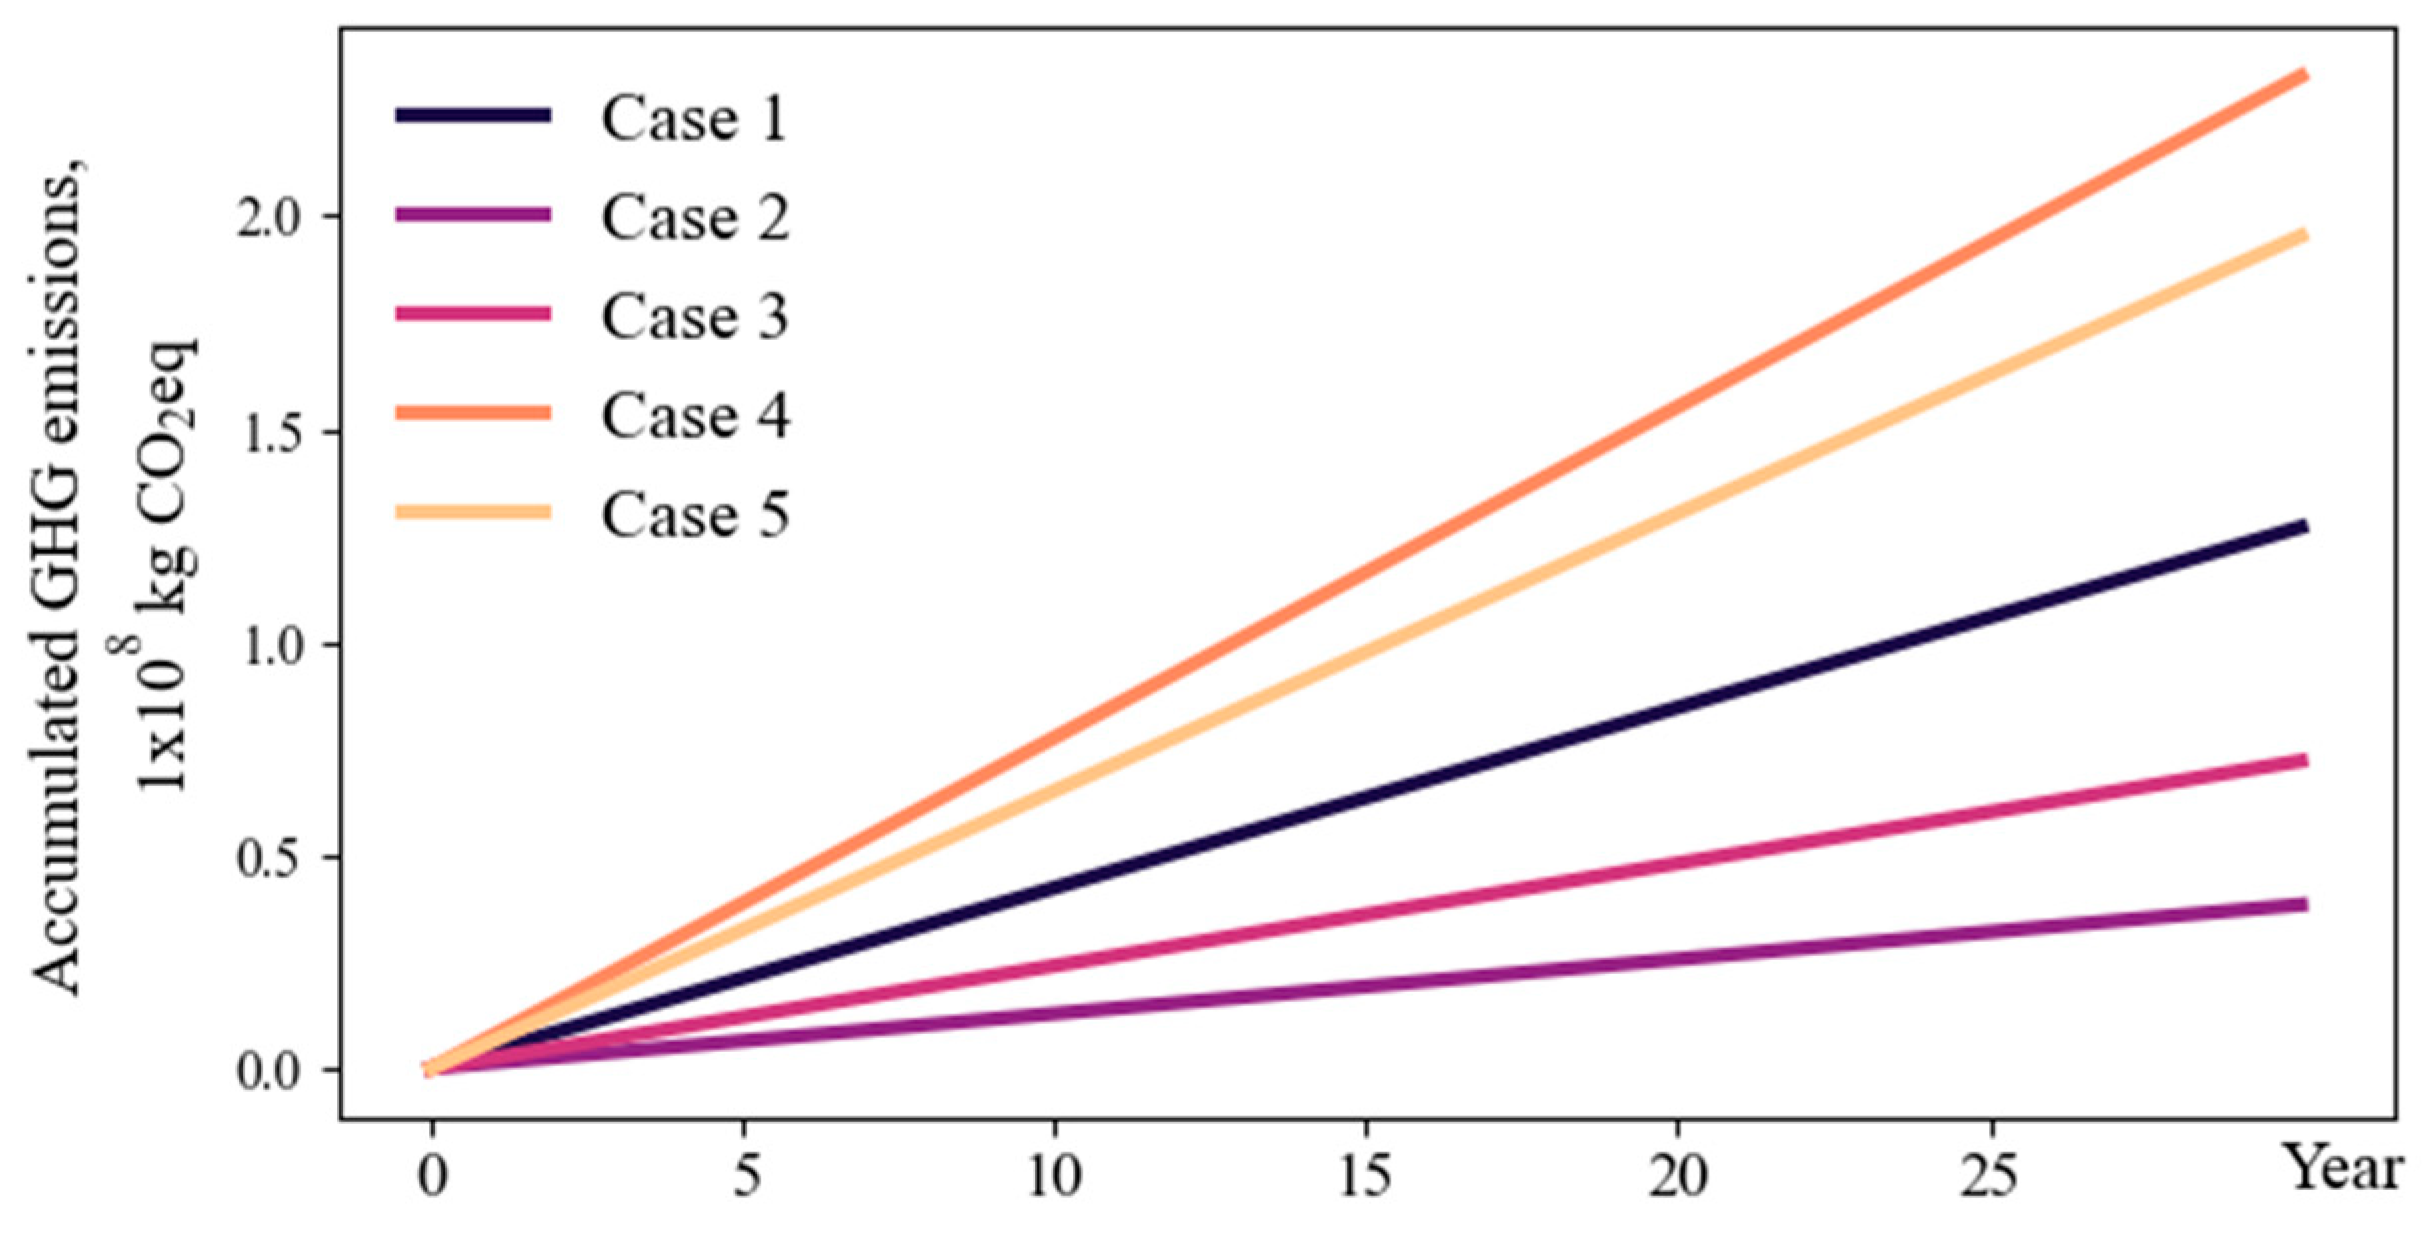
2.5. Climate Change and System Dynamics

System dynamics (SD) were used to model the GHG emissions of the proposed system following the LCA methodology. GHG emissions of the considered system boundary and annual plant capacity of 6,750,000 rice straw are obtained from the results of the LCIA, measured as a carbon dioxide equivalent (CO2-eq). Aside from CO2, GHG includes CH4, nitrous oxide (N2O), and chlorofluorocarbons (CFC), which have significantly higher global warming potential than that of CO2. SD is performed on GHG since it is the main contributor to climate change and increases in the temperature of the atmosphere and oceans, resulting in high-level environmental impacts. GHG is also the only climate forcing agent calculated in all the LCIA methodologies which is presented as the global warming potential (GWP) first developed by the Intergovernmental Panel on Climate Change (IPCC) [47].
The computed GWP100 using the ReCiPe methodology was used to represent the total GHG emissions for the proposed system. GHG emissions in kg CO2-eq is the only “stock” considered in the SD model (Supplementary File S1), with four flows contributing to its generation and consumption. The first flow, rice production, generates GHG from the production and use of chemicals such as fertilizers, pesticides, and other chemicals as listed in Table 1. Aside from that, GHG are also produced during electricity generation and usage required to perform farming activities. The operation of agricultural machinery produced GHG from the production and combustion of diesel. Biogenic CH4 from flooded rice fields are also accounted for in the LCA study. Based on the Ecoinvent 3.7.1 database, CH4 generation has a value of 0.04 kg CH4/kg milled rice for a non-basmati rice variety, with a range of 0.01–0.06 kg CH4/kg milled rice for various rice varieties, farming practices, and locations [29]. Land occupation in terms of ha dictates the rate of rice production and GHG emission on the SD model. The land area considered corresponds to the requirement for a 1500 kg/h G/ICE plant operation, based on the minimum rice straw production of 2.7 t/ha.
The CO2 uptake during plant growth served as the second flow and the only process that consumes GHG from the stock. The amount of CO2 sequestered during plant growth used in the calculation is equal to 1.42 kg CO2/kg milled rice, while the Ecoinvent 3.7.1 database shows a range of 1.32–1.46 kg CO2/kg milled rice depending on the rice variety [29].
The total GHG allocated for rice straw production is computed using Equation (8), which is multiplied to the total GHG generation by rice farming and consumption by carbon sequestration. The amount of CO2 sequestered by rice straw is computed using the allocation multiplier. The allocation multiplier by mass does not consider the production of other possible by-products, such as rice husk.
a l l o c a t i o n   m u l t i p l i e r = w e i g h t   o f   r i c e   s t r a w / h a w e i g h t   o f   r i c e   s t r a w / h a + w e i g h t   o f   m i l l e d   r i c e / h a ,
The third flow is the transportation of biomass to the G/ICE plant site at a 2-way distance of 40 m. The variables included in this flow were transportation distance and rice straw weight. The last flow considered was the biomass gasification process that corresponds to the whole G/ICE system. The main contributor of GHG emissions in this process is biogenic in nature since it comes directly from rice straw combustion. Aside from that, other sources include the generation and use of electricity and water for G/ICE plant operations.
The graph of GHG accumulation in the environment over a 30-year period was generated using the SD model and calculated using Insight Maker [48], a free online tool for System Dynamics, Agent-based Modelling, and imperative programming. The equation governing the SD model generated by the software is included as a Supplementary file (1). The LCA result of the proposed G/ICE system was compared with the GHG emissions of using coal for electricity generation, the Philippines power generation mix from Ecoinvent database, and with burning of rice straw in the field as a common practice in the Philippines [49]. The following cases presented were listed below for the 30-year GHG emissions:
  • Case 1—Electricity from the proposed G/ICE system (default)
  • Case 2—Electricity from Philippine power generation mix
  • Case 3—Electricity from 100% coal power plant
  • Case 4—Burning of rice straw (excluding rice production emissions)
  • Case 5—Rice production with rice straw burnt on-site

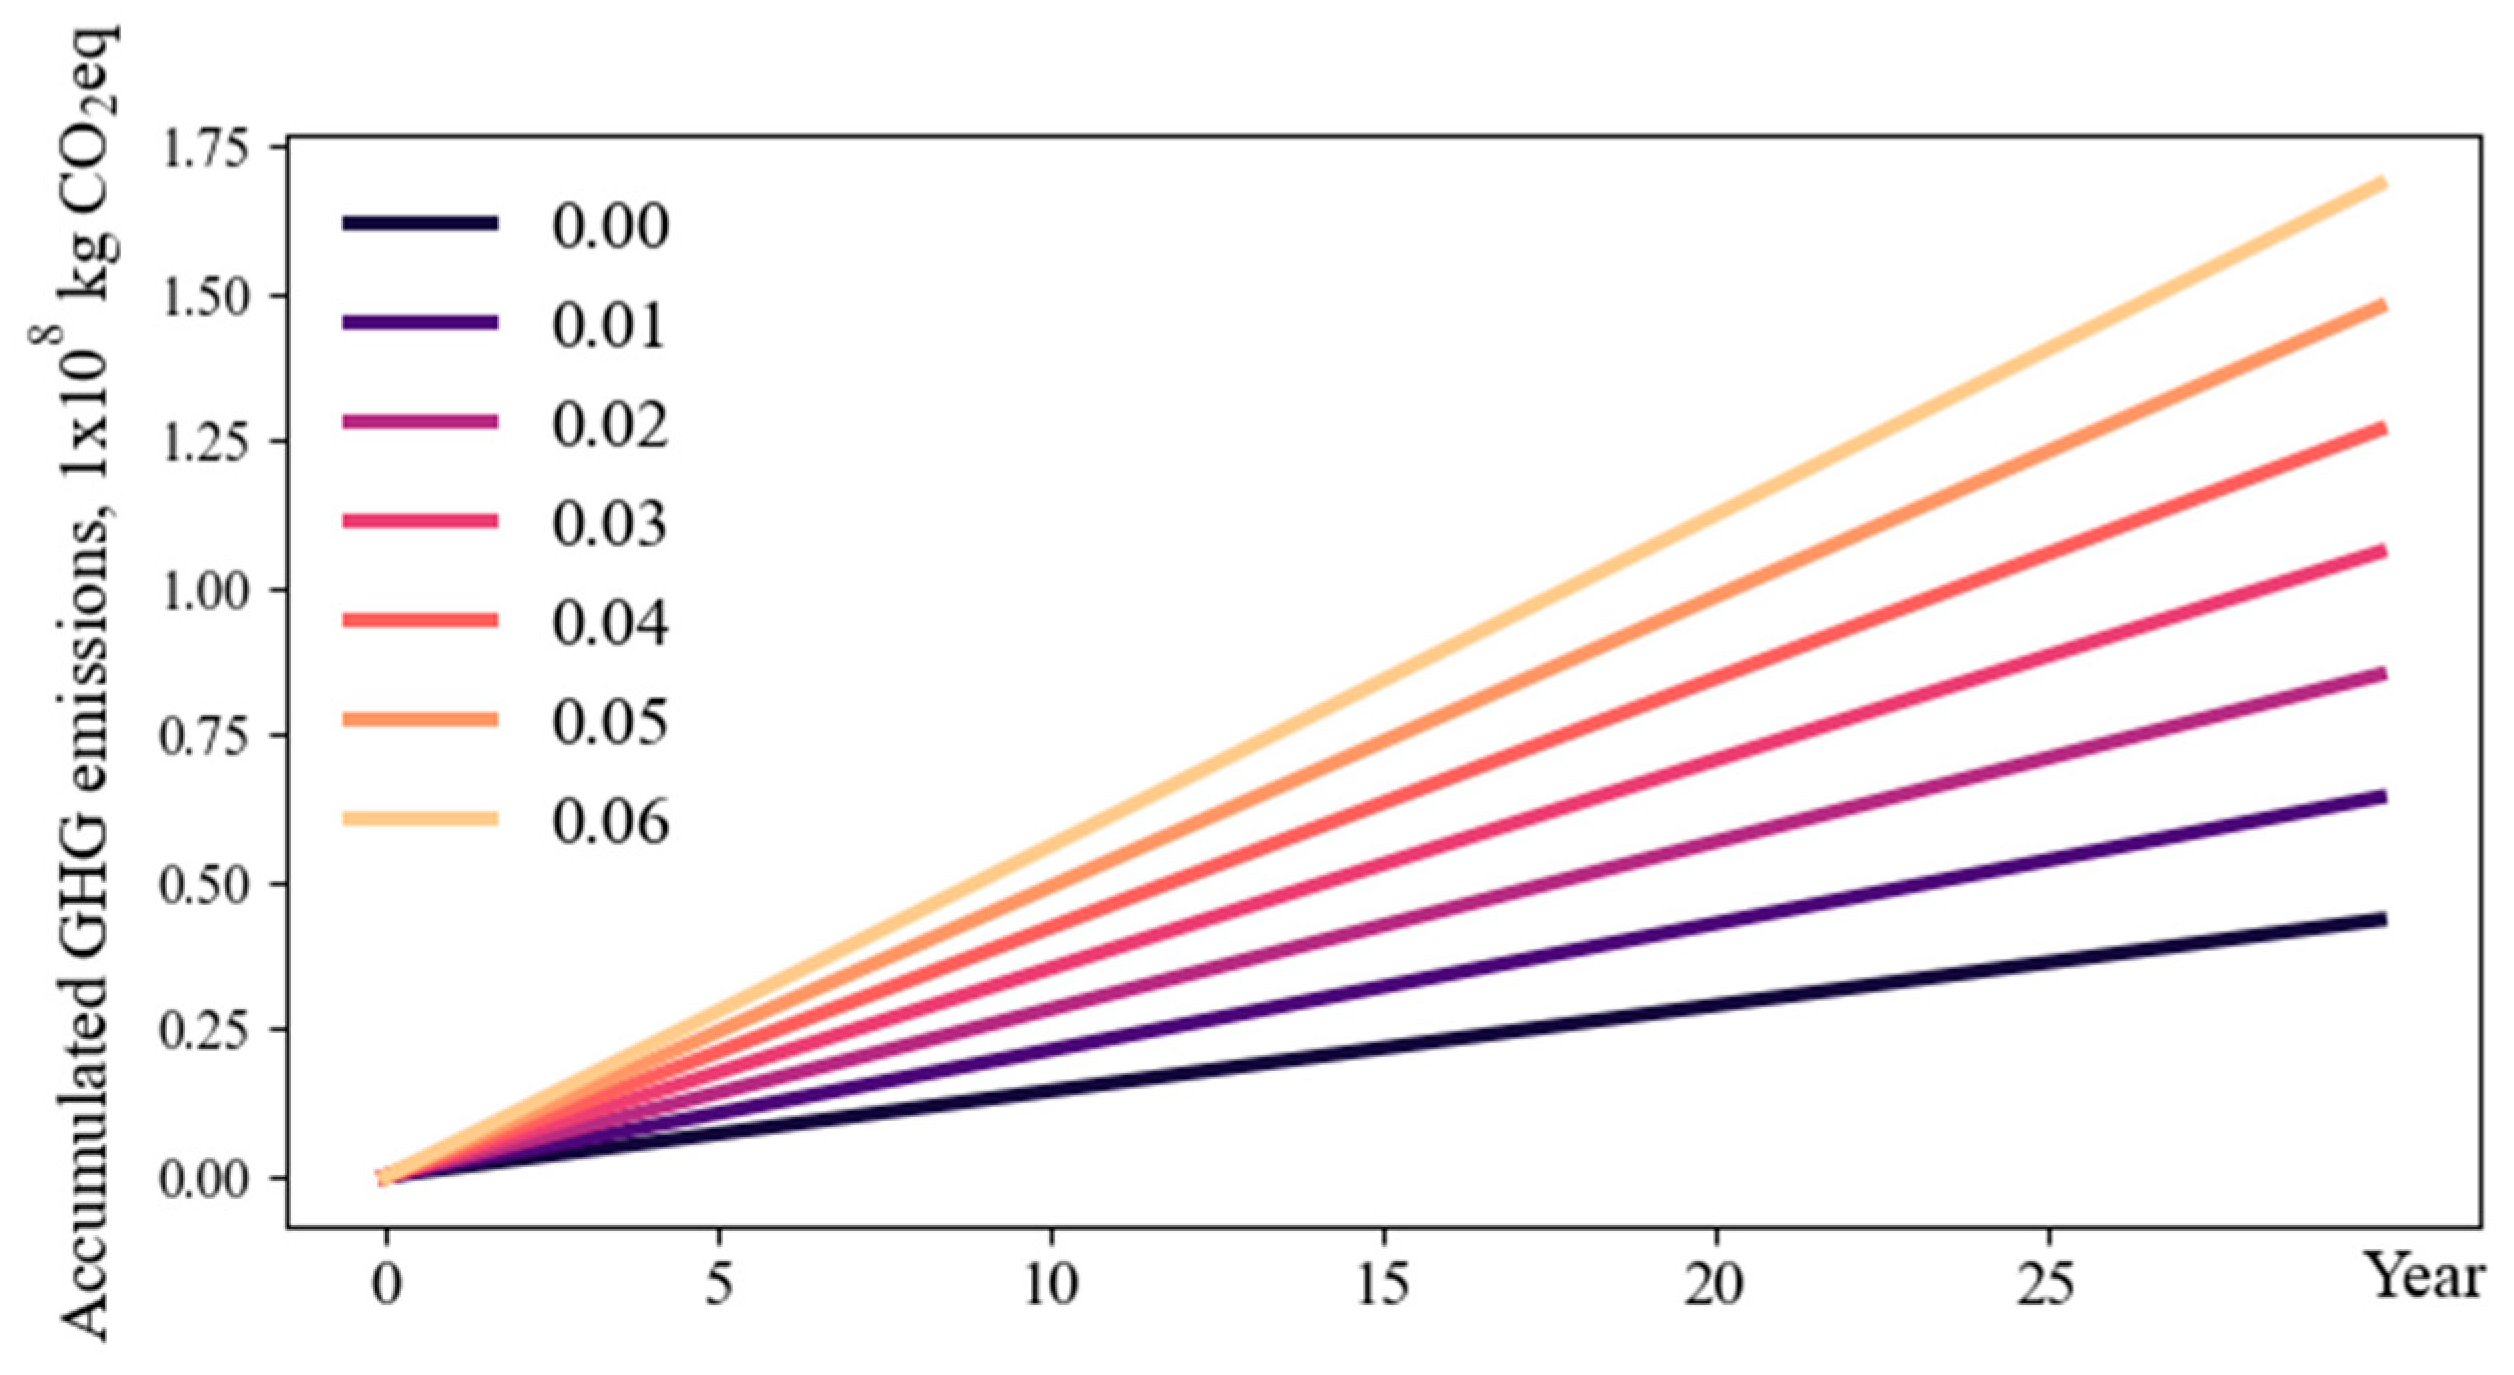
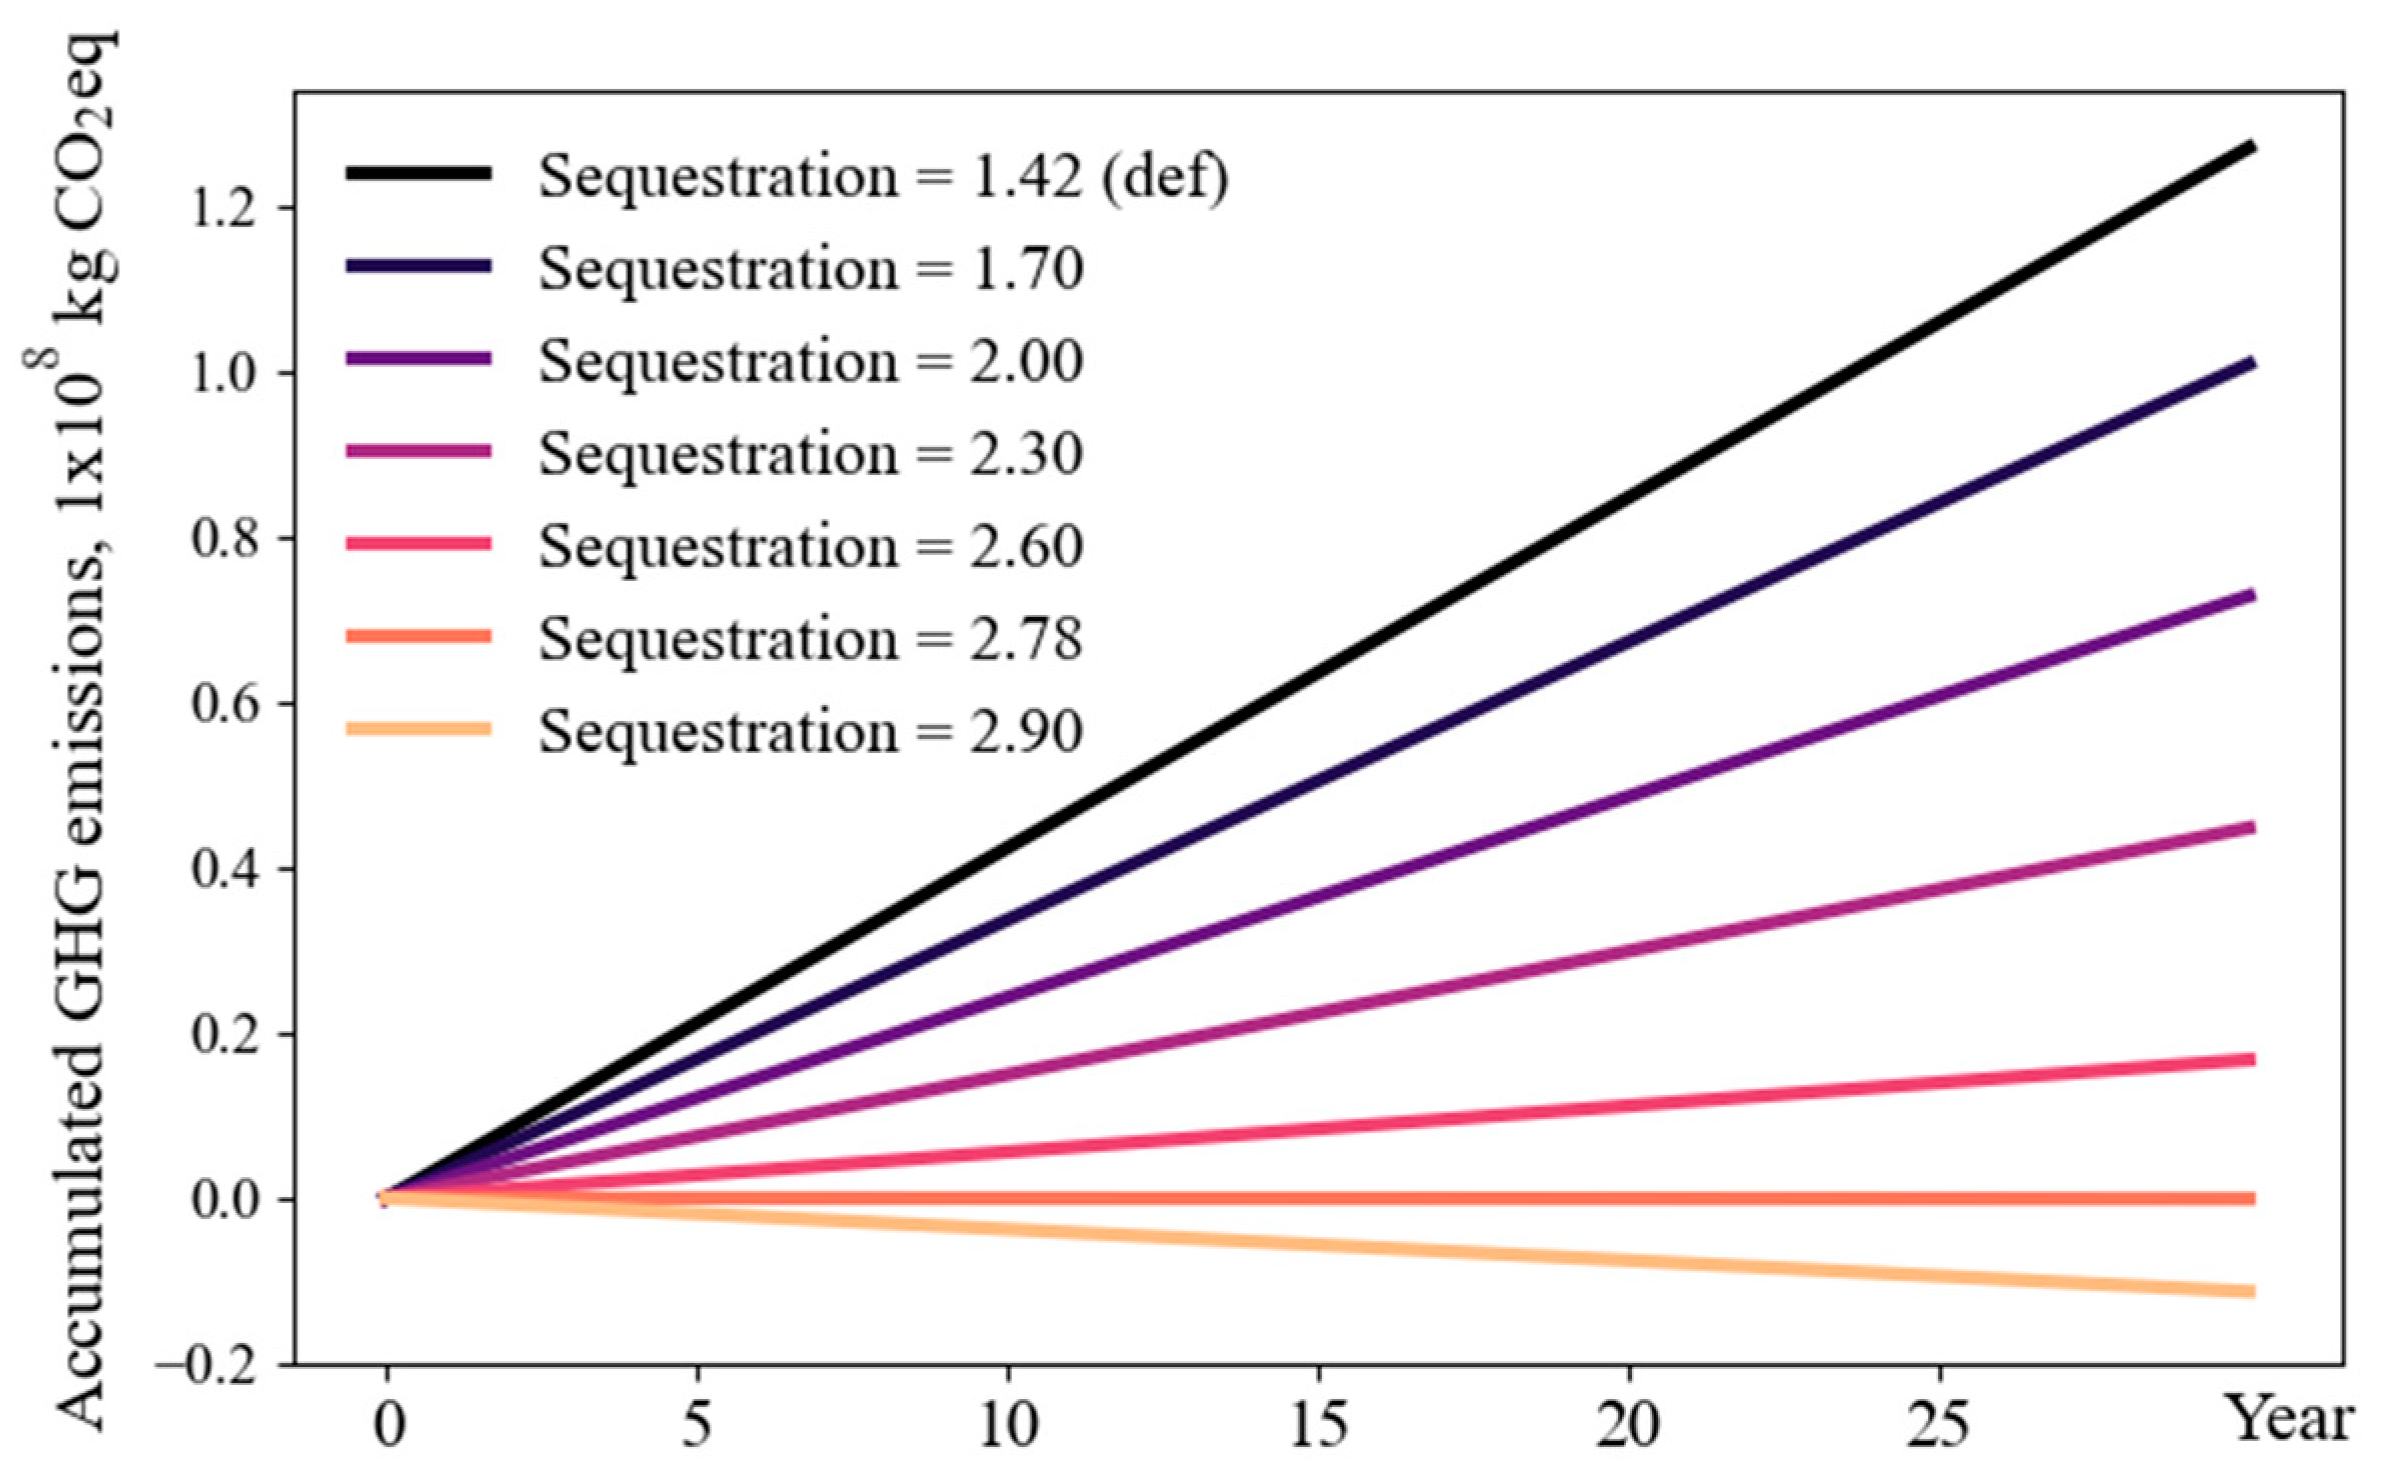
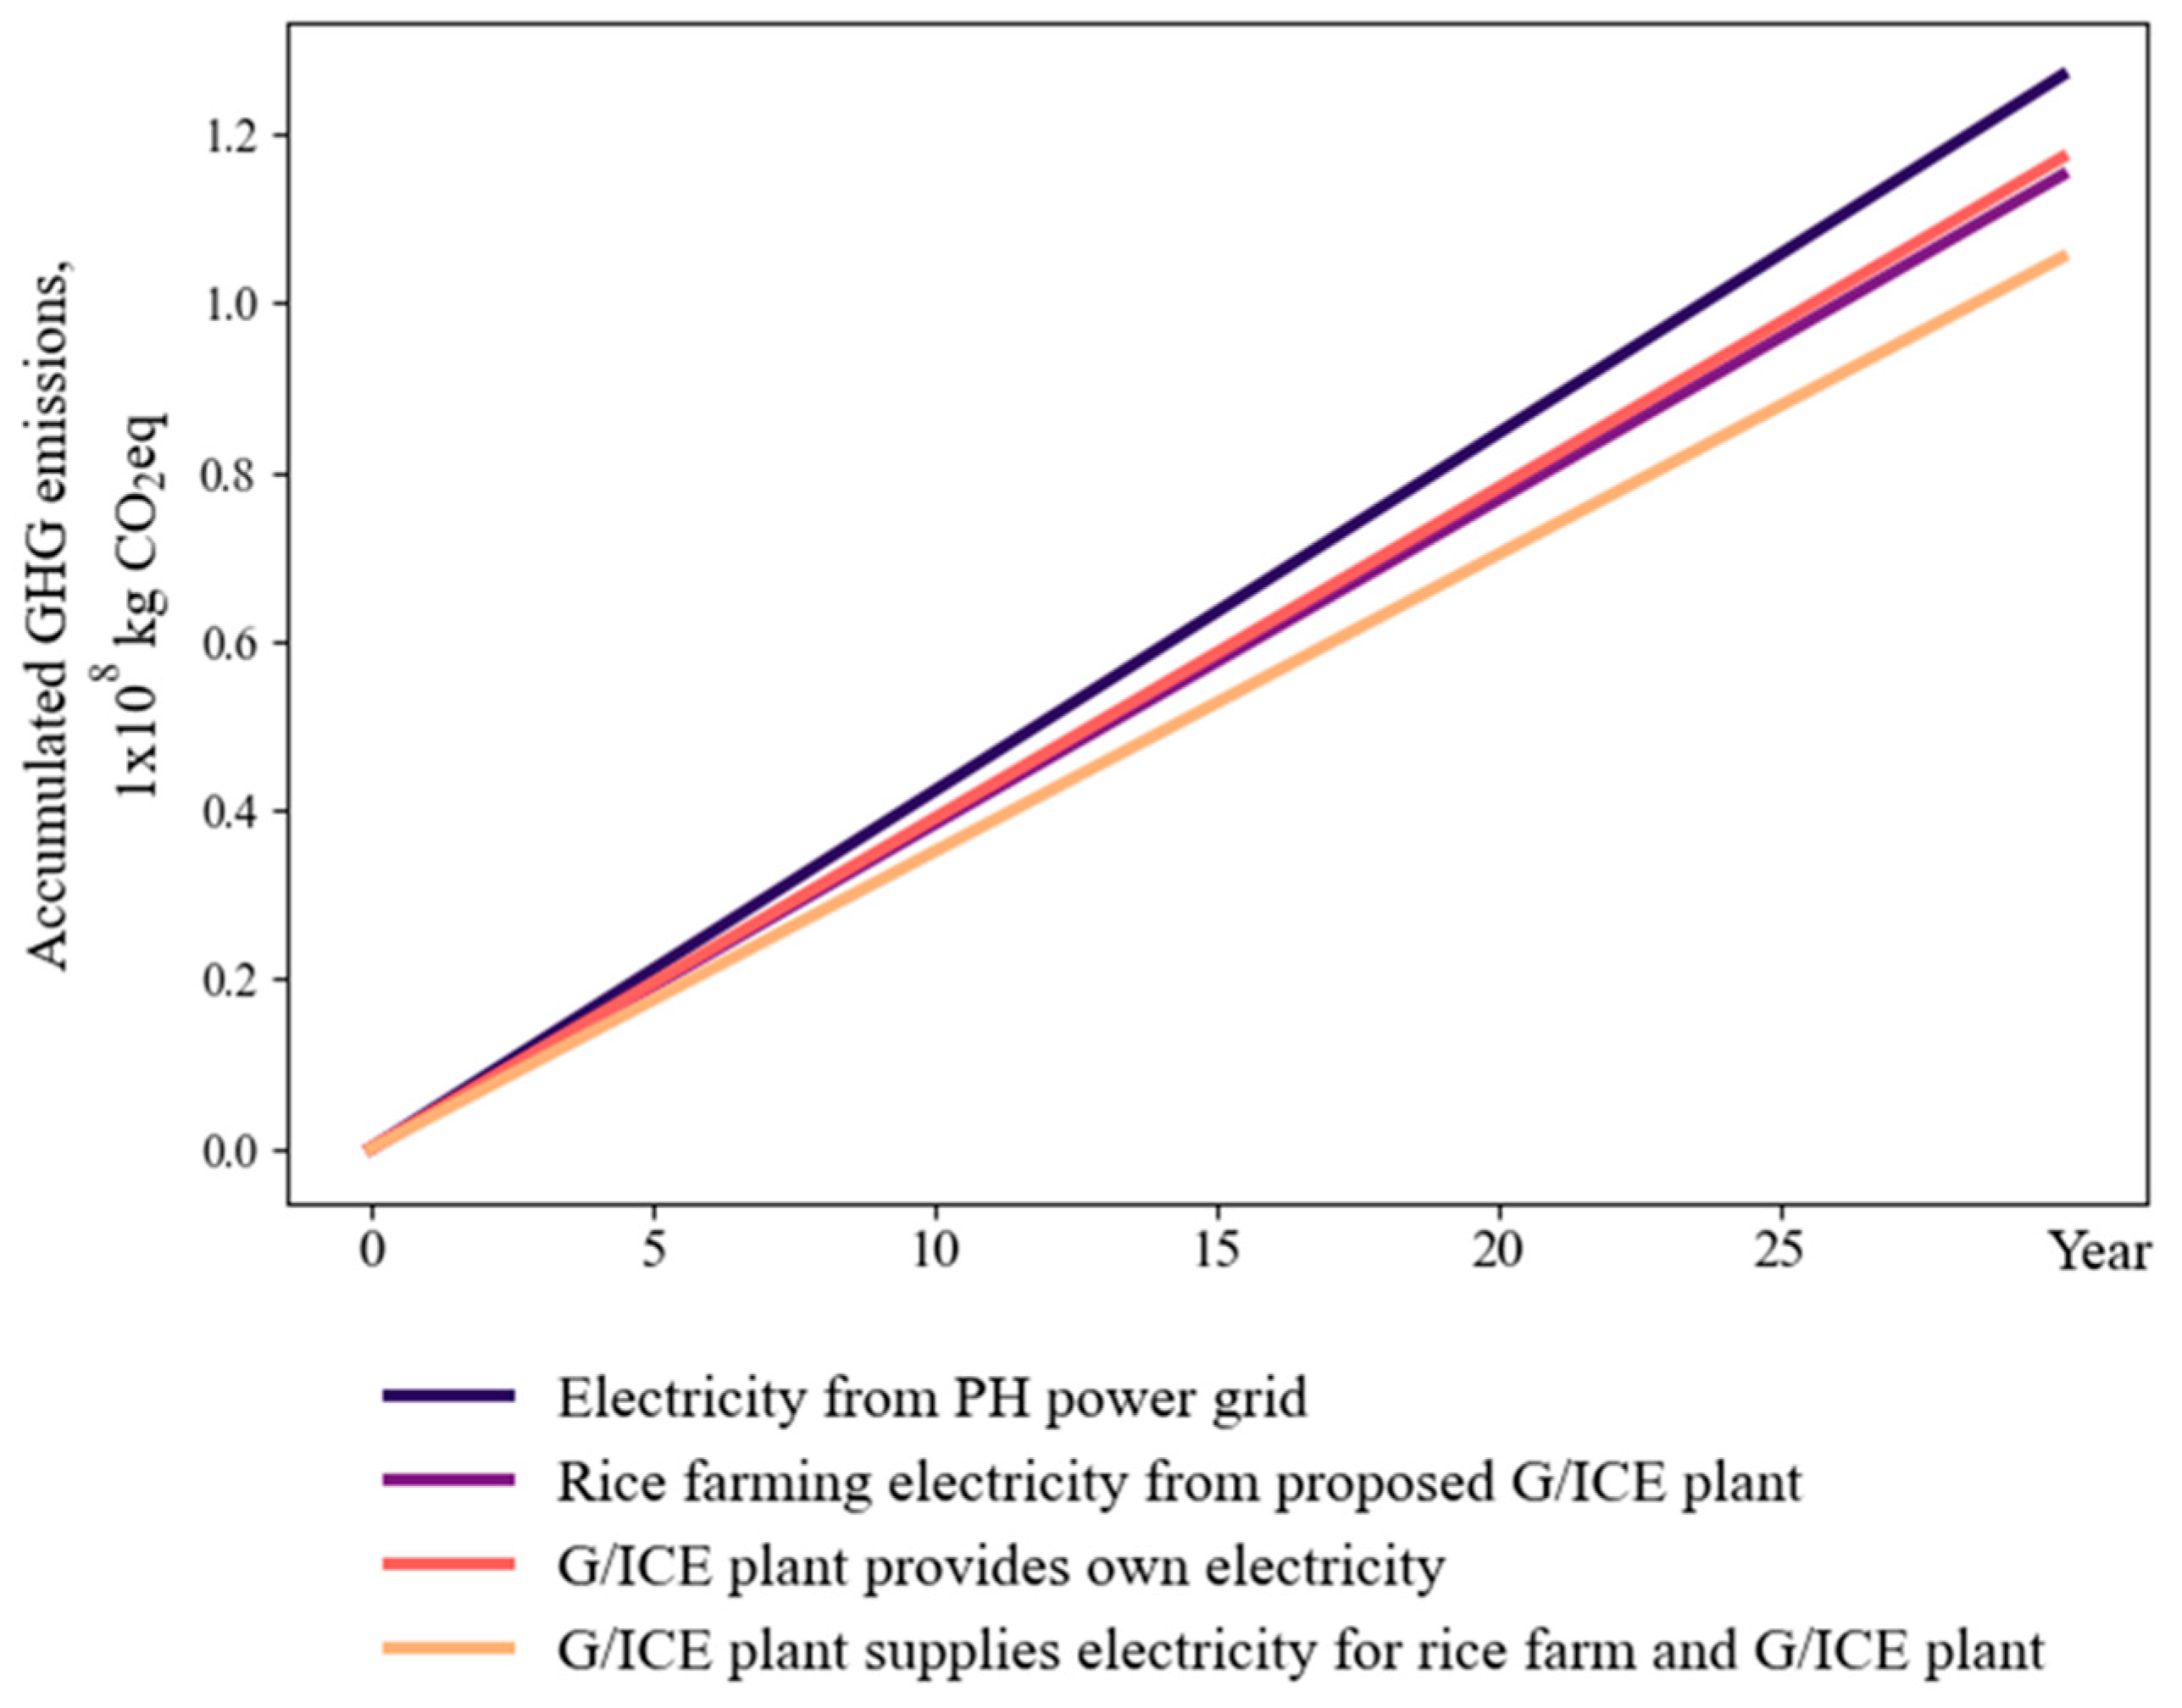
2.6. Sensitivity Analysis

A sensitivity analysis was conducted to determine the impact of important parameters and processes and to compute its influence on the LCIA results. In this process, the original or default values of key parameters were varied and the corresponding changes in GHG emissions and energy efficiency were calculated. Among the parameters varied in this study were:
  • Biogenic CH4 emissions to determine the possible impact of farming mitigation procedures;
  • CO2 sequestration by the rice plant to determine the rate of carbon uptake necessary to produce a negative net GHG emissions;
  • Use of generated electricity from rice straw for rice farming and G/ICE plant operations, thus removing GHG emissions from fossil fuels; and
  • Efficiency of the internal combustion engine.

3. Results and Discussion

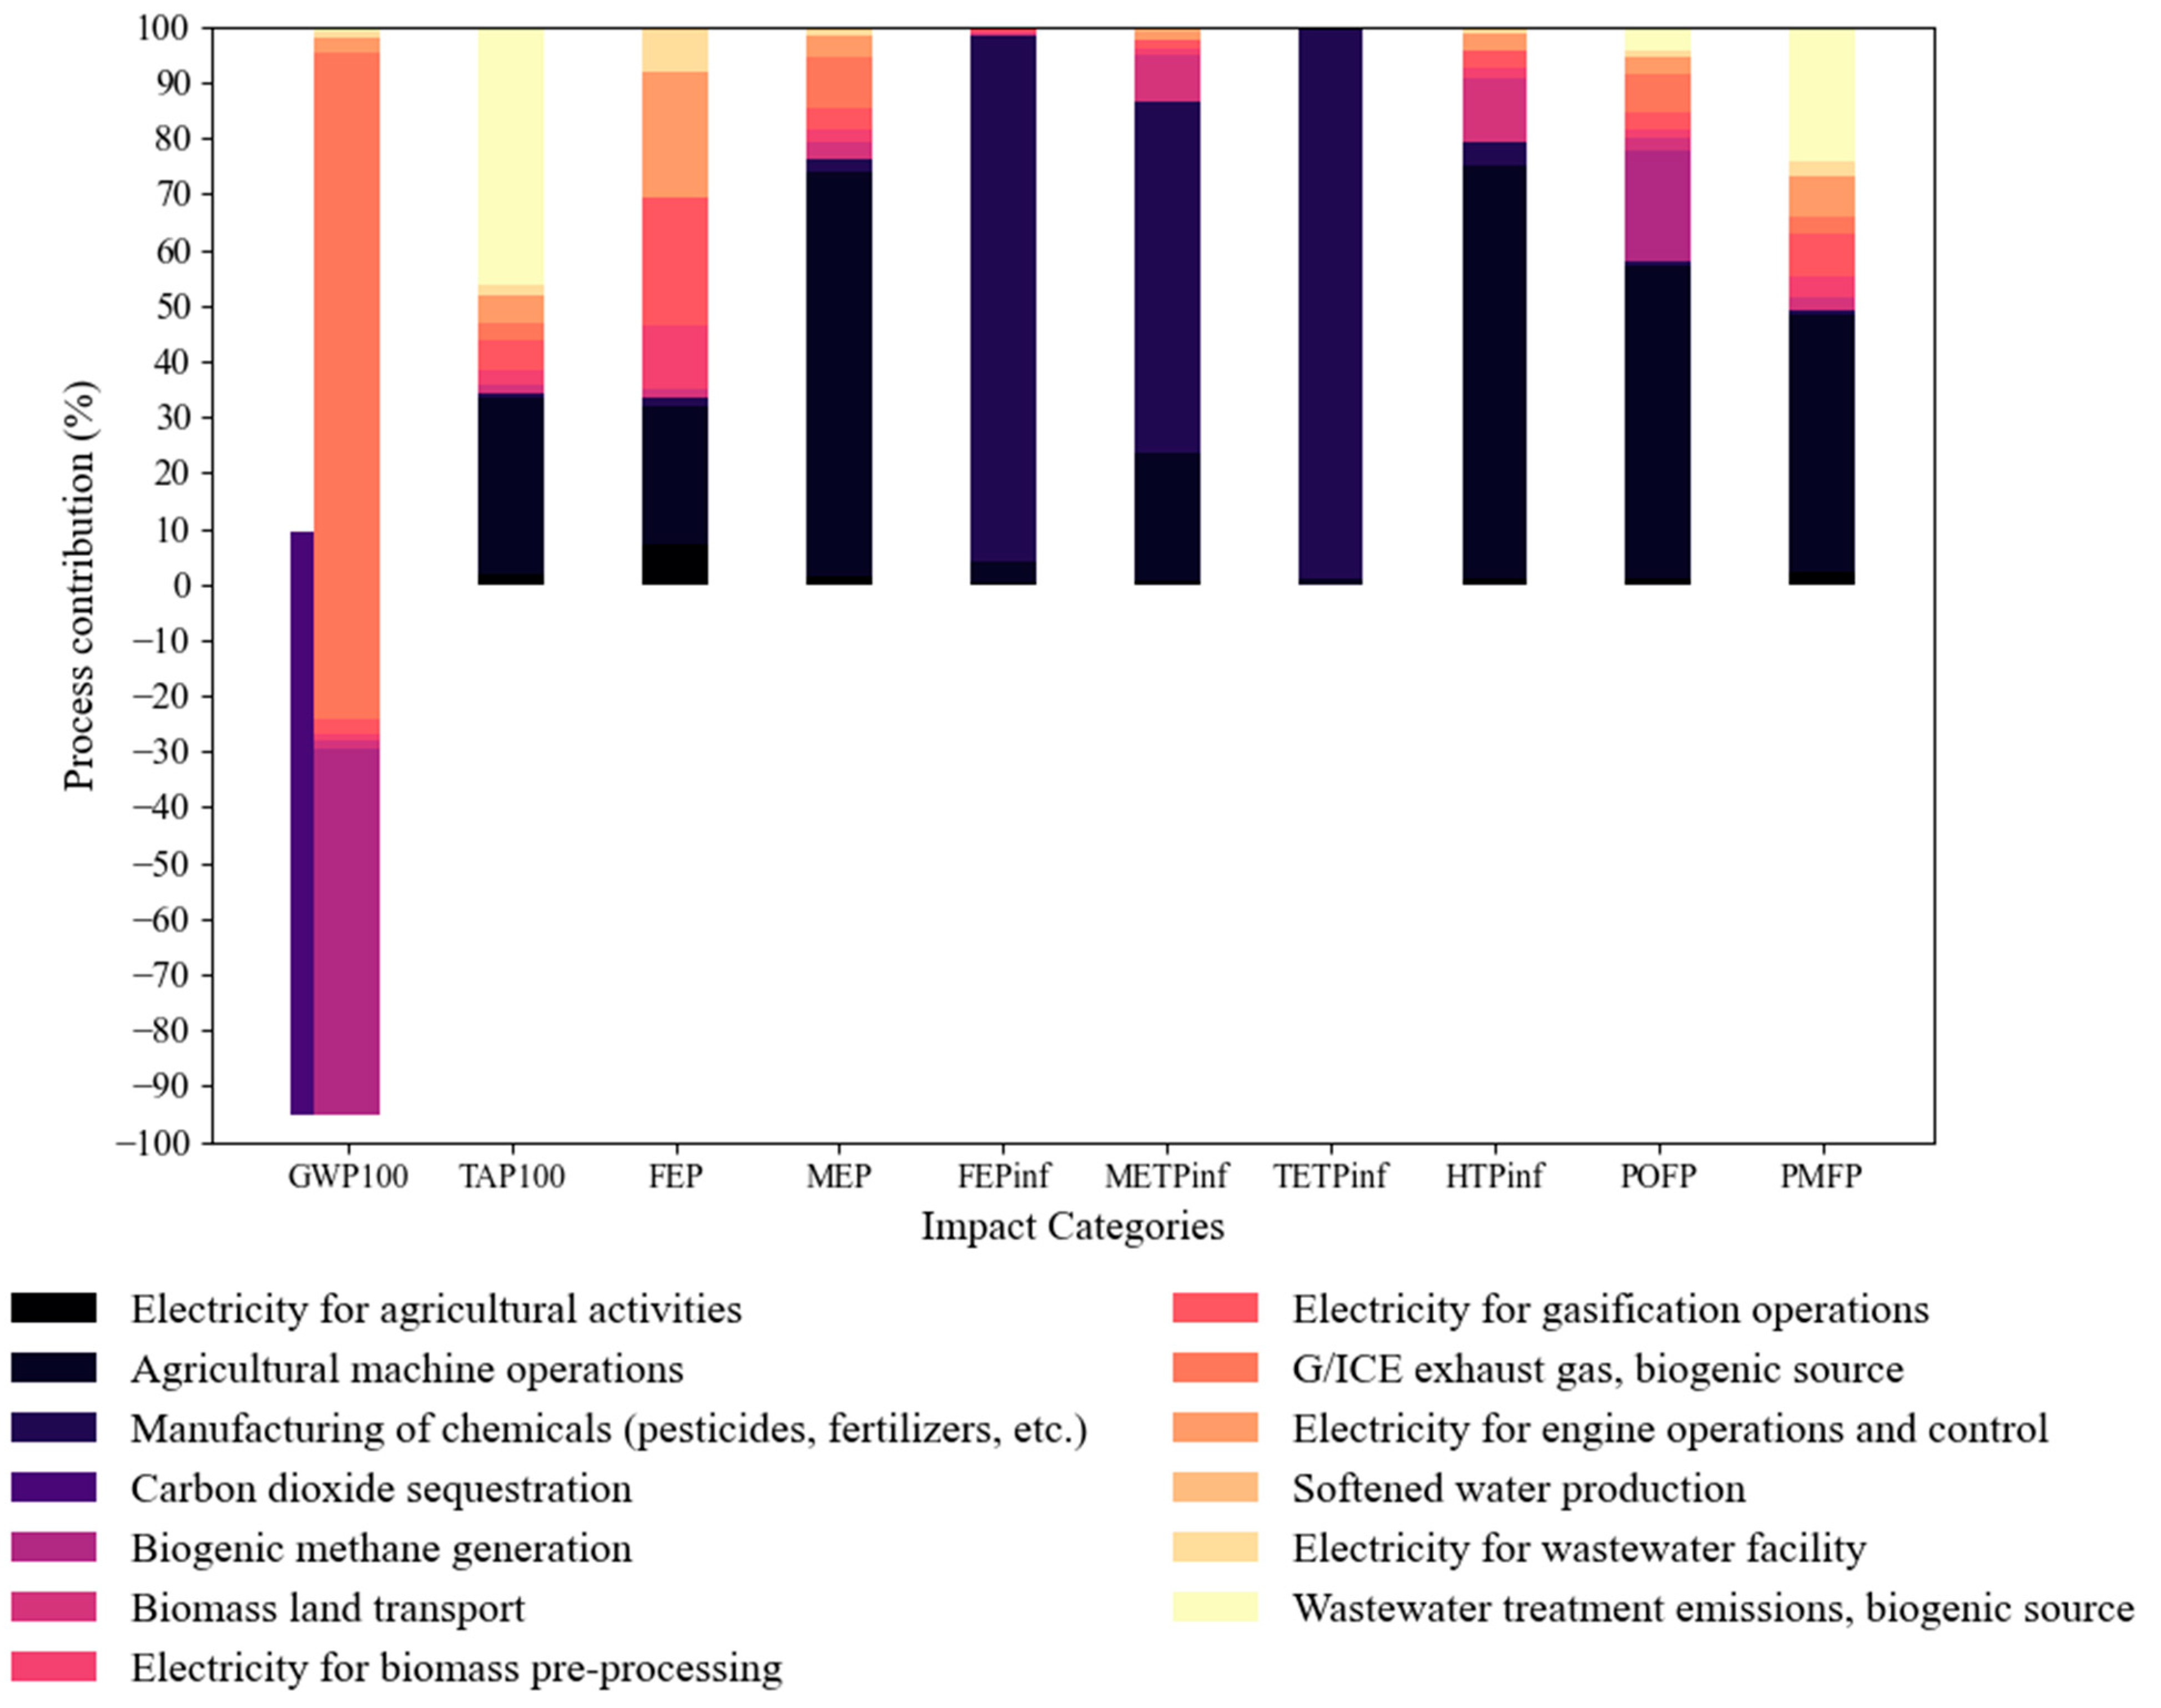
3.1. LCIA Results and Contributions of Each Processes

Table 5 presents the result of the LCIA performed on the system boundary, which includes the following processes: rice farming practices in the Philippines, with a burden allocated by mass to rice straw as a coproduct of milled rice; transportation of rice straw; pre-processing operations; G/ICE plant operations; and wastewater treatment facility. The contributions to the environmental impact of each process and operations within the system boundary is shown in Figure 2.
Climate change, represented by the GWP100, has a value of 0.642 kg CO2-eq/MJ electricity for the whole system with a productivity of 334 kWh/t rice straw. In a cradle-to-gate LCA study on power generation using rice straw combustion, the reported GWP100 is 0.036 kg CO2-eq/MJ with power generation of 518 kWh/t rice straw [20]. Meanwhile, in a LCA study conducted in Malaysia which used a similar rice straw combustion technology, the GWP100 was 0.235 kg CO2-eq/MJ [21]. In a study conducted by Chen et al. [50], the reported GWP100 was equal to 0.292, 0.023, 0.769, 0.220 and 0.891 kg CO2-eq/MJ electricity produced from direct combustion, gasification, mixed combustion-gasification, biogas, and coal-fired. The main difference between the obtained results and the other studies is caused, notably, by the use of different technologies and the rice straw energy conversion efficiency. Using G/ICE and rice husk as feed, a study showed higher power generation of 526–588 kWh/t, while only 334 kWh/t rice straw is attained for this study. It should be noted that most of the total GWP100 value comes from the direct combustion of rice straw.
Figure 2 shows that biogenic CH4 emissions from flooded rice fields (65.66%) and biogenic emissions directly from rice straw combustion (120.4%) have the highest contribution to GWP100. Rice straw leaves the farm gate with a negative GWP100 due to CO2 uptake during its cultivation stage, accounting for 104.4% of the total GWP100 emissions. However, this is mostly offset by the biogenic CH4 emissions caused by anaerobic processes occurring in flooded rice fields. Although biogenic in nature, the occurrence of CH4 emissions in this case is unnatural and is assisted by human activities, for human benefits. Without the biogenic CH4 emissions, a net-zero over-all GWP100 of the system can be easily realized.
Terrestrial acidification (TAP100) is caused by the deposition of acidifying pollutants, usually oxides of sulfur and nitrogen, to soil, ground water, and surface waters [51]. In the considered system, these pollutants are released during the combustion of diesel in agricultural machines, contributing to 32.05% of the total TAP100, while nitrous oxides and sulfur oxides from the biomass are stripped from the syngas and released during water treatment, contributing to 46.12% of the total emissions. Eutrophication includes the release of nitrogen and phosphorus to bodies of water, leading to nutrient enrichment either in freshwater (FEP) or marine systems (MEP). The treatment of spoils from hard coal mining releases a large amount of phosphorus into the ecosystem, and thus diesel and electricity production from coal plants have the highest contribution to FEP. Diesel burnt in agricultural machines has the highest impact on MEP (about 72.73%), due to the release of nitrogen as oxides together with the exhaust gas. The production and application of chemicals, such as various types of pesticides, and inorganic and organic fertilizers, have the highest contribution to freshwater (FETPinf), marine (METPinf), and terrestrial (TETPinf) ecotoxicity, with values of 94.54%, 63.07%, and 98.82%, respectively. Pesticides are toxic chemicals that directly affect insects, fungi, other herbs/plants, rodents, nematodes, mollusks, and many other types of pests, hampering rice growth. Ideally, pesticides are lethal to the target organisms, while being non-lethal to other exposed species, such as humans. However, pesticides can also be toxic to consumers of those target organisms, such as birds, fish and other animals that prey on affected pests. Despite their harmful effects, including to human health, pesticides have largely increased crop productivity [52]. For human toxicity (HTPinf), diesel combustion in agricultural machinery has the highest contribution (about 74.07%), followed by the land transport of biomass using diesel as fuel, which accounts for 11.41%. Exhaust gas from diesel engines may contain heavy metals, polycyclic aromatic hydrocarbons, and particulate matter that causes oxidative stress to humans [53,54]. Diesel combustion in agricultural machines also has the highest impact to photochemical oxidant formation (POFP) and particulate matter formation (PMFP), accounting for 56.45% and 46.13% of the total emissions, respectively. Since the transportation of biomass was limited to a short two-way distance of 40 km, the impact of land transport using diesel as fuel was low compared to the use of diesel fuel for agricultural machines, with a combustion efficiency of about 40%.
GHG emissions directly cause an increase in atmospheric and oceanic temperatures, leading to high-level environmental impacts, such as rises in sea levels, extreme meteorological events, and disruptions to weather patterns [47]. GHG emissions are the only elementary flows that are considered in all LCIA methodologies, which include CO2, CH4, N2O and halocarbons, with CO2 being the most abundant. The 30-year GHG accumulation in the environment caused by the proposed system is shown in Figure 3 as Case 1.
Based on GHG emissions and computed using system dynamics, Case 4 > Case 5 > Case 1 > Case 3 > Case 2. Case 4 accounts the GHG emissions from the open field burning of rice straw, while Case 5 accounts for the total GHG emission associated with rice straw production and disposal. Case 5 presents a lower GHG than Case 4, due to CO2 uptake during plant growth. Rice straw left in the field decomposes to produce biogenic methane emissions, which is 28 times more potent than CO2 [16]. In-field rice straw burning produces 0.7–4.51 g of methane and 0.019–0.069 g of nitrous oxide. In addition, rice straw burning produces PM2.5 and PM10 particulate matter and toxic gases that have adverse direct impacts on human health when inhaled [49]. The release of these pollutants can be avoided by using rice straw as G/ICE feedstock. The utilization of rice straw in G/ICE could reduce the GHG emissions by 27%, versus burning in the field.
Case 2 shows the GHG emissions produced using the Philippine power generation mix, while Case 3 shows coal-fired power generation for the same amount of electricity. Case 2 is composed partially of renewable energy sources, such as hydroelectric and geothermal energy, and thus has lower emissions than Case 3. However, Case 1, or the G/ICE process, has higher GHG emissions than coal-fired power plant. This GHG emission is mostly biogenic and associated with rice straw production, as discussed earlier. Mitigation measures can be employed to lower the GHG emissions of the G/ICE process.

3.2. Sensitivity Analysis and Mitigation Measures

Biogenic methane emissions occur mainly due to the anaerobic decomposition of rice straw and other crop residues in the wetland [49,55]. Mitigation procedures, such as rice paddies and crab-fish aquaculture integration, are reported to decrease methane production by 52% in China [56]. Figure 4 shows the effect of varying methane emissions on the results of the LCA study. The reported biogenic methane emissions in the Ecoinvent database are approximately 0.01–0.06 kg CH4/kg milled rice, an amount which is dependent on the region and rice variety. Decreasing the methane emissions by 0.01 kg CH4/kg rice would decrease the GHG emissions by 16%, while the total GHG emissions are approximately 0.224 kg CO2-eq/MJ electricity at zero biogenic emissions.
Figure 5 shows the change in GHG emissions achieved by increasing the CO2 sequestration rate. To achieve a zero net GHG emissions, CO2 should be absorbed at a rate of 2.78 kg/kg milled rice. Other mitigation procedures can be performed to achieve this, such as planting other crops or trees alongside the production of rice, or by using novel carbon capture technologies in the G/ICE plant.
Lastly, the use of electricity produced by the G/ICE system to support rice farming and plant activities, as shown in Figure 6, could further reduce the GHG emissions of the system, enabling a zero net carbon process, together with the other mitigation measures presented.

3.3. Biomass Energy Utilization and Production Efficiency

The proposed G/ICE system could generate about 6.5 TJ/y of electricity from 5.4 million tons of dried rice straw. Table 6 shows the BER, or the efficiency, of rice straw energy conversion to electricity. At 33% gasification efficiency, and at 22% engine efficiency, the BER is equal to 0.065. The BER value for the G/ICE system is low, compared with conversion to other valuable energy products, such as hydrogen gas, with the BER equal to 0.19 [10], and 0.10–0.25 in various scenarios [1]. The BER can be greatly improved by increasing the efficiency of the internal combustion engine from 22%, leading to an increase in the overall energy utilization.
Table 6 also shows the calculated NER, which accounts for the energy input into the system, excluding the energy possessed by the biomass and the energy lost to the environment. The G/ICE system has more efficient energy utilization, as depicted by the NER, which is about 1.64 compared to 0.80 and 1.25 for biohydrogen production using gasification and dark fermentation, respectively.
As part of the emission mitigation measures, the electricity generated by the G/ICE system can be used to support farming activities and plant operations. This procedure is expected to decrease the efficiency of the system, as shown in Table 6.

4. Conclusions

Rice straw is often burnt on-field as a common farming practice, with few portions used as cheap value products. Rice straw can be successfully used as feedstock for electricity generation, using a combined gasification and internal combustion engine (G/ICE) process, with a productivity rate of 334 kWh/t rice straw, at 22% engine efficiency. In this paper, a life cycle assessment (LCA) was performed to assess the environmental performance and energy efficiency of the system composed of rice straw production, biomass transportation and G/ICE process. The impact assessment showed that the GHG emissions from rice straw production and the G/ICE process were lower compared to rice straw direct burning. The GHG released directly from rice straw transformation to electricity using G/ICE process was counterbalanced by the carbon uptake during rice crop growth. The energy derived from the fossil fuels supplied to the whole system was the other source of GHG emissions. For the other impact categories, the production and use of energy from fossil fuels had the highest impacts, based on acidifying and ecotoxicity emissions, while the production of chemicals for rice farming had the highest contribution to emissions of toxic substances. The use of fossil fuels could be avoided by using the electricity produced by the system to supply rice farming and the G/ICE plant energy needs. However, this step could decrease the productivity of the process, reducing the BER and NER values of the system. The process could be improved at a higher engine efficiency from the reported value of 22% to 50%, whereby increasing the BER from 0.065 to 0.15 and the NER from 1.64 to 3.73. This is possible by improving the producer gas quality from gasification, or through technological improvement of the internal combustion engine.

Supplementary Materials

The following are available online at https://www.mdpi.com/article/10.3390/en14164942/s1, System dynamics model equation.

Author Contributions

Conceptualization, R.L.R. and A.B.H.; methodology, R.L.R., V.A.N.d.P. and A.B.H.; software, R.L.R.; validation, R.L.R., V.A.N.d.P. and A.B.H.; formal analysis, R.L.R.; investigation, R.L.R.; resources, R.L.R., V.A.N.d.P. and A.B.H.; data curation, R.L.R. and V.A.N.d.P.; writing—original draft preparation, R.L.R. and V.A.N.d.P.; writing—review and editing, R.L.R., V.A.N.d.P. and A.B.H.; visualization, R.L.R.; supervision, R.L.R. and A.B.H. All authors have read and agreed to the published version of the manuscript.

Funding

This research received no external funding.

Institutional Review Board Statement

Not applicable.

Informed Consent Statement

Not applicable.

Data Availability Statement

Sufficient data is presented in the methodology.

Conflicts of Interest

The authors declare no conflict of interest.

References

  1. Reaño, R.L. Assessment of environmental impact and energy performance of rice husk utilization in various biohydrogen production pathways. Bioresour. Technol. 2020, 299, 122590. [Google Scholar] [CrossRef]
  2. Gençer, E.; Torkamani, S.; Miller, I.; Wu, T.W.; O’Sullivan, F. Sustainable energy system analysis modeling environment: Analyzing life cycle emissions of the energy transition. Appl. Energy 2020, 277, 115550. [Google Scholar] [CrossRef]
  3. IEA. Net Zero by 2050; IEA: Paris, France, 2021. [Google Scholar]
  4. IEA. World Energy Outlook 2020-Summary; Report; IEA: Paris, France, 2020; pp. 1–25. [Google Scholar]
  5. IEA. Renewables 2019; IEA: Paris, France, 2019. [Google Scholar]
  6. Briones-Hidrovo, A.; Copa, J.; Tarelho, L.A.C.; Gonçalves, C.; da Costa, T.P.; Dias, A.C. Environmental and energy performance of residual forest biomass for electricity generation: Gasification vs. combustion. J. Clean. Prod. 2021, 289, 125680. [Google Scholar] [CrossRef]
  7. Beagle, E.; Belmont, E. Comparative life cycle assessment of biomass utilization for electricity generation in the European Union and the United States. Energy Policy 2019, 128, 267–275. [Google Scholar] [CrossRef]
  8. Filho, F.B.D.; Santiago, Y.C.; Lora, E.E.S.; Palacio, J.C.E.; del Olmo, O.A.A. Evaluation of the maturity level of biomass electricity generation technologies using the technology readiness level criteria. J. Clean. Prod. 2021, 295, 126426. [Google Scholar] [CrossRef]
  9. Soam, S.; Borjesson, P.; Sharma, P.K.; Gupta, R.P.; Tuli, D.K.; Kumar, R. Life cycle assessment of rice straw utilization practices in India. Bioresour. Technol. 2017, 228, 89–98. [Google Scholar] [CrossRef]
  10. Reaño, R.L.; Halog, A. Analysis of carbon footprint and energy performance of biohydrogen production through gasification of different waste agricultural biomass from the Philippines. Biomass Convers. Biorefin. 2020. [Google Scholar] [CrossRef]
  11. Basu, P. Design of Biomass Gasifiers. In Biomass Gasification, Pyrolysis and Torrefaction; Elsevier: Amsterdam, The Netherlands, 2018; pp. 263–329. [Google Scholar]
  12. Martínez, J.D.; Mahkamov, K.; Andrade, R.V.; Lora, E.E.S. Syngas production in downdraft biomass gasifiers and its application using internal combustion engines. Renew. Energy 2012, 38. [Google Scholar] [CrossRef]
  13. Raman, P.; Ram, N.K. Performance analysis of an internal combustion engine operated on producer gas, in comparison with the performance of the natural gas and diesel engines. Energy 2013, 63, 317–333. [Google Scholar] [CrossRef]
  14. Yin, X.L.; Wu, C.Z.; Zheng, S.P.; Chen, Y. Design and operation of a CFB gasification and power generation system for rice husk. Biomass Bioenergy 2002, 23, 181–187. [Google Scholar] [CrossRef]
  15. Tsiakmakis, S.; Mertzis, D.; Dimaratos, A.; Toumasatos, Z.; Samaras, Z. Experimental study of combustion in a spark ignition engine operating with producer gas from various biomass feedstocks. Fuel 2014, 122, 126–139. [Google Scholar] [CrossRef]
  16. Collier, Z.A.; Connelly, E.B.; Polmateer, T.L.; Lambert, J.H. Value chain for next-generation biofuels: Resilience and sustainability of the product life cycle. Environ. Syst. Decis. 2017, 37, 22–33. [Google Scholar] [CrossRef]
  17. Wu, Y.; Su, D. Review of Life Cycle Impact Assessment (LCIA) Methods and Inventory Databases. In Sustainable Product Development; Su, D., Ed.; Springer International Publishing: Cham, Switzerland, 2020; pp. 39–55. [Google Scholar]
  18. Su, D.; Smith, J.; Wu, Y.; Ren, Z. Environmental Impact Assessment of Farming with Combined Methods of Life Cycle Assessment and Farm Carbon Calculator. In Sustainable Product Development; Su, D., Ed.; Springer International Publishing: Cham, Switzerland, 2020; pp. 249–270. [Google Scholar]
  19. Delivand, M.K.; Barz, M.; Gheewala, S.H.; Sajjakulnukit, B. Environmental and socio-economic feasibility assessment of rice straw conversion to power and ethanol in Thailand. J. Clean. Prod. 2012, 37, 29–41. [Google Scholar] [CrossRef]
  20. Cherubini, F.; Ulgiati, S. Crop residues as raw materials for biorefinery systems—A LCA case study. Appl. Energy 2010, 87, 47–57. [Google Scholar] [CrossRef]
  21. Shafie, S.M.; Masjuki, H.H.; Mahlia, T.M.I. Life cycle assessment of rice straw-based power generation in Malaysia. Energy 2014, 70, 401–410. [Google Scholar] [CrossRef]
  22. Singh, A.; Basak, P. Economic and environmental evaluation of rice straw processing technologies for energy generation: A case study of Punjab, India. J. Clean. Prod. 2019, 212, 343–352. [Google Scholar] [CrossRef]
  23. Halog, A.; Manik, Y. Advancing Integrated Systems Modelling Framework for Life Cycle Sustainability Assessment. Sustainability 2011, 3, 469–499. [Google Scholar] [CrossRef] [Green Version]
  24. Yao, L.; Liu, T.; Chen, X.; Mahdi, M.; Ni, J. An integrated method of life-cycle assessment and system dynamics for waste mobile phone management and recycling in China. J. Clean. Prod. 2018, 187, 852–862. [Google Scholar] [CrossRef]
  25. McAvoy, S.; Grant, T.; Smith, C.; Bontinck, P. Combining Life Cycle Assessment and System Dynamics to improve impact assessment: A systematic review. J. Clean. Prod. 2021, 128060. [Google Scholar] [CrossRef]
  26. ISO. ISO 14040: Environmental Management Life Cycle Assessment—Principles and Framework; ISO: Geneva, Switzerland, 2006. [Google Scholar]
  27. ISO. ISO 14044: Environmental Management Life Cycle Assessment—Requirements and Guidelines; ISO: Geneva, Switzerland, 2006. [Google Scholar]
  28. Republic of the Philippines Department of Energy. Philippine Energy Plan 2018–2040; Republic of the Philippines Department of Energy: Taguig, Philippines, 2021. [Google Scholar]
  29. Wernet, G.; Bauer, C.; Steubing, B.; Reinhard, J.; Moreno-Ruiz, E.; Weidema, B. The ecoinvent database version 3 (part I): Overview and methodology. Int. J. Life Cycle Assess. 2016, 21, 1218–1230. [Google Scholar] [CrossRef]
  30. Philippine Statistics Authority. Crops Statistics of the Philippines; Philippine Statistics Authority: Quezon City, Philippines, 2017; Volume 2015. [Google Scholar]
  31. Philippine Statistics Authority. Palay Production in the Philippines, 2017–2019; Philippine Statistics Authority: Quezon City, Philippines, 2019. [Google Scholar]
  32. Cruz, R.D.; Malanon, H.G. On-Farm Mechanization of Paddy in the Philippines. Asian J. Postharvest Mech. 2018, 1, 1–10. [Google Scholar]
  33. Van Hung, N.; Maguyon-Detras, M.C.; Migo, M.V.; Quilloy, R.; Balingbing, C.; Chivenge, P.; Gummert, M. Rice Straw Overview: Availability, Properties, and Management Practices. In Sustainable Rice Straw Management; Gummert, M., Hung, N., Van Chivenge, P., Douthwaite, B., Eds.; Springer International Publishing: Cham, Switzerland, 2020; pp. 1–13. ISBN 978-3-030-32373-8. [Google Scholar]
  34. IRRI Water Management—IRRI Rice Knowledge Bank. Available online: http://www.knowledgebank.irri.org/step-by-step-production/growth/water-management (accessed on 24 March 2021).
  35. Caparino, O.A. Status of Agricultural Waste and Utilization in the Philippines; Philippine Center for Postharvest Development and Mechanization: Nueva Ecija, Philippines, 2018. [Google Scholar]
  36. Cruz, R.D.; Bobier, S. Farm Power Available for Utilization in Philippine Agriculture. Postharvest Mech. J. 2016, 2, 16p. [Google Scholar]
  37. Calcante, A.; Oberti, R. A Technical-Economic Comparison between Conventional Tillage and Conservative Techniques in Paddy-Rice Production Practice in Northern Italy. Agronomy 2019, 9, 886. [Google Scholar] [CrossRef] [Green Version]
  38. Rupesh, S.; Muraleedharan, C.; Arun, P. A comparative study on gaseous fuel generation capability of biomass materials by thermo-chemical gasification using stoichiometric quasi-steady-state model. Int. J. Energy Environ. Eng. 2015, 6, 375–384. [Google Scholar] [CrossRef] [Green Version]
  39. Dassey, A.; Mukherjee, B.; Sheffield, R.; Theegala, C. Catalytic cracking of tars from biomass gasification. Biomass Convers. Biorefin. 2013, 3, 69–77. [Google Scholar] [CrossRef]
  40. Park, H.J.; Park, S.H.; Sohn, J.M.; Park, J.; Jeon, J.-K.; Kim, S.-S.; Park, Y.-K. Steam reforming of biomass gasification tar using benzene as a model compound over various Ni supported metal oxide catalysts. Bioresour. Technol. 2010, 101, S101–S103. [Google Scholar] [CrossRef]
  41. Ishii, K.; Furuichi, T. Influence of moisture content, particle size and forming temperature on productivity and quality of rice straw pellets. Waste Manag. 2014, 34, 2621–2626. [Google Scholar] [CrossRef] [PubMed]
  42. Migo-Sumagang, M.V.P.; Van Hung, N.; Detras, M.C.M.; Alfafara, C.G.; Borines, M.G.; Capunitan, J.A.; Gummert, M. Optimization of a downdraft furnace for rice straw-based heat generation. Renew. Energy 2020, 148, 953–963. [Google Scholar] [CrossRef]
  43. Safarian, S.; Richter, C.; Unnthorsson, R. Waste Biomass Gasification Simulation Using Aspen Plus: Performance Evaluation of Wood Chips, Sawdust and Mixed Paper Wastes. J. Power Energy Eng. 2019, 7, 12–30. [Google Scholar] [CrossRef] [Green Version]
  44. Anis, S.; Zainal, Z.A. Tar reduction in biomass producer gas via mechanical, catalytic and thermal methods: A review. Renew. Sustain. Energy Rev. 2011, 15, 2355–2377. [Google Scholar] [CrossRef]
  45. Konti, A.; Kekos, D.; Mamma, D. Life Cycle Analysis of the Bioethanol Production from Food Waste—A Review. Energies 2020, 13, 5206. [Google Scholar] [CrossRef]
  46. Hauschild, M.Z.; Huijbregts, M.A.J. Introducing Life Cycle Impact Assessment. In Life Cycle Impact Assessment; Springer: Berlin, Germany, 2015; pp. 1–16. [Google Scholar]
  47. Levasseur, A. Climate Change. In Life Cycle Impact Assessment; Springer: Berlin, Germany, 2015; pp. 39–50. [Google Scholar]
  48. Fortmann-Roe, S. Insight Maker: A general-purpose tool for web-based modeling & simulation. Simul. Model. Pract. Theory 2014, 47, 28–45. [Google Scholar] [CrossRef] [Green Version]
  49. Nguyen, V.H.; Sander, B.O.; Quilty, J.; Balingbing, C.; Castalone, A.G.; Romasanta, R.; Alberto, M.C.R.; Sandro, J.M.; Jamieson, C.; Gummert, M. An assessment of irrigated rice production energy efficiency and environmental footprint with in-field and off-field rice straw management practices. Sci. Rep. 2019, 9, 16887. [Google Scholar] [CrossRef] [PubMed]
  50. Chen, S.; Feng, H.; Zheng, J.; Ye, J.; Song, Y.; Yang, H.; Zhou, M. Life Cycle Assessment and Economic Analysis of Biomass Energy Technology in China: A Brief Review. Processes 2020, 8, 1112. [Google Scholar] [CrossRef]
  51. van Zelm, R.; Roy, P.-O.; Hauschild, M.Z.; Huijbregts, M.A.J. Acidification. In Life Cycle Impact Assessment; Springer: Berlin, Germany, 2015; pp. 163–176. [Google Scholar]
  52. Aktar, W.; Sengupta, D.; Chowdhury, A. Impact of pesticides use in agriculture: Their benefits and hazards. Interdiscip. Toxicol. 2009, 2. [Google Scholar] [CrossRef] [Green Version]
  53. Duan, H.; Jia, X.; Zhai, Q.; Ma, L.; Wang, S.; Huang, C.; Wang, H.; Niu, Y.; Li, X.; Dai, Y.; et al. Long-term exposure to diesel engine exhaust induces primary DNA damage: A population-based study. Occup. Environ. Med. 2016, 73, 83–90. [Google Scholar] [CrossRef]
  54. Jolliet, O.; Fantke, P. Human Toxicity. In Life Cycle Impact Assessment; Springer: Berlin, Germany, 2015; pp. 75–96. [Google Scholar]
  55. Allen, J.; Pascual, K.S.; Romasanta, R.R.; Van Trinh, M.; Van Thach, T.; Van Hung, N.; Sander, B.O.; Chivenge, P. Rice Straw Management Effects on Greenhouse Gas Emissions and Mitigation Options. In Sustainable Rice Straw Management; Springer International Publishing: Cham, Switzerland, 2020; pp. 145–159. [Google Scholar]
  56. Hu, Z.; Wu, S.; Ji, C.; Zou, J.; Zhou, Q.; Liu, S. A comparison of methane emissions following rice paddies conversion to crab-fish farming wetlands in southeast China. Environ. Sci. Pollut. Res. 2016, 23, 1505–1515. [Google Scholar] [CrossRef] [PubMed]
Figure 1. Biomass pre-processing and combined gasification and internal combustion engine process layout.
Energies 14 04942 g001aEnergies 14 04942 g001b
Figure 2. Rice farming and G/ICE plant process percent contribution to the selected LCIA impact categories.
Energies 14 04942 g002
Figure 3. Comparison of 30-year GHG emissions using the SD model from various cases.
Energies 14 04942 g003
Figure 4. Effect of varying biogenic methane emissions (kg CH4/kg milled rice) on the GHG accumulation using the SD model.
Energies 14 04942 g004
Figure 5. Effect of varying CO2 sequestration rate (kg CO2/kg milled rice) on the GHG accumulation using the SD model.
Energies 14 04942 g005
Figure 6. Effect of obtaining an electricity source from G/ICE plant to support rice farming and plant operations.
Energies 14 04942 g006
Table 1. Summary of annual average material input and products of rice production in the Philippines.
Material FlowAnnual AverageUnit, per ha of Land
Input
Inorganic fertilizer [31]277.50kg
     Urea123.83kg
     Ammonium sulfate24.33kg
     Ammonium phosphate30.33kg
     Complete99.17kg
     Others (solid)2.74kg
     Others (liquid)0.18L
Organic (solid)6.95kg
Organic (liquid)0.42L
Pesticide [31]
     Insecticide (solid)0.30kg
     Insecticide (liquid)0.91L
     Herbicide (solid)0.12kg
     Herbicide (liquid)0.89L
     Fungicide (solid)0.07kg
     Fungicide (liquid)0.06L
     Rodenticide (solid)0.03kg
     Rodenticide (liquid)0.01L
     Molluscicide (solid)0.27kg
     Molluscicide (liquid)0.15L
     Nematicide (solid)0.01kg
     Nematicide (liquid)0.01L
     Others (solid)0.01kg
     Others (liquid)0.03L
Seed39.17kg
Water (irrigated rice) [34]4374.50m3
Products
Milled rice2.35t
Paddy rice3.70t
Rice husk [35]0.89t
Rice straw [33]2.70–8.00t
Table 2. Approximation of electricity and amount of diesel used in milled rice production.
Machinery Used [36]OperationsAverage Motor Size (hp)Operation, h/ha [37]kWh/yType
hand tractor (engine)Plowing, Harrowing,9.40.5920,846.52diesel
TransplanterTransplanting6.60.5914,469.58diesel
irrigation pumpIrrigation11.073977.07diesel
4-wheel tractorPlowing, Harrowing,761.39393,274.75diesel
CombineHarvesting, threshing610.83188,925.83diesel
Rice MillMilling6.2 45,254.02electricity
Otherslighting, transport1 1431.75electricity
Summary
Total diesel energy, MJ/y2,237,377.54
Total electricity from grid, MJ/y168,068.75
Table 3. Material flow for electricity generation from rice straw using a combined gasification and internal combustion engine process.
Parameters Used in Design/CalculationValuesBasis/Remarks
Days of operation per year300
Gasification operation hours per day12
PRE-PROCESSING
Rice straw feed rate, kg/h1875.00 About 0.02–0.06% of total available rice straw per year
Initial moisture content20%8–25% initial moisture content of rice straw [41]
Biomass crushing
Particle size<5 cm<5 cm [12]
Drying
Moisture content, %5.42%<25% [12]
GASIFICATION
Rice straw feed rate, kg/h1500.00 [42]
Rice straw LHV, MJ/kg14.72
Ultimate analysis: C, H, O, N, S, Ash (% weight)35.5, 4.62, 58.83, 0.99, 0.06, 19.86
Parameters
Gasification temperature, °C1000800–1200, average is 1000 [10,12]
Equivalence ratio (ER)0.20.20–0.30 [43]; 0.20–0.40 [12]
Steam to biomass ratio (SBR)0.25
Air supplied, kg/h831.23Calculated based on ER
Steam flowrate (1 bar, 300 °C), kg/h375Calculated based on SBR
Output
Syngas composition, H2, CO, CO2, CH4, N213%, 26%, 22%, 2%, 37%Equation (1),Calculated is based on the methodology presented in the following studies: [10,38].
Steam, Nm3/h1046.6
Elemental C, kg/h88.674
Tar, kg/h22.582
Ash, kg/h297.90
H2S, kg/h0.93490
Summary
Gas yield, Nm3/kg rice straw0.920
LHV, MJ/Nm35.26Equation (4)
Gasification efficiency33.0%
GAS CLEANING AND PURIFICATION
Inertial separators
Percent efficiency50[14]
Cyclone separators
Percent efficiency90[14]
Unreacted Carbon recovered, kg/h84.24
Ash recovered, kg/h283.01
Tar cracking, 700 °C
Tar from syngas, kg/h22.582Tar is represented by C6H6.
Steam, kg/h841.77
Percent conversion efficiency87.2[44]
Tar Cracking products
H2, kg/h4.57Equation (3)
CO, kg/h42.4
Venturi scrubber
Percent efficiency90%[14]
Water scrubber (2 units)
Percent efficiency95%[14]
Fuel gas, million Nm3/y5.256producer gas + cracked tar
LHV fuel gas, MJ/Nm35.62Equation (4)
Tar in gas, mg/Nm30.4910–100 mg/Nm3 gas allowable [12]
Total gas impurities (C, Ash, H2S, tar, water), ppm0.14
Fuel gas composition: H2, CO, CO2, CH4, N2 (% by volume)15.9, 27.0, 20.4, 1.67, 35.1
Internal combustion engine
Fuel flowrate, m3/h730.05based on gasification fuel gas production
Air flowrate (20% excess), m3/h1899
Actual Air/Fuel (A/F) ratio, by volume2.6
Power generation efficiency22%20–22% efficiency for producer gas engine, [13]
Electricity output, TJ/y6.5Equivalent to 155.13 toe
Fuel gas consumption, Nm3/MJ (Nm3/kWh)0.81 (2.91)In comparison to rice husk: 3.76 Nm3/kWh [14]
Flue gas
Composition: N2, CO2, H2O, O2, CO, NO2 (% by weight)70.3, 23.3, 3.74, 2.65, 0.0125, 0.00332
Temperature, °C500
Water treatment
Influent, kg/h8000
COD, ppm1156.73
Water, for recycling, kg/h8000
COD, ppm (effluent)0.1[14]
Filtered solids, kg/h19.32based on material balance
Air emissions
CO2, kg/h4.88based on material balance
SO2, kg/h0.878
Table 4. Energy flow calculation for the combined gasification and internal combustion engine process.
EquipmentNo. of UnitsCodeCapacityPower Rating, kW
Pre-processing
Ball crusher1BC013000 kg/h30
Conveyor2PC01, PC022400 kg/h0.6
Boiler/Steam heater BD01 Recycled heat
Air fan/dryer2AF0140,000 m3/h15
Gasification
Air/steam fan1GF015000 m3/h15
Ash conveyor1 1
Gasifier 1500 kg/h
Gas Pump1CF01 15
Water pump, 4.3 bar (g)1WP018000 kg/h7.5
Cooling water pump1 60 m3/h7.5
Cooling water air fan1 11
Aerators 7.5
Internal combustion engine
Gas compressor, 10 kPa1AC018000 m3/h37
Control power transformer1 4.5
Table 5. Environmental impact of rice straw production and G/ICE plant for electricity production.
Impact CategoriesUnit per MJ ElectricityValues
climate changekg CO2-eq0.642
terrestrial acidificationkg SO2-eq0.00208
freshwater eutrophicationkg P-eq6.69 × 10−6
marine eutrophicationkg N-eq4.73 × 10−5
freshwater ecotoxicitykg 1,4-DCB-eq0.00138
marine ecotoxicitykg 1,4-DB-eq2.78 × 10−4
terrestrial ecotoxicitykg 1,4-DCB-eq0.00171
human toxicitykg 1,4-DCB-eq0.0121
photochemical oxidant formationkg NMVOC-eq0.00180
Table 6. Energy utilization and electricity production efficiency.
CaseBERNER
ICE efficiency = 22% (default)0.0651.64
ICE efficiency = 35%0.102.61
ICE efficiency = 50%0.153.73
G/ICE plant provides electricity for rice farming operations0.0411.03
G/ICE plant provides electricity for self-operations0.0501.25
G/ICE plant provides all electricity demand of the system0.0260.64
Publisher’s Note: MDPI stays neutral with regard to jurisdictional claims in published maps and institutional affiliations.

