Article

Modified Model for Shallow Soil Strength Recovery Calculation during Set-Up Periods of Jetted Conductor—A Case Study of Equatorial Guinea Bay Deep-Water Drilling

1
State Key Laboratory of Petroleum Resource and Prospecting, China University of Petroleum, Beijing 102249, China
2
Tianjin Branch of CNOOC Ltd., Tianjin 300459, China
*
Author to whom correspondence should be addressed.
Energies 2021, 14(16), 4940; https://doi.org/10.3390/en14164940
Submission received: 16 June 2021 / Revised: 4 August 2021 / Accepted: 10 August 2021 / Published: 12 August 2021

Abstract

:
Jetted conductor setting depth is crucial for deep-water drilling. This paper presents an innovative method for determining the shallow soil resistance strength recovery factor based on the field data of Equatorial Guinea bay. It shows that the soil strength recovery factor of Equatorial Guinea bay is lower than that of the Gulf of Mexico. The conductor setting depth calculation referring to other place will have a high risk of wellhead sinking. According to the newly established designing charts, the conductor setting depth was recommended for the S1 well. Each preferred set-up period requires a specific setting depth. If the chosen set-up period is 2 days, the expected setting depth of a 36″ conductor should be 250 ft (76.2 m) and, similarly, 295 ft (89.9 m) for a 30″ conductor. The relationship between set-up period and surface conductor setting depth is established as well. Wellhead landed load appears to be the crucial factor for determining the conductor setting depth. The rationality of the newly developed shallow soil strength recovery model for the Equatorial Guinea deep-water block was also confirmed by the field data.

1. Introduction

Surface conductors (also known as surface casing or jetted conductors) are important parts of the well structure in deep-water drilling. They play an important role in constructing the wellhead, supporting the underwater blowout preventer stack, and in all casing strings. The surface conductor must have the capacity to resist external imposed load at the surface to prevent itself from sinking; subsequent construction is strongly dependent upon its installing quality [1,2,3,4,5]. The typical wellhead structure used in deep-water drilling is shown in Figure 1. It consists of surface conductor, mudmat, low pressure wellhead, high pressure wellhead, technical casing, slope indicator, etc.
The running technology of jetting while drilling concerning surface conductor have currently grown into a universal phenomenon in the field of deep-water drilling [6,7]. This technology can be traced back to the Gulf of Mexico in the 1960s when the USA used the first floating rigs in the Gulf of Mexico. However, few research has focused on drilling in deep water. To some extent, jetting while drilling in deep-water practically represents a profound branch and therefore requires intensive research for the purposes of inquiry and study [8].
Beginning from the Gulf of Mexico in the 1960s, the running technology of jetting while drilling concerning surface conductors has undergone a complicated development process. The conductor runs down into the hole by its own weight after jetting off the seabed soil [9]. Successful operation can greatly save time and money. Consequently, the design of jetting while drilling has been of great importance in the whole drilling plan [10]. Particularly, in the calculation concerning the design of setting depth, the surface conductor plays the most important role [11].
There was a big difference between the designing and installment of surface conductors which occurred before the establishment of the American BP and Amoco corporations. The extensive arguments associated with the most workable method laid the basis for innovations concerning designs of surface conductors.
In BP, Beck, Jackson, and Hamilton (1991) determined the design of jetting operations with coring soil sample in specific sites. The design calculated the upper and lower bounds of bearing capacity related to the surface conductor with the aid of undrained shear strength, miniature vane shear strength (MV) and the residual miniature vane shear strength (RMV) of soil. However, this design did not provide the calculating method of set-up curve associated with soil. During jetting while drilling, the design mainly imposed enough weight laid onto the surface conductor by other implements, which largely exceeded the bearing capacity of the conduit [3]. This design can avoid the reciprocating motion of strings and thus is referred to as “controlled jetting”. This design remains stagnant due to its many disadvantages (even though it can effectively guarantee the safety of subsequent operations). As for the other aspect, Jeanjean in BP performed an innovation for the abovementioned technique in 2002 and proposed a method to calculate the bearing capacity of the surface conductor. The method can determine the instantaneous bearing capacity and evaluate the variations between the set-up of soil and time. The method is developed based on the study of Beck et al. (1991), in which the drilling operation reaches the target depth with the help of the reciprocating motion of strings. Since then, the method has achieved successful application.
The deep offshore Gulf of Guinea has become a mature oil province with rapid development of numerous oilfields, such as in the Gulf of Mexico. The Gulf of Guinea is known to possess benign environmental conditions. The deep offshore Gulf of Guinea has proven to be unique in certain aspects. There are number of differences with regard the Gulf of Mexico’s characteristics. For example, the Gulf of Guinea’s deep-water sediments are generally consolidated clays.
Soil parameters have significance uses, especially for the design of deep-water structures such as piles, anchors, mudmats, casings, and pipelines. They are also used in geohazard risk assessments and to perform slope stability assessments or debris flow run-out analyses.
Lateral friction against surface conductors plays an important role in subsea wellhead stability. Lateral friction acts as a resistance during jetting process and supports the load of the subsea wellhead. So, prediction of this friction is of great significance during the conductor jetting process. Some petroleum companies such as British Petroleum (BP) company (2002) collected soil samples from different depth under the mudline in the Gulf of Mexico and established predictions in the Gulf of Mexico. Zhou [12] also built a friction recovery prediction model using conductor soaking experiment method according to the shallow water seabed field experiments. However, these results cannot be used directly for Equatorial Guinea deep water conductor setting depth designing. The soil strength recovery characteristic is also related to the jet excavation during the conductor jetting process [8,13].
Based on the soil-pile theory and soil strength recovery test method, this paper presented a new idea for developing a distrusted soil strength recovery model by using the field drilling data. The research results are strongly confirmed by the field practice.

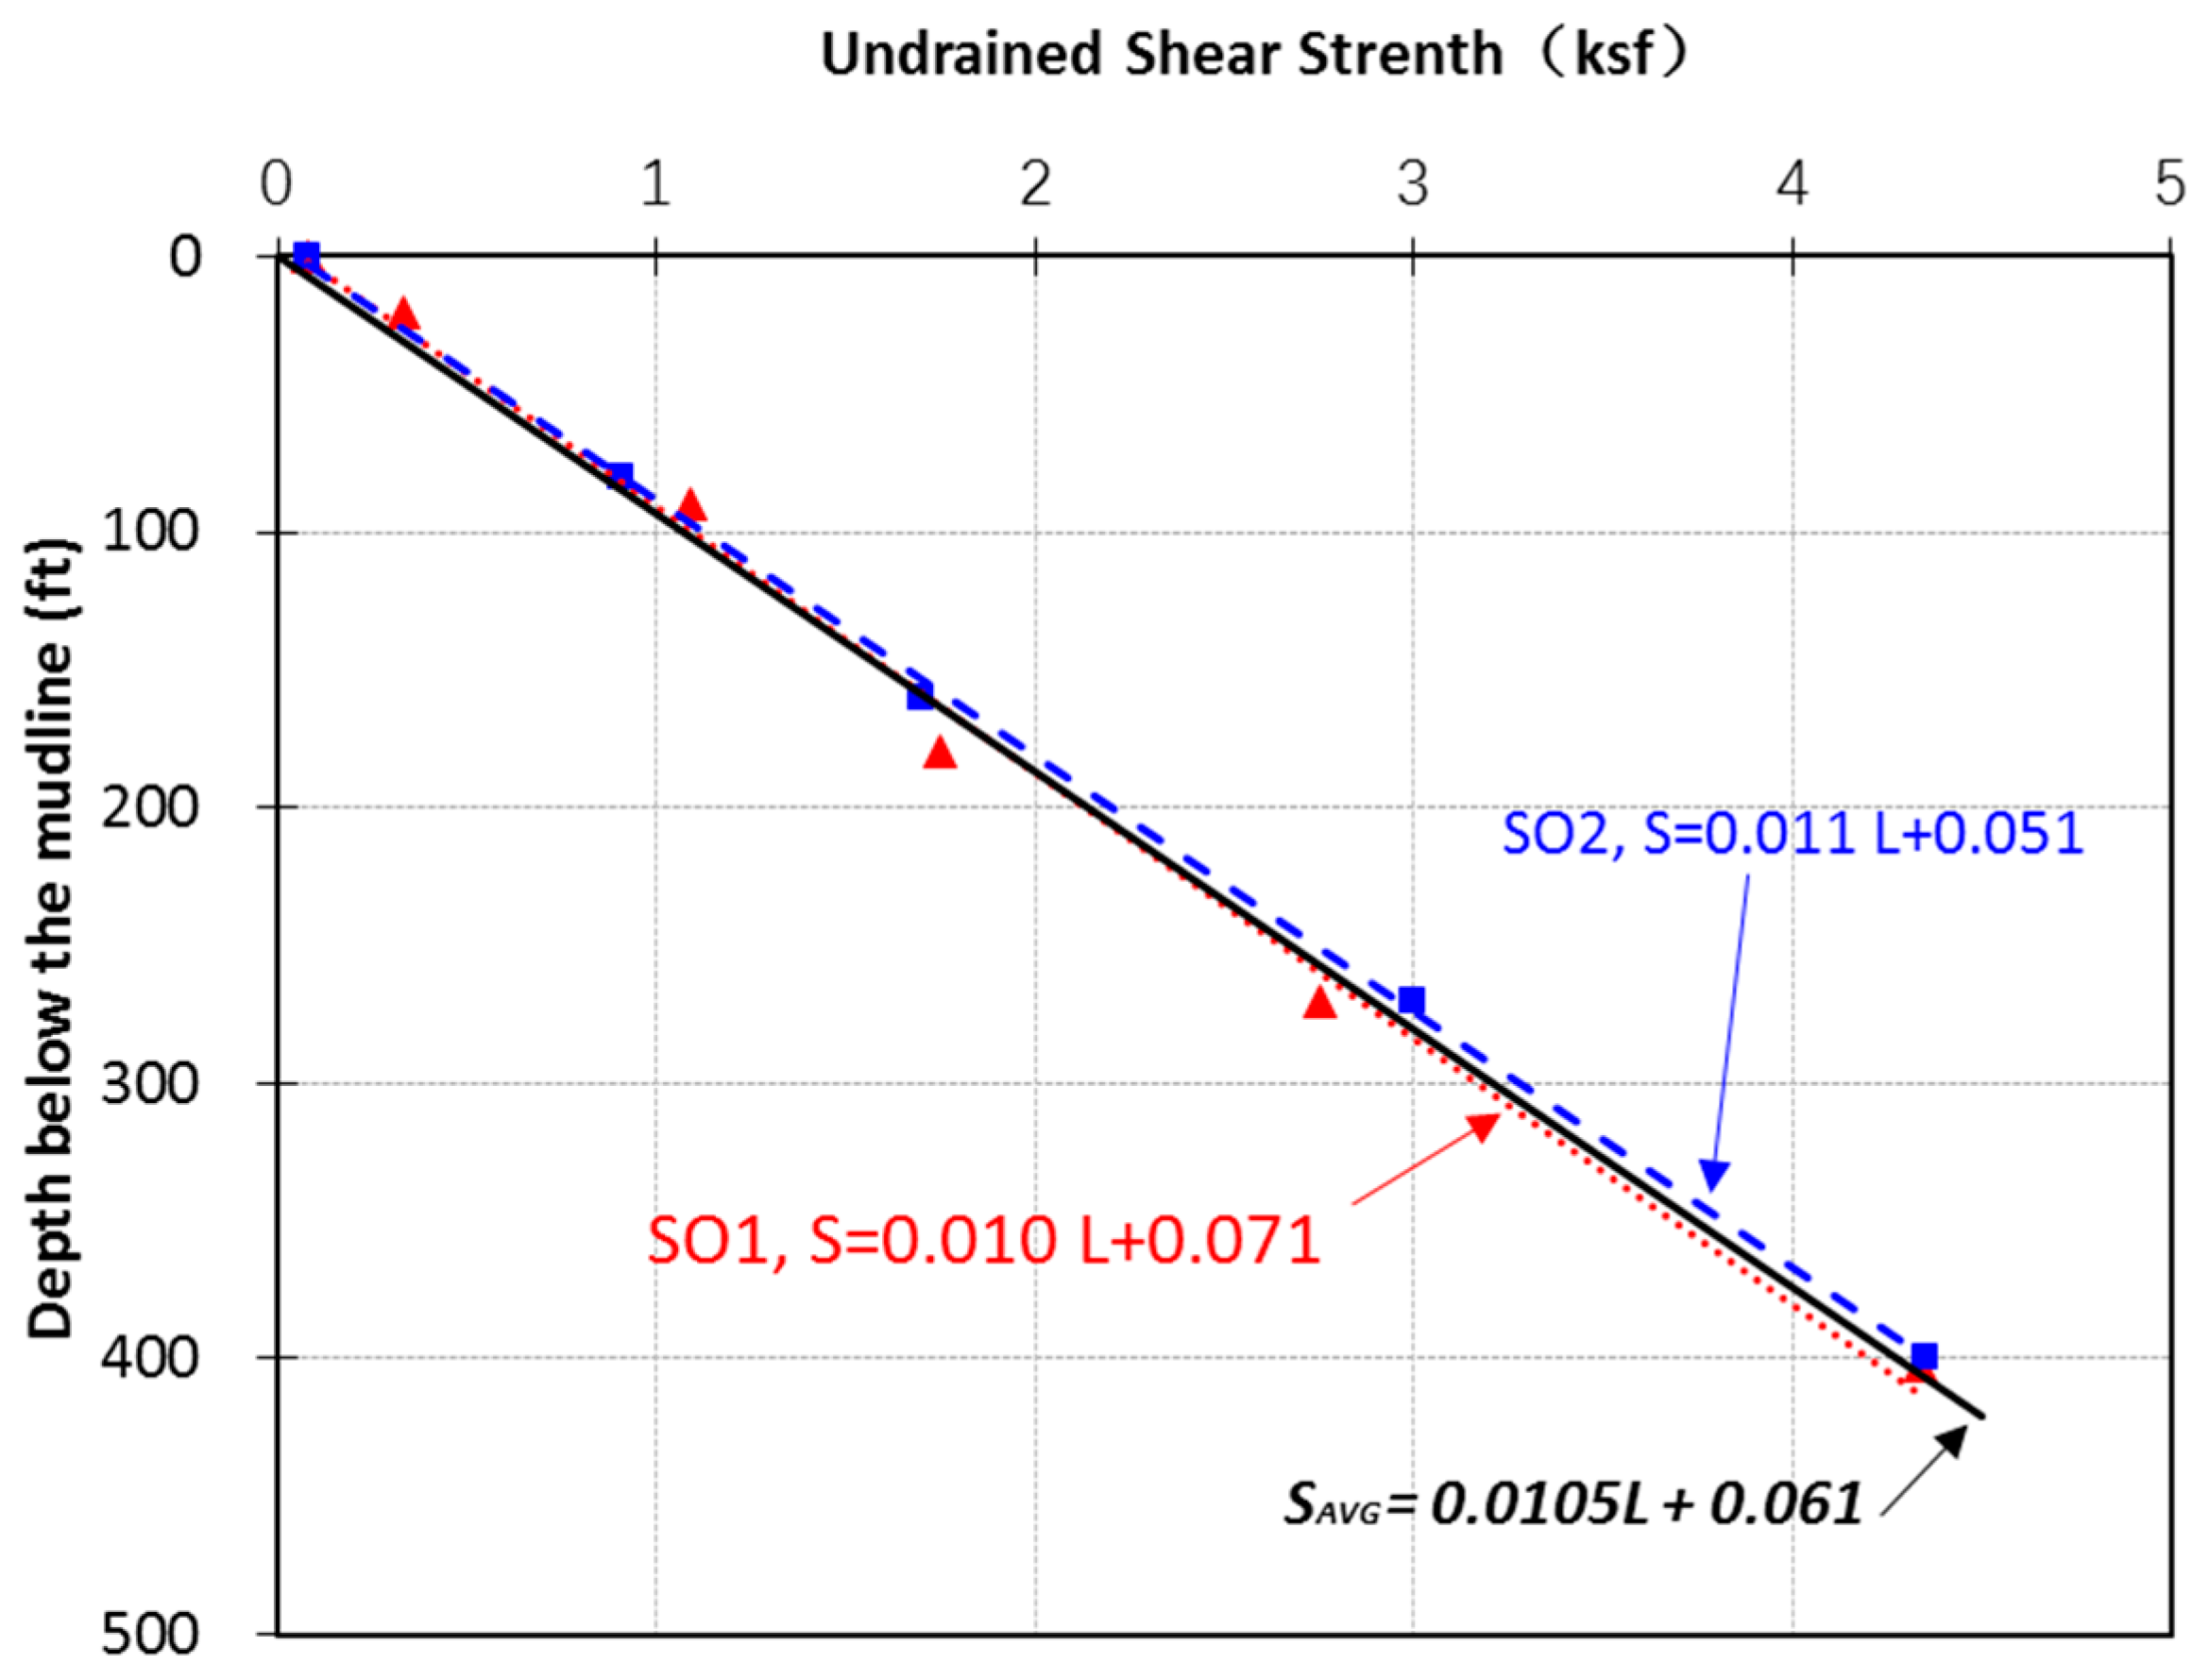
2. Shear Strength Profile of the Shallow Soil in Equatorial Guinea Deep-Water

The setting depth of jetting conductor has a close relationship with the shallow soil shear strength [14,15]. Therefore, the profile of shallow soil shear strength in the site has to be developed. The measured data concerning the shear strength of shallow soil in SO1 and SO2 holes are presented in Figure 2. Based on provided parameters of shallow soil strength of SO1 and SO2 holes, the average profile of shear strength of shallow soil was established (black solid line in Figure 2).
The average undrained shear strength of this site can be calculated as (see Equation (1)):
S u - avg = 0.0105 L + 0.061
where:
  • L—the depth below the mudline, ft;
  • Su-avg—the average shear strength at depth of L, ksf.
It should be noted that the water depth of the two holes (SO1 and SO2) are about 1968 ft (600 m). However, the objective well site of the S1 well is 3611 ft (1101 m). The shallow soil shear strength for S1 well site should be corrected. Generally, the shallow soil shear strength profiles decreased with increasing of water depth. As shown in Figure 3, 2400 m water depth soil data is from the South China Sea, the 1500 m data is from the Gulf of Mexico, and 600 m data is from this research.
The soil shear strength curves’ slop decreased almost linearly with the increase of water depth. Thus, the reasonable soil strength curve for the target S1 well could be speculated as Equation (2) (solid line in Figure 3):
S u , REC = 0.0055 L + 0.05
where:
  • S u , REC —the recommended shear strength at depth of L, ksf.

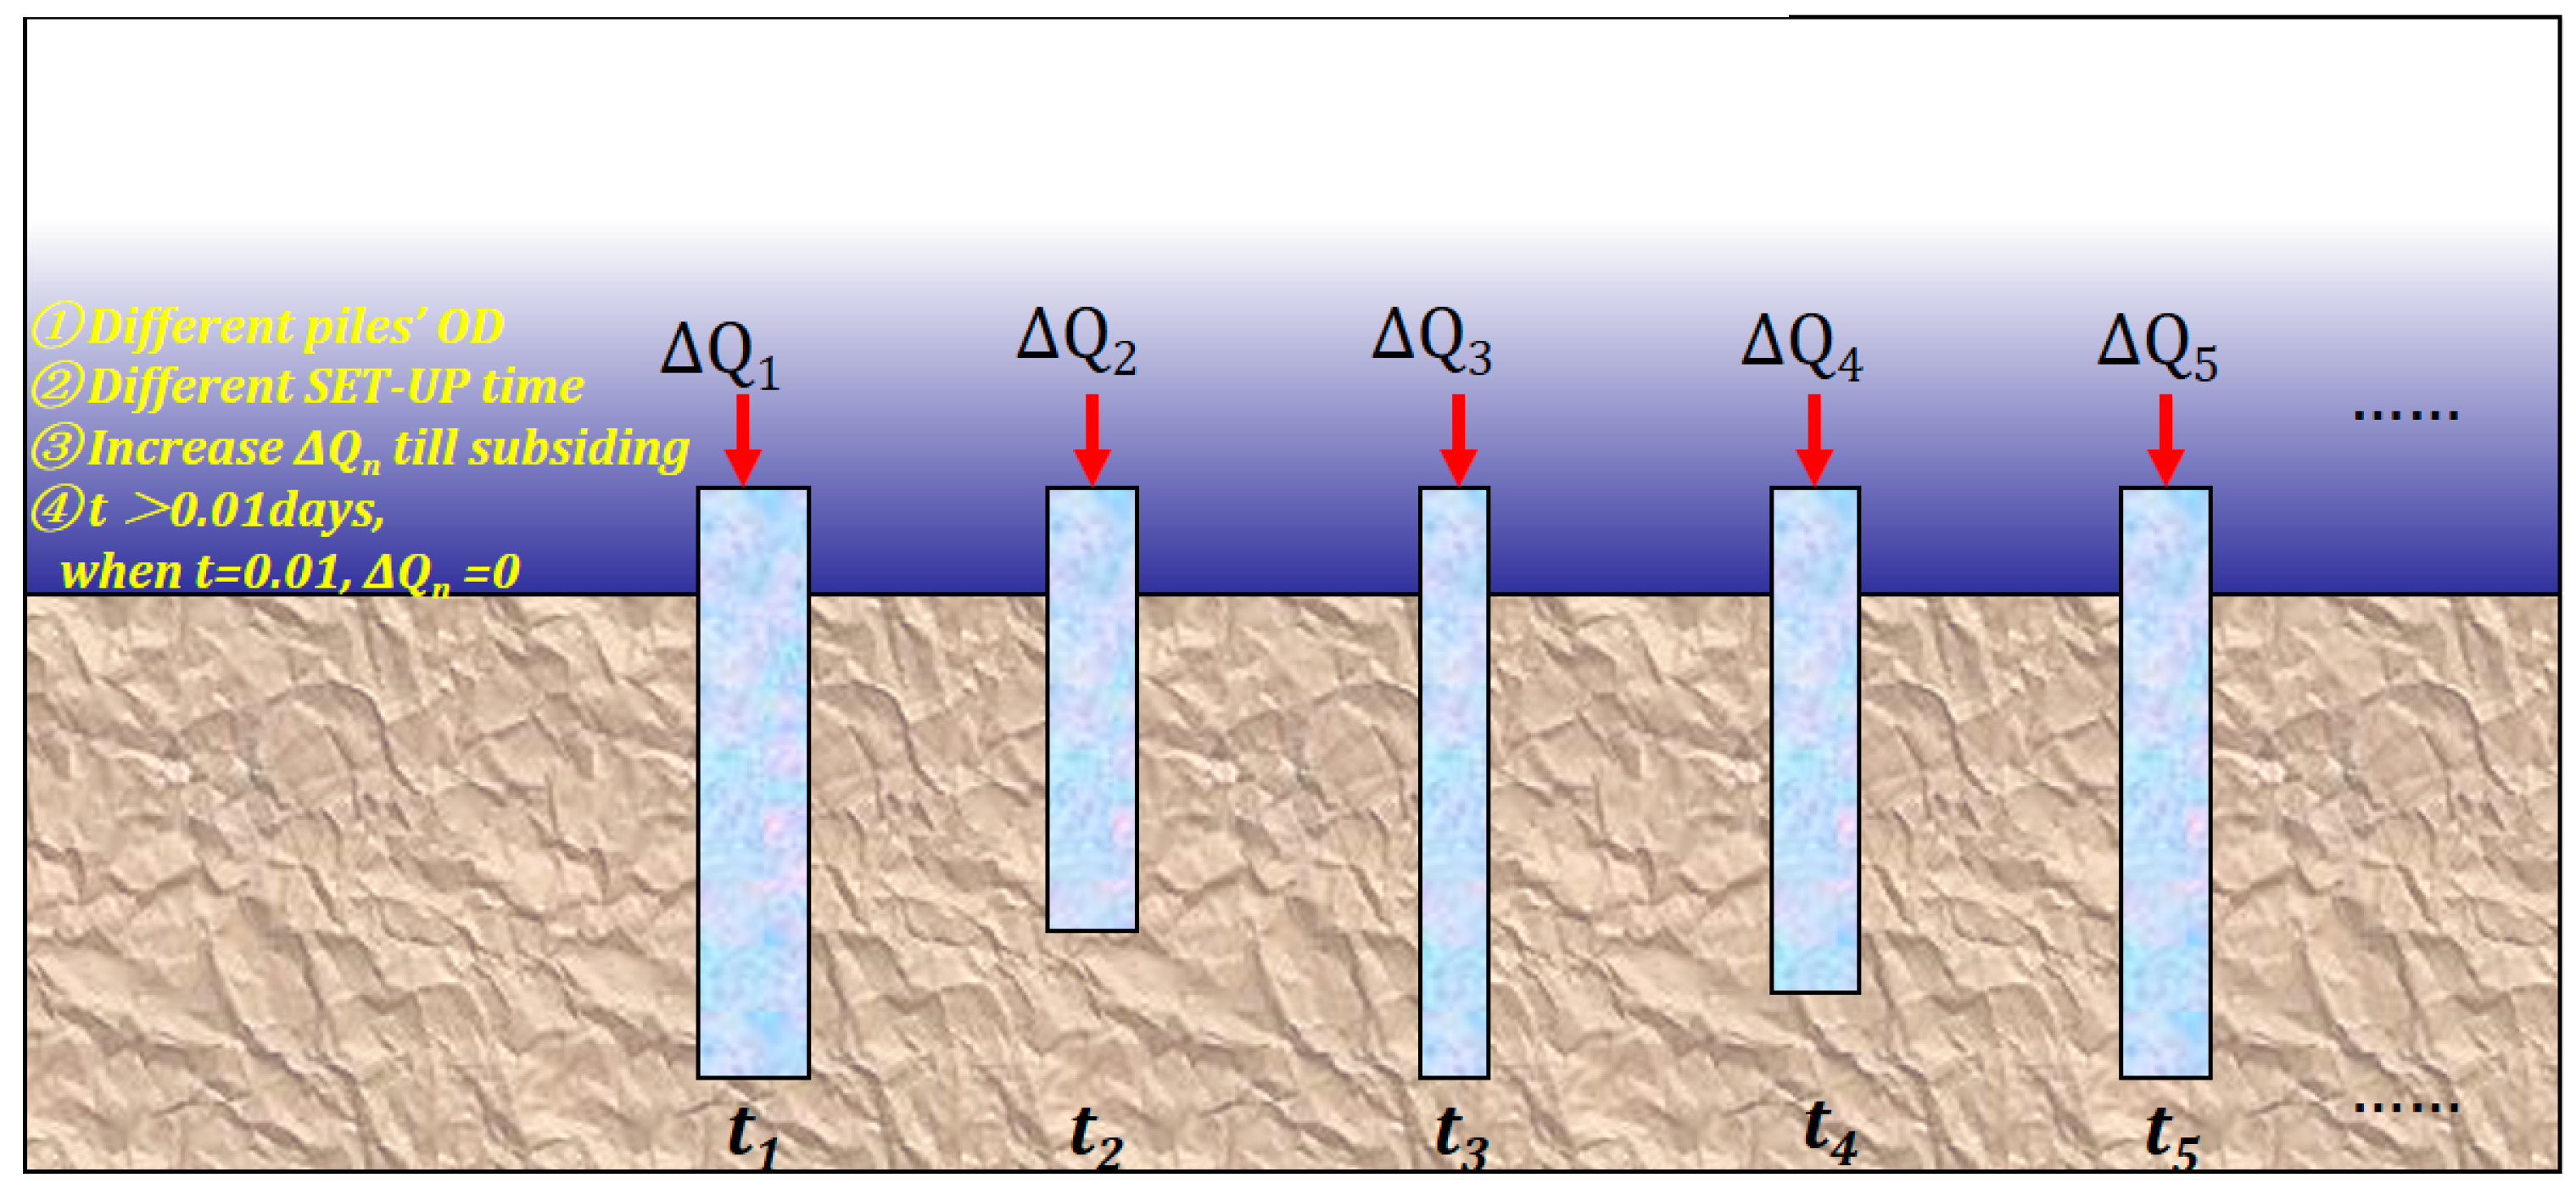
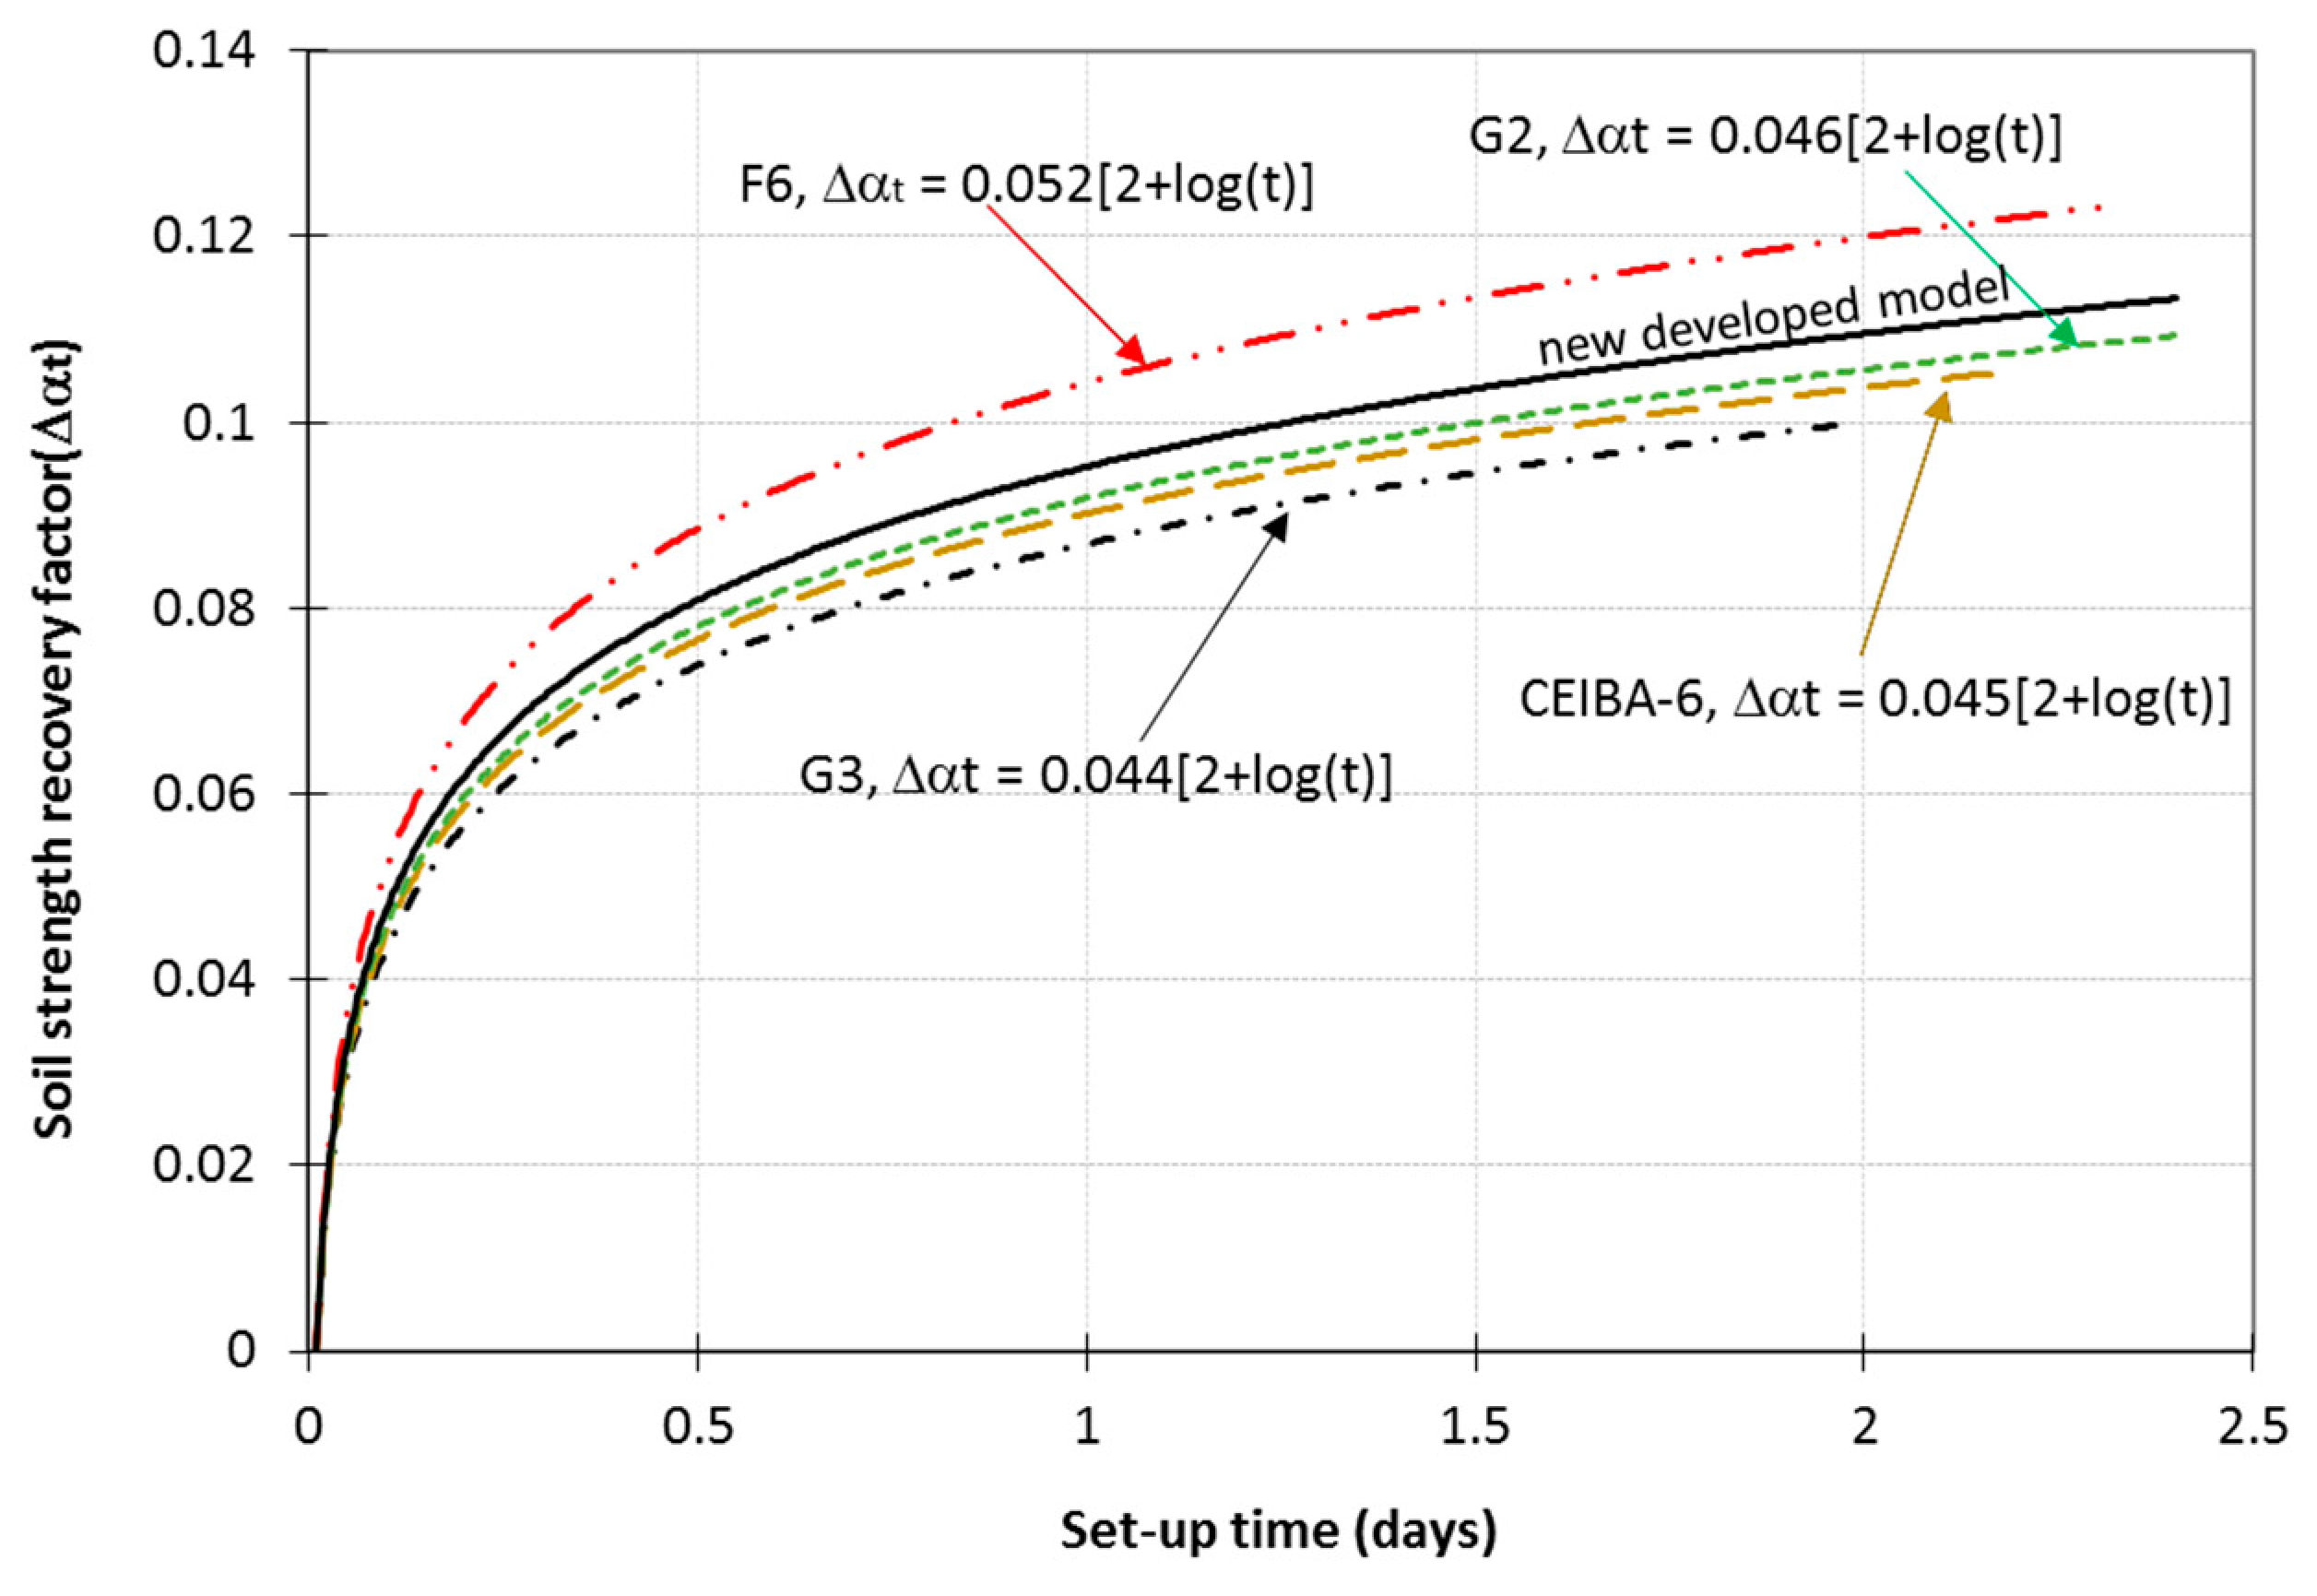
3. Soil Strength Recovery Model of Equatorial Guinea

The soil strength recovery factor ( Δ α t ) represents the strength recovery ability of a disturbed soil, it has typical regional characteristics. The test method is shown in Figure 4. For each test pile (or conductor), after a certain period of “set-up”, we applied a step increasing downward load Δ Q n until the pile began to sink. Then, we calculated the Δ α t by using the Equation (3). Parallel tests will make the result more reliable.
The immediate capacity is arbitrarily defined at time equals to 0.01 day [4], which is the initial point. When set-up time (T) = 0.01, the instantaneous load is set as Q 0 .
Δ α t = Q t Q 0 π D L S A V G = Δ Q π D L S A V G
where:
  • Δ α t : Soil strength recovery factor (correlated with set-up time);
  • Q t : Conductor capacity at time = t days, pounds (lbs);
  • Q 0 : Initial Capacity, (at time t = 0.01 days), pounds (lbs);
  • Δ Q : Load increment beyond 0.01 day, pounds (lbs);
  • S A V G : Average undrained shear strength of soil along the length of riser pipe, pounds-force per square inch;
Ideally, the Δ α t determination test should be conducted nearby the well site. However, few companies conduct such tests regarding the high cost, especially in deep-water blocks. The operating company for Equatorial Guinea S1 well drilling did not conduct Δ α t testing as well. Most oil companies refer to the Δ α t model derived from the BP experience in the Gulf of Mexico’s deep-water areas [4]. However, the Equatorial Guinea deep-water block is far from the Gulf of Mexico, and thus the seabed shallow soil properties could be different from each other. The soil strength recovery factor ( Δ α t ) is expected to be different.
In order to obtain a suitable soil strength recovery factor ( Δ α t ) for the Guinea deep-water block, regression analysis was performed based on the field data presented in Table 1. The conductors of Well G3, CEIBA-6, and G-2 were jetted at a shallow depth of 242.8 ft and well F6 at 275.6 ft with a set-up time of 1.98, 2.19, 2.4, and 2.31 days respectively.
According to the Daily Drilling Report, well F6’s wellhead sank during the 20″ casing cementing. The other three wells were successful. Based on the test method of Δ α t (Figure 4), well F6 can be seen as a test point for determining the maximum Δ α t , and the other three wells’ data can be seen as the test point for determining the minimum. The actual recovery factor was expected between the maximum and minimum. Four wells site recovery factors are plotted in Figure 4. The model coefficient is between 0.044 and 0.052. The average coefficient Δ α t model is used to design conductor setting depth for S1 well in Equatorial Guinea deep-water block. A new modified soil strength recovery model for Equatorial Guinea is developed in Equation (4) (solid line in Figure 5):
Δ α t = 0.048 × [ 2 + lg ( t ) ]
As shown in Figure 6, The average coefficient of soil strength recovery model in Equatorial Guinea deep-water block is obviously lower than that of the value in the Gulf of Mexico. Equatorial Guinea deep-water shallow soil is “softer” and “recovers more slowly” than the Gulf of Mexico’s shallow soil. If the surface conductor depth designing method were to use the Gulf of Mexico’s deep-water model directly, a quite smaller required conductor setting depth will be obtained and wellhead sinking risk is much higher during 20″ casing cementing.

4. Conductor Setting Depth Determination

4.1. Wellhead Landed Load Calculation

Wellhead landed load during 20″ casing cementing is a crucial factor to determine the surface conductor setting depth. As shown in Figure 7, the maximum landed load appears sharp at the second of cementing mud reached the bottom hole. Generally, the maximum landed load includes the buoyant weight of 20″ casing, the weight of cementing string in air, the weight of sea water in the annular, and the weight of cement in the cementing string.
The calculation equation is as follows (Equation (5)):
W l a n d e d = W 20 i n c h + W c s a + W s w a + W c c s W w d 20 i n c h
where:
  • W l a n d e d , maximum load landed on wellhead during technical casing cementing, lbs;
  • W 20 i n c h , the weight of 20″ casing in air, lbs;
  • W c s a , the weight of cementing string in air, pound, lbs;
  • W s w a , the weight of sea water in the annular, lbs;
  • W c c s , the weight of cement in the cementing string, lbs;
  • W w d 20 i n c h , the weight of water displaced by 20″ casing
Field parameters for landed load calculation are listed in Table 2, under the condition of 20″ casing shoe running depth at 1640 ft (about 500 m) below the mudline. The maximum load landed on wellhead during cementing operation is 424,100 lbs.

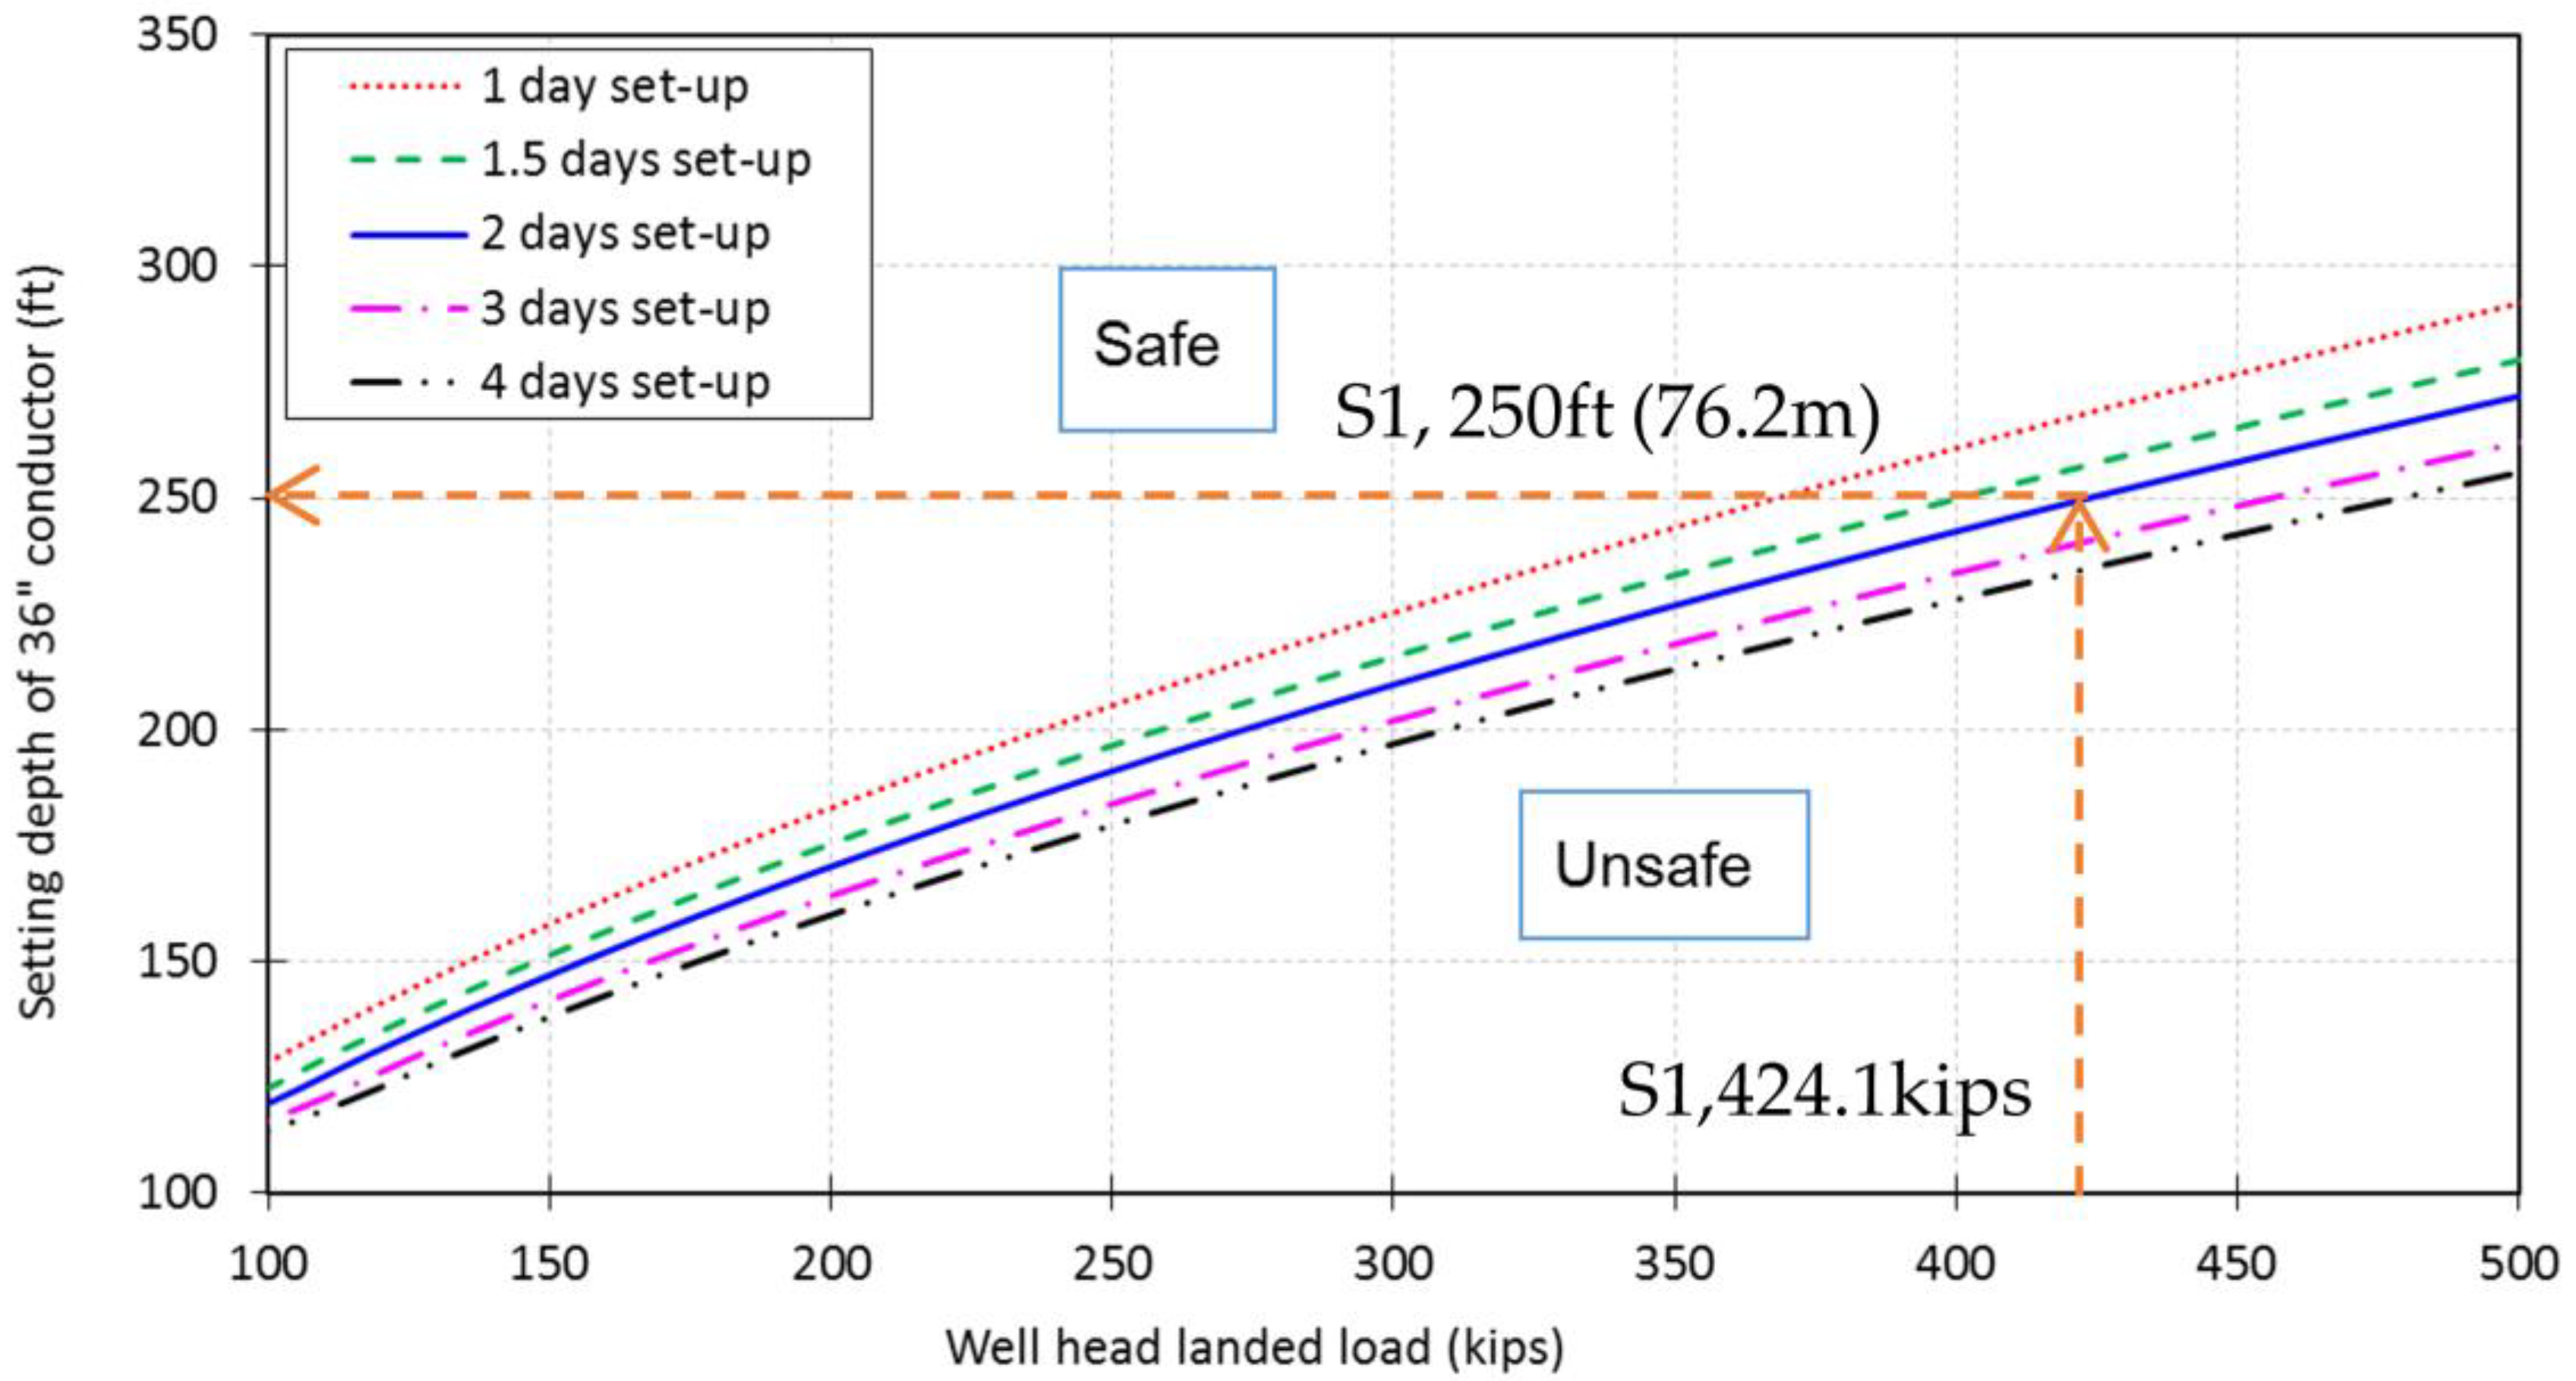
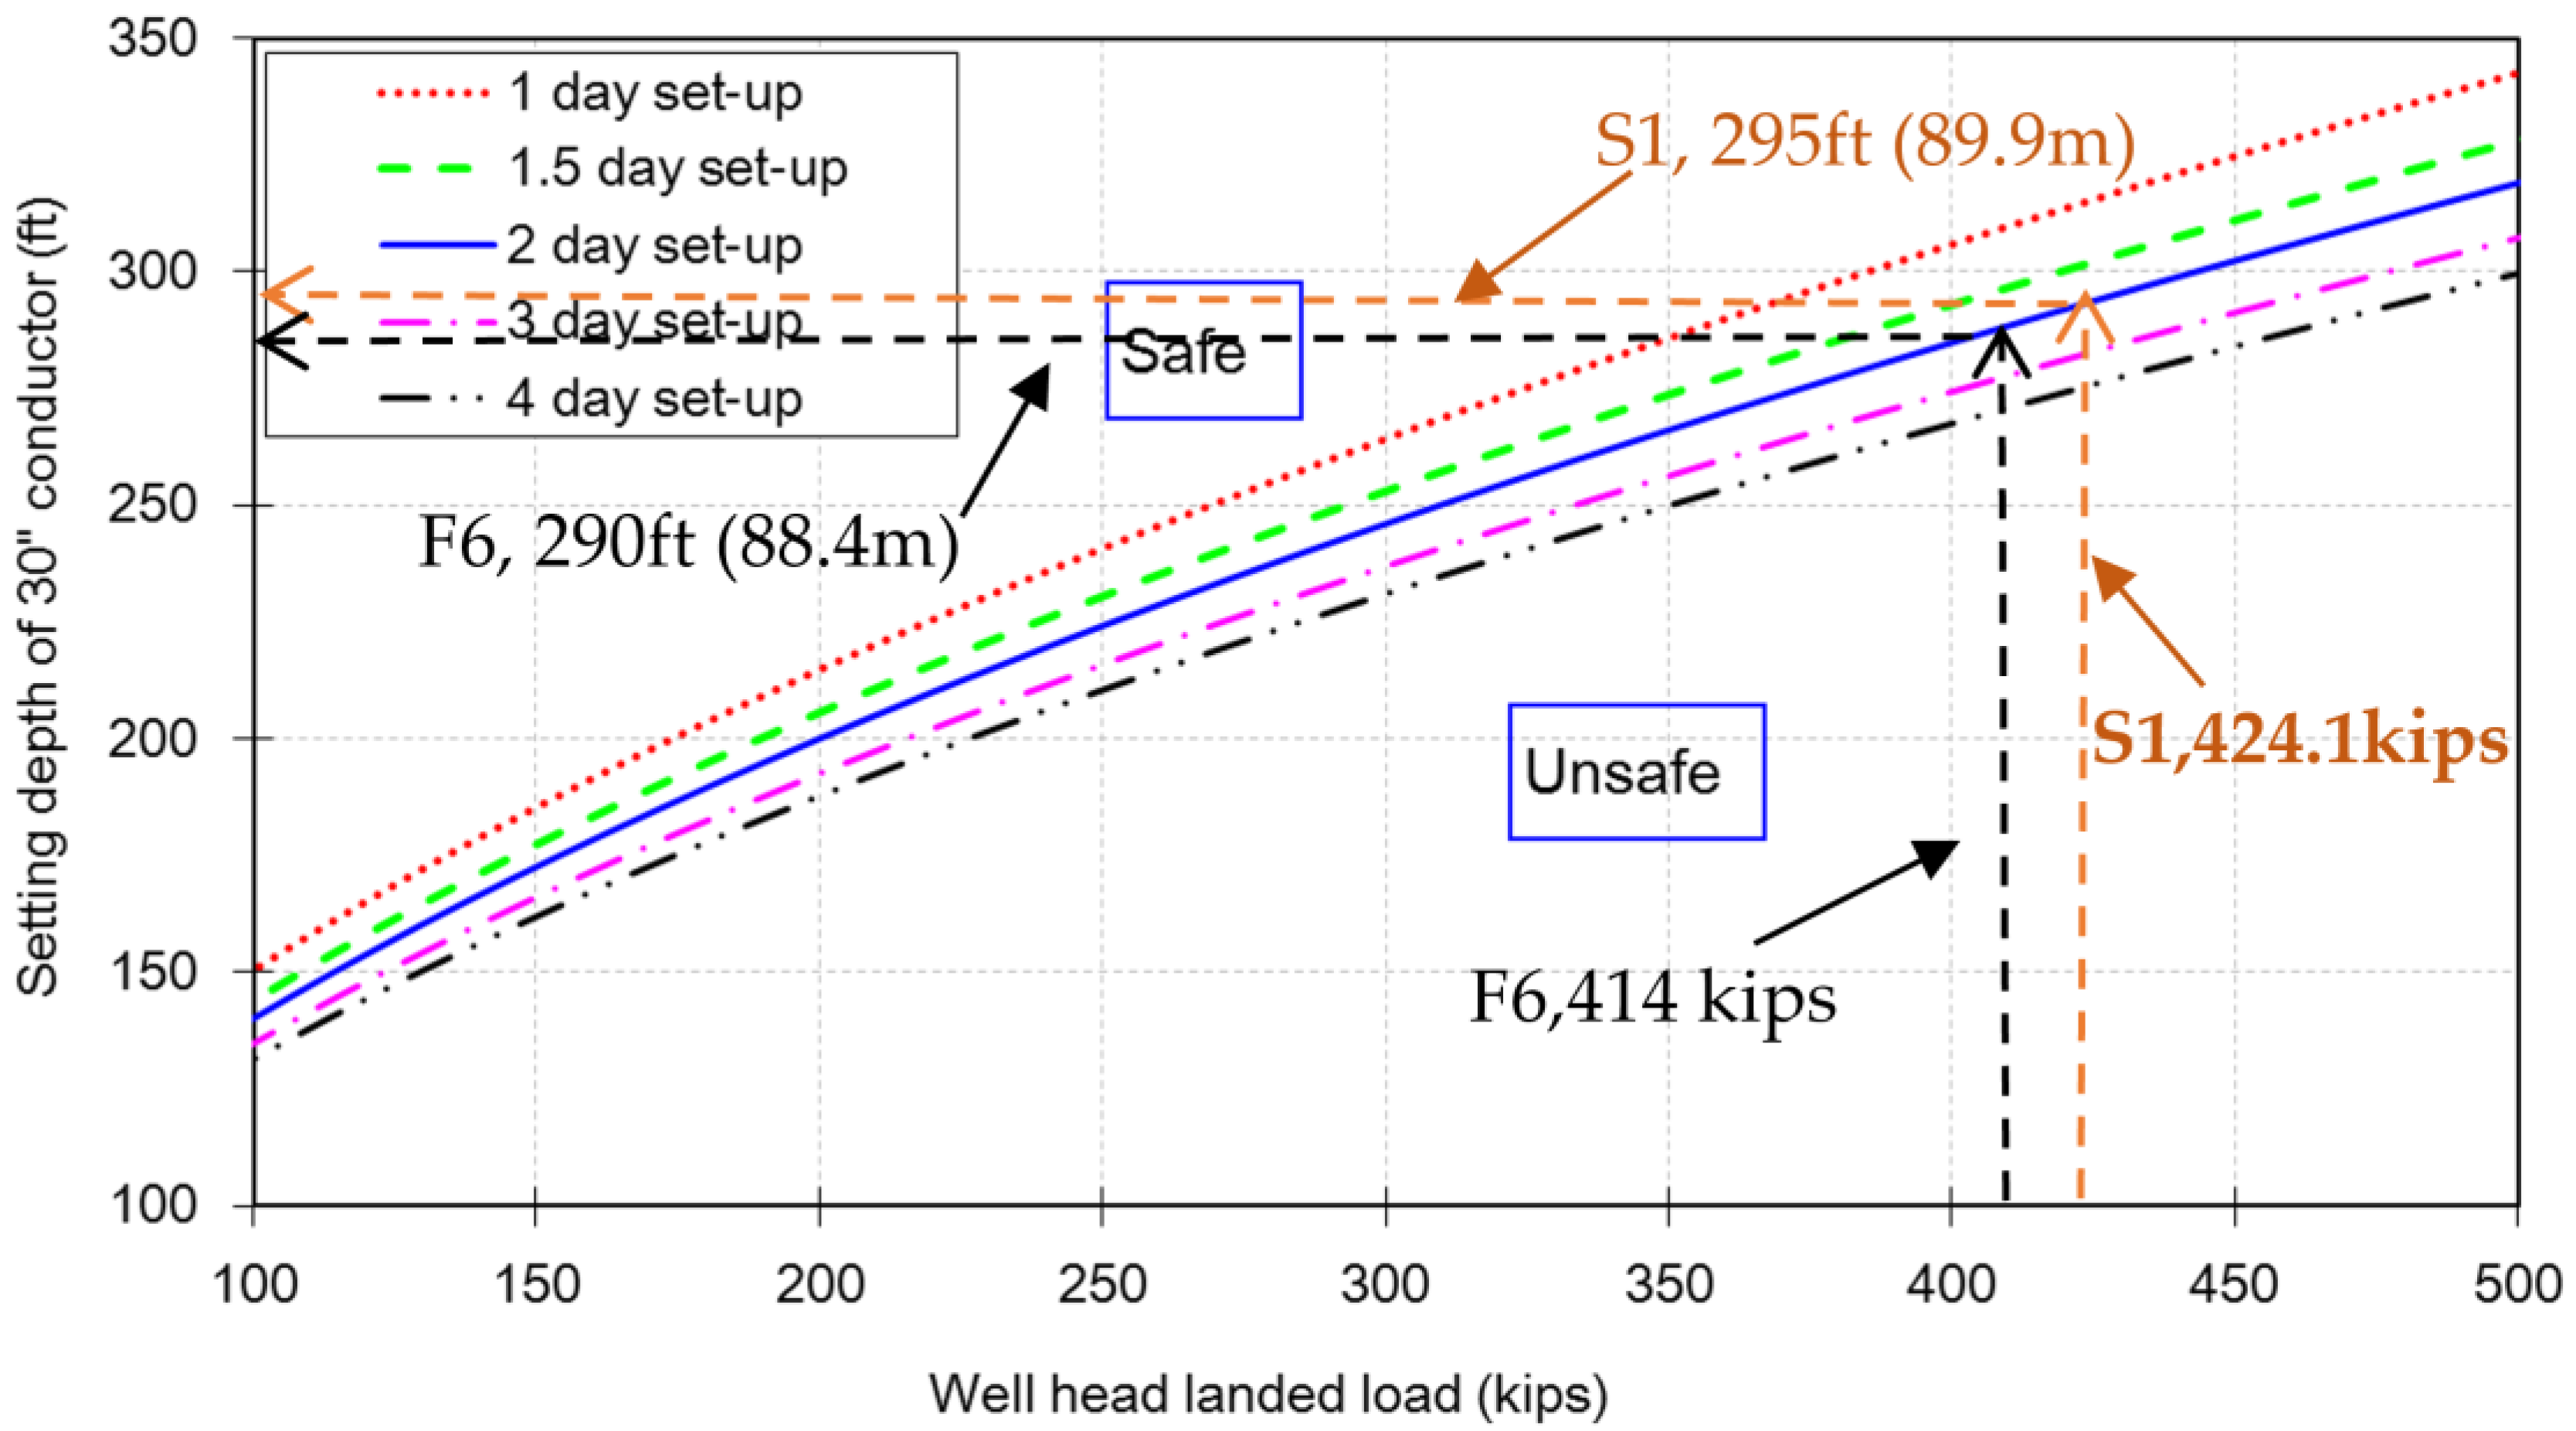
4.2. Jetting Conductor Depth Design According to Different Set-Up Time

Besides the own weight of the conductor and low-pressure wellhead (seen as Q 0 ), the surface conductor baring ability increment during set-up time must be greater than the Δ Q or landed load W l a n d e d . When the conductor diameter is fixed, the jetting depth could be calculated by varying the landed load and the set-up time, as illustrated below (Equation (6)).
Δ Q = W l a n d e d = Δ α t × π D L × S u , REC
36″ conductor setting depth determined according to the well head landed load under different Set-up time are shown in Figure 8. For the S1 well, if the 20″ casing is to be cemented in two days, the jetting depth of 36″ surface conductor that can bear a cementing load of 424.1 kips should be no less than 250 ft (76.2 m).
The 30″ conductor setting depth determined according to the well head landed load under different set-up times are shown in Figure 9. Under the same condition of landed load with 424.1 kips (for the S1 well), if the 20″ casing is to be cemented in two days, the jetting depth of 30″ surface conductor should be no less than 295 ft (89.9 m). Based on this design chart (Figure 9), for an F6 well with a landed load of 414 kips, a 30″ surface conductor setting depth should be about 290 ft (88.4 m). In practice, a 275.6 ft (84 m) setting depth is not sufficient. This can sufficiently explain why the wellhead sink accident occurred during the technical casing cementing operation on F6. For the other three wells of G3, CEIBA-6, and G2 the maximum landed load is 287 kips (G2, Table 1), and the 30″ surface conductor requires a theoretical depth of 240 ft, and a 242.8 ft running depth in practice. Thus, all were successful. These field data above confirm the rationality of the modified model for the Equatorial Guinea deep-water block.
The jetting depth of the surface conductor and set-up period are closely related; the cementing load is directly proportional to the design depth of 20″ casing (see Figure 10). On the other hand, the set-up period is inversely proportional to conductor depth (see Figure 11). Therefore, the relationship between the length of 20″ casing, set-up time and conductor jetting depth can also be determined conveniently by using the flowing charts.

5. Conclusions

A reasonable undrained soil shear strength profile is recommended based on two holes’ soil parameters and the other two ultra-deep-water field data. The shallow soil shear strength profiles decreased with increasing water depth. New modified soil strength recovery model for Equatorial Guinea is developed by using the field drilling data, sunk well F6 was seen as a critical test point for determining the maximum of soil strength recovery factor. The surface conductor setting depth of S1 well were determined based on the new modified model, if the 20″ casing running depth is 1640 ft and the set-up period is 2 days, the jetting depth of 30″ surface conductor should be no less than 295 ft (89.9 m), 36″ conductor need 250 ft (76.2 m). Newly developed charts can sufficiently explain why the wellhead sink accident occurred during 20″ casing cementing operation on F6. The other three wells of G3, CEIBA-6 and G2, surface conductor running depth (242.8 ft) in practice is greater than the theoretical depth of 240 ft, and all were successful. The rationality of the modified model was well confirmed by the field data in the Equatorial Guinea deep-water block.
It needs to be stressed that the soil strength recovery model represents the strength recovery ability of disturbed soil, and it has typical regional characteristics. Equatorial Guinea deep-water shallow soil seems to “recovery more slowly” than that of in Mexico Gulf shallow. Thus, when new developing a new deep-water block in other areas, more attention should be paid to the soil strength recovery properties before drilling operations.

Author Contributions

Conceptualization, W.Y. and J.D.; methodology, W.Y.; software, W.Y.; validation, W.Y., J.D. and H.L. (Hai Lin); formal analysis, X.H.; investigation, W.Y. and S.J.K.; resources, H.L. (Hailong Liu); data curation, W.Y.; writing—original draft preparation, W.Y.; writing—review and editing, X.H. and S.J.K.; visualization, W.Y.; supervision, J.D. and W.Y.; project administration, J.D. and H.L. (Hailong Liu); funding acquisition, J.D. All authors have read and agreed to the published version of the manuscript.

Funding

This research received no external funding.

Institutional Review Board Statement

Not applicable.

Informed Consent Statement

Not applicable.

Data Availability Statement

Data available on request due to restrictions. The data presented in this study are available on request from the corresponding author. The data are not publicly available due to privacy.

Conflicts of Interest

The authors declare no conflict of interest.

References

  1. Xu, G.; Liu, S.; Xie, R.; Tong, G.; Li, C. The development of a new type of deep-water surface conductor joint. In Proceedings of the 29th International Ocean and Polar Engineering Conference, Honolulu, HI, USA, 16–21 June 2019; Volume 2, pp. 1754–1755. [Google Scholar]
  2. Wang, L.; Gao, B.; Hu, T.; Ma, C.; Wang, J. Mechanical analysis of subsea wellhead in deep-water wells. In Proceedings of the 29th International Ocean and Polar Engineering Conference, Honolulu, HI, USA, 16–21 June 2019; Volume 1, pp. 1464–1470. [Google Scholar]
  3. Beck, R.D.; Jackson, C.W.; Hamilton, T.K. Reliable deep-water structural casing installation using control jetting. In Proceedings of the SPE Annual Technical Conference and Exhibition, Dallas, TX, USA, 6–9 October 1991; pp. 75–84. [Google Scholar] [CrossRef]
  4. Jeanjean, P. Innovative Design Method for Deep-water Surface Casings. In Proceedings of the SPE Annual Technical Conference and Exhibition, San Antonio, TX, USA, 29 September–2 October 2002; pp. 241–254. [Google Scholar] [CrossRef]
  5. Akers, T.J. Improving hole quality and casing-running performance in riserless Topholes—Deep-water Angola. SPE/IADC Drill. Conf. Proc. 2008, 2, 684–699. [Google Scholar] [CrossRef]
  6. Yang, J.; Yan, D.; Tian, R.; Zhou, B.; Liu, S.; Zhou, J.; Tang, H. Bit stick-out calculation for the deep-water conductor jetting technique. Pet. Explor. Dev. 2013, 40, 394–397. [Google Scholar] [CrossRef]
  7. Akers, T.J. Jetting of structural casing in deep-water environments: Job design and operational practices. SPE Drill. Complet. 2008, 23, 29–40. [Google Scholar] [CrossRef]
  8. Wang, T.; Song, B. Study on deep-water conductor jet excavation mechanism in cohesive soil. Appl. Ocean Res. 2019, 82, 225–235. [Google Scholar] [CrossRef]
  9. Hui, Z.; Deli, G.; Haixiong, T. Landing string design and strength check in ultra-deep-water condition. J. Nat. Gas Sci. Eng. 2010, 2, 178–182. [Google Scholar] [CrossRef]
  10. Deng, S.; Liu, Y.; Jiang, P.; Zhu, S.; Tao, L.; He, Y. Simulation and experimental study of deep-water subsea wellhead-shallow casing deflection considering system mass force. Ocean Eng. 2019, 187, 106222. [Google Scholar] [CrossRef]
  11. Kan, C.; Yang, J.; Yu, X.; Dong, T.; Wu, X.; Liu, M.; Li, C.; Zhang, C.; Fu, J. Load bearing characteristics study on novel deep-water composite drilling conductor by simulation and experimental methods. J. Pet. Sci. Eng. 2018, 171, 289–301. [Google Scholar] [CrossRef]
  12. Zhou, B.; Yang, J.; Liu, Z.; Luo, J.; Ye, J.; Chen, B.; Liu, S.; Zhou, J. Design of conductor soaking time in deep-water drilling. Pet. Explor. Dev. 2014, 41, 257–261. [Google Scholar] [CrossRef]
  13. Wang, B.; van Rhee, C.; Nobel, A.; Keetels, G. Modeling the hydraulic excavation of cohesive soil by a moving vertical jet. Ocean Eng. 2021, 227, 108796. [Google Scholar] [CrossRef]
  14. Su, K.; Guan, Z.; Su, Y. Determination method of conductor setting depth using jetting drilling in deep-water. J. China Univ. Pet. Ed. Nat. Sci. 2008, 4, 47–50. [Google Scholar]
  15. Yan, W.; Chen, Z.J.; Deng, J.G.; Zhu, H.Y.; Deng, F.C.; Liu, Z.L. Numerical method for subsea wellhead stability analysis in deep-water drilling. Ocean Eng. 2015, 98, 50–56. [Google Scholar] [CrossRef]
Figure 1. Subsea wellhead structure.
Energies 14 04940 g001
Figure 2. The profile of average shear strength based on SO1 and SO2 holes.
Energies 14 04940 g002
Figure 3. Shallow soil undrained shear strength under different water depth.
Energies 14 04940 g003
Figure 4. Schematic of soil strength recovery factor test method.
Energies 14 04940 g004
Figure 5. Soil strength recovery models in Equatorial Guinea derived from the field data.
Energies 14 04940 g005
Figure 6. Comparison of soil strength recovery model in the Gulf of Mexico and Equatorial Guinea.
Energies 14 04940 g006
Figure 7. Landed load analysis during the cementing operation of 20″ casing.
Energies 14 04940 g007
Figure 8. Landed weight vs. setting depth of 36″ surface conductor.
Energies 14 04940 g008
Figure 9. Landed weight vs setting depth of 30″ surface conduit.
Energies 14 04940 g009
Figure 10. The relationship between 20″ casing’s design depth and surface conductor setting depth (set-up time is two days).
Energies 14 04940 g010
Figure 11. The relationship curve between set-up period and surface conductor setting depth (20″ casing @500 m, landed load is 424 kips).
Energies 14 04940 g011
Table 1. Summary of drilling data from Equatorial Guinea deep-water.
WellDepth of Surface Conductor (ft)Outer Diameter of Conductor (in)Set-Up Time (Day)ΔQ(Kips) Δ α t Remarks
G3242.8301.982620.0998success
CEIBA-6242.8302.192770.1055success
G2242.8302.42870.1093success
F6275.6302.314140.1232subsidence
Table 2. Parameters for landed load calculation.
No.ItemValue
1Weight of 20″ casing129.33 lbs/ft
2Weight of 5–1/2″drillnig string3004.91 lb
3Design depth of 20″ casing1640.4 ft
4Liquid cement density11.5 ppg
5Distance between the end of cementing string and the 20″ casing shoe 49.2 ft
6Sea water density8.8 ppg
Publisher’s Note: MDPI stays neutral with regard to jurisdictional claims in published maps and institutional affiliations.

