
Technical Efficiency and Productivity Change in the European Union with Undesirable Output Considered


Abstract
:
1. Introduction
2. Conceptual Background with Literature Review
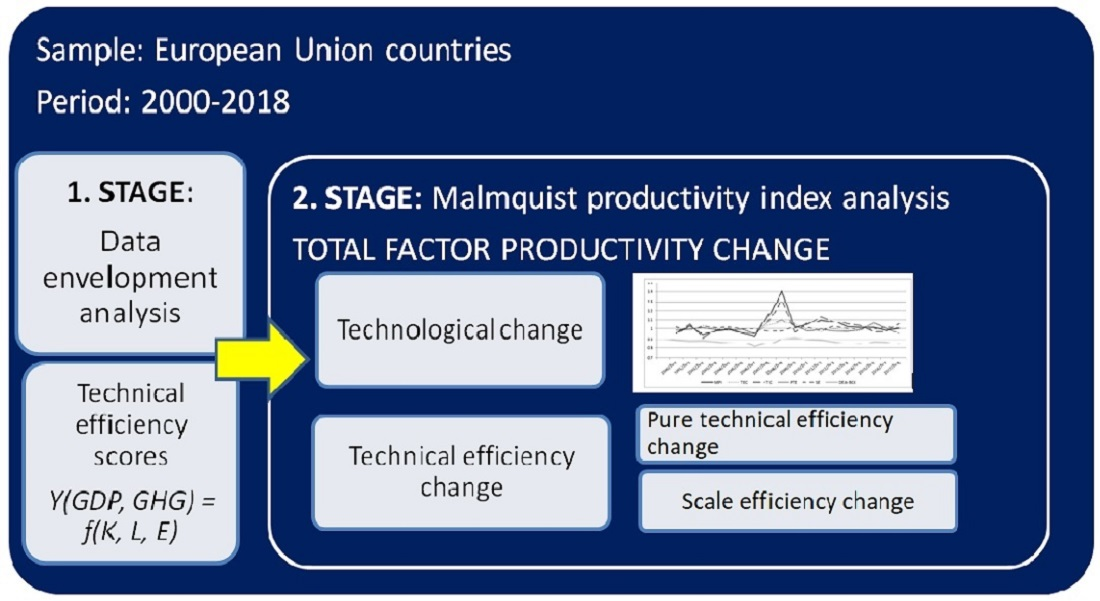
3. Methods and Data
3.1. Methods
3.2. Data
4. Results with Discussion
4.1. Preliminary Analysis
4.2. Measuring Efficiency and Productivity Change
5. Conclusions
Funding
Data Availability Statement
Conflicts of Interest
Appendix A

| Variable | GDP | GHG | K | L | E |
|---|---|---|---|---|---|
| GDP | 1 | ||||
| GHG | 0.9464 * | 1 | |||
| K | 0.9893 * | 0.9403 * | 1 | ||
| L | 0.9663 * | 0.9806 * | 0.9594 * | 1 | |
| E | 0.9812 * | 0.9800 * | 0.9815 * | 0.9845 * | 1 |
References
- Ancev, T.; Azad, M.A.S.; Akter, M. Environmentally adjusted productivity and efficiency: A review of concepts, methods and empirical work. In New Direction in Productivity Measurement and Efficiency Analysis, Counting the Environment and Natural Resources; Ancev, T., Azad, M.A.S., Hernandez-Sancho, F., Eds.; Edward Elgar: Cheltenham, UK, 2017; pp. 9–58. [Google Scholar]
- European Commission. A Roadmap for Moving to a Competitive Low Carbon Economy in 2050, COM/2011/0112 Final; European Commission: Brussels, Belgium, 2011. [Google Scholar]
- European Commission. A Policy Framework for Climate and Energy in the Period from 2020 to 2030, COM/2014/015 Final; European Commission: Brussels, Belgium, 2014. [Google Scholar]
- European Parliament. Greenhouse Gas Emissions by Country and Sector (Infographic), News, 17 October 2019. Available online: https://www.europarl.europa.eu/news/en/headlines/society/20180301STO98928/greenhouse-gas-emissions-by-country-and-sector-infographic (accessed on 20 May 2020).
- European Environment Agency (EEA). Renewables Helping to Reduce Greenhouse Gas Emissions across the EU, 24 April 2017. Available online: https://www.connect4climate.org/article/renewables-eu-energy-helping-reduce-greenhouse-gas-emissions (accessed on 20 May 2020).
- Hua, Z.; Bian, Y. DEA with undesirable factors. In Modeling Data Irregularities and Structural Complexities in Data Envelopment Analysis; Zhu, J., Cook, W.D., Eds.; Springer: Boston, MA, USA, 2007; pp. 103–121. [Google Scholar]
- Parmeter, C.F.; Kumbhakar, S.C. Efficiency analysis: A primer on recent advances. Found. Trends Econom. 2014, 7, 191–385. [Google Scholar] [CrossRef]
- Gokgoz, F.; Turkoglu, S.P. Investigating the energy efficiencies of OECD countries via a slack-based undesirable output model. Econ. Policy Energy Environ. 2018, 73–94. [Google Scholar] [CrossRef]
- Shen, Z.; Boussemart, J.-P.; Leleu, H. Aggregate green productivity growth in OECD’s countries. Int. J. Prod. Econ. 2017, 189, 30–39. [Google Scholar] [CrossRef] [Green Version]
- Gehringer, A.; Martinez-Zarzoso, I.; Nowak, N.; Danziger, L. The determinants of total factor productivity in the EU: Insights from sectoral data and common dynamic processes. Econ. Model. 2013, 5343. Available online: https://econpapers.repec.org/paper/ekd004912/5343.htm (accessed on 20 May 2020).
- Chang, M.-C.; Yu, C.-H. Estimation of energy productivity change in Baltic Sea and EU non-Baltic Sea states. Balt. J. Econ. 2016, 17, 78–102. [Google Scholar] [CrossRef] [Green Version]
- Mahlberg, B.; Luptacik, M.; Sahoo, B. Examining the drivers of total factor productivity change with an illustrative example of 14 EU countries. Ecol. Econ. 2011, 72, 60–69. [Google Scholar] [CrossRef]
- Picazo-Tadeo, A.J.; Castillo-Giménez, J.; Beltrán-Esteve, M. An intertemporal approach to measuring environmental per-formance with directional distance functions: Greenhouse gas emissions in the European Union. Ecol. Econ. 2014, 100, 173–182. [Google Scholar] [CrossRef]
- Beltran-Esteve, M.; Picazo-Tadeo, A.J. Assessing environmental performance in the European Union: Eco-innovation versus catching-up. Energy Policy 2017, 104, 240–252. [Google Scholar] [CrossRef]
- Wang, L.-W.; Le, K.-D. Energy Efficiency and Improvement European countries: Data Envelopment Analysis approach. Int. J. Sci. Res. Publ. (IJSRP) 2019, 9. [Google Scholar] [CrossRef]
- Caves, R.; Christensen, I.; Diewert, W.E. The economic theory of index numbers and the measurement of input, output and productivity. Econometrica 1982, 50, 1414. [Google Scholar] [CrossRef]
- Färe, R.; Grosskopf, S.; Norris, M.; Zhang, Z. Productivity growth, technical progress, and efficiency change in industrialized countries. Am. Econ. Rev. 1994, 84, 66–83. [Google Scholar]
- Kurz, H.D.; Salvatori, N. Theory of Production—A Long Period Analysis; Cambridge University Press: Cambridge, MA, USA, 1995. [Google Scholar]
- Farrell, M.J. The measurement of productive efficiency. J. R. Stat. Soc. 1957, 120, 253–290. [Google Scholar] [CrossRef]
- Stern, D.I. The Role of Energy in Economic Growth; Taylor & Francis: Oxfordshire, UK, 2011; pp. 35–47. [Google Scholar]
- Makridou, G.; Andriosopoulos, K.; Doumpos, M.; Zopounidis, C. A two-stage approach for energy efficiency analysis in Eu-ropean Union countries. Energy 2015, 36, 47–69. [Google Scholar]
- Duman, Y.S.; Kasman, A. Environmental technical efficiency in EU member and candidate countries: A parametric hyperbolic distance function approach. Energy 2018, 147, 297–307. [Google Scholar] [CrossRef]
- Halkos, G.; Petrou, K.N. Testing undesirable output in DEA: A critical review. Econ. Anal. Policy 2019, 62, 97–104. [Google Scholar] [CrossRef]
- Huppes, G.; Ishikawa, M. Eco-efficiency and Its Terminology. J. Ind. Ecol. 2005, 9, 43–46. [Google Scholar] [CrossRef]
- Gu, W.; Hussain, J.; Willox, M. Environmentally Adjusted Multifactor Productivity Growth for the Canadian Manufacturing Sector; Analytical Studies Branch Research Paper Series; Research Gate: Berlin, Germany, 2019. [Google Scholar]
- Jahan, H.; Ancev, T. Environmentally adjusted efficiency of shrimp farming in Bangladesh. In New Direction in Productivity Measurement and Efficiency Analysis, Counting the Environment and Natural Resources; Ancev, T., Azad, M.A.S., Hernandez-Sancho, F., Eds.; Edward Elgar: Cheltenham, UK, 2017; pp. 249–274. [Google Scholar]
- Rodríguez, M.C.; Haščič, I.; Souchier, M. Environmentally Adjusted Multifactor Productivity: Methodology and Empirical Results for OECD and G20 Countries. Ecol. Econ. 2018, 153, 147–160. [Google Scholar] [CrossRef]
- Beltran-Esteve, M.; Gimenez, V.; Picazo-Tadeo, A. Environmental productivity in the European Union: A global Luen-berger-metafrontier approach. Sci. Total Environ. 2019, 692, 136–146. [Google Scholar] [CrossRef] [PubMed]
- Wang, J.; Wang, K.; Shi, X.; Wei, Y.M. Spatial heterogeneity and driving forces of environmental productivity growth in China: Would it help to switch pollutant discharges fee to environmental taxes? J. Clean. Prod. 2019, 223, 36–44. [Google Scholar] [CrossRef]
- Sun, H.; Kporsu, A.K.; Taghizadeh-Hesary, F.; Edziah, B.K. Estimating environmental efficiency and convergence: 1980 to 2016. Energy 2020, 208, 118224. [Google Scholar] [CrossRef]
- Woo, C.; Chung, Y.; Chun, D.; Seo, H.; Hong, S. The static and dynamic environmental efficiency of renewable energy: A Malmquist index analysis of OECD countries. Renew. Sustain. Energy Rev. 2015, 47, 367–376. [Google Scholar] [CrossRef]
- Prokop, V.; Stejskal, J.; Kuba, O. Effective financing of environmentally adjusted productivity growth in sustainable development framework: An international comparative study. Eur. J. Sustain. Dev. 2012, 8, 172. [Google Scholar] [CrossRef]
- Desli, E. Convergence and efficiency: Evidence from the EU-15. J. Post Keynes. Econ. 2009, 31, 403–430. [Google Scholar] [CrossRef]
- Vlahinic-Dizdarevic, N.; Segota, A. Total-factor energy efficiency in the EU countries. Zb. Rad. Ekon. Fak. Rij. 2012, 30, 247–265. [Google Scholar]
- Lacko, R.; Hajduová, Z. Determinants of Environmental Efficiency of the EU Countries Using Two-Step DEA Approach. Sustainability 2018, 10, 3525. [Google Scholar] [CrossRef] [Green Version]
- Vlahnic Lenz, N.; Segota, A.; Maradin, D. Total-factor energy efficiency in EU: Do environmental impacts matter? Int. J. Energy Policy 2018, 8, 92–96. [Google Scholar]
- Hsieh, J.-C.; Lu, C.-C.; Li, Y.; Chiu, Y.-H.; Xu, Y.-S. Environmental Assessment of European Union Countries. Energies 2019, 12, 295. [Google Scholar] [CrossRef] [Green Version]
- Charnes, A.; Cooper, W.W.; Rhodes, E. Measuring the efficiency of decision making units. Eur. J. Oper. Res. 1978, 2, 429–444. [Google Scholar] [CrossRef]
- Emrouznejad, A.; Yang, G.-L. A survey and analysis of the first 40 years of scholarly literature in DEA: 1978–2016. Socio-Econ. Plan. Sci. 2018, 61, 4–8. [Google Scholar] [CrossRef]
- Banker, R.D.; Charnes, A.; Cooper, W.W. Some Models for Estimating Technical and Scale Inefficiencies in Data Envelopment Analysis. Manag. Sci. 1984, 30, 1078–1092. [Google Scholar] [CrossRef] [Green Version]
- Seiford, L.M.; Zhu, J. Modeling undesirable factors in efficiency evaluation. Eur. J. Oper. Res. 2002, 142, 16–20. [Google Scholar] [CrossRef]
- Eurostat. Database on Energy, Luxembourg. 2020. Available online: http://ec.europa.eu/eurostat/web/energy/data/main-tables (accessed on 16 January 2020).
- Sarkins, J. Preparing Your Data in DEA. In Modeling Data Irregularities and Structural Complexities in DEA; Zhu, J., Cook, W.D., Eds.; Springer: Boston, MA, USA, 2007; pp. 305–320. [Google Scholar]
- Krüger, J.J. The global trends of total factor productivity: Evidence from the nonparametric Malmquist index approach. Oxf. Econ. Pap. 2003, 55, 265–286. [Google Scholar] [CrossRef] [Green Version]
- Draghi, M. The Productivity Challenge for Europe, Speeches, European Central Bank 2016. 30 November 2016. Available online: https://www.ecb.europa.eu/press/key/date/2016/html/sp161130_1.en.html (accessed on 20 October 2018).
- Montinho, V.; Madaleno, M.; Robaina, M. The economic and environmentally efficiency assessment in EU cross-country: Evidence from DEA and quantile regression approach. Ecol. Indic. 2017, 78, 85–97. [Google Scholar] [CrossRef]
- Morley, B. Empirical evidence on the effectiveness of environmental taxes. Appl. Econ. Lett. 2012, 19, 1817–1820. [Google Scholar] [CrossRef] [Green Version]
- Borozan, D. Efficiency of energy taxes and the validity of the residential electricity environmental Kuznets curve in the European Union. Sustainability 2018, 10, 2464. [Google Scholar] [CrossRef] [Green Version]
- Kortelainen, M. Dynamic environmental performance analysis: A Malmquist index approach. Ecol. Econ. 2008, 64, 701–715. [Google Scholar] [CrossRef]
- Chertow, M.R.; Ashton, W.S.; Espinosa, J.C. Industrial Symbiosis in Puerto Rico: Environmentally related agglomeration economies. Reg. Stud. 2008, 42, 1299–1312. [Google Scholar] [CrossRef]
- Han, F.; Xie, R.; Lu, Y.; Fang, J.; Liu, Y. The effects of urban agglomeration economies on carbon emissions: Evidence from Chinese cities. J. Clean. Prod. 2018, 172, 1096–1110. [Google Scholar] [CrossRef]
- Lozano, S.; Gutierrez, E. Non-parametric frontier approach to modelling the relationships among population, GDP, energy consumption and CO2 emissions. Ecol. Econ. 2008, 66, 687–699. [Google Scholar] [CrossRef]
- Baldwin, A.; Bax, H.J.; Lhermitte, M. How Can Europe Raise Its Game? EV Attractiveness Survey Europe 2020. 2019. Available online: https://www.ey.com/en_gl/attractivenessss (accessed on 15 December 2019).
- Pan, H.; Page, J.; Cong, C.; Barthel, S.; Kalantari, Z. How ecosystem services driven urban growth: Integrating nature-based solutions. Anthropocene 2021, 35, 100297. [Google Scholar] [CrossRef]
| Variable | Variable Description | Symbol | Obs | Mean | Std. Dev. | Min. | Max. |
|---|---|---|---|---|---|---|---|
| Output | Real GDP (in billions of euros at 2015 constant prices), calculation based on nominal GDP [TEC00001] | GDP | 532 | 501.83 | 769.74 | 6.08 | 3215.74 |
| GHG emissions (in million tons) [env_air_gge] | GHG | 532 | 176.82 | 235.88 | 2.27 | 1079.27 | |
| Input | Capital stock (in billions of euros at 2015 constant prices), calculation based on gross fixed capital formation [TEC00011] | K | 532 | 107.59 | 159.09 | 1.08 | 707.64 |
| Total number of employed workers (in million persons) [TEC00112] | L | 532 | 8.04 | 10.43 | 0.15 | 44.85 | |
| Total final energy consumption (in million TOE) [TEN00124] | E | 532 | 40.75 | 53.95 | 0.37 | 223.81 |
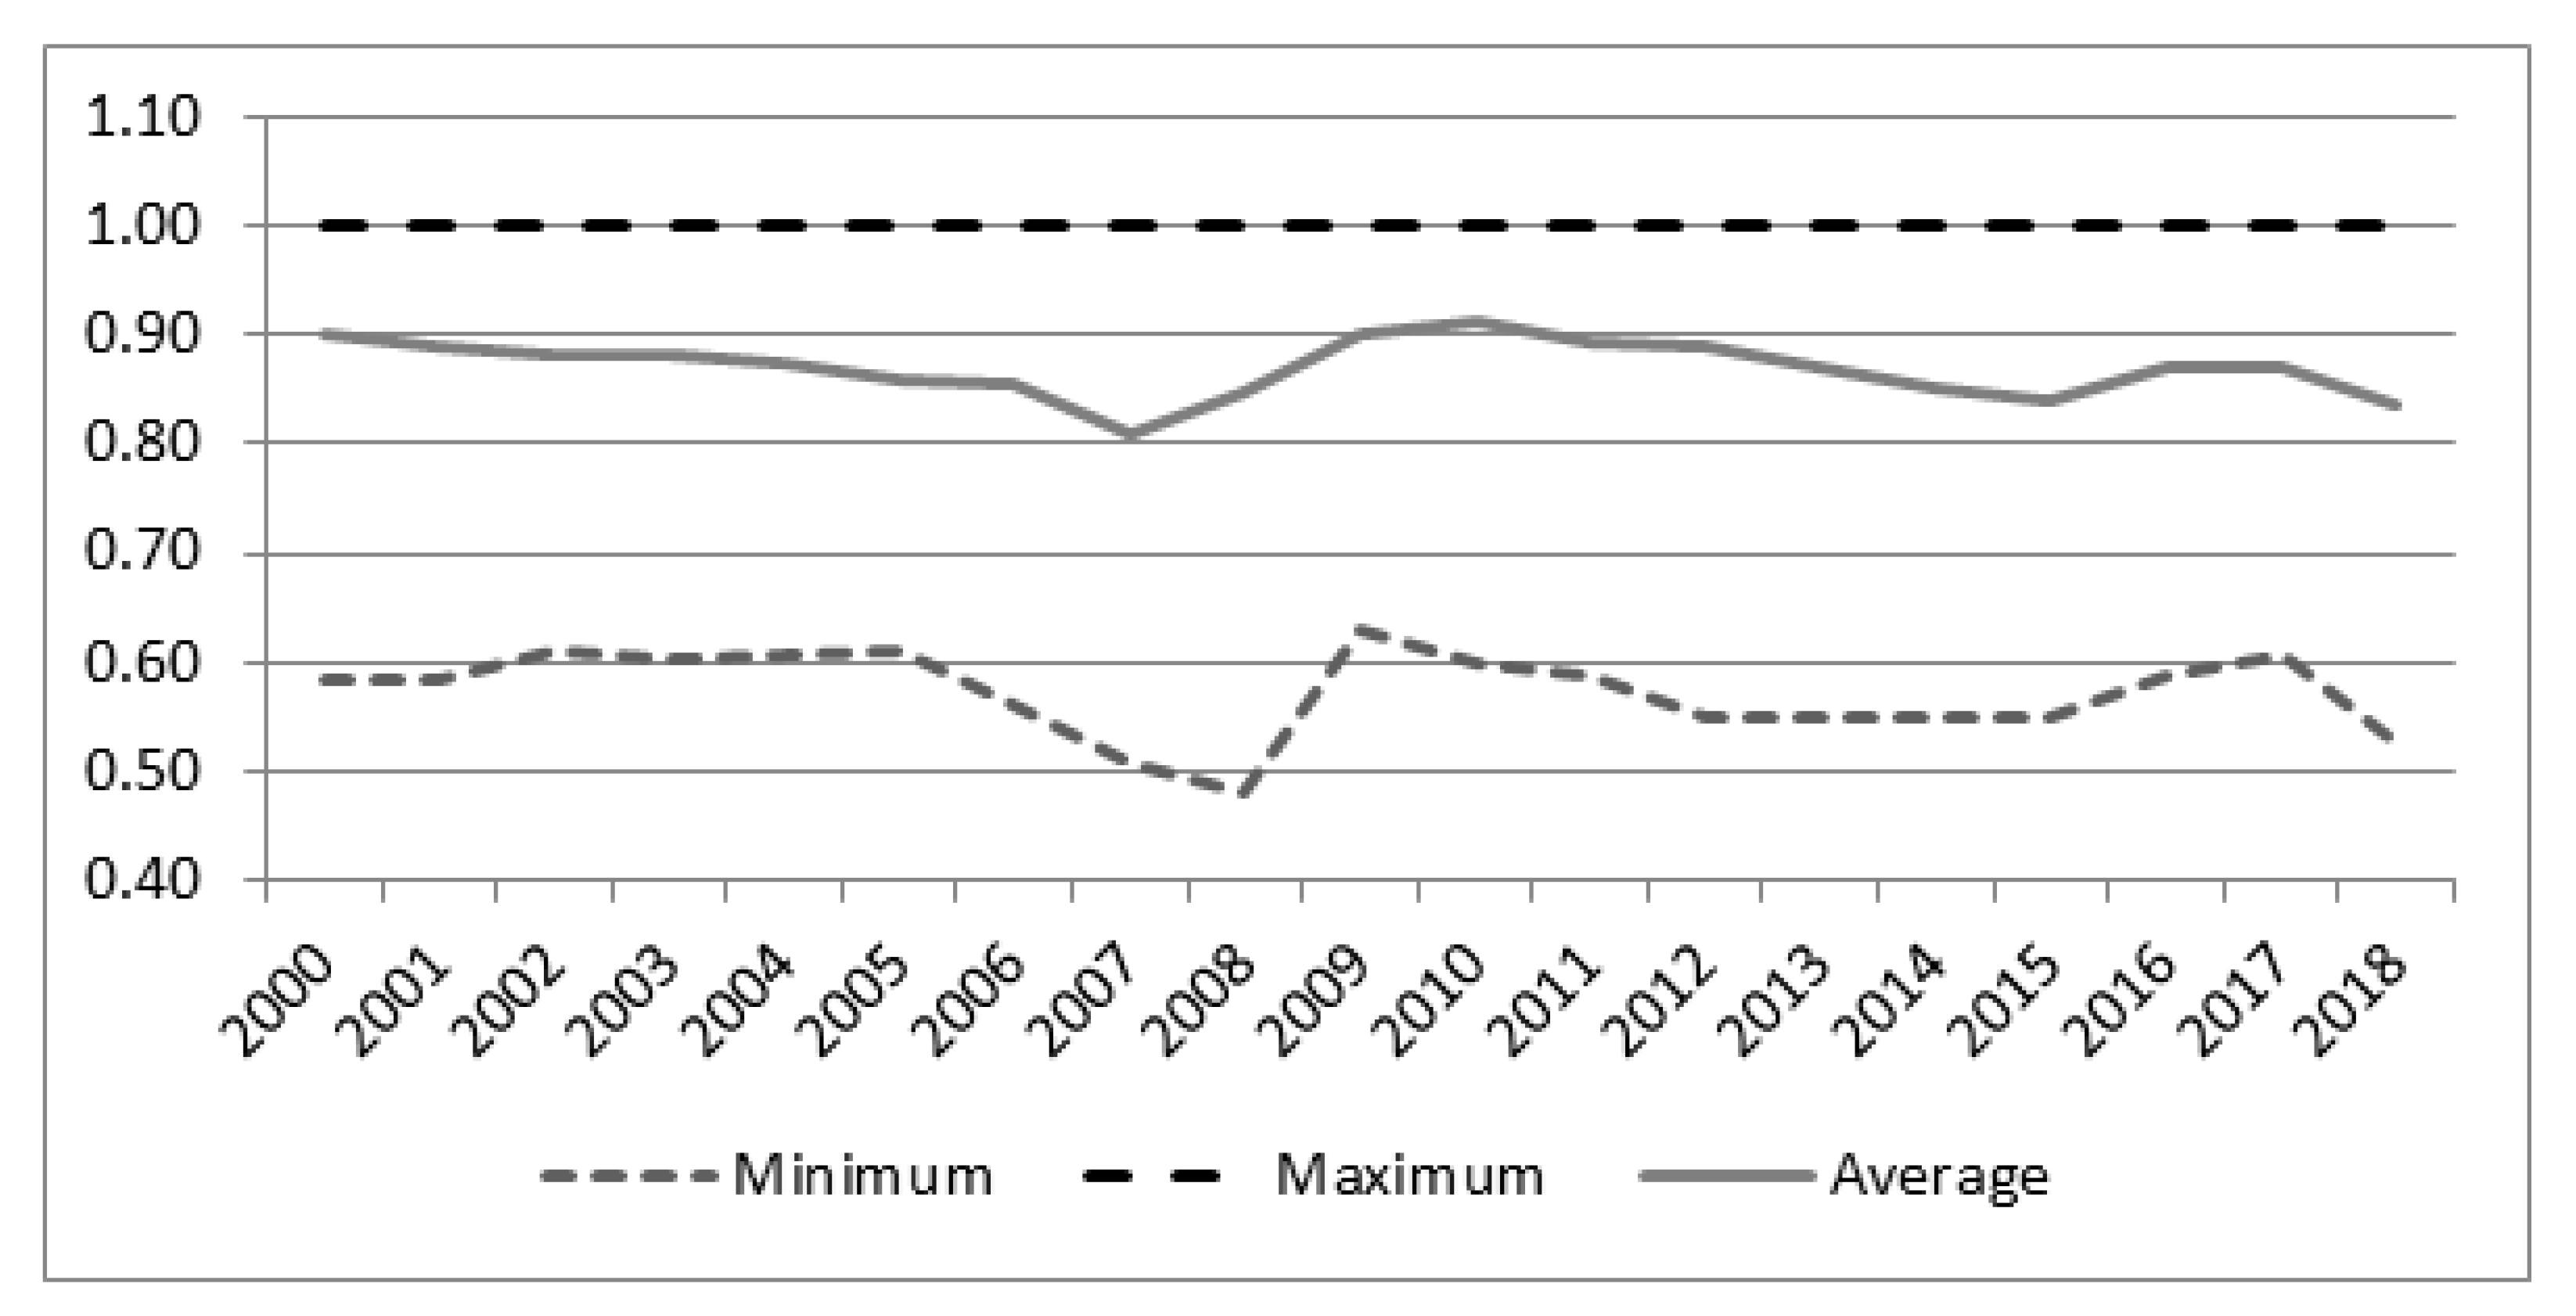
| 2000–2018 | ||||||||
| Model 1: Y(GDP) = f(K, L) | Model 2: Y(GDP, GHG) = f(K, L, E) | |||||||
| Min | Max | Aver | SD | Min | Max | Aver | SD | |
| Min | 0.467 | 0.605 | 0.550 | 0.037 | 0.478 | 0.631 | 0.572 | 0.040 |
| Max | 1.000 | 1.000 | 1.000 | 0.000 | 1.000 | 1.000 | 1.000 | 0.000 |
| Aver | 0.781 | 0.866 | 0.826 | 0.024 | 0.811 | 0.914 | 0.871 | 0.026 |
| SD | 0.126 | 0.189 | 0.152 | 0.020 | 0.114 | 0.180 | 0.145 | 0.020 |
| 2007–2018 | ||||||||
| Model 3: Y(GDP, GHG) = f(K, L, E) | ||||||||
| Min | 0.478 | 0.631 | 0.560 | 0.044 | ||||
| Max | 1.000 | 1.000 | 1.000 | 0.000 | ||||
| Aver | 0.811 | 0.914 | 0.867 | 0.030 | ||||
| SD | 0.114 | 0.180 | 0.153 | 0.021 | ||||
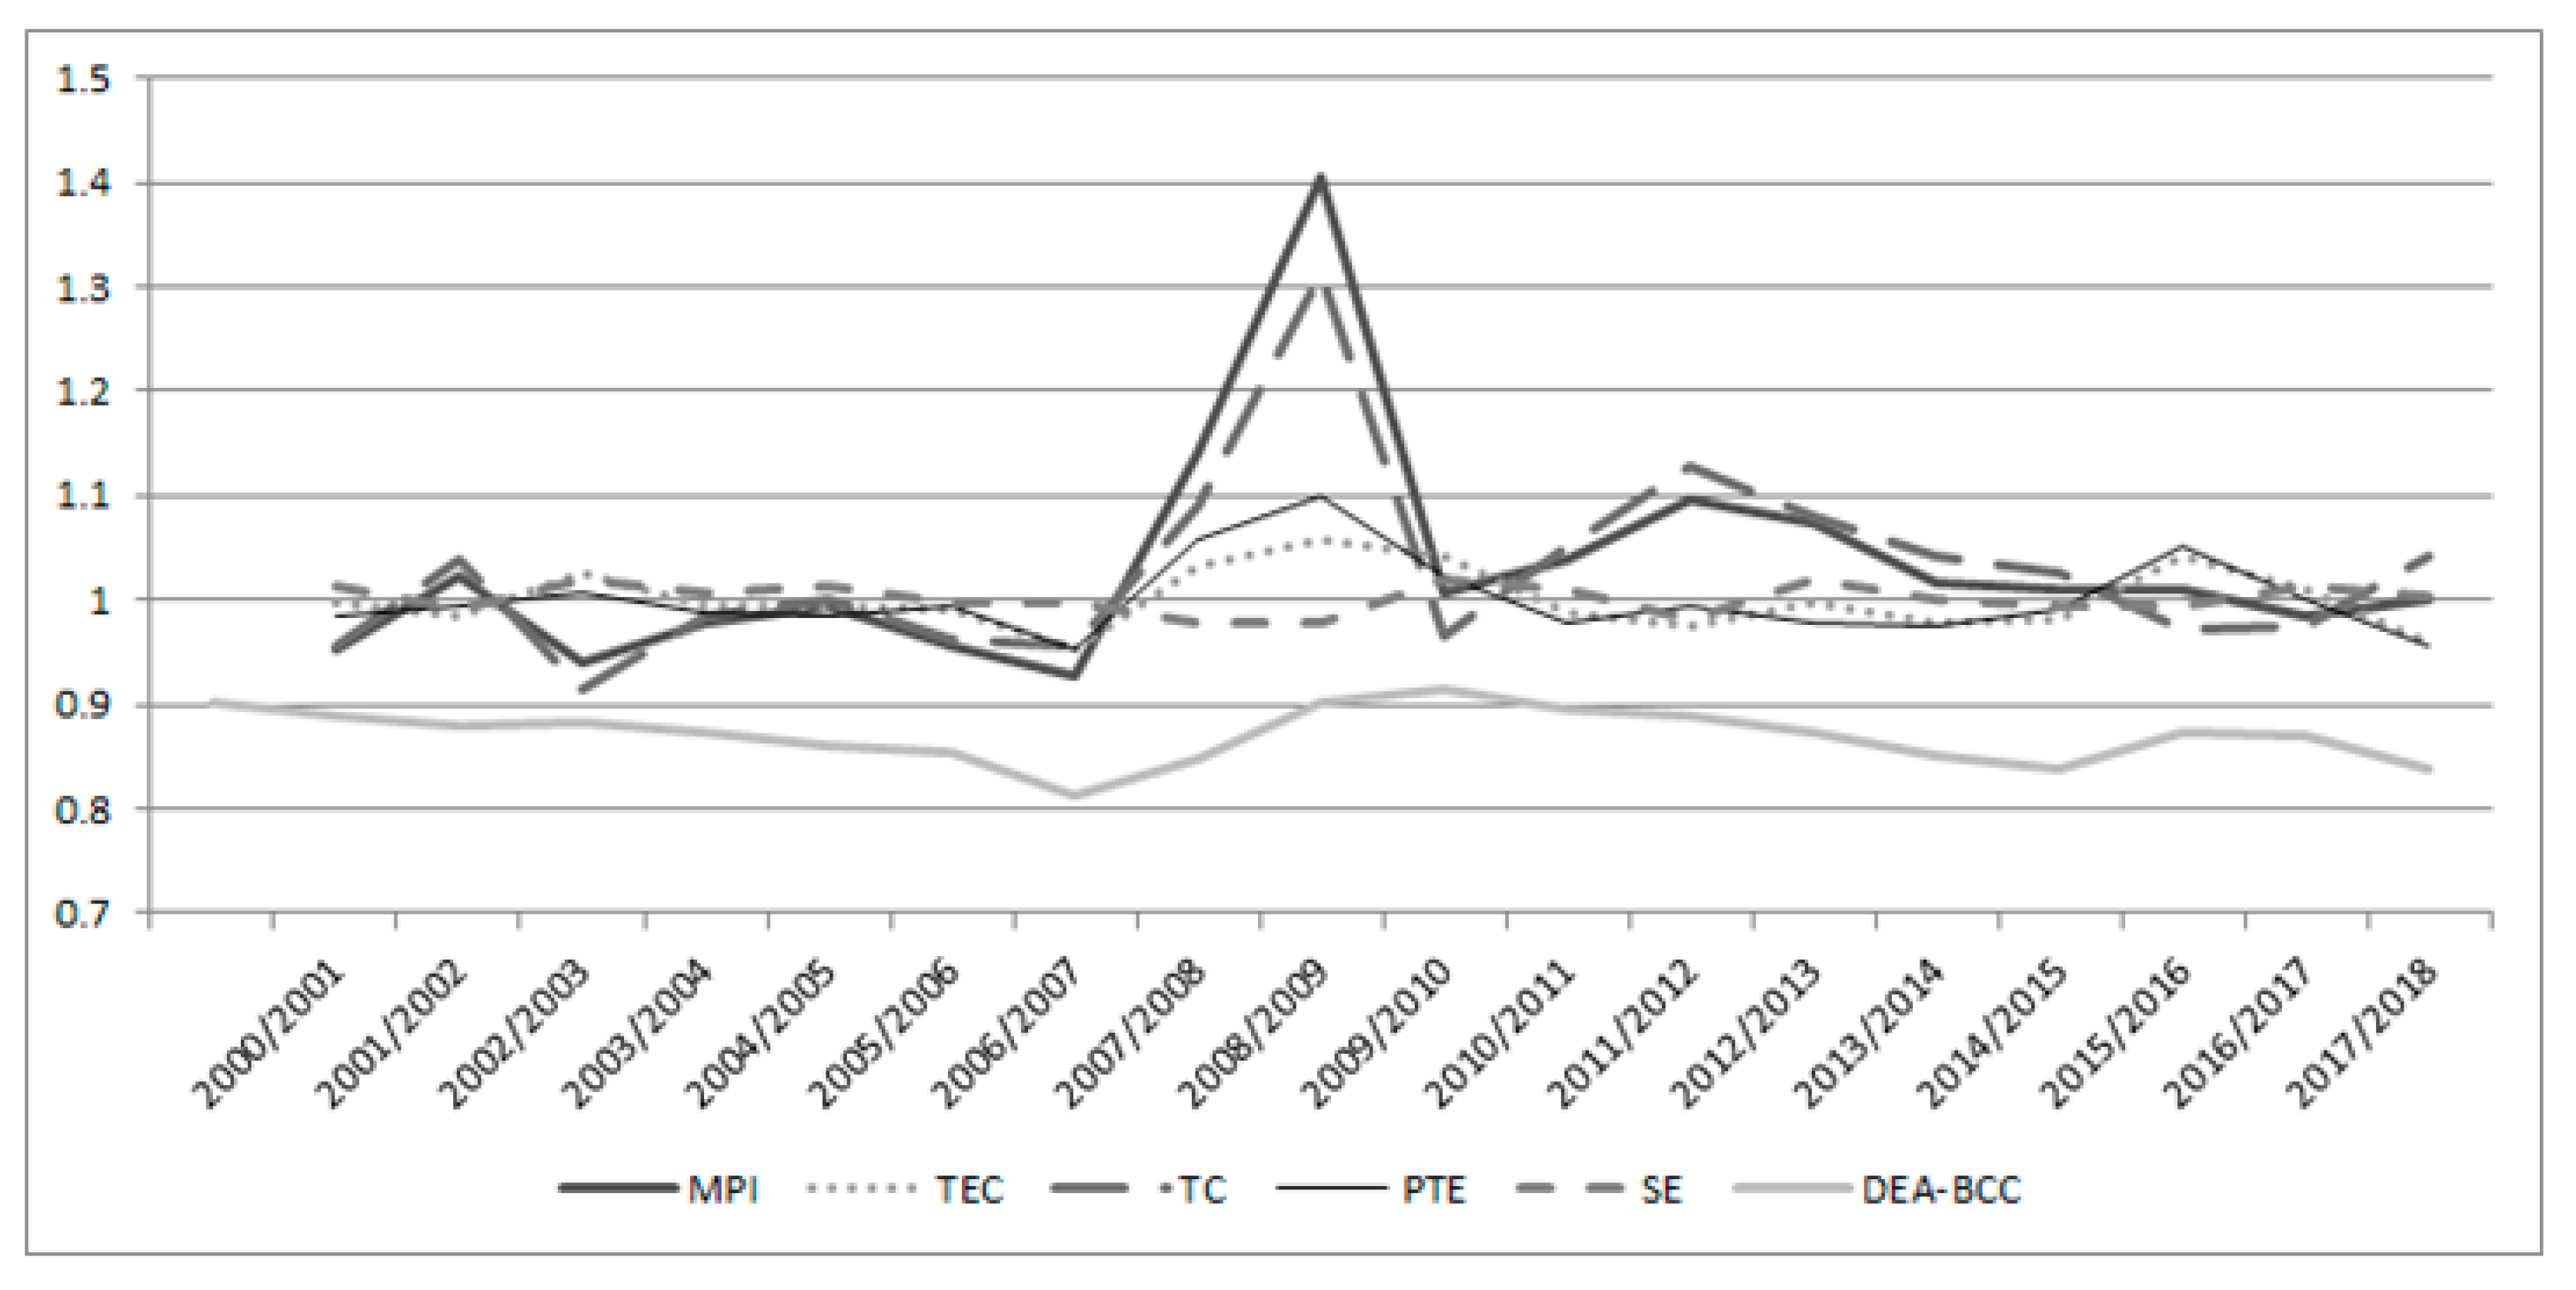
| Index | Model 2: Y(GDP, GHG) = f(K, L, E) | ||||
|---|---|---|---|---|---|
| Minimum | Maximum | Average | Standard Deviation | Compound Growth Rate, % | |
| MPI | 0.926 | 1.406 | 1.031 | 0.108 | 0.280 |
| TC | 0.916 | 1.314 | 1.028 | 0.091 | 0.513 |
| TEC | 0.953 | 1.060 | 1.000 | 0.029 | −0.224 |
| PTE | 0.954 | 1.100 | 1.001 | 0.037 | −0.176 |
| SE | 0.977 | 1.021 | 1.002 | 0.014 | −0.048 |
Publisher’s Note: MDPI stays neutral with regard to jurisdictional claims in published maps and institutional affiliations. |
© 2021 by the author. Licensee MDPI, Basel, Switzerland. This article is an open access article distributed under the terms and conditions of the Creative Commons Attribution (CC BY) license (https://creativecommons.org/licenses/by/4.0/).
Share and Cite
Borozan, D. Technical Efficiency and Productivity Change in the European Union with Undesirable Output Considered. Energies 2021, 14, 4937. https://doi.org/10.3390/en14164937
Borozan D. Technical Efficiency and Productivity Change in the European Union with Undesirable Output Considered. Energies. 2021; 14(16):4937. https://doi.org/10.3390/en14164937
Chicago/Turabian StyleBorozan, Djula. 2021. "Technical Efficiency and Productivity Change in the European Union with Undesirable Output Considered" Energies 14, no. 16: 4937. https://doi.org/10.3390/en14164937
APA StyleBorozan, D. (2021). Technical Efficiency and Productivity Change in the European Union with Undesirable Output Considered. Energies, 14(16), 4937. https://doi.org/10.3390/en14164937