
Assessment of Ground Regeneration around Borehole Heat Exchangers between Heating Seasons in Cold Climates: A Case Study in Bialystok (NE, Poland)


Abstract
:1. Introduction
2. Materials and Methods
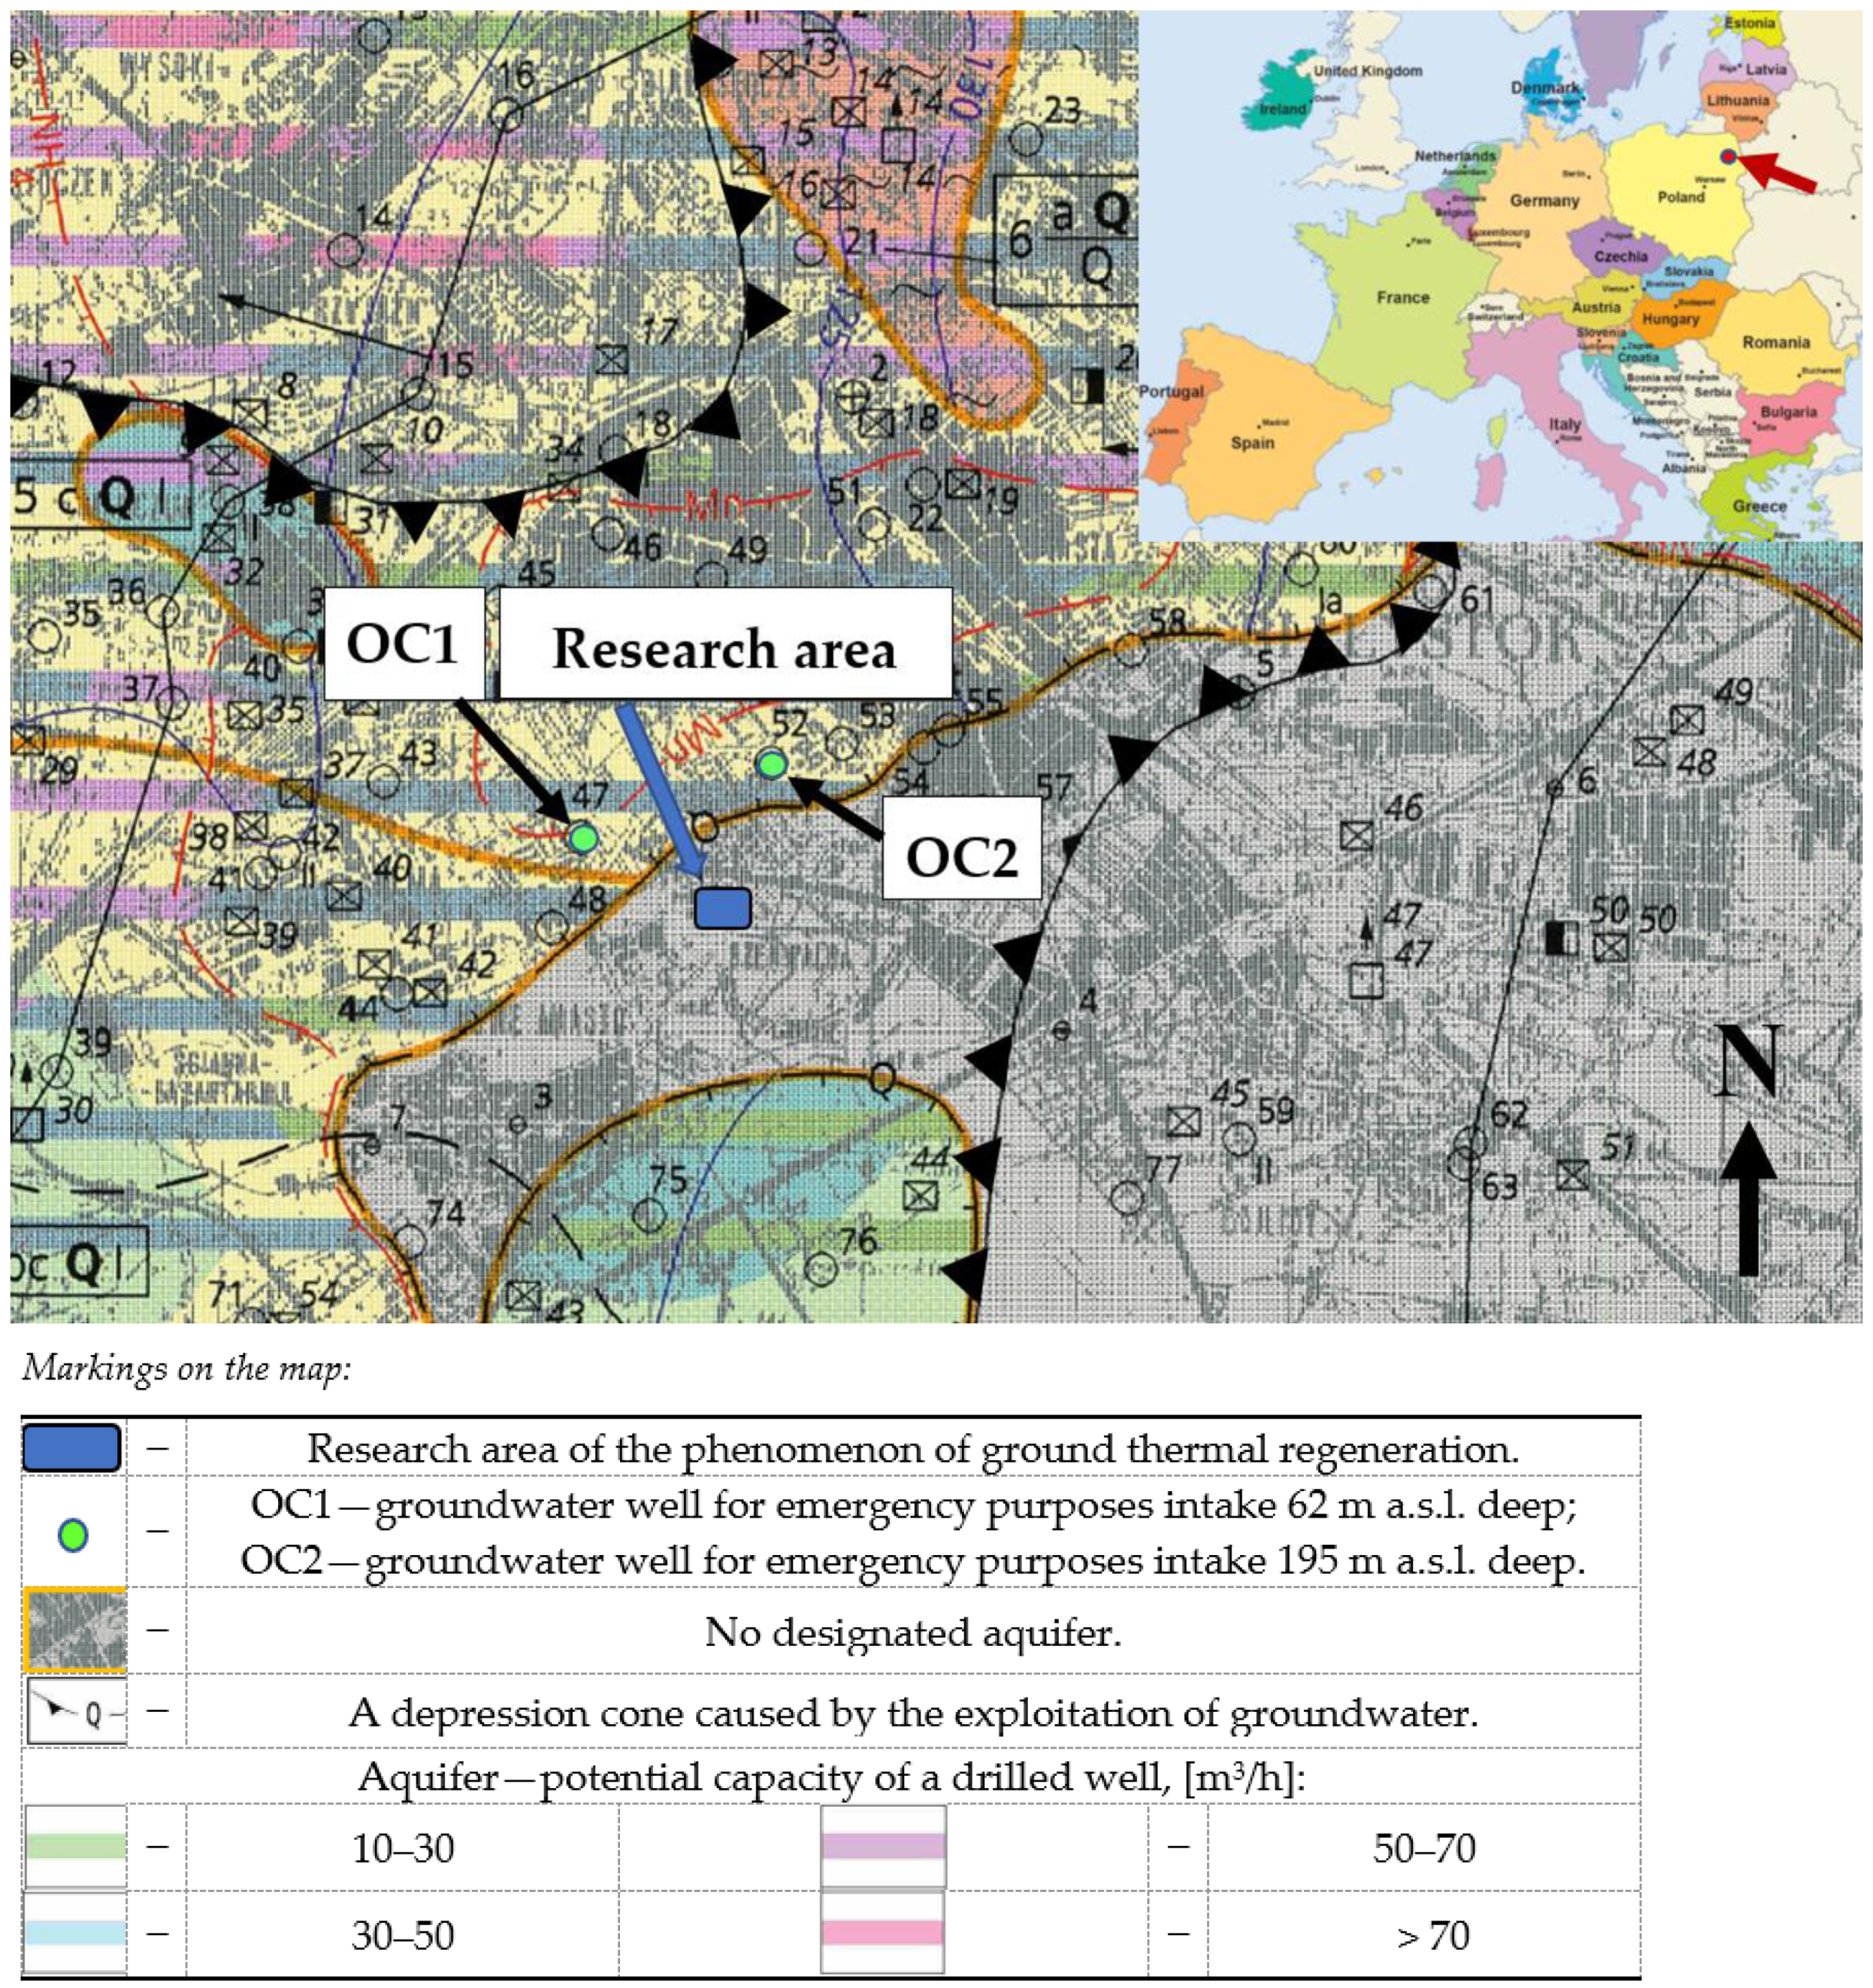
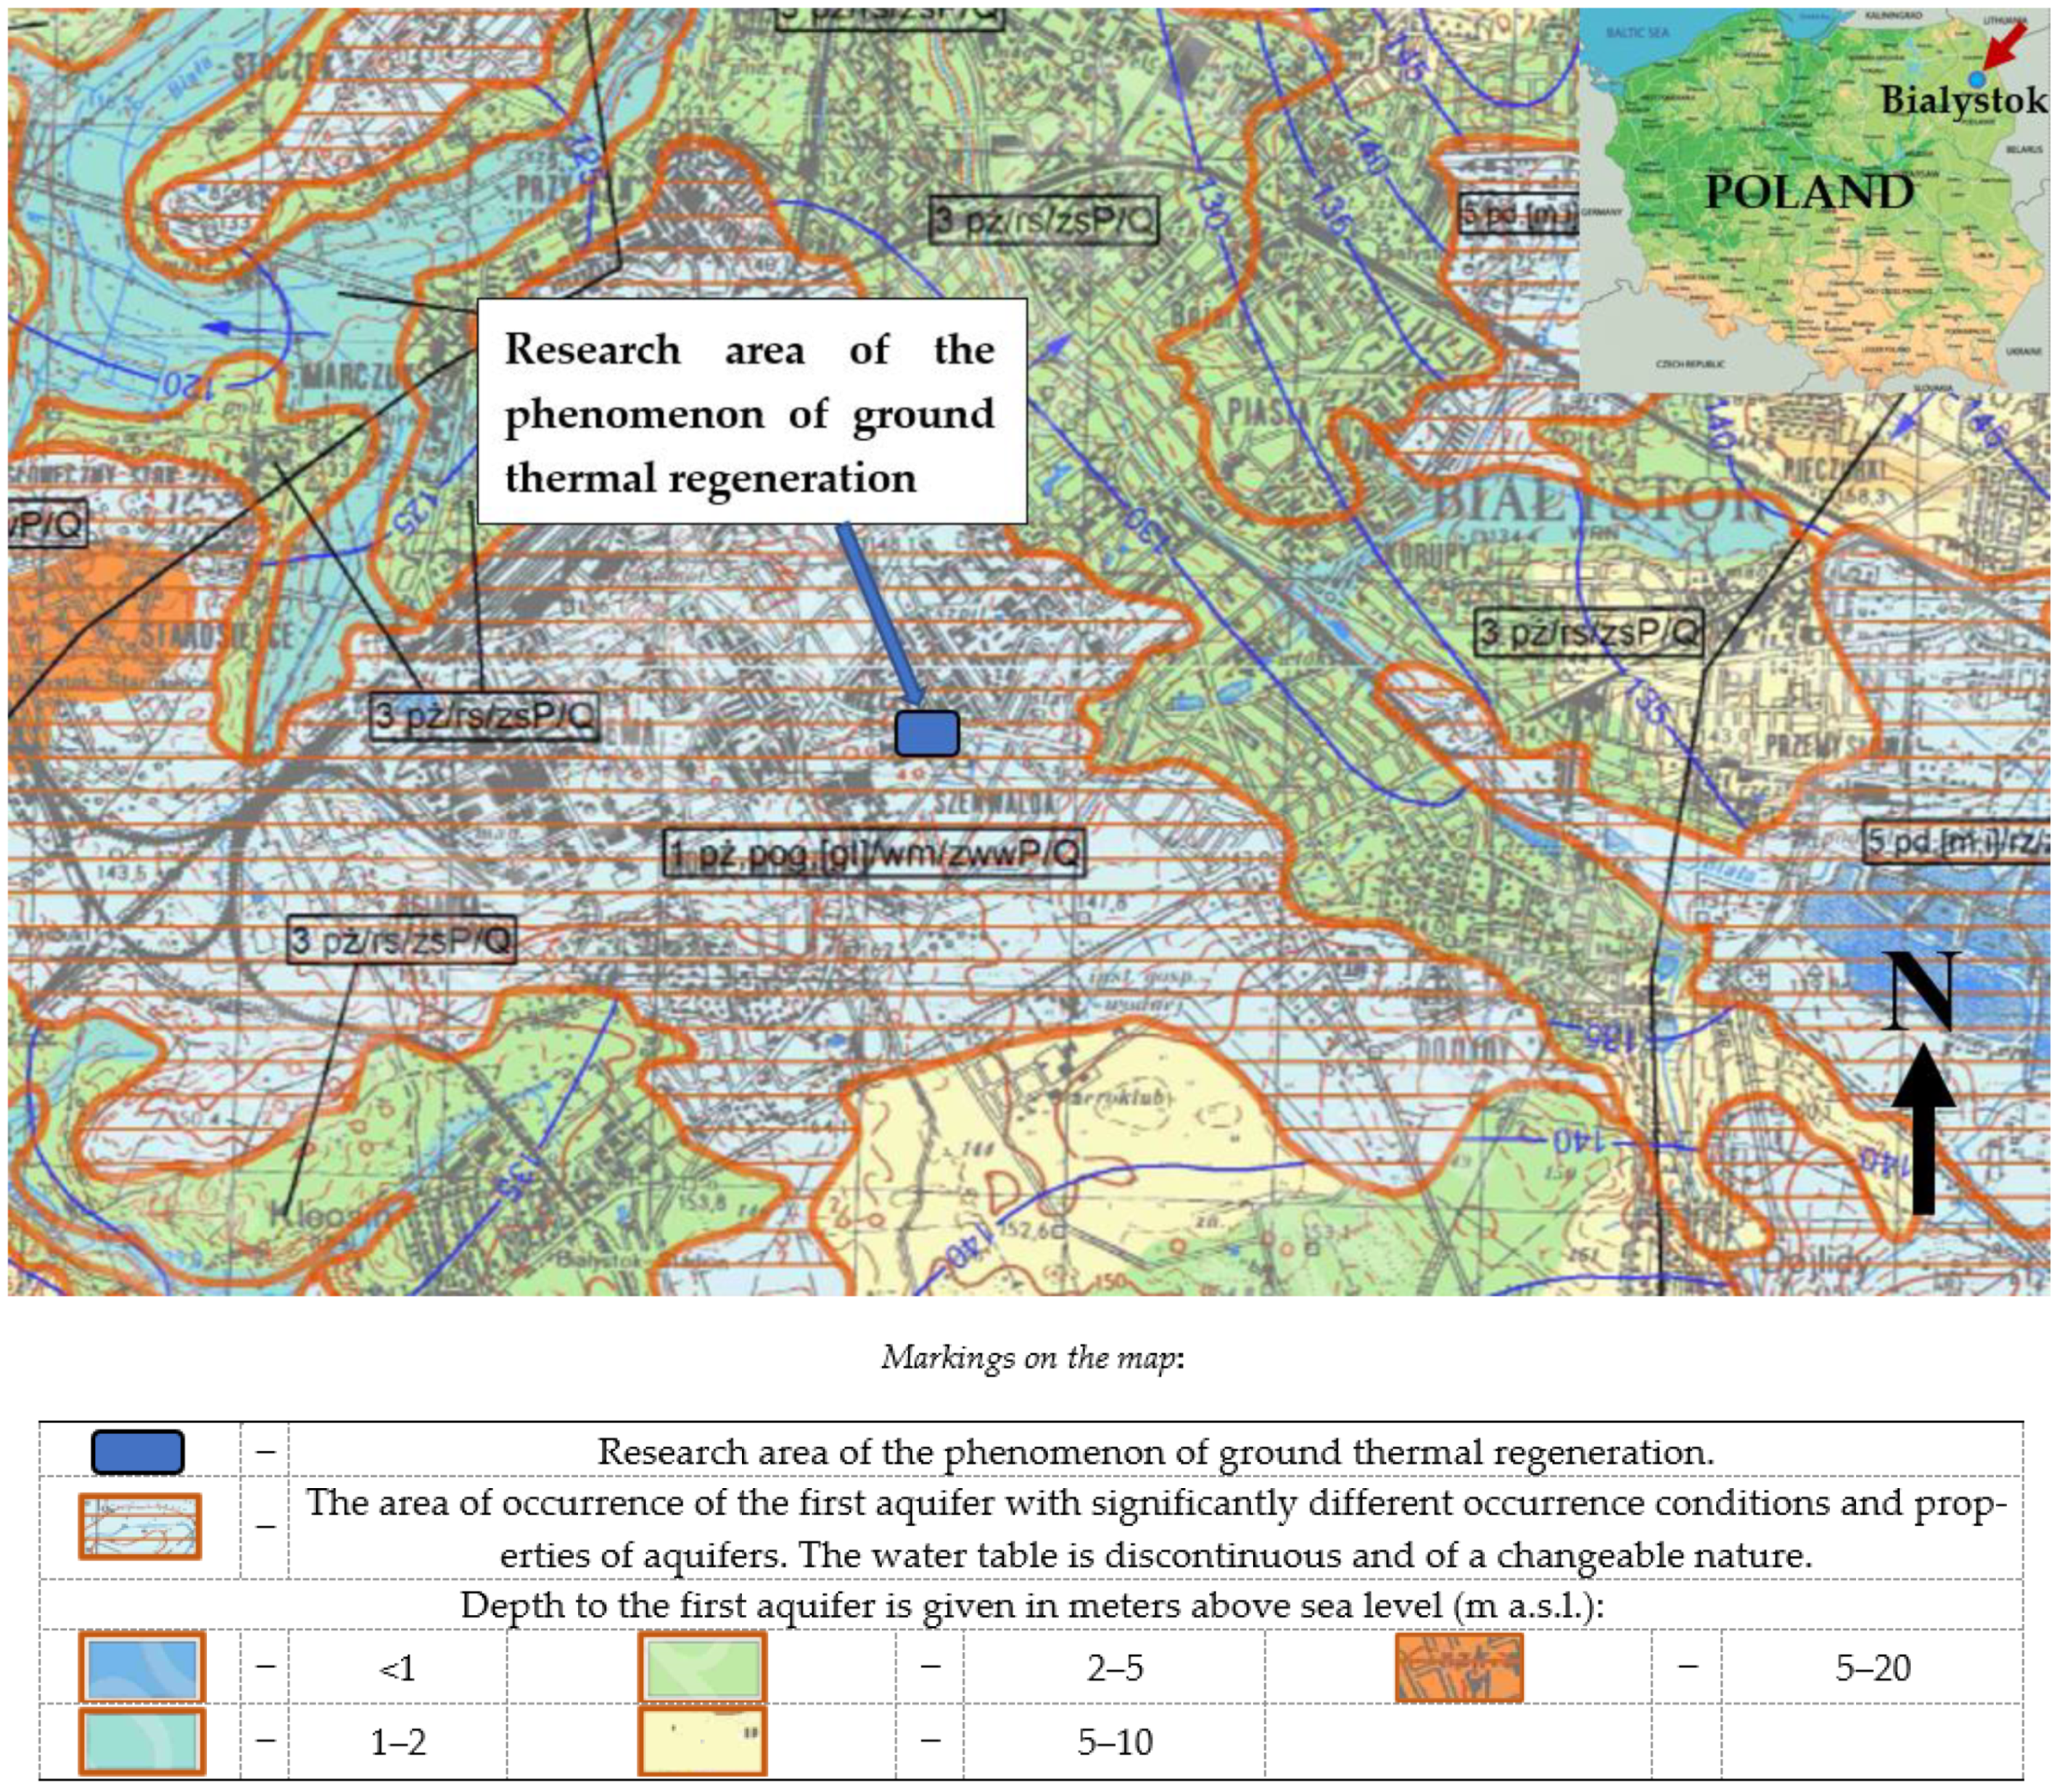
2.1. Experimental and Measuring Site
2.2. Ground Profile
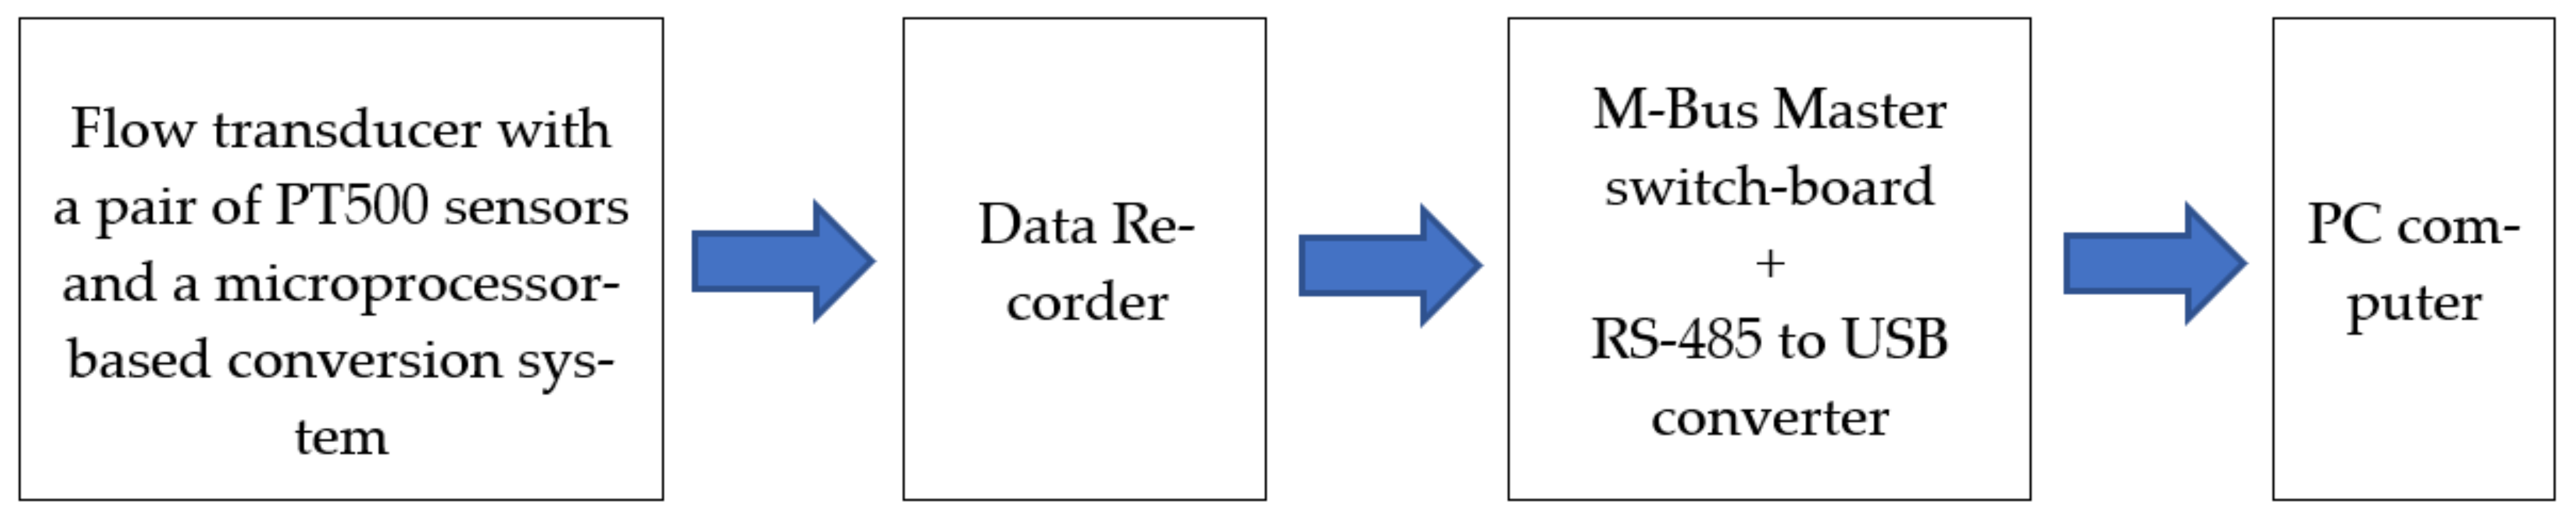
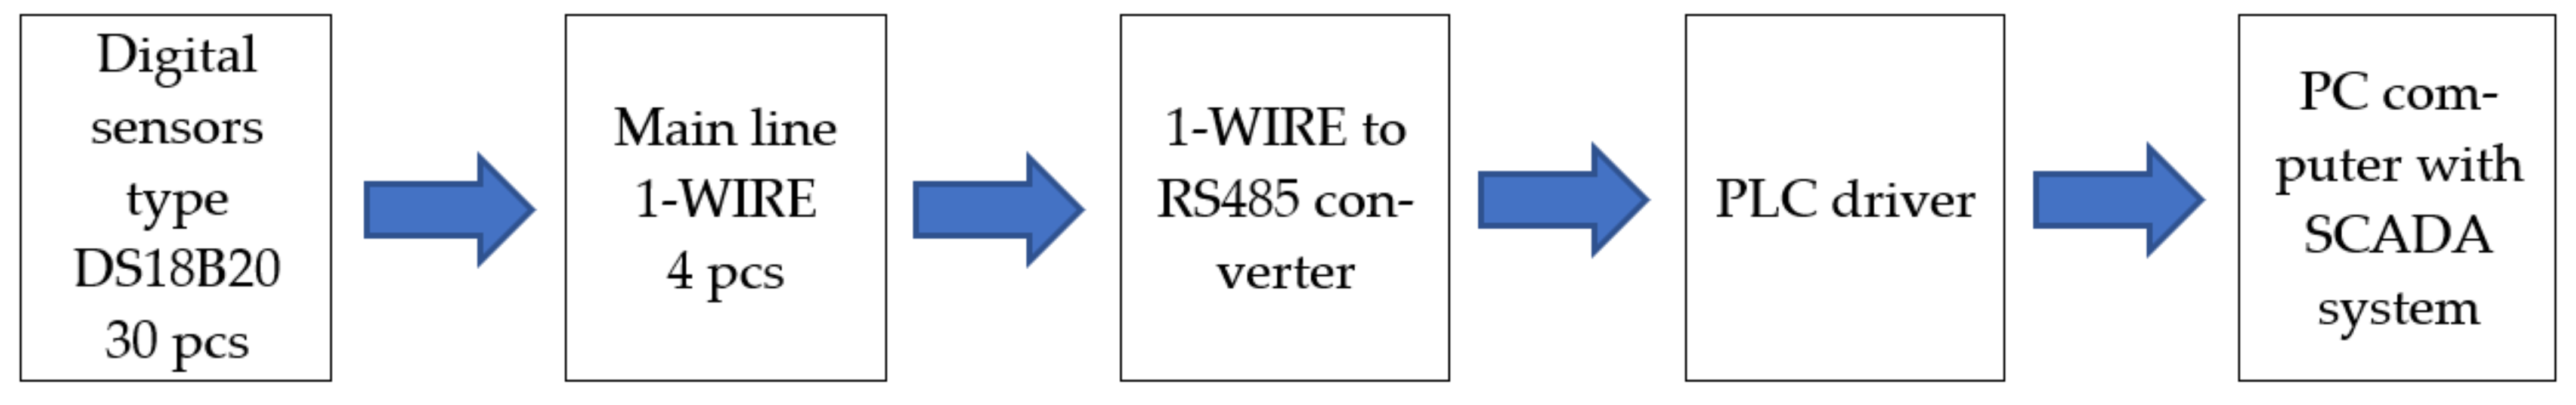
2.3. Measurement Methodology
3. Results and Discussion
4. Conclusions
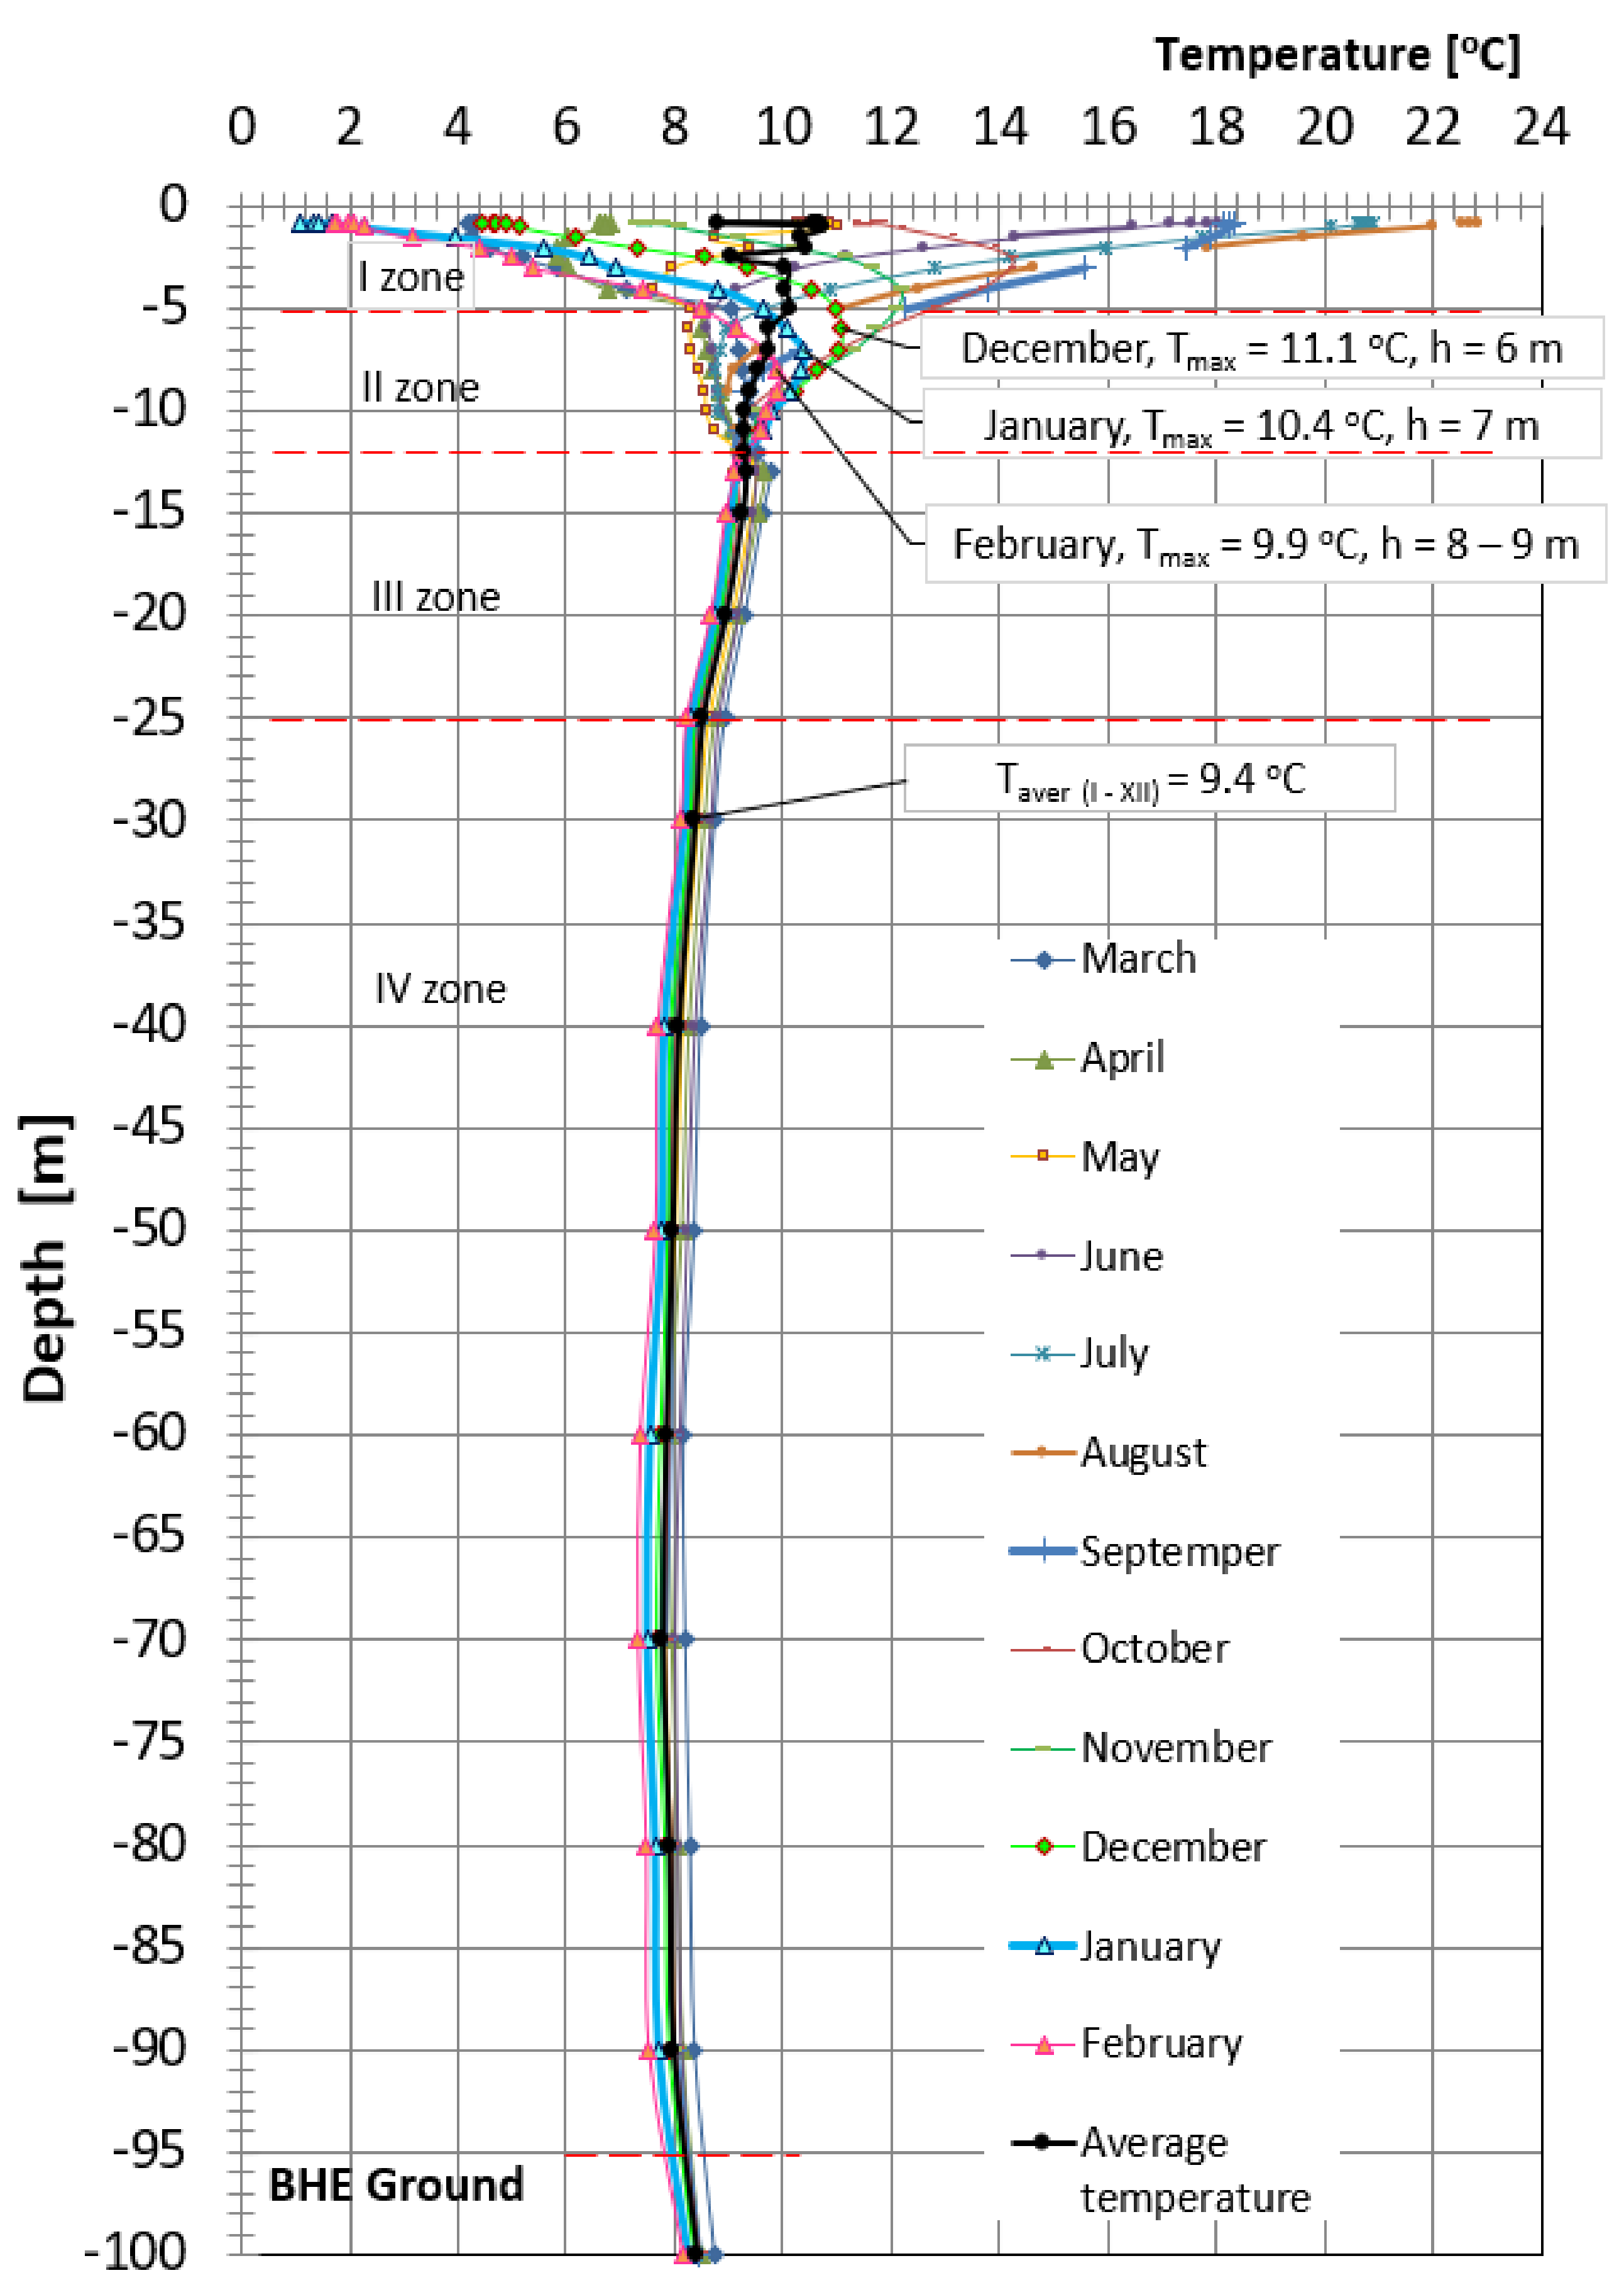
- In the layer at a depth of 6–9 m, in the coldest months in Poland, from December to February, the occurrence of maximum temperatures at the level of 9.9 °C (February)–11.1 °C (December), where the average annual ground temperature at a depth of 25 m to 100 m is 8.1 °C. Perhaps it would be reasonable and economical to use, when designing lower heat sources, to a much greater extent these ground layers, e.g., by drilling oblique boreholes, basket heat exchangers, and others.
- The measurements confirmed that at a depth of 15–25 m, the average annual ground temperature has a temperature close to the annual average outside air temperature, and in shallow, near-surface zones, the ground temperature changes seasonally under the influence of weather conditions, that are difficult to predict [91,94,95,96,97].
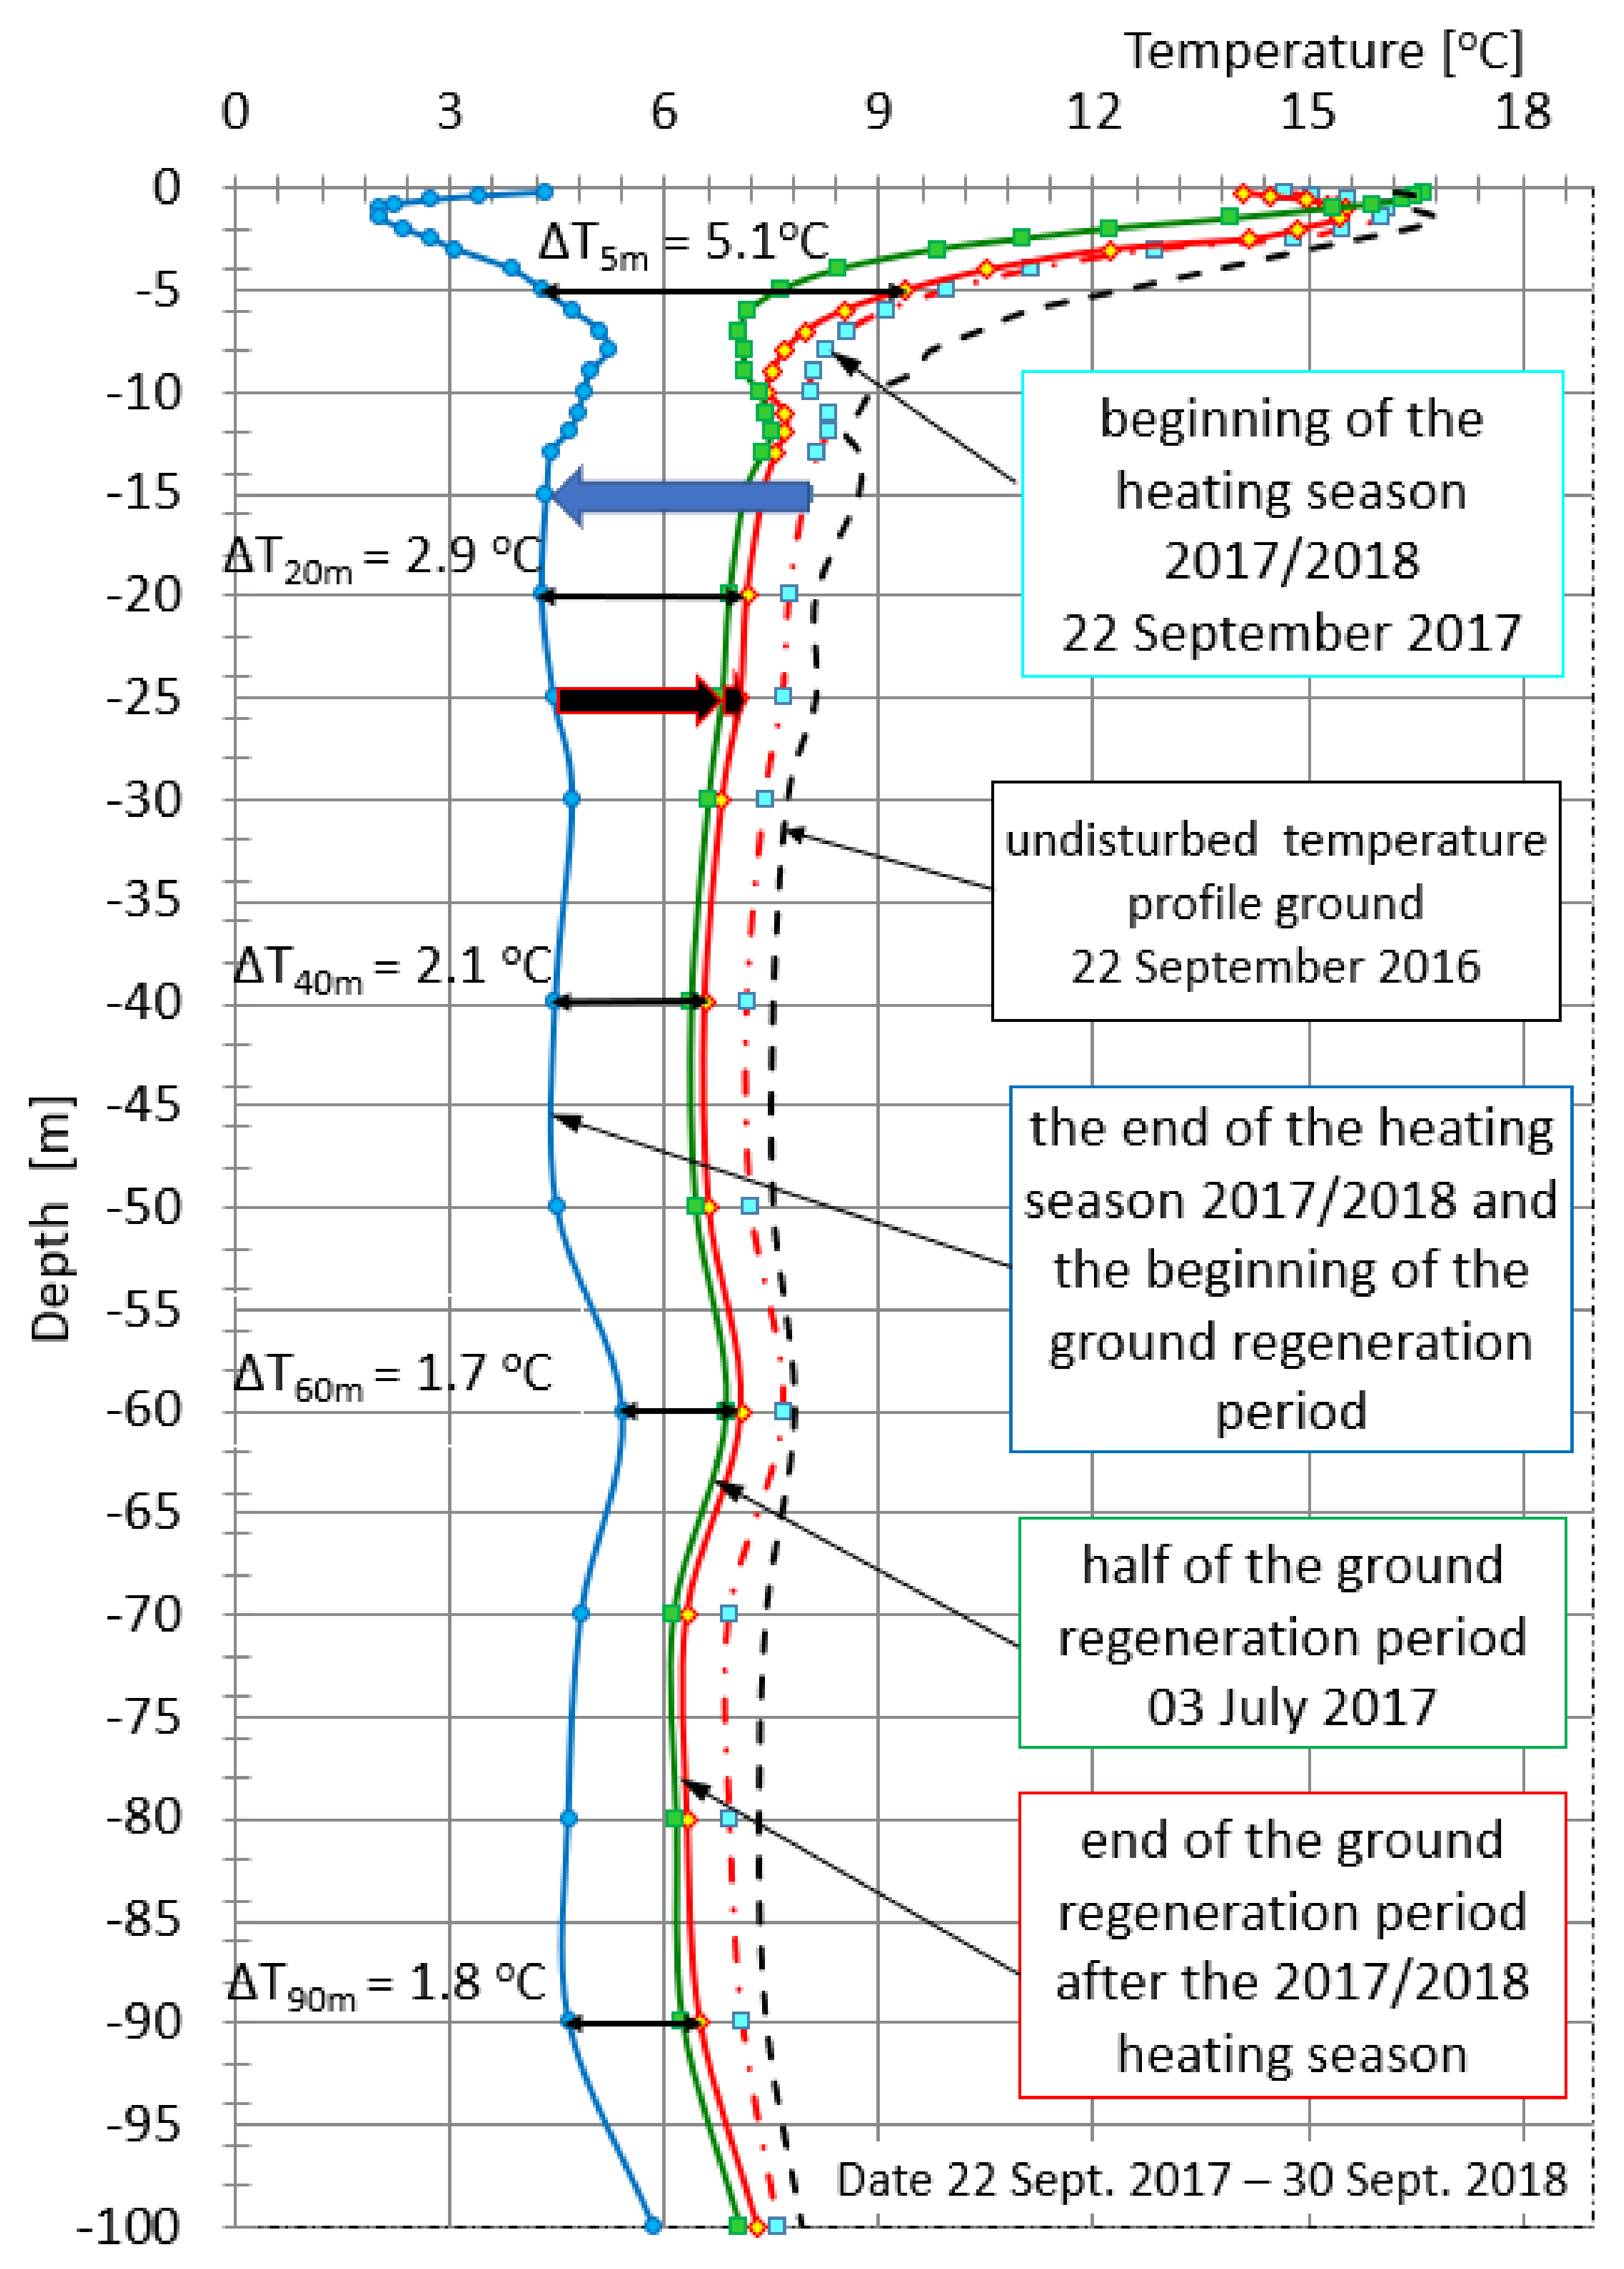
- Despite shorter heating seasons lasting 200–201 days and the number of HDDs in the heating season 3174.1–3276.4 days/K year, in 2016–2018, compared to the standard season, which lasts 232 days, where the number of HDDs is 3496.1 day/K year, the well under test has not fully recovered. However, in the 2018/2019 and 2019/2020 seasons, the ground temperature during regeneration returned to the baseline from before the preceding heating season.
- With such long heating seasons (in cold regions), it seems reasonable to use an additional heat source at the stage of designing ground heat exchangers, supporting ground regeneration in the summer. Ground regeneration in summer can be supported by, among others, PV panels with electric heaters or liquid solar collectors, which in the case of public buildings, especially schools, would allow the use of excess thermal energy obtained from solar collectors, mainly during the holiday season, which is a huge problem, especially in schools, in the months of VII–VIII.
- It also seems justified due to the intensity of solar radiation in the summer, and thus the amount of heat that cannot be quickly pumped into the ground in order to regenerate BHE, the use of underground energy storage, because in a cold climate without adequate heat injection in summer, the ground temperature may not return to its natural state, and this process may worsen with each passing year. The use of underground energy storage or hybrid systems will help to reduce the carbon footprint, which is one of the main goals of the European Green Deal.
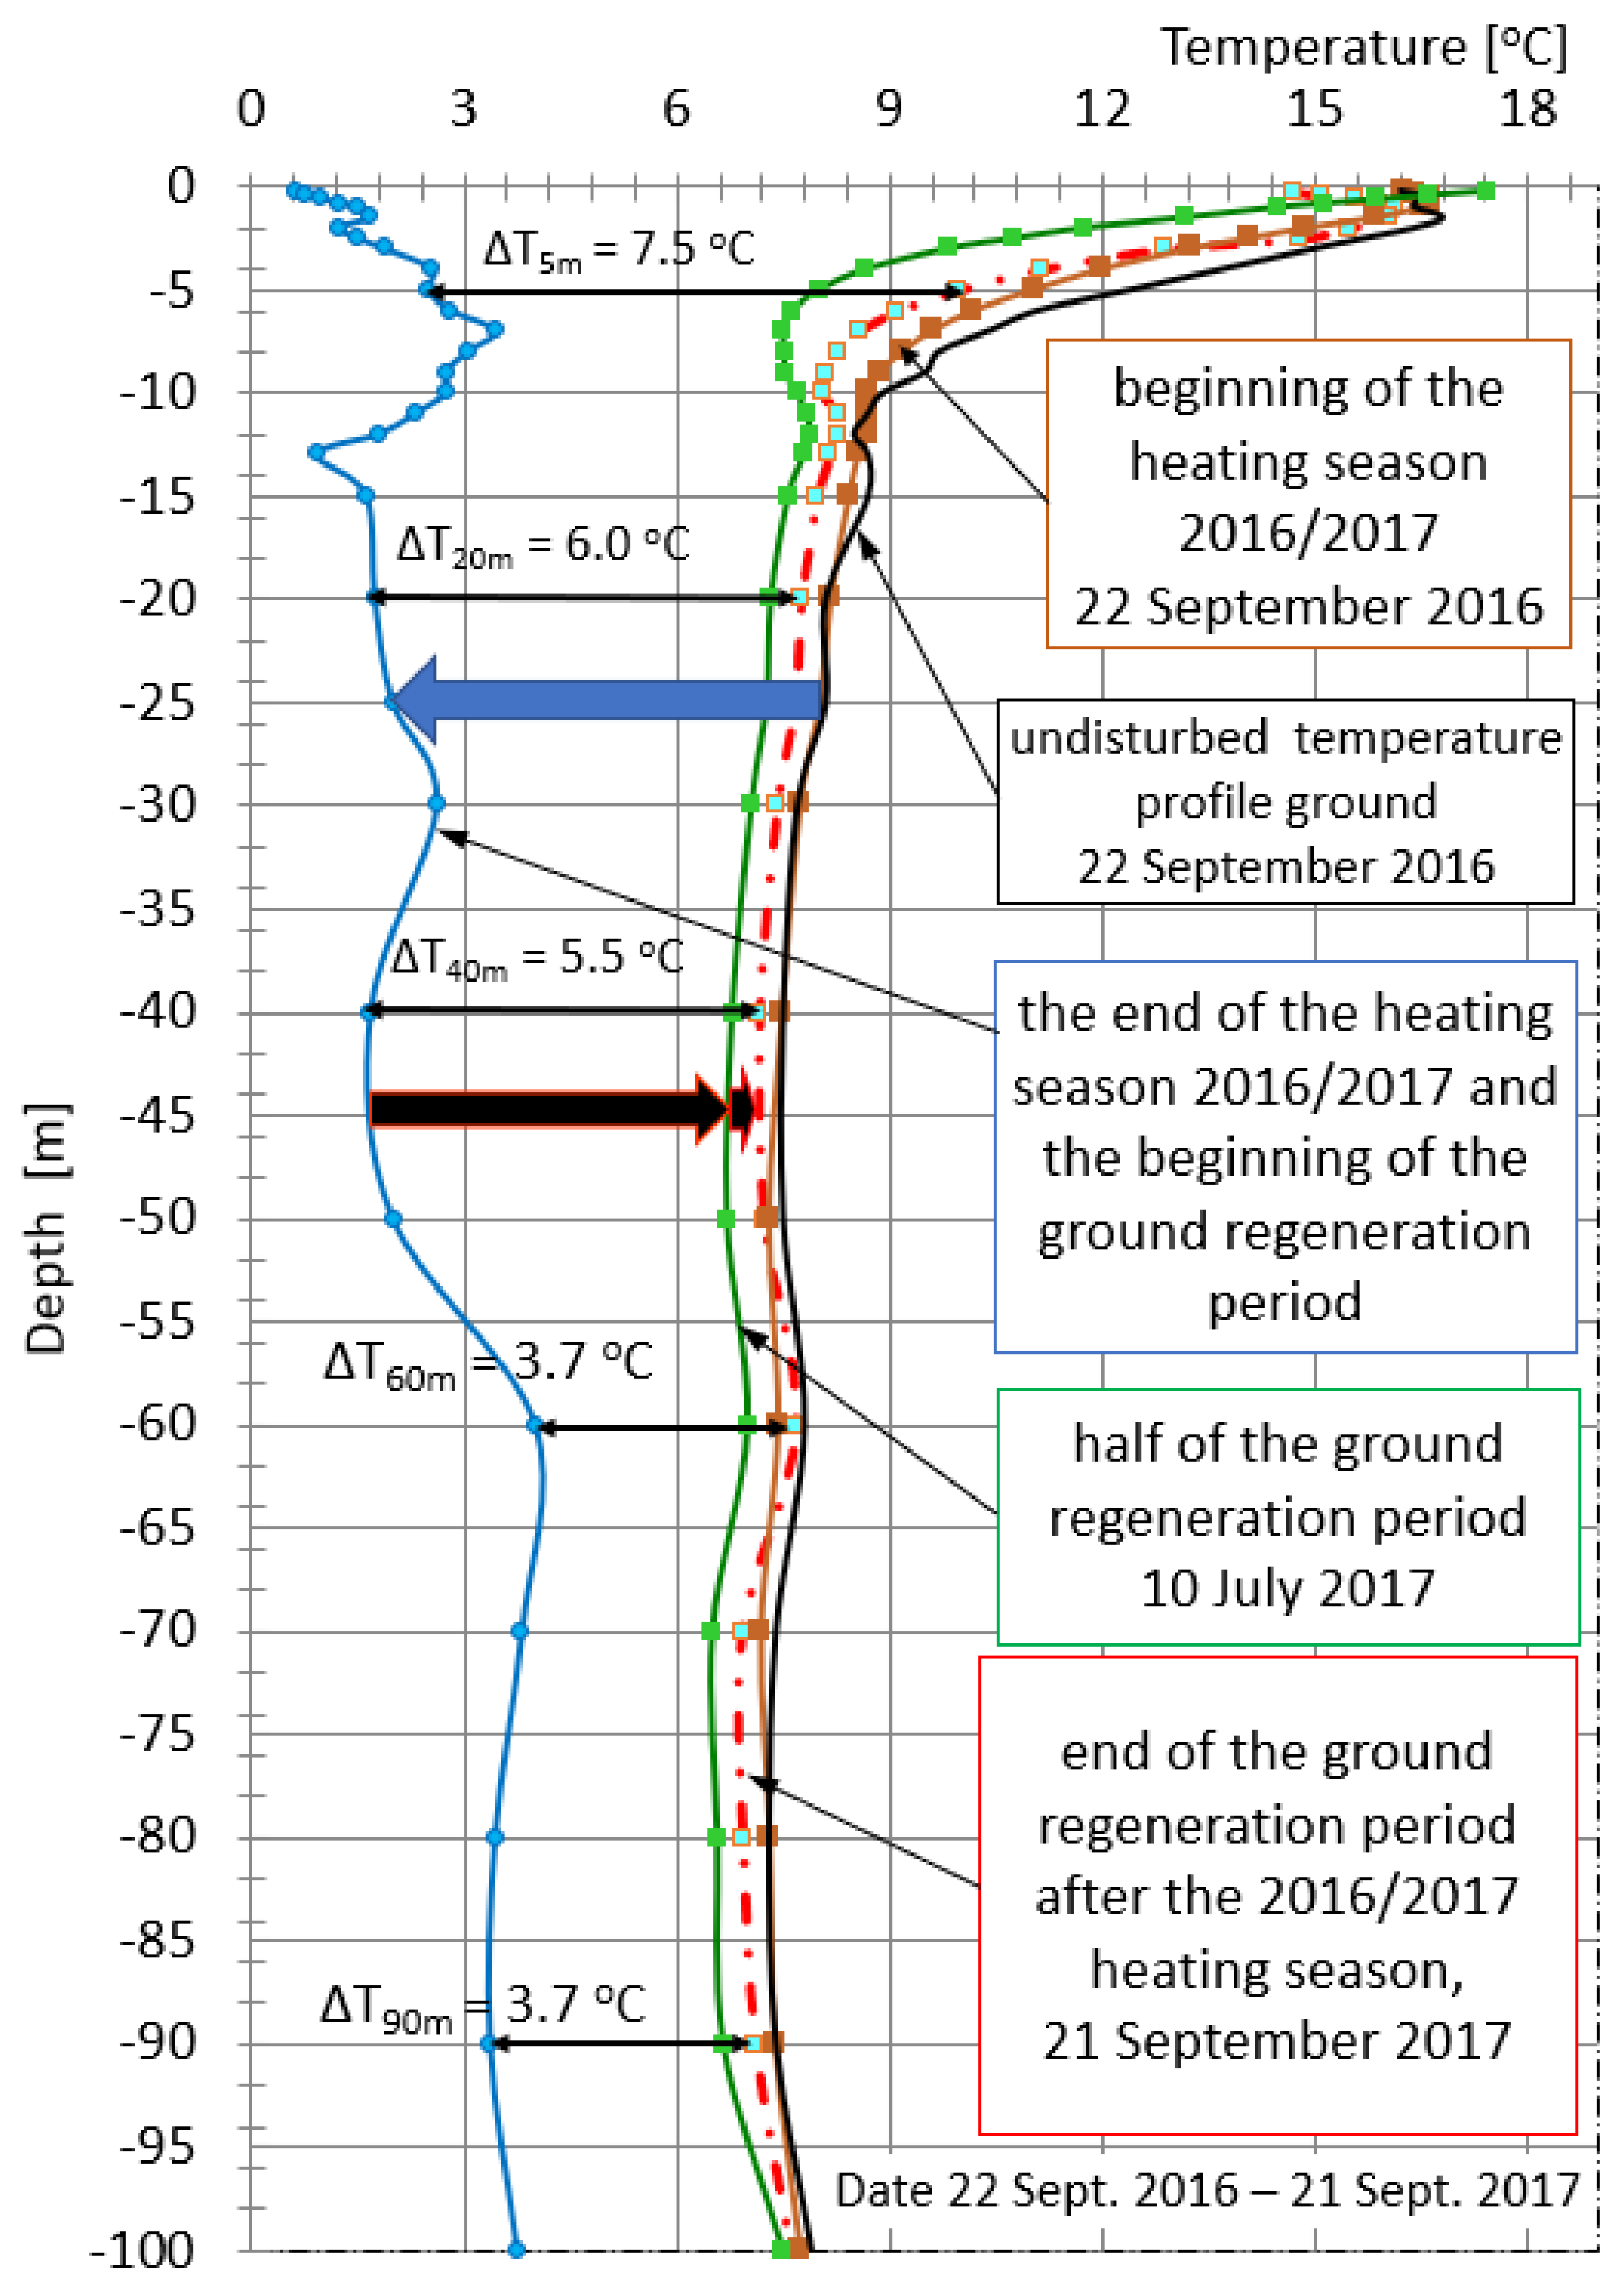
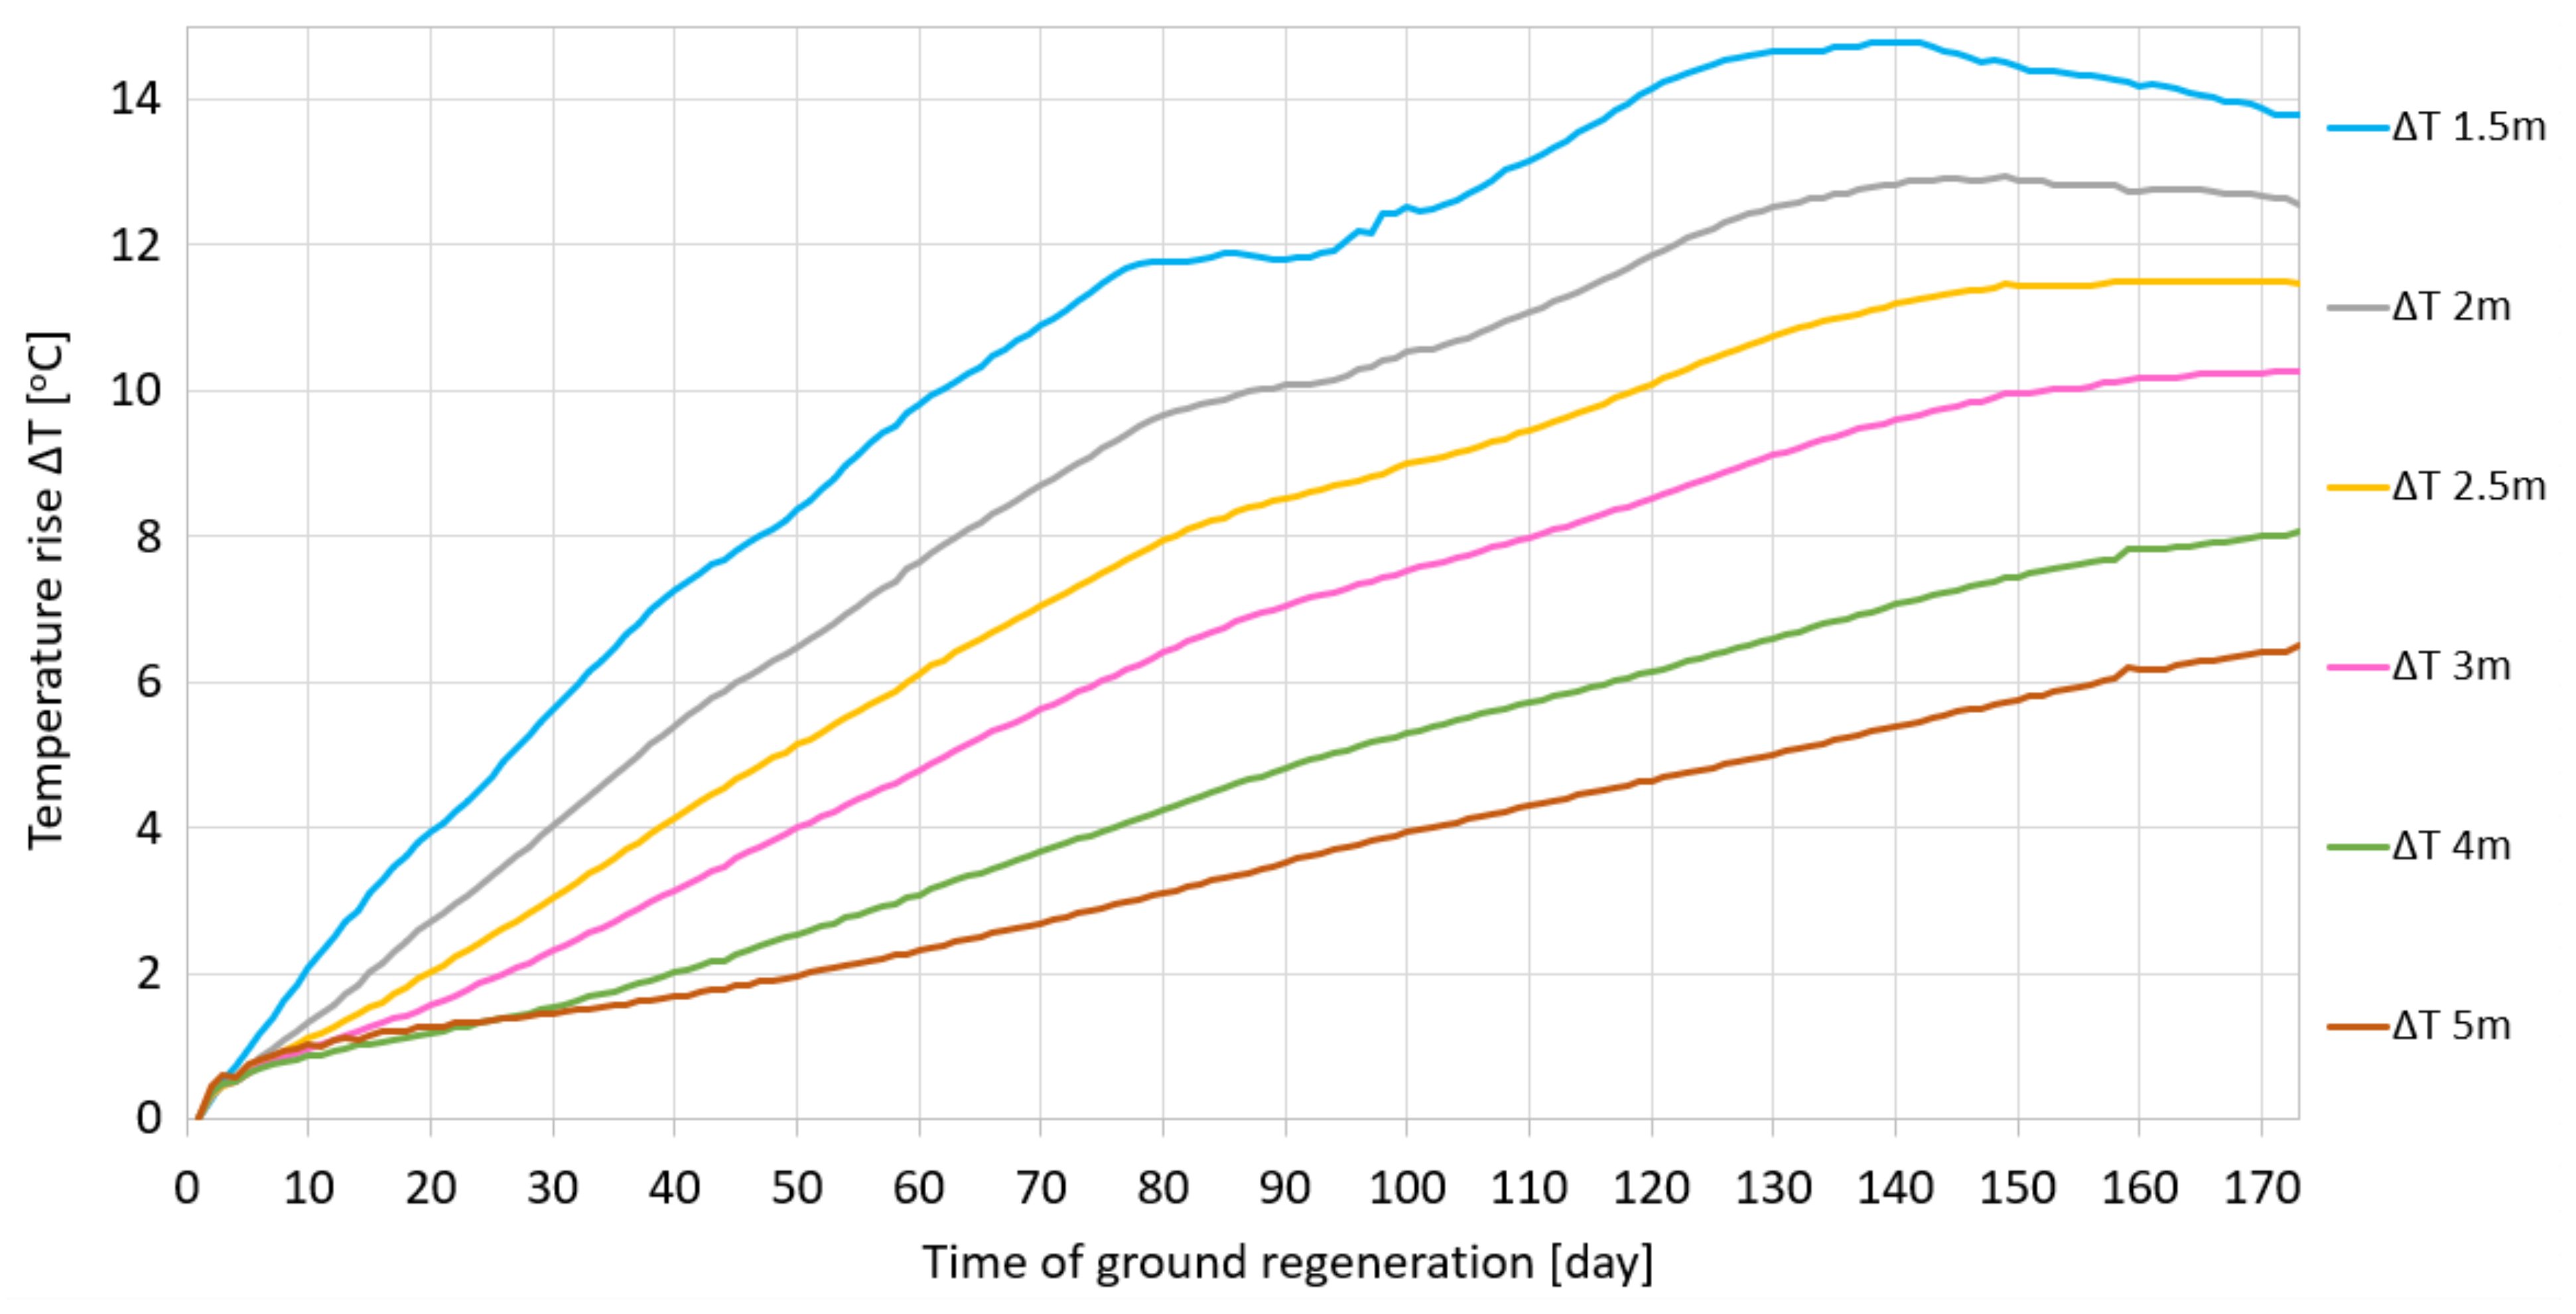
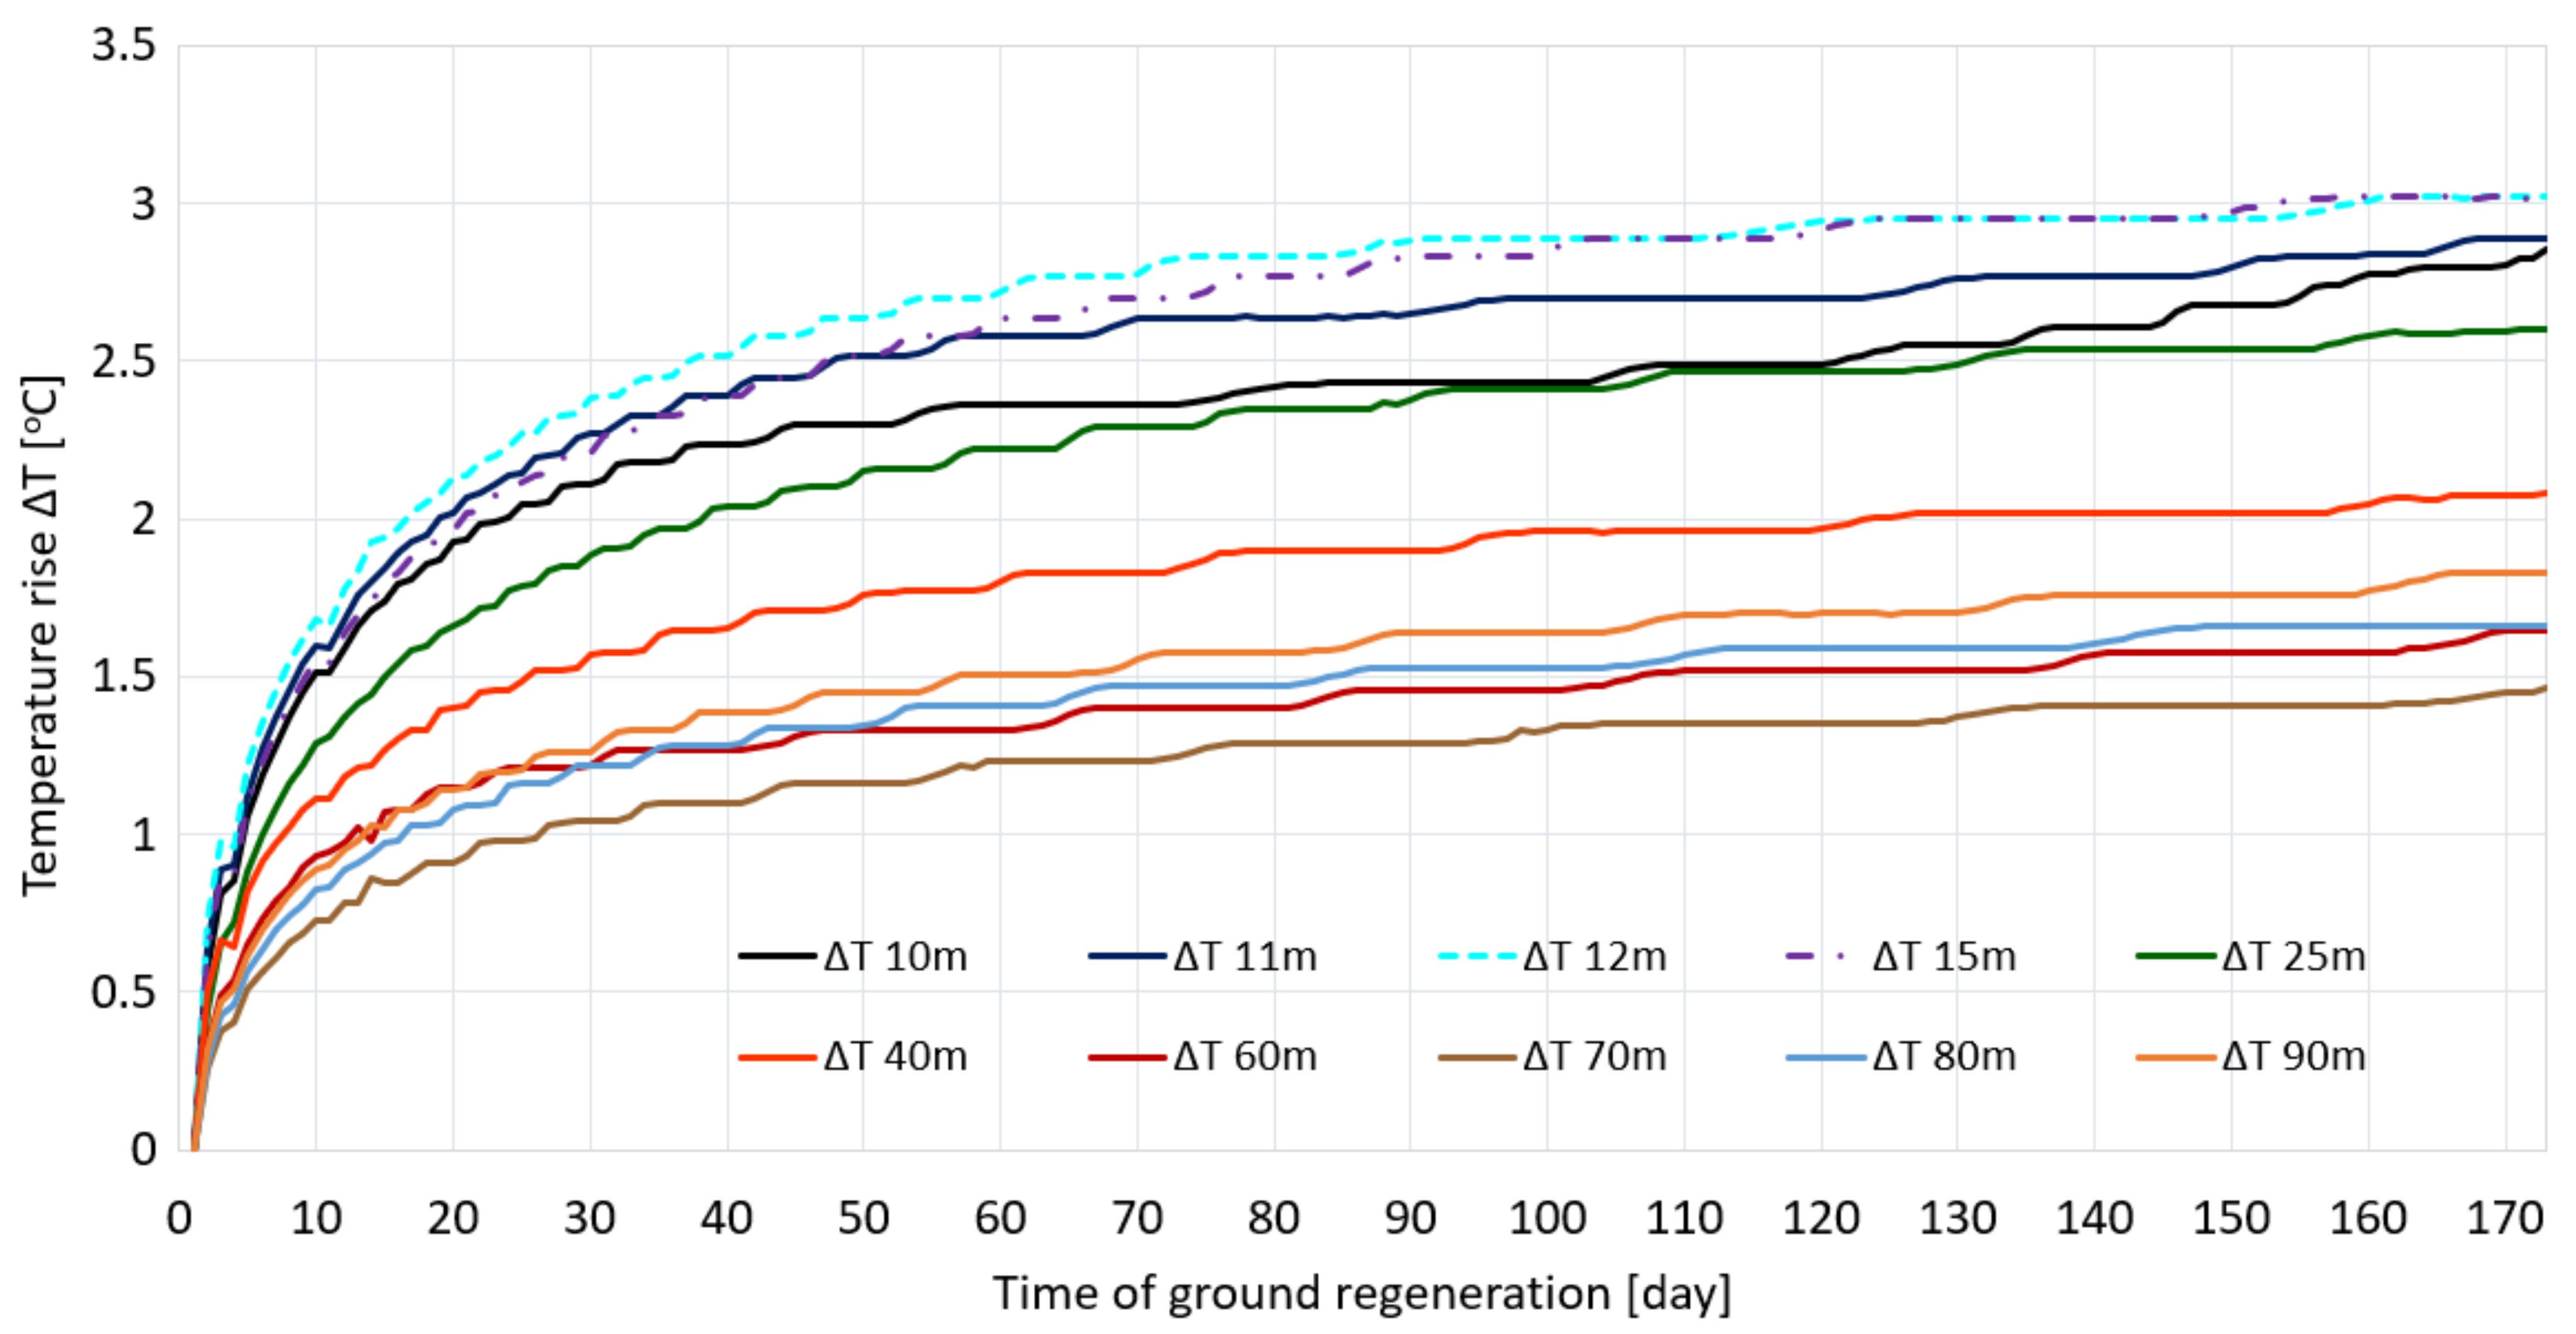
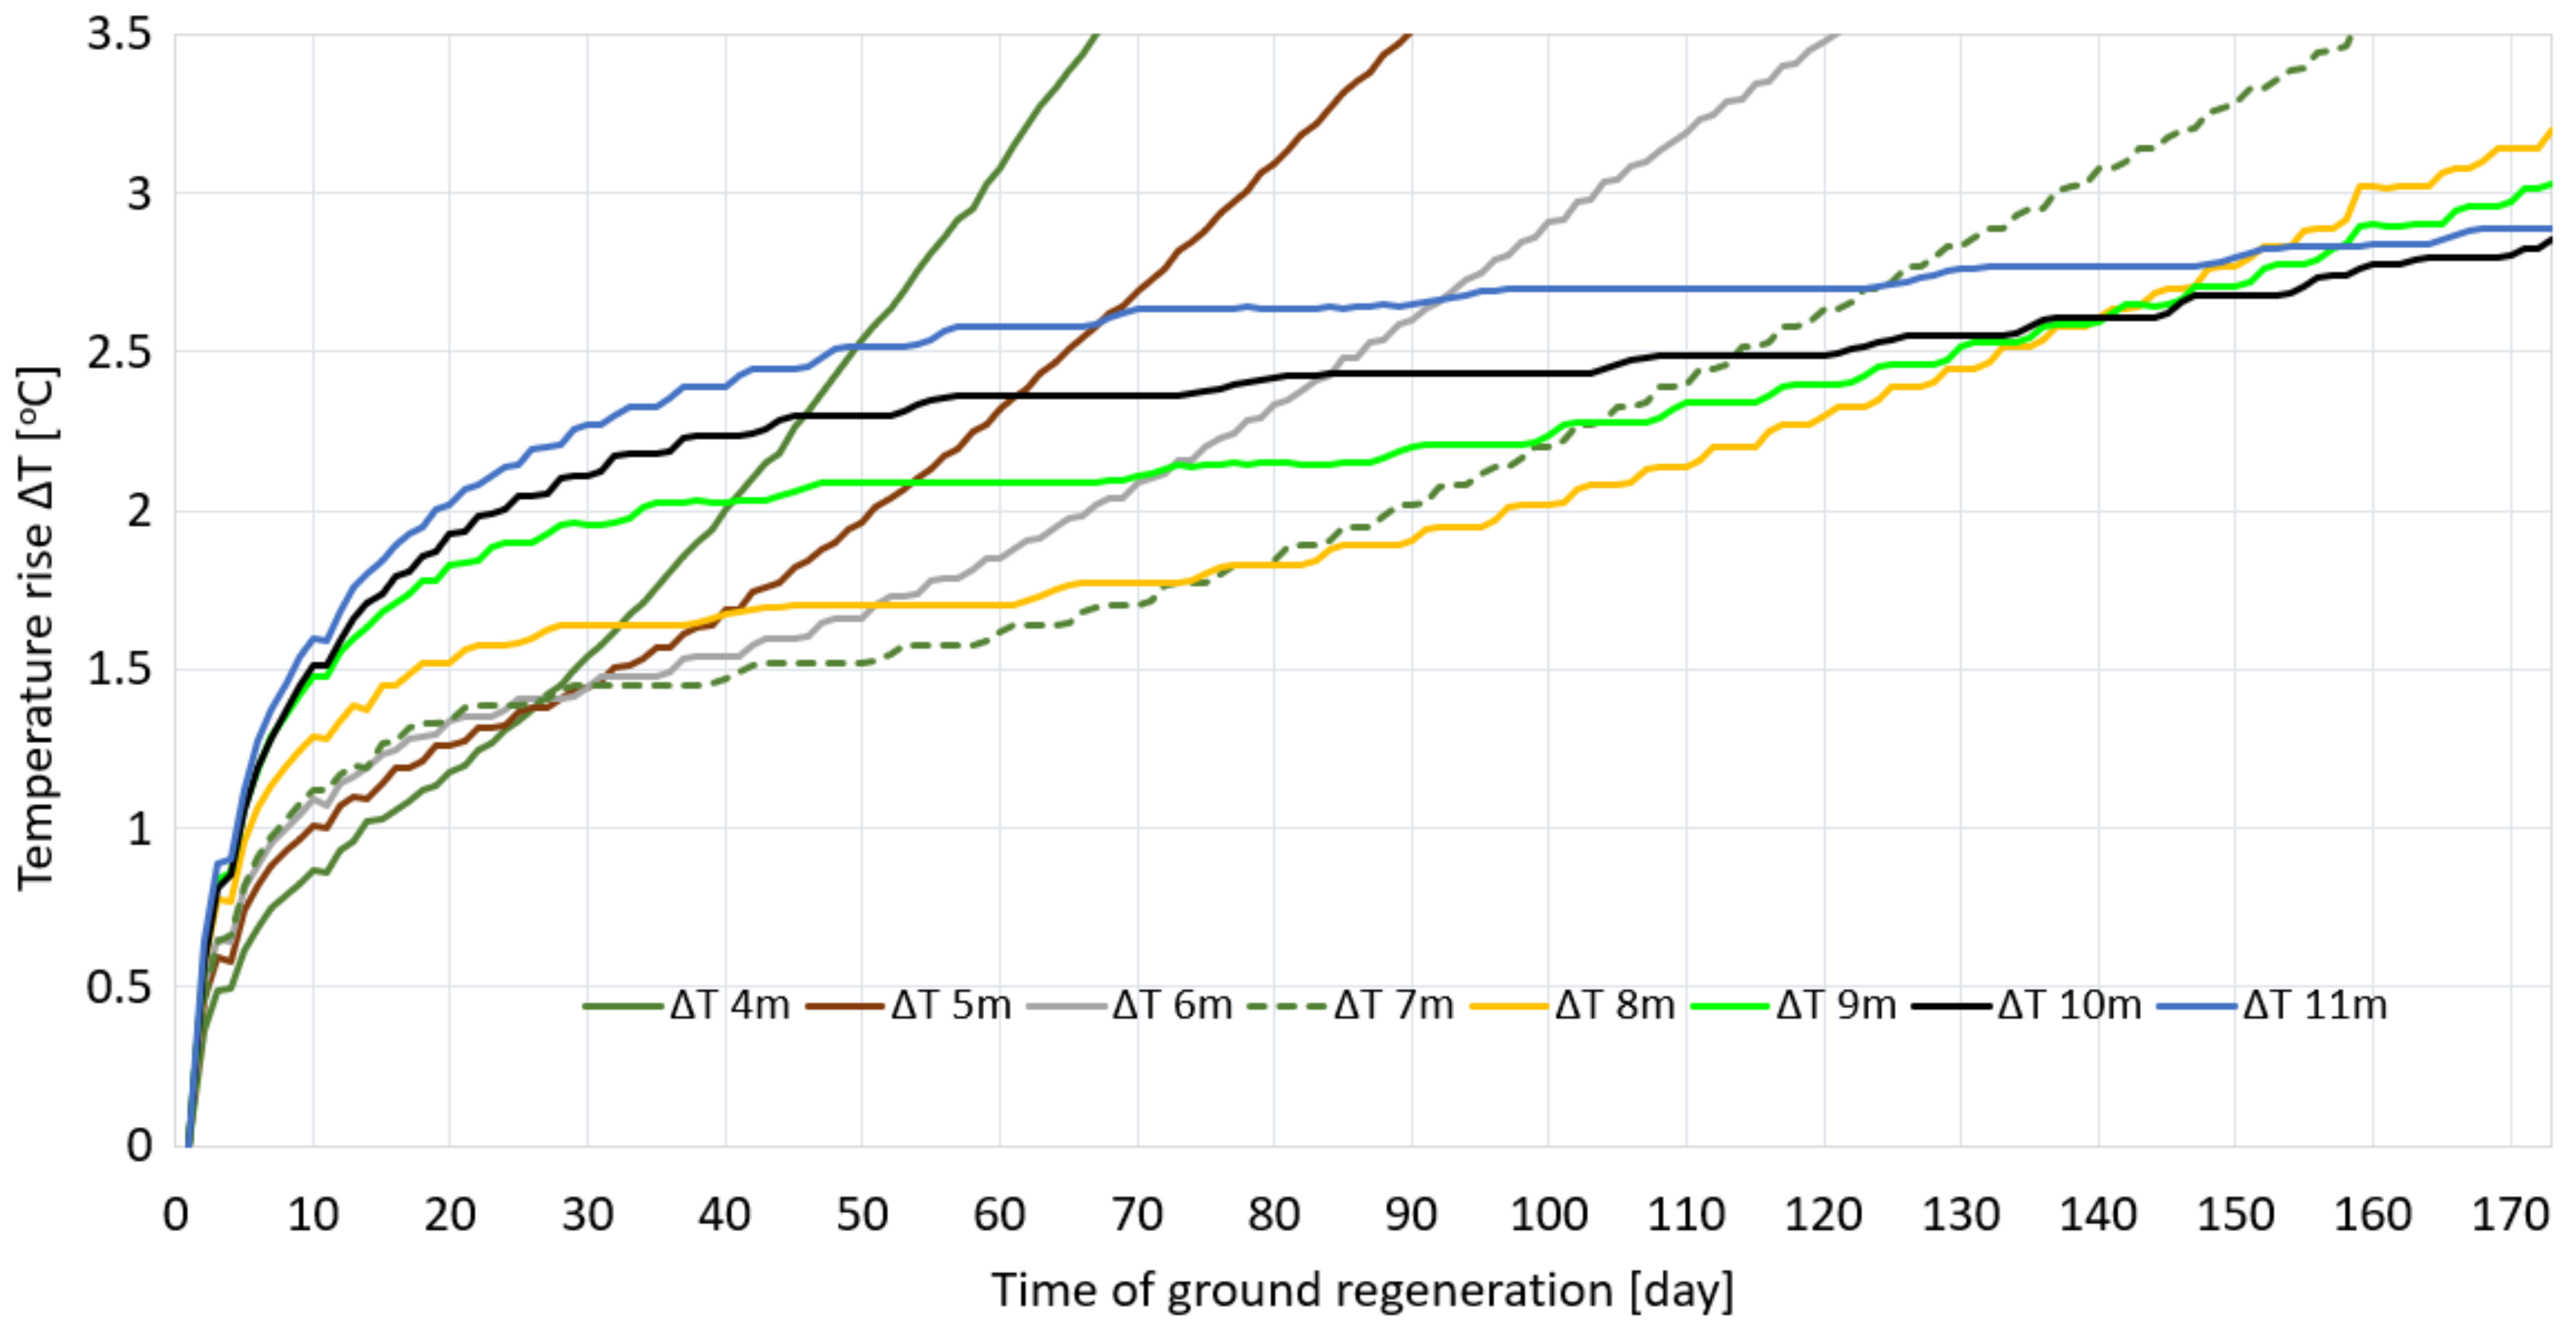
- The weather conditions affect the ground regeneration process in the zone from 0–12 m. At the same time, the influence of weather conditions at different depths is not marked simultaneously at the same time. The reaction time depends on the depth, the deeper it is, the longer it is, e.g., in the zone at a depth of 4 m, it started after about 15 days, but at a depth of 10 m after about 110 days. A slight influence was observed at a depth of 12 m, and was imperceptible at depths of 15–100 m. Rybach and Sanner [92] showed that the zone of the influence of atmospheric conditions in the place of their research was 0–15 m.
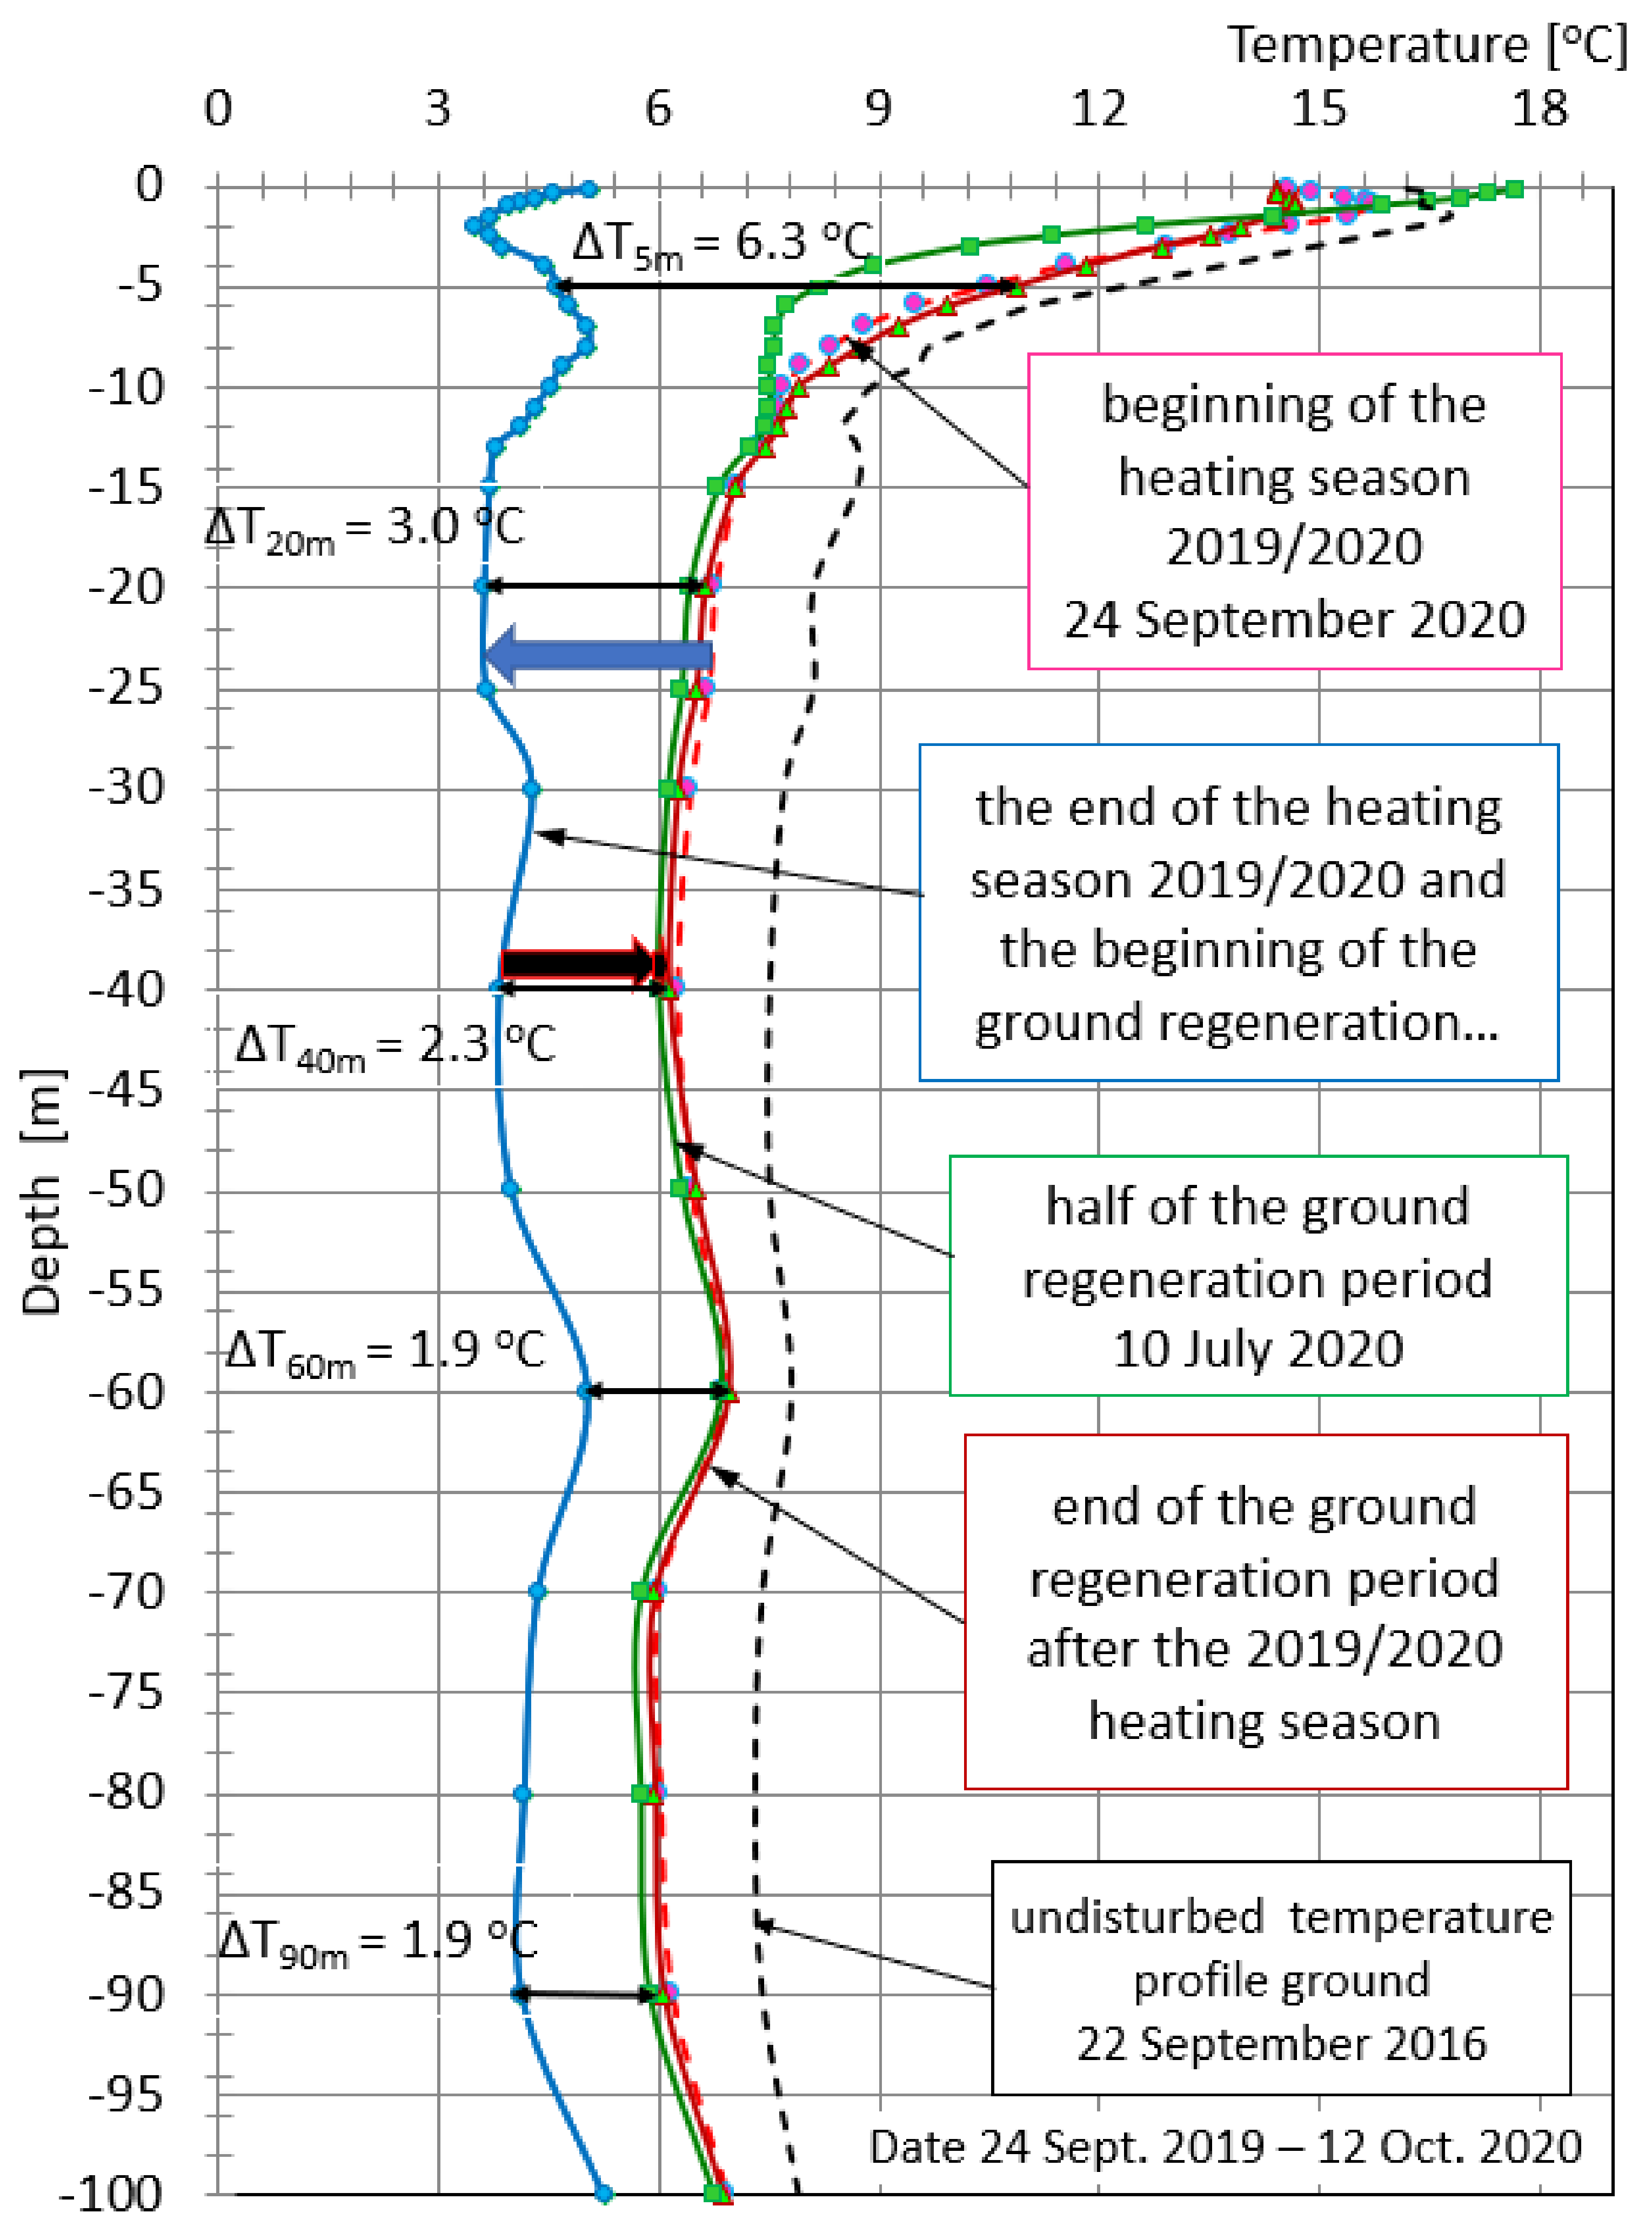
- The process of ground regeneration is most intensive until the middle of its time (it is usually the beginning of July), then its further regeneration is very slow, especially at depths below 10 m, the influence of climatic conditions is less noticeable here. Below the depth of 12 m, the ground temperature field is regulated by the geothermal heat flux from the interior of the Earth and the possible flow of groundwater.
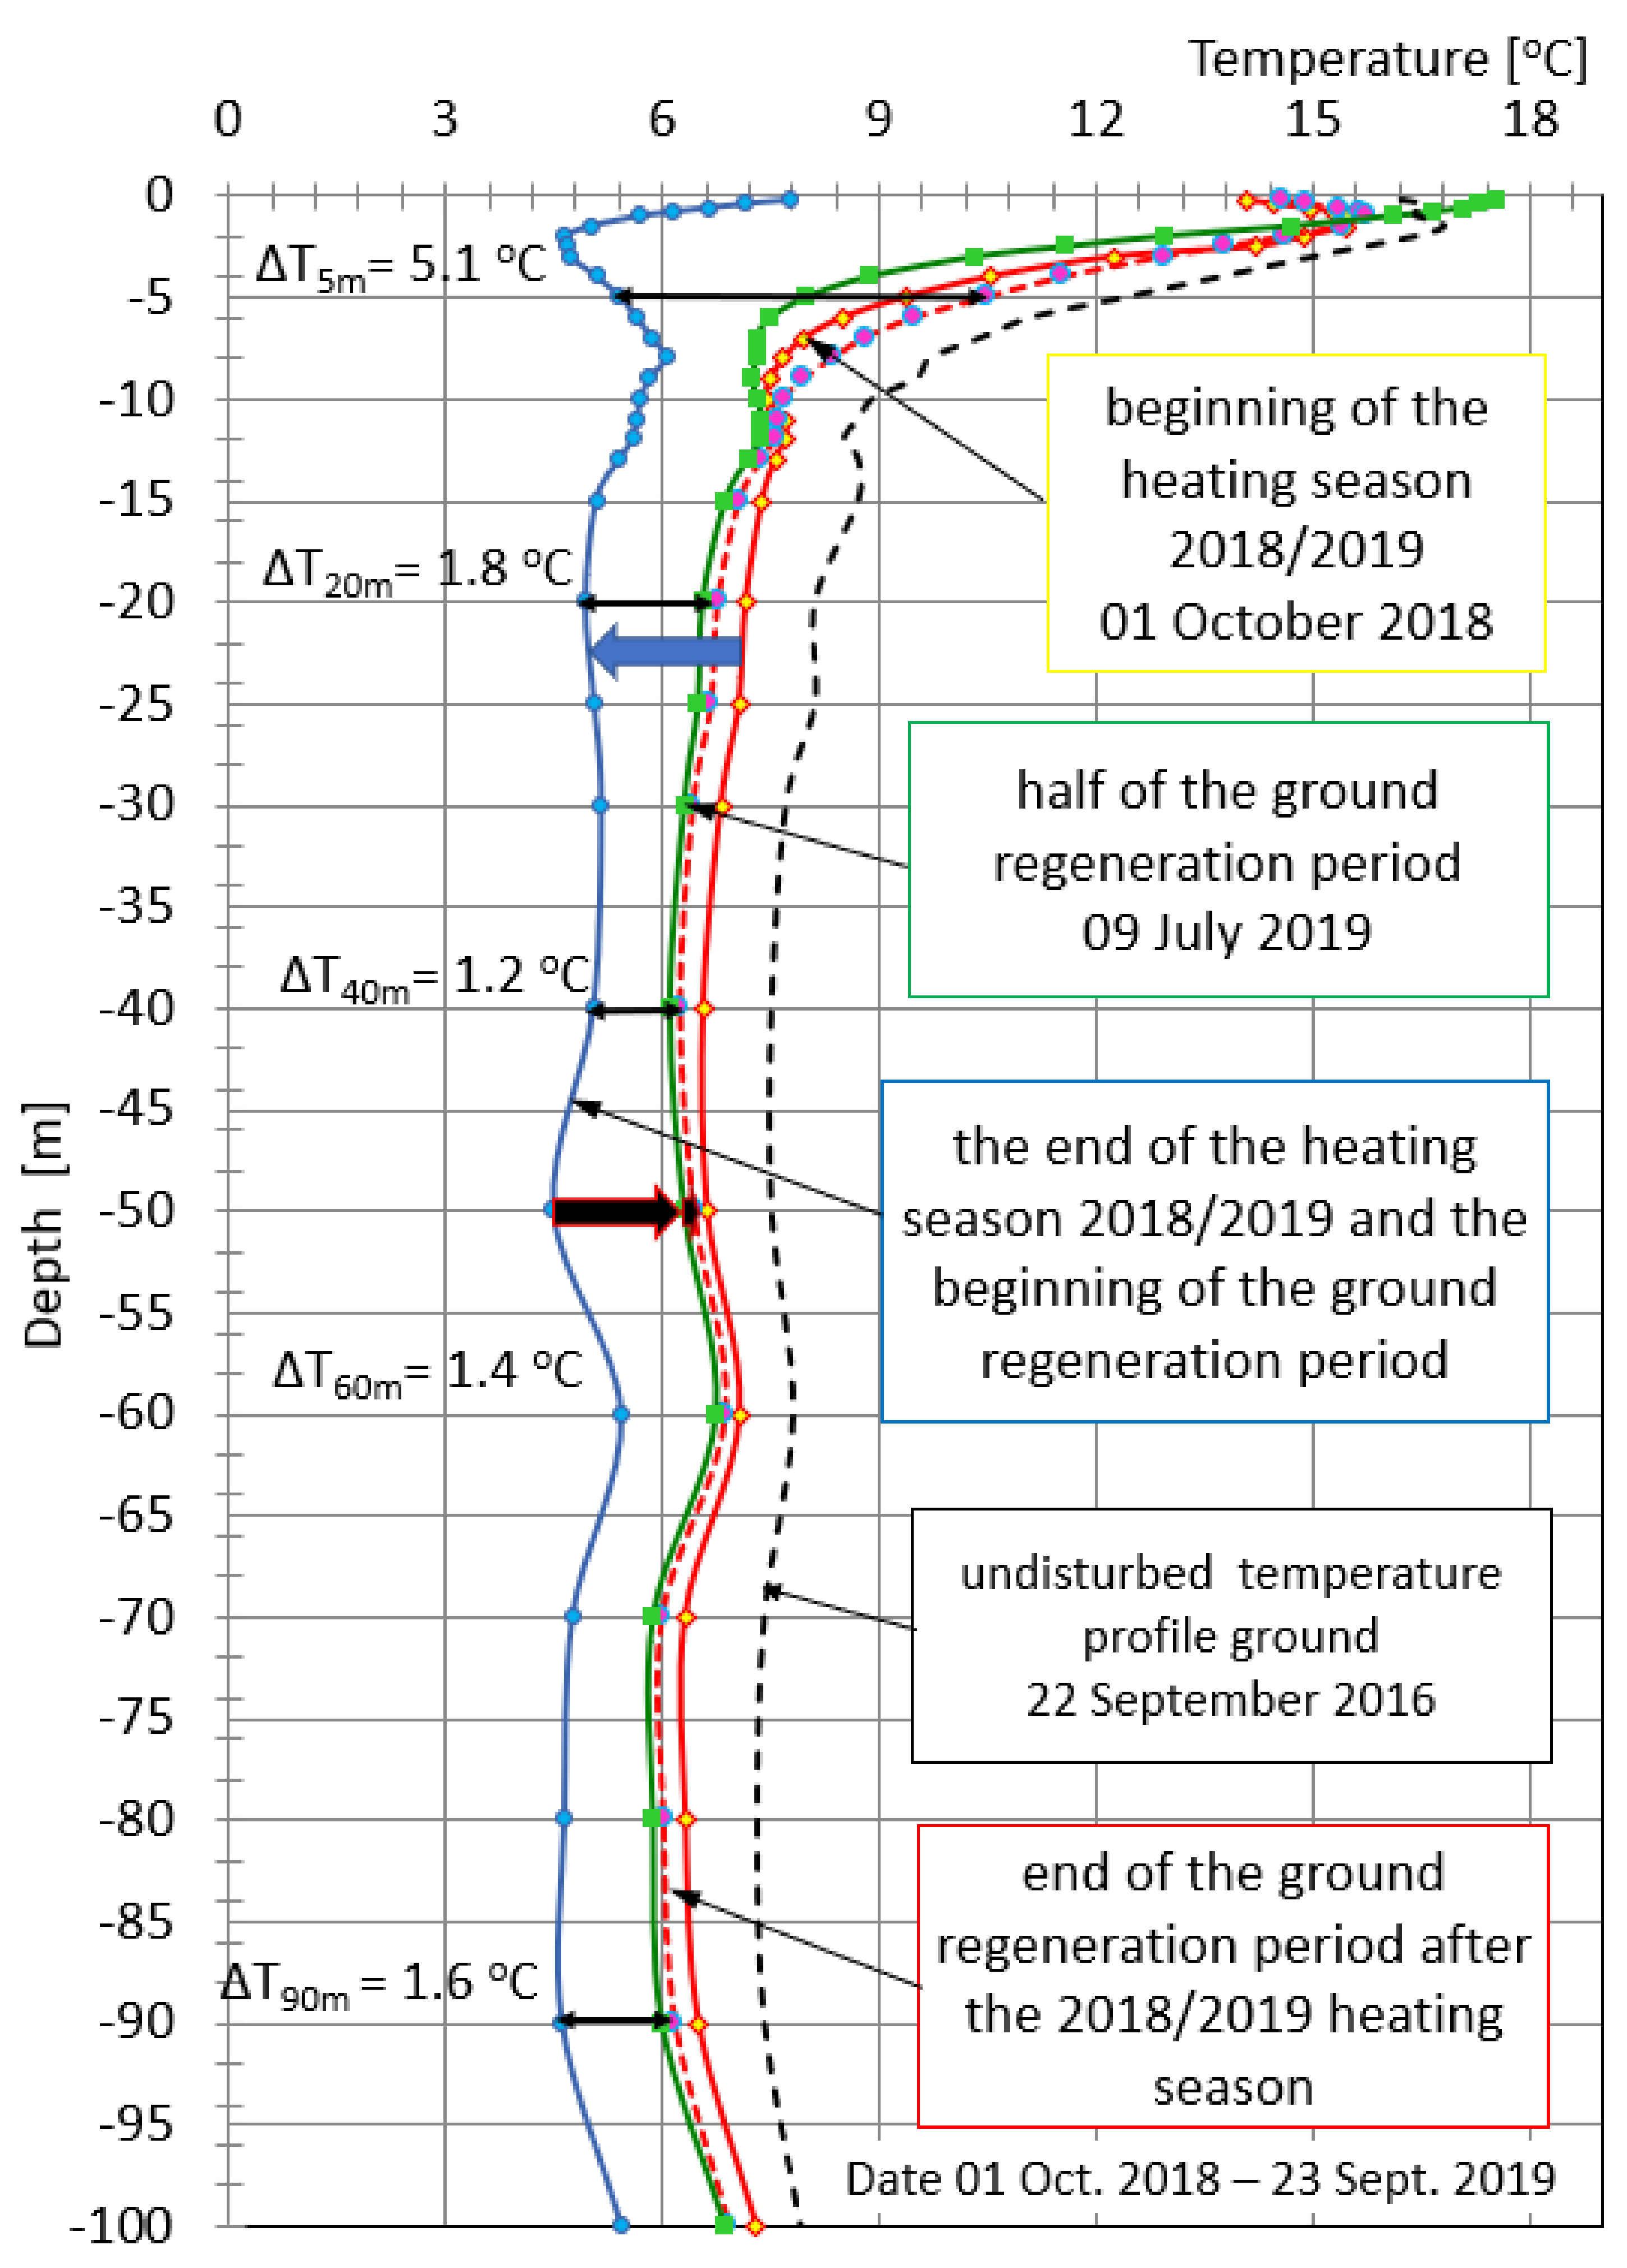
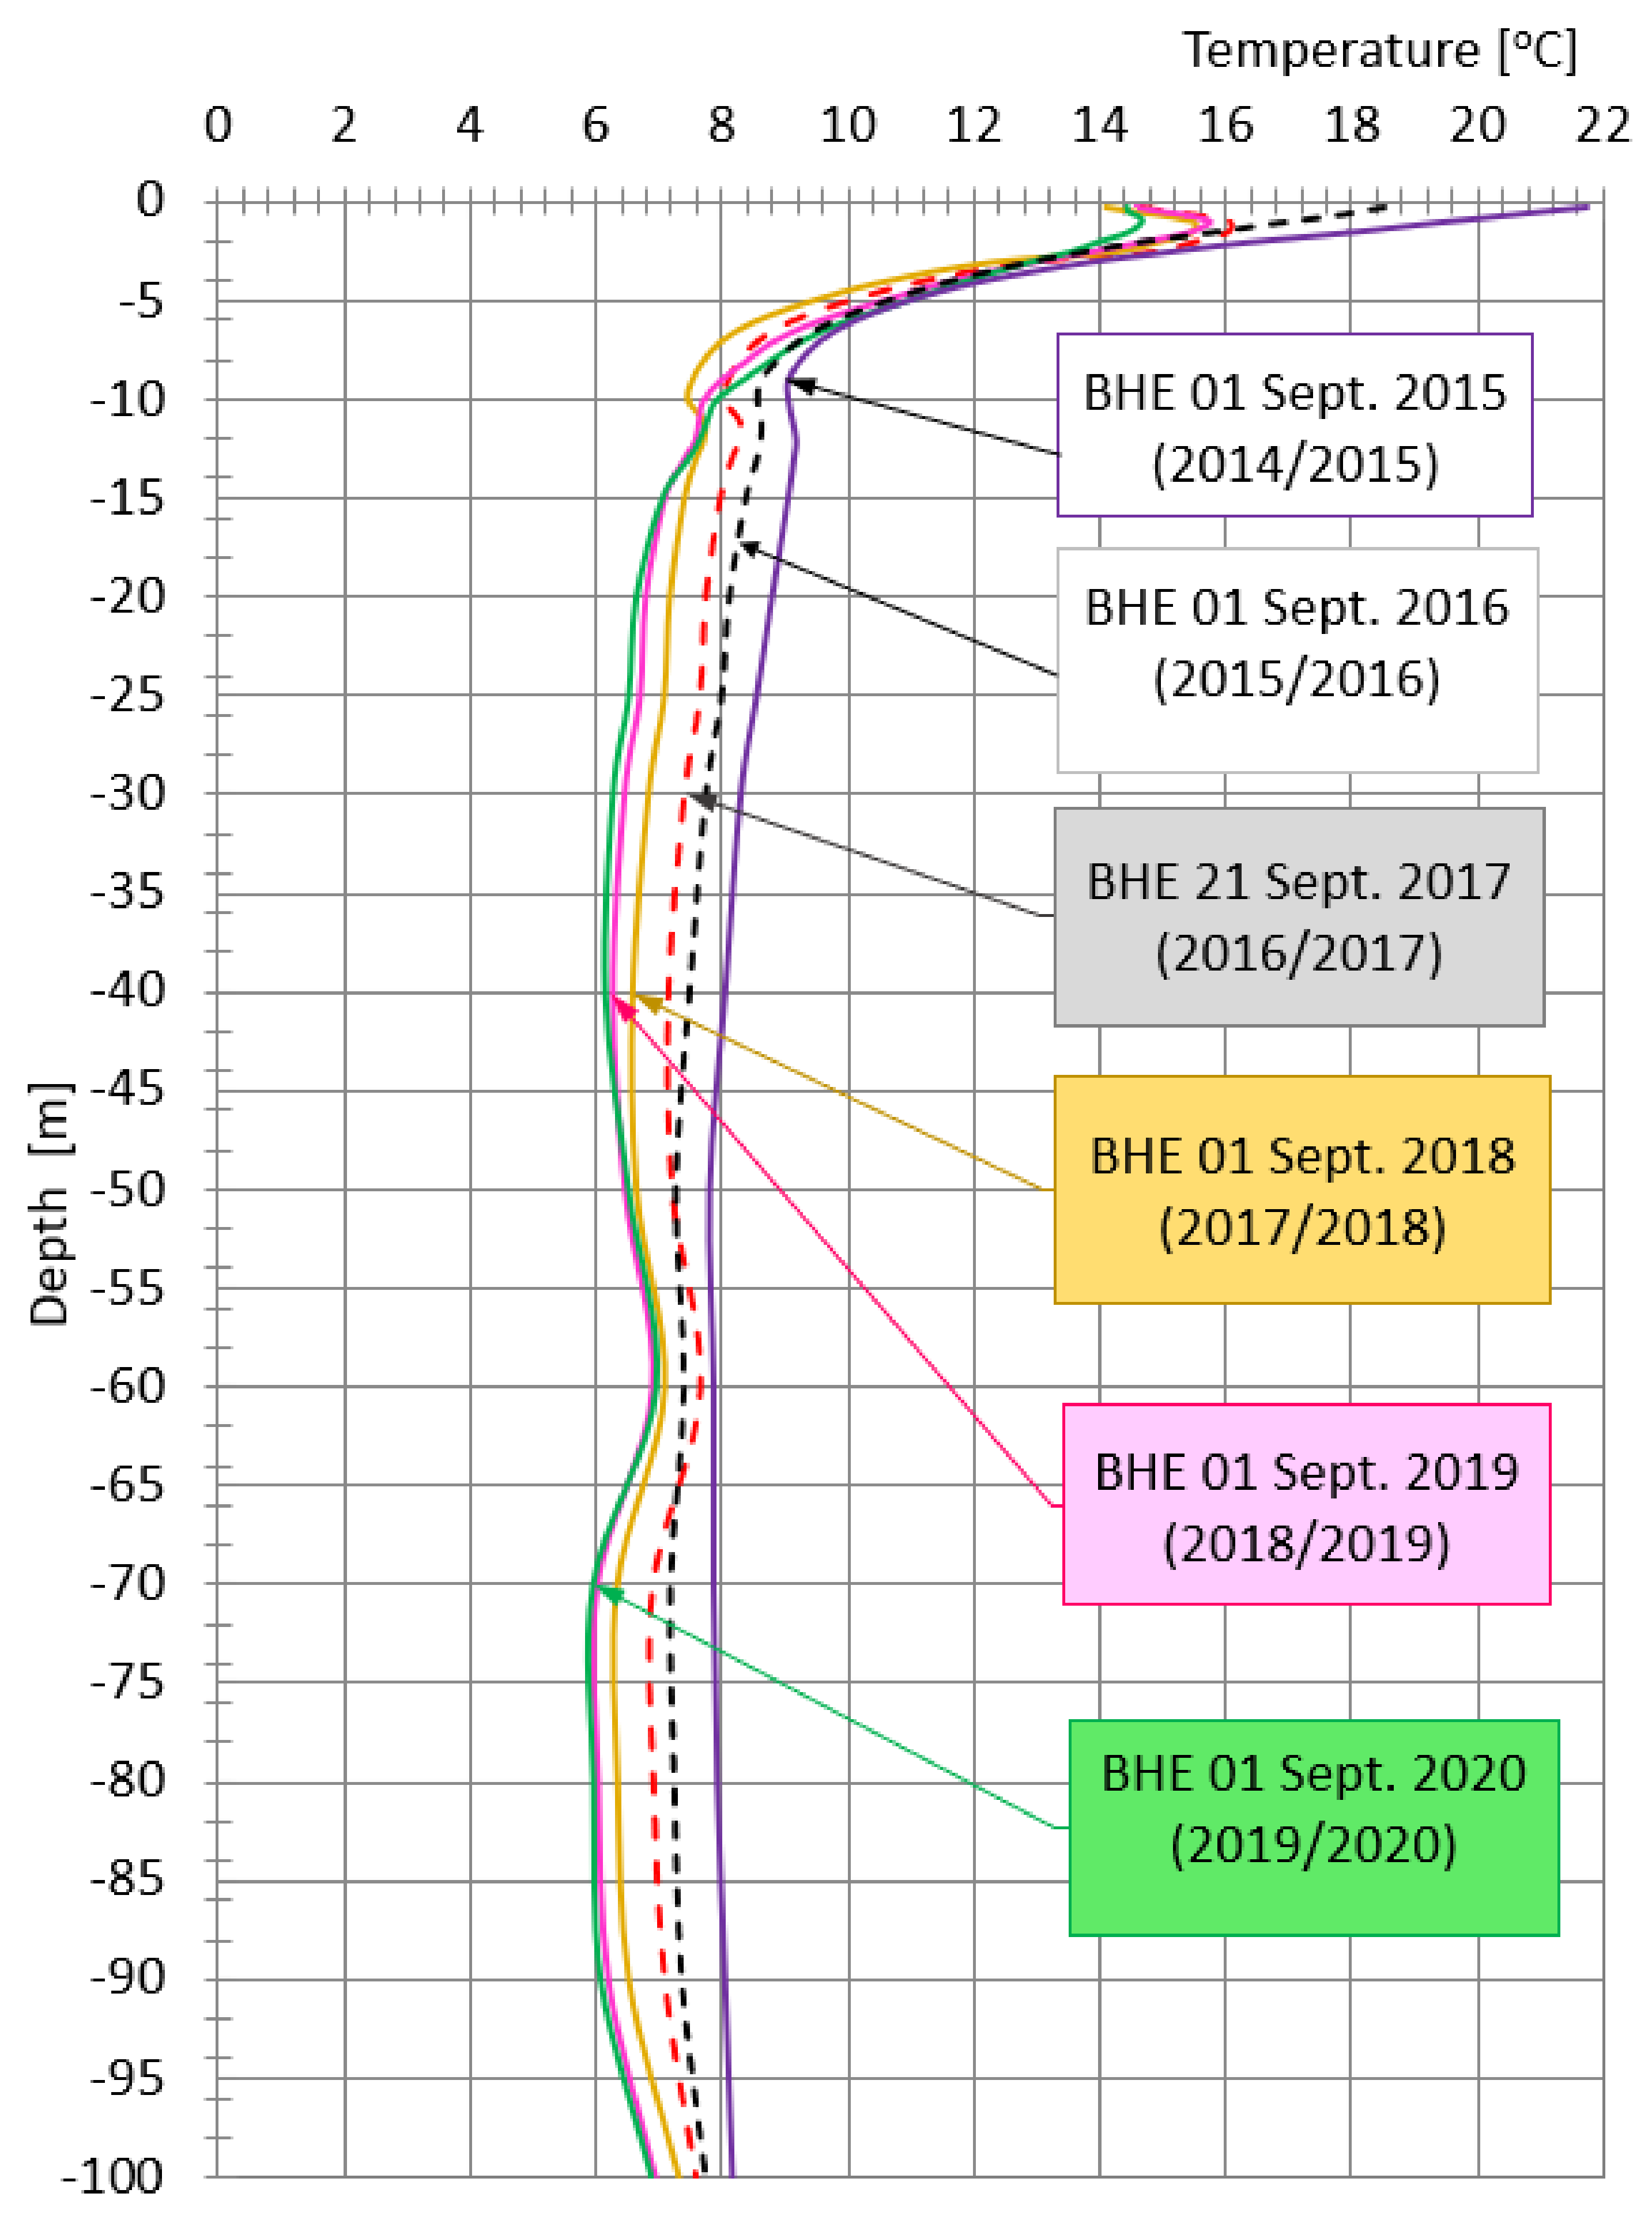
- The average temperature of the regenerated ground in 2018–2020 (the fifth and sixth heating season) remains at the same level of 9.6–9.7 °C, hence it is possible that a new stable thermal equilibrium has been established between the BHE and the ground. Possibly, it may be related, in this period, to warmer winters and a shorter heating season, and thus a longer period of the ground regeneration around the BHE.However, only further research, which the author will provide in the following years, will allow to confirm, or reject this thesis.
- The conducted research will help to better understand the changes taking place in the ground, and thus to better design lower heat sources for heat pumps systems, whether in the form of horizontal, vertical, oblique, or basket ground heat exchangers. They can be used to validate numerical models for convection and conduction of heat transport in the ground. The obtained results of measurements of temperature in the ground can be used for long-term simulations and are very valuable information, allowing for the introduction of, for example, corrections in very ideal, sometimes theoretical mathematical models, used to simulate lower heat sources, and allow to see the complexity of processes related to heat and mass transfer occurring in the ground.
- The article contributes to the scientific community, particularly by showing a very relevant and useful technical approach to quantify the cooling effect of soil based on detailed long-term monitoring of ground temperatures.
- From the point of view of the proper exploitation of the ground heat source, it seems important to introduce monitoring of shallow geothermal systems, especially in the case of large and extensive BHE installations. The number of checkpoints should depend on the number of GHE or installed thermal power. The ground monitoring should also be accompanied by the control of all other important technical parameters of the GSHP room, such as electricity consumption, inlet, and outlet temperatures of the evaporator and GSHP condenser, compressor operating hours, etc.
Funding
Institutional Review Board Statement
Informed Consent Statement
Data Availability Statement
Acknowledgments
Conflicts of Interest
Appendix A

| Month | Insolation [kWh/m2] | |||||
| Statistical 1991–2020 | 2016 (2015/2016) * | 2017 (2016/2017) * | 2018 (2017/2018) * | 2019 (2018/2019) * | 2020 (2019/2020) * | |
| IV | 185.7 | 142.8 | 169.7 | 248.6 | 292.6 | 255.7 |
| V | 254.1 | 295.7 | 279.9 | 363.2 | 195.0 | 227.2 |
| VI | 259.3 | 313.0 | 237.7 | 259.9 | 371.9 | 245.0 |
| VII | 256.9 | 177.1 | 252.5 | 202.0 | 257.6 | 261.4 |
| VIII | 250.5 | 216.1 | 237.7 | 294.3 | 298.4 | 258.0 |
| IX | 161.8 | 202.6 | 117.7 | 233.5 | 203.3 | 225.9 |
| Average | 233.0 | 224.6 | 215.9 | 266.9 | 269.8 | 245.5 |
| Annually I-XII | 1755.3 | 1688.9 | 1553.9 | 2008.5 | 2032.2 | 1846.1 |
| Month | Humidity [%] | |||||
| Statistical 1991–2020 | 2016 (2015/2016) * | 2017 (2016/2017) * | 2018 (2017/2018) * | 2019 (2018/2019) * | 2020 (2019/2020) * | |
| IV | 69.8 | 67.9 | 73.0 | 68.0 | 54.4 | 55.8 |
| V | 71.2 | 69.7 | 67.4 | 63.7 | 73.6 | 69.0 |
| VI | 73.1 | 68.3 | 73.4 | 62.3 | 67.9 | 75.9 |
| VII | 75.4 | 79.7 | 77.7 | 77.2 | 73.8 | 73.8 |
| VIII | 77.2 | 80.5 | 79.6 | 74.9 | 78.6 | 75.0 |
| IX | 82.5 | 80.9 | 85.4 | 78.6 | 79.2 | 81.5 |
| Average | 74.9 | 74.5 | 76.1 | 70.8 | 71.3 | 71.8 |
| Annually I–XII | 80.5 | 79.9 | 81.4 | 78.0 | 77.9 | 79.0 |
| Month | Total Precipitation [mm] | |||||
| Statistical 1991–2020 | 2016 (2015/2016) * | 2017 (2016/2017) * | 2018 (2017/2018) * | 2019 (2018/2019) * | 2020 (2019/2020) * | |
| IV | 37.7 | 37.3 | 78.0 | 41.0 | 4.1 | 5.1 |
| V | 69.1 | 46.7 | 101.1 | 31.2 | 100.4 | 72.0 |
| VI | 65.4 | 44.4 | 116.1 | 22.4 | 50.3 | 138.6 |
| VII | 86.5 | 186.6 | 82.8 | 144.8 | 113.5 | 43.2 |
| VIII | 69.4 | 68.6 | 108.2 | 25.9 | 100.7 | 97.5 |
| IX | 56.0 | 21.5 | 123.4 | 65.9 | 54.0 | 24.5 |
| Average | 64.0 | 67.5 | 101.6 | 55.2 | 70.5 | 63.5 |
| Annually I–XII | 610.2 | 790.0 | 934.6 | 536.2 | 617.6 | 639.9 |
References
- European Parliament. European Parliament Resolution of 15 January 2020 on the European Green Deal 2019, 2956 (RSP). Available online: https://www.europarl.europa.eu/doceo/document/TA-9-2020-0005_EN.html (accessed on 10 June 2021).
- European Parliament. European Parliament Resolution of 14 March 2019 on Climate Change-A European Strategic Long-Term Vision for a Prosperous, Modern, Competitive and Climate Neutral Economy in Accordance with the Paris Agreement 2019, 2582(RSP). Available online: https://www.europarl.europa.eu/doceo/document/TA-8-2019-0217_EN.html (accessed on 9 June 2021).
- International Energy Agency (IEA). Global Status Report for Buildings and Construction 2019; IEA: Paris, France, 2019; Available online: https://www.iea.org/reports/global-status-report-for-buildings-and-construction (accessed on 9 June 2021).
- United Nations Environment Programme. 2020 Global Status Report for Buildings and Construction: Towards a Zero-Emission, Efficient and Resilient Buildings and Construction Sector; United Nations Environment Programme: Nairobi, Kenya, 2020; Available online: https://globalabc.org/news/launched-2020-global-status-report-buildings-and-construction (accessed on 5 June 2021).
- Zhao, Y.; Pang, Z.; Huang, Y.; Ma, Z. An efficient hybrid model for thermal analysis of deep borehole heat exchangers. Geotherm. Energy 2020, 8, 18. [Google Scholar] [CrossRef]
- Zarrella, A.; Emmi, G.; Graci, S.; De Carli, M.; Cultrera, M.; Santa, G.D.; Galgaro, A.; Bertermann, D.; Müller, J.; Pockelé, L.; et al. Thermal Response Testing Results of Different Types of Borehole Heat Exchangers: An Analysis and Comparison of Interpretation Methods. Energies 2017, 10, 801. [Google Scholar] [CrossRef] [Green Version]
- Lee, S.-M.; Park, S.-H.; Jang, Y.-S.; Kim, E.-J. Proposition of Design Capacity of Borehole Heat Exchangers for Use in the Schematic-Design Stage. Energies 2021, 14, 822. [Google Scholar] [CrossRef]
- Minaei, A.; Maerefat, M. A new analytical model for short-term borehole heat exchanger based on thermal resistance capacity model. Energy Build. 2017, 146, 233–242. [Google Scholar] [CrossRef]
- Boban, L.; Miše, D.; Herceg, S.; Soldo, V. Application and Design Aspects of Ground Heat Exchangers. Energies 2021, 14, 2134. [Google Scholar] [CrossRef]
- Naicker, S.S.; Rees, S.J. Long-term high frequency monitoring of a large borehole heat exchanger array. Renew. Energy 2020, 145, 1528–1542. [Google Scholar] [CrossRef]
- Spitler, J.; Bernier, M. 2-Vertical borehole ground heat exchanger design methods. In Advances in Ground-Source Heat Pump Systems; Rees, S.J., Ed.; Woodhead Publishing: Oxford, UK, 2016; pp. 29–61. ISBN 978-0-08-100311-4. [Google Scholar] [CrossRef]
- Kasuda, T.; Archenbach, P. Earth Temperature and Thermal Diffusivity at Selected Stations in the United States; National Bureau of Standards: Gaithersburg, MD, USA, 1965. [Google Scholar] [CrossRef]
- Nian, Y.; Cheng, W. Analytical g-function for vertical geothermal boreholes with effect of borehole heat capacity. Appl. Therm. Eng. 2018, 140, 733–744. [Google Scholar] [CrossRef]
- Yu, X.; Li, H.; Yao, S.; Nielsen, V.; Heller, A. Development of an efficient numerical model and analysis of heat transfer performance for borehole heat exchanger. Renew. Energy 2020, 152, 189–197. [Google Scholar] [CrossRef]
- Wang, C.; Li, H.; Huang, Z.; Lu, Y.; Huang, X.; Gan, L. A new heat transfer model for single U-pipe ground heat exchanger. Appl. Therm. Eng. 2019, 154, 400–406. [Google Scholar] [CrossRef]
- Ghoreish-Madiseh, S.; Kuyuk, A.; de Brito, M.A.R. An analytical model for transient heat transfer in ground-coupled heat exchangers of closed-loop geothermal systems. Appl. Therm. Eng. 2019, 150, 696–705. [Google Scholar] [CrossRef]
- Li, P.; Guan, P.; Zheng, J.; Dou, B.; Tian, H.; Duan, X.; Liu, H. Field Test and Numerical Simulation on Heat Transfer Performance of Coaxial Borehole Heat Exchanger. Energies 2020, 13, 5471. [Google Scholar] [CrossRef]
- Zhou, A.; Huang, X.; Wang, W.; Jiang, P.; Li, X. Thermo-Hydraulic Performance of U-Tube Borehole Heat Exchanger with Different Cross-Sections. Sustainability 2021, 13, 3255. [Google Scholar] [CrossRef]
- Javadi, H.; Urchueguia, J.F.; Mousavi Ajarostaghi, S.S.; Badenes, B. Numerical Study on the Thermal Performance of a Single U-Tube Borehole Heat Exchanger Using Nano-Enhanced Phase Change Materials. Energies 2020, 13, 5156. [Google Scholar] [CrossRef]
- Katsura, T.; Sakata, Y.; Ding, L.; Nagano, K. Development of Simulation Tool for Ground Source Heat Pump Systems Influenced by Ground Surface. Energies 2020, 13, 4491. [Google Scholar] [CrossRef]
- Mitchell, M.S.; Spitler, J.D. An Enhanced Vertical Ground Heat Exchanger Model for Whole-Building Energy Simulation. Energies 2020, 13, 4058. [Google Scholar] [CrossRef]
- Jahanbin, A.; Semprini, G.; Natale Impiombato, A.; Biserni, C.; Rossi di Schio, E. Effects of the Circuit Arrangement on the Thermal Performance of Double U-Tube Ground Heat Exchangers. Energies 2020, 13, 3275. [Google Scholar] [CrossRef]
- Hałaj, E.; Pająk, L.; Papiernik, B. Finite Element Modeling of Geothermal Source of Heat Pump in Long-Term Operation. Energies 2020, 13, 1341. [Google Scholar] [CrossRef] [Green Version]
- Katsura, T.; Higashitani, T.; Fang, Y.; Sakata, Y.; Nagano, K.; Akai, H.; Oe, M. A New Simulation Model for Vertical Spiral Ground Heat Exchangers Combining Cylindrical Source Model and Capacity Resistance Model. Energies 2020, 13, 1339. [Google Scholar] [CrossRef] [Green Version]
- Zhang, X.; Zhang, T.; Li, B.; Jiang, Y. Comparison of Four Methods for Borehole Heat Exchanger Sizing Subject to Thermal Response Test Parameter Estimation. Energies 2019, 12, 4067. [Google Scholar] [CrossRef] [Green Version]
- Naldi, C.; Zanchini, E. Full-Time-Scale Fluid-to-Ground Thermal Response of a Borefield with Uniform Fluid Temperature. Energies 2019, 12, 3750. [Google Scholar] [CrossRef] [Green Version]
- Quaggiotto, D.; Zarrella, A.; Emmi, G.; De Carli, M.; Pockelé, L.; Vercruysse, J.; Psyk, M.; Righini, D.; Galgaro, A.; Mendrinos, D.; et al. Simulation-Based Comparison Between the Thermal Behavior of Coaxial and Double U-Tube Borehole Heat Exchangers. Energies 2019, 12, 2321. [Google Scholar] [CrossRef] [Green Version]
- Rivoire, M.; Casasso, A.; Piga, B.; Sethi, R. Assessment of Energetic, Economic and Environmental Performance of Ground-Coupled Heat Pumps. Energies 2018, 11, 1941. [Google Scholar] [CrossRef] [Green Version]
- Sun, X.-H.; Yan, H.; Massoudi, M.; Chen, Z.-H.; Wu, W.-T. Numerical Simulation of Nanofluid Suspensions in a Geothermal Heat Exchanger. Energies 2018, 11, 919. [Google Scholar] [CrossRef] [Green Version]
- Alberti, L.; Angelotti, A.; Antelmi, M.; La Licata, I.A. Numerical Study on the Impact of Grouting Material on Borehole Heat Exchangers Performance in Aquifers. Energies 2017, 10, 703. [Google Scholar] [CrossRef] [Green Version]
- Puttige, A.R.; Andersson, S.; Östin, R.; Olofsson, T.A. Novel Analytical-ANN Hybrid Model for Borehole Heat Exchanger. Energies 2020, 13, 6213. [Google Scholar] [CrossRef]
- Lei, X.; Zheng, X.; Duan, C.; Ye, J.; Liu, K. Three-Dimensional Numerical Simulation of Geothermal Field of Buried Pipe Group Coupled with Heat and Permeable Groundwater. Energies 2019, 12, 3698. [Google Scholar] [CrossRef] [Green Version]
- Sáez Blázquez, C.; Farfán Martín, A.; Martín Nieto, I.; Carrasco García, P.; Sánchez Pérez, L.S.; González-Aguilera, D. Efficiency Analysis of the Main Components of a Vertical Closed-Loop System in a Borehole Heat Exchanger. Energies 2017, 10, 201. [Google Scholar] [CrossRef] [Green Version]
- Neuberger, P.; Adamovský, R. Analysis and Comparison of Some Low-Temperature Heat Sources for Heat Pumps. Energies 2019, 12, 1853. [Google Scholar] [CrossRef] [Green Version]
- Rad, F.M.; Fung, A.S.; Rosen, M.A. An integrated model for designing a solar community heating system with borehole thermal storage. Energy Sustain. Dev. 2017, 36, 6–15. [Google Scholar] [CrossRef]
- Viccaro, M. Doped bentonitic grouts for implementing performances of low-enthalpy geothermal systems. Geotherm. Energy 2018, 6, 4. [Google Scholar] [CrossRef] [Green Version]
- Ouzzane, M.; Eslami-Nejad, P.; Aidoun, Z.; Lamarche, L. Analysis of the convective heat exchange effect on the undisturbed ground temperature. Sol. Energy 2014, 108, 340–347. [Google Scholar] [CrossRef]
- Pan, A.; Lu, L.; Tian, Y. A new analytical model for short vertical ground heat exchangers with Neumann and Robin boundary conditions on ground surface. Int. J. Therm. Sci. 2020, 152, 106–326. [Google Scholar] [CrossRef]
- Nian, Y.; Wang, X.; Xie, K.; Cheng, W. Estimation of ground thermal properties for coaxial BHE through distributed thermal response test. Renew. Energy 2020, 152, 1209–1219. [Google Scholar] [CrossRef]
- Boban, L.; Soldo, V.; Fuji, H. Investigation of heat pump performance in heterogeneous ground. Energy Convers. Manag. 2020, 211, 112–736. [Google Scholar] [CrossRef]
- Ahmadfard, M.; Bernier, M. A review of vertical ground heat exchanger sizing tools including an intermodel comparison. Renew. Sustain. Energy Rev. 2019, 110, 247–265. [Google Scholar] [CrossRef]
- Sailer, E.; Taborda, D.M.G.; Zdravković, L. A new approach to estimating temperature fields around a group of vertical ground heat exchangers in two-dimensional analyses. Renew. Energy 2018, 118, 579–590. [Google Scholar] [CrossRef]
- Hu, J. An improved analytical model for vertical borehole ground heat exchanger with multiple-layer substrates and groundwater flow. Appl. Energy 2017, 202, 537–549. [Google Scholar] [CrossRef]
- Morchio, S.; Fossa, M. On the ground thermal conductivity estimation with coaxial borehole heat exchangers according to different undisturbed ground temperature profiles. Appl. Therm. Eng. 2020, 173, 115–198. [Google Scholar] [CrossRef]
- Beier, R.A. Thermal response tests on deep borehole heat exchangers with geothermal gradien. Appl. Therm. Eng. 2020, 178, 115–447. [Google Scholar] [CrossRef]
- Gónzález-Santander, J.L. Asymptotic expansions for the ground heat transfer due to a borehole heat exchanger with a Neumann boundary condition. J. Eng. Math. 2019, 117, 47–64. [Google Scholar] [CrossRef]
- Kerme, E.D.; Fung, A.S. Heat transfer simulation, analysis and performance study of single U-tube borehole heat exchanger. Renew. Energy 2020, 145, 1430–1448. [Google Scholar] [CrossRef]
- Claesson, J.; Javed, S. Explicit Multipole Formulas for Calculating Thermal Resistance of Single U-Tube Ground Heat Exchangers. Energies 2018, 11, 214. [Google Scholar] [CrossRef] [Green Version]
- Naldi, C.; Jahanbin, A.; Zanchini, E. A New Estimate of Sand and Grout Thermal Properties in the Sandbox Experiment for Accurate Validations of Borehole Simulation Codes. Energies 2021, 14, 1149. [Google Scholar] [CrossRef]
- Sivasakthivel, T.; Philippe, M.; Murugesan, K.; Verma, V.; Hu, P. Experimental thermal performance analysis of ground heat exchangers for space heating and cooling applications. Renew. Energy 2017, 113, 1168–1181. [Google Scholar] [CrossRef]
- Zhai, X.; Cheng, X.; Wang, R. Heating and cooling performance of a mini type ground source heat pump system. Appl. Therm. Eng. 2017, 111, 1366–1370. [Google Scholar] [CrossRef]
- Atwany, H.; Hamdan, M.O.; Abu-Nabah, B.A.; Alami, A.H.; Attom, M. Experimental evaluation of ground heat exchanger in UAE. Renew. Energy 2020, 159, 538–546. [Google Scholar] [CrossRef]
- Vella, C.; Borg, S.P.; Micallef, D. The Effect of Shank-Space on the Thermal Performance of Shallow Vertical U-Tube Ground Heat Exchangers. Energies 2020, 13, 602. [Google Scholar] [CrossRef] [Green Version]
- Zarrella, A.; Zecchin, R.; Pasquier, P.; Guzzon, D.; Prataviera, E.; Vivian, J.; De Carli, M.; Emmi, G. Analysis of Retrofit Solutions of a Ground Source Heat Pump System: An Italian Case Study. Energies 2020, 13, 5680. [Google Scholar] [CrossRef]
- Bartolini, N.; Casasso, A.; Bianco, C.; Sethi, R. Environmental and Economic Impact of the Antifreeze Agents in Geothermal Heat Exchangers. Energies 2020, 13, 5653. [Google Scholar] [CrossRef]
- Badenes, B.; Mateo Pla, M.Á.; Magraner, T.; Soriano, J.; Urchueguía, J.F. Theoretical and Experimental Cost–Benefit Assessment of Borehole Heat Exchangers (BHEs) According to Working Fluid Flow Rate. Energies 2020, 13, 4925. [Google Scholar] [CrossRef]
- Badenes, B.; Mateo Pla, M.Á.; Lemus-Zúñiga, L.G.; Sáiz Mauleón, B.; Urchueguía, J.F. On the Influence of Operational and Control Parameters in Thermal Response Testing of Borehole Heat Exchangers. Energies 2017, 10, 1328. [Google Scholar] [CrossRef] [Green Version]
- Witte, H.J.L. Error analysis of thermal response tests. Appl. Energy 2013, 109, 302–311. [Google Scholar] [CrossRef]
- Lamarche, L.; Raymond, J.; Koubikana Pambou, C.H. Evaluation of the Internal and Borehole Resistances during Thermal Response Tests and Impact on Ground Heat Exchanger Design. Energies 2018, 11, 38. [Google Scholar] [CrossRef] [Green Version]
- Kurevija, T.; Strpić, K.; Koščak-Kolin, S. Applying Petroleum the Pressure Buildup Well Test Procedure on Thermal Response Test—A Novel Method for Analyzing Temperature Recovery Period. Energies 2018, 11, 366. [Google Scholar] [CrossRef] [Green Version]
- Jensen-Page, L.; Loveridge, F.; Narsilio, G.A. Thermal Response Testing of Large Diameter Energy Piles. Energies 2019, 12, 2700. [Google Scholar] [CrossRef] [Green Version]
- Schwarz, H.; Badenes, B.; Wagner, J.; Cuevas, J.M.; Urchueguía, J.; Bertermann, D. A Case Study of Thermal Evolution in the Vicinity of Geothermal Probes Following a Distributed TRT Method. Energies 2021, 14, 2632. [Google Scholar] [CrossRef]
- Sáez Blázquez, C.; Piedelobo, L.; Fernández-Hernández, J.; Nieto, I.M.; Martín, A.F.; Lagüela, S.; González-Aguilera, D. Novel Experimental Device to Monitor the Ground Thermal Exchange in a Borehole Heat Exchanger. Energies 2020, 13, 1270. [Google Scholar] [CrossRef] [Green Version]
- Bae, S.M.; Nam, Y.; Choi, J.M.; Lee, K.H.; Choi, J.S. Analysis on Thermal Performance of Ground Heat Exchanger According to Design Type Based on Thermal Response Test. Energies 2019, 12, 651. [Google Scholar] [CrossRef] [Green Version]
- Serageldin, A.A.; Radwan, A.; Sakata, Y.; Katsura, T.; Nagano, K. The Effect of Groundwater Flow on the Thermal Performance of a Novel Borehole Heat Exchanger for Ground Source Heat Pump Systems: Small Scale Experiments and Numerical Simulation. Energies 2020, 13, 1418. [Google Scholar] [CrossRef] [Green Version]
- Park, S.; Lee, S.; Lee, H.; Pham, K.; Choi, H. Effect of Borehole Material on Analytical Solutions of the Heat Transfer Model of Ground Heat Exchangers Considering Groundwater Flow. Energies 2016, 9, 318. [Google Scholar] [CrossRef] [Green Version]
- Sakata, Y.; Katsura, T.; Serageldin, A.A.; Nagano, K.; Ooe, M. Evaluating Variability of Ground Thermal Conductivity within a Steep Site by History Matching Underground Distributed Temperatures from Thermal Response Tests. Energies 2021, 14, 1872. [Google Scholar] [CrossRef]
- Sliwa, T.; Rosen, M.A. Natural and Artificial Methods for Regeneration of Heat Resources for Borehole Heat Exchangers to Enhance the Sustainability of Underground Thermal Storages: A Review. Sustainability 2015, 7, 13104–13125. [Google Scholar] [CrossRef] [Green Version]
- Miglani, S.; Orehounig, K.; Carmeliet, J. Integrating a thermal model of ground source heat pumps and solar regeneration within building energy system optimization. Appl. Energy 2018, 218, 78–94. [Google Scholar] [CrossRef]
- Zhao, Z.; Shen, R.; Feng, W.; Zhang, Y.; Zhang, Y. Soil Thermal Balance Analysis for a Ground Source Heat Pump System in a Hot-Summer and Cold-Winter Region. Energies 2018, 11, 1206. [Google Scholar] [CrossRef] [Green Version]
- Niemann, P.; Richter, F.; Speerforck, A.; Schmitz, G. Desiccant-Assisted Air Conditioning System Relying on Solar and Geothermal Energy during Summer and Winter. Energies 2019, 12, 3175. [Google Scholar] [CrossRef] [Green Version]
- He, Y.; Bu, X. Performance of Hybrid Single Well Enhanced Geothermal System and Solar Energy for Buildings Heating. Energies 2020, 13, 2473. [Google Scholar] [CrossRef]
- Cupeiro Figueroa, I.; Cimmino, M.; Helsen, L. A Methodology for Long-Term Model Predictive Control of Hybrid Geothermal Systems: The Shadow-Cost Formulation. Energies 2020, 13, 6203. [Google Scholar] [CrossRef]
- Mielke, P.; Bauer, D.; Homuth, S.; Götz, A.E.; Sass, I. Thermal effect of a borehole thermal energy store on the subsurface. Geotherm. Energy 2014, 2, 5. [Google Scholar] [CrossRef] [Green Version]
- Haotian, H.; Yimin, X.; Jianquan, L.; Tiecheng, Z.; Yanan, L.; Qian, Z. Thermal characteristics of a seasonal solar assisted heat pump heating system with an underground tank. Sustain. Cities Soc. 2020, 53, 101910. [Google Scholar] [CrossRef]
- Allaerts, K.; Coomans, M.; Salenbien, R. Hybrid ground-source heat pump system with active air source regeneration. Energy Convers. Manag. 2015, 90, 230–237. [Google Scholar] [CrossRef]
- Bo, X.; Xiaoling, C.; Yanping, Y.; Liangliang, S.; Hongwei, W.; Fariborz, H. A novel hybrid energy system combined with solar-road and soil-regenerator: Dynamic model and operational per-formance. Energy Convers. Manag. 2018, 156, 376–387. [Google Scholar] [CrossRef] [Green Version]
- Peel, M.C.; Finlayson, B.L.; McMahon, T.A. Updated world map of the Köppen-Geiger climate classification. Hydrol. Earth Syst. Sci. 2007, 11, 1633–1644. [Google Scholar] [CrossRef] [Green Version]
- Data from the Institute of Meteorology and Water Management. Available online: danepubliczne.imgw.pl/ (accessed on 28 April 2021). (In Polish).
- Piotrowska-Woroniak, J. Determination of the Selected Wells Operational Power with Borehole Heat Exchangers Operating in Real Conditions, Based On Experimental Test Energies. Energies 2021, 14, 2512. [Google Scholar] [CrossRef]
- Łapa, M. Executive project. In Reconstruction of the WBiIŚ Building of the Bialystok University of Technology Together with the Construction of An Internal Monitoring Installation under the Project “Improving the Energy Efficiency of the PB Infrastructure Using Renewable Heat Sources”, Scope: Construction of the Heat Pump Installation; Office Technika Grzewcza Solarsystem: Myślenice, Poland, 2014. (In Polish) [Google Scholar]
- Serial Geological Maps of Poland 1:50,000; Sheet 339–Bialystok (N-34-107-C); Ministry of Environmental Protection Natural Resources and Forestry; Polish Geological Institute; National Research Institute: Warsaw, Poland, 1998. Available online: http://baza.pgi.gov.pl/resources.html?type=map50&id=339 (accessed on 15 May 2021). (In Polish)
- Bigaj, Z. Project of Geological Works for Drilling Boreholes to Use Heat from the Earth; Hydrogeological Company PANGEA: Chrzanów, Poland, 2013. (In Polish) [Google Scholar]
- Earth Energy Designer ver.4.20 Software; Blocon AB: Lund, Sweden, 2019.
- Usowicz, B. Estimating the thermal properties of the soil. Acta Agrophysica 2002, 72, 135–165. Available online: http://users.ipan.lublin.pl/~usowicz/pdf/Estimation.pdf (accessed on 14 June 2021). (In Polish).
- Madejski, J. The Theory of Heat Transfer; University Publishing House of the Szczecin University of Technology: Szczecin, Poland, 1998; ISBN 83-87423-47-5. (In Polish) [Google Scholar]
- Cengel, Y.A.; Ghajar, A.J. Heat and Mass Transfer: Fundamentals and Applications; McGrawHill: New York, NY, USA, 2010; Available online: www.academia.edu/37959323/Yunus_A_%C3%87engel_Heat_and_mass_transfer (accessed on 10 June 2021).
- Jarmoc, W. Technical Design of the Multi-Point Temperature Measurement and Monitoring System; Elektrokomplex Company: Białystok, Poland, 2014. (In Polish) [Google Scholar]
- Piotrowska-Woroniak, J. Preliminary results of the temperature distribution measurements around the vertical ground heat exchangers tubes. Ecol. Chem. Eng. 2020, 27, 509–528. [Google Scholar] [CrossRef]
- Port, P.C. Guidelines for Designing, Realization and Receiving Installations Powered by Heat Pumps; Part 1; Polish Organization for the Development of Heat Pump Technology: Cracow, Poland, 2013. (In Polish) [Google Scholar]
- Kupiec, K.; Larwa, B.; Komorowicz, T.; Neupauer, K. Temperature profiles in the ground with heterogeneous physical properties. Chem. Eng. Appar. 2015, 54, 332–333. Available online: http://inzynieria-aparatura-chemiczna.pl/pdf/2015/2015-6/InzApChem_2015_6_332-333.pdf (accessed on 28 July 2021). (In Polish).
- Rybach, L.; Sanner, B. Ground-source heat pump systems the European experience. GHC Bull 2000, 21, 16–26. Available online: http://www.sanner-geo.de/media/art4.pdf (accessed on 10 June 2021).
- Szulgowska-Zgrzywa, M.; Fidorów-Kaprawy, N. Performance analysis of a brine-to-water heat pump and of its boreholes’ temperature change during three years of operation. Appl. Therm. Eng. 2017, 127, 233–244. [Google Scholar] [CrossRef]
- Piotrowska-Woroniak, J.; Załuska, W. Variability of Soil Temperatures During 5 Years of a Horizontal Heat Exchanger Operation Co-Operating with a Heat Pump in a Single-Family House. In Renewable Energy Sources: Engineering, Technology, Innovation: ICORES 2017; Springer International Publishing: Cham, Switzerland, 2018; pp. 161–175. ISSN 2352-2534/2018. [Google Scholar]
- Larwa, B. Heat Transfer Model to Predict Temperature Distribution in the Ground. Energies 2019, 12, 25. [Google Scholar] [CrossRef] [Green Version]
- Bryś, K.; Bryś, T.; Sayegh, M.A.; Ojrzyńska, H. Subsurface shallow depth soil layers thermal potential for ground heat pumps in Poland. Energy Build. 2018, 165, 64–75. [Google Scholar] [CrossRef]
- Karabetoglu, S.; Ozturk, Z.F.; Kaslilar, A.; Juhlin, C.H.; Sisman, A. Effect of layered geological structures on borehole heat transfer. Geothermics 2021, 91, 102043. [Google Scholar] [CrossRef]


| Month | Average Outside Air Temperature [°C] | |||||
|---|---|---|---|---|---|---|
| Statistical 1991–2020 | 2016 (2015/2016) * | 2017 (2016/2017) * | 2018 (2017/2018) * | 2019 (2018/2019) * | 2020 (2019/2020) * | |
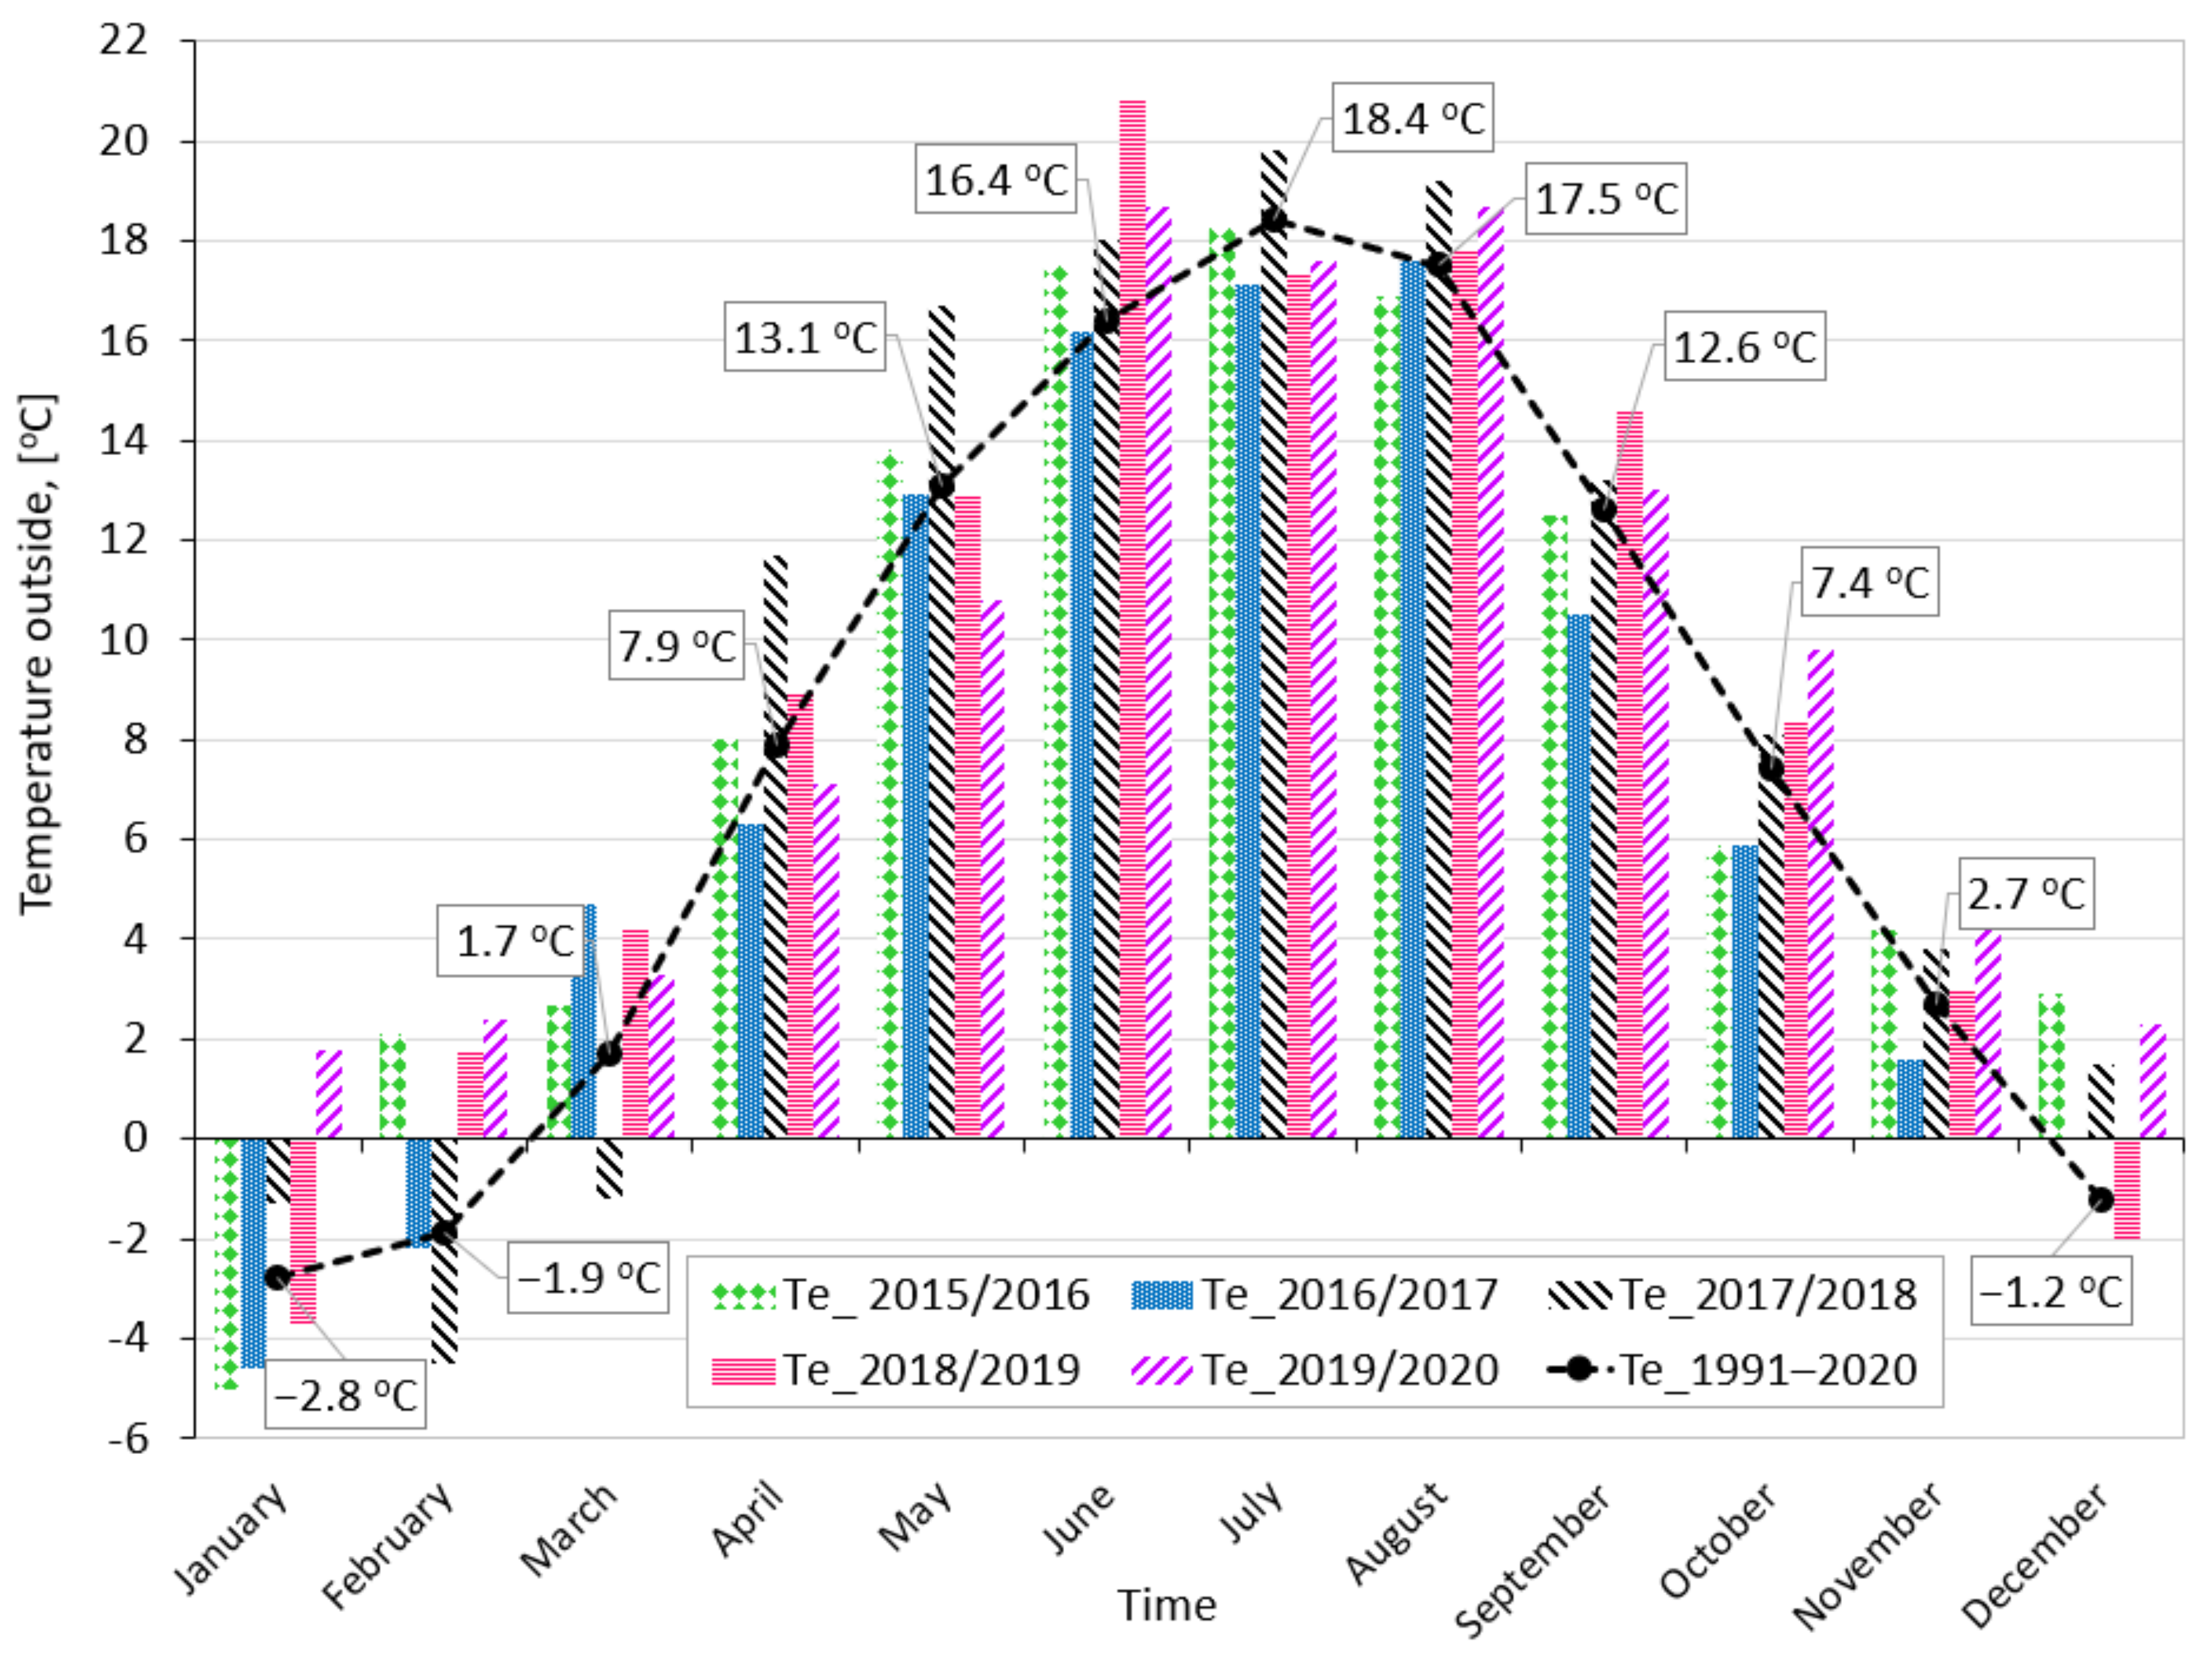
| April | 7.9 | 8.0 | 6.3 | 11.7 | 8.9 | 7.1 |
| May | 13.1 | 14.5 | 12.9 | 16.7 | 12.9 | 10.8 |
| June | 16.4 | 17.5 | 16.2 | 18.0 | 20.8 | 18.7 |
| July | 18.4 | 18.3 | 17.1 | 19.8 | 17.3 | 17.6 |
| August | 17.5 | 16.9 | 17.6 | 19.2 | 17.8 | 18.7 |
| September | 12.6 | 13.5 | 13.2 | 14.6 | 13.0 | 14.4 |
| Average | 14.3 | 14.8 | 13.9 | 16.7 | 15.1 | 14.6 |
| Month | Minimum Temperature Near the Ground [°C] | |||||
|---|---|---|---|---|---|---|
| Statistical 1991–2020 | 2016 (2015/2016) * | 2017 (2016/2017) * | 2018 (2017/2018) * | 2019 (2018/2019) * | 2020 (2019/2020) * | |
| April | −8.1 | −5.8 | −8.0 | −6.7 | −8.7 | −7.8 |
| May | −3.8 | −1.1 | −3.2 | 0.5 | −6.3 | −3.9 |
| June | 0.7 | −1.0 | −0.4 | −0.6 | 5.4 | 2.2 |
| July | 3.8 | 6.7 | 4.1 | 8.7 | 2.6 | 4.2 |
| August | 2.3 | 2.6 | 3.4 | 3.8 | 5.9 | 5.6 |
| September | −3.1 | −1.6 | −2.7 | −3.2 | −3.8 | −1.2 |
| Average | −1.4 | 0.0 | −1.1 | 0.4 | −0.8 | −0.2 |
| Years of the Heating Season | The Number of HDDs Sd [Day/K⋅Year] | Average Annual Outside Air Temperature [°C], [79] |
|---|---|---|
| 2016/2017 | 3276.4 ↑ | 7.2 |
| 2017/2018 | 3174.1 | 8.8 |
| 2018/2019 | 3131.0 | 8.7 |
| 2019/2020 | 2651.4 ↓ | 9.2 |
| 1991—2020 | 3496.1 | 7.7 |
| No. | Lithology [83] | Layer Top Bottom [83] [m.b.g.l.] | Percentage of Total Thickness [%] | Volumetric Specific Heat Cv = ρ × Cp [MJ/(m3∙K)], [84] | Thermal Diffusivity a × 10−6 [m2/s] | Number of Temperature Sensors Placed | |
|---|---|---|---|---|---|---|---|
| 1 | Native ground | 0 m | 2.0 m | 2 | 1.4 | 0.36 | 7 pcs |
| 2 | Clay dry | 2.0 m | 4.0 m | 2 | 1.6 | 0.41 | 3 pcs |
| 3 | Sand and Gravel, saturated | 4.0 m | 12 m | 8 | 1.62 | 0.51 | 8 pcs |
| 4 | Clay, moist-wet | 12 m | 40 m | 28 | 2.4 | 0.65 | 6 pcs |
| 5 | Muds | 40 m | 45 m | 5 | 2.5 | 1.35 | 1 pcs |
| 6 | Clay, moist-wet | 45 m | 100 m | 55 | 2.4 | 0.65 | 5 pcs |
| Measurement range | from (−55) °C to +125 °C |
| Supply voltage | from 3.0 V to 5.5 V |
| Resolution | from 9 to 12 bits (0.0625 °C at 12 bit) |
| Sensor dimensions | Diameter: 6 mm Length: 51 mm |
| Cover protection degree | IP65 |
| No. | Dates | Season | The Number of Days |
|---|---|---|---|
| 1 | 22 September 2016–9 April 2017 | heat pump operation, heating season 2016/2017 | 200 |
| 2 | 10 April 2017–21 September 2017 | regeneration of wells after the heating season 2016/2017 | 165 |
| 3 | 22 September 2017–10 April 2018 | heat pump operation, heating season 2017/2018 | 201 |
| 4 | 11 April 2018–30 September 2018 | regeneration of wells after the heating season 2017/2018 | 173 |
| 5 | 1 October 2018–23 April 2019 | heat pump operation, heating season 2018/2019 | 205 |
| 6 | 24 April 2019–23 September 2019 | regeneration of wells after the heating season 2018/2019 | 153 |
| 7 | 24 September 2019–8 April 2020 | heat pump operation, heating season 2019/2020 | 198 |
| 8 | 9 April 2020–12 October 2020 | regeneration of wells after the heating season 2019/2020 | 187 |
| Borehole Depth | The Period of the Ground Regeneration | Temperature Rise in the Wellbore |ΔT| [°C] | |
|---|---|---|---|
| Initial Temperature T1 [°C] Start April | Final Temperature T2 [°C] Stop September | ||
| Season 2016/2017 | |||
| 5 m | 2.5 | 10.0 | 7.5 |
| 20 m | 1.8 | 7.8 | 6.0 |
| 40 m | 1.7 | 7.2 | 5.5 |
| 60 m | 4.0 | 7.7 | 3.7 |
| 90 m | 3.4 | 7.1 | 3.7 |
| Average | 2.2 | 10.2 | 8.0 |
| Season 2017/2018 | |||
| 5 m | 4.3 | 9.4 | 5.1 |
| 20 m | 4.3 | 7.2 | 2.9 |
| 40 m | 4.5 | 6.6 | 2.1 |
| 60 m | 5.4 | 7.1 | 1.7 |
| 90 m | 4.7 | 6.5 | 1.8 |
| Average | 4.1 | 9.6 | 5.5 |
| Season 2018/2019 | |||
| 5 m | 5.4 | 10.5 | 5.1 |
| 20 m | 5.0 | 6.8 | 1.8 |
| 40 m | 5.1 | 6.3 | 1.2 |
| 60 m | 5.5 | 6.9 | 1.4 |
| 90 m | 4.6 | 6.2 | 1.6 |
| Average | 5.5 | 9.7 | 4.2 |
| Season 2019/2020 | |||
| 5 m | 4.6 | 10.9 | 6.3 |
| 20 m | 3.6 | 6.6 | 3.0 |
| 40 m | 3.8 | 6.1 | 2.3 |
| 60 m | 5.0 | 6.9 | 1.9 |
| 90 m | 4.2 | 6.1 | 1.9 |
| Average | 4.3 | 9.6 | 5.3 |
| No. | Dates | Average Well Temperature [°C] |
|---|---|---|
| 1 | 1 September 2015 | 11.8 |
| 2 | 1 September 2016 | 10.7 |
| 3 | 1 September 2017 | * |
| 21 September 2017 | 10.2 | |
| 4 | 1 September 2018 | 9.6 |
| 5 | 1 September 2019 | 9.7 |
| 6 | 1 September 2020 | 9.6 |
Publisher’s Note: MDPI stays neutral with regard to jurisdictional claims in published maps and institutional affiliations. |
© 2021 by the author. Licensee MDPI, Basel, Switzerland. This article is an open access article distributed under the terms and conditions of the Creative Commons Attribution (CC BY) license (https://creativecommons.org/licenses/by/4.0/).
Share and Cite
Piotrowska-Woroniak, J. Assessment of Ground Regeneration around Borehole Heat Exchangers between Heating Seasons in Cold Climates: A Case Study in Bialystok (NE, Poland). Energies 2021, 14, 4793. https://doi.org/10.3390/en14164793
Piotrowska-Woroniak J. Assessment of Ground Regeneration around Borehole Heat Exchangers between Heating Seasons in Cold Climates: A Case Study in Bialystok (NE, Poland). Energies. 2021; 14(16):4793. https://doi.org/10.3390/en14164793
Chicago/Turabian StylePiotrowska-Woroniak, Joanna. 2021. "Assessment of Ground Regeneration around Borehole Heat Exchangers between Heating Seasons in Cold Climates: A Case Study in Bialystok (NE, Poland)" Energies 14, no. 16: 4793. https://doi.org/10.3390/en14164793
APA StylePiotrowska-Woroniak, J. (2021). Assessment of Ground Regeneration around Borehole Heat Exchangers between Heating Seasons in Cold Climates: A Case Study in Bialystok (NE, Poland). Energies, 14(16), 4793. https://doi.org/10.3390/en14164793