1. Introduction
Short circuits are one of the most common disturbances occurring in power systems. A short circuit is a connection between two or more points of a power system that is not expected in the normal operating state, whereby the voltages of the shorted points in the normal operating state are different [
1,
2]. Short circuits can be single-phase, two-phase, two-phase-to-earth, and three-phase. In overhead high- and extra-high-voltage power networks, single-phase shorts-circuits are the dominant disturbances type (more than two-thirds of all the short-circuits). The causes of short circuits can be different. They are classified into electrical and non-electrical. In overhead lines, the main cause of short circuits are atmospheric overvoltages.
Short-circuit disturbances can cause many negative phenomena in power networks. This results from the flow of short-circuit currents where values are many times greater than the currents in the normal operating state. The effects of short circuits can be both local—limited to the faulted system elements, or global—affecting the entire power system. The most important effects of short circuits include heavy heating of the conductors by the short circuit current, the occurrence of high electrodynamic forces between the electric conductors and the generation of shock hazard. To evaluate the effects of these phenomena, short-circuit currents have to be calculated, as experimental studies of short circuits in real networks are practically impossible. Accordingly, the analysis of short-circuit currents can be performed only theoretically with the use of appropriate mathematical models.
The short-circuit current distributions are analyzed both in power lines and in substations. In the case of power lines, it is the short-circuit currents returning via the earth and short-circuit currents returning in earth wires to the short-circuit supply sites that are determined most frequently. The knowledge of the value of earth return currents is indispensable for determining the earth potential rise (EPR), on the basis of which the assessment of the electric shock hazard to humans and animals during single-phase earth faults is assessed [
3].
Ensuring the safety of bystanders and workers is always a top priority in the operation of overhead transmission lines. The publication [
4] analyzed the influence of many factors on the EPR in a 230 kV line. They emphasized that, due to the complexity of the problem and the large amount of data required, there are no simple methods for calculating the EPR for short circuits in high voltage transmission lines. Such calculations can only be performed using computer simulation programs, and there is only limited information on this subject in the literature. Another example are the publications [
5,
6], which analyzed the EPR in the system of a 138 kV transmission line and a 25 kV distribution line, which are placed on common towers. In these cases, advanced computer models were used for these studies as well. The knowledge of return currents through earth wires is important in view of their proper selection of these wires, which have to withstand the short-circuit conditions. Publication [
7] presents a model and a method that allows the calculation of short-circuit current distribution in the earth wires of high-voltage power lines. This publication proposed a procedure to calculate the initial short-circuit current for a short-circuit at any tower of an overhead line and, then, to calculate the current distribution in each span of the line. In publication [
8], an advanced short-circuit current distribution model was used to analyze an earth fault in a 220 kV overhead transmission line. The aim of this research was to explain the causes of earth wire breaking. In publication [
9], equations for accurate calculation of the short-circuit current distribution in earth wires of overhead transmission lines were derived. Their validity was confirmed by the excellent agreement occurring between the calculation and measurement results. Apart from that, analyses of short-circuit current distribution in power lines can be also conducted for other purposes, e.g., localization of short-circuits in transmission lines based on currents flowing in earth wires [
10].
The analysis of short-circuit current distribution in substations is mainly conducted to evaluate the shock hazard. In this case, the scale of the hazard greatly depends on part of short-circuit current flowing to the substation earthing electrode. This electrode is connected to all conductive elements of the construction objects within the substation, transformer neutral points, metallic sheaths and armors of power cables, as well as power line earth wires.
During a single-phase short-circuit in the substation, all above-mentioned elements create a pathway for short-circuit current in this extensive system of connections. These issues are covered, among others, by IEEE guidelines [
11]. The determination of short circuit current distribution in substations requires the extensive use of models that also consider transformers and connected power lines. An integral part of these models are clearly the models of overhead lines. An example is the publication [
12], as well as the authors’ research presented in [
13].
A precise mathematical description of short-circuit current distribution in power lines is a complex issue. This is a result of electromagnetic couplings between the line conductors as well as the fact that overhead lines are not a homogeneous structure due to the variation in the length of individual sections (spans) and tower footing resistance. According to these reasons, simplified models are used in practical calculations of short-circuit current distributions.
We developed, and present in this paper (
Section 2), a set of such models varying in complexity. These models were then submitted to simulation studies. The aim of this research was a critical comparative analysis in the aspect of errors of calculations of short-circuit currents flowing in the earth electrodes of high-voltage overhead line towers (
Section 3). This analysis allowed for an assessment of the validity of the simplifying assumptions made and recommendations for practical applications of the proposed models.
Although numerous models for the analysis of short-circuit current distributions in lines are presented and used in the literature, studies concerning comparative analyses and accuracy assessment of such models are very rare. An example is the publication [
14]. Therefore, it can be expected that the original and innovative research results presented in this publication will find application in the design and operation of high-voltage overhead power lines in the scope of electric shock safety as well as protection automation systems configuration.
The paper is organized as follows:
a review of the specific literature on short-circuit current distribution in overhead lines is presented in
Section 2;
calculation results and comparative analysis of the proposed models are presented in
Section 3; and
2. Power Line Models for Determining Short-Circuit Currents in Towers Earthing Systems
The subject of this study was high-voltage overhead power lines.
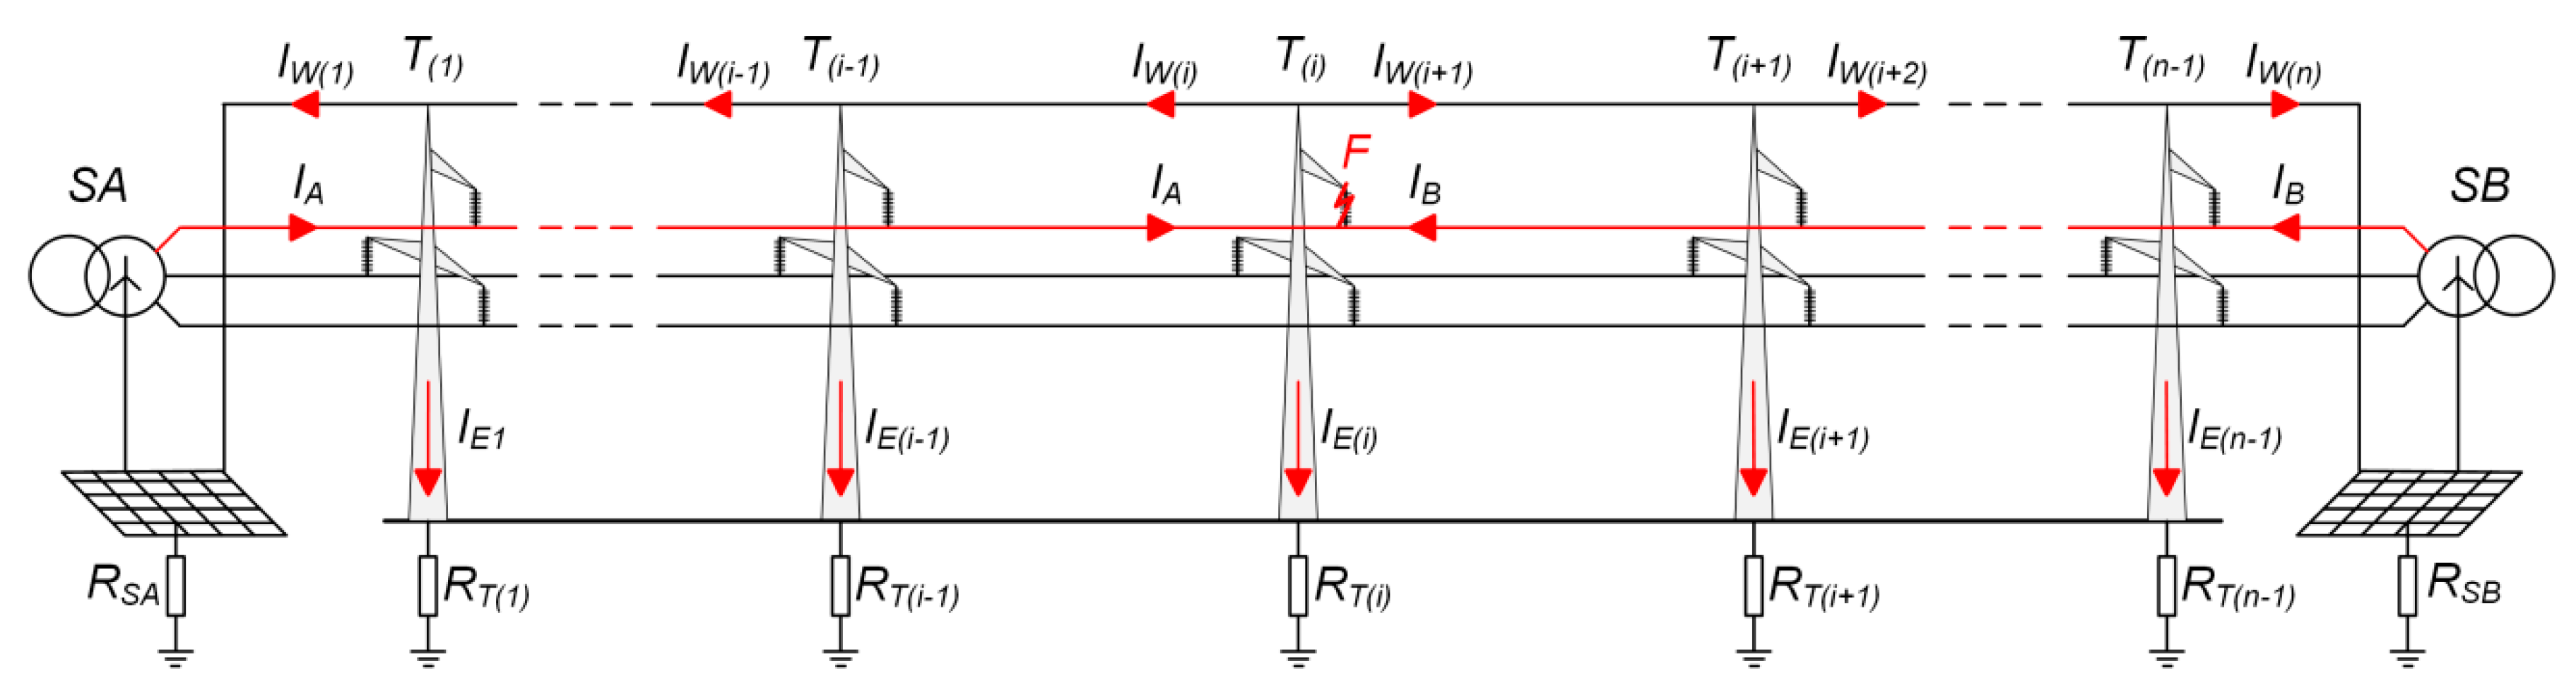
Figure 1 shows the layout of a power line, double-sided supplied from substations
SA and
SB. The power line consists of
n sections (spans) of specified length and
n–1 towers. All abbreviations and symbols used in the article are explained in detail in
Appendix A.
We assumed that a single-phase short-circuit F to tower T(i) takes place in the power line, resulting in flow of short-circuit currents IA, IB from the supply substations SA, SB to the short-circuit site. These currents return to the supply substations through earth wires (IW), also earth (IE), and tower earthing systems connected to the earth wires.
The development of mathematical model to determine the distribution of
IA,
IB,
IW,
IE currents is a complex problem because a power line is not homogenous. It results both from the various lengths of particular sections (spans) and different tower footing resistances. A variety of approaches to this problem has been presented in the literature. Despite this diversity, the models can be classified into two basic groups [
14,
15].
The first group includes models based on the long line theory. The theoretical basis for these models was formulated in [
16] and further developed in [
9]. Their special feature is that they are applicable only to homogeneous power line structures. Models belonging to this group can be either continuous or discrete. The circuit representation of discrete models has a ladder structure. Although these models have limitations, they find practical application due to their relatively simple analytical form. An example of such applications can be found in the CIGRÉ guidelines [
3].
In the second group of models, the current and voltage equations are directly formulated for discrete power lines. The theoretical basis of these models has been formulated in publications [
17,
18]. These models are multidimensional systems of algebraic equations. Appropriate numerical methods and computer programs must be used to solve them.
Despite these inconveniences, the considered models have many advantages. Specifically, these models can be applied to non-homogeneous power line structures. Therefore, they are widely used, among others, in the research being the subject of the publications cited in the first section [
4,
5,
6,
7,
8,
10,
13]. Moreover, in the publication [
19], concerning the analysis and optimization of earthing systems in substations, and, in the publication [
20], concerning the study of appropriate selection of earth wire, these models were also used.
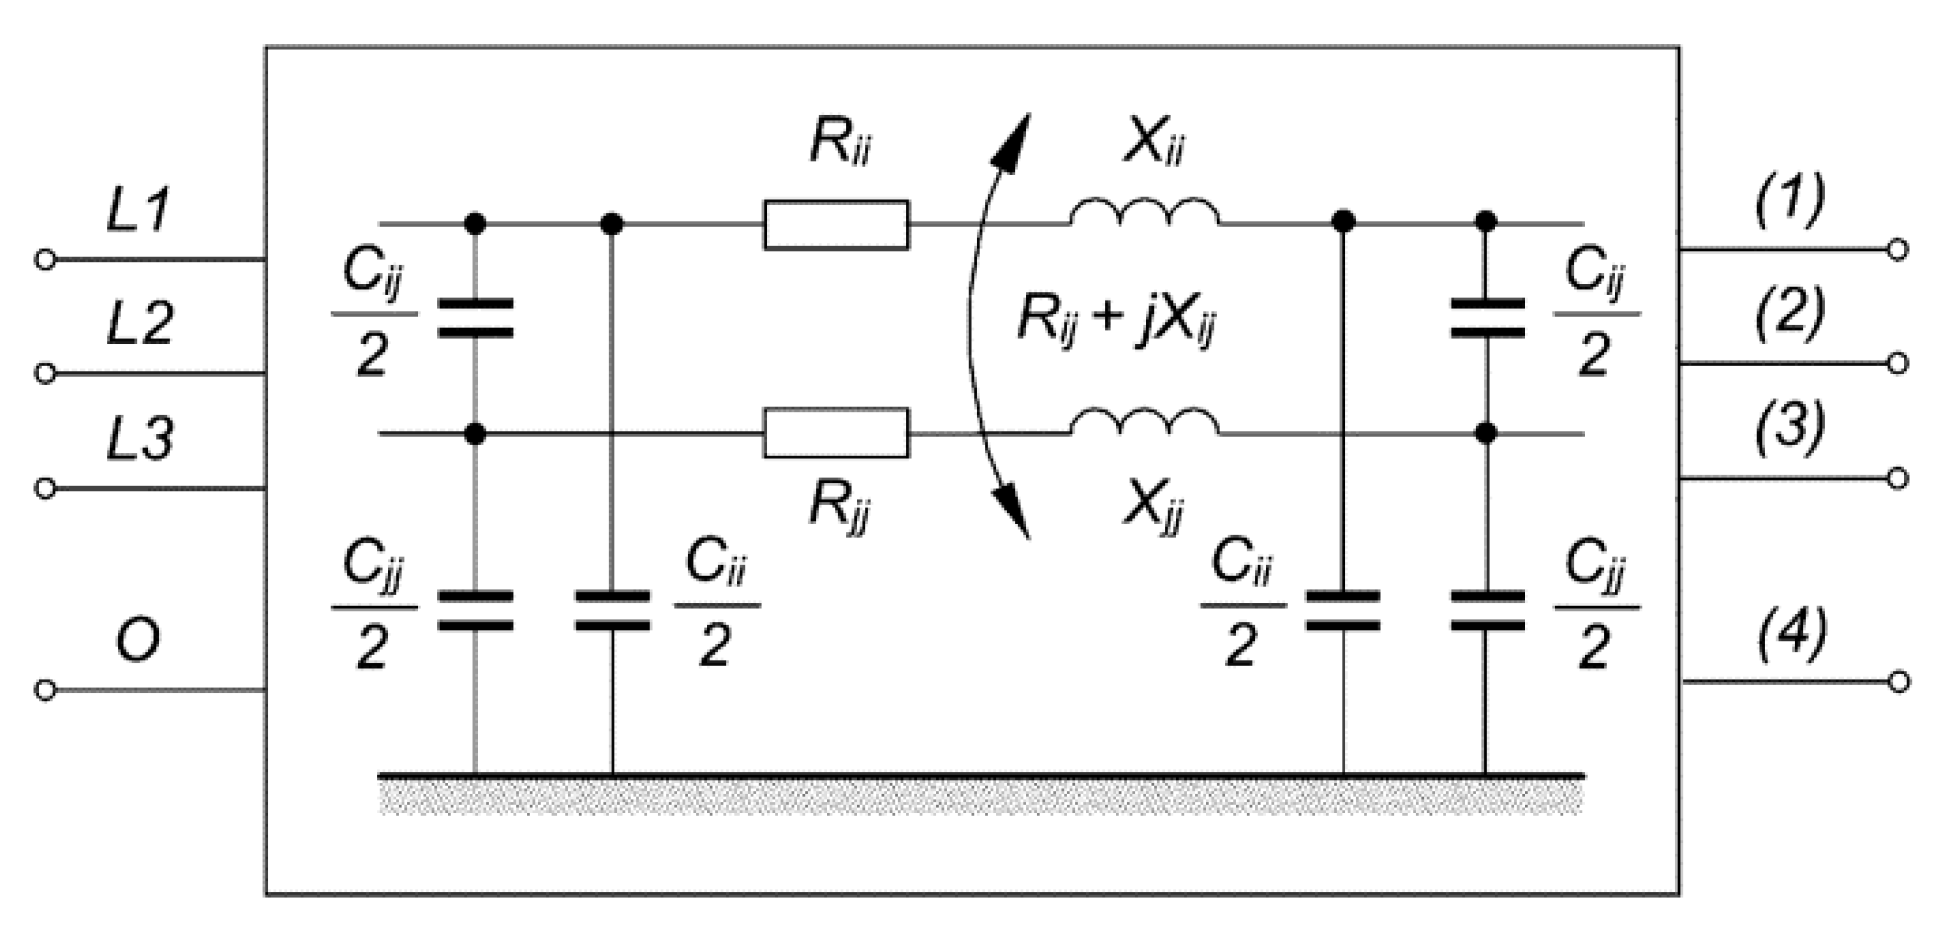
Due to the high practical importance of discrete models belonging to the second group, they became the subject of the authors’ research. The development of a model for the short circuit current distribution requires the appropriate model of the line sections (spans) to be applied. For the analysis of short-circuit currents, line models with lumped parameters (
Figure 2), the values of which are determined for a network frequency and a given soil resistivity, are sufficient [
21].
Consequently, taking into account above aspects, we obtain multiphase models (M) of non-homogeneous power line structures, in which specialized simulation programs, e.g., EMTP-ATP have to be used for practical calculations [
4,
5,
6,
8,
10,
13,
20]. The multiphase model can be used for determining the short-circuit current distribution in overhead power lines of any wire configuration. There are no limitations as to the number of circuits and earth wires, their construction and spatial distribution, the number and length of spans, etc. The spans are modeled by capacitively and magnetically coupled
π—section equivalent circuits (
Figure 1), the parameters of which are determined by the program based on typical power line design data [
22].
Despite its evident advantages, the multiphase model (M) has also some disadvantages. The most important is the complexity of its creation. Therefore, we proposed five power line models for determining currents in the towers earthing systems: reference model (R) and models (A), (B), (C), and (D), which are simplifications of the reference model. These models were compared for their accuracy of calculating short-circuited tower earthing currents (
Section 3).
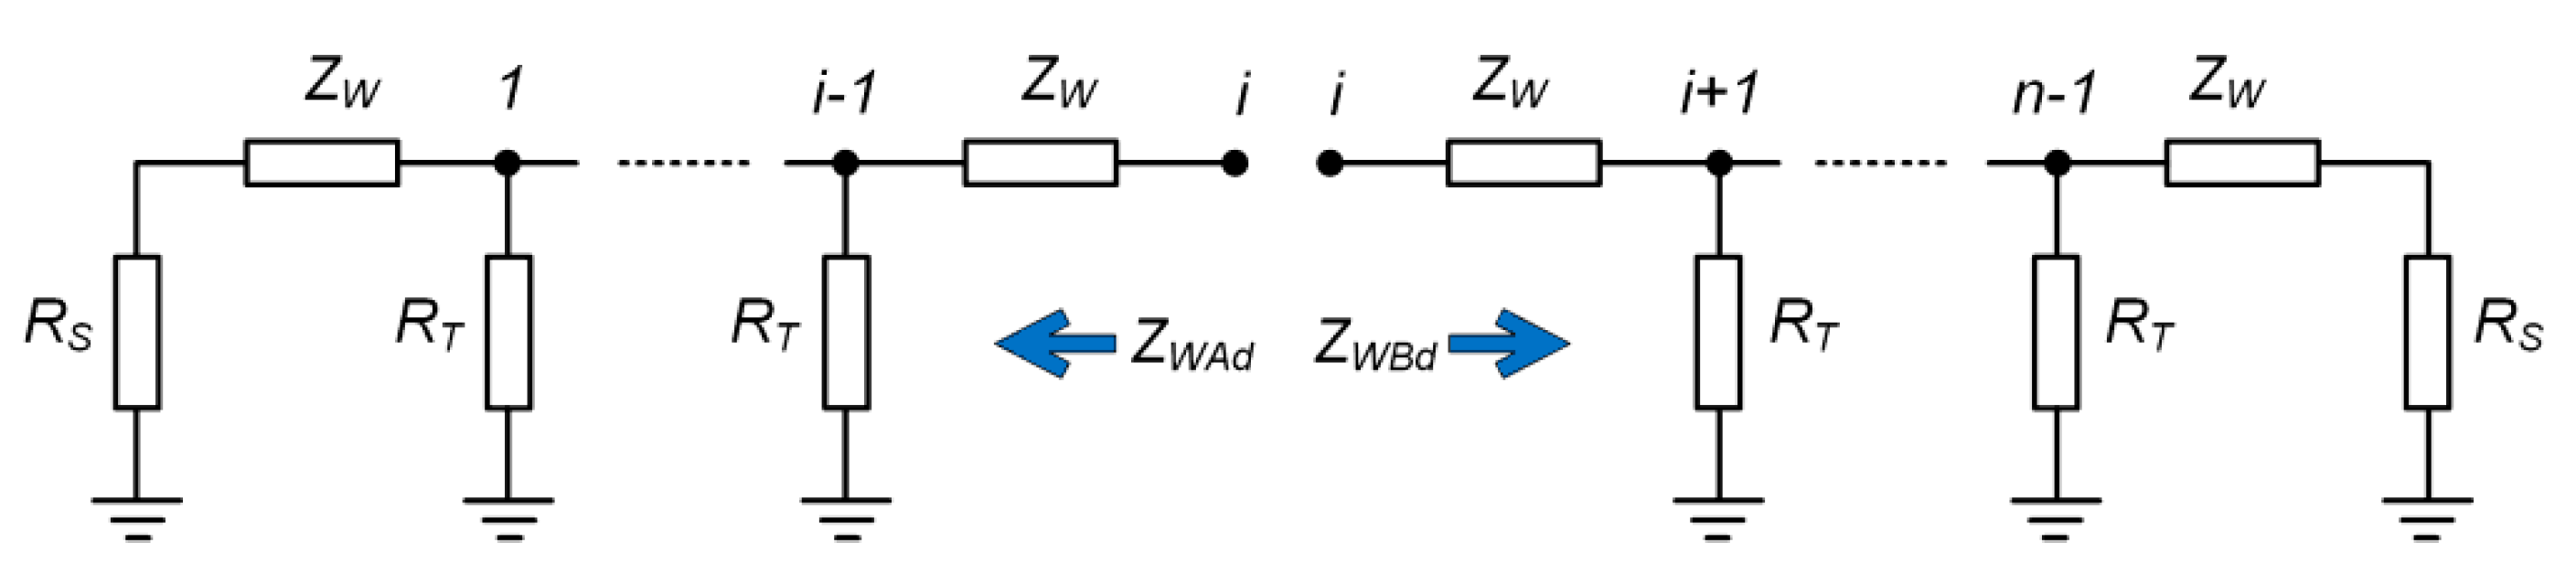
2.1. Reference Model (R)
A single-phase model with high computational accuracy was adopted as a reference model (R), as a significant simplification of multiphase model (M). The following assumptions were made for this model:
Only short-circuited phase wire and earth wires are taken into account.
The short-circuit place is current-powered, and the short-circuit current values are determined with a common normative method.
The model consists of n spans.
A scheme of the single-phase model for a line with one earth wire is shown in
Figure 3. A similar model structure was adopted in studies published in [
14].
The model shown in
Figure 3 can be analyzed based on the nodal voltage method with a set of
n-1 earth voltages
U1,…,
Un-1. In this method, the current balance equations are written for individual points in which the tower footing is connected to the earth wire. The matrix form of these equations can be described by:
where
Y is the nodal admittance matrix,
U is the node voltage vector, and
I is the current vector.
where
ZW is the self earth return impedance of one-span-long earth wire,
RT is the tower footing resistance, and
RS is the substation earthing resistance.
where
IA,
IB are the short-circuit currents flowing from substations
SA and
SB to the short circuit place, and
EA,
EB are the voltages induced in earth wires by short-circuit currents in phase wires:
where
ZM is the mutual impedance between phase conductor and one-span-long earth wire.
Power lines with two earth wires are replaced with one earth wire according to the procedure:
Assumed impedance values ZW are two times smaller.
Impedance values ZM are determined for the geometrically averaged distance between earth wires and phase wire.
Coupling effects between earth wires are neglected.
The earth currents
IE are determined by calculating nodal voltages
U from Equation (1) and dividing them by the tower footing resistance
RT:
The earth current in the
i-th tower footing affected by short circuit equals to:
Single-phase short-circuit currents
IA and
IB are determined based on the normative method in compliance with standard no. IEC 60909 [
23]. The current values in
i-th tower with a short circuit are established with Equations (14) and (18):
where
l is the length of power line,
a is the length of span,
n is the number of spans,
Un is the rated voltage,
c is the voltage factor,
SkA,
SkB are the short-circuit power in substations
SA and
SB, and
X0A/
X1A,
X0B/
X1B are the ratios of zero-sequence reactance to positive-sequence reactance in substations
SA and
SB.
Four simplifications of the model (R) involving a reduction of the number of model elements and, thus, a reduction of the number of equations, are presented further in this Section.
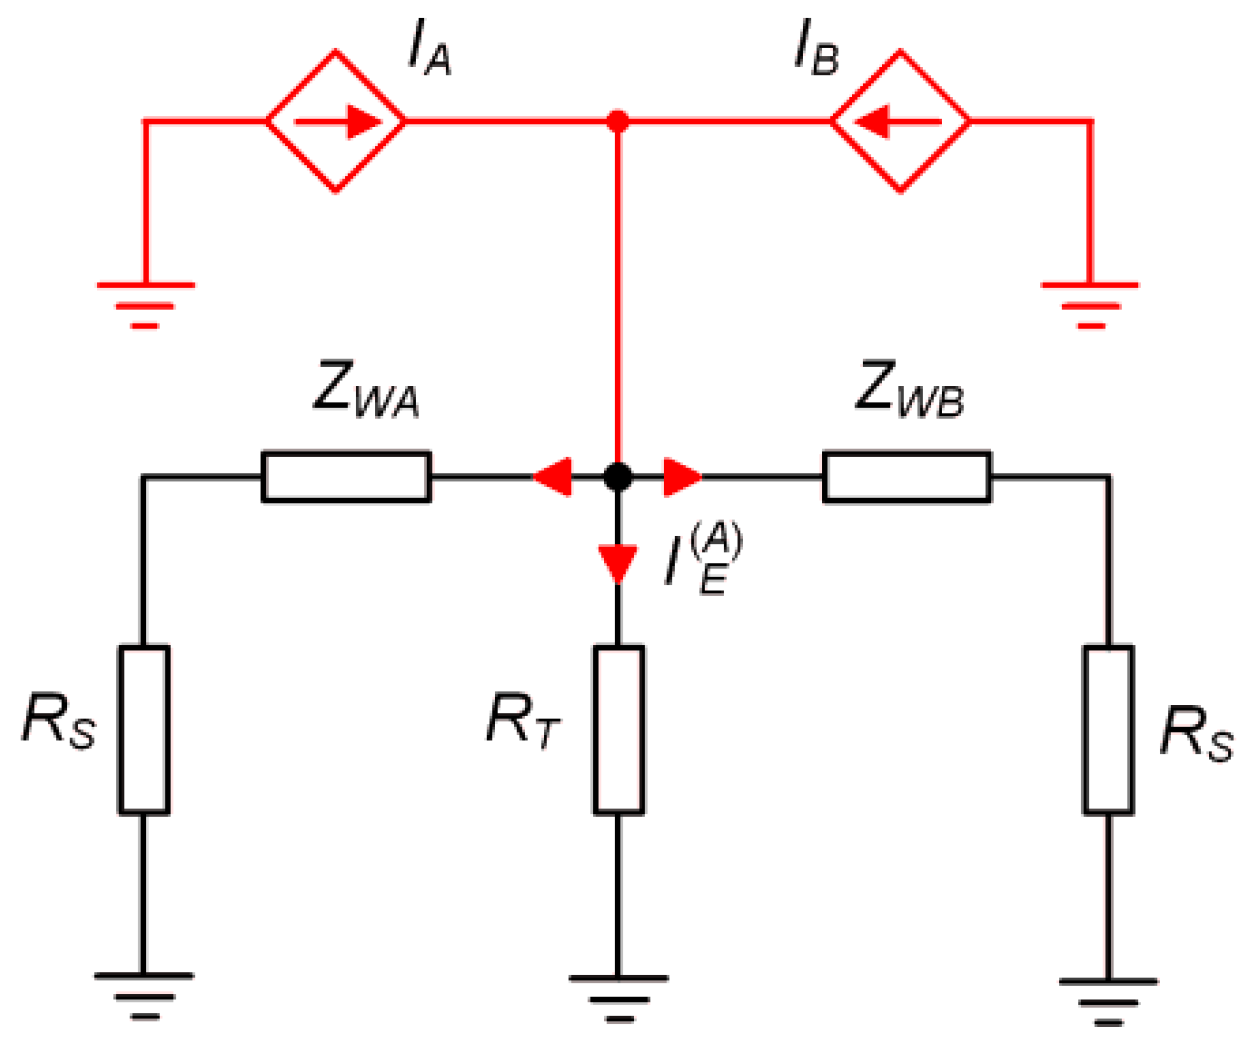
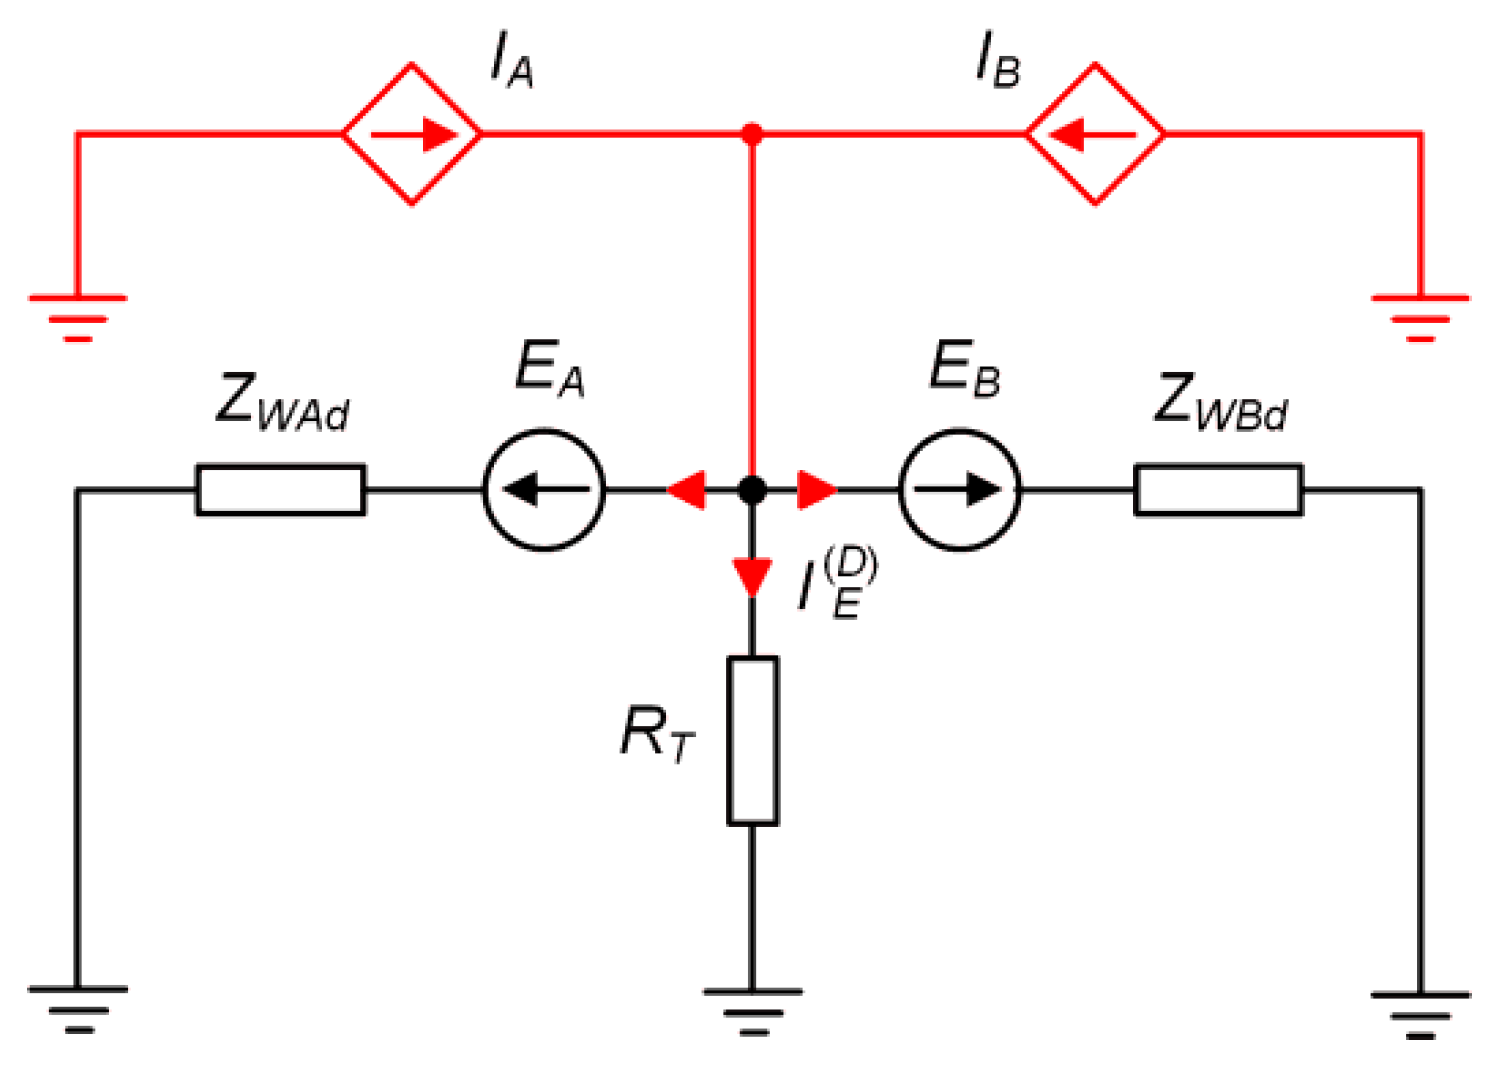
2.2. Simplified Model (A)
A scheme of the simplified model (A) is shown in
Figure 4. It consists of five passive elements: the
RT resistance of the tower where the short-circuit occurred, the
RS resistances of the
SA and
SB substations, and the
ZWA and
ZWB self impedances of the earth wires. The elimination of the ladder structure was achieved by omitting all line towers except the tower where the short circuit occurred and omitting electromagnetic coupling between the phase wires and the earth wires.
In this model, the impedances of the earth wires ZWA and ZWB are equal to the sum of the impedances of the particular spans earth wires between the short-circuit location and the substations SA and SB. As a result, the currents flowing into the earth wires at the short-circuit location are equal to the currents flowing into the SA and SB substation earth electrodes. In addition, there are two current sources in this model, with the IA and IB values determined in the same way as in the reference model (R).
In model (A), the current flowing into the tower earthing system where the short-circuit occurred is expressed by the equation:
where
ZWA,
ZWB are the self-impedances of earth wire sections between substations
SA and
SB and the short-circuit place. In the case of power lines with two earth wires, they are replaced by one earth wire, analogously as in the reference model (R).
2.3. Simplified Model (B)
A scheme of simplified model (B) is shown in
Figure 5. In this model, as in simplified model (A), all towers in the power line were neglected except the tower affected by short-circuit. However, the coupling between the earth wire and the phase wire in which the short-circuit currents flow has not been neglected. These couplings are represented in the model by voltage sources
EA and
EB, whose values are proportional to the mutual impedances between the phase conductors and the earth wires along the sections between the short-circuit site and the
SA and
SB substations.
The earth current is expressed by the relation:
where
ZWA,
ZWB are the self impedances of the earth wire sections between substations
SA and
SB and the short-circuit place, and
EA,
EB is the voltages induced in earth wires by short-circuit currents flowing in phase wires:
where
ZMA,
ZMB are the mutual impedances between the phase conductors and the earth wires on sections with lengths resulting from the distance of the short-circuit location from the substation
SA and the substation
SB, respectively.
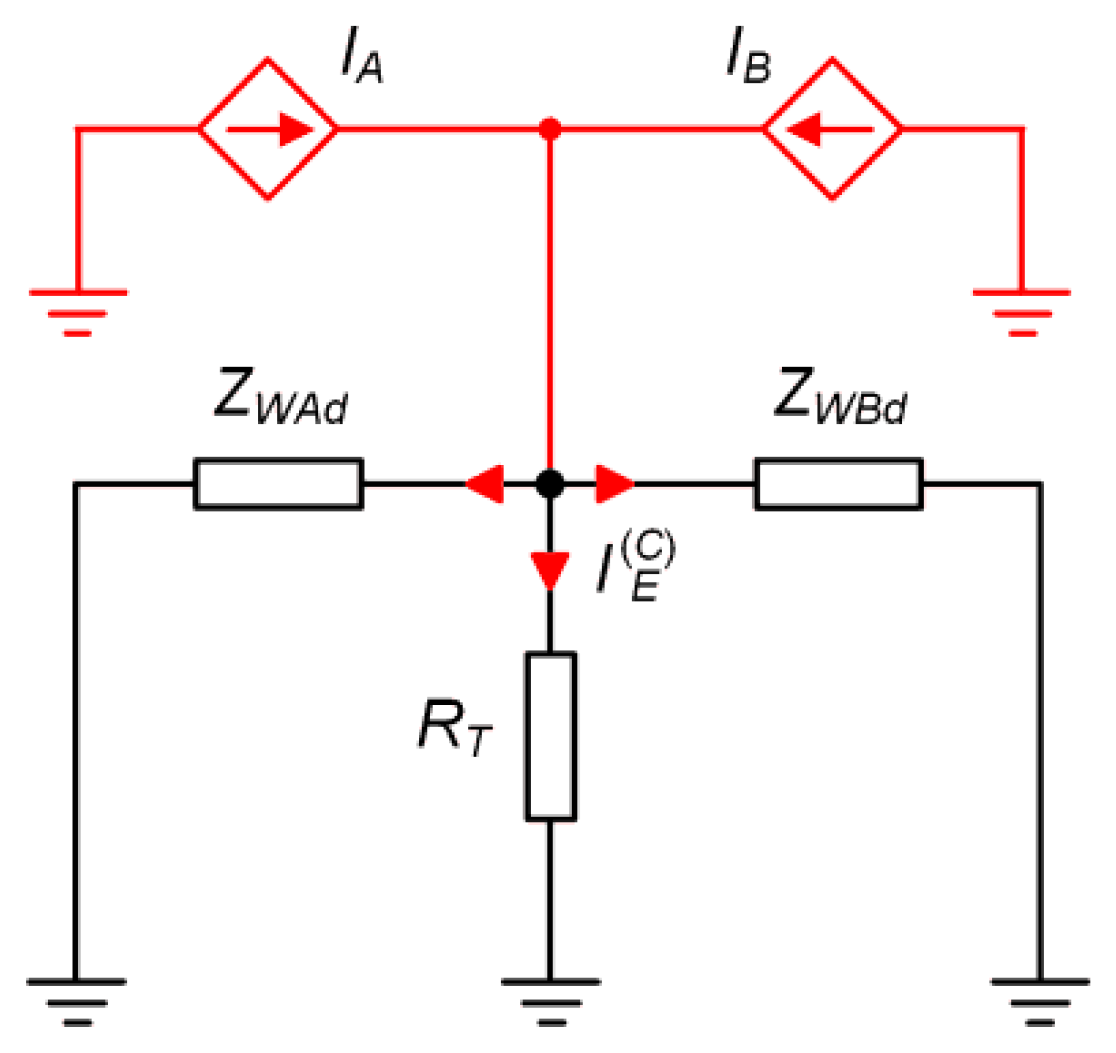
2.4. Simplified Model (C)
A scheme of simplified model (C) is shown in
Figure 6. In this model, as in simplified model (A) (
Section 2.2), the couplings between earth wires and phase wires were neglected.
The earth current is expressed by a relation analogous to that in the simplified model (A), except that self-impedances
ZWA,
ZWB are substituted for equivalent impedances of the ladder systems
ZWAd,
ZWBd shown in
Figure 7:
However, the significant difference from models A and B here is the way of determining the impedances of the earth wires. Their values are the equivalent impedances
ZWAd,
ZWBd of the ladder systems shown in
Figure 7.
2.5. Simplified Model (D)
A scheme of simplified model (D) is shown in
Figure 8. It is an extension of the simplified model (C), in which the resultant coupling of the phase wire and earth wire was taken into consideration, analogous to the simplified model (B).
The earth current is expressed by the relation:
where
ZMA,
ZMB are the mutual impedances between the phase wire and earth wire.
3. Results and Discussion—Comparative Analysis of the Proposed Models
The models used for determining expected earth currents in the supports are burdened with errors resulting from the introduced assumptions and simplifications. To assess the applicability of these models for practical calculations, a multivariate comparative analysis was performed to determine relative calculation errors of simplified models (A)–(D) in relation to the exact models (M) and (R).
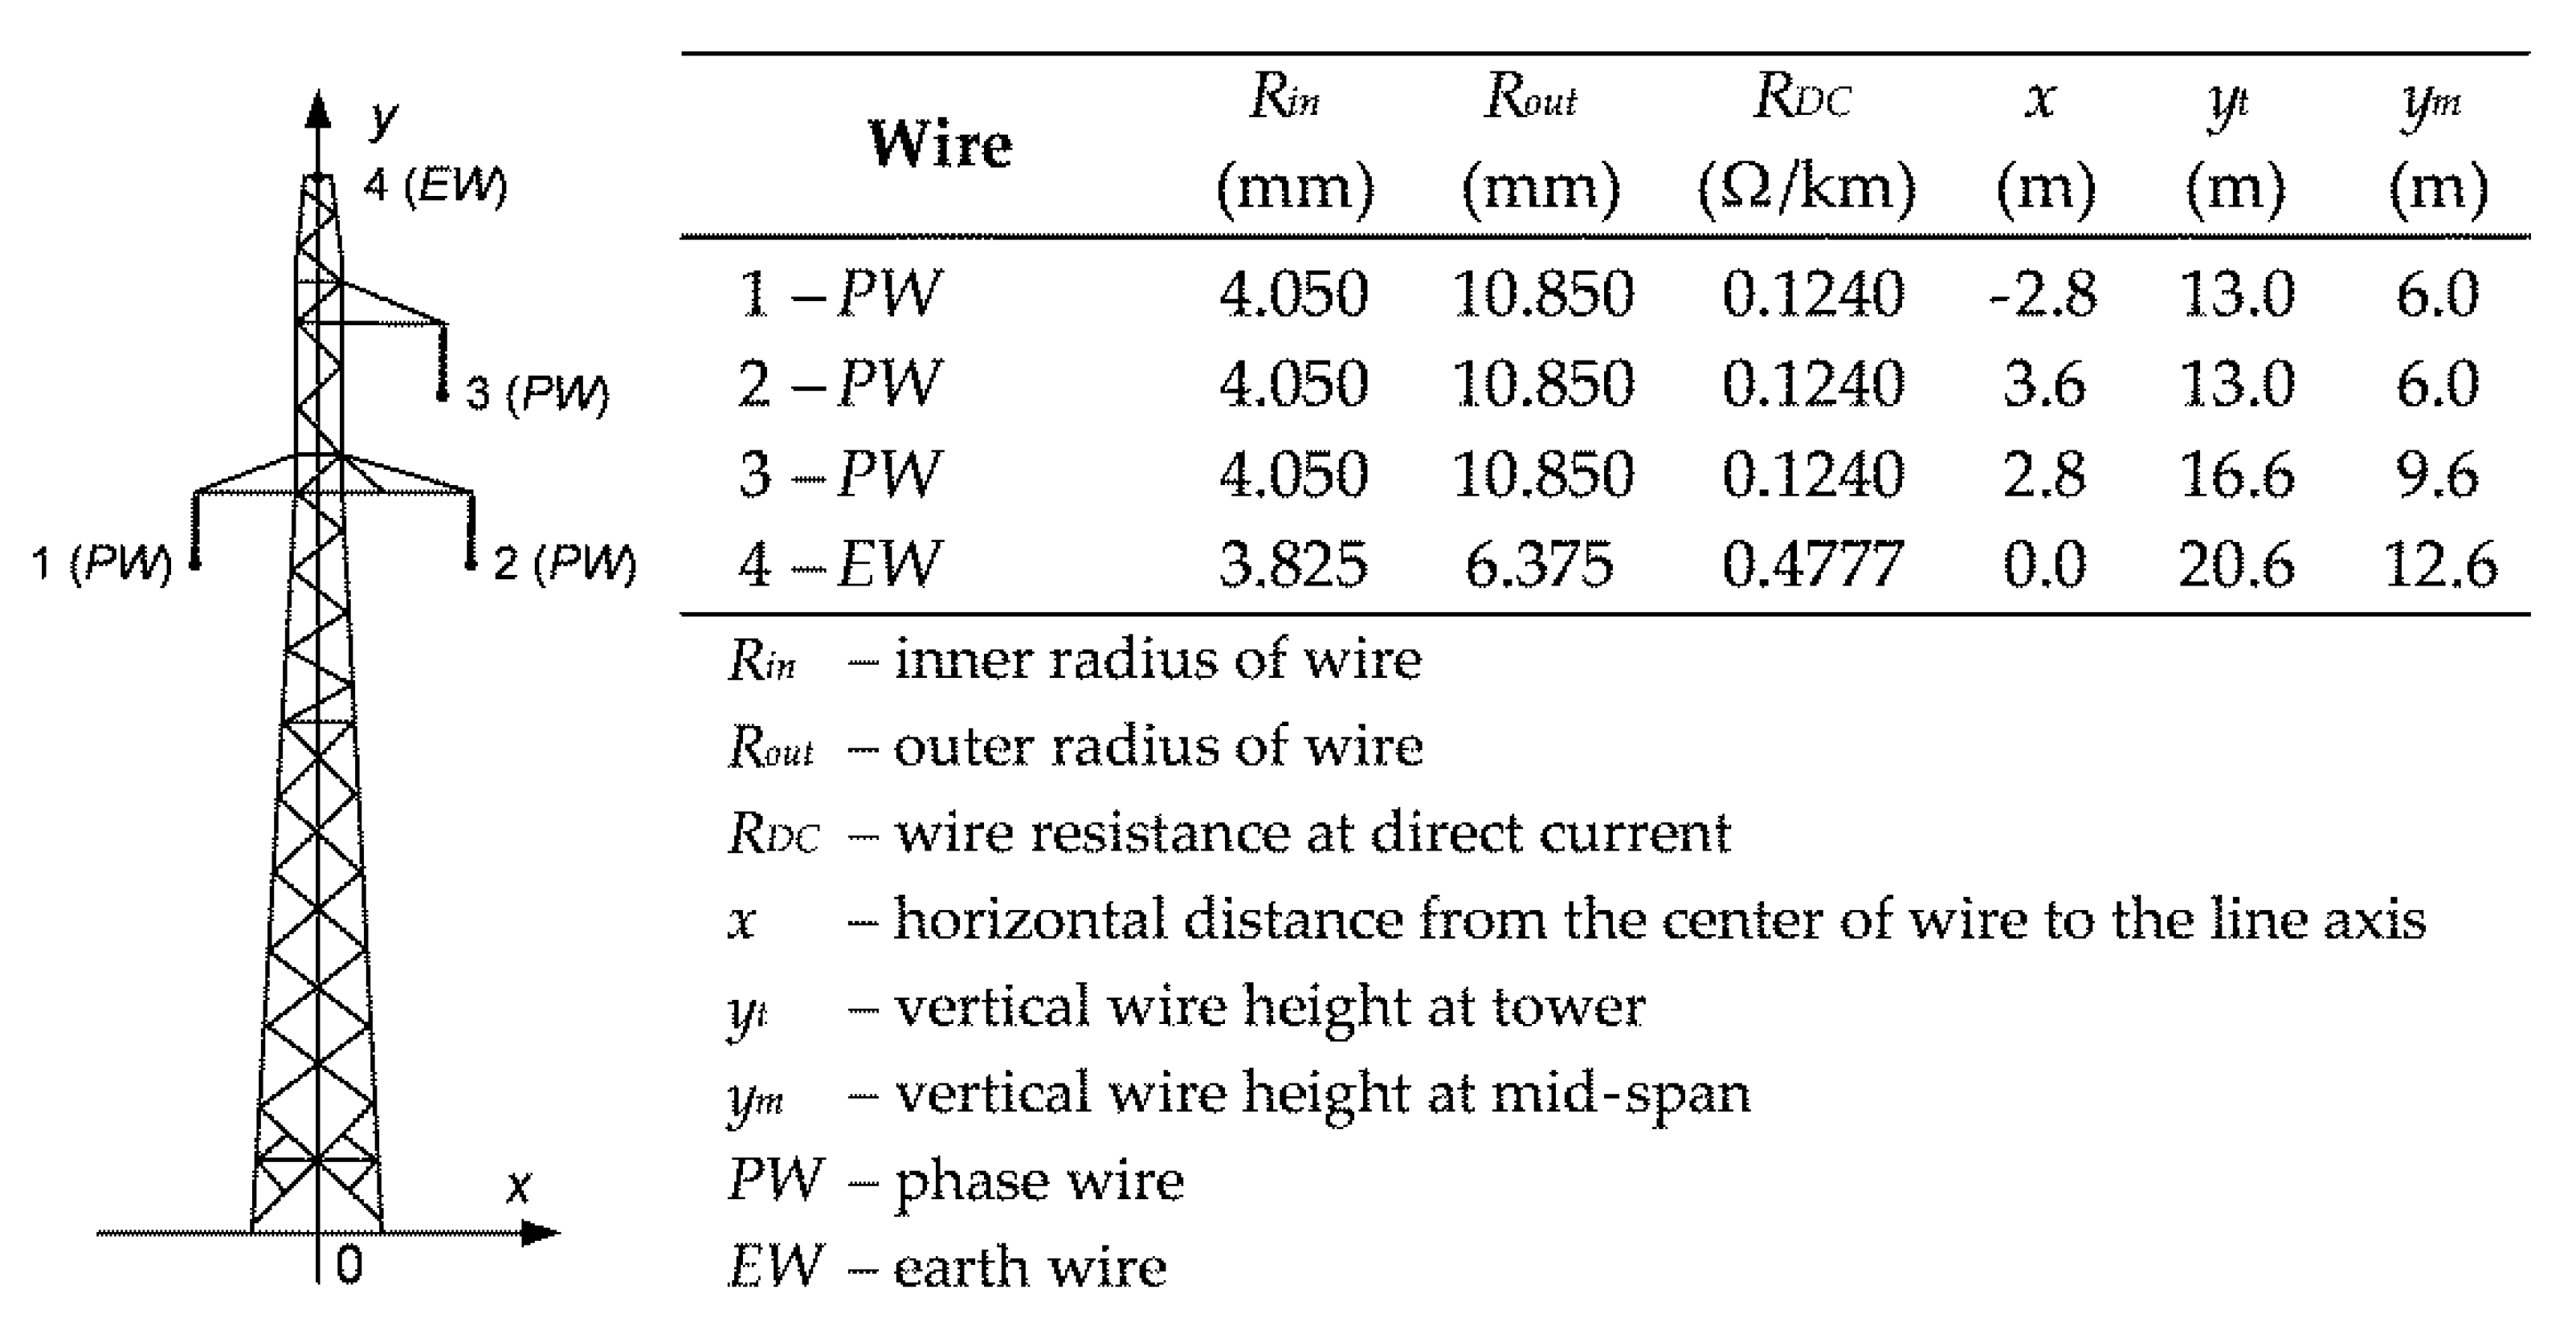
A 110 kV overhead power line with a triangular asymmetrical arrangement of three phase wires and with one earth wire was selected for the study. Uniform, averaged values of line parameters were assumed along the entire line length. The tower shape is based on data from catalogues of single-circuit lines typical structures [
24]. The cross-section of the phase wires equaled to 240 mm
2, and that of the earth wire was 70 mm
2.
The tower footing resistances and the span lengths were assumed to be equal along the entire power line. Detailed data of the power line are shown in
Figure 9. On the basis of these parameters, the models of the line spans were determined in the form of self- and mutual impedances (30), and, after their transformation, the impedances in the domain of symmetrical components were obtained (31).
The self and mutual impedances matrix of the analyzed line, determined in the EMTP-ATP program for the multiwire model and soil resistivity equals to 100 Ωm, has the following form:
This matrix, after the earth wire aggregation and mutual impedance averaging, can be transformed to a domain of symmetrical components:
The per unit impedance Z44 = (0.525 + j0.757) (Ω/km) is the basis for determining the ZW impedance in model (R), the ZWA and ZWB impedances in models (A) and (C), and the ZWAd and ZWBd impedances in models (B) and (D). In addition, the per unit impedance Z34 = (0.048 + j0.339) (Ω/km) is the basis for determining the ZM impedance in model (R) and the ZMA and ZMB impedances in models (B) and (D). Moreover, the per unit impedances Z0L = (0.368 + j1.061) (Ω/km) and Z1L = (0.125 + j0.402) (Ω/km) are the basis for determining the short-circuit currents IA and IB according to Equations (14) and (18).
The analysis was conducted for nine variants of power line (
Table 1) differing in the line length, spans length, tower and substation earthing resistances, and short-circuit powers at line ends.
Variants (1)–(4) differ in length l of the line, where l {5 km; 10 km; 20 km; 50 km}. For these variants, the span length a, tower footing resistances RT, and substation earthing resistances RS are the same. The short-circuit powers Sk and the X0/X1 ratio in the supply substations are also the same, except for variant (4), which assumes five-times higher short-circuit power values in substation SA and double values in substation SB.
Variants (5) and (6) have reference to variant (2); however, in this case, the span lengths are, respectively, longer (357 m) and shorter (200 m) than length a in variant (2). Variants (7) and (8) are also referenced to variant (2); however, in these cases, the tower footing resistances are lower (5 Ω) and higher (15 Ω), respectively. On the other hand, variant (9) differs from variant (2) in the lower earthing resistance (0.1 Ω) of supply substations SA and SB. Variant (10) is similar to variant (2) but differs in the soil resistivity value equal to 300 Ωm.
The power line variants were represented in multiphase model (M), reference model (R) and in simplified models (A)–(D). Model (M) was developed in the EMTP-ATP program, while the remaining ones were developed in a MATLAB environment. The simulations revealed that the multiphase (M) and reference (R) models gave practically identical values of earthing currents in power lines with a single earth wire. For this reason, further analyses concentrated on the comparison of results obtained with simplified models (A)–(D) and reference model (R).
The analysis results for variants (1)–(10) are presented in
Figure 10,
Figure 11,
Figure 12,
Figure 13,
Figure 14 and
Figure 15. The plots visualize currents
IE flowing to the tower earthing system of tower affected by short-circuit, determined for models (R), (A)–(D), as a function of short-circuit place. The figures also present the values of relative errors ε of determining the
IE currents for the analyzed variants:
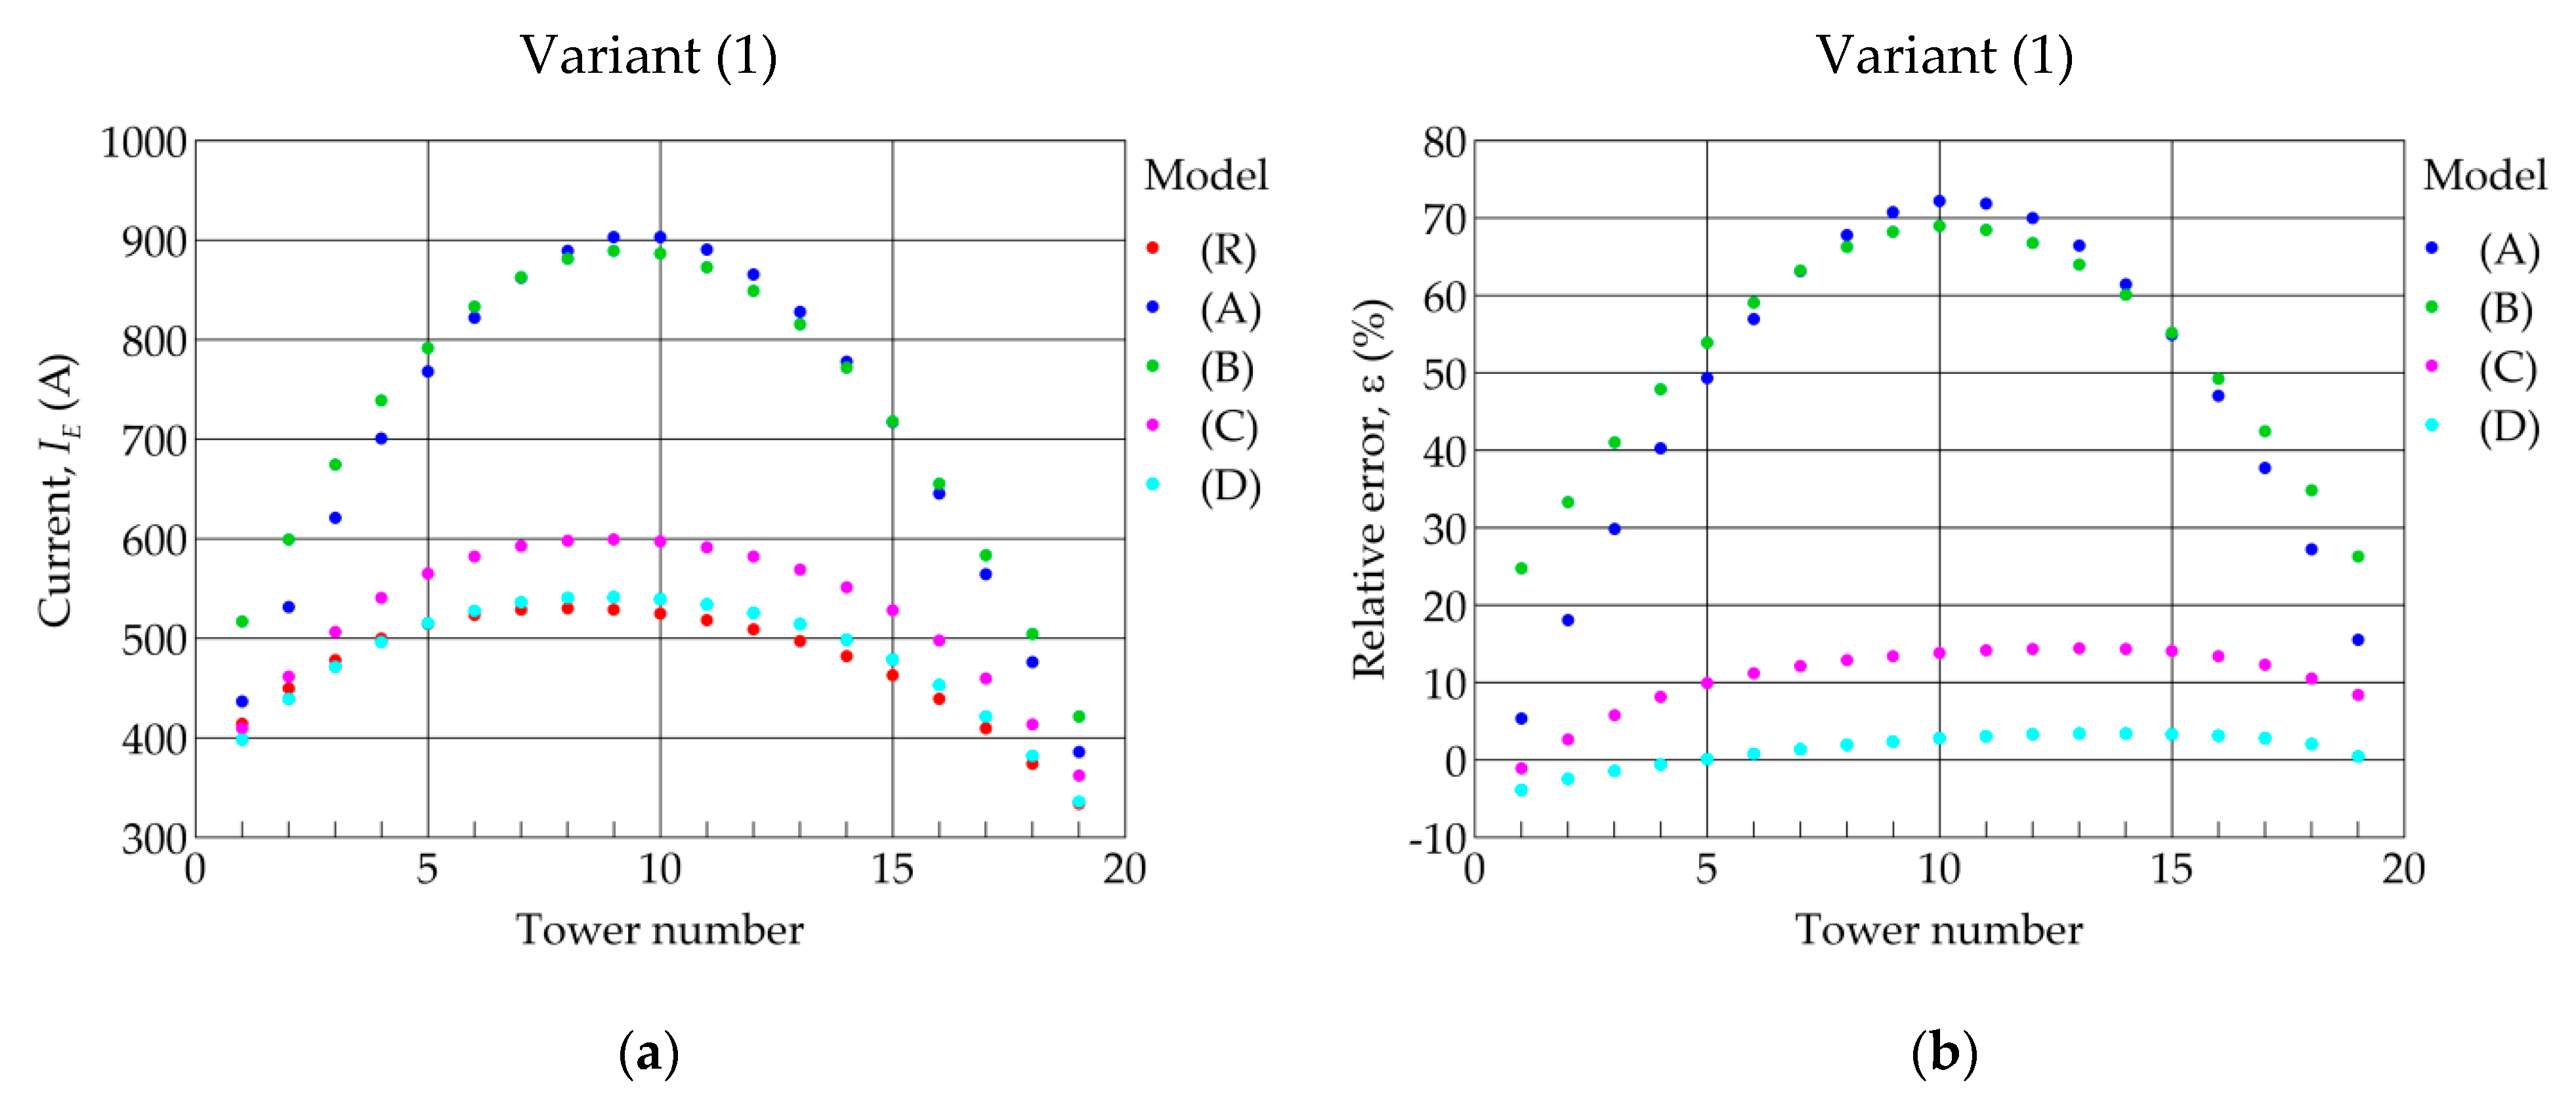
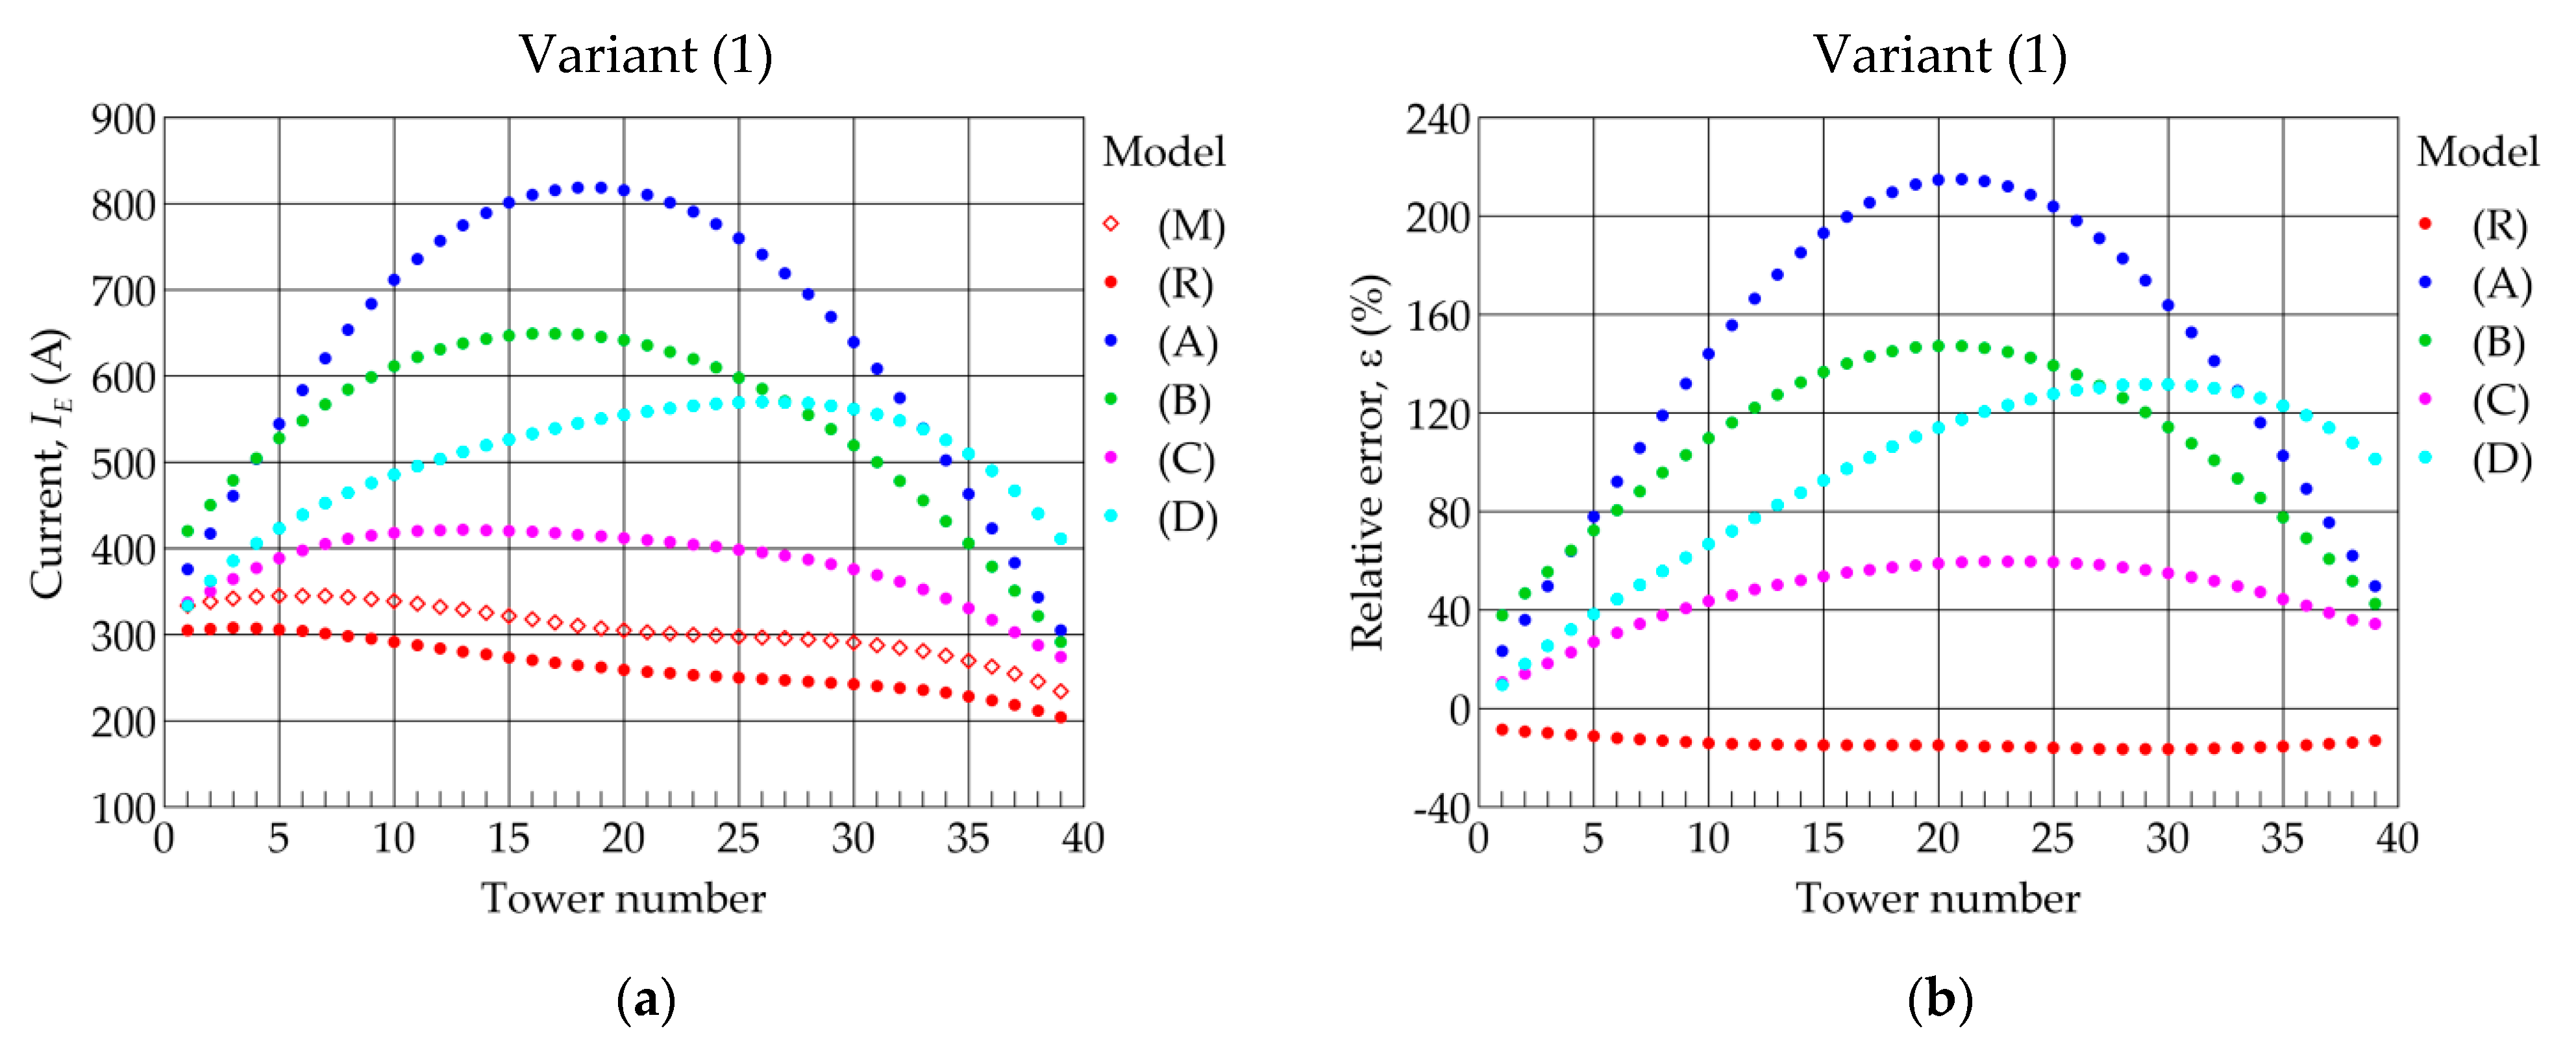
In
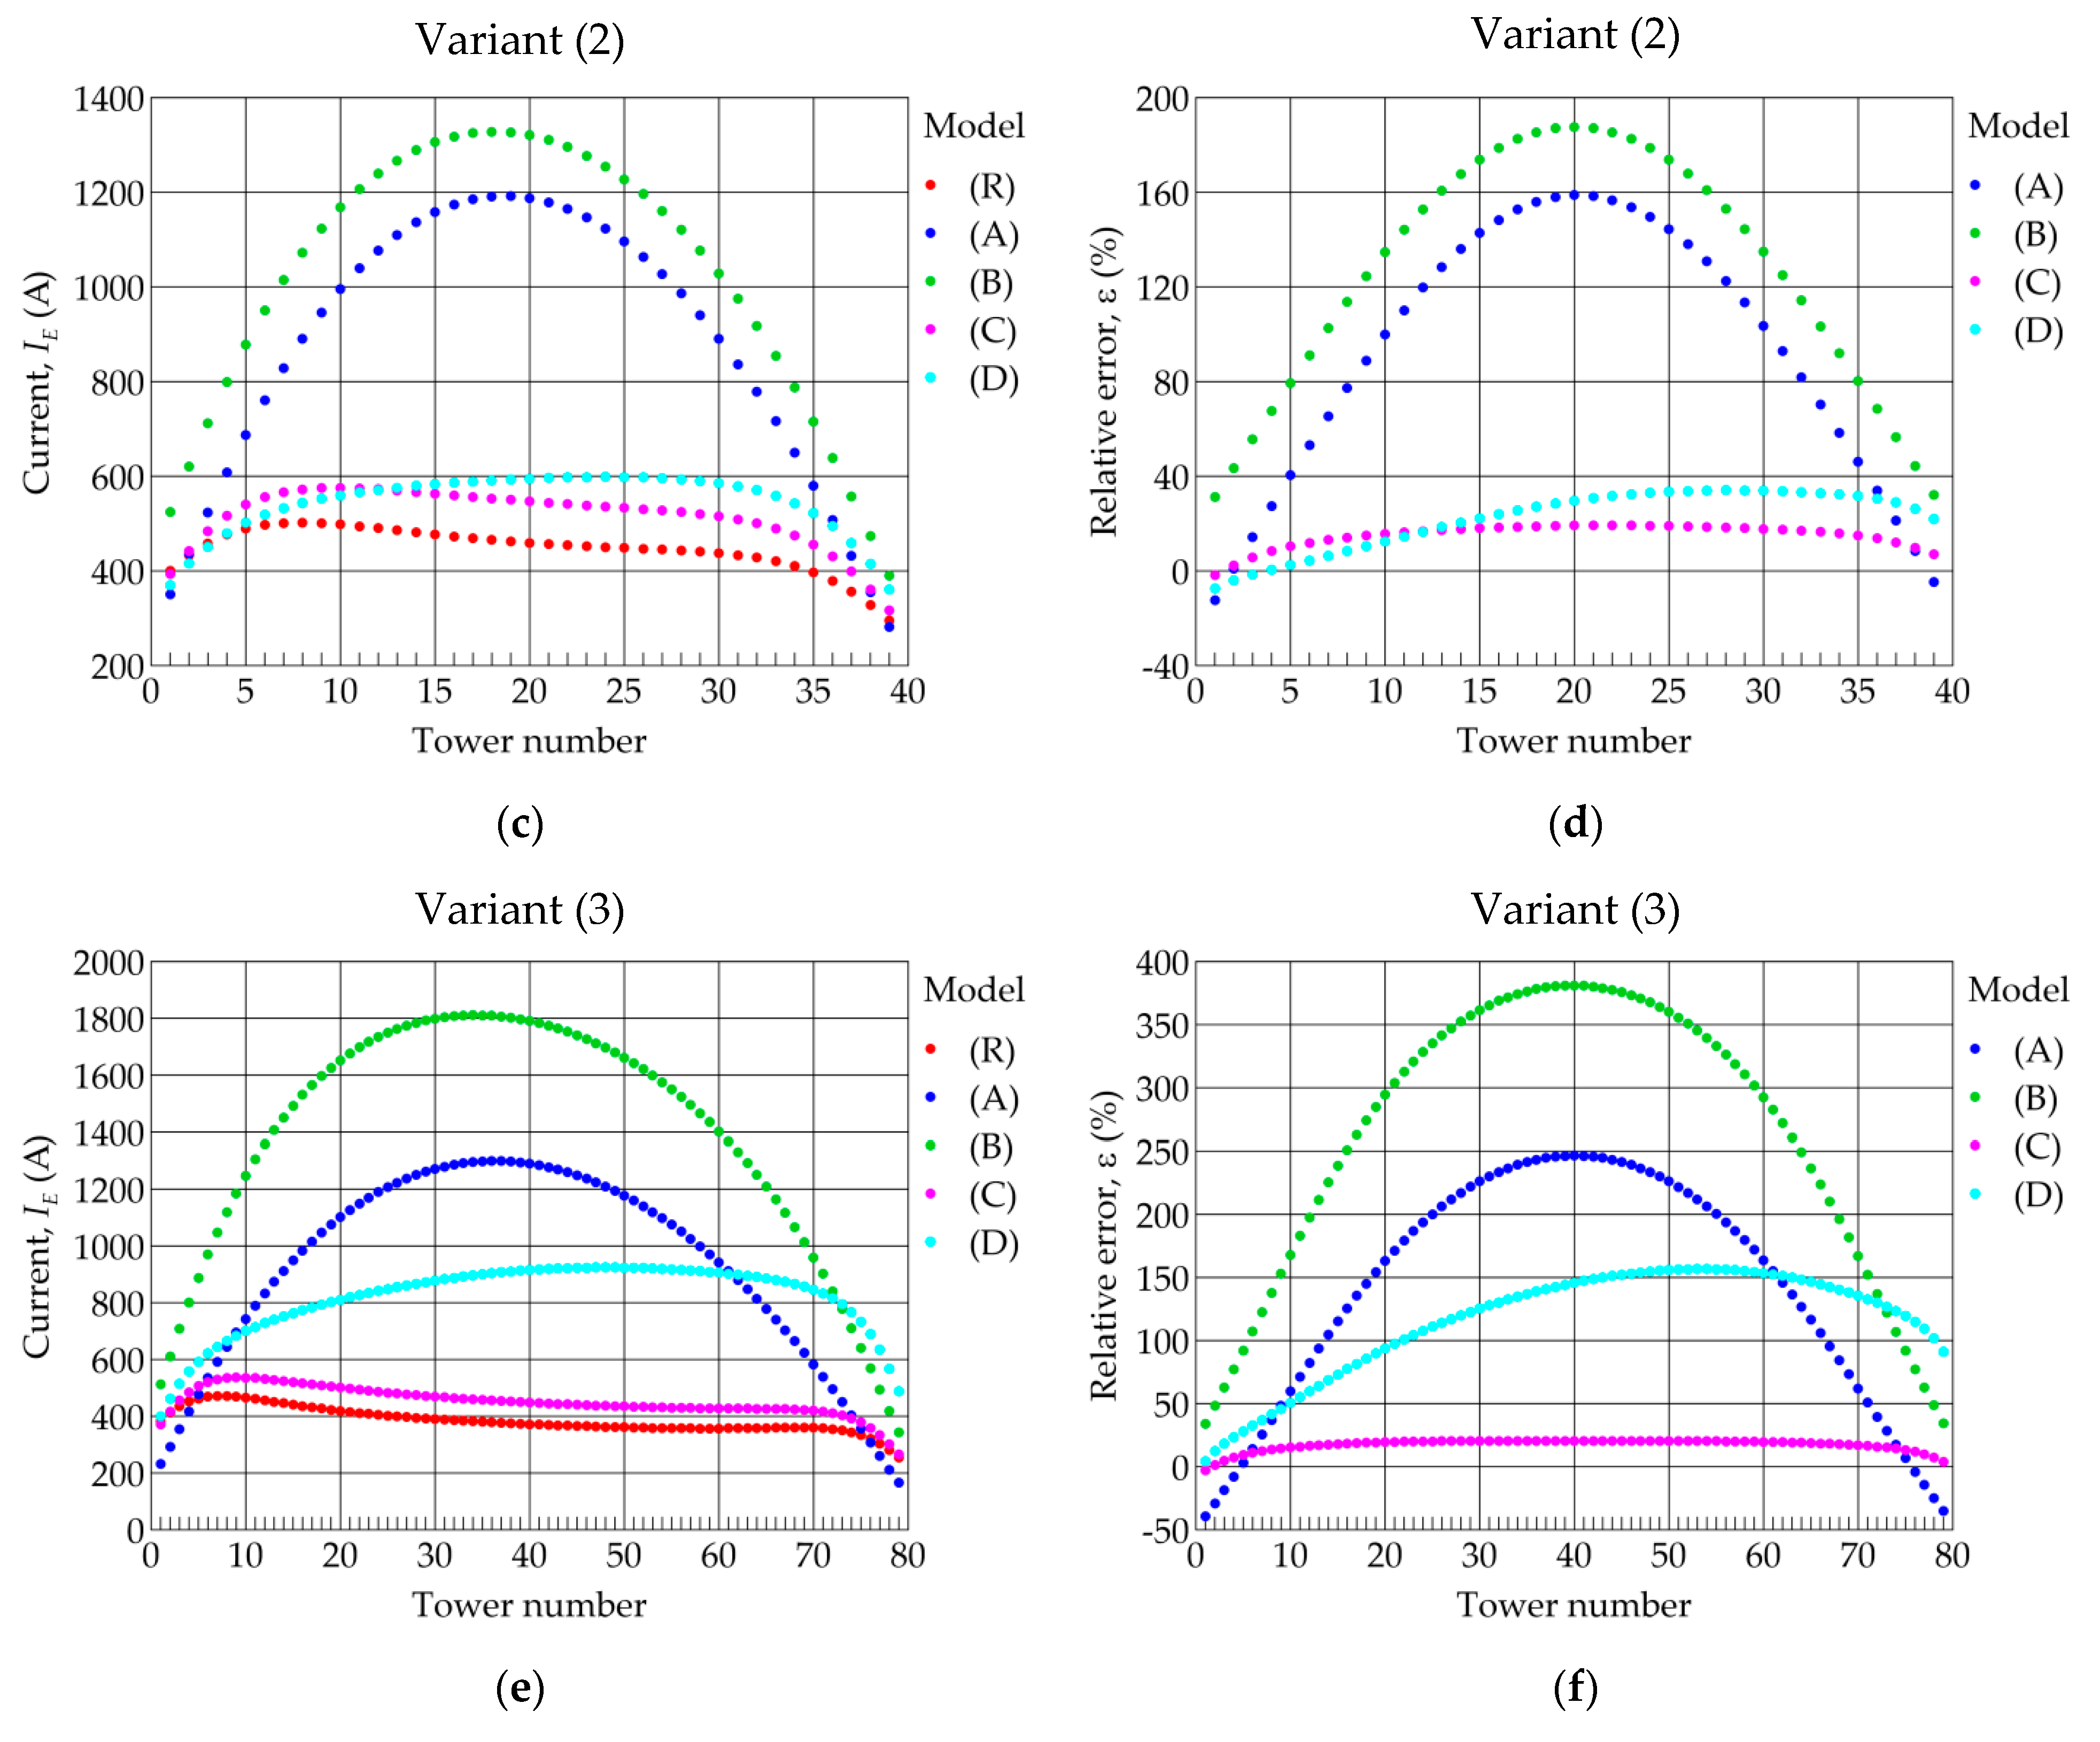
Figure 10, the results of the comparative analysis for Variants (1), (2), and (3) are presented. These variants differ in the lengths of the analyzed line being 5, 10, and 20 km, respectively. From this figure, it can be seen that the values of currents flowing into the earthing of the towers where the short circuit occurred significantly depended on the model used. From the calculations using model (R), it can be seen that the length of the line had a minor influence on the values of the earth currents.
The relative errors using models (A) and (B) reached very high values, up to several hundred percent. Whereas, model (D), for short sections, obtained good convergence with model (R), but its errors increased with the length of the analyzed line. In addition, this model did not correctly determine at which line towers the largest values of earth currents occur. The smallest errors were obtained using model (C) with the error value increasing slightly with line length.
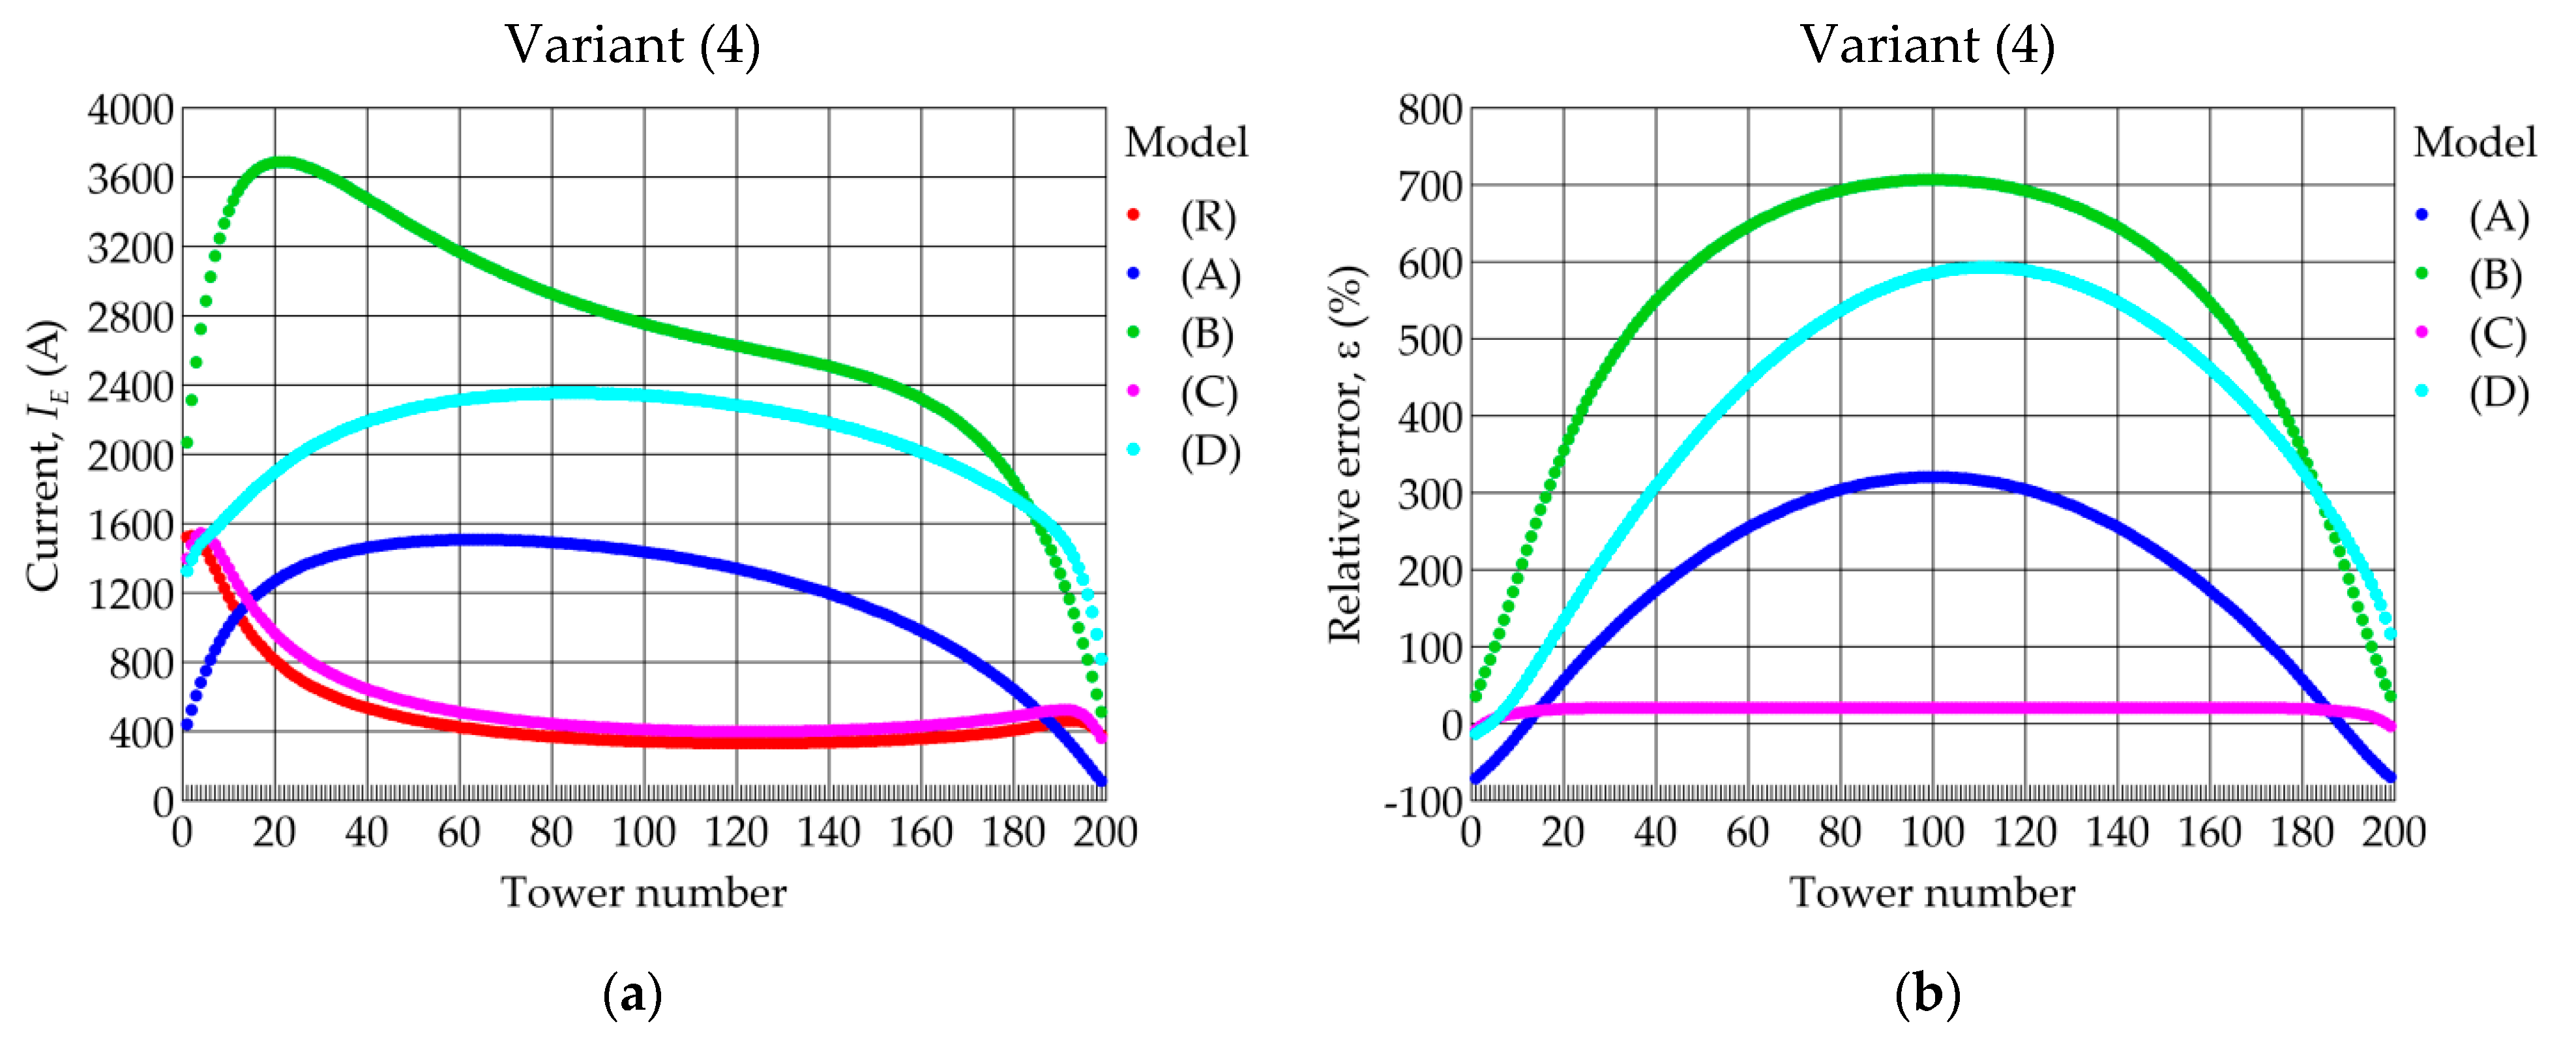
Figure 11 shows the analysis results for variant (4). The analyzed case was characterized by a significant line length (50 km) and higher short-circuit powers at the supply substations. The increase in short-circuit powers caused an increase in the values of earth currents during short-circuits, especially on towers near the substations. In this case, only model (C) gave results with an error not exceeding 25%, while the errors of the other models reached values ranging from about 300% (model (A)), to about 700% (model (B)).
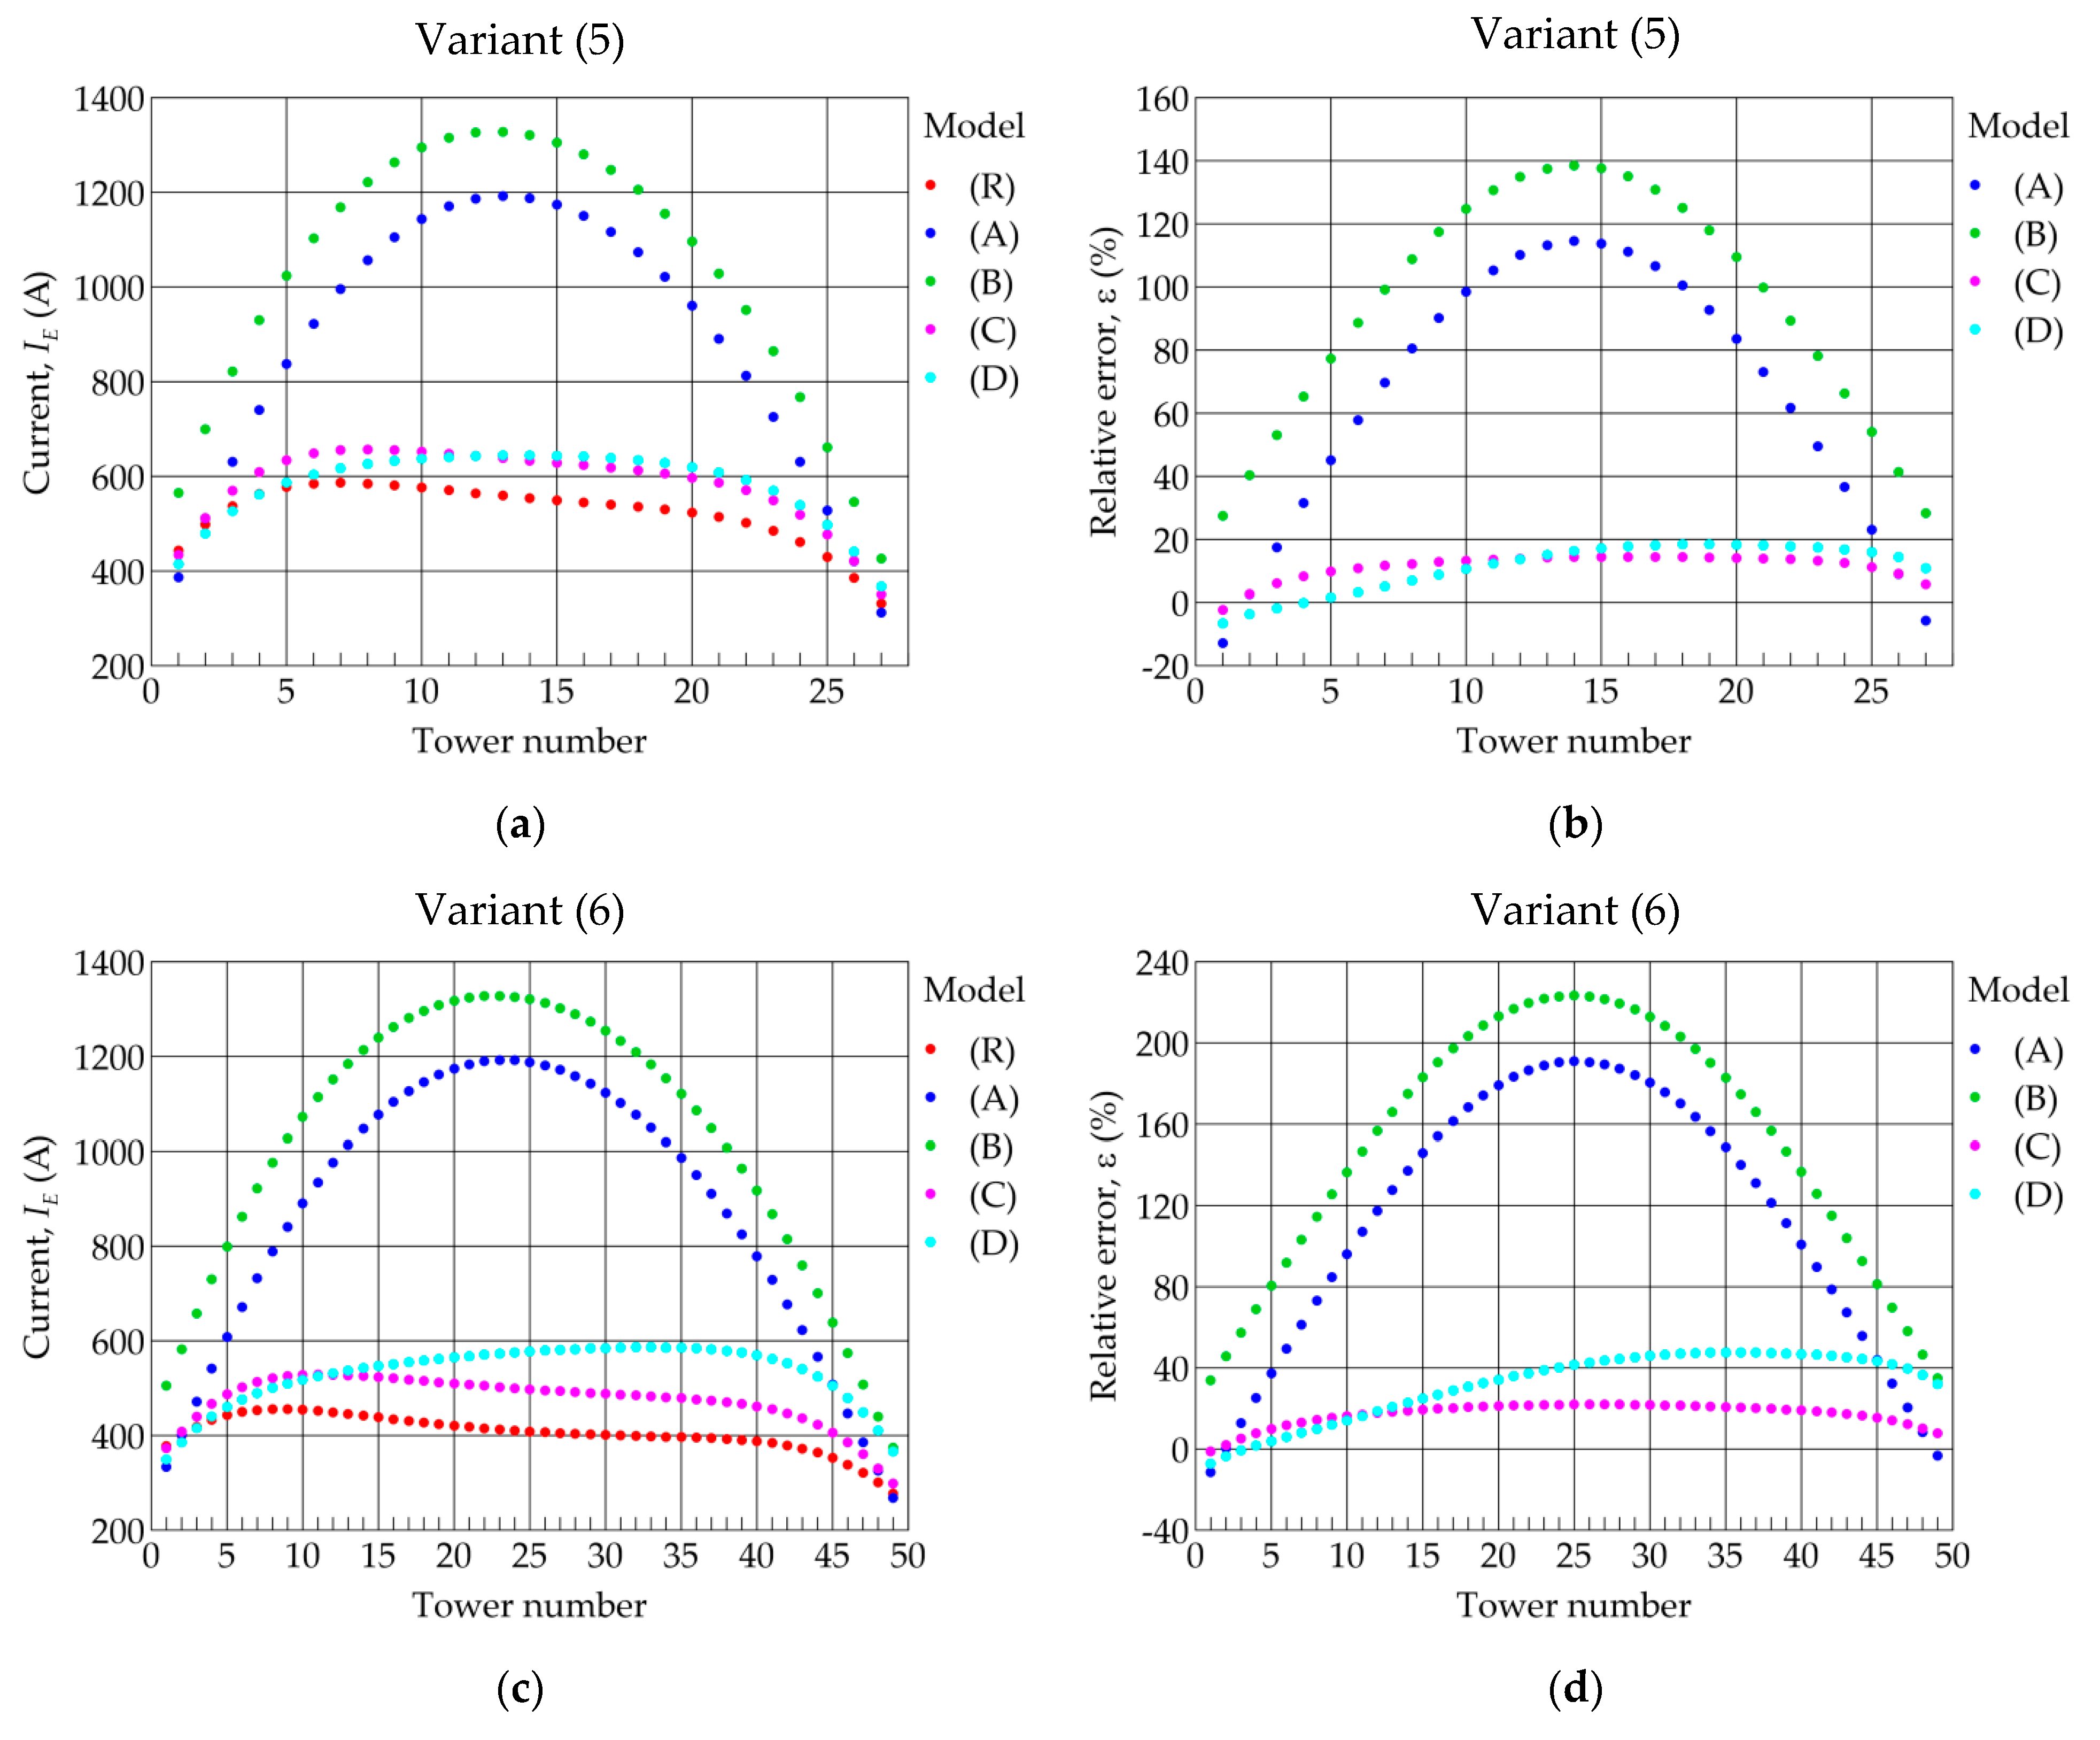
Figure 12 shows the results of the analysis for variants (5) and (6). These variants were characterized by different span lengths (357 and 200 m, respectively), with the same total line length of 10 km (as in variant (2)). The values of earth currents depended on the span length with the values increasing with the span length. The relative errors of all models decreased with increasing span length. For these variants, model (C) had the lowest relative errors as well. In these variants, model (D) did not allow to determine correctly in which towers of the line the highest values of earth currents occurred.
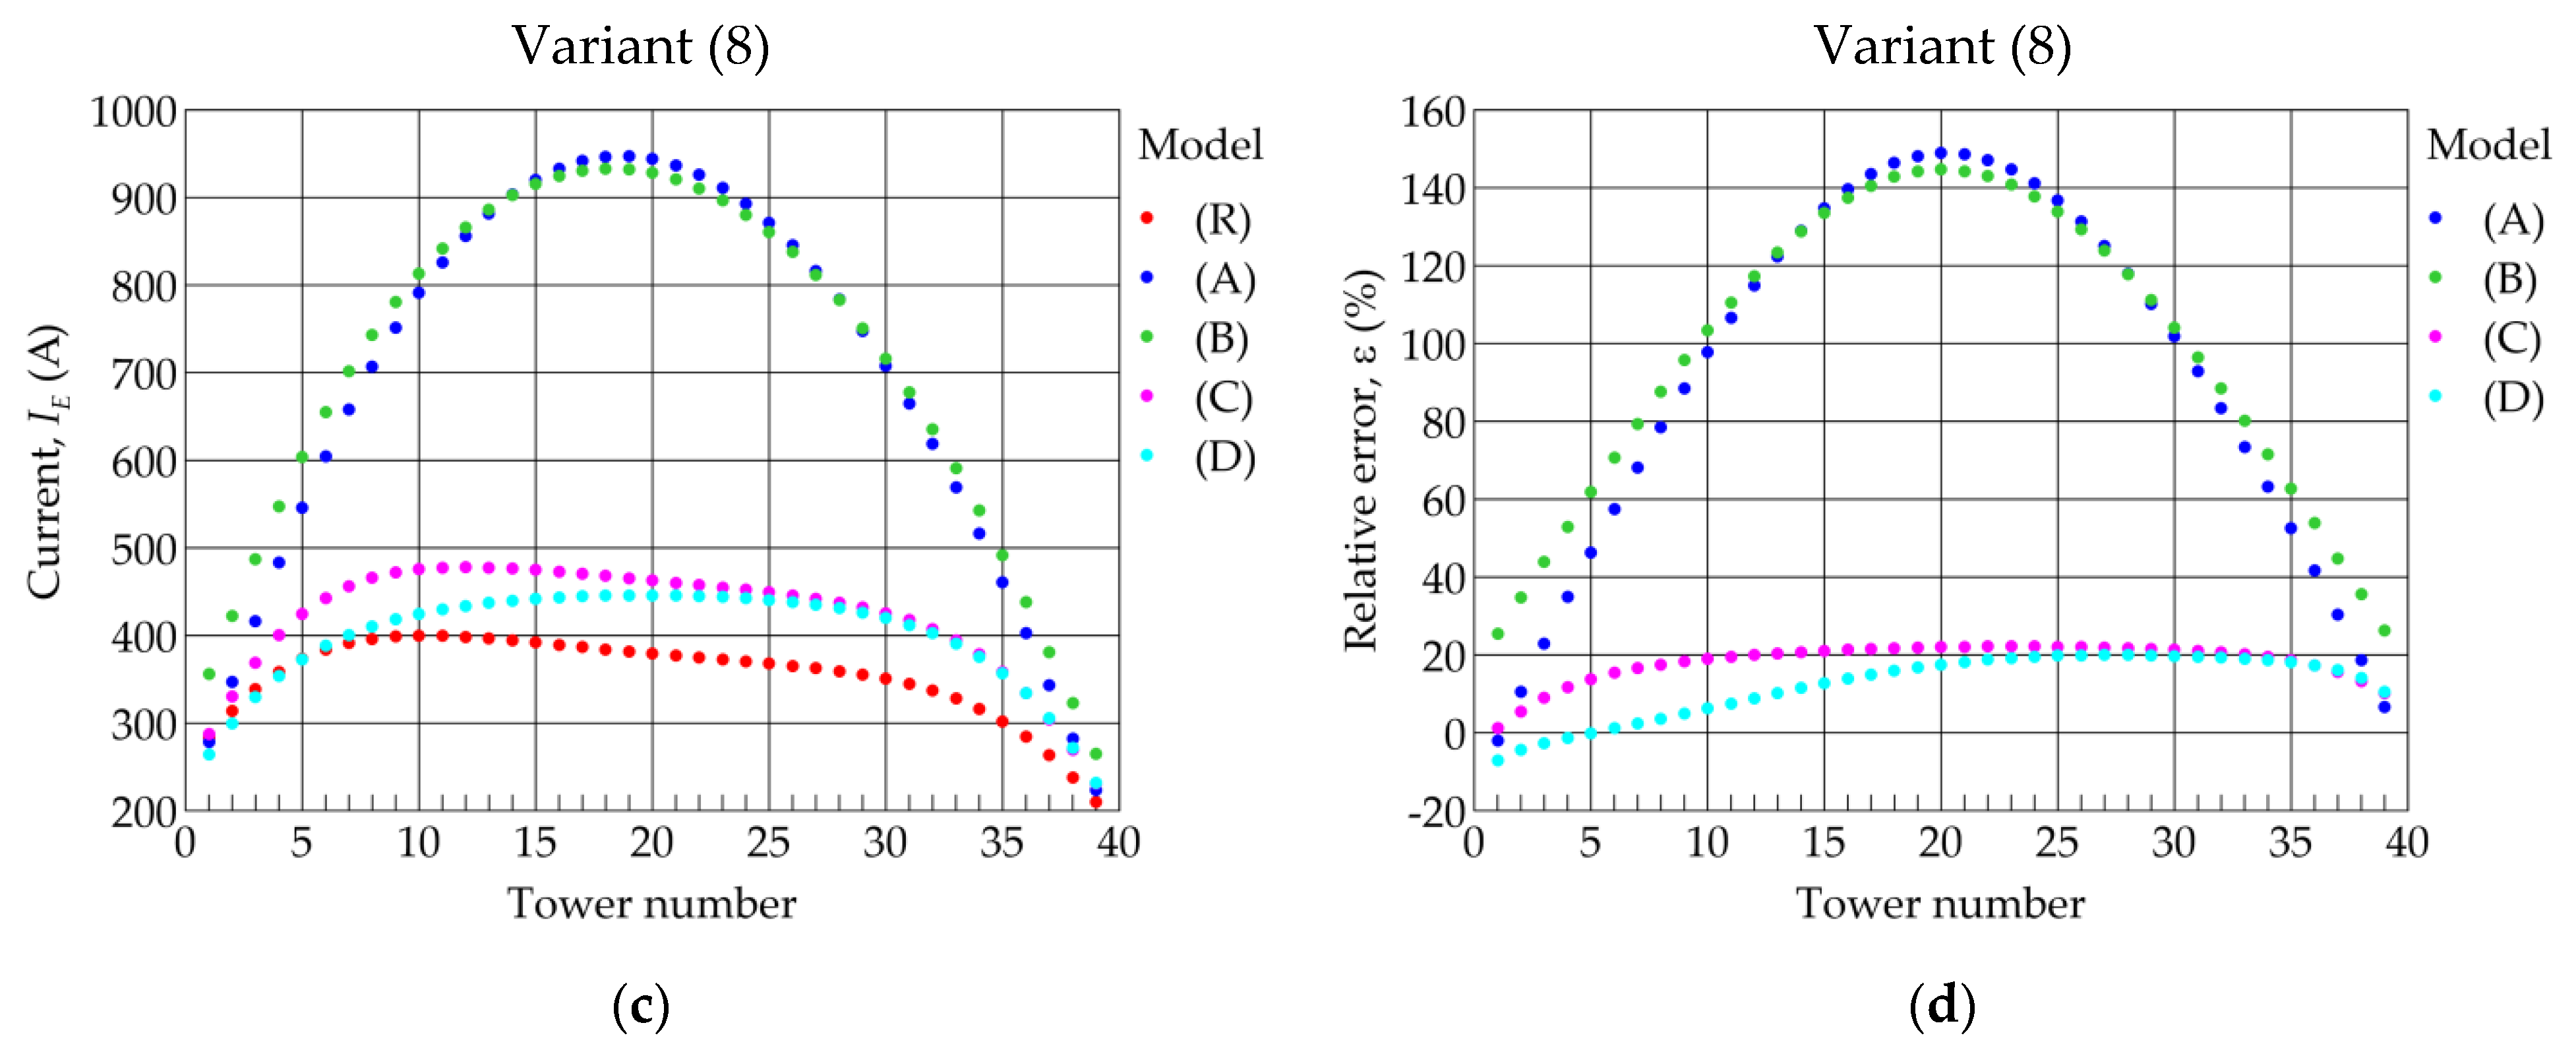
The results of the analysis for variants (7) and (8) are shown in
Figure 13. These variants had different tower footing resistances (5 and 15 Ω, respectively) with the other parameters the same as in variant (2). As expected, higher values of footing resistance corresponded to lower values of earth current. In variant (7), the smallest relative errors were obtained with model (C), while in variant (8) with model (D).
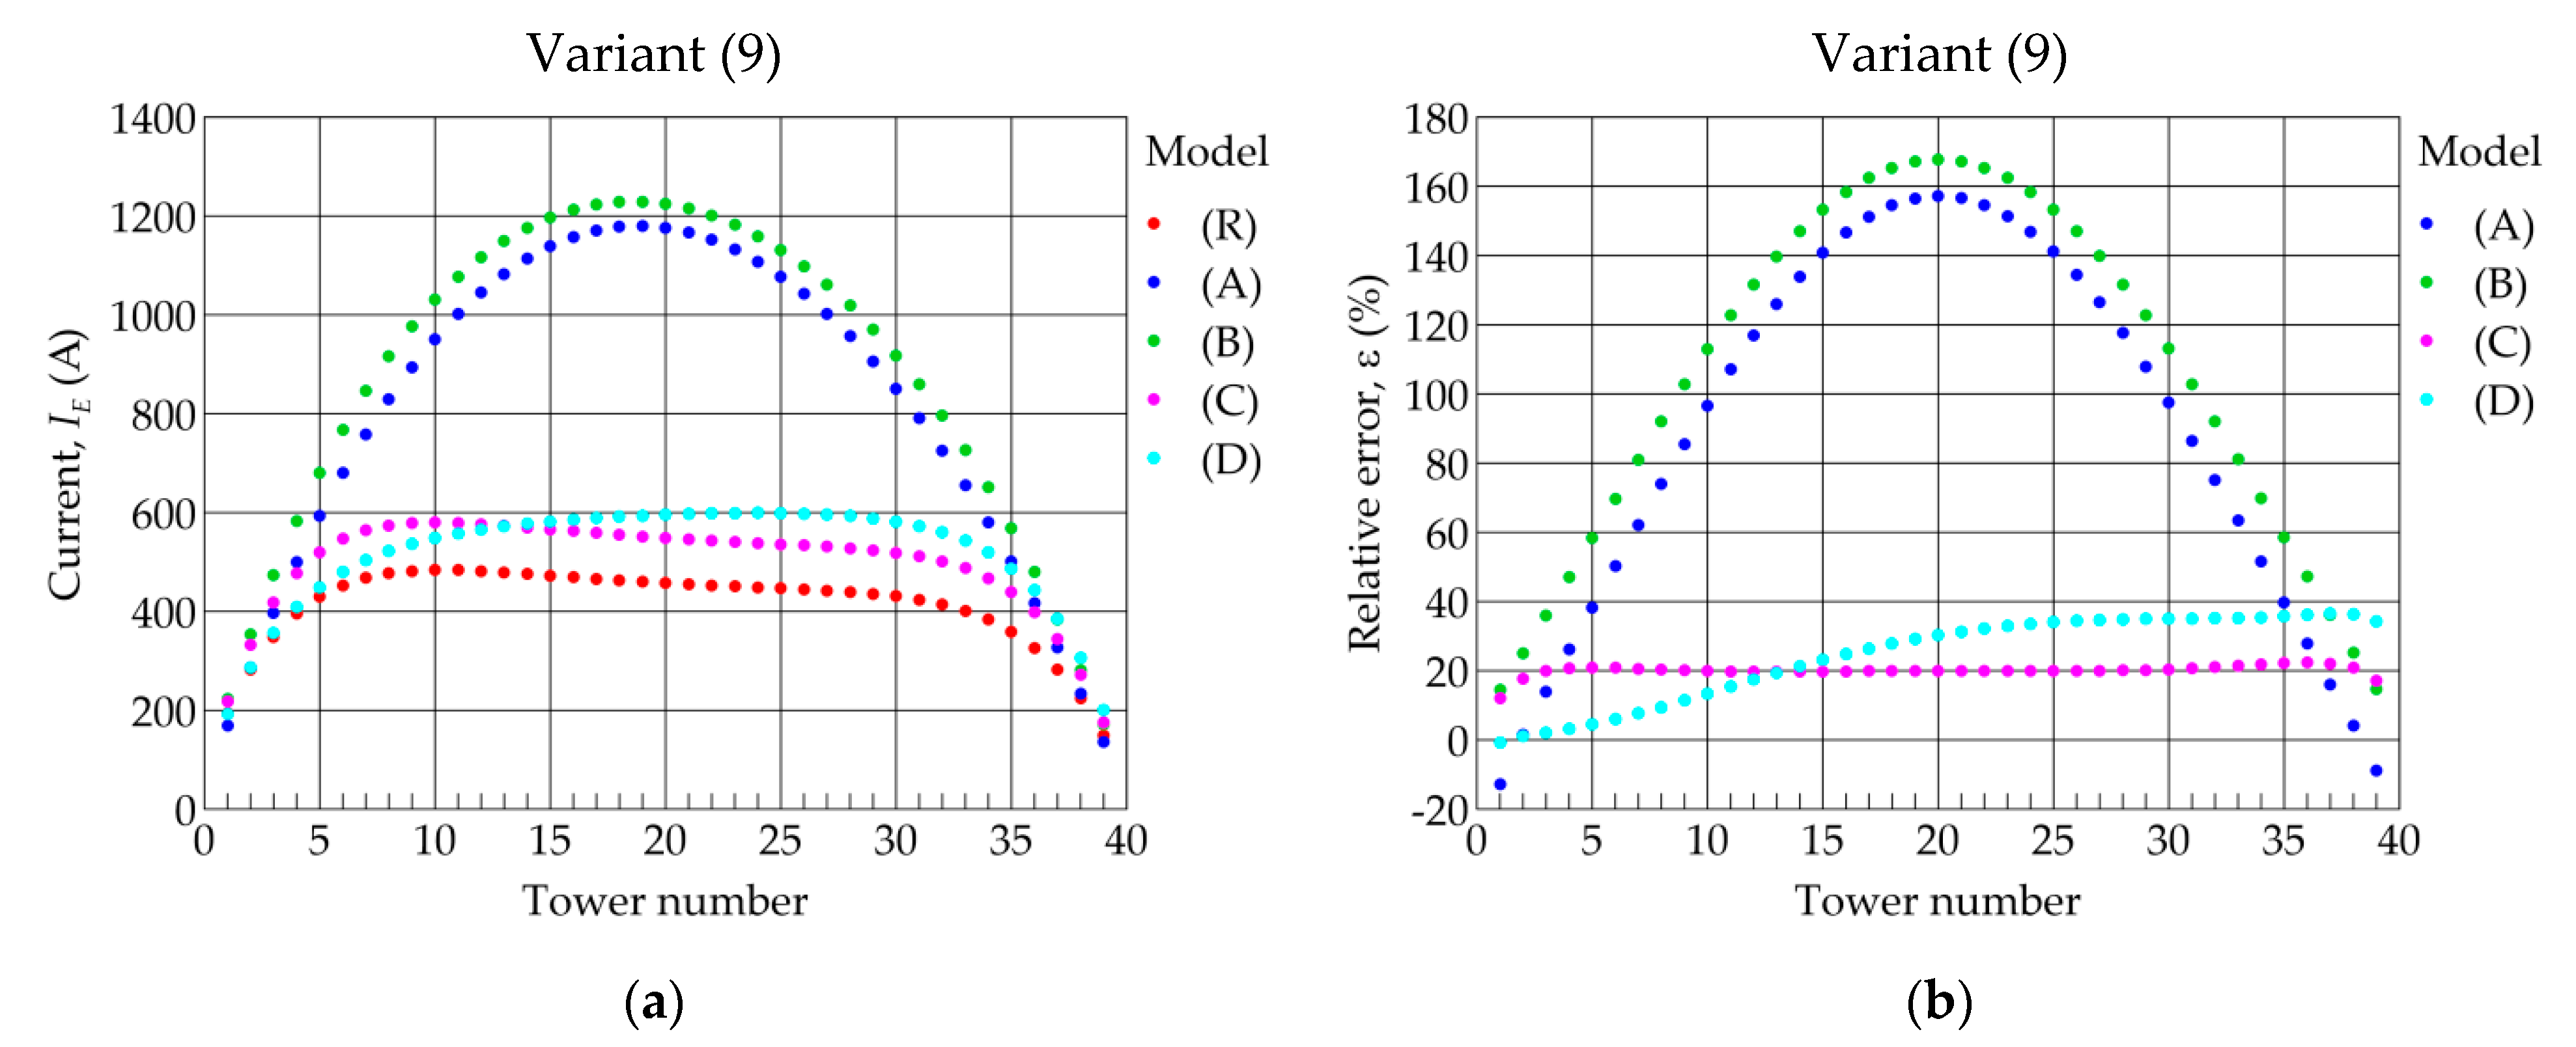
Figure 14 shows the results of the analysis for variant (9). The analyzed case was characterized by a five-times lower value of the substation earthing system resistance (
RS = 0.1 Ω) than in the other variants. This change caused a decrease in the value of earth currents only in a few towers in the substation vicinity. The error values for all analyzed models practically did not depend on the value of substations earthing system resistance and are comparable to the errors in variant (2).
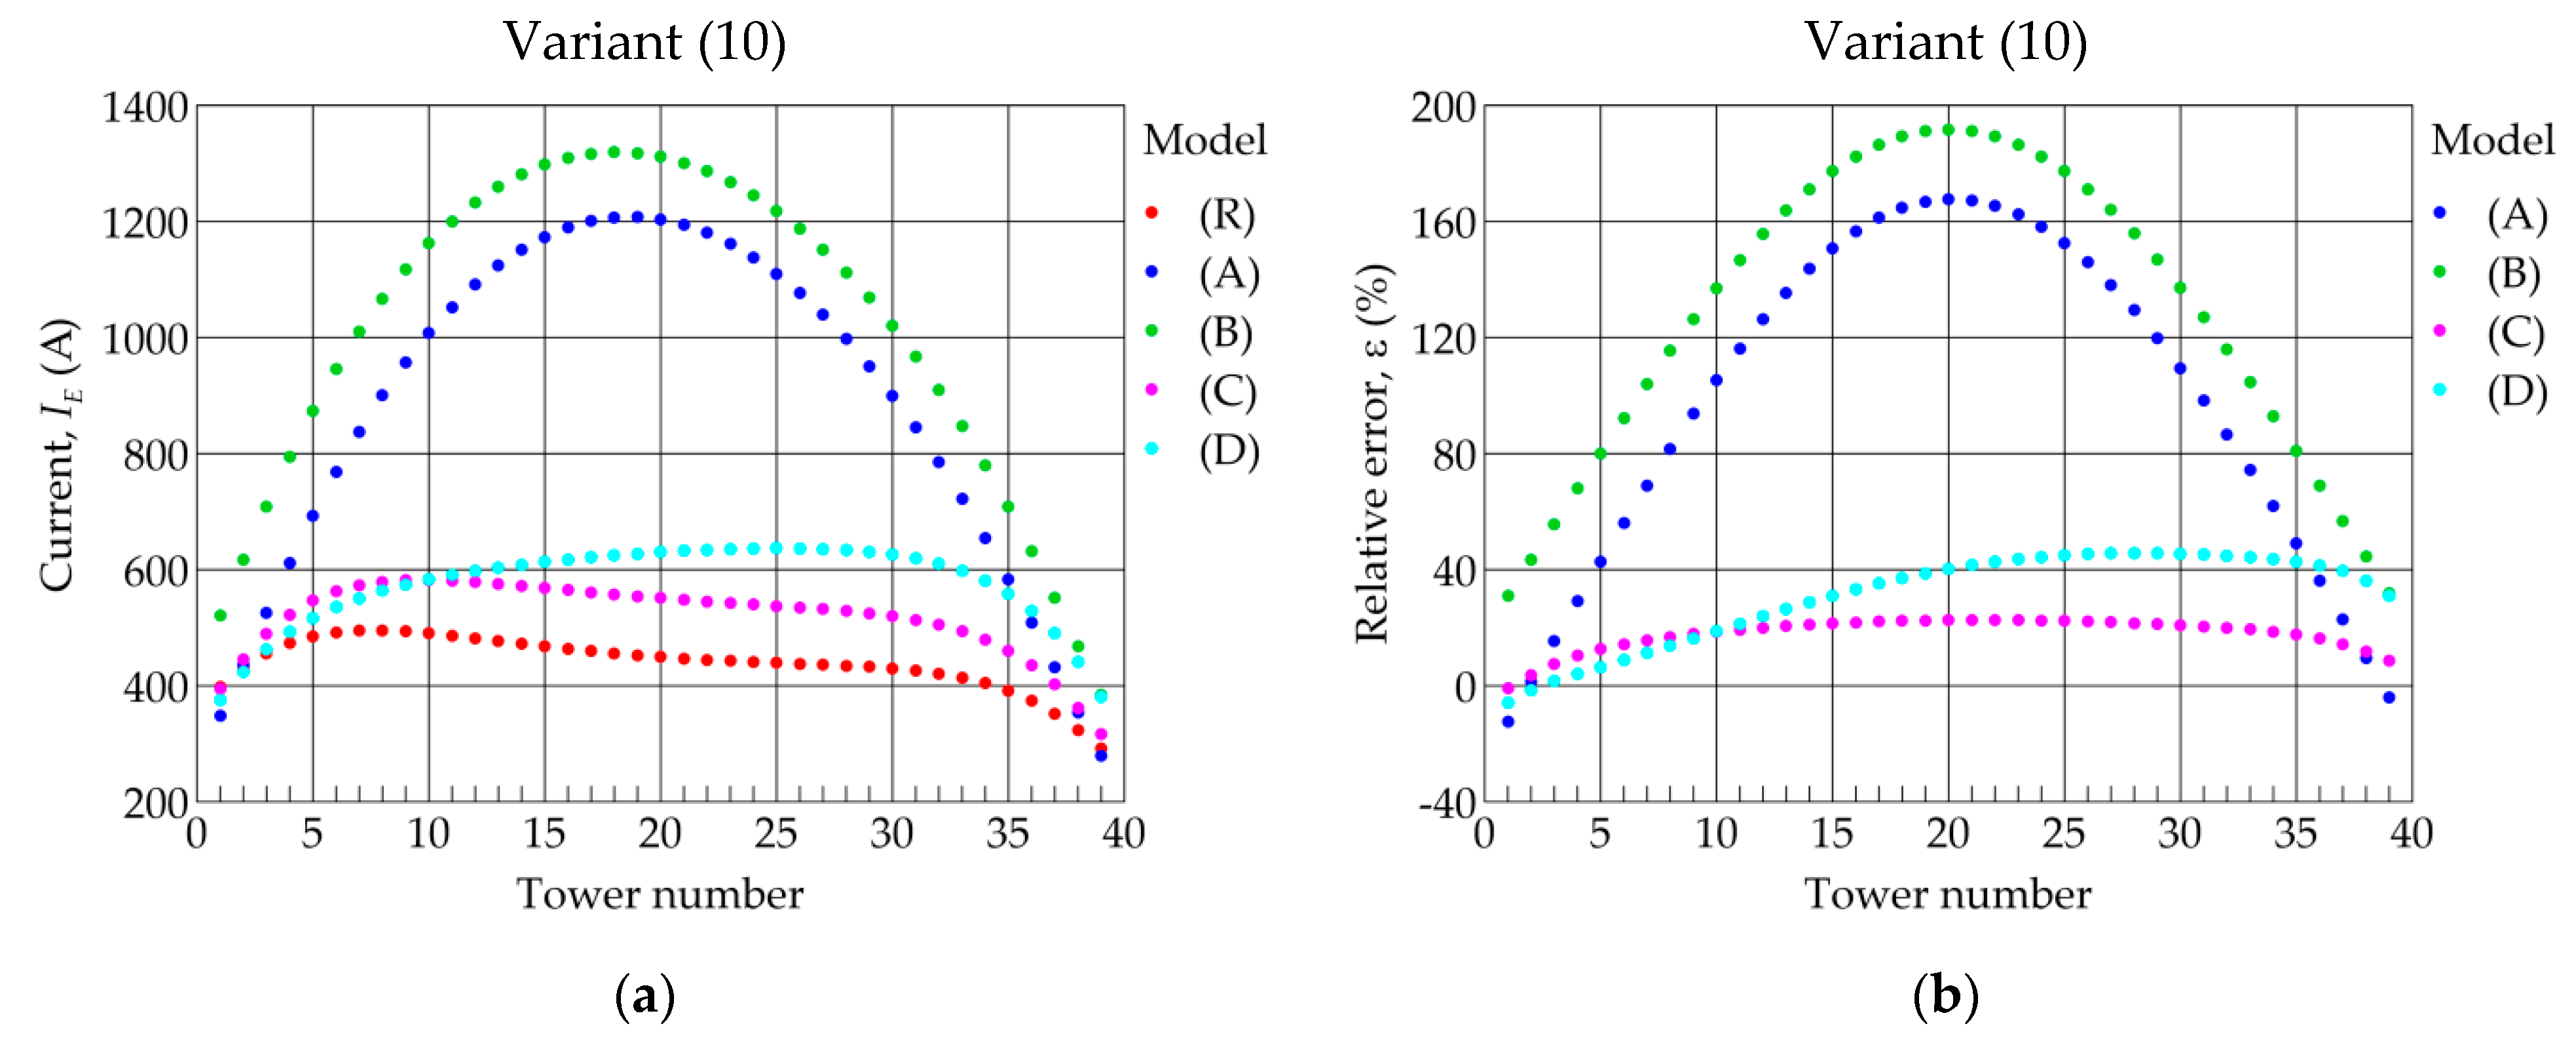
The results of the analysis for variant (10) are shown in
Figure 15. This variant had different soil resistivity equal to 300 Ωm, with the other parameters the same as in variant (2). Higher value of soil resistivity caused a slight decrease of the earth current values determined by model (R) and model (B), whereas the other models were characterized by slightly higher values of earth currents. This change caused an increase of relative errors. It should be noted that the simplified model (C), as well as the other variants, was characterized by the lowest values of relative errors and not exceeding 23%.
The analysis showed that model (A) and model (B) in all analyzed variants generated considerable errors up to several hundred percent. The higher power line length l was, the higher the relative error was. Despite the fact that models (A) and (B) are mathematically simple, they should not be used to determine the earthing current values.
In model (C), the error ranged from a few to about 25%. Generally, the earthing current values were only slightly overestimated along the entire power line. Therefore, we recommend that this model is used in calculations conducted for lines with one earth wire. In model (C), the relative error did not exceed the value of +25% in any of the analyzed variants. A negative error value in model (C) was observed in few variants in some of the first power line towers (1 to 3 towers) from substations where the short-circuit power was higher. However, the error value did not exceed −5%. The negative error can increase when assuming relatively small values of tower footing resistance (<5 Ω).
Very good results were obtained in model (D) for considerably short power lines (up to a dozen or so km) or lines with high tower footing resistance (RT ≥ 10 Ω). However, the relative error increased with the distance between the short-circuit site and the substation, and for long power lines (several tens of km long). In this case, the error values can reach even several hundred percent. Additionally, this model does not allow to identify correctly in which line towers the highest earth currents values occur. Moreover, it should be noted that model (D) is the most complex of the analyzed simplified models.
The research showed that, for power lines with two earth wires, reference model (R) did not ideally comply with multiphase model (M). This stems from the assumption of equal mutual impedances between the short-circuited phase wire and the earth wires as well as omission of the magnetic coupling between earth wires. To check the accuracy of the proposed computational models, tests were performed for a power line with two earth wires.
Figure 16 shows an example of the analysis results for line models with two earth wires with parameters from variant (1).
As can be seen, all simplified models generated significant relative error values, while reference model (R), relative to multiphase model (M), had a negative error of several percent value (
Figure 16b). Among the simplified models, model (C) also had the smallest relative error as in the case of the power lines with one earth wire. However, with reference to model (R), its errors reached up to +60%.
4. Conclusions
Although the construction of overhead power lines varies considerably, the method of their modelling in short-circuits calculations is the same. The mathematical description of accurate multiphase models of these lines is complex due to the electromagnetic couplings between the wires and the multi-site connections of the earth wires to the tower earthing system. The quantitative analysis of short-circuit conditions is complex and requires the use of advanced mathematical models. On the other hand, many technical decisions in operation and design practice must take into account the values of short-circuit currents and other related parameters.
Therefore, it is necessary to develop simplified methods of short-circuit calculations that do not require the use of complicated mathematical methods and with reference to the distribution of short-circuit currents in power lines. We proposed two precise models (multiphase model (M), reference model (R)), and four simplified models (named A–D). These models were analyzed for their applicability to the determination of earth currents during short circuits.
The developed and proposed models and the comparative analysis made in the article are the authors’ contributions to the field of short-circuits in power networks. Multivariate calculations were performed for different values of line parameters, which were the line length, span length, number of spans, tower footing resistance, substation earthing resistance, soil resistivity, and substations short-circuit powers. The parameter used to evaluate the individual models was the relative error of determining the earth currents values.
Based on the analysis of the proposed models, the following models, ranked according to increasing calculation relative error, are recommended for the determination of earth currents in lines with a single earth wire: multiphase model (M), reference model (R), and simplified model (C). However, earth currents in power lines equipped with two earth wires should be determined with multiphase model (M) or at least reference model (R). The use of simplified model (C) is permissible, although the error involved should be considered.
The use of multiphase model (M) in short-circuit calculations requires specialized simulation programs, such as EMTP-ATP. The calculations performed with reference model (R) require computer programs in which complex admittance matrices can be easily created and inverted, e.g., a MATLAB computing environment. In turn, simplified model (C) requires using simple computational tools, such as an EXCEL spreadsheet.
The research results presented in this article can support the design and operation of high-voltage overhead power lines in the field of electric shock protection assessment. One of the elements of this analysis is the determination of earth voltages resulting from the flow of short-circuit currents in the power line towers. Due to the fact that the allowed values of earth voltages depend on the duration of the short circuit, the results of the research can also be used in the coordination of the protection automation systems settings. The simplified models proposed by the authors are currently used by some power distribution operators to assess the shock hazard around line towers during earth faults.


