Article

A New Measurement of Anisotropic Relative Permeability and Its Application in Numerical Simulation

1
Faculty of Engineering, School of Energy, China University of Geosciences, Beijing 100083, China
2
Shengli Oilfield Exploration and Development Research Institute, Dongying 257001, China
*
Author to whom correspondence should be addressed.
Energies 2021, 14(16), 4731; https://doi.org/10.3390/en14164731
Submission received: 7 June 2021 / Revised: 30 July 2021 / Accepted: 2 August 2021 / Published: 4 August 2021

Abstract

:
In this paper, we used a self-developed anisotropic cubic core holder to test anisotropic relative permeability by the unsteady-states method, and introduced the anisotropic relative permeability to the traditional numerical simulator. The oil–water two-phase governing equation considering the anisotropic relative permeability is established, and the difference discretization is carried out. We formed a new oil–water two-phase numerical simulation method. It is clear that in a heterogeneous rock with millimeter to centimeter scale laminae, relative permeability is an anisotropic tensor. When the displacement direction is parallel to the bedding, the residual oil saturation is high and the displacement efficiency is low. The greater the angle between the displacement direction and the bedding strike, the lower the residual oil saturation is, the higher the displacement efficiency is, and the relative permeability curve tends towards a rightward shift. The new simulator showed that the anisotropic relative permeability not only affects the breakthrough time and sweep range of water flooding, but also has a significant influence on the overall water cut. The new simulator is validated with the actual oilfield model. It could describe the law of oil–water seepage in an anisotropic reservoir, depict the law of remaining oil distribution of a typical fluvial reservoir, and provide technical support for reasonable injection-production directions.

1. Introduction

Old oilfields in eastern China have generally entered a dual-high development stage with high water cut and high recovery degree. The hydrodynamic adjustment of “liquid flow steering” has achieved good results in improving recovery. Fluid flow steering changes the flow direction of fluid and makes fluid flow paths more intricate. Fluid seepage laws thus become complicated. At present, relative permeability is isotropic in traditional numerical simulations, which cannot accurately calculate residual oil distribution and cannot describe the deep mechanisms of liquid flow steering.
Relative permeability (the ratio of effective permeability to absolute permeability) is a basic parameter to study the seepage law of multiphase fluid. There are many factors affecting relative permeability, among which the heterogeneous pore structure is of vital importance. It is found that relative permeability will change significantly due to microscopic local pore structure, fluid interaction, and rock–fluid interaction [1,2,3,4,5]. Therefore, the relative permeability must be different when the pore structure of the reservoir is different.
In the past several years, a number of works have been reported on the directional characteristics of pore structures. In fluvial sediments, due to long-term erosion and erosion by water flow, the particles that make up the rock skeleton of the reservoir are often in irregular ellipsoid shapes. In the process of deposition, the skeleton particles are arranged directionally with the transport medium, and the direction of the long axis is consistent with the direction of the flow, while the direction of the short axis is perpendicular to the direction of the flow. The compaction in the diagenetic process also strengthens this directional arrangement, which makes the pore structure directional. Effected by the sedimentary environment and the inherent properties of the reservoir, including the original sedimentary bedding, vertical rhythm, and so on, the pore structure will be obviously different in the plane and vertical, and the fluid flow will have a dominant migration direction [5,6,7,8,9,10,11]. Recent theoretical and experimental studies have revealed that permeability is anisotropic [12,13,14,15,16]. Since it is the pore throats that govern the percolation threshold for porous media, permeability anisotropy is the behavior of the anisotropy of pore structure. In other words, the pore structure anisotropy has been widely observed.
Since Corey and Rathjens found that the relative permeability of bedded rocks is directional in 1956, research on anisotropic relative permeability has mainly focused on the following three aspects. Firstly, identification of core scales in the laboratory. It has been shown that relative permeability is related to the particle size of the rock composition of bedding structures (namely pore throat structure) and micro fractures. When driven along the direction of penetrating bedding, the change of rock properties leads to the change of capillary resistance so that the movement of fluid in this direction is blocked, and the oil in the core will be blocked, indicating that the relative permeability is directional. The displacement direction is different, the shape of phase permeability curve is different, the vertical displacement remaining oil is less, and the displacement efficiency is higher [17,18,19,20,21,22,23,24]. Secondly, discovery in numerical simulation. Some numerical simulation studies used pore network models to point out that the relative permeability parallel to the bedding direction is larger than that perpendicular to the bedding direction, and the residual saturation and relative permeability are sensitive to anisotropic correlation. The higher the absolute permeability value is, the greater the relative permeability value is, and the relative permeability is related to pore connectivity and pore inclination angles. The dendritic nature of gas-cluster topology, especially in the presence of other forces, such as gravity or strong viscous pressure gradients, clearly suggests that significant anisotropy may exist in relative permeability due to the balance of forces in the dissolved gas drive process [25,26,27,28,29,30,31]. Thirdly, microscopic visual seepage physical simulation. It is indicated that the change of injection-production angle will break the pressure balance of the original seepage field, promote the stripping and seepage of all kinds of remaining oil, and make the remaining oil migrate again, thus changing the microscopic remaining oil type and distribution law. The essence of this change is that the percolation law of the oil and water phases has changed due to different pore structures in different displacement directions [32,33]. Numerical models and physical experiments all prove that like porosity and permeability, relative permeability is a direction-dependent tensor, not a scalar.
Although the anisotropic characteristics of relative permeability were recognized earlier, the related studies focused on its embodiment in microscopic displacement experiments, or the demonstration of the characteristics by numerical simulation. In particular, few studies, to our knowledge, have considered two facts. Firstly, the test of anisotropic relative permeability. At present, most studies tested the anisotropic relative permeability curve by drilling cores in different directions. The testing device and the displacement direction is one-dimensional. However, the three-dimensional flow of fluid in the core is not equal to the simple superposition of three one-dimensional flows. The traditional relative permeability curve testing device cannot increase or change the displacement direction and cannot directly test the anisotropic relative permeability curve. It is quite difficult to test the relative permeability in three directions through one sample, However, the different test results of the same sample are the most comparable; Secondly, the application of anisotropic relative permeability in reservoir numerical simulation is very weak. There is a long way to go to test and apply the anisotropic relative permeability.
In this paper, firstly, the typical fluvial sandstone of the Shihezi fomation outcrop in Jiyang depression of Bohai Bay basin are used to measure the anisotropic relative permeability via a self-developed anisotropic cubic core holder; Secondly, we established a new simulator considering anisotropic relative permeability and compared the calculation results between the new simulator and traditional simulator. Finally, we apply the new simulator to the reservoir numerical simulation of Cheng 4 block in Shengli Oilfield (the reservoir is a typical fluvial sedimentary environment). The production data show that the numerical simulation method considering anisotropic relative permeability can describe the remaining oil distribution more accurately, especially in the situation that the reservoir has entered the development period of ultra-high water cut. In order to precisely apply anisotropic relative permeability to typical fluvial reservoir simulation or fractured reservoir, there is an urgent need for working on the upscaling of anisotropic relative permeability.

2. Experiments

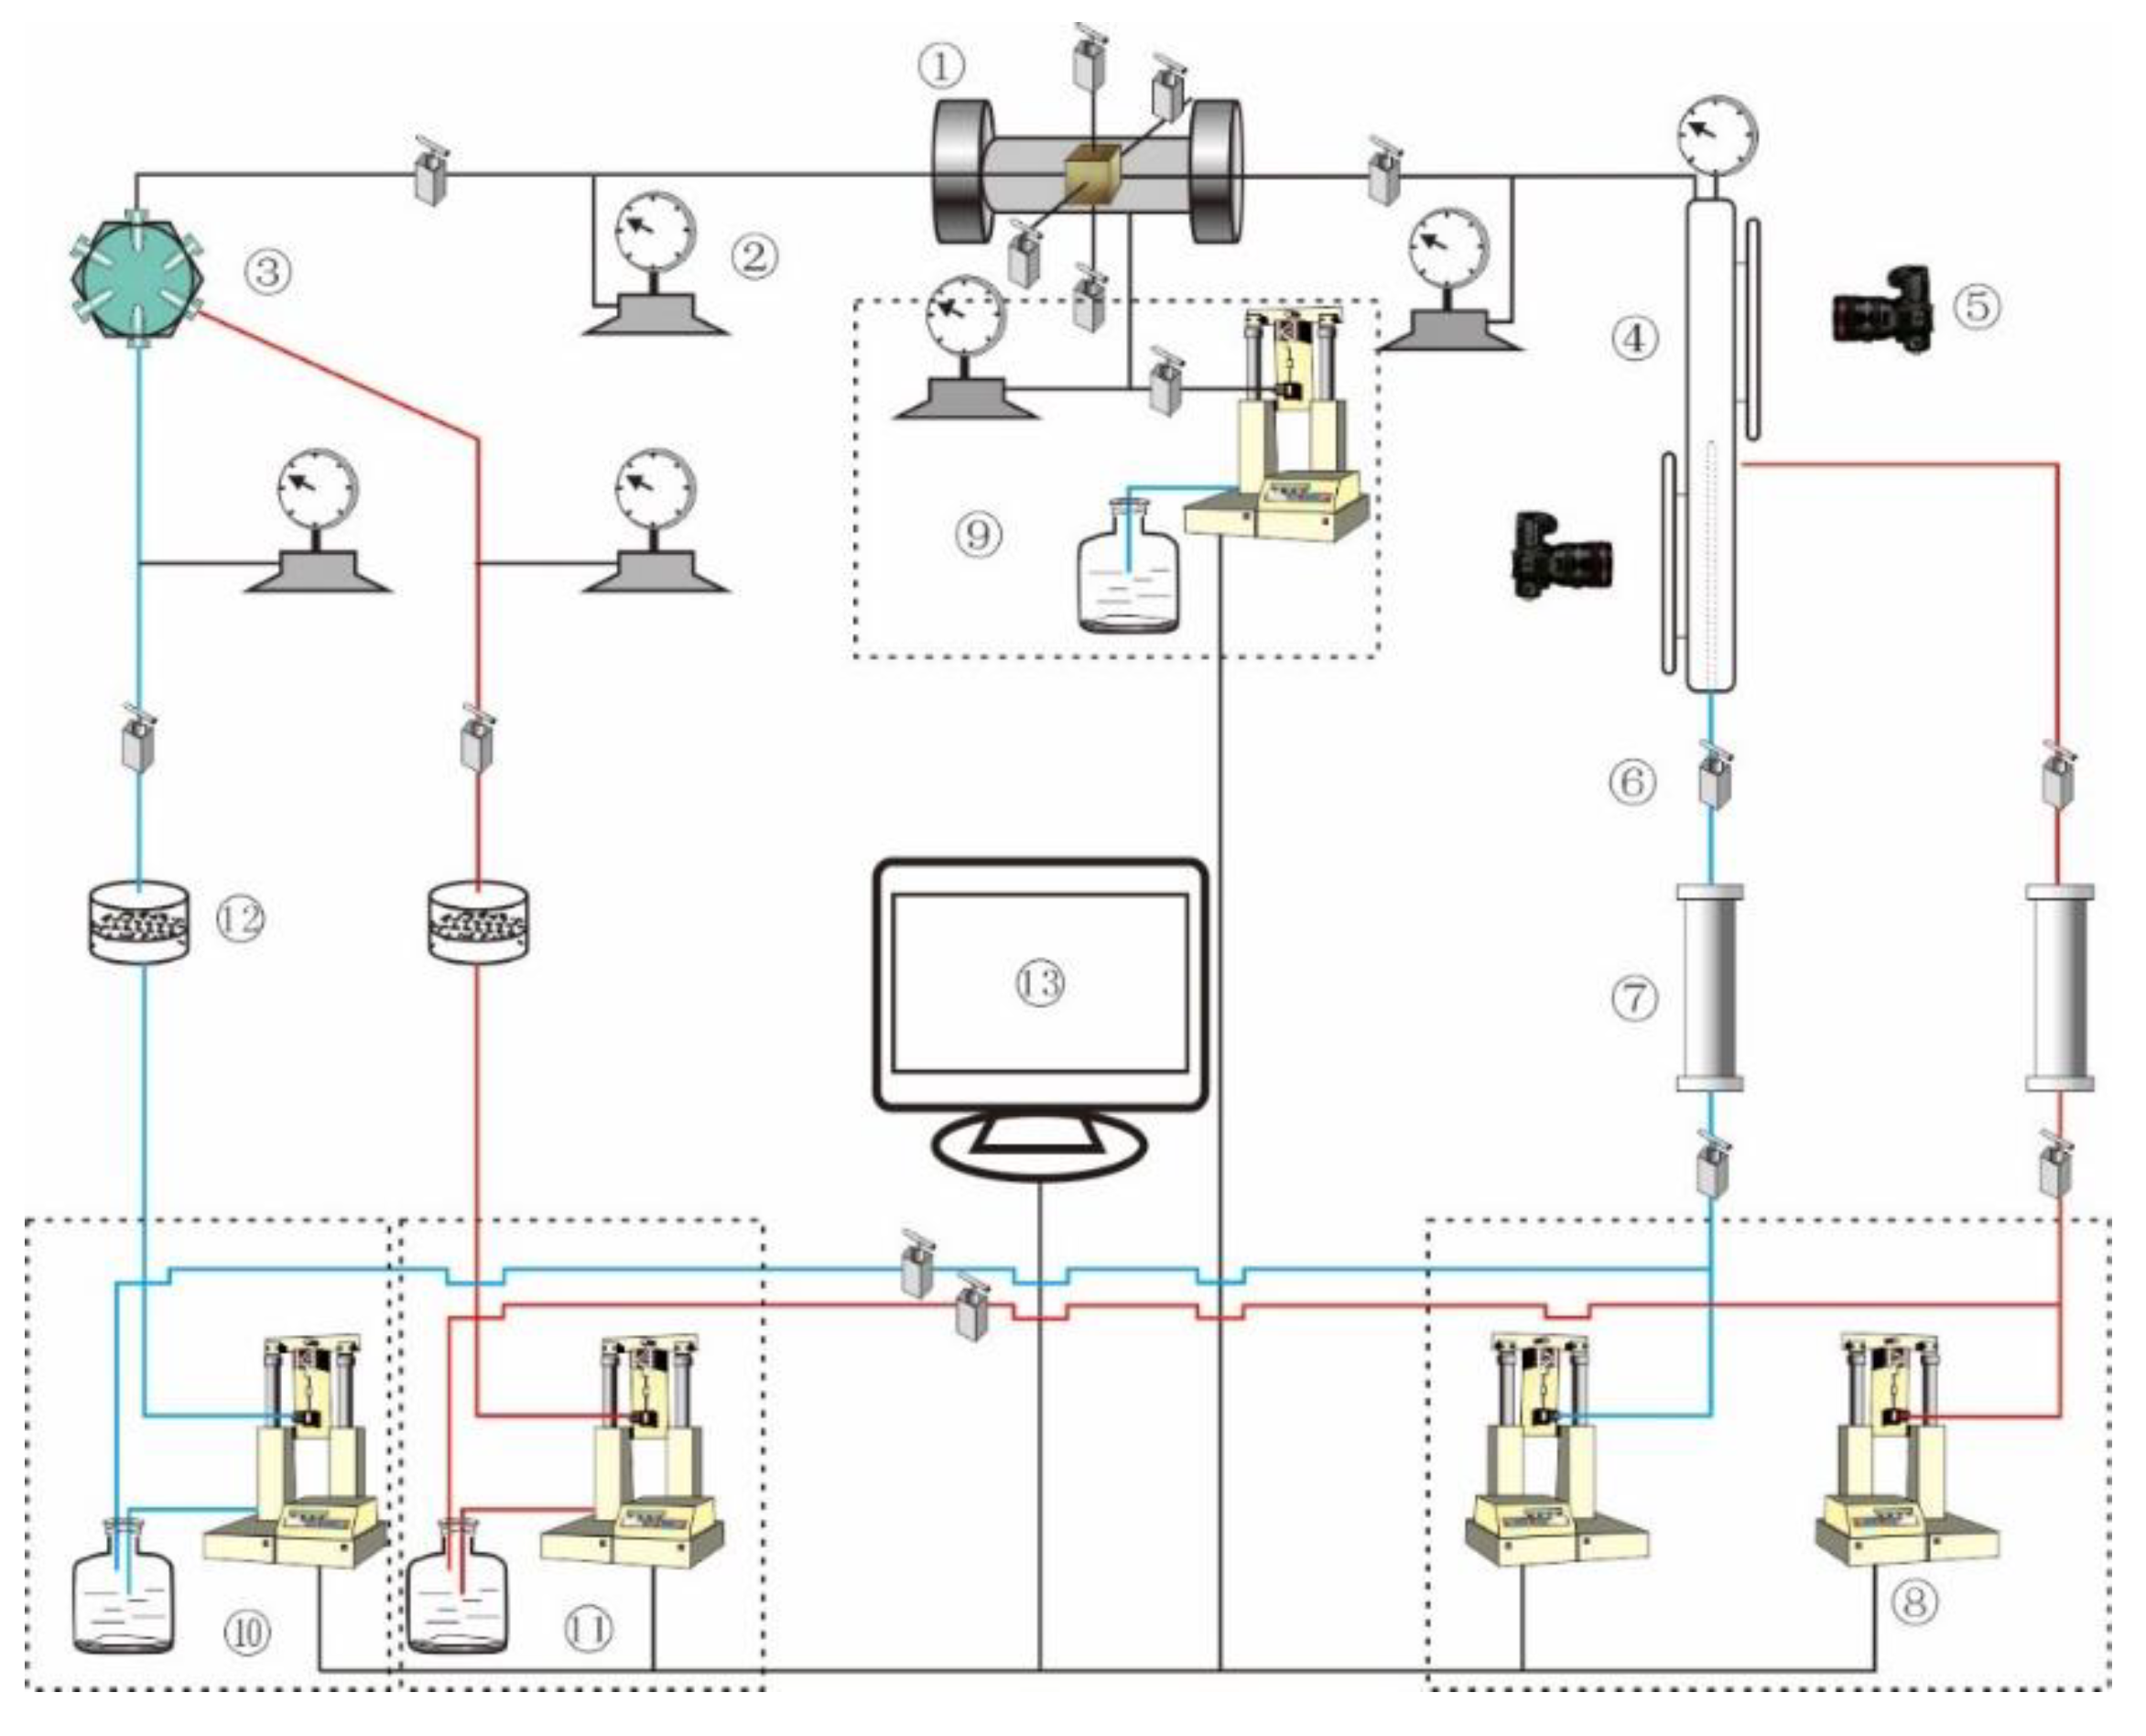
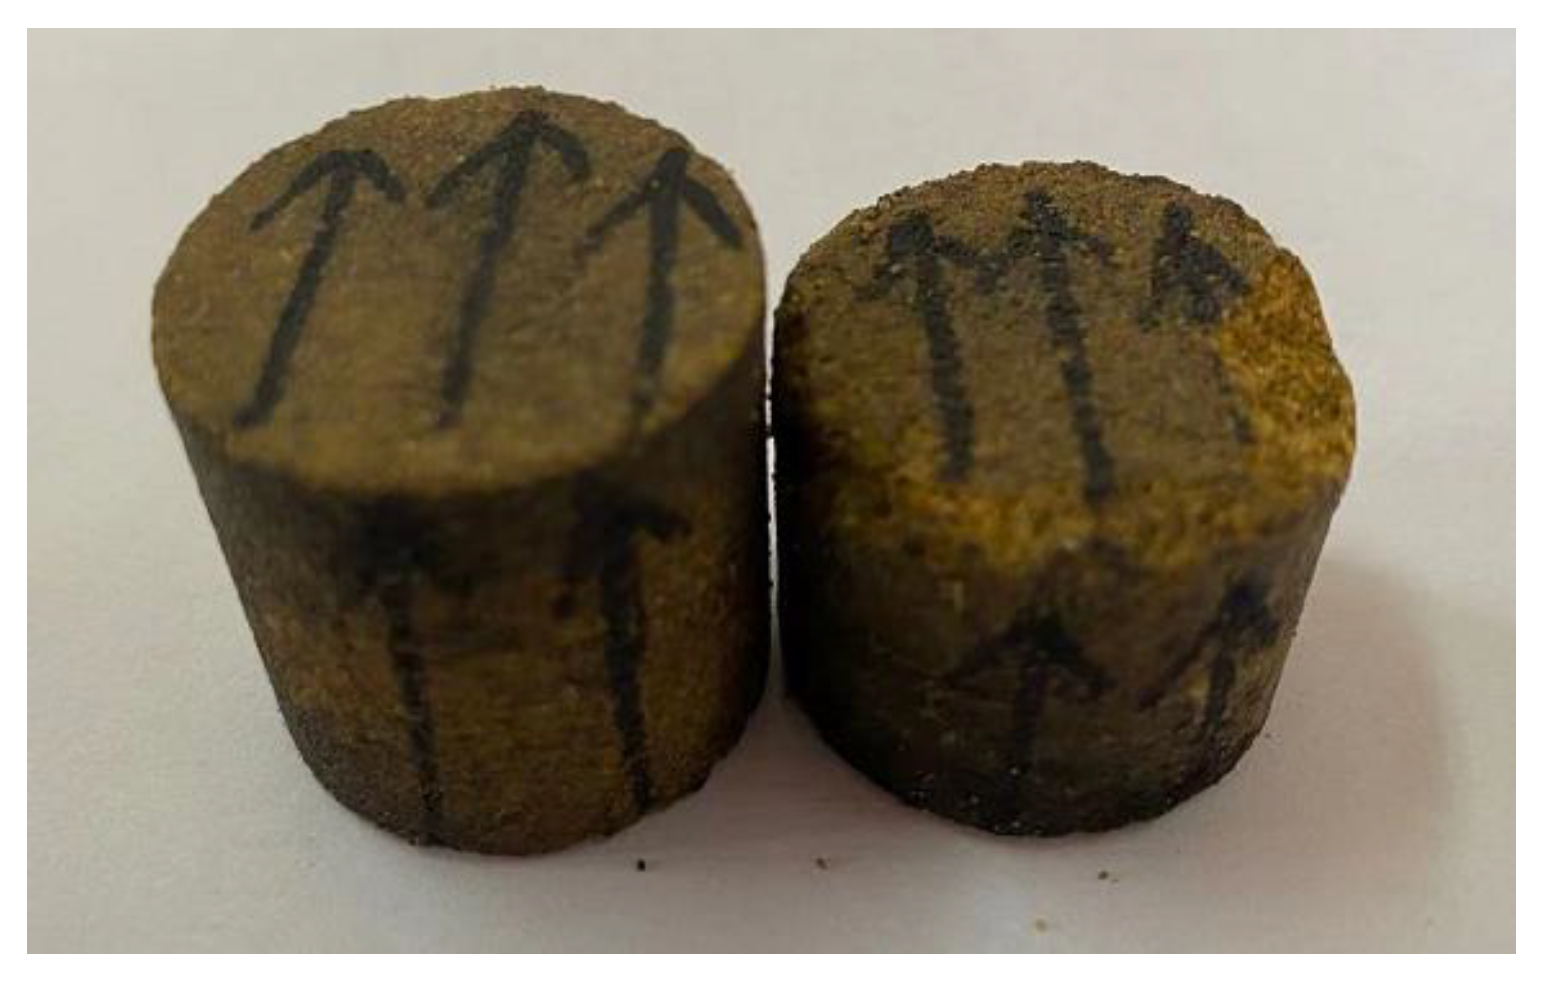
2.1. Sample Preparation and Experimental Apparatus

In this study, fluvial facies sandstone outcrop from Guantao formation was used in this study. We can clearly see that the sample has developed plate-like cross-beds, which are at an angle of 30 degrees with the ground (Figure 1). We define the bedding direction as the x direction, the y direction orthogonal to x, and the z direction perpendicular to the xy plane. The water permeability in the three directions of x, y, and z is 37.87 mD, 20.83 mD and 18.94 mD, respectively, and the porosity is 15.98%. The testing oil is a mixture of crude oil and diesel with a viscosity of 10 mPa·s at 20 °C. The salinity and viscosity of the testing water are 4000 mg/L and 1.0 mPa·s, respectively. The testing fluids are based on the actual reservoir oil and water properties in the Shengli Oilfield.
The experimental apparatus consists of five different parts: injection control system, temperature and pressure control system, core holding system, outlet back pressure control system, and data acquisition system. The schematic representation of the experimental apparatus is shown in Figure 2.
(①—anisotropic cubic core holder; ②—pressure sensor; ③—six-way value; ④- oil–water separator; ⑤—Monitoring camera system; ⑥—value; ⑦—output liquid collector; ⑧—backpressure regulator (BPR); ⑨—confining pressure system; ⑩—water flooding system; ⑪—oil flooding system; ⑫—filter; ⑬—control system).

2.2. Experimental Process
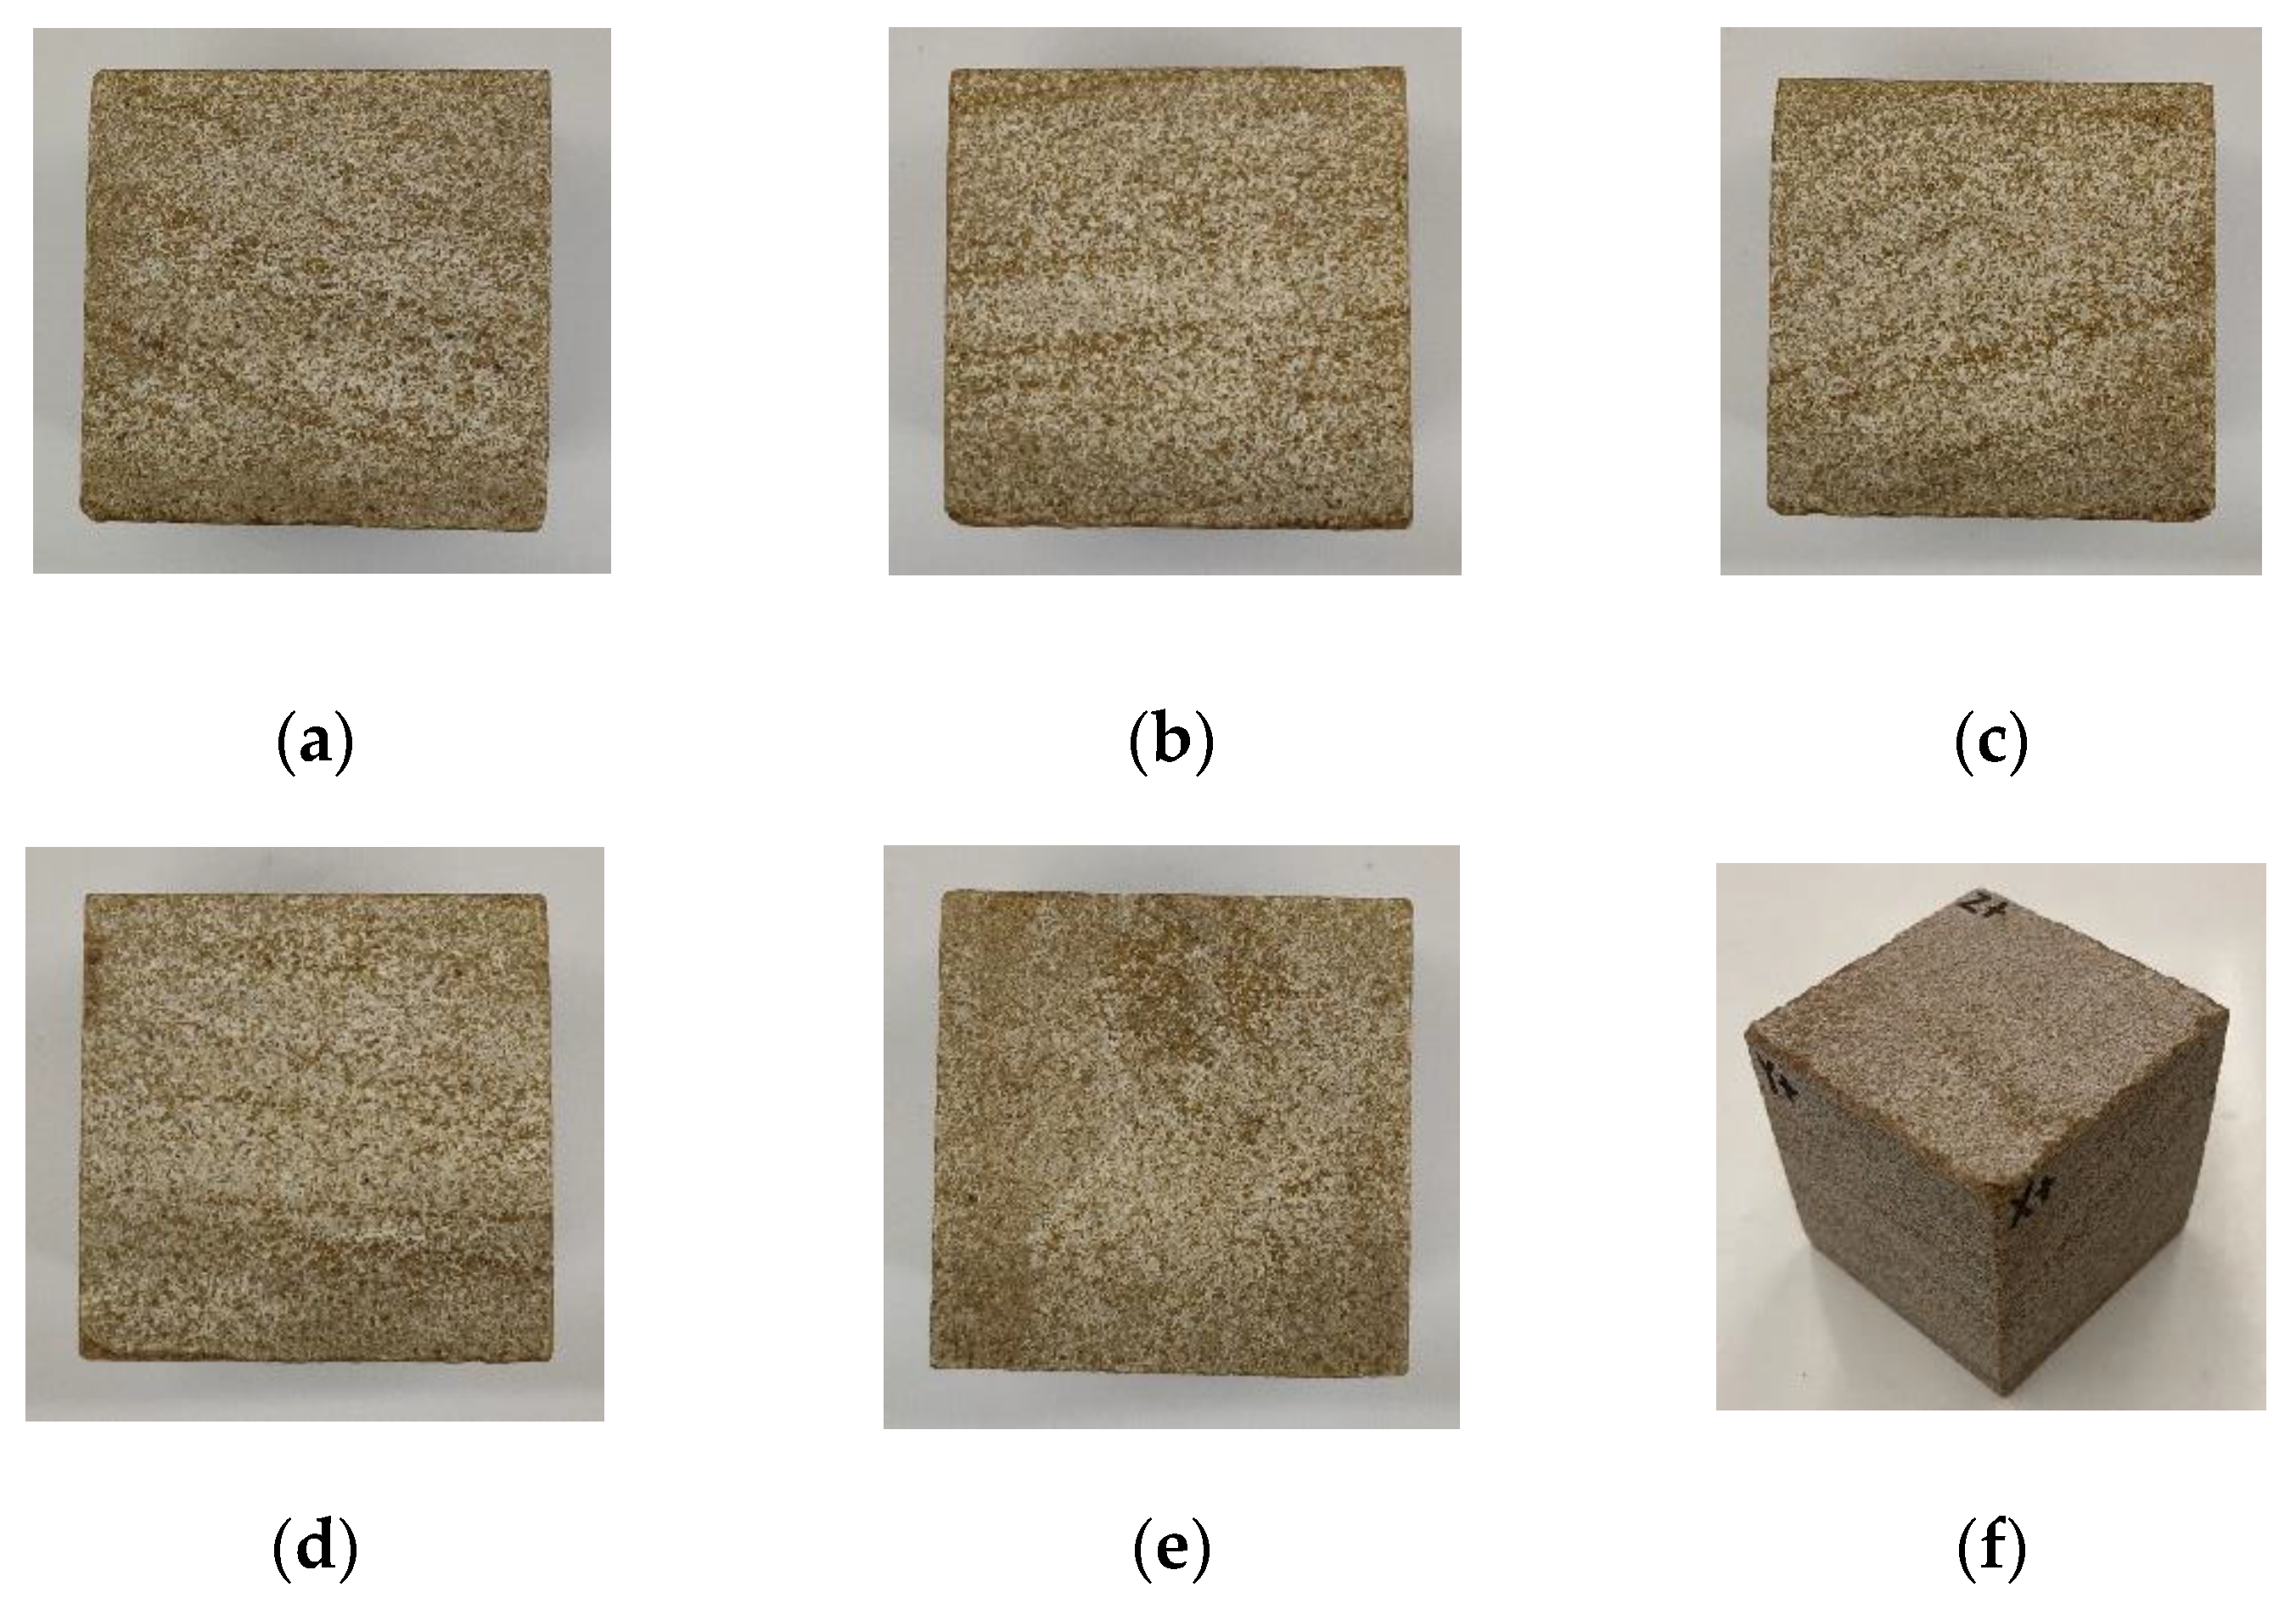
(1)
Use wire cutting technology to cut outcrop rock samples into 50 mm × 50 mm × 50 mm cube core;
(2)
Wash the oil, water, salt, soil, and other impurities attached to the cubic core, dry, and weigh the cubic core;
(3)
Put the cubic core into a rubber sleeve;
(4)
Measure the porosity of the cubic core and test its permeability from three directions of x, y, and z;
(5)
Saturate the cubic core with formation water in three directions;
(6)
Measure the absolute permeability of water in three directions;
(7)
Displace the water in the cubic core with oil along three directions until the irreducible water saturation (record the flow data and time at the outlet; open the outlet plunger and close the inlet; the outlet water cut <0.1%, Additionally, when the number of PV injected is greater than 10 PV, stop the oil saturation process.)
(8)
Measure the effective permeability of the oil phase under irreducible water saturation in three directions;
(9)
Displace the oil in the sample with water along the x direction, inject at a constant speed, 10 PV (record the flow data and time at the outlet; when the water cut at the outlet is >99.9%, and the injected PV number is greater than 10 PV, stop the water flooding process);
(10)
Measure the effective permeability of water under residual oil saturation;
(11)
Repeat step 7.
(12)
Change the inlet and outlet of the core holder to change the displacement direction;
(13)
Repeat steps 9–11 until the relative permeability tests in the three directions of x, y, and z are completed;
(14)
Wash, dry, and weigh the sample.
(15)
Calculate the relative permeability.

3. Methodology

3.1. Characterization of Anisotropic Relative Permeability

The test process is continuous. After measuring the x direction, the oil is saturated in the x direction, and then the direction is changed to do the water flooding process, so as to ensure that the core porous medium and the oil and water conditions are the same in each test. The main goal of this research is to observe the difference in residual oil saturation after water flooding in different directions. Therefore, minor changes in the irreducible water saturation are ignored.
During the experimental process and numerical simulation research process, we realized that the relative permeability of the XY, XZ, and YZ directions are also important to this experiment. Different inlet and outlet combinations could help to test the relative permeability of the XY, XZ, and YZ directions. For example, if we use the X direction as the injection end, we can use the Y direction or the Z direction as the production end. However, the existing JBN calculation method cannot be used to solve the relative permeability curve of such a combined inject-product method. The automatic history matching method or other methods need to be proposed to solve the relative permeability curve.
In this experiment, the JBN method was used to solve the relative permeability curve. The JBN method is based on the Buckley–Leverett one-dimensional two-phase water flooding front advancement theory, ignoring capillary pressure and gravity, assuming that the two-phase immiscible fluid is incompressible and the oil–water saturation in any cross section of the rock sample is uniform. In the process of water flooding, only when the displacement front breaks through the end, can the relative permeability of the oil and water phase be calculated. For the entire core, the displacement process has a breakthrough time, but for the end face, the flow is pure oil phase before the breakthrough. The saturation in the end face has not changed. After the breakthrough, the process of the end face water saturation from the irreducible water saturation to the maximum water saturation is complete. JBN projects the seepage law of the entire core to the end face. It studies the law of water saturation and oil–water seepage at the end face. The relative permeability calculated by JBN represents the end face, not the entire core.
There is a marked difference between the relative permeability curves derived from the x direction, y direction, and vertical displacements. Different residual oil saturations were obtained for three directions displacements, the residual oil saturation in X direction is 0.56, the residual oil saturation in Y direction is 0.61, the residual oil saturation in Z direction is 0.82. The displacement was more efficient in the vertical than other directions. The greater the angle between the displacement direction and the bedding strike, the lower the residual oil saturation is, the higher the displacement efficiency is, and the relative permeability curve tends towards a rightward shift. The displacement efficiency in the three directions of x, y, and z are 0.664, 0.721, and 0.84, respectively.

3.2. Numerical Simulation with Anisotropic Relative Permeability

According to the experimental results, JBN (calculation of relative permeability from displacement experiments proposed by Johnson, E.F., Bossler, D.P. and Naumann, V.O.) method was used to obtain the relative permeability curves in three directions. The anisotropic relative permeability is applied to the traditional numerical simulator and the traditional numerical simulator is modified.
In this paper, based on the oil–water two-phase black oil model, the isotropic relative permeability in the water phase governing equation and the oil phase governing equation is replaced by the anisotropic relative permeability, and the new oil phase and water phase motion equations are solved by the finite difference method. There are many numerical simulation methods, such as the finite difference method, finite element method, etc. Different solving methods have great influence on the results of fracture–matrix seepage, different mesh sizes, and poor mesh quality. The stochastic perturbation-based finite element approach proposed by Kaminski, M. can even treat uncertainty in inflow or wall boundary conditions, in parameters of the equations, in profile shape, etc. [34]. The model in this paper is relatively simple, so we chose the traditional finite difference method to solve the problem. The assumptions of the numerical simulation model established in this paper are as follows:
(1)
There are only two phases, oil and water, in the model.
(2)
There is no mass exchange between oil and water.
(3)
The fluid flow seepage follows Darcy’s law.
(4)
Rocks and fluids are slightly compressible.
The oil governing equations used in this study are presented in Appendix A, where the derivation process is discussed.
The fully implicit method is selected to ensure accuracy during the calculation. The heterogeneity of the reservoir is usually strong, and the fluid properties are also complex and diverse. In addition, the time span of historical production data is large, and as a result, the stability and robustness of implicit pressure, explicit saturation (IMPES) implementation are not enough to meet the requirements of reservoir numerical simulation [35]. The fully implicit method is very stable and can solve the problems of non-convergence and computational instability in a heterogeneous model.

4. Numerical Simulation Calculating Results and Discussion

In this study, according to the experimental results, we set up two kinds of numerical simulation models: homogeneous permeability model and heterogeneous permeability model. The numerical simulation calculating results obtained from the new simulator considering anisotropic relative permeability is compared with that from a traditional numerical simulator (isotropic relative permeability). The basic parameters of the numerical simulation model are as shown in Table 1, and the relative permeability curve used in the numerical simulation model is shown in Figure 3.

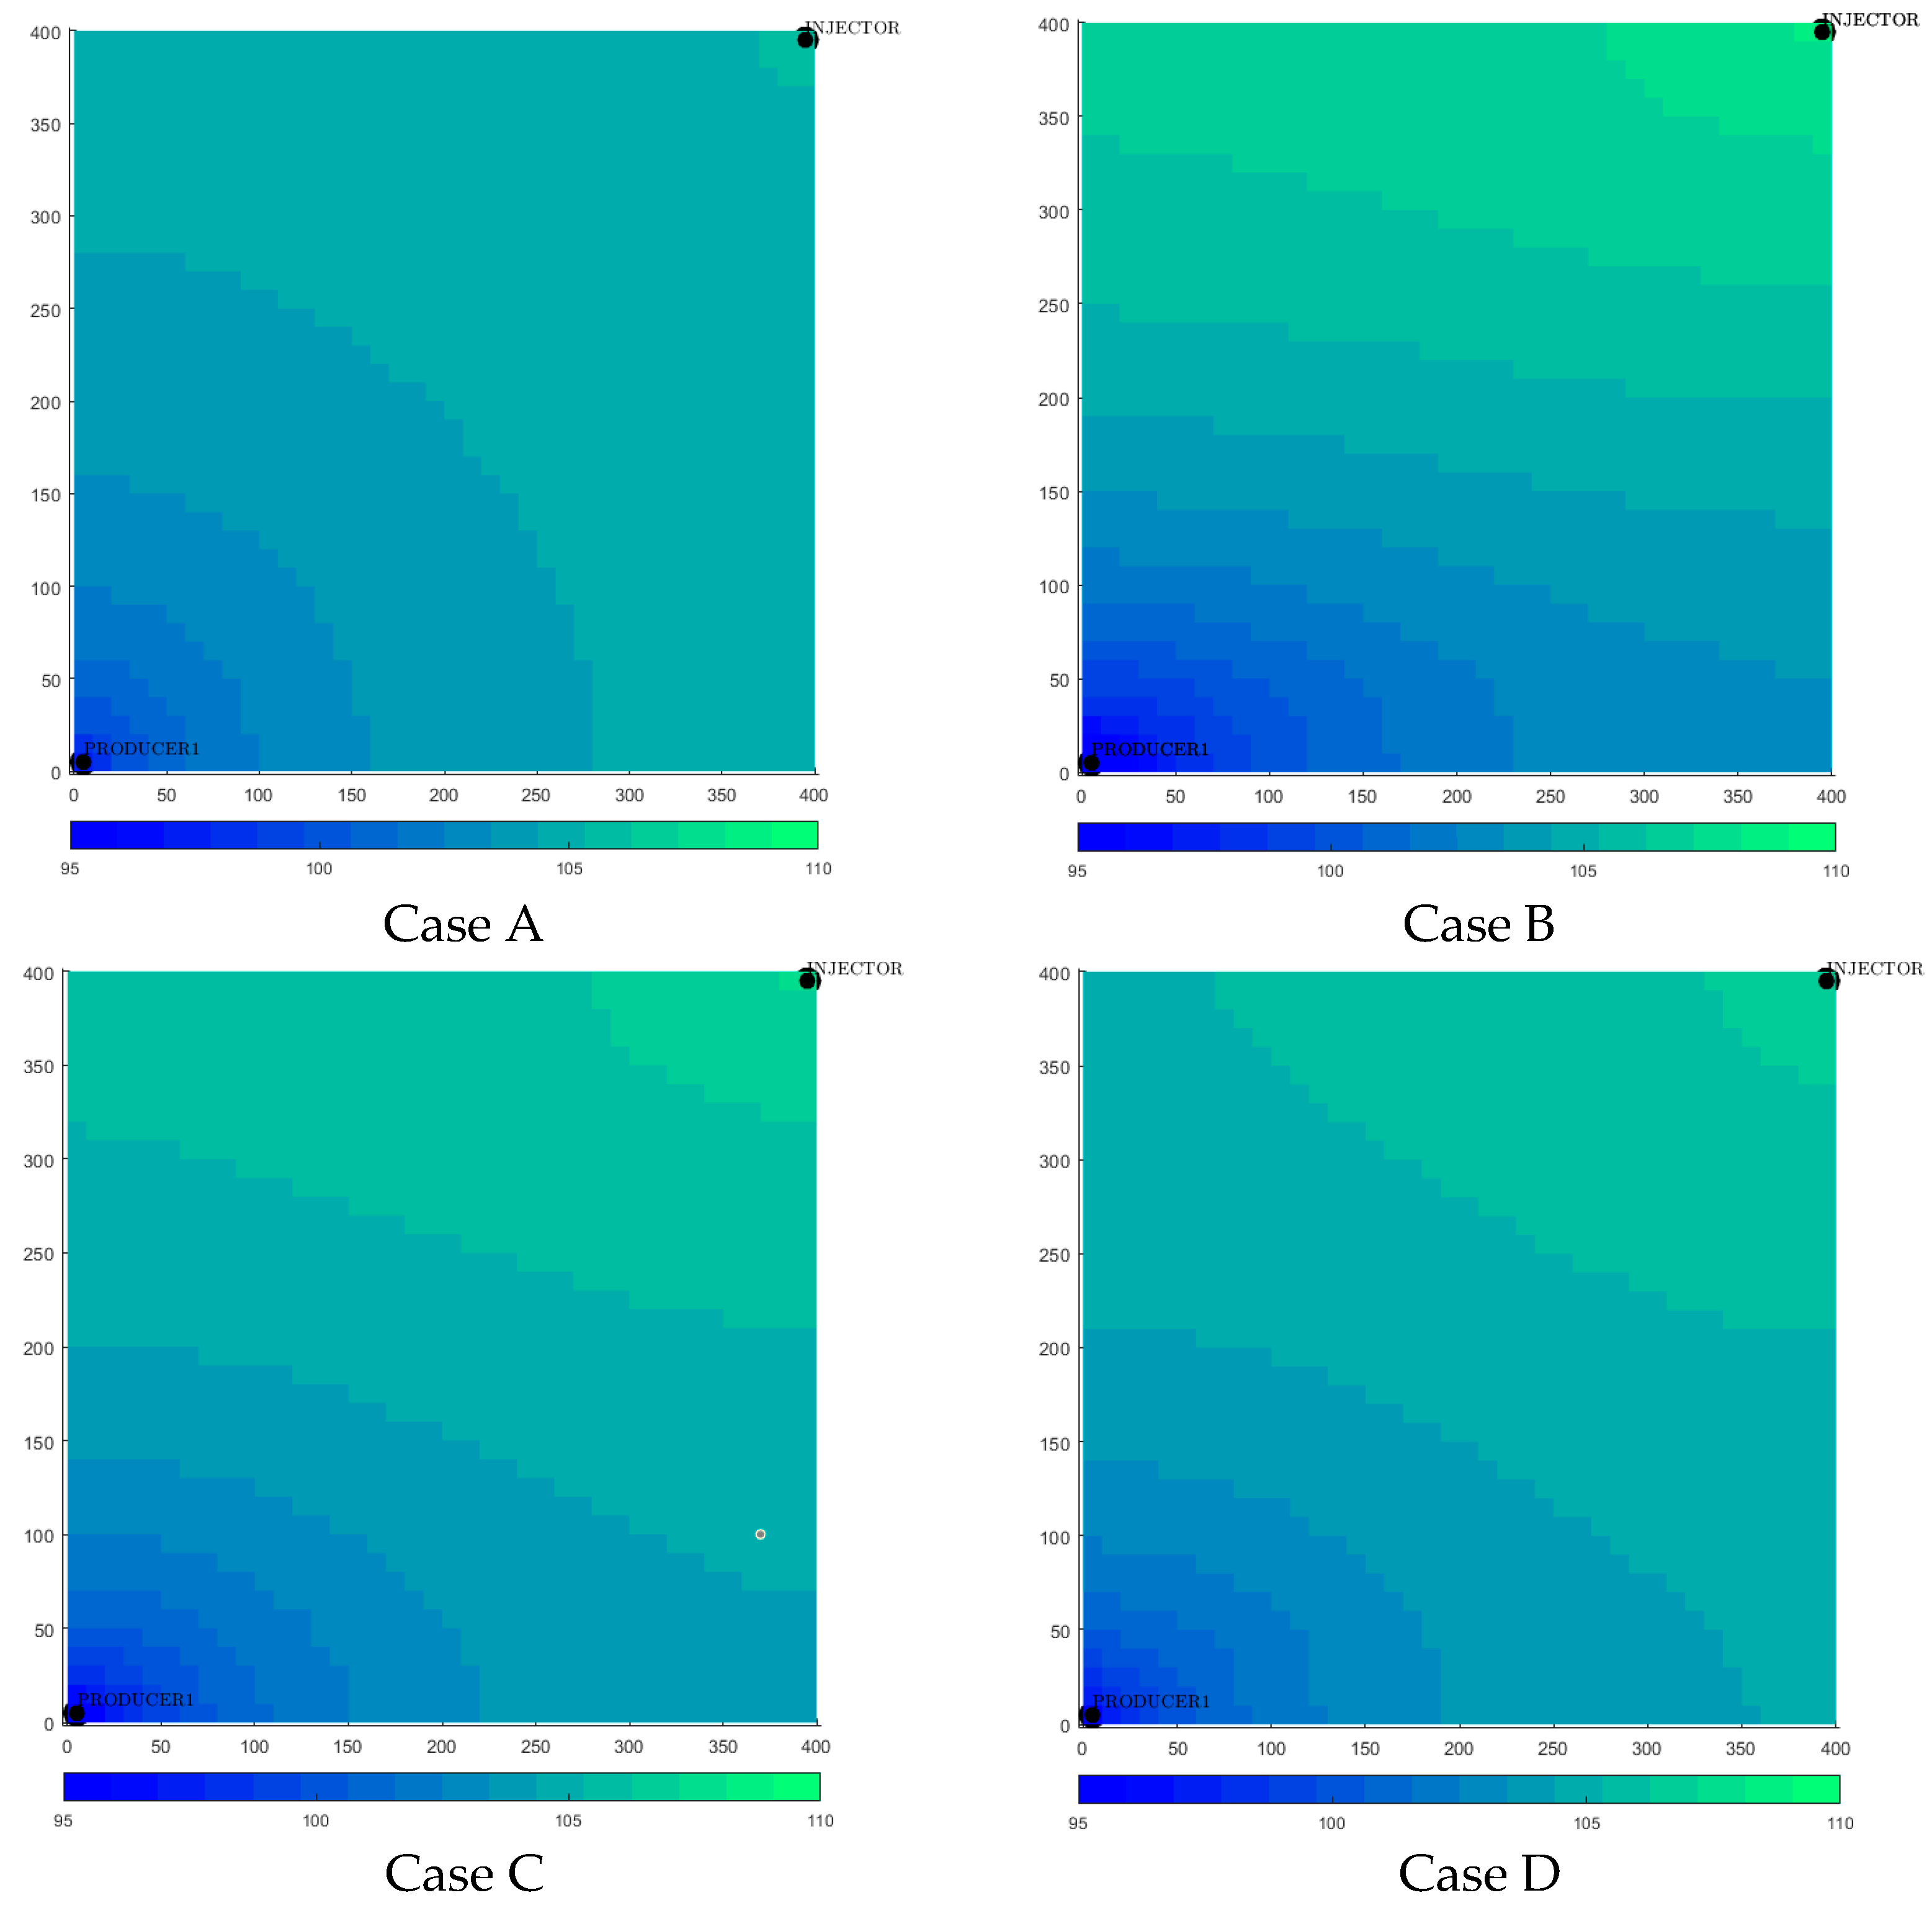
4.1. Effect of Anisotropic Relative Permeability on Pressure Distribution

In order to observe the effect of anisotropic relative permeability on pressure distribution, we made four cases, which are a homogeneous model with isotropic relative permeability (Case A), a homogeneous model with anisotropic relative permeability (Case B), a heterogeneous model with isotropic relative permeability (Case C), and a heterogeneous model with anisotropic relative permeability (Case D). The pressure distribution results in these four cases are different, and they are very much affected by the heterogeneity of the relative permeability curves, which is different from Gomez-Hernandez’s understanding. He proceeded with a derivation of the algorithm used to condition a realization of relative permeability to pressure and saturation data, and he observed that pressures are not very much affected by the heterogeneity of the relative permeability curves [36].
The results show that the pressure distribution uniformity between the injection well and the production well and the tangent of the pressure isoline along the diagonal is perpendicular to the diagonal line in Case A. In Case B, which considers the anisotropic relative permeability, the pressure propagation mode has changed, and the pressure distribution near the injection well and the production well has shifted in the x direction, and the relative permeability in the x direction is higher than that in the y direction. As far as this model is concerned, it seems that the pressure distribution in case A has been twisted counterclockwise. The pressure propagation of Case C is similar to that of Case B, but there is still a difference. The pressure propagation of Case D is also similar to that of Case B and Case C. However, the torsion of pressure distribution is more severe in Case D (Figure 4).
The effective permeability, that is, the product of absolute permeability and relative permeability, determines the flow capacity of one phase in two-phase flow. It is found that both anisotropic absolute permeability and anisotropic relative permeability have an important influence on pressure distribution, and they are not equivalent and cannot be replaced each other, especially since the relative permeability is affected by fluid saturation and at the same time the change of relative permeability is not uniform. Obviously, the pressure propagation shifts to the direction of high relative permeability after considering the anisotropic relative permeability.

4.2. Effect of Anisotropic Relative Permeability on Remaining Oil Saturation

In this section, we further study the effect of anisotropic relative permeability on the remaining oil saturation. It is indicated that the water flooding is uniform and the remaining oil is symmetrically distributed along the injection-production wells diagonal line in Case A. The remaining oil of Case A is mainly located near the two sides of the production well and is most enriched at both ends of the diagonal line perpendicular to the injection–production line. The water flooding process obviously shifts to the x direction in Case B, with less remaining oil in the x direction and more remaining oil in the y direction, which is consistent with the experimental results. The result of Case C is not similar to that of Case B. Though the permeability in the x direction is large, there is more remaining oil in the x direction. Case D is the superposition of Case B and Case C, and the process of water flooding obviously shifts in the x direction (Figure 5).
The area swept by injection water obviously shifts to the x direction in Case B because the relative permeability in the x direction is greater than that in the y direction. With regard to the phenomenon of Case C, we need to review the pressure distribution characteristics of Case C. Since the pressure at both the injection well and the production well propagates preferentially in the x direction, the injected water flows in the x direction first, and the production well also gives priority to producing oil in the x direction. Therefore, the process of water flooding does not seem to shift blindly to the x direction, but there is an equilibrium point on the injection–production line.
Before the equilibrium point, there is more remaining oil in the y direction, and after the equilibrium point, there is less remaining oil in the y direction. Here, we notice that case B and Case C have similar pressure propagation patterns, and the reason why there is such a big difference in remaining oil saturation is the relative permeability is affected by saturation. The relative permeability in the x direction is larger in Case B, the injected water is rapidly transferred near the production well, and the rapid increase in water saturation makes the flow capacity of water exceed that of oil. As a result, although the relative permeability in the x direction is larger, the movement ability of water in the y direction is higher than that of the oil in the x direction. Therefore, the remaining oil saturation of Case B occurs. However, the evolution of remaining oil saturation of Case C is different from that of Case B because it uses isotropic relative permeability and the absolute permeability is not affected by saturation. From the above analysis, it is not difficult to infer that the influence and mechanism of anisotropic relative permeability and absolute permeability on oil–water two-phase flow are different.

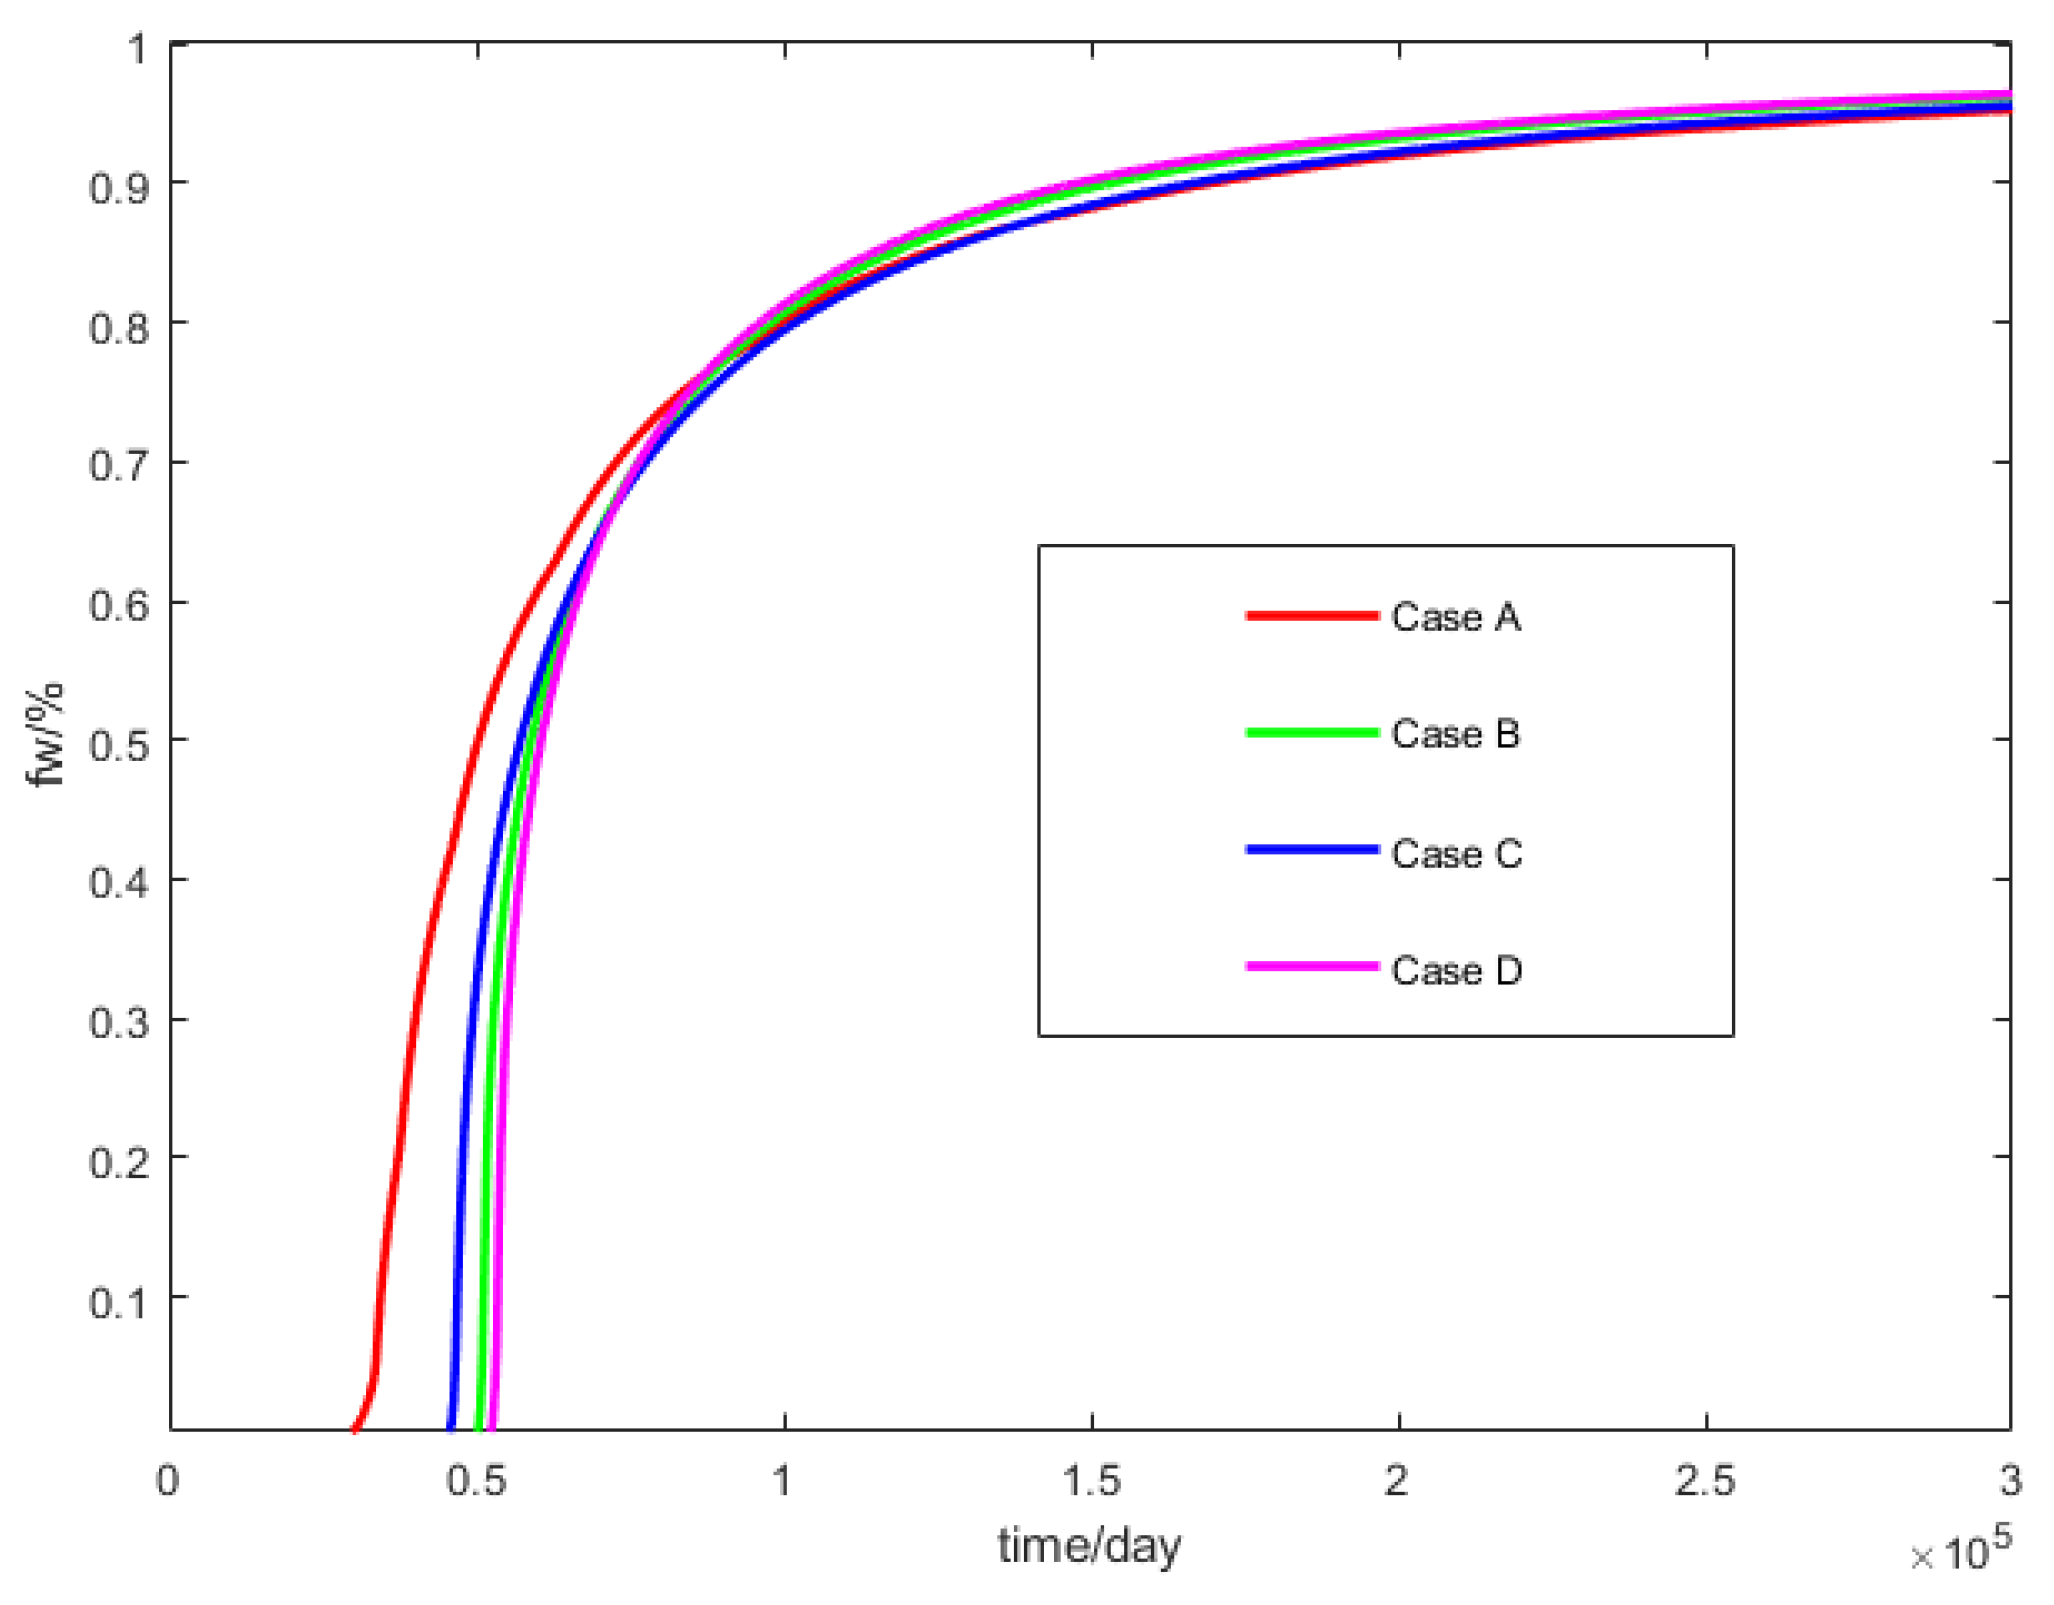
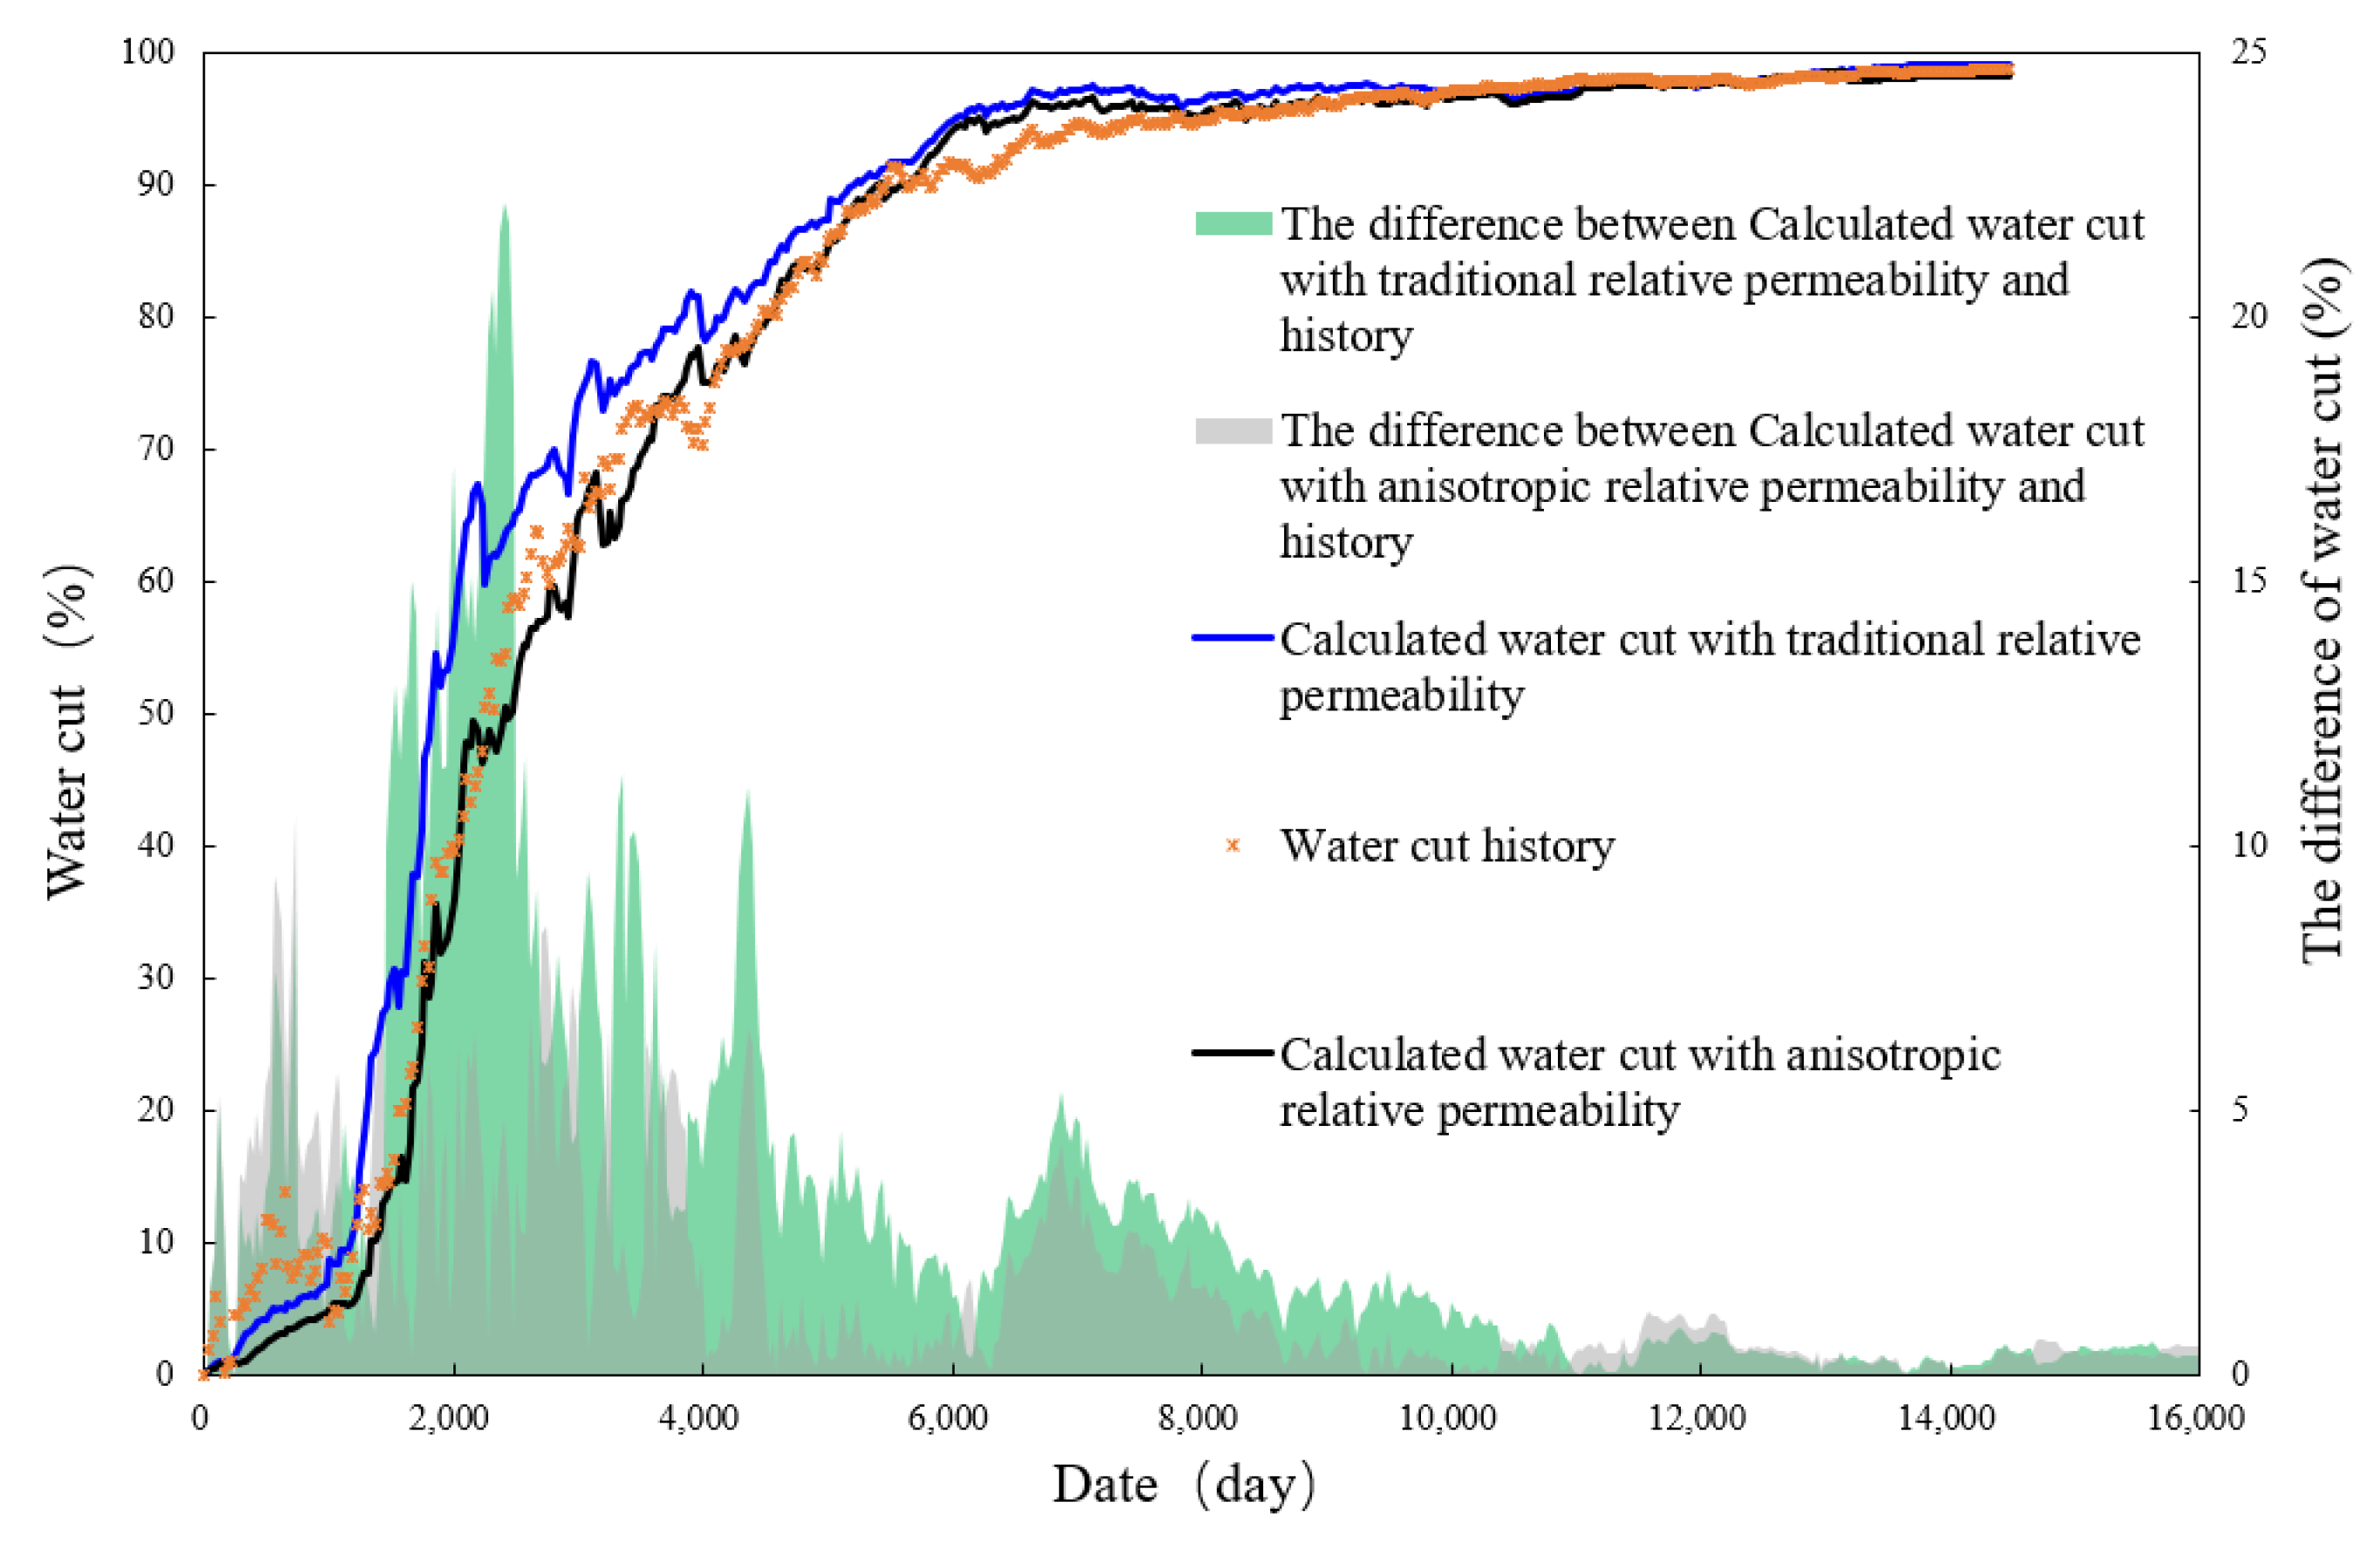
4.3. Effect of Anisotropic Relative Permeability on Water Cut

It is shown that Case A is the first to produce water, followed by Case C, Case B, and Case D, respectively. The reason for the difference can be made clear by comparing the corresponding remaining oil saturation. The flooding process of Case A is uniform, and it is the first to produce water. Most of the remaining oil distributes on both sides of the injection–production line near the production well. The sweep range of Case C is larger than that of Case A, so the time the model begins to produce water is later than in Case A. The flooding degree along the x direction in Case B is higher than Case C, as a result, Case B produces water later than Case C. Case D is affected by both anisotropic relative permeability and absolute permeability, and the degree of water flooding in x direction is the highest so it is the last to see water. However, although the time at which it sees the water is late, once there is a breakthrough, the later the breakthrough, the faster the water cut rises, and the higher the final water cut is (Figure 6).
It can be seen from the water cut curves that when the water cut exceed 0.75, the difference between the water cut curves of the four cases is very small, and there is little difference in saturation. However, when the water cut is less than 0.75, there are obvious differences in breakthrough time and the rising speed of water cut. Because of the homogeneity or heterogeneity of the model itself and the relative permeability isotropy or anisotropy, the movement direction and velocity of the displacement fronts of reservoir are sensitive from the beginning of displacement, as described in Section 4.2. Due to the simplicity of the model and well pattern, after breakthrough, the injected water continues to spread to the unused remaining oil area, and the remaining oil is gradually produced. When the water cut reaches a certain value, the difference in saturation and water cut of the four cases gradually decreases.

4.4. Sensitivity of the Measured Anisotropic Relative Permeability Data on the Simulation Model
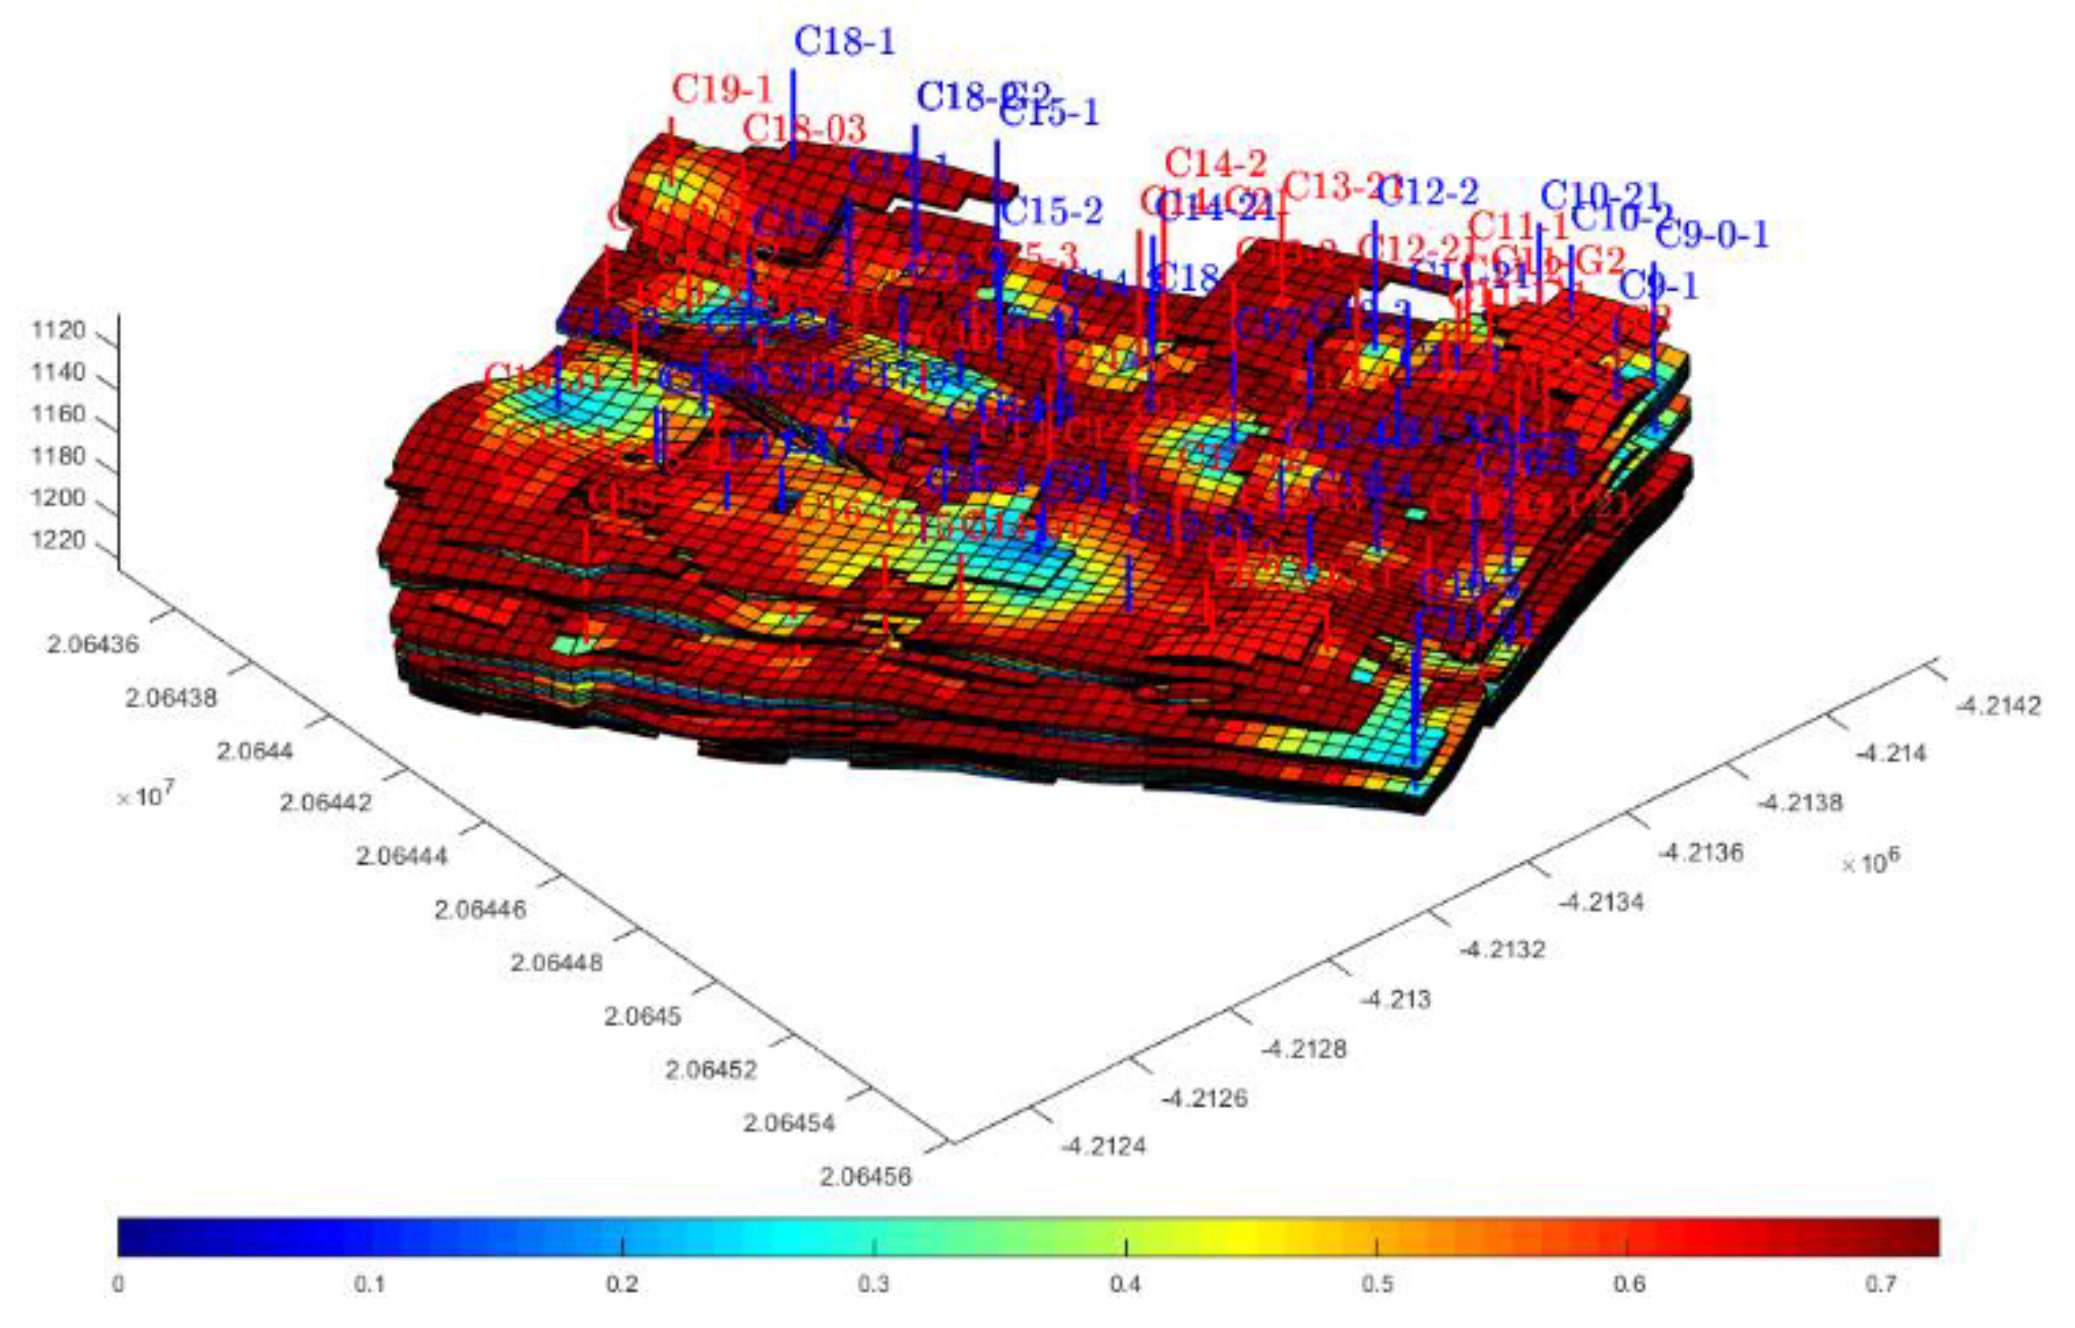
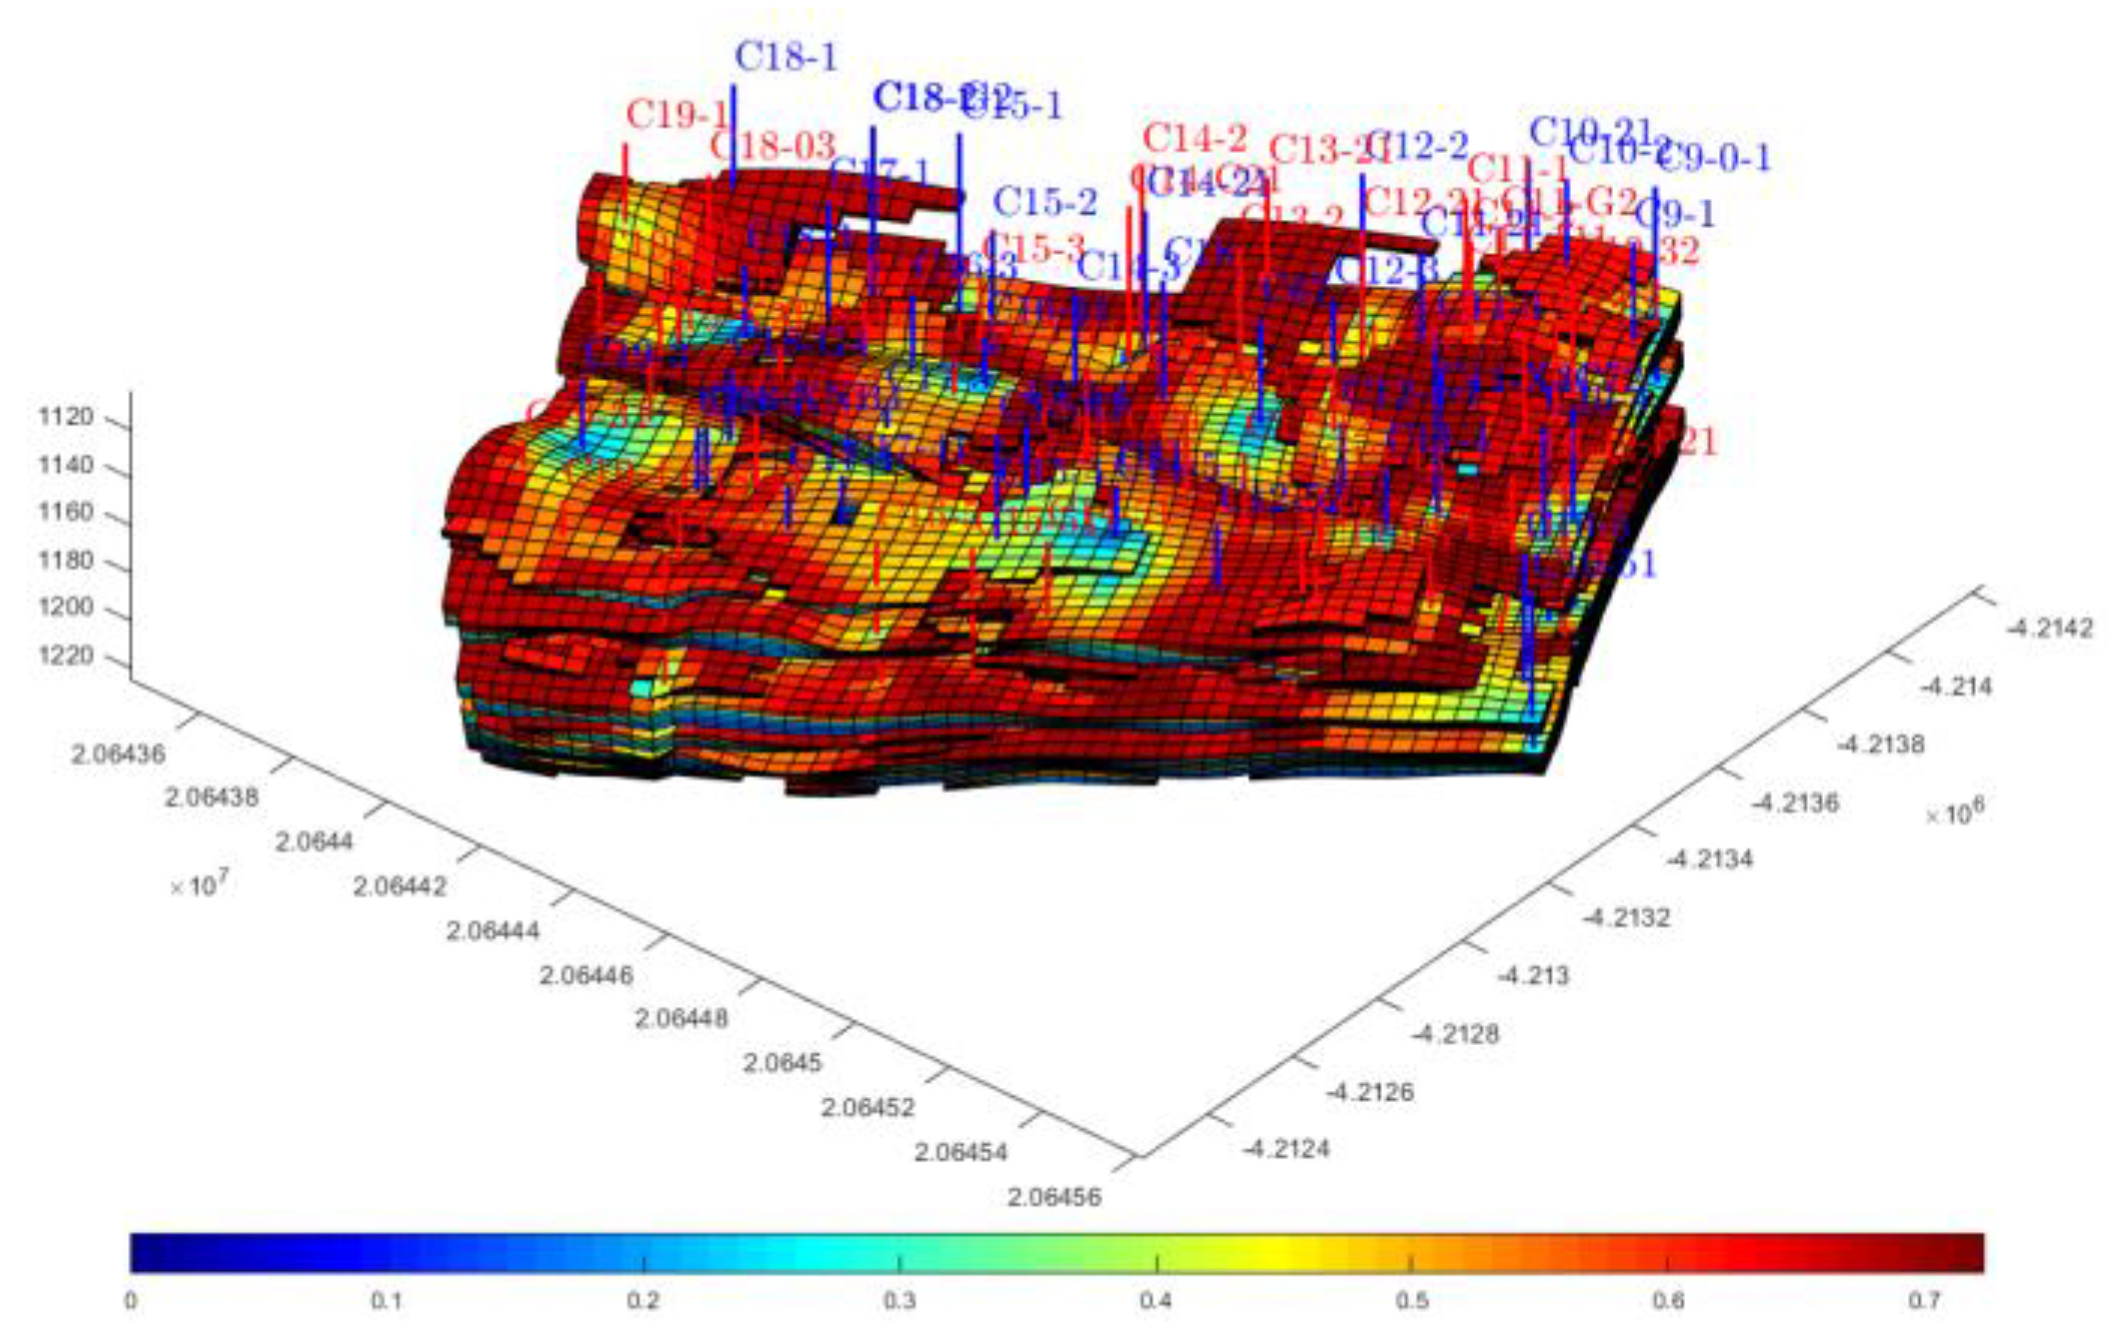
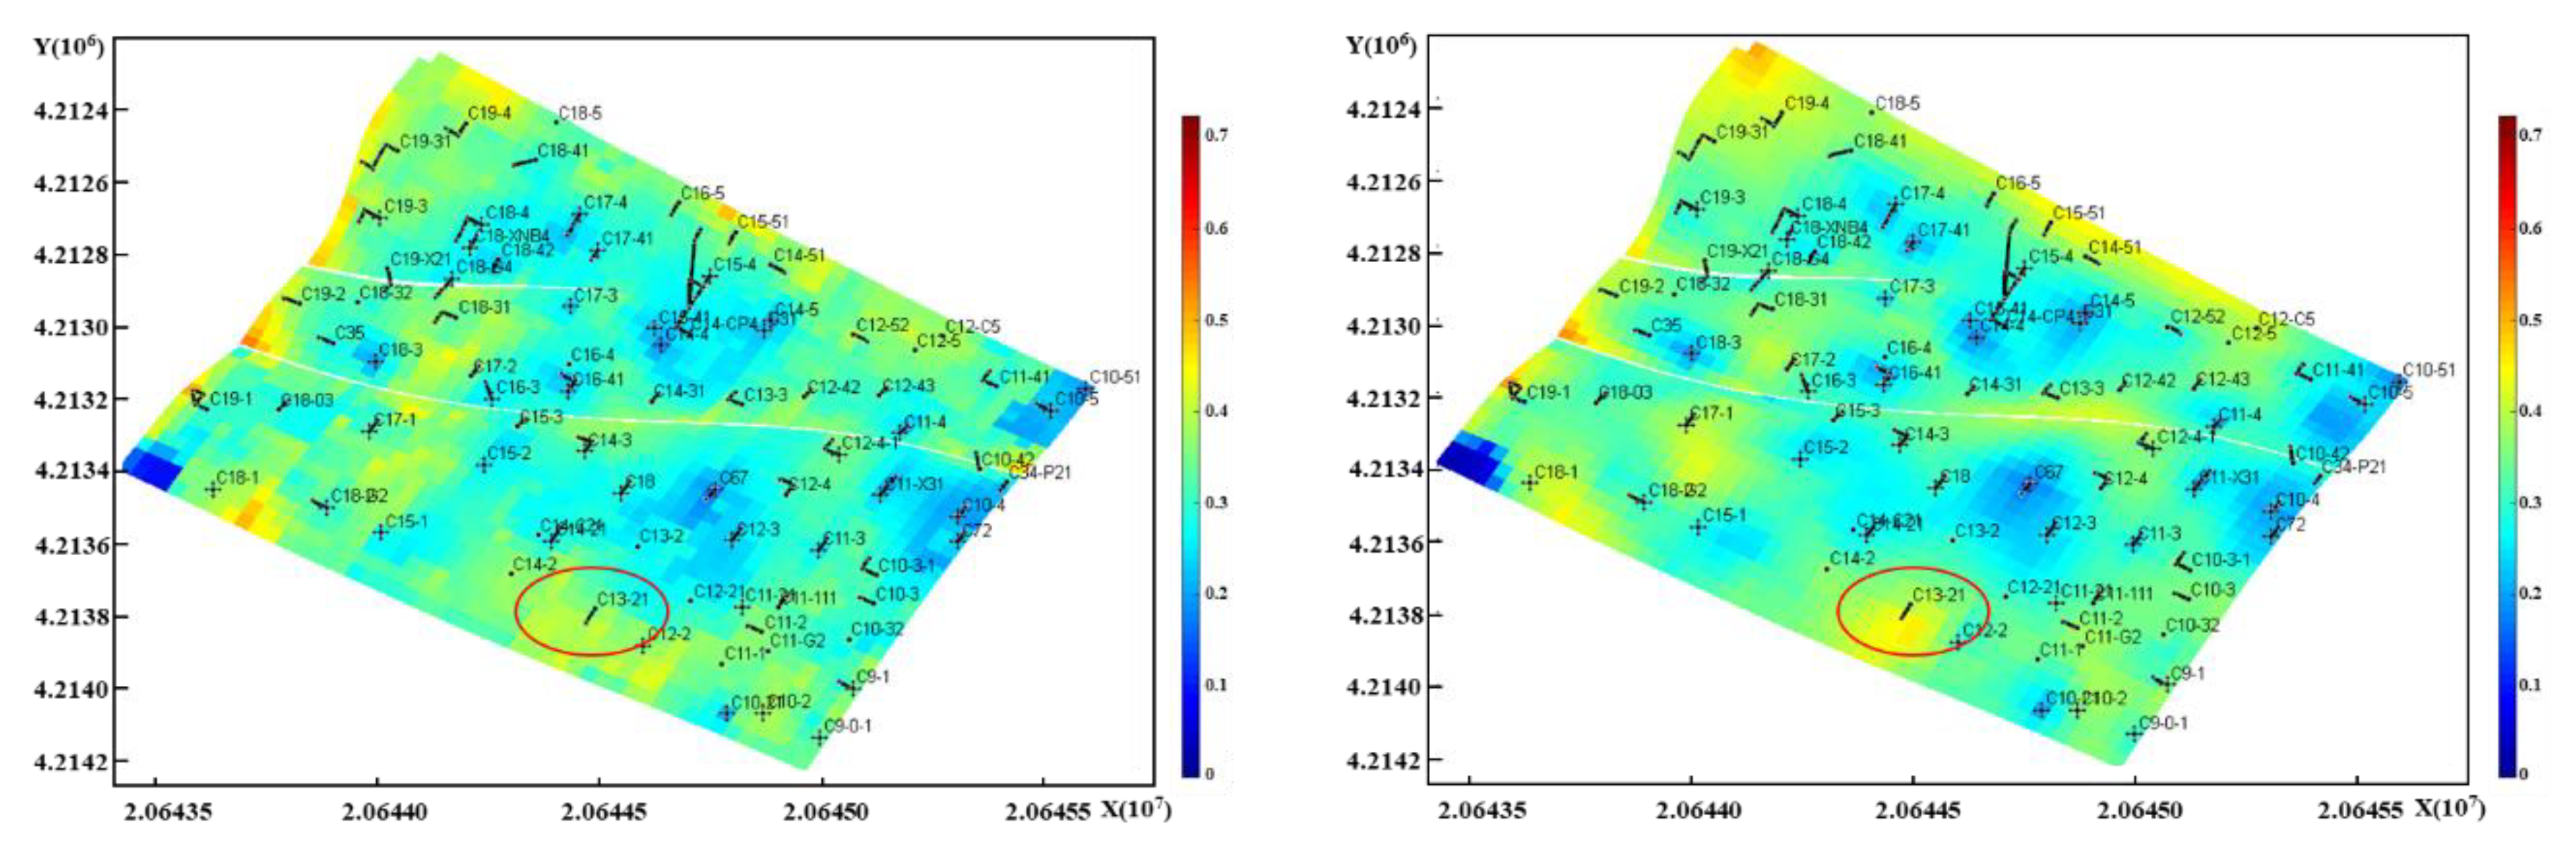
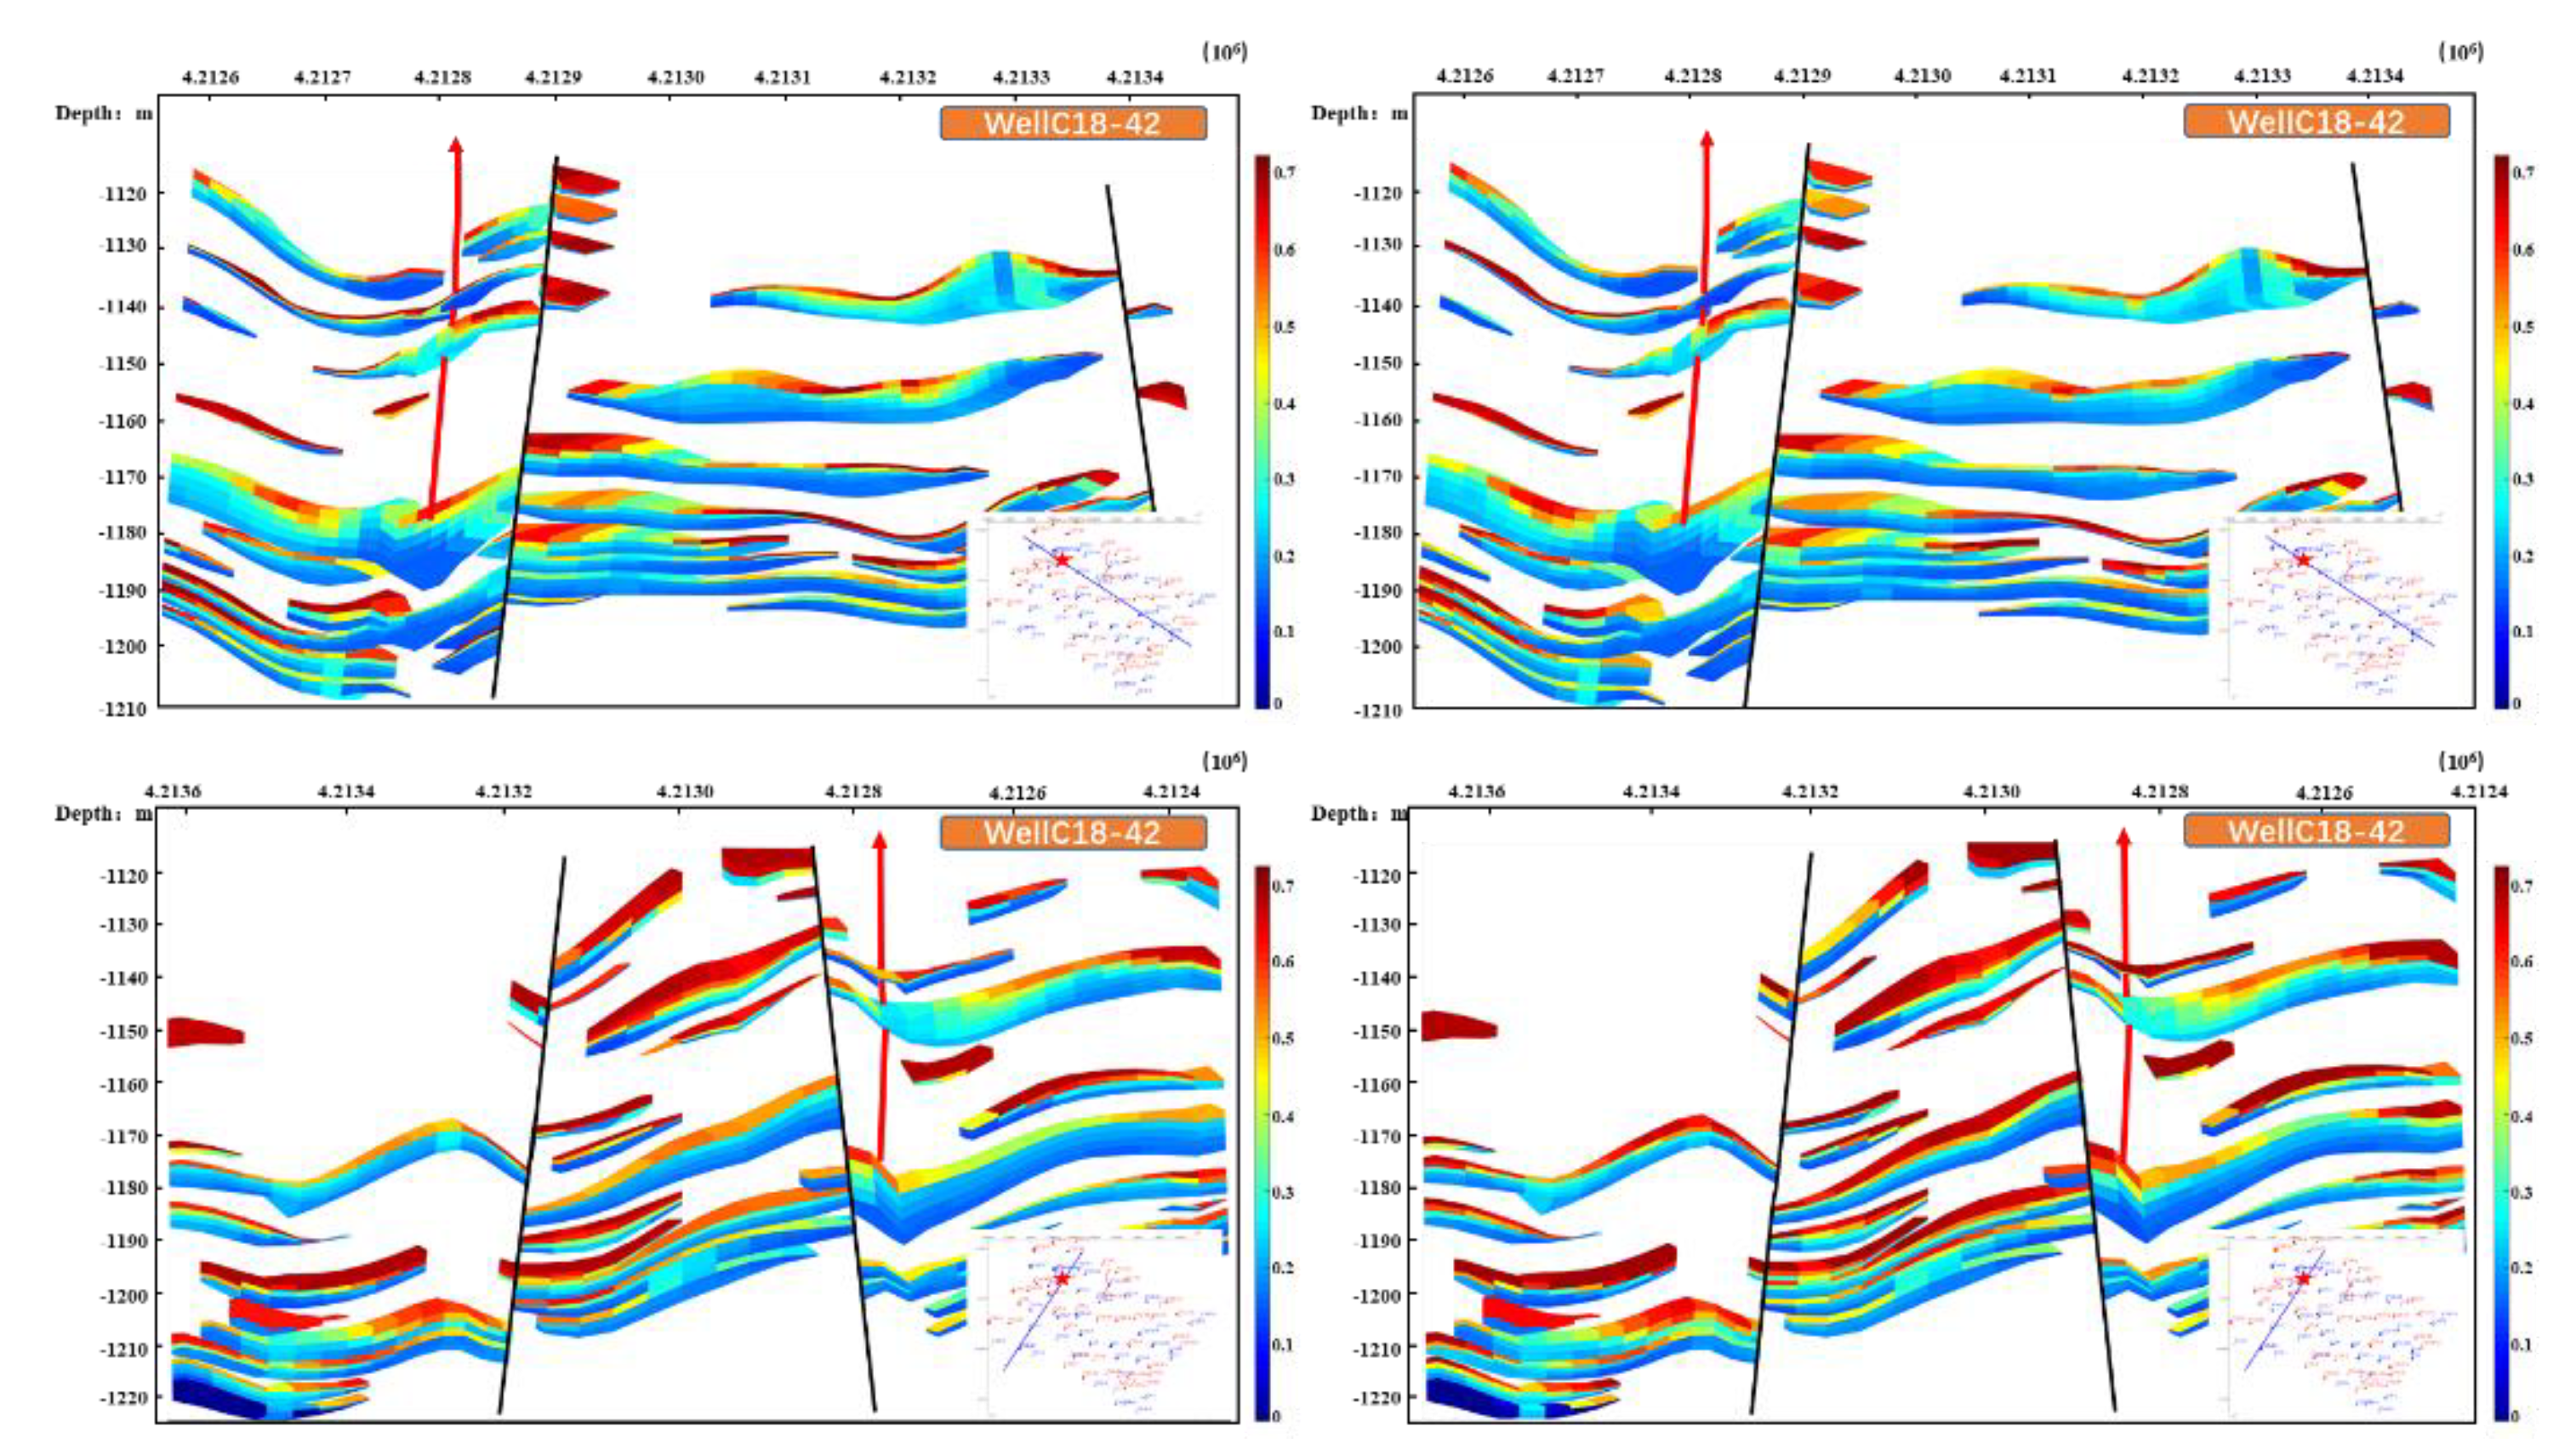
We tested the relative permeability in three directions, and we call the relative permeability curve in the x direction obtained by the experiment No. 1, the relative permeability curve in the y direction No. 2, and the relative permeability curve in the z direction No. 3. No. 1 and No. 2 relative permeability (the smallest difference), No. 1 and No. 3 relative permeability (the biggest difference), and No. 2 and No. 3 relative permeability (large difference) are applied in the homogeneous model x, y, and z direction, respectively (for the convenience of the description later, we named these three cases low difference, high difference, mid difference). Then, we studied the effect of the difference in anisotropic on the results of the numerical simulation.
The water cut of low difference shows the injected water breakthrough first (waterless oil recovery period is the shortest) with a breakthrough time of 6.3 × 10⁴ days, the water cut rises fastest, the final water cut is the highest, and the daily oil production drops the earliest. The breakthrough time of high difference is later than that of low difference, which is 6.9 × 10⁴ days. The final water cut of high difference case is the lowest. The breakthrough time of mid difference is the latest, which is 7.5 × 10⁴ days. After the breakthrough, the water cut rises rapidly, and at 8.8 × 10⁴ days, the water cut exceeds that of high difference, and the water cut is 68.24%. Accordingly, the daily oil production of high difference decreased earlier than that of mid difference, but the daily oil production of high difference exceeded both at 8.8 × 10⁴ days (Figure 7).
According to the characteristics of the relative permeability curve, the difference of the relative permeability curve between low difference x and y is the smallest, and the difference of residual oil saturation is only 5%. Therefore, the injected water advances uniformly in the x and y direction and breaks through fastest. The difference between the relative permeability curve of high difference x and y is the biggest, and the difference in residual oil saturation is 26%. The displacement efficiency of injected water in the y direction is higher, so the path of injected water to the production well shifts in the y direction, and the path becomes farther, so the breakthrough time is later than low difference. The relative permeability curves of mid difference x and y are quite different, and the difference of residual oil saturation is 21%, but the displacement efficiency in both directions is high, so the injected water breakthrough is the latest. It is precisely because of the high displacement efficiency of mid difference in both directions, once the injected water breaks through, the remaining oil is the least, and the water cut increases rapidly. After the injected water of high difference breakthrough, there is more remaining oil in the x direction, with the continuous increase in injected pv, this part of the remaining oil is gradually drained, resulting in a smaller increase in water cut than the other two cases.

4.5. Actual Model

In this section, we further verify the accuracy of the application of anisotropic relative permeability by comparing the actual production data of the C4N well area in Shengli Oilfield. This well area is a typical fluvial facies sedimentary environment, which belongs to a medium–high permeability reservoir.
In order to apply the anisotropic relative permeability to the actual model more accurately, we carried out a paleomagnetic orientation on the experimental samples (Figure 8). We separated the stable magnetization direction through the high precision magnetometer system in the laboratory and determined the geographic north pole direction of the core. In the paleomagnetic test, the x direction is used as the marking direction. The paleogeographic magnetic declination angle and magnetic inclination angle of the Y direction of the sample are 63.1° and −0.9°, respectively. Two precision parameters K and T95 (the higher the K value, the higher the precision, the smaller the T95, the more reliable the result) are usually used to measure the reliability spectrum degree of the Fisher distribution or the average observation direction of the pole [37,38,39,40]. The K value of this paleomagnetic test is 18.7 and T95 is 9.4, which has high reliability (Table 2).
After that, we established a three-dimensional geological model according to the characteristics of the C4N well area, and the grid system was generated with the north by west 63.1 degrees as the X axis. The C4N well area is in the middle and high water cut stage, when deploying infill wells, and the remaining oil drilling potential will refer to the calculation results of reservoir numerical simulation. We often encounter the deployment of wells in places with high remaining oil saturation, and the drilling and production effect is not necessarily good. In fact, this is due to the inaccurate characterization of remaining oil distribution.
Figure 9 and Figure 10 show the current distribution of remaining oil saturation calculated by traditional relative permeability and anisotropic relative permeability in the Cheng 4 South well area, respectively, as of 1 November 2019. There is a significant difference in remaining oil saturation between the two numerical simulation results. The numerical simulation results considering anisotropic relative permeability show that the sweep range of water is larger and the displacement efficiency in the Y direction (perpendicular to the river flow direction) is higher. There is also a great difference in the average remaining oil saturation obtained by the two algorithms. For example, the average remaining oil saturation of well C13-21 obtained by the numerical simulation algorithm considering anisotropic relative permeability is significantly higher than that of the traditional algorithm. This also explains why well C13-21 has a longer stable production period than other production wells, and the current water cut can still be maintained at 53.7% (Figure 11).
Here, we count the first production of producers since 2017. The statistical results are shown in Table 3. Column 5 in Table 3 shows the average production for the first three months. Column 4 in Table 2 shows the average water cut for the first three months. By comparing the results, it can be seen that the numerical simulation algorithm considering anisotropic relative permeability is close to reality. Particularly in the C14-31 and C18-42 wells, when the water cut of these two wells exceeded 98%, though measures of partition were taken, the production effect was still poor and the water cut remained high. The reason is that the traditional numerical simulation results show that there is still some remaining oil in these two wells, but the numerical simulation results considering anisotropic relative permeability show that the contribution of remaining oil considered by the former is actually very small and has been swept in the process of water flooding (Figure 12 and Figure 13).
The coincidence rate between the remaining oil saturation calculated by the traditional relative permeability and the initial production of the oil well is 62.5%, and the coincidence rate between the remaining oil saturation calculated by the anisotropic relative permeability and the initial production of the oil well is 87.5%, which is 25% higher (Table 3). Obviously, the remaining oil saturation calculated by anisotropic relative permeability shows better agreement with the actual situation and can describe the oil–water movement law more accurately.
We compared the change in water cut in the Cheng 4 South well area during the production process. Compared with the water cut calculated by the traditional numerical simulation method, the historical water cut shows a better agreement with that obtained by the numerical simulation algorithm considering anisotropic relative permeability (Figure 14).

5. Conclusions

In this paper, the anisotropic relative permeability of typical fluvial sandstone is studied using a self-developed anisotropic cubic core holder by unsteady-states relative permeability experiments. A new numerical simulator considering anisotropic relative permeability is established. The effect of anisotropic relative permeability in the flooding process is analyzed by the new simulator. An actual fluvial facies reservoir of Shengli Oilfield in China is selected as an example to validate the new simulator.
(1)
In a heterogeneous rock with millimeter to centimeter scale laminae, relative permeability has directional characteristics. The greater the angle between the displacement direction and the bedding strike, the lower the residual oil saturation is, the higher the displacement efficiency is, and the relative permeability curve tends towards a rightward shift.
(2)
Under the condition of anisotropic relative permeability, the pressure propagates more easily in the direction of higher relative permeability, and the fluid saturation changes more in the corresponding direction. The water free oil production period is longer than the calculation results of traditional numerical simulation.
(3)
The new simulator shows excellent agreement with the actual oil field data. The coincidence rate between the remaining oil saturation calculated by the new simulator and the initial production of the oil well is 87.5%, which is 25% higher than that of a traditional simulator.
(4)
Our work should provide important insights into the importance of anisotropic relative permeability and the application of numerical simulations in actual oil field production predictions.

Author Contributions

Writing—original draft, C.L.; Writing—review & editing, S.W. and Q.Y. Data curation, C.Y. All authors have read and agreed to the published version of the manuscript.

Funding

This research received no external funding.

Acknowledgments

I would like to thank Shuoliang Wang, Chunlei Yu and Qing You for their guidance in the process of writing and revising of this paper.

Conflicts of Interest

The authors declare no conflict of interest.

Nomenclature

μwwater vicosity
vwinjection velocity
ρooil density
ρwwater density
fwwater cut
λwwater mobility
λooil mobility
Across-sectional area
qttotal volume flow of oil phase and water phase
krooil relative permeability
krwwater relative permeability
γooil unit weight
γwwater unit weight
Kabsolute permeability tensor
μooil viscosity
Pooil phase pressure
Pwwater phase pressure
Ddepth
φporosity
Δxix-direction grid length
Δyiy-direction grid length
Δziz-direction grid length
Sooil phase saturation
Swwater phase saturation
Vijkvolume of the bulk
Krlanisotropicanisotropic relative permeability tensor

Appendix A. The Oil Governing Equations

Oil phase:
[ k k r o a n i s o t r o p i c ρ o μ o ( p o γ o D ) ] q o =   t ( ρ o ϕ S o )
Water phase:
[ k k r w a n i s o t r o p i c ρ w μ w ( p w γ w D ) ] q w =   t ( ρ w ϕ S w )
where: γ o = ρ o g ; γ w = ρ w g , K r o a n i s o t r o p i c is the oil phase relative permeability, K is the absolute permeability tensor, μ o , p o , and γ o are the viscosity, pressure, and specific gravity of the oil phase, respectively, K r w a n i s o t r o p i c is the water phase relative permeability, μ w , p w , and γ w are the viscosity, pressure, and specific gravity of the water phase, respectively, D is the depth, and ϕ is the porosity.
The results of the experiments in this paper showed that the relative permeability of oil and water is affected by the anisotropy of pore structure. In this paper, the krlanisotropic in the above formula is written into three relative permeability expressions that vary with different directions when dealing with the anisotropic relative permeability, namely krox, kroy, and kroz. After the replacement here, the traditional isotropic relative permeability is replaced by the anisotropic relative permeability.
Taking the oil phase as an example, the governing equation is expanded initially into a rectangular coordinate component as follows.
x [ ρ o k μ o k r ox ( p o x γ o D x ) ] + y [ ρ o k μ o k r oy ( p o y γ o D y ) ] + z [ ρ o k μ o k r oz ( p o z γ o D z ) ] + q o = ( ϕ ρ o S o ) t
For (i,j,k,n + 1) point, the subscript in the following expression is in an abbreviated form:
ρ o k k r ox Δ x i μ o [ ( p i + 1 n + 1 p i n + 1 Δ x i + 1 2 γ o i + 1 2 D i + 1 D i Δ x i + 1 2 ) + ( p i 1 n + 1 p i n + 1 Δ x i 1 2 γ o i 1 2 D i 1 D i Δ x i 1 2 ) ] + ρ o k k r oy Δ y j μ o [ ( p j + 1 n + 1 p j n + 1 Δ y j + 1 2 γ o j + 1 2 D j + 1 D j Δ y j + 1 2 ) + ( p j 1 n + 1 p j n + 1 Δ x j 1 2 γ o j 1 2 D j 1 D j Δ x j 1 2 ) ] + ρ o k k r oz Δ z k μ o [ ( p k + 1 n + 1 p k n + 1 Δ z k + 1 2 γ o k + 1 2 D k + 1 D k Δ z k + 1 2 ) + ( p k 1 n + 1 p k n + 1 Δ z k 1 2 γ o k 1 2 D k 1 D k Δ z k 1 2 ) ] + q o n + 1 = 1 Δ t [ ( ϕ ρ o S o ) n + 1 ( ϕ ρ o S o ) n ]
Multiply both sides by V i j k = Δ x i Δ y j Δ z k and define the following conductivity:
{ T X o i a n i s o t r o p i c + 1 2 = V i j k Δ x i ρ o k μ o k r ox Δ x i + 1 2 = Δ y j Δ z k Δ x i + 1 2 ρ o k μ o k r ox , T X o i a n i s o t r o p i c 1 2 = V i j k Δ x i ρ o k μ o k r ox Δ x i 1 2 = Δ y j Δ z k Δ x i 1 2 ρ o k μ o k r ox T Y o j a n i s o t r o p i c + 1 2 = V i j k Δ y j ρ o k μ o k r oy Δ y j + 1 2 = Δ x i Δ z k Δ y j + 1 2 ρ o k μ o k r oy , T Y o j a n i s o t r o p i c 1 2 = V i j k Δ y j ρ o k μ o k r oy Δ y j 1 2 = Δ x i Δ z k Δ y j 1 2 ρ o k μ o k r oy T Z o k a n i s o t r o p i c + 1 2 = V i j k Δ z k ρ o k μ o k r oz Δ z k + 1 2 = Δ x i Δ y j Δ z k + 1 2 ρ o k μ o k r oz , T Z o k a n i s o t r o p i c 1 2 = V i j k Δ z k ρ o k μ o k r oz Δ z i 1 2 = Δ x i Δ y j Δ z i 1 2 ρ o k μ o k r oz
The second-order difference operator is defined as follows:
{ Δ x T X o a n i s o t r o p i c Δ x P = T X o i a n i s o t r o p i c + 1 2 ( p i + 1 p i ) + T X o i a n i s o t r o p i c 1 2 ( p i 1 p i ) Δ y T Y o a n i s o t r o p i c Δ y P = T Y o j a n i s o t r o p i c + 1 2 ( p j + 1 p j ) + T Y o j a n i s o t r o p i c 1 2 ( p j 1 p j ) Δ z T Z o a n i s o t r o p i c Δ z P = T Z o k a n i s o t r o p i c + 1 2 ( p k + 1 p k ) + T Z o k a n i s o t r o p i c 1 2 ( p k 1 p k )
The oil phase governing equation is discretized as a sample in this section, which is shown as follows:
Δ x T X o a n i s o t r o p i c Δ x P n + 1 + Δ y T Y o a n i s o t r o p i c Δ y P n + 1 + Δ z T Z o a n i s o t r o p i c Δ z P n + 1 Δ x T X o a n i s o t r o p i c γ o g Δ x D Δ y T Y o a n i s o t r o p i c γ o g Δ y D Δ z T Z o a n i s o t r o p i c γ o g Δ z D + q o n + 1 V i j k = V i j k Δ t [ ( ϕ ρ o S o ) n + 1 ( ϕ ρ o S o ) n ]
Then, the formula above can be further simplified as follows:
Δ T o a n i s o t r o p i c Δ P n + 1 Δ T o a n i s o t r o p i c Δ D + q o n + 1 V i j k = V i j k Δ t [ ( ϕ ρ o S o ) n + 1 ( ϕ ρ o S o ) n ]
The governing equation of the water phase is expressed with the same format. So far, the anisotropic relative permeability is introduced into the traditional numerical simulation method by dealing with the relative permeability in the traditional oil and water phase governing equation.

References

  1. Honarpour, M.M. Relative Permeability of Petroleum Reservoirs; The Chemical Rubber Company Press: Boca Raton, FL, USA, 1986. [Google Scholar]
  2. Ramstad, T.; Idowu, N.; Nardi, C.; Øren, P.-E. Relative permeability calculations from two-phase flow simulations directly on digital images of porous rocks. Transp. Porous Media 2012, 94, 487–504. [Google Scholar] [CrossRef]
  3. Deng, Q. Microscale Occurence and Recovery Mechanism of Remaining Oil in Sazhong Area at Extra-High Water Stage of Daqing Field. Ph.D. Thesis, Northeast Petroleum University, Daqing, China, 2015. [Google Scholar]
  4. Wang, S.; Yu, C.; Sang, G.; Zhao, Q. A new numerical simulator considering the effect of enhanced liquid on relative permeability. J. Pet. Sci. Eng. 2019, 177, 282–294. [Google Scholar] [CrossRef]
  5. Fang, Y.; Yang, E.; Yin, D.; Gan, Y. Study on distribution characteristics of microscopic residual oil in low permeability reservoirs. J. Dispers. Sci. Technol. 2019, 41, 575–584. [Google Scholar] [CrossRef]
  6. Hsieh, A.I.; Allen, D.M.; MacEachern, J.A. Upscaling permeability for reservoir-scale modeling in bioturbated, heterogeneous tight siliciclastic reservoirs: Lower Cretaceous Viking Formation, Provost Field, AL, Canada. Mar. Pet. Geol. 2017, 88, 1032–1046. [Google Scholar] [CrossRef]
  7. Peng, J.; Zhang, J.; Shen, Z.; Ye, J. Effect of grain shape on pore characteristics and permeabilities of coarse-grained soil. Rock Soil Mech. 2017, 41, 592–600. [Google Scholar]
  8. Sun, D.; Li, A.; Wang, H.; Zhao, W.; Qiao, E.; Long, C. Experiment on anisotropy of permeability with tight sandstone. Prog. Geophys. 2012, 27, 1101–1106. [Google Scholar]
  9. Zhang, Q.; Sun, W.; Ming, H.; Wang, Q.; Zhang, L. Micro-pore Structure of Diagenetic Facies of Chang 63 Reservoir and Distribution of High Quality Reservoir in Banqiao-Heshui Area. Acta Sedimentol. Sin. 2016, 34, 336–345. [Google Scholar]
  10. Su, Y.; Li, T. Effects studies of areal heterogeneity on oil-water displacement law in extra-low permeability reservoirs. Pet. Geol. Recov. Effic. 2009, 16, 69–71. [Google Scholar]
  11. Gao, H.; Jiang, H.; Chen, M. Simulation study on the effect of the microscopic parameters of reservoir pore structure on oi-l water relative permeability. J. Xi’an Shiyou Univ. 2007, 22, 56–59. [Google Scholar]
  12. Hunt, A.; Ewing, R.; Ghanbarian, B. Percolation Theory for Flow in Porous Media; Springer: Berlin/Heidelberg, Germany, 2014. [Google Scholar]
  13. Farquharson, J.I.; Wadsworth, F.B. Upscaling permeability in anisotropic volcanic systems. J. Volcanol. Geotherm. Res. 2018, 364, 35–47. [Google Scholar] [CrossRef] [Green Version]
  14. Sun, F. Analysis of permeability orientation in reservoir. Fault Block Oil Gas Field 2007, 14, 38–39. [Google Scholar]
  15. Nordlund, M.; Penha, D.J.L.; Stolz, S.; Kuczaj, A.; Winkelmann, C.; Geurts, B.J. A new analytical model for the permeability of anisotropic structured porous media. Int. J. Eng. Sci. 2013, 68, 38–60. [Google Scholar] [CrossRef]
  16. Li, T.; Li, M.; Jing, X.; Xiao, W.; Cui, Q. Influence mechanism of pore-scale anisotropy and pore distribution heterogeneity on permeability of porous media. Pet. Explor. Dev. 2019, 46, 569–579. [Google Scholar] [CrossRef]
  17. Corey, A.T.; Rathjens, C. Effect of stratification on relative permeability. J. Pet. Technol. 1956, 8, 69–71. [Google Scholar] [CrossRef] [Green Version]
  18. Honarpour, M.; Cullick, A.; Saad, N.; Humphreys, N. Effect of rock heterogeneity on relative permeability: Implications for scale-up. J. Pet. Technol. 1956, 47, 980–986. [Google Scholar] [CrossRef]
  19. Crotti, M.; Rosbaco, J. Relative Permeability Curves: The Influence of Flow Direction and Heterogeneities. In Proceedings of the SPE/DOE Improved Oil Recovery Symposium, Tulsa, OK, USA, 19–22 April 1998. [Google Scholar]
  20. Crotti, M.; Cobeñas, R. Scaling Up of Laboratory Relative Permeability Curves. An Advantageous Approach Based on Realistic Average Water Saturations. In Proceedings of the SPE Latin American and Caribbean Petroleum Engineering Conference, Buenos Aires, Argentina, 25–28 March 2001. [Google Scholar]
  21. Keilegavlen, E.; Nordbotten, J.M.; Stephansen, A. Simulating two-phase flow in porous media with anisotropic relative permeabilities. In Proceedings of the SPE Reservoir Simulation Symposium, The Woodlands, TX, USA, 21–23 February 2011. [Google Scholar]
  22. Krause, M. Modeling and investigation of the influence of capillary heterogeneity on relative permeability. In Proceedings of the SPE Annual Technical Conference and Exhibition, San Antonio, TX, USA, 8–10 October 2012. [Google Scholar]
  23. Krause, M.; Krevor, S.; Benson, S.M. A procedure for the accurate determination of sub-core scale permeability distributions with error quantification. Transp. Porous Media 2013, 98, 565–588. [Google Scholar] [CrossRef]
  24. Zheng, W.; Liu, Y.; Liu, Y.; Wang, Y.; Ma, J. Anisotropic experiment of microfracture relative permeability. Fault-Block OilGas Field 2019, 26, 21. [Google Scholar]
  25. Ezeuko, C.C.; McDougall, S.R.; Bondino, I.; Hamon, G. Anisotropic Relative Permeabilities for Characterising Heavy-Oil Depletion Experiment. In Proceedings of the SPE Symposium on Improved Oil Recovery, Tulsa, OK, USA, 20–23 April 2008. [Google Scholar]
  26. Kortekaas, T.F. Water/oil displacement characteristics in crossbedded reservoir zones. Soc. Pet. Eng. J. 1985, 25, 917–926. [Google Scholar] [CrossRef]
  27. Paterson, L.; Painter, S.; Zhang, X.; Pinczewski, V. Simulating residual saturation and relative permeability in heterogeneous formations. In Proceedings of the SPE Annual Technical Conference and Exhibition, Denver, CO, USA, 6–9 October 1996. [Google Scholar]
  28. Bondino, I.; McDougall, S.R.; Hamon, G. Interpretation of a long core heavy oil depletion experiment using pore network modelling techniques. In Proceedings of the International Symposium of the Society of Core Analysts, Pau, France, 21–24 September 2003. [Google Scholar]
  29. Pergament, A.K.; Tomin, P.Y. The study of relative phase-permeability functions for anisotropic media. Math. Models Comput. Simul. 2012, 4, 1–9. [Google Scholar] [CrossRef]
  30. Sedaghat, M.H.; Gerke, K.; Azizmohammadi, S.; Matthai, S.K. Simulation-based determination of relative permeability in laminated rocks. Energy Procedia 2016, 97, 433–439. [Google Scholar] [CrossRef] [Green Version]
  31. Xiu, L.; Liu, S.; Liu, L.; Liu, L.; Zhang, G. Research on Oil Droplets Deformation Flow of Water-flooding Reservoir. Contemp. Chem. Ind. 2015, 44, 1443–1445. [Google Scholar]
  32. Yin, D.; Fang, Y.; Xin, Y. Study on Microscopic Mechanism of Changing Displacement Direction in Low-Permeability Reservoirs. Spec. Oil Gas Reserv. 2017, 24, 59. [Google Scholar]
  33. Zhu, W.; Ma, Q.; Li, B.; Liu, Y.; Yue, M. Influence of injection-production angle variation on oil displacement efficiency and microscope remaining oil. Fault-Block OilGas Field 2019, 26, 220–224. [Google Scholar]
  34. Kaminski, M.; Carey, G. Stochastic perturbation-based finite element approach to fluid flow problems. Int. J. Numer. Methods HeatFluid Flow 2005, 15, 671–697. [Google Scholar] [CrossRef]
  35. Hustad, O.S.; Browning, D.J. A fully coupled three-phase model for capillary pressure and relative permeability for implicit compositional reservoir simulation. In Proceedings of the SPE/EAGE Reservoir Characterization, Simulation Conference, Abu Dhabi, United Arab Emirates, 19–21 October 2009. [Google Scholar]
  36. Gomez-Hernandez, J.; Guardiola-Albert, C. Inverse Conditional Simulation of Relative Permeabilities. In Geostatistics Banff 2004; Springer: Berlin/Heidelberg, Germany, 2004; pp. 325–331. [Google Scholar]
  37. Hailwood, E.A.; Ding, F. Palaeomagnetic reorientation of cores and the magnetic fabric of hydrocarbon reservoir sands. Geol. Soc. Lond. Spec. Publ. 1995, 98, 245–258. [Google Scholar] [CrossRef]
  38. Hou, S.; Tian, G. Palaeomagnetic Orientation of Cores and Its Applications for Insitu Stress Measurements. J. Geomech. 1999, 5, 90–96. [Google Scholar]
  39. Dong, P. Numerical Simulation Technolog Orientation Determination of Maximum Horizontal Stress in Reservoir Formation by Paleomagnetic Orientation of Cores. Chin. J. Rock Mech. Eng. 2004, 23, 2480. [Google Scholar]
  40. Xie, J.; Ge, K.; Xu, H.; Deng, J. Review of Paleomagnetic Core Orientation Method. Prog. Geophys. 2020, 35, 906–917. [Google Scholar]
Figure 1. Cores used in our experiment (ae) are the 4 side and top photos of the cubic core, (f) is the full-view photo of the cubic core.
Energies 14 04731 g001
Figure 2. Schematic representation of the experimental apparatus of the anisotropic relative permeability measurement.
Energies 14 04731 g002
Figure 3. Relative permeability of three directions.
Energies 14 04731 g003
Figure 4. The pressure distribution of the four cases at the 50th time step.
Energies 14 04731 g004
Figure 5. The remaining oil saturation distribution of the four cases at the 50th time step.
Energies 14 04731 g005
Figure 6. The changing process of water cut of the four cases.
Energies 14 04731 g006
Figure 7. Water cut and daily oil production of different anisotropic relative permeability.
Energies 14 04731 g007
Figure 8. Photo of palaeomagnetic core sample.
Energies 14 04731 g008
Figure 9. The remaining oil saturation distribution calculated by a traditional simulator.
Energies 14 04731 g009
Figure 10. The remaining oil saturation distribution calculated by the new simulator.
Energies 14 04731 g010
Figure 11. The average remaining oil saturation distribution (the left one is calculated by a traditional simulator, the right one is calculated by the new simulator).
Energies 14 04731 g011
Figure 12. Cross section of remaining oil saturation of well C14-31 (the upper left one and the lower left one are the remaining oil profiles calculated by the numerical simulation method considering anisotropic relative permeability, and the upper right one and lower right one are the results of a traditional simulation).
Energies 14 04731 g012
Figure 13. Cross section of remaining oil saturation of well C18-42 (the upper left one and the lower left one are the remaining oil profiles calculated by the numerical simulation method considering anisotropic relative permeability, and the upper right one and lower right one are the results of a traditional simulation).
Energies 14 04731 g013
Figure 14. Water cut change with traditional relative permeability and anisotropic relative permeability in the production process of the Cheng 4 South well area.
Energies 14 04731 g014
Table 1. Simulation model parameters.
Grid node40 × 40 × 1Dx (m)10
Dy (m)10Dz (m)10
Top deep (m)1000Initial water saturation (f)0.15
Porosity (f)0.2Permeability (10−3 μm2)50
Water viscosity (mPa·s)1Oil viscosity (mPa·s)10
Exploit schemeWater floodingWell patternOne injection well and one production well
Table 2. The results of characteristic remnant magnetization measurements.
Sample NumberMagnetic Declination (°)Magnetic Inclination (°)T95RK
158.14.48.943.035.78
282.1−65.534.249.52
Average results of Fisher statistical vector63.1−0.99.41.8218.7
Table 3. The first production of deployed production wells since 2017.
Well NameProduction DatePermeabilityWater Cut (%)Average Production in the First Three Months (m3/day)Average Remaining Oil Saturation of Traditional SimulatorAverage Remaining Oil Saturation of New Simulator
C18-3May 20173785317.560.500.49
C19-4June 201752364.513.740.590.60
C12-1September 201750548.620.530.470.52
C18-42April 201829670.49.720.510.37
C16-5August 201844812.322.000.570.61
C14-31November 201862763.114.700.540.44
C12.42April 201946456.716.500.500.47
C13-2July 201983866.213.300.440.39
Publisher’s Note: MDPI stays neutral with regard to jurisdictional claims in published maps and institutional affiliations.

