Article

Optimization of Low Head Axial-Flow Turbines for an Overtopping BReakwater for Energy Conversion: A Case Study

1
Department of Engineering, Università della Campania “Luigi Vanvitelli”, 81031 Aversa, Italy
2
National Inter-University Consortium of Marine Sciences (CoNISMa), Piazzale Flaminio 9, 00196 Roma, Italy
3
Consiglio Nazionale delle Ricerche—Istituto di Ingegneria del Mare (CNR-INM), Institute of Marine Engineering, Via di Vallerano 139, 00128 Roma, Italy
*
Author to whom correspondence should be addressed.
Energies 2021, 14(15), 4618; https://doi.org/10.3390/en14154618
Submission received: 14 May 2021 / Revised: 12 July 2021 / Accepted: 27 July 2021 / Published: 30 July 2021

Abstract

:
Overtopping-type wave power conversion devices represent one of the most promising technology to combine reliability and competitively priced electricity supplies from waves. While satisfactory hydraulic and structural performance have been achieved, the selection of the hydraulic turbines and their regulation is a complex process due to the very low head and a variable flow rate in the overtopping breakwater set-ups. Based on the experience acquired on the first Overtopping BReakwater for Energy Conversion (OBREC) prototype, operating since 2016, an activity has been carried out to select the most appropriate turbine dimension and control strategy for such applications. An example of this multivariable approach is provided and illustrated through a case study in the San Antonio Port, along the central coast of Chile. In this site the deployment of a breakwater equipped with OBREC modules is specifically investigated. Axial-flow turbines of different runner diameter are compared, proposing the optimal ramp height and turbine control strategy for maximizing system energy production. The energy production ranges from 20.5 MWh/y for the smallest runner diameter to a maximum of 34.8 MWh/y for the largest runner diameter.

1. Introduction

The utilization of waves as a renewable energy source has spread worldwide. Many countries have been massively investing in the planning, installation, and operation of wave energy converters (WECs) [1]. Different WEC prototypes and device conceptualizations are reported in the technical literature [2,3,4,5,6]. Five types of WECs [7] are basically defined: point absorbers, wave overtopping reservoirs, attenuators, oscillating water columns and oscillating surges. However, most of the available technologies are still in a prototype phase and not ready for commercialization. This is the consequence of various difficulties to be faced, such as the extreme weather conditions and the aggressive and challenging marine environment which make the construction and maintenance operations expensive. In several WECs with a relatively high Technological Readiness Level (TRL) the structural design failed after a short operating period, mostly due to fatigue causing the collapse of the entire facility.
WEC breakwater can exploit the overtopping phenomenon [8,9] where incoming waves run over an “overtopping” ramp and fall into a reservoir located above the sea level inside a conventional rubble mound breakwater, or into a vertical caisson breakwater. The wave energy is transformed into potential energy. Then, the flow is forced through a turbine leading to the final transformation into electrical energy. One of the latest convincing technologies is named OBREC (Overtopping BReakwater for Energy Conversion). The hydraulic behavior of this special WEC was investigated in detail by performing both numerical and physical model tests [10,11,12,13,14]. These studies were useful to design the structural elements, to predict the wave overtopping discharge rate at the rear side of the structure and to estimate the wave loadings acting on the various structural components.
In locations with a limited access to electricity, as for structures on the coastlines, low-head hydropower technologies represent the cheapest solution for off-grid energy generation. The hydropower potential with head H of few meters and flow discharges Q between 10−1 and 10 m3/s exists in many places, as ramps in rivers, head drops in channels for irrigation systems and old mill sites [15]. In these cases, water wheels and Archimedean screws are frequently utilized for H < 6 m and Q < 6–8 m3/s, with a power output less than 100 kW [16]. When the expected hydropower is above 50 kW, reaction turbines (i.e., micro-Kaplan and micro-Francis turbines), are also used. If compared with standard hydropower plants, WECs are undoubtedly characterized by a limited head availability, which consequently further restricts the field of turbines. Therefore, the selection of the hydraulic turbine is critical. Additionally, a further problem for turbines operating in WECs is the highly variable regime. The head depends on the incoming wave heights [17], and consequently the flow discharge is subjected to significant variations in a short time. The service life of the turbines installed into WECs is also much shorter than in river hydropower installations because of the aggressive effect of sea water. Consequently, the severe environmental conditions and the demanding operating regime require that a detailed maintenance program should be planned in marine sites.
Due to the abovementioned reasons, the choice of the optimal turbine inside a WEC is challenging but, at the same time, fundamental. The main structural components, as the reservoir and the sloping ramp shape and dimensions, were typically sized by applying hydraulic and structural criteria. The original concept consisted in designing the main geometry based on the wave climate, with the main aim at the overtopping discharge [18]. Some papers indicated that the produced energy could be maximized by optimizing the crest level [19,20,21]. For multi-level WECs, the geometrical optimization usually includes the selection of the most appropriate number of reservoirs [22]. However, the achievement of the best energy conversion efficiency requires to include turbine and generator selection in the optimization process [23], making it a multivariable optimization process. An interesting work focusing on the optimization of an OBREC device installed in the Pantelleria island (Sicily, Italy) was conducted by Cavallaro et al. [24]. It demonstrated that the energy production was mainly affected by three geometrical parameters, such as the crest freeboard of the reservoir, the height of the reservoir bottom and the height of the overtopping ramp.
The present study aims at performing a multivariable optimization of an overtopping breakwater wave energy converter for maximizing the energy production. Given the multivariable aspect of the problem, it is fundamental to evaluate variable mutual interaction on system performance. Ramp height, turbine runner diameter and turbine control strategy were considered as design variables for maximizing the energy production of the overtopping breakwater wave energy converter. The analysis was conducted by considering the wave climate in the San Antonio Port, Chile.

2. Materials and Methods

2.1. Approach

Pico-hydro power plants are commonly installed in remote areas as off-grid stations or stand-alone arrangements [25]. Williamson et al. [26] examined the market of low-head turbines. They showed that axial-flow turbines prevail commercially in this sector, even if the use of low-speed generators extends the range to other turbine types, such as crossflow, Turgo and multiple-jet Pelton turbines.
In this study, axial-flow turbines are considered for the installation in a WEC. The methodology is applied to a case study in the San Antonio Port (Region of Valparaìso), along the central coast of Chile. Here the wave climate conditions suggested the installation of an OBREC device.

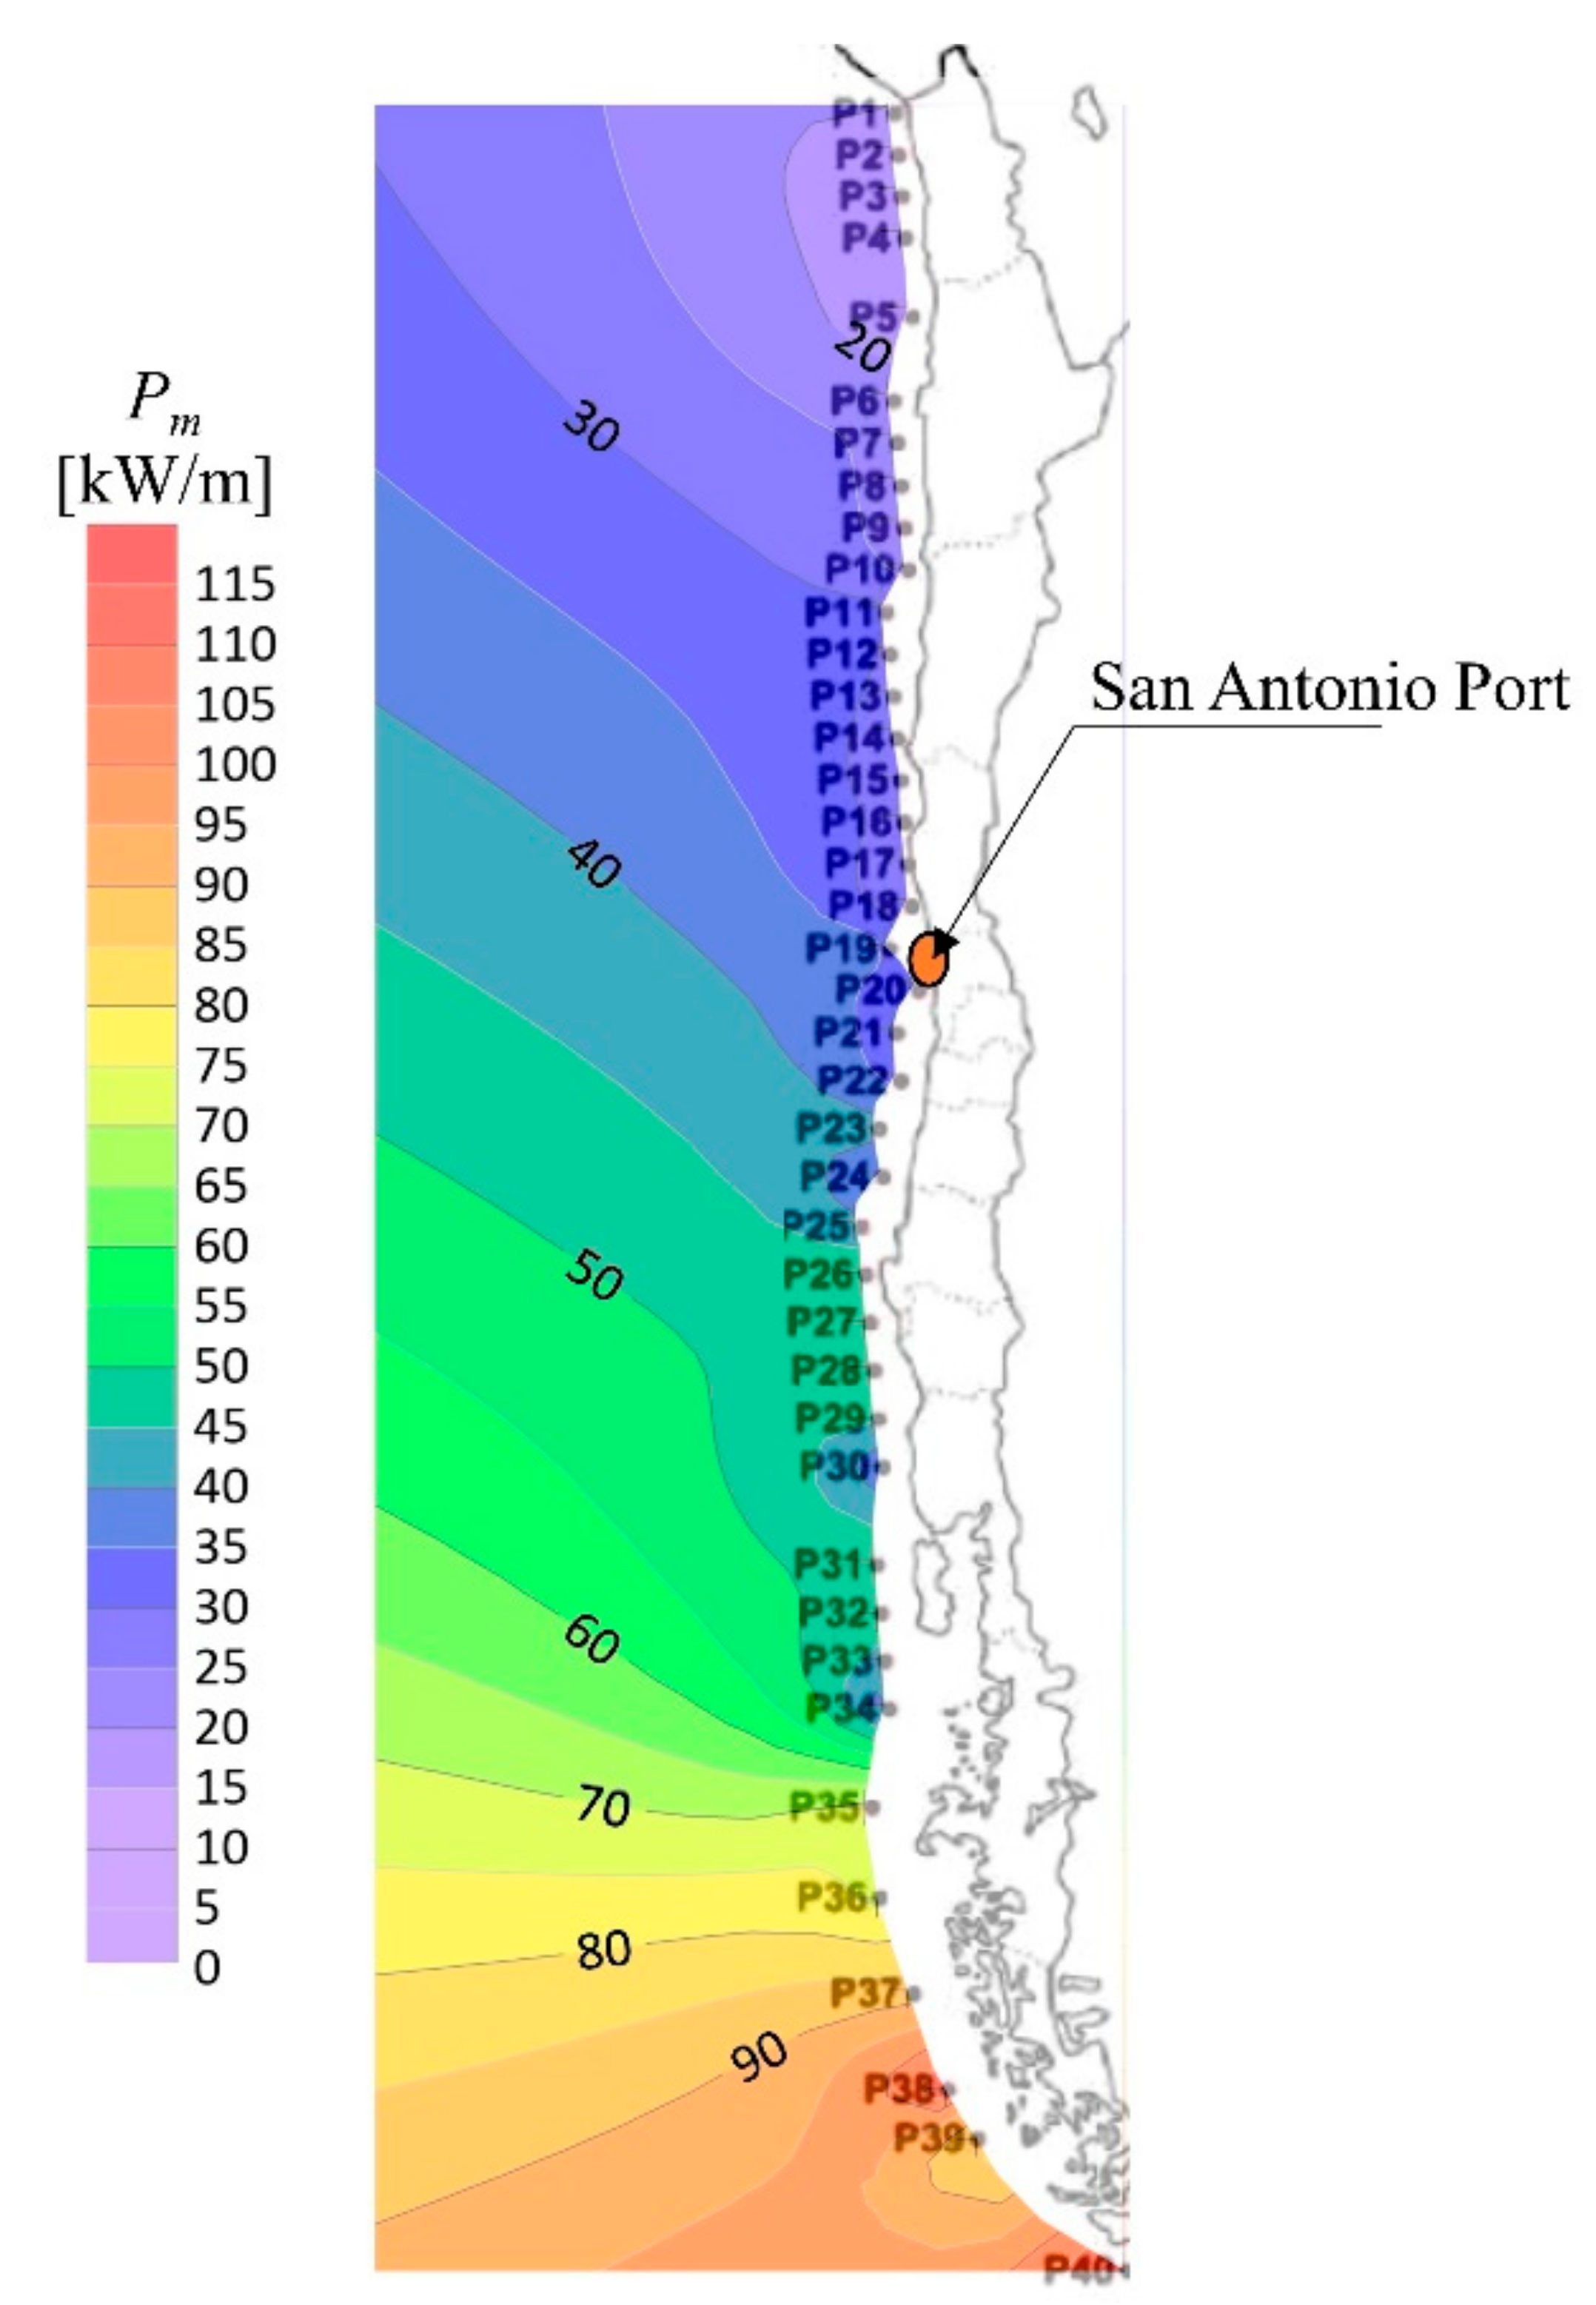
2.2. Study Area Overview

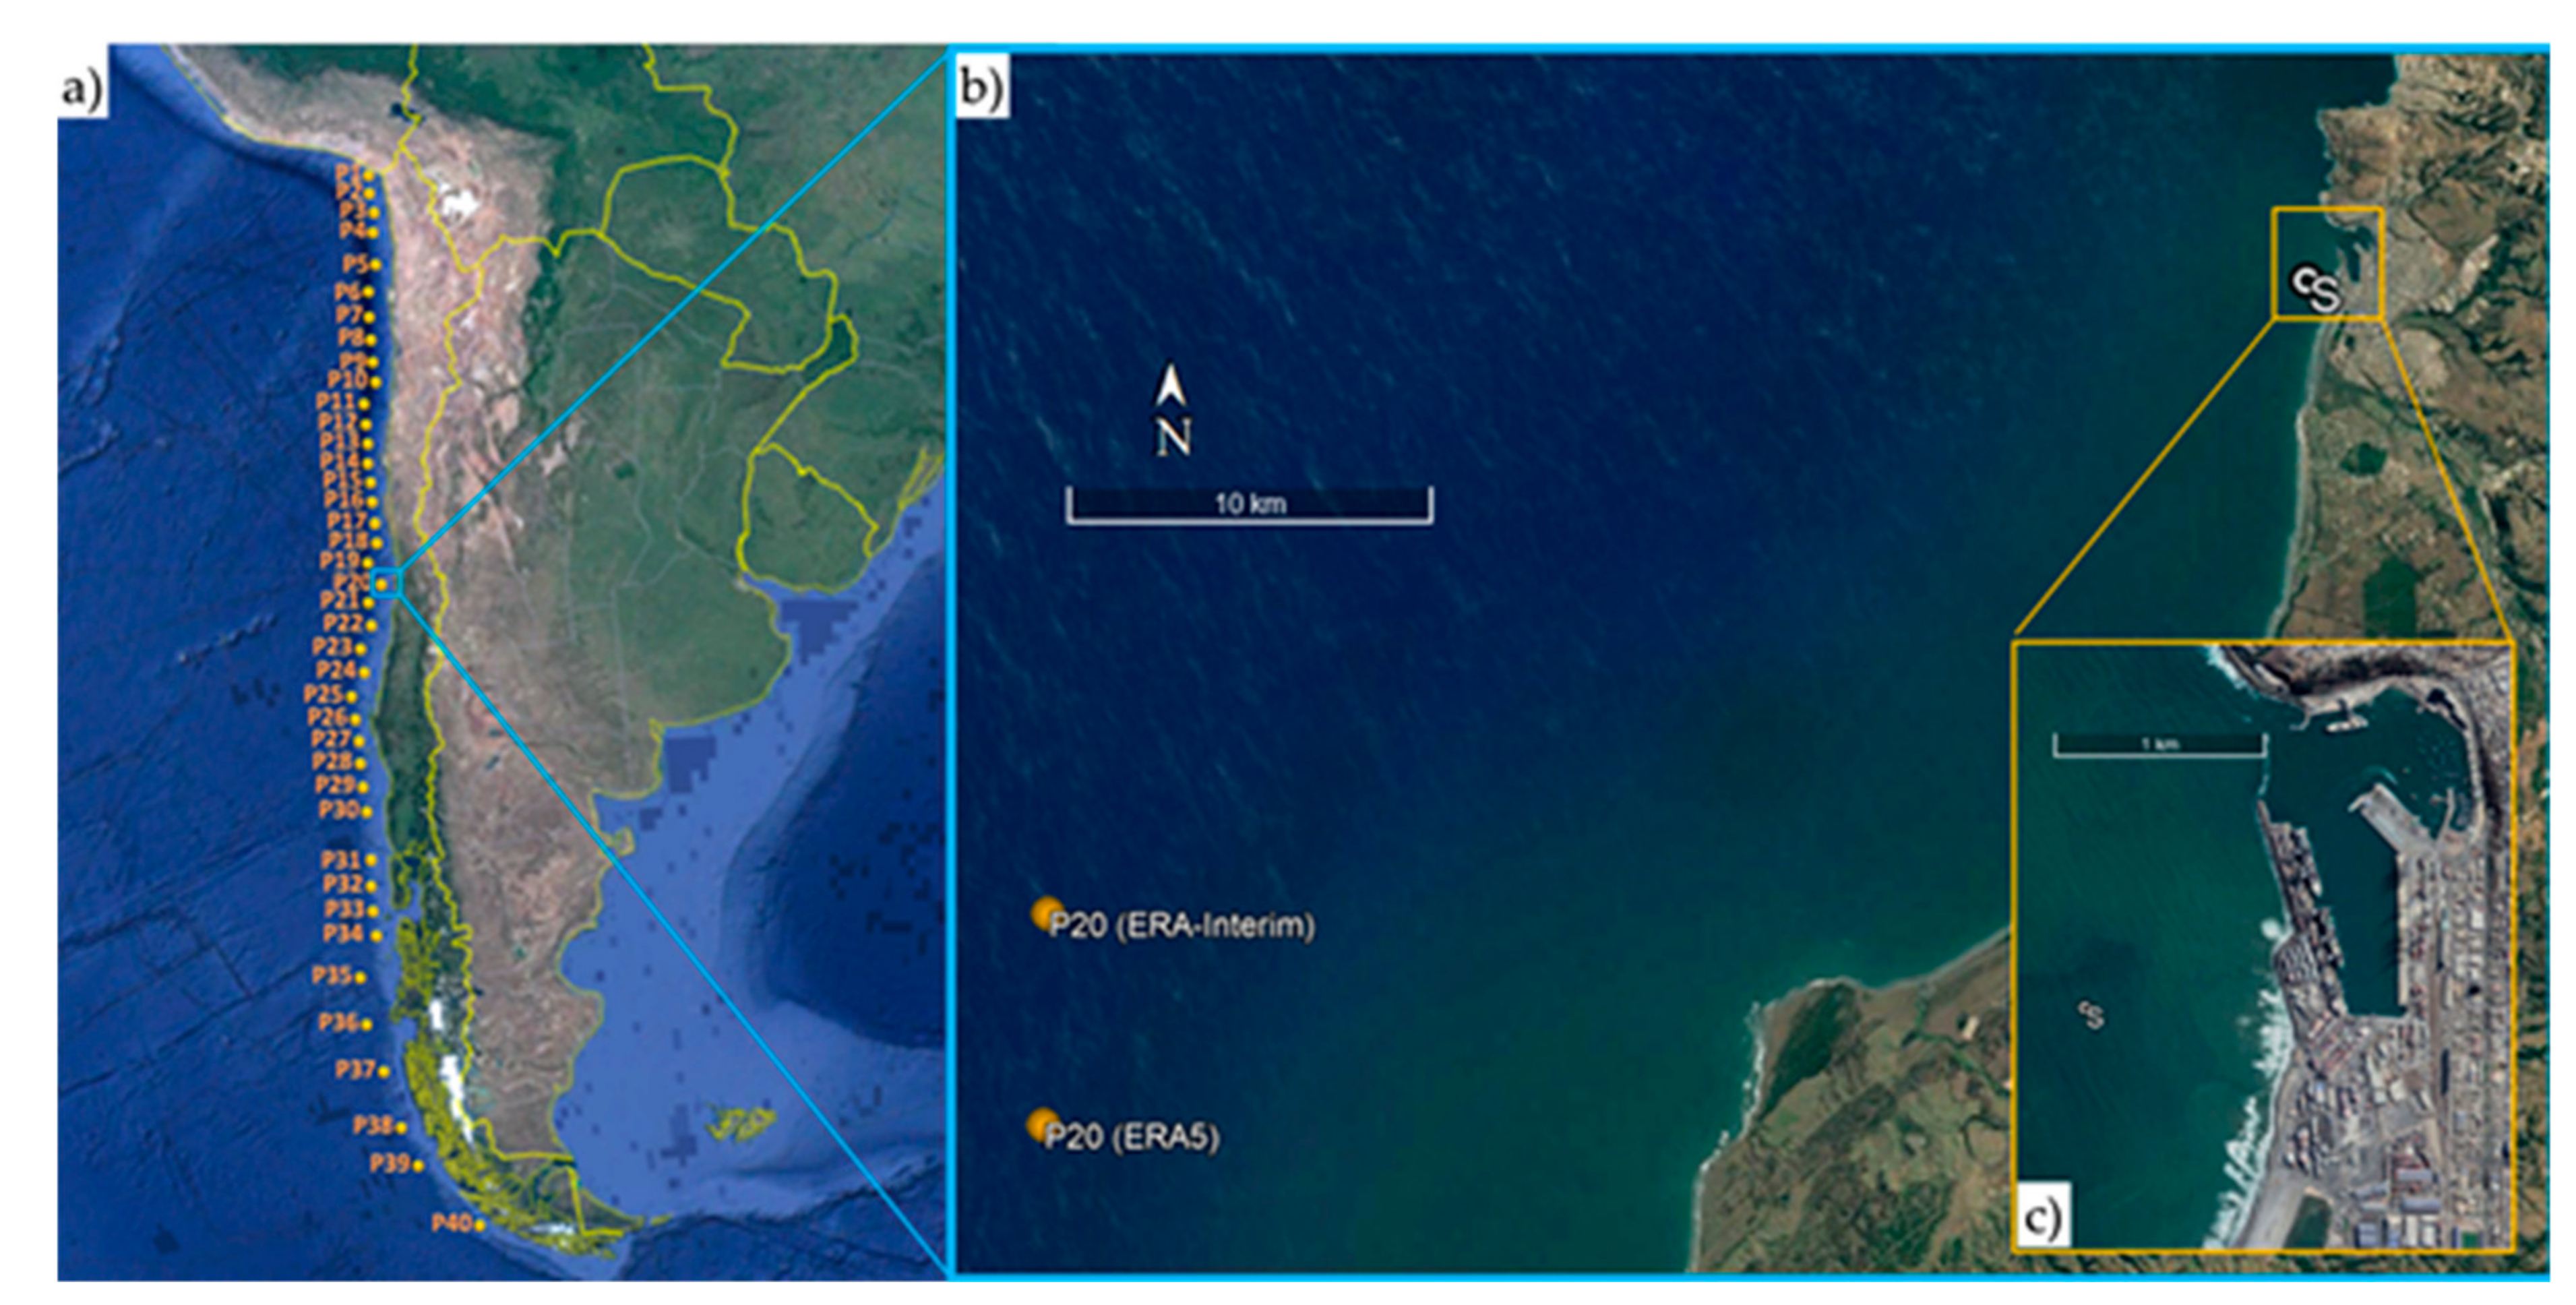
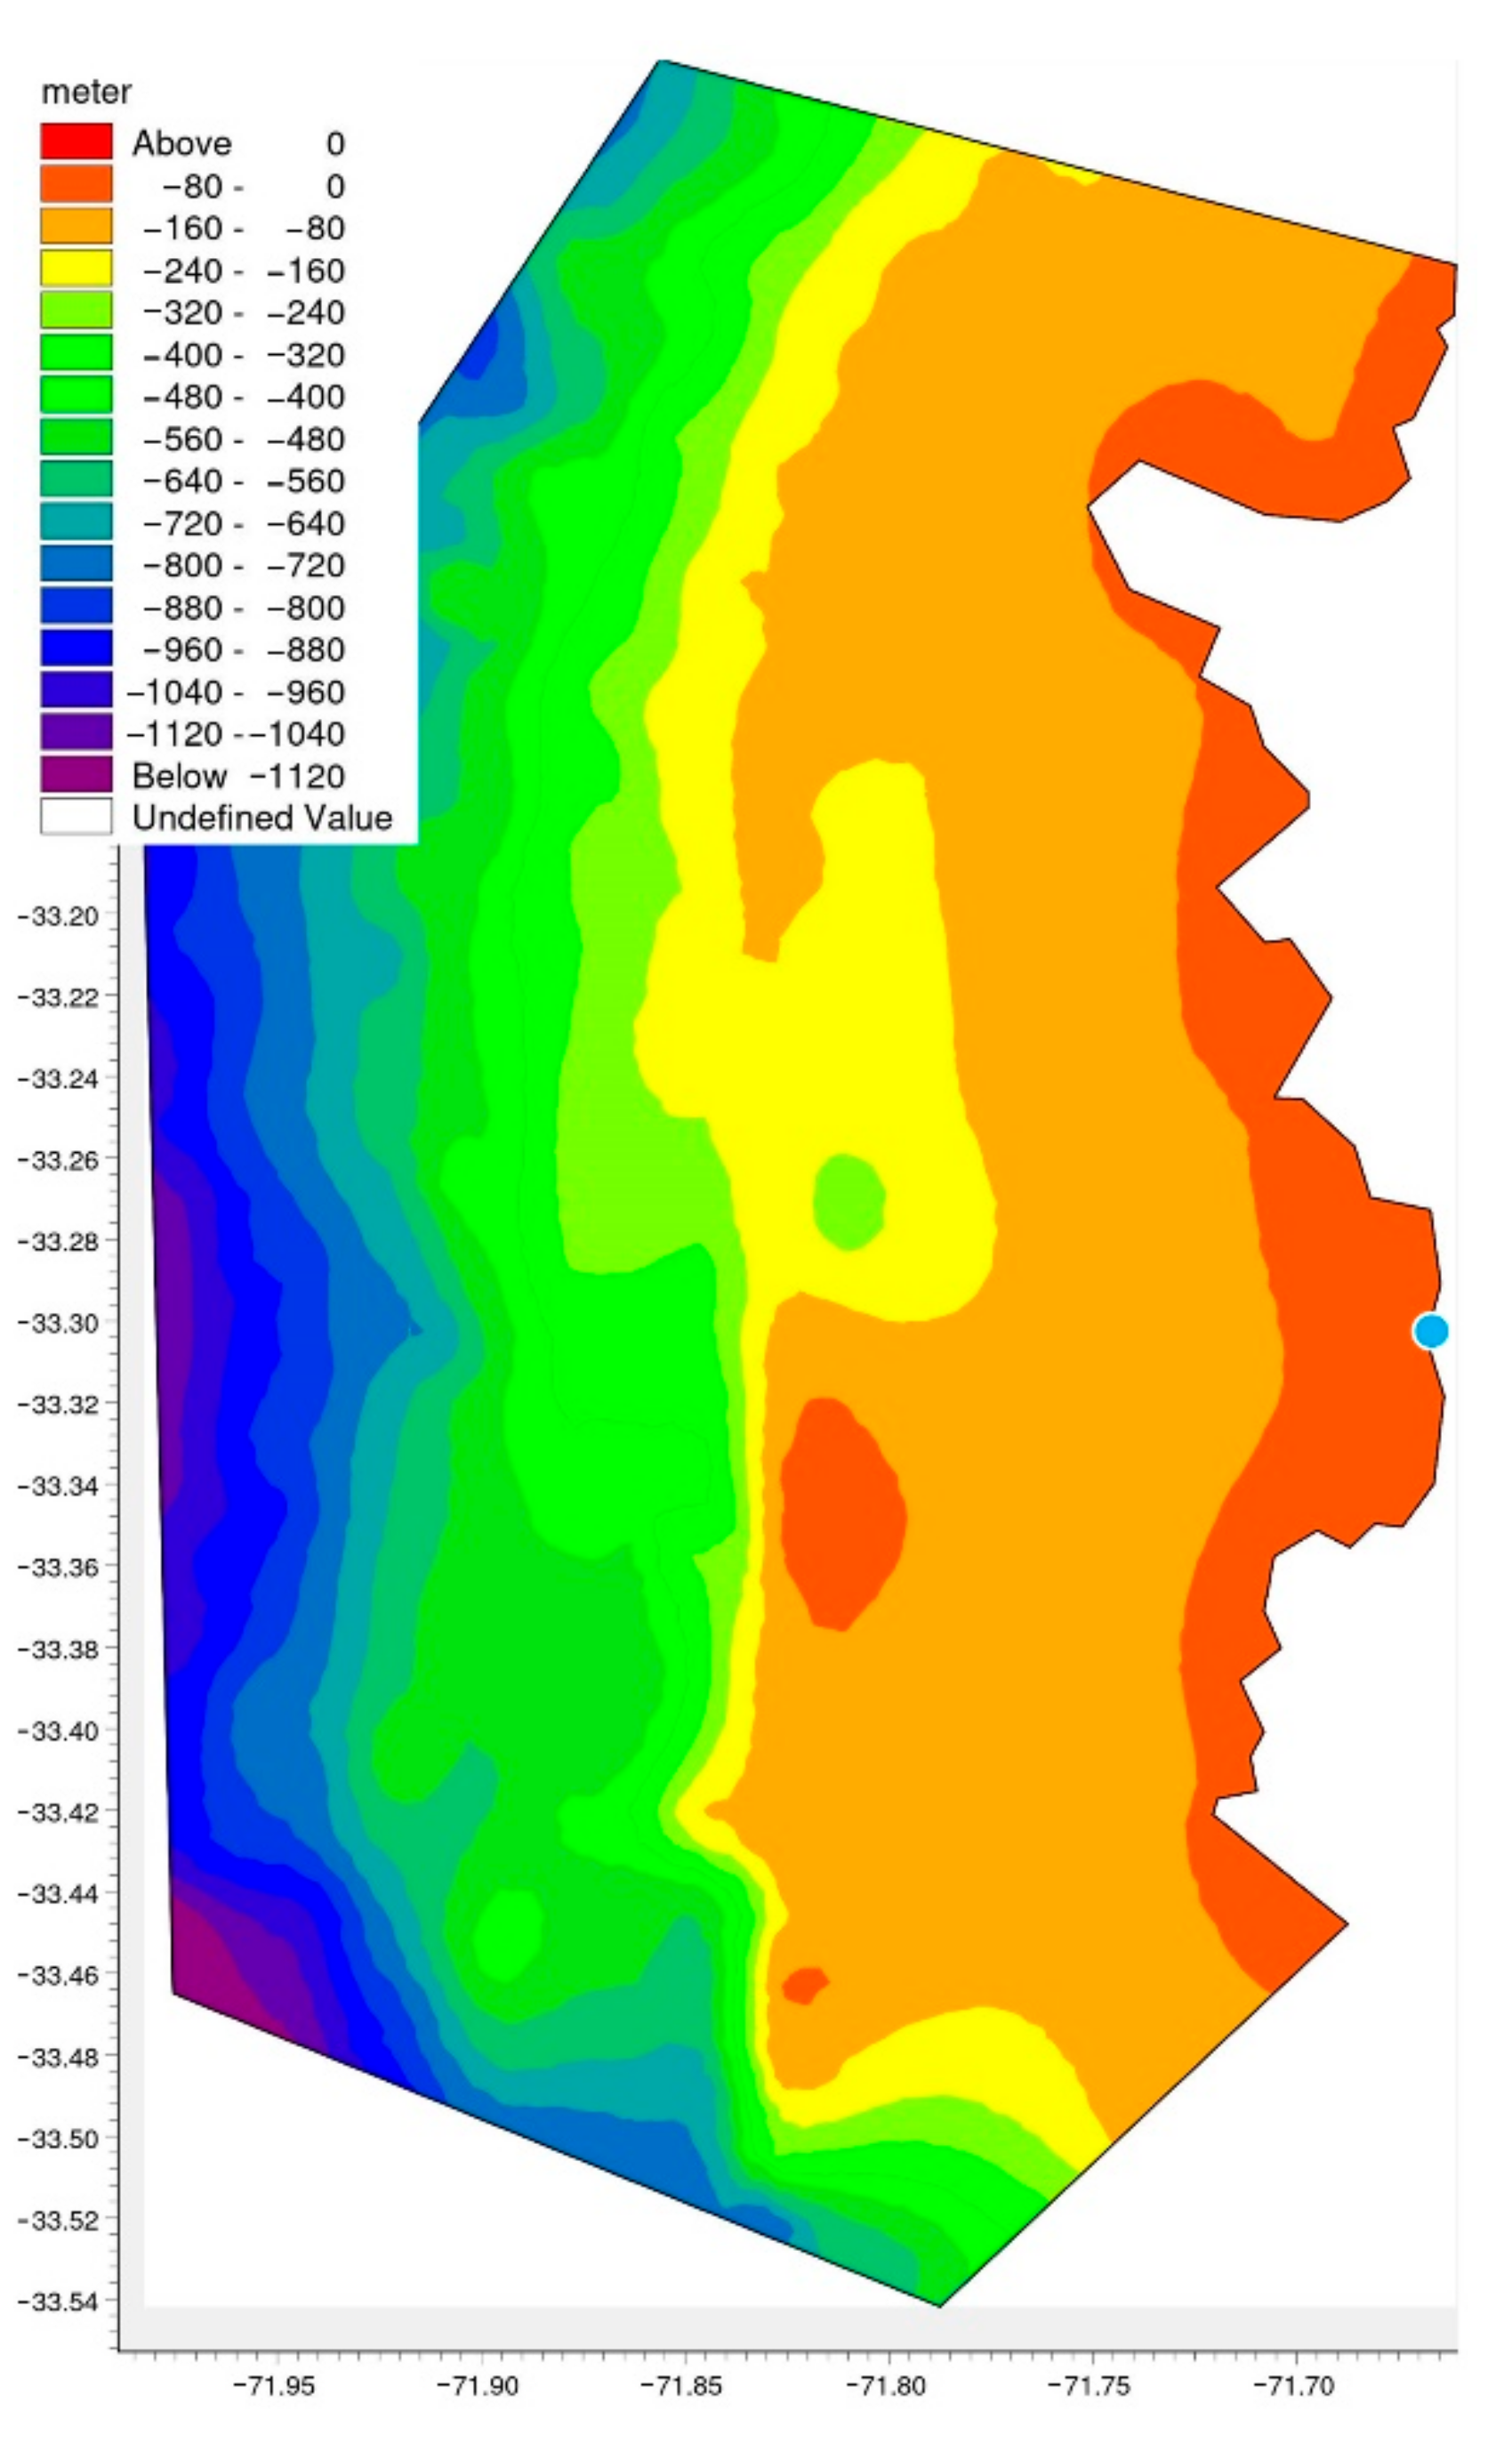
2.2.1. Site Selection and Wave Data

The Chilean coast (Figure 1a) provides an interesting case study as it is one of the most energetic areas around the world [27,28,29,30,31,32,33,34]. The wave energy assessment along the Chilean coast is provided considering the 6 h records of the European Centre for Medium-Range Weather Forecasts (ECMWF) internal WAve Model (WAM), based on the ERA-Interim dataset [35]. Such data cover the period from January 2007 to December 2016. A total of 40 grid points, whose latitude ranges between 18.75° S and 55.50° S and the longitude ranges between 70.50° W to 76.50° W, have been considered for the analysis. Then, a detailed nearshore assessment is presented along the area of the San Antonio Port (Figure 1b). In the present study, the results provided by Di Lauro et al. [27] have been detailed by widening the time window for the source point P20, as representative of the wave climate offshore San Antonio Port. An extended dataset has been considered for P20 by combining:
The 10-year dataset from ERA-Interim for the point P20, with coordinates 33.75° S and 72.00° W
A 4-year dataset (from January 2017 to December 2020) from ERA5 reanalysis, for the point P20 (ERA5), in Figure 1b, with coordinates 33.8° S and 72.00° W.
ERA5 is the latest climate reanalysis produced by ECMWF, providing hourly estimates of climate variables. The point study S, Figure 1c, represents the new “Outer Port”, an expansion of the existing port infrastructure to be built in front of Molo Sur, the main coastal protection of San Antonio Port [36]. The construction of the new breakwater to shelter the terminals involves a first section perpendicular to the coast, with a length of approximately 1.5 km, followed by another section of about 2.4 km length running parallel to the coastline. Due to the long maritime tradition of the city of San Antonio, the port area is the largest in terms of freight handled and one of the busiest in the whole South America.

2.2.2. Offshore Wave Climate

In real sea states, the wave energy flux Pm across a vertical section of unit width perpendicular to the wave propagation direction can be computed as follows [27]:
P m = ρ g 0 2 π 0 C g f , h · S f , θ d f d θ
in which ρ is the sea water density, g is the gravity acceleration, S(f,θ) denotes the directional spectral density function, with θ as the wave direction, and Cg(f,h) represents the wave group velocity, expressed as:
C g f , h = 1 2 1 + 2 k h sin h 2 k h g k tan h k h
where k(f) is the wave number depending on the wave frequency f, and h is the local water depth.
In this work Pm was approximated as [37]:
P m ρ g 16 H s 2 C g T e , h
where Hs is the significant wave height, Te is the energy period and Cg(Te,h) is the wave group velocity of a wave with period Te and water depth h. The energy period Te is defined as the ratio between the minus-one and the zeroth spectral moments:
T e = m 1 m 0
It is noteworthy that Te is rarely specified, and, for this reason, it needs to be estimated from other variables. As the mean wave period Tm is known from the hindcast wave dataset, a common approach consists in assuming Te proportional to Tm as Te = α∙Tm. The coefficient α was set equal to 1.14, according to the approach used in [38,39]. For deep waters (h > L/2), the approximate expression for wave power under a wave front crest of width equal to 1.0 m is given by:
P m = ρ g 2 H s 2 T e 64 π
Operatively, for each triple (Hs, Tm, θm) provided at the 40 hindcast points P1-P40 along the Chilean coast in deep waters, the related power series given by Equation (5) was computed. Results are graphically represented by a colour map in Figure 2. Geographical information, main statistical parameters, yearly average wave power Pm and annual wave energy Ew, based on the 10-year average at the 40 ECMWF grid points in deep water are shown in Table 1. Table 2 reports the principal statistical values of the Hs, Tm, Tp, and θm, for the point P20. Wave statistics obtained from ERA5 (from January 2017 to December 2020) result in smaller energetic wave patterns. For instance, the 4-year average wave power results in about 25.80 kW/m, a value significantly smaller than that one provided by using 10-year average from ERA-Interim (i.e., 27.98 kW/m). As results, the overall parameters reported in Table 2 show smaller values than the corresponding ones in Table 1. Being more conservative, they have been considered as input to run the wave propagation model.

2.2.3. Wave Propagation

The assessment of the nearshore wave conditions along the area of the San Antonio Port was carried out using the software Mike 21 Spectral Waves FM (Mike 21 SW, Hørsholm, Denmark), developed by the Danish Hydraulic Institute [40]. Mike 21 SW is a spectral model describing the wave propagation from deep to shallow waters by resolving the action balance equation for the evolution of the wave spectra. A detailed description of governing equation has been provided by [32]. A high-resolution unstructured grid mesh with triangular elements was used to provide reliable estimations of wave power in coastal waters. The grid resolution of the domain varies linearly as a function of the depth, with a grid spacing equal to 100 m at water depths of 50 m, and to 1000 m where the depth is 500 m. Constant values of 100 m and 1000 m were assumed respectively for water depths shallower than 50 m and deeper than 500 m, respectively. The bathymetry was modelled interpolating the dataset provided by the General Bathymetric Chart of the Oceans (GEBCO) [41], where the global bathymetry data have a resolution of 30’’ arc. The wave model was run as forced sea state-by-sea state with data related to the “extended” dataset for grid point P20, Figure 2. The output data refers to the point S (blu circle in Figure 3) at a water depth of about 25 m, with coordinates 33°35’41.84’’ S and 71°37’56.49’’ W.
Main wave climate parameters, average wave power Pm and yearly energy per meter of wave front at point S are reported in Table 3. The annual power was found to be 17.7 kW/m. About 67% of total power is related to wave periods between 9 and 12 s. About 55% of the total resource is provided by waves with significant heights between 1.5 m and 2.25 m, and related to peak wave periods between 9 and 12 s. At this point, it is useful to qualify the performance analysis on the OBREC. For the new Outer Port, the extension of the breakwater could be considered oriented at 180° N, to maintain a safe maneuvering area at the harbor entrance. Therefore, in the OBREC performance simulation, only waves coming from the sector of 270° N ± 45° (i.e., 225–315° N) should be considered. Under this assumption, the available incident wave power Pm,a become 15.3 kW/m, and the correspondent yearly energy is 134 MWh/m, as reported in Table 3.

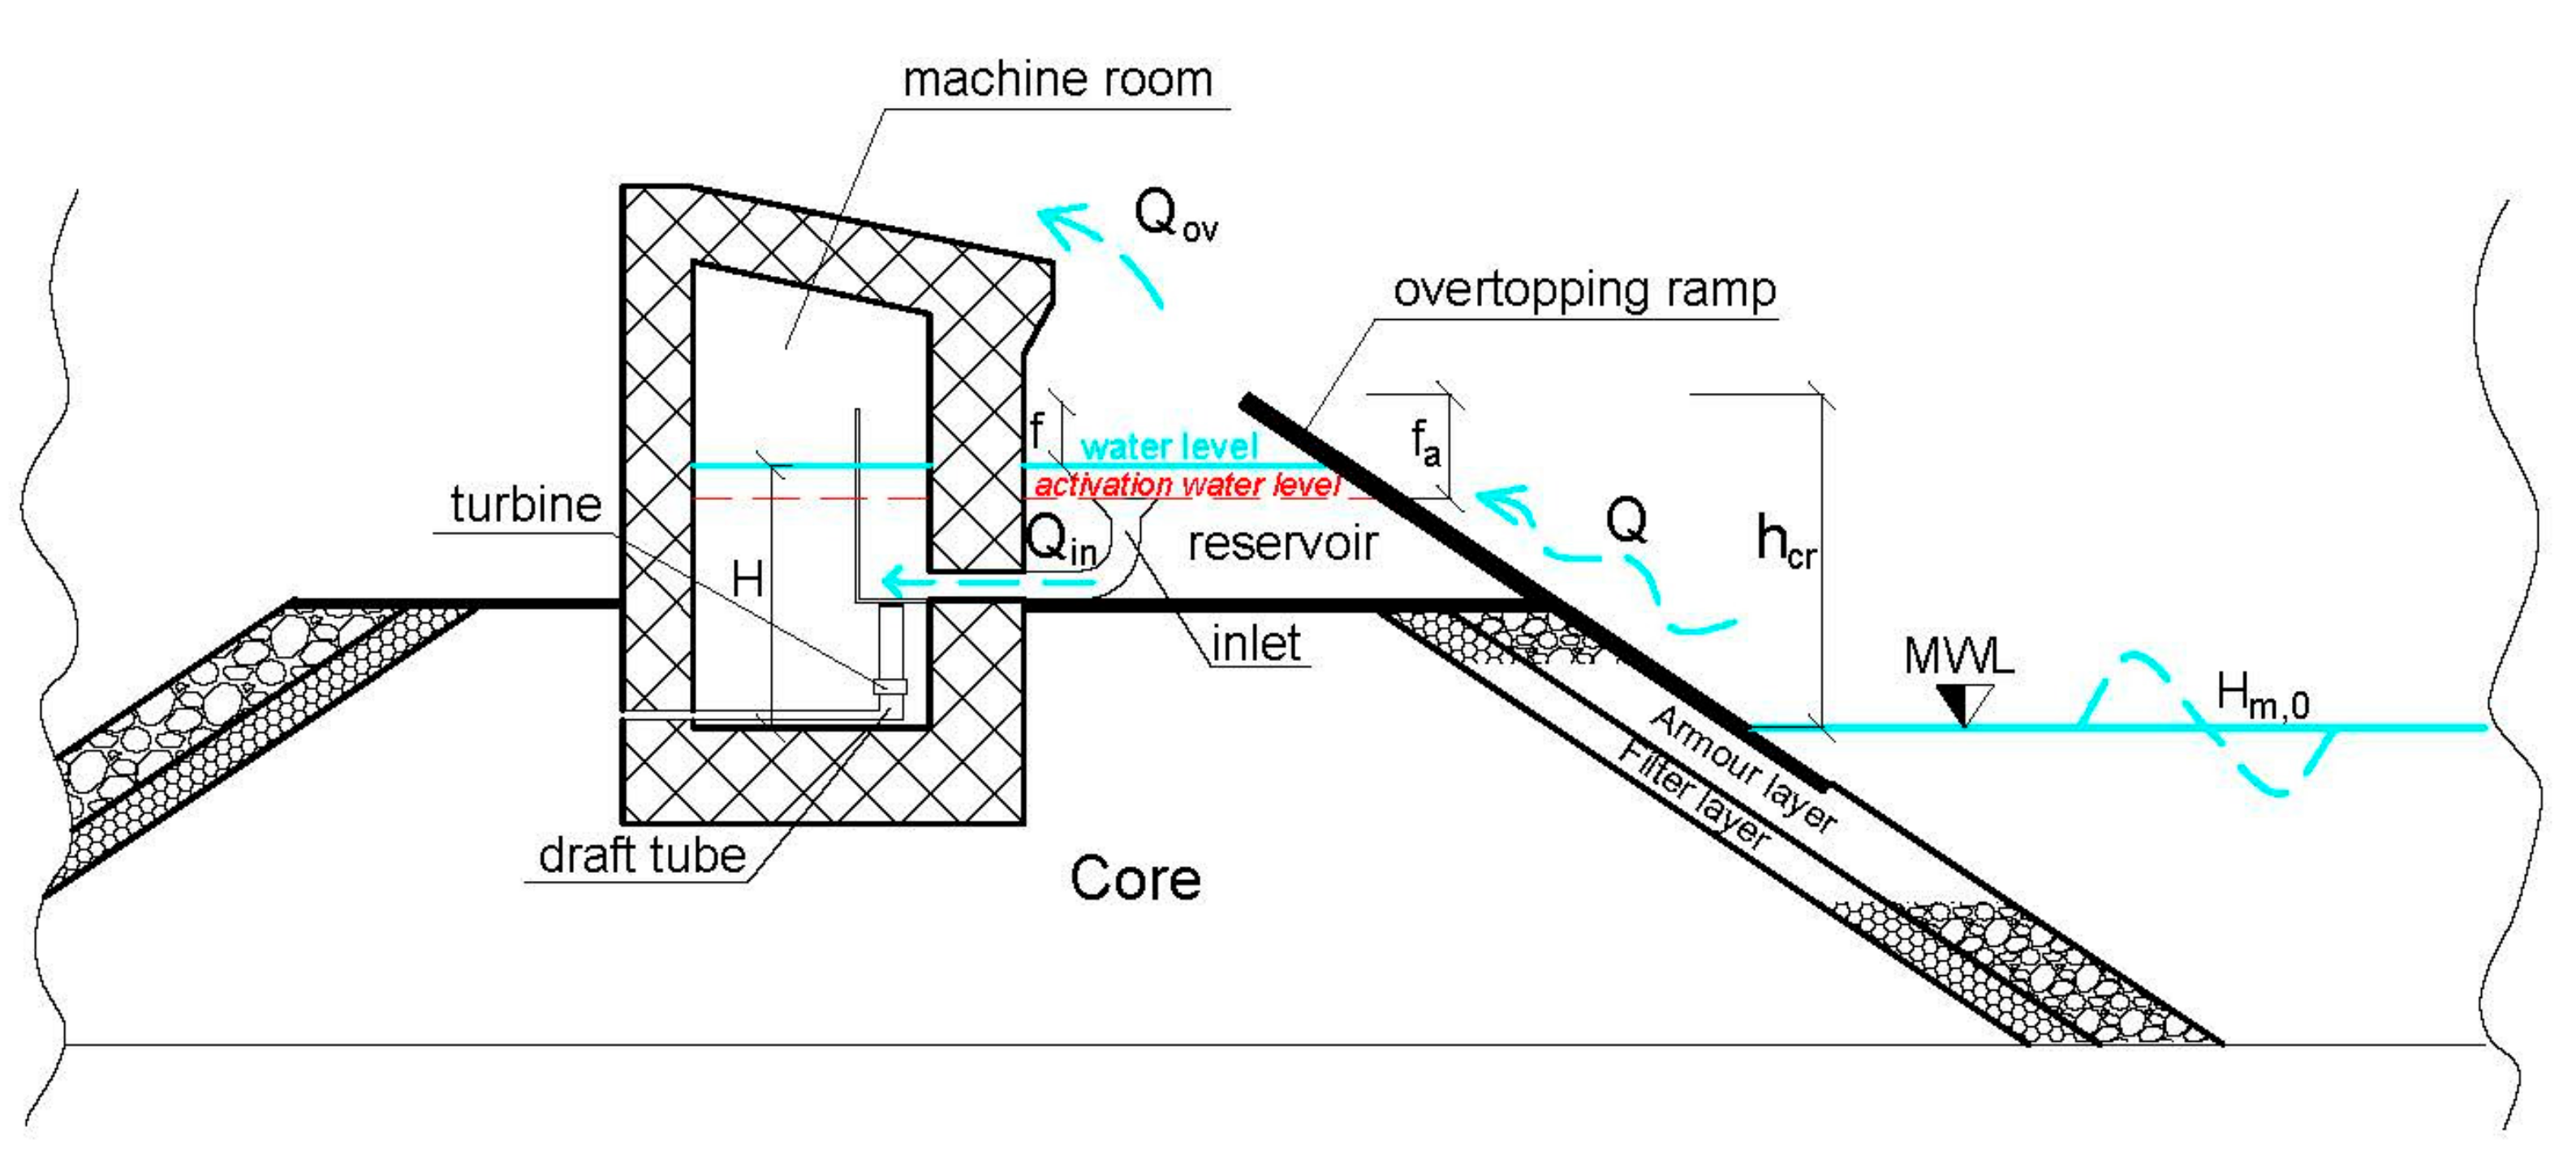
2.3. OBREC Structure

A schematic representation of the OBREC geometry is reported in Figure 4. As anticipated in the Introduction, the device consists of an overtopping ramp feeding a reservoir located above the sea level inside a conventional rubble mound breakwater. This way, wave energy is transformed into potential energy. Then, the flow is forced through the turbine leading to the final transformation into electrical energy. The lowest operational head depends on the inlet device height in Figure 4: for heads below the elevation of the inlet weir there is no flow through the turbine. The energy production is directly influenced by the amount of water flow into the reservoir, that in turns depends on the sea states and the structure geometry [42]. In particular, the reservoir volume influences the average head and, consequently, turbine performance. If the reservoir volume is small in relation to the water inflow, then most of the water coming from waves would overflow, with loss in energy production. On the other hand, if the reservoir is too large, then the turbine would operate more often but under a low head and, consequently, with a reduction of the turbine efficiency. For this reason, the study is a multi-variable optimization problem where turbine size, control strategy and structure geometry must be accordingly established. Details on the equations adopted in the model are available in Jensen et al. [42].
The present analysis has been carried out on a 6 m long breakwater module with 3 m cross sectional width reservoir. The crest level is one key parameter involved in the numerical optimization.

2.4. Turbine Control Strategy

The turbine control strategy is particularly important for these applications. In fact, the head is continuously variable during turbine operation. When the head reduces, so does the flow rate and the produced energy. Therefore, it is inconvenient to operate the turbine at low head. A turbine control strategy has been consequently adopted, setting the minimum head value by means of an inlet device, represented in Figure 4. Consequently, the turbine operates only in a defined head interval. The activation free space fa is the difference between the ramp crest level and the minimum water head, Figure 4. Such control system does not require the presence of moving parts, assuring a better system reliability.
A variable speed turbine control was applied to assure the best efficiency at different heads, a condition typical of WECs.

2.5. Flow Model

The performance of a WEC is generally estimated by means of a power matrix, allowing a match of the wave characteristics (typically the significant wave height Hs and peak period Tp) with the converter power output. The OBREC prototype represents the world’s first overtopping WEC totally integrated into an existing breakwater [6]. As the selection of the best hydro-turbine has not been performed yet, the power matrix is not available [27,28]. For that reason, the only practical approach to solve the complexity of the optimization task is represented by a software simulation of the system behavior combined with a systematic parameters variation. Therefore, the energy production of the OBREC device was determined by means of simulations performed using the software “SSG Power simulation 2”, developed at the Aalborg University (Aalborg Øst, Denmark) [43] with experimental data obtained from tests on overtopping WECs [44,45]. This code allows to model the structure geometry and to estimate the incoming water flow from waves captured into the reservoir. Balancing the water inflow, the water overflow and the turbine flow, the model determines the produced energy and system efficiency.
Model input data are:
Sea states
Ramp crest level
Turbine performance curve
Turbine control strategy

2.5.1. Sea States

Sea states implemented in the numerical code have been obtained through a discretization of the nearshore yearly available wave climate, based on 14-year sea waves numerical propagation for the sector 225–315° N, assigning a certain probability of occurrence to a specific couple Hs-Tp. Sea state computational settings are defined by the total number of waves covering all yearly sea states and by the number of waves per sea-state computed from the probability of occurrence of each wave in the time domain. The simulation is performed dividing each wave in sub-steps. More time steps improve the simulation accuracy at the cost of a longer computation time.
The 14 sea state conditions are reported in Table 4, where Prob is the probability of occurrence of each wave in the time domain and Ew is the yearly energy of each wave in MWh/year. As Hs increases from the minimum value of 0.1 m (wave class number 1), the probability of occurrence increases till the most probable wave height of 1.5 m (wave number 6) with a probability of about 25%. For waves higher than 1.5 m the probability of occurrence reduces till Hs = 4.0 m wave with a probability of occurrence of 0.4%. High waves, which are not frequent over the year, provide less energy than more frequent waves of lower heights. For the site considered in this study, the sea state number 7 provides the highest annual energy.
For each wave class, the program calculates the overtopping flow Q running over the ramp into the reservoir. The software then estimates the water flow Qin through the turbine, the water overflow Qov, the produced energy E, and the total efficiency of the system ηOBREC.

2.5.2. Crest Level

The crest level hcr (Figure 4) is defined as the vertical distance between the mean sea-water level (MWL) and the top elevation of the overtopping ramp. The software models the interaction of the structure geometry with the sea state relative to the specific site location and, consequently, it calculates the overtopping flow.

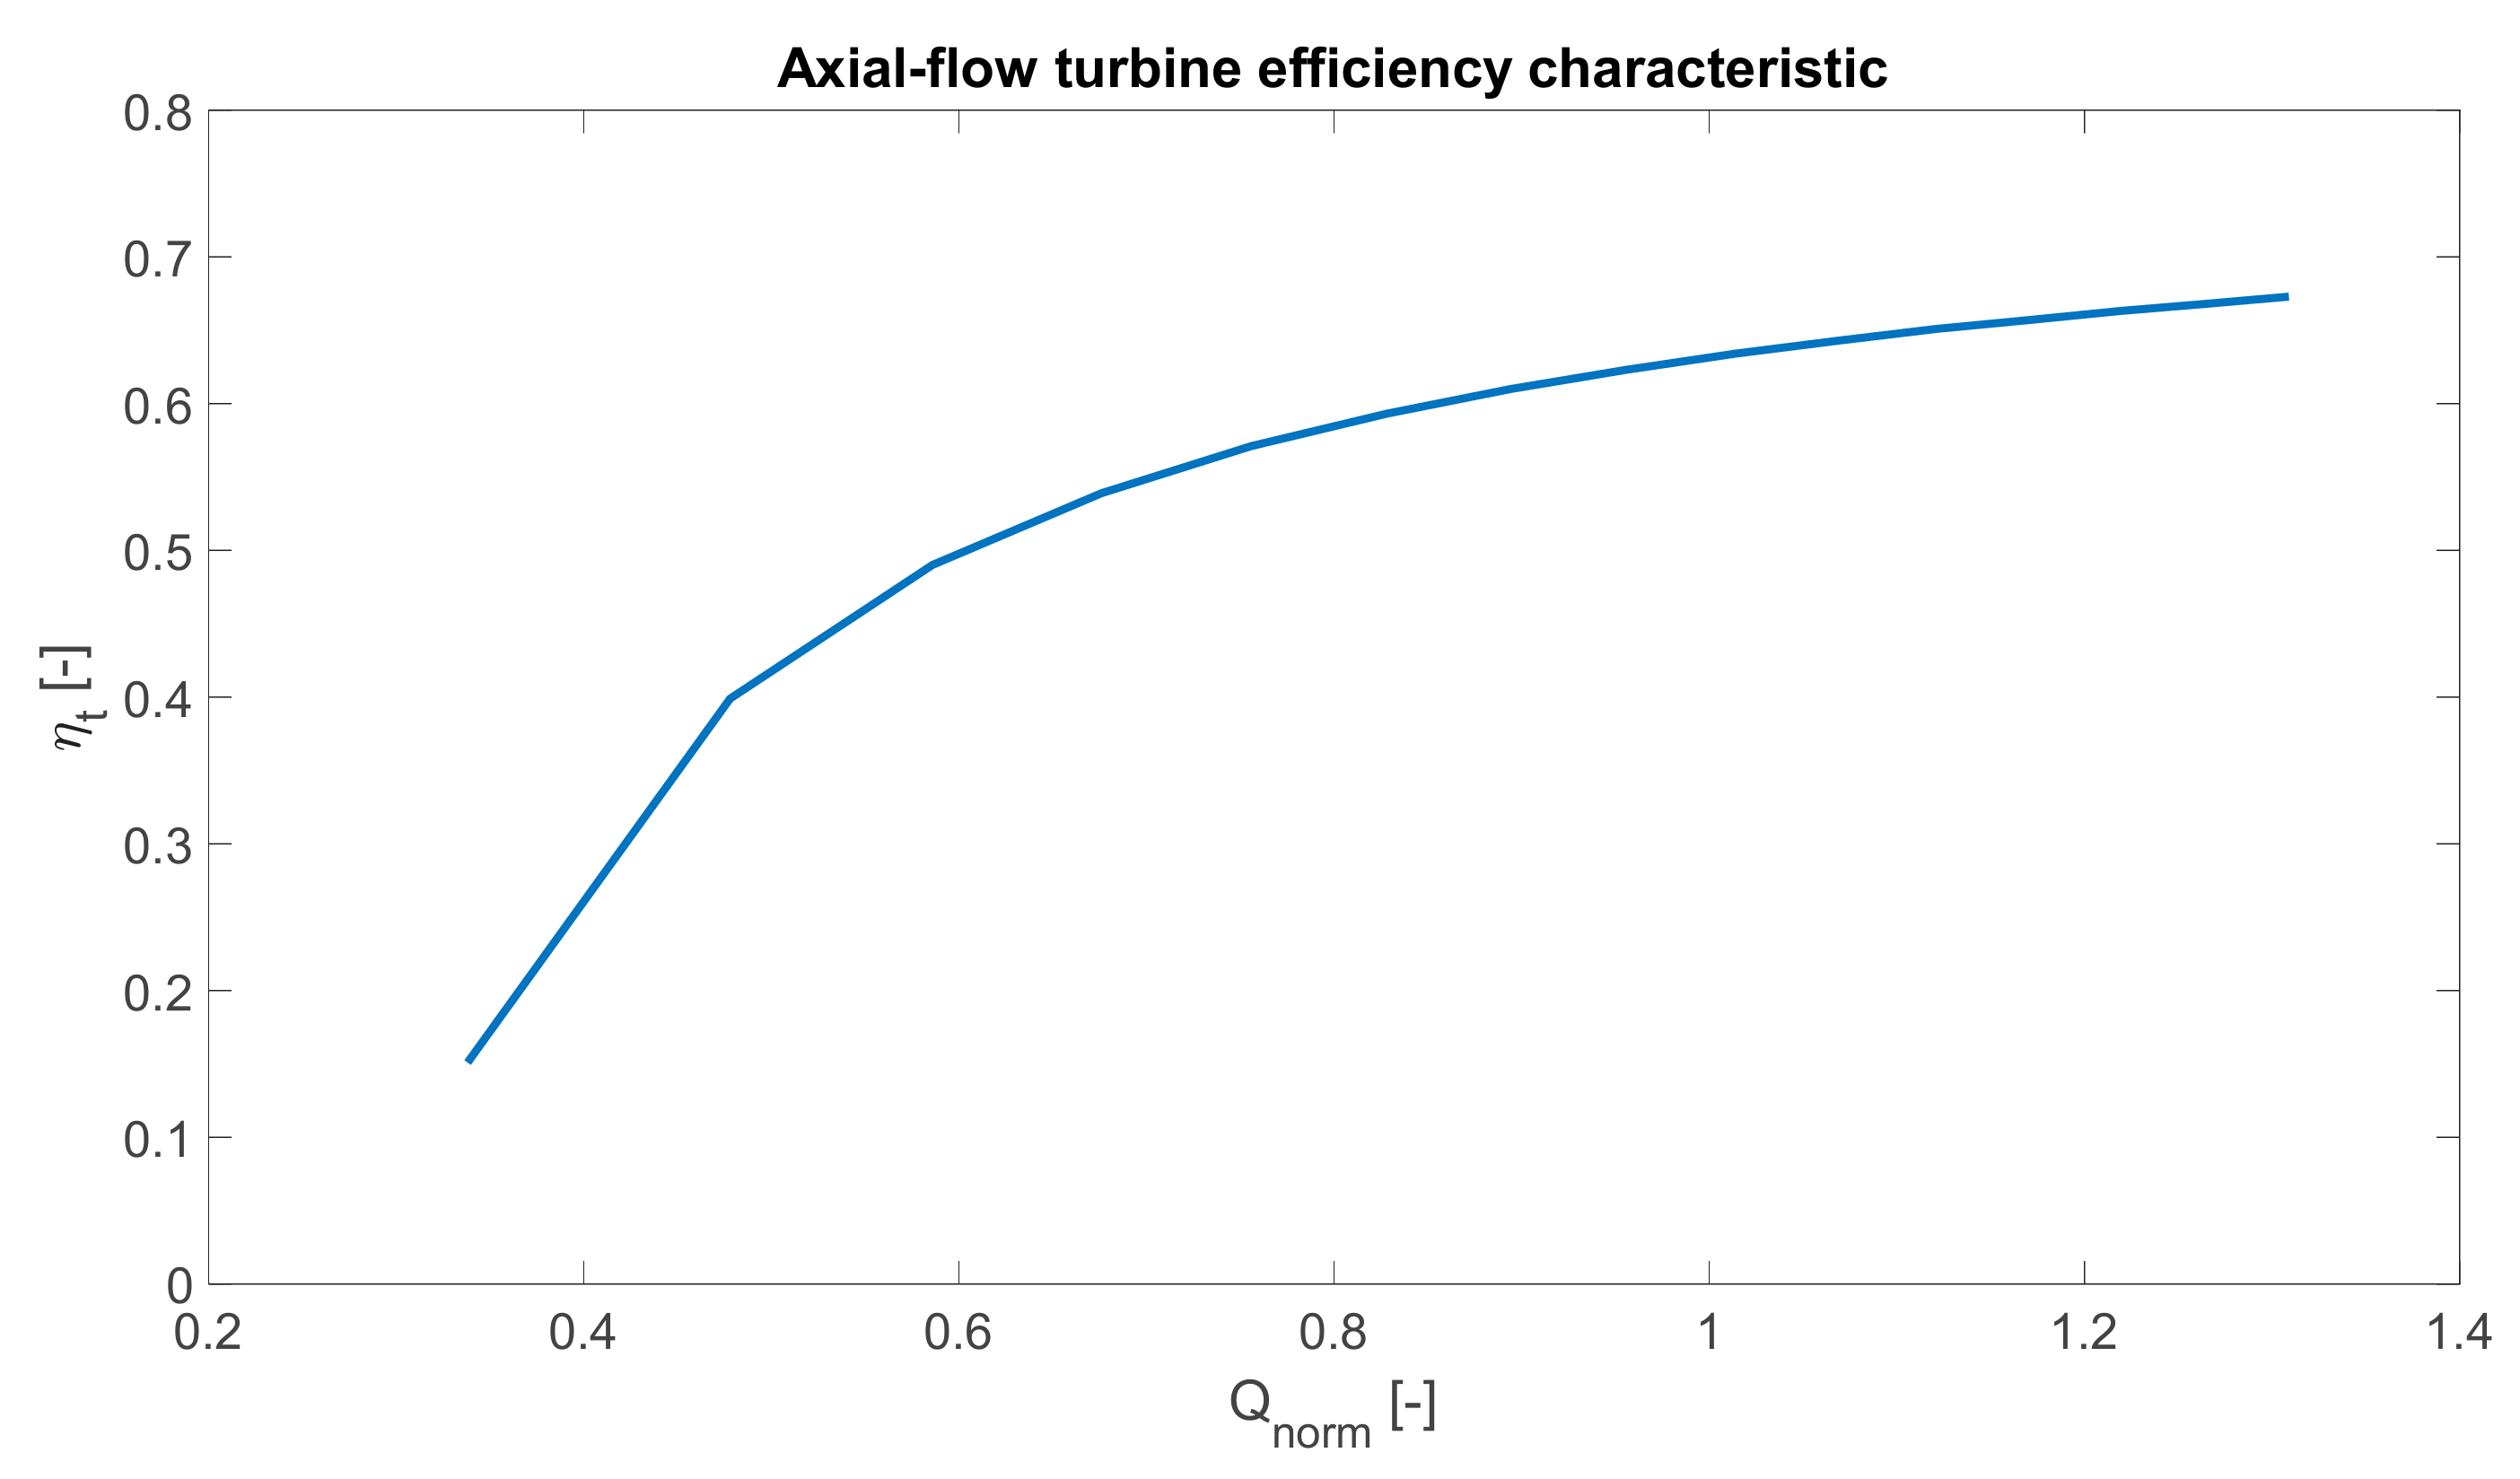
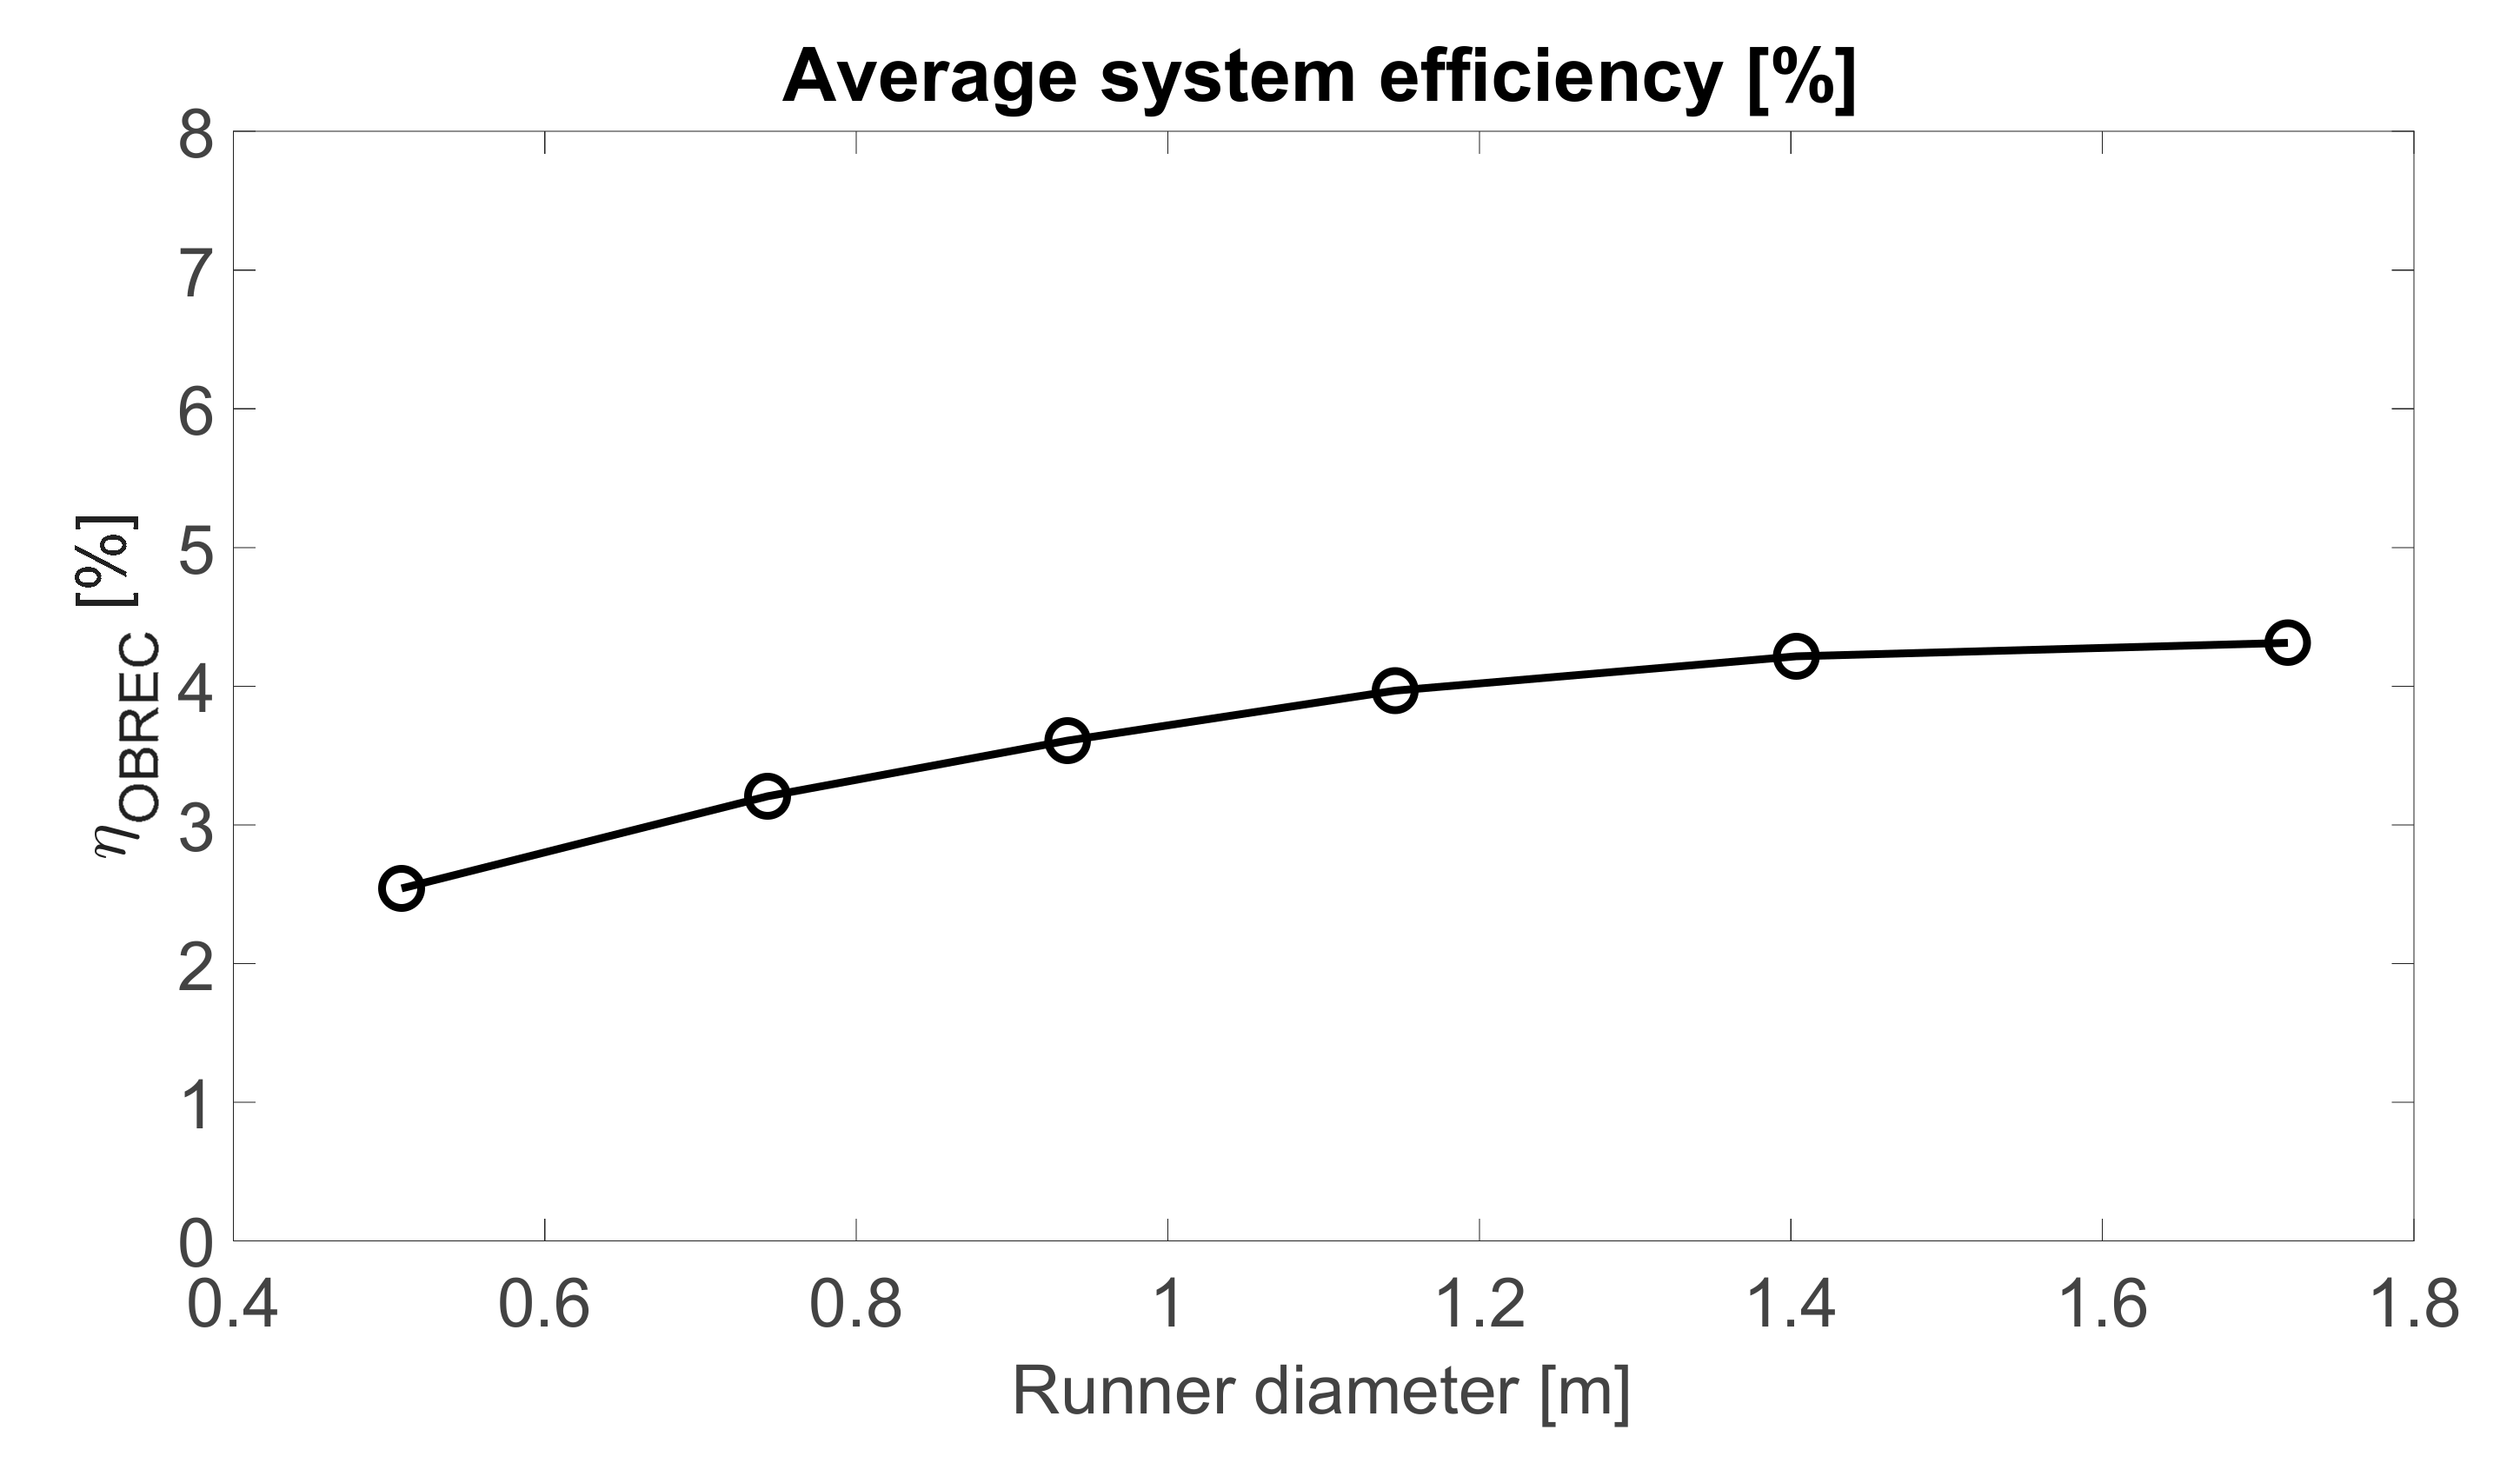
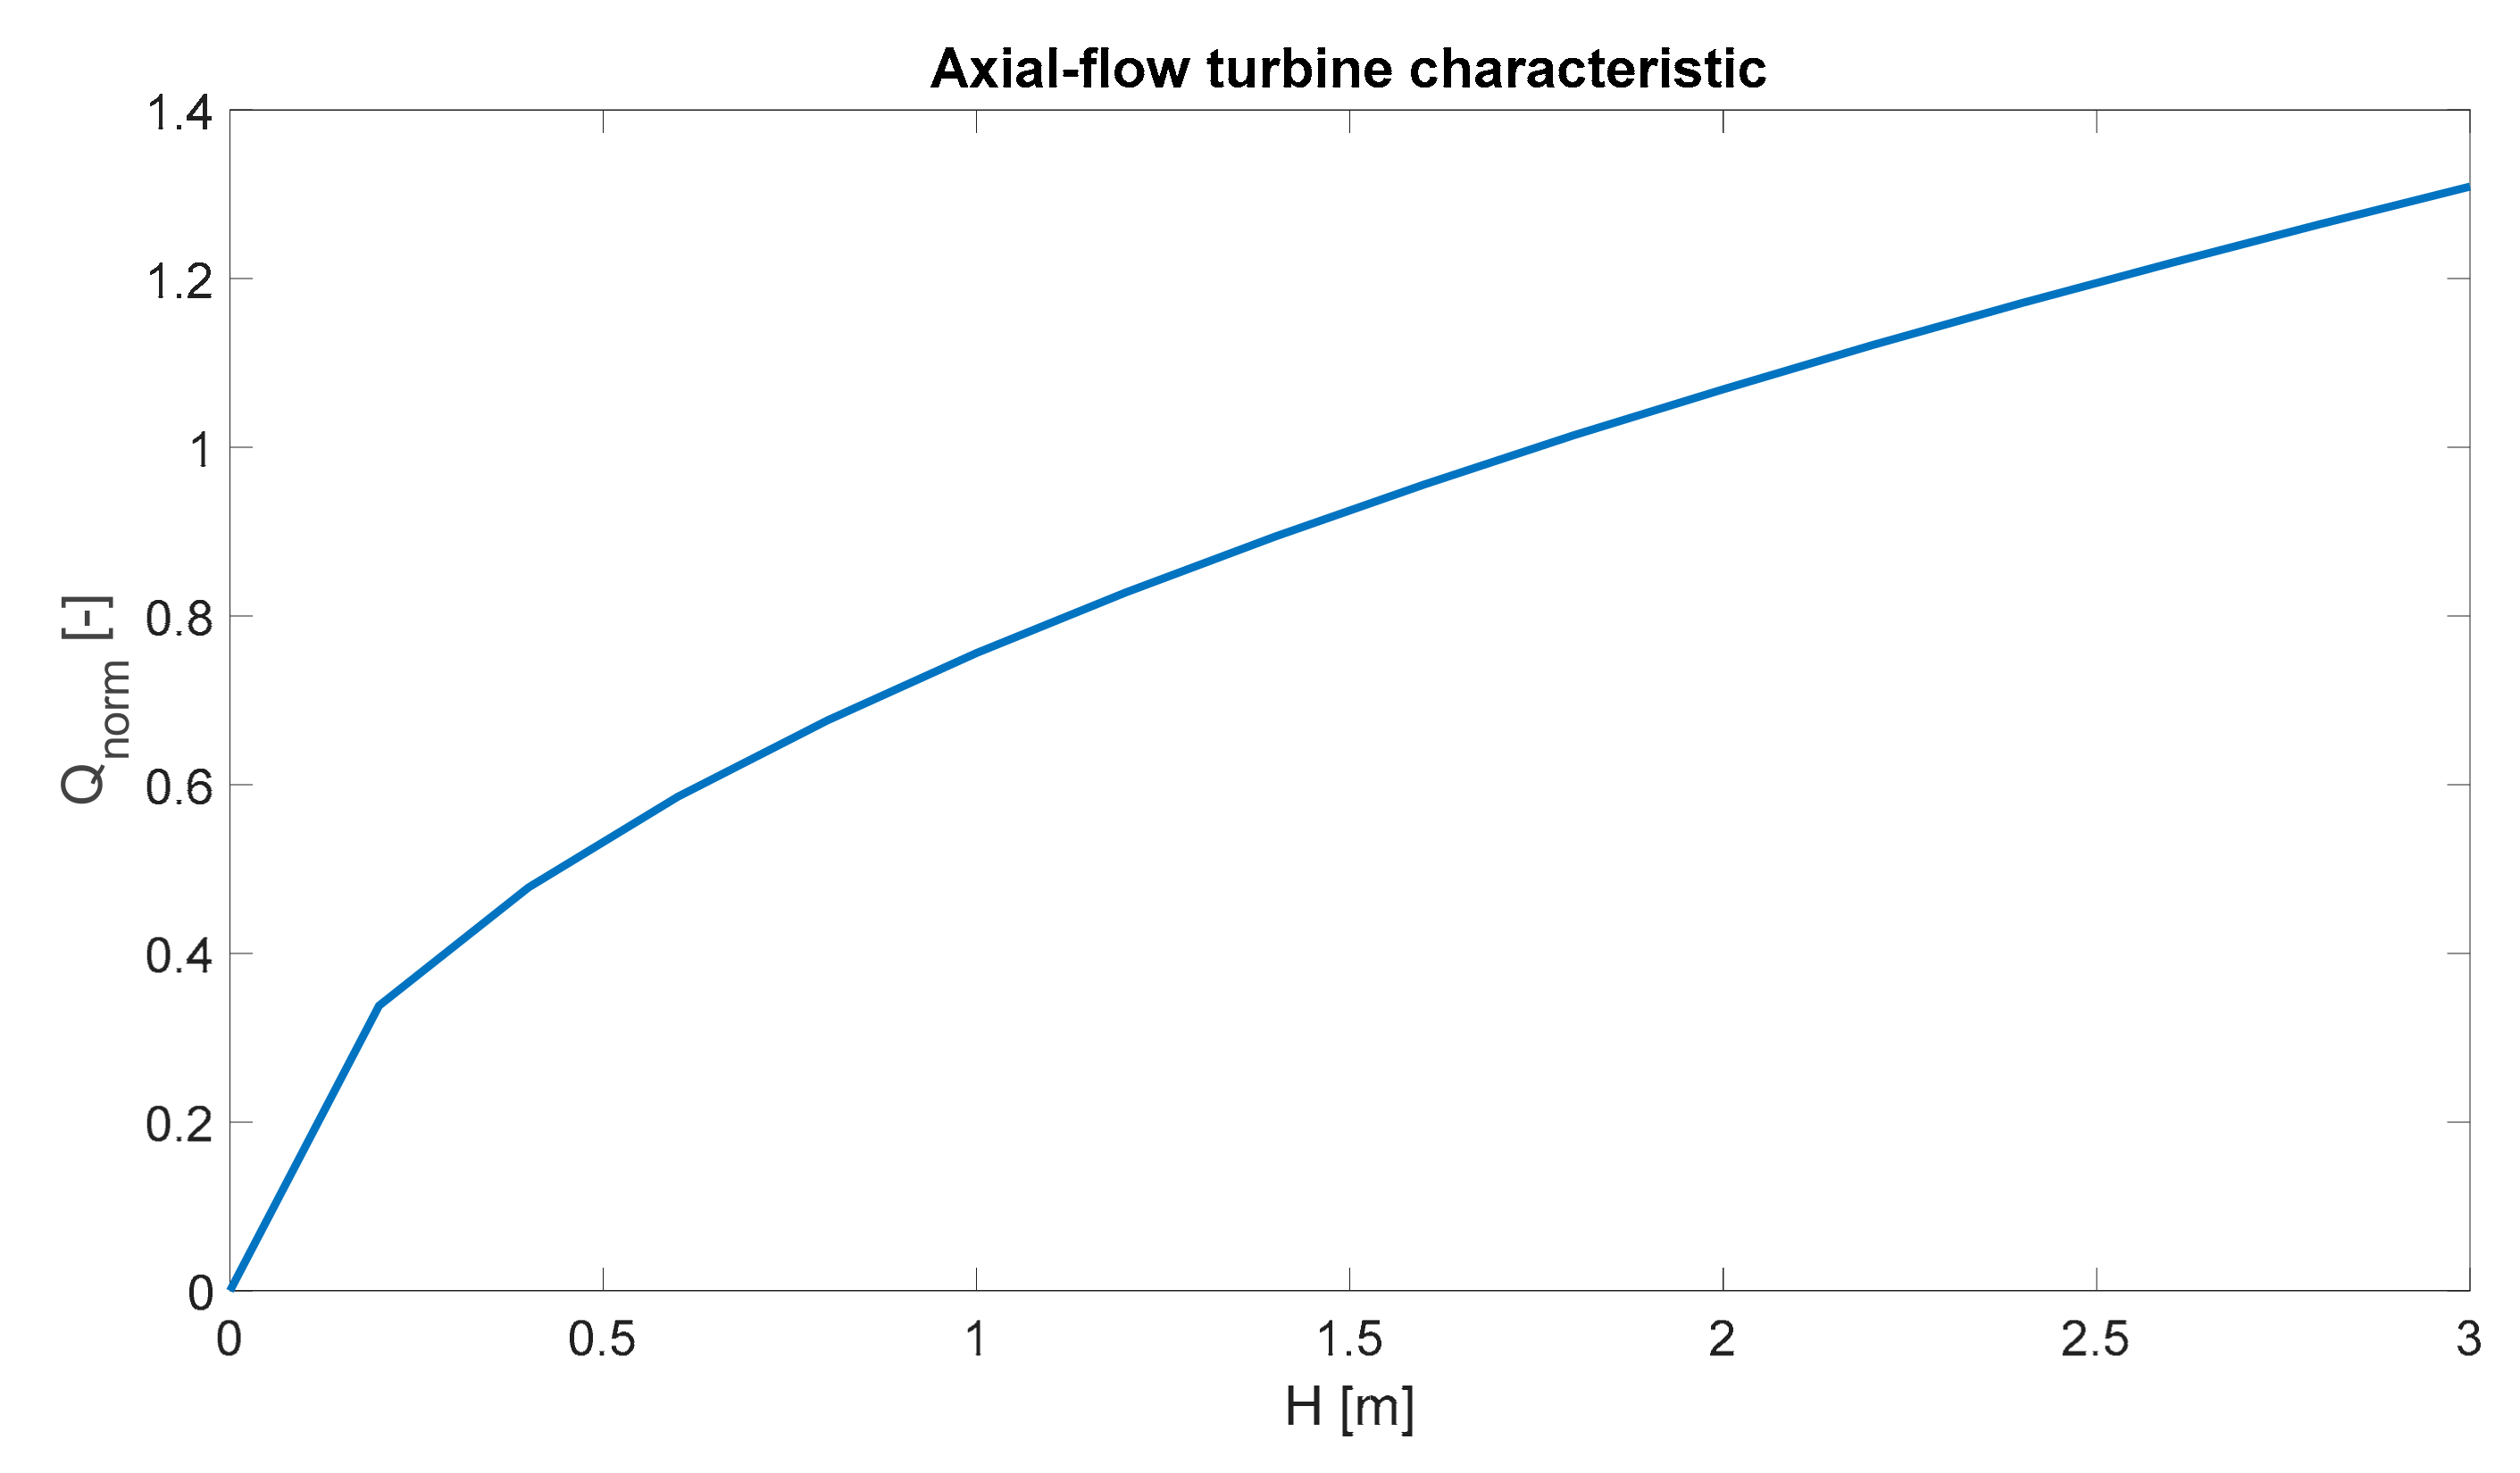
2.6. Turbine Characteristics

2.6.1. Turbine Performance Curves

Turbine characteristic curves describe the correlation between head H, turbine flow rate Qin, and turbine efficiency ηt. Qin depends on the head H, which continuously changes during operation. This is unusual for a hydraulic power plant, where the head is almost constant, and the turbine operates mainly at steady state conditions. Therefore, the turbine performance is described by means of water flow and efficiency curves versus turbine head.

2.6.2. Similitude

Dimensional analysis is a useful tool for representing the behavior of hydraulic machinery. Dimensional analysis applied to turbomachinery allows to predict prototype’s performance from tests conducted on a scale model (similitude theory) or to determine the most suitable type of machine for specified head, speed, and flow rate.
The operating conditions of a hydraulic turbine are dynamically similar at two different rotational speeds if all fluid velocities at corresponding points within the machine are in the same direction and proportional to the blade speed. In other words, the flow is dynamically similar if the streamline patterns relative to the blades are geometrically similar.
In this study, the similitude theory above mentioned was used to derive the turbine performance curves for different runner diameters, hence the effect of the size on the turbine characteristics was addressed assuming the turbines geometrically similar.
As explained in the Turbine characteristic section, the turbines are operated at variable rotational speed to maintain the highest possible efficiency as the head varies. The authors derived the flow rate versus head and efficiency versus head characteristics by imposing similar flow conditions as the rotational speed of the turbine changes.

2.7. OBREC Efficiency

The overall system efficiency ηOBREC can be expressed by the following equation:
ηOBREC = ηRAMPηRESERVOIRηt
where:
ηRAMP is the efficiency of the ramp, i.e., the rate of total incident power overtopping the crest.
ηRESERVOIR represents the efficiency of the reservoir, in terms of the potential energy stored or lost due to overflow.
ηt is the turbine efficiency calculated considering the electrical energy produced.
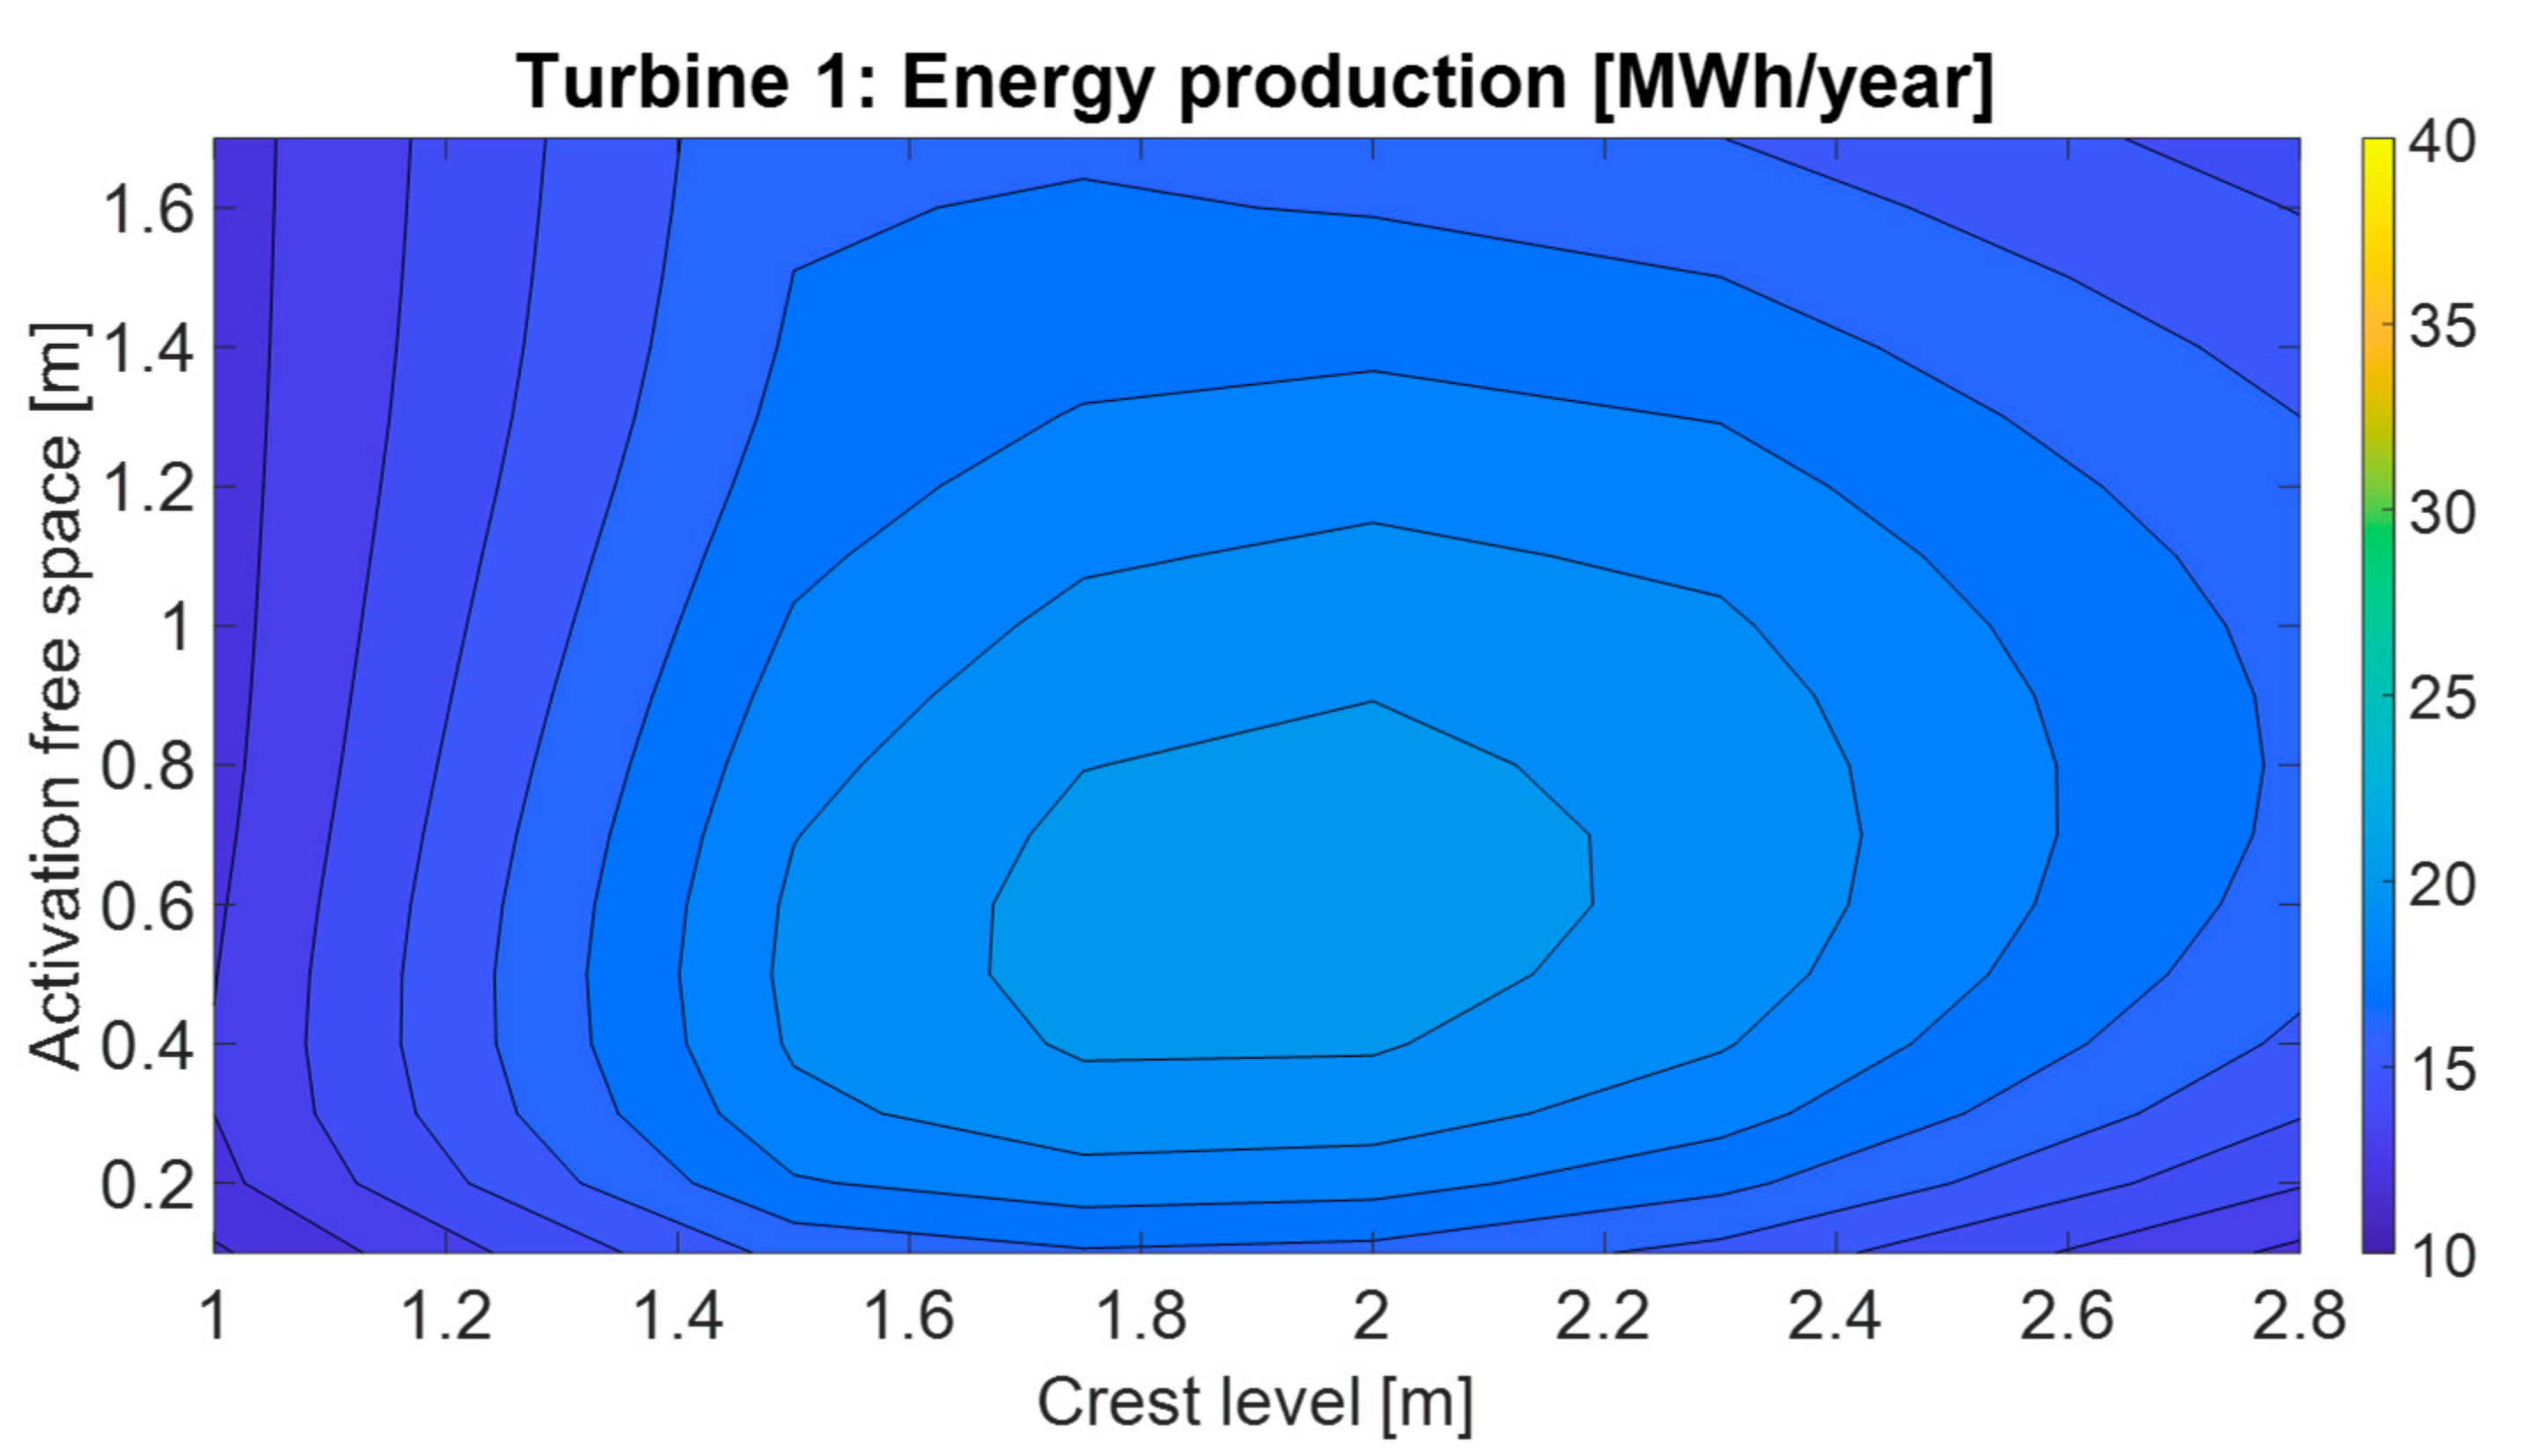
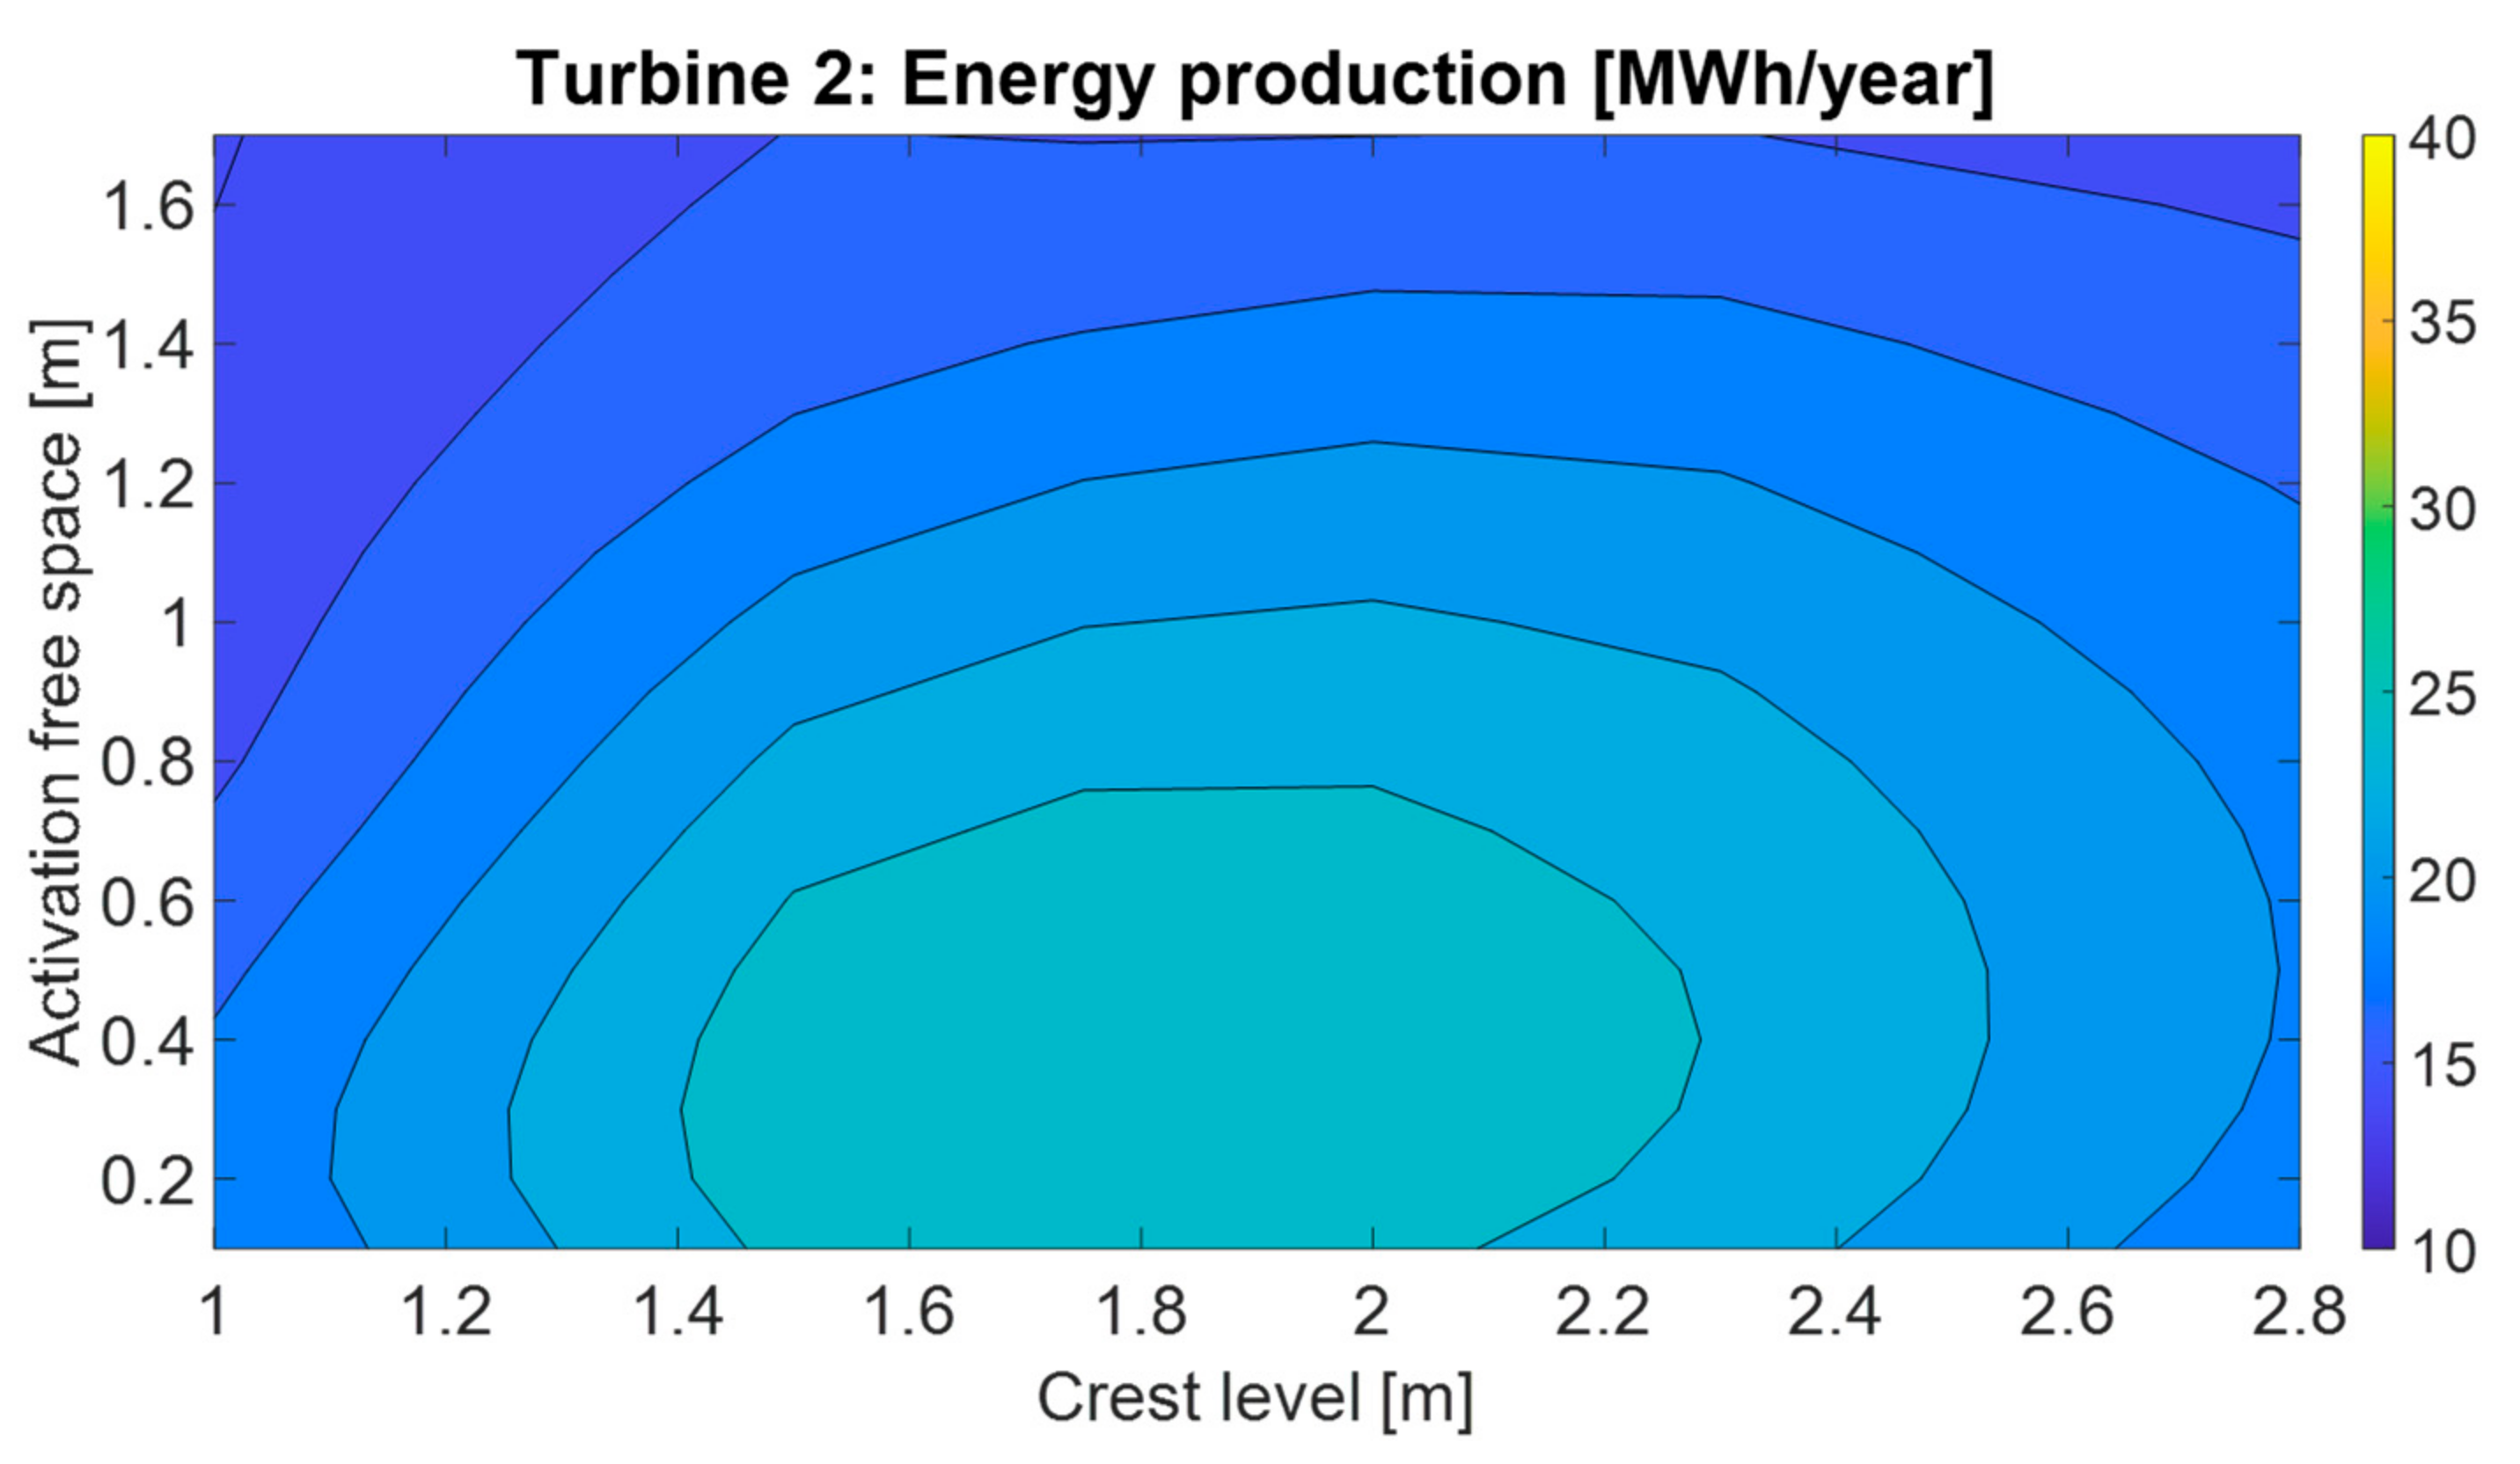
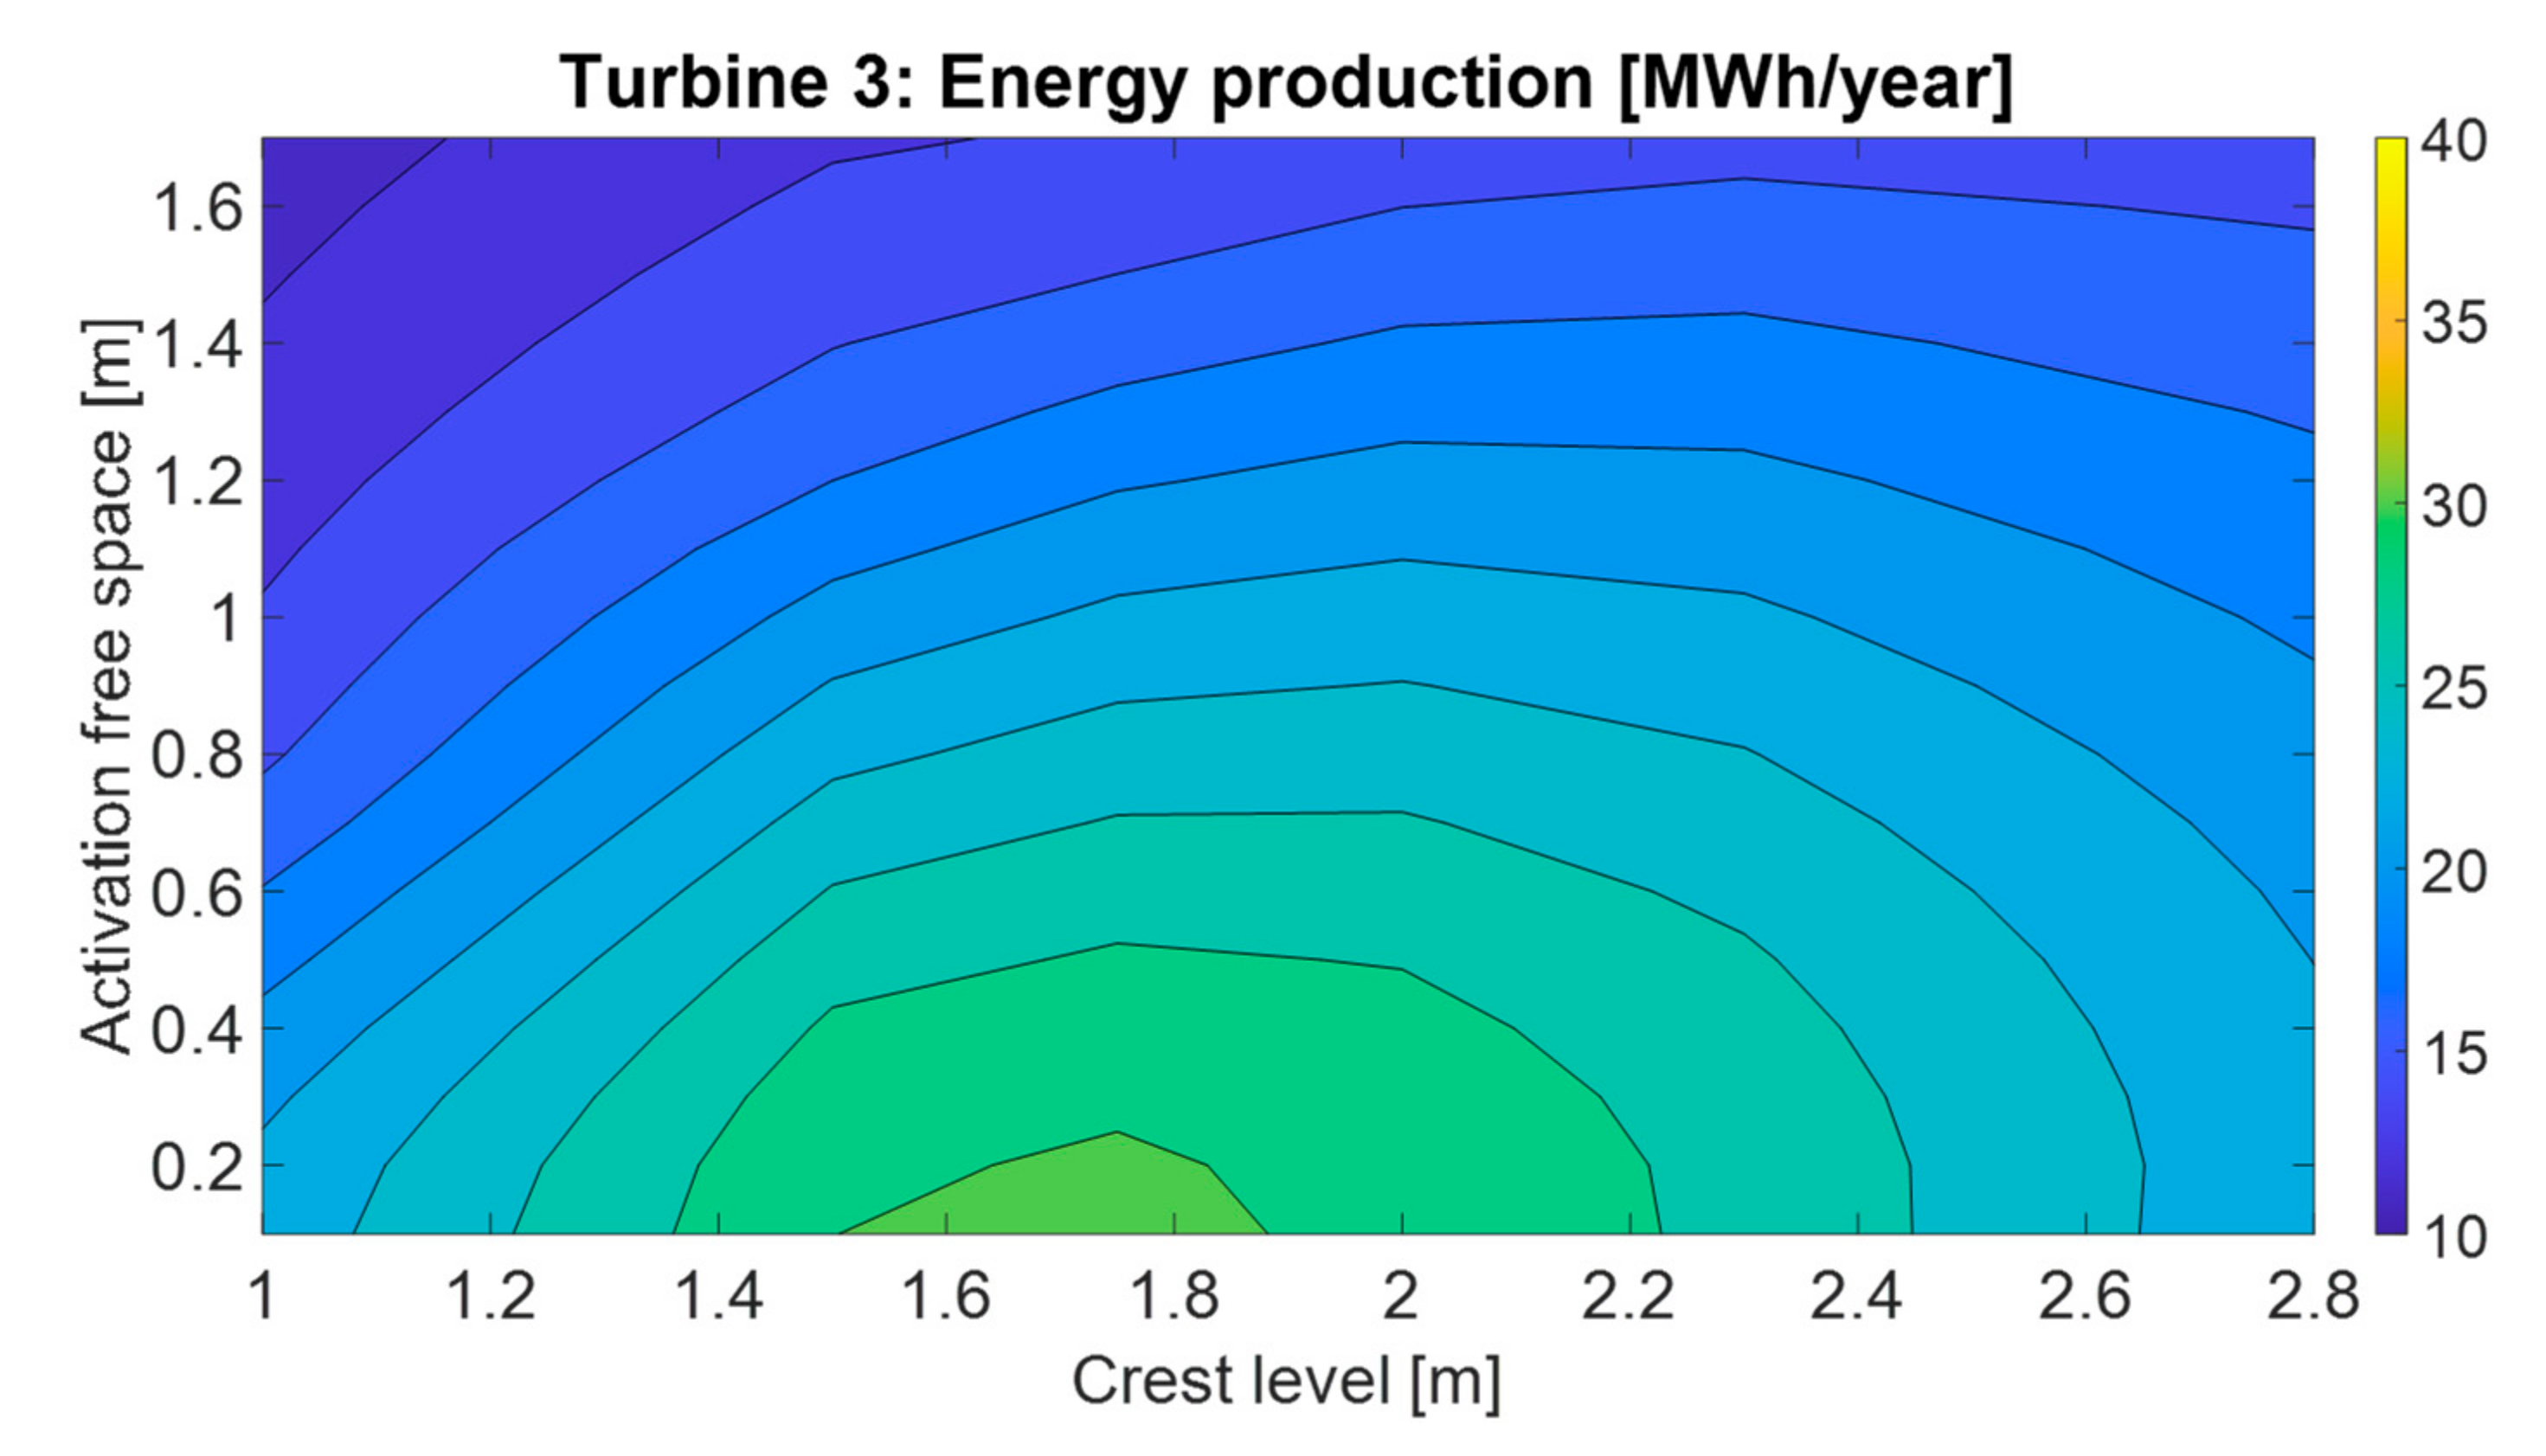
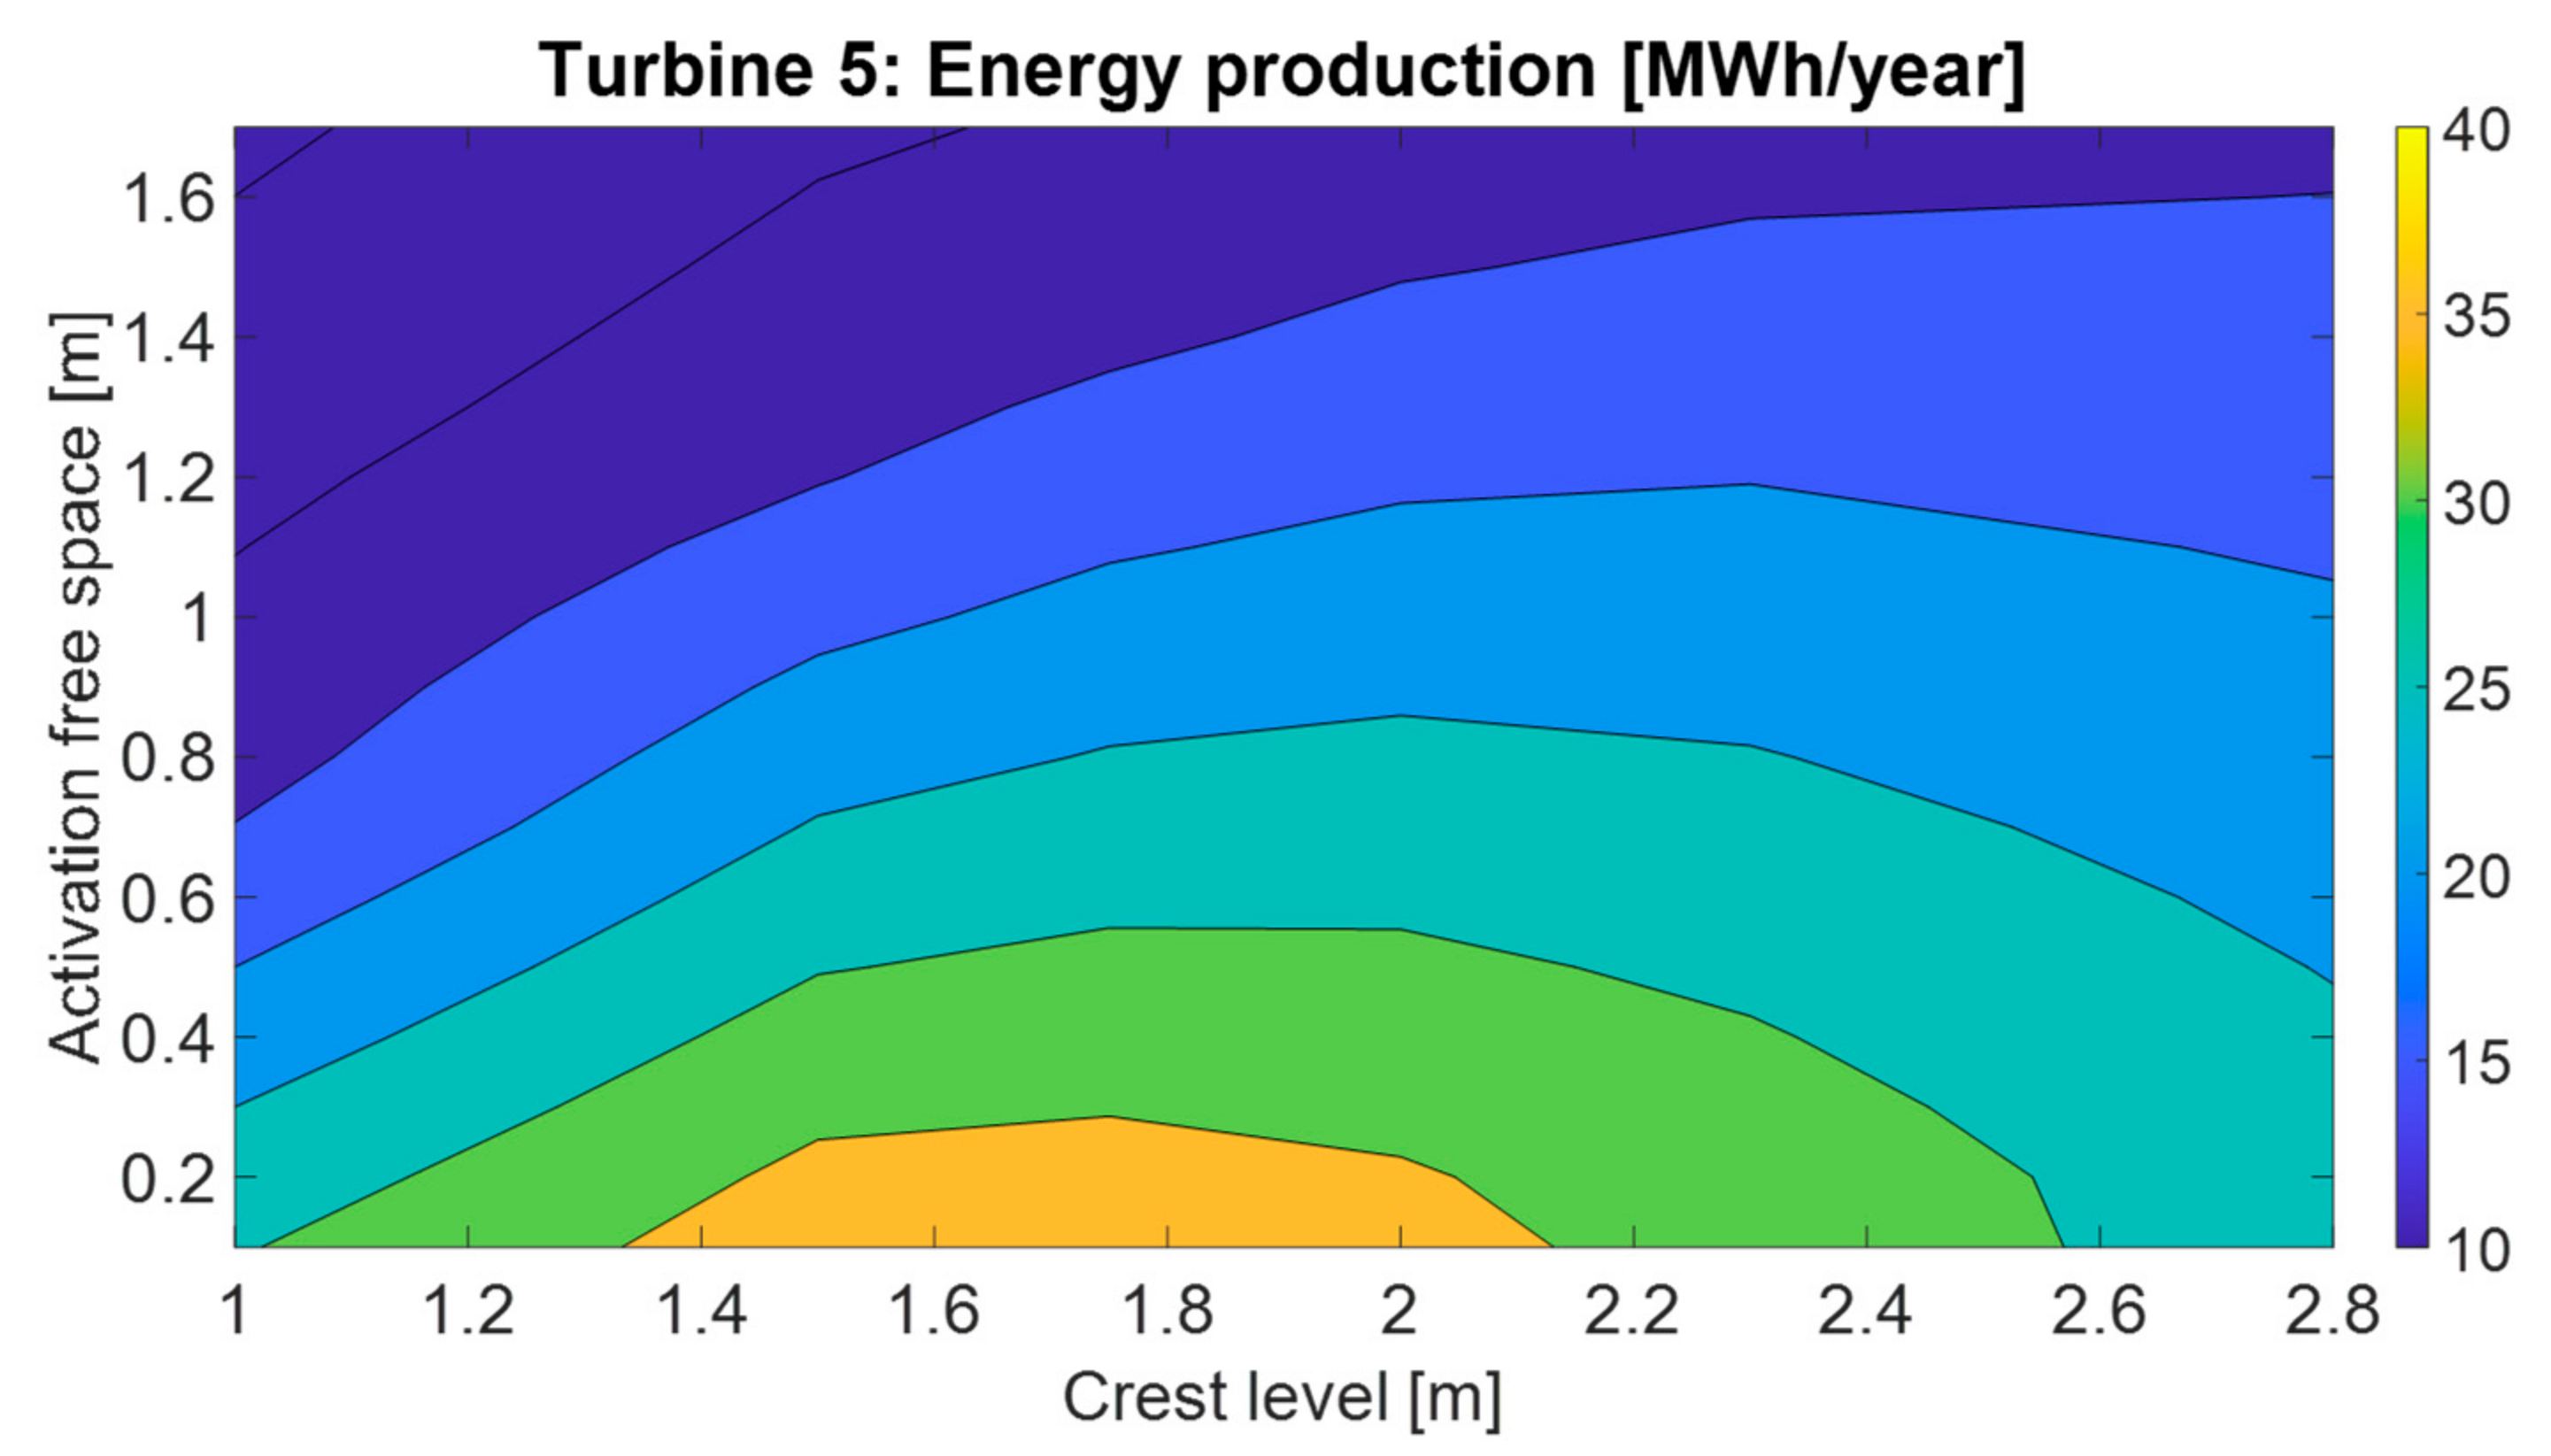
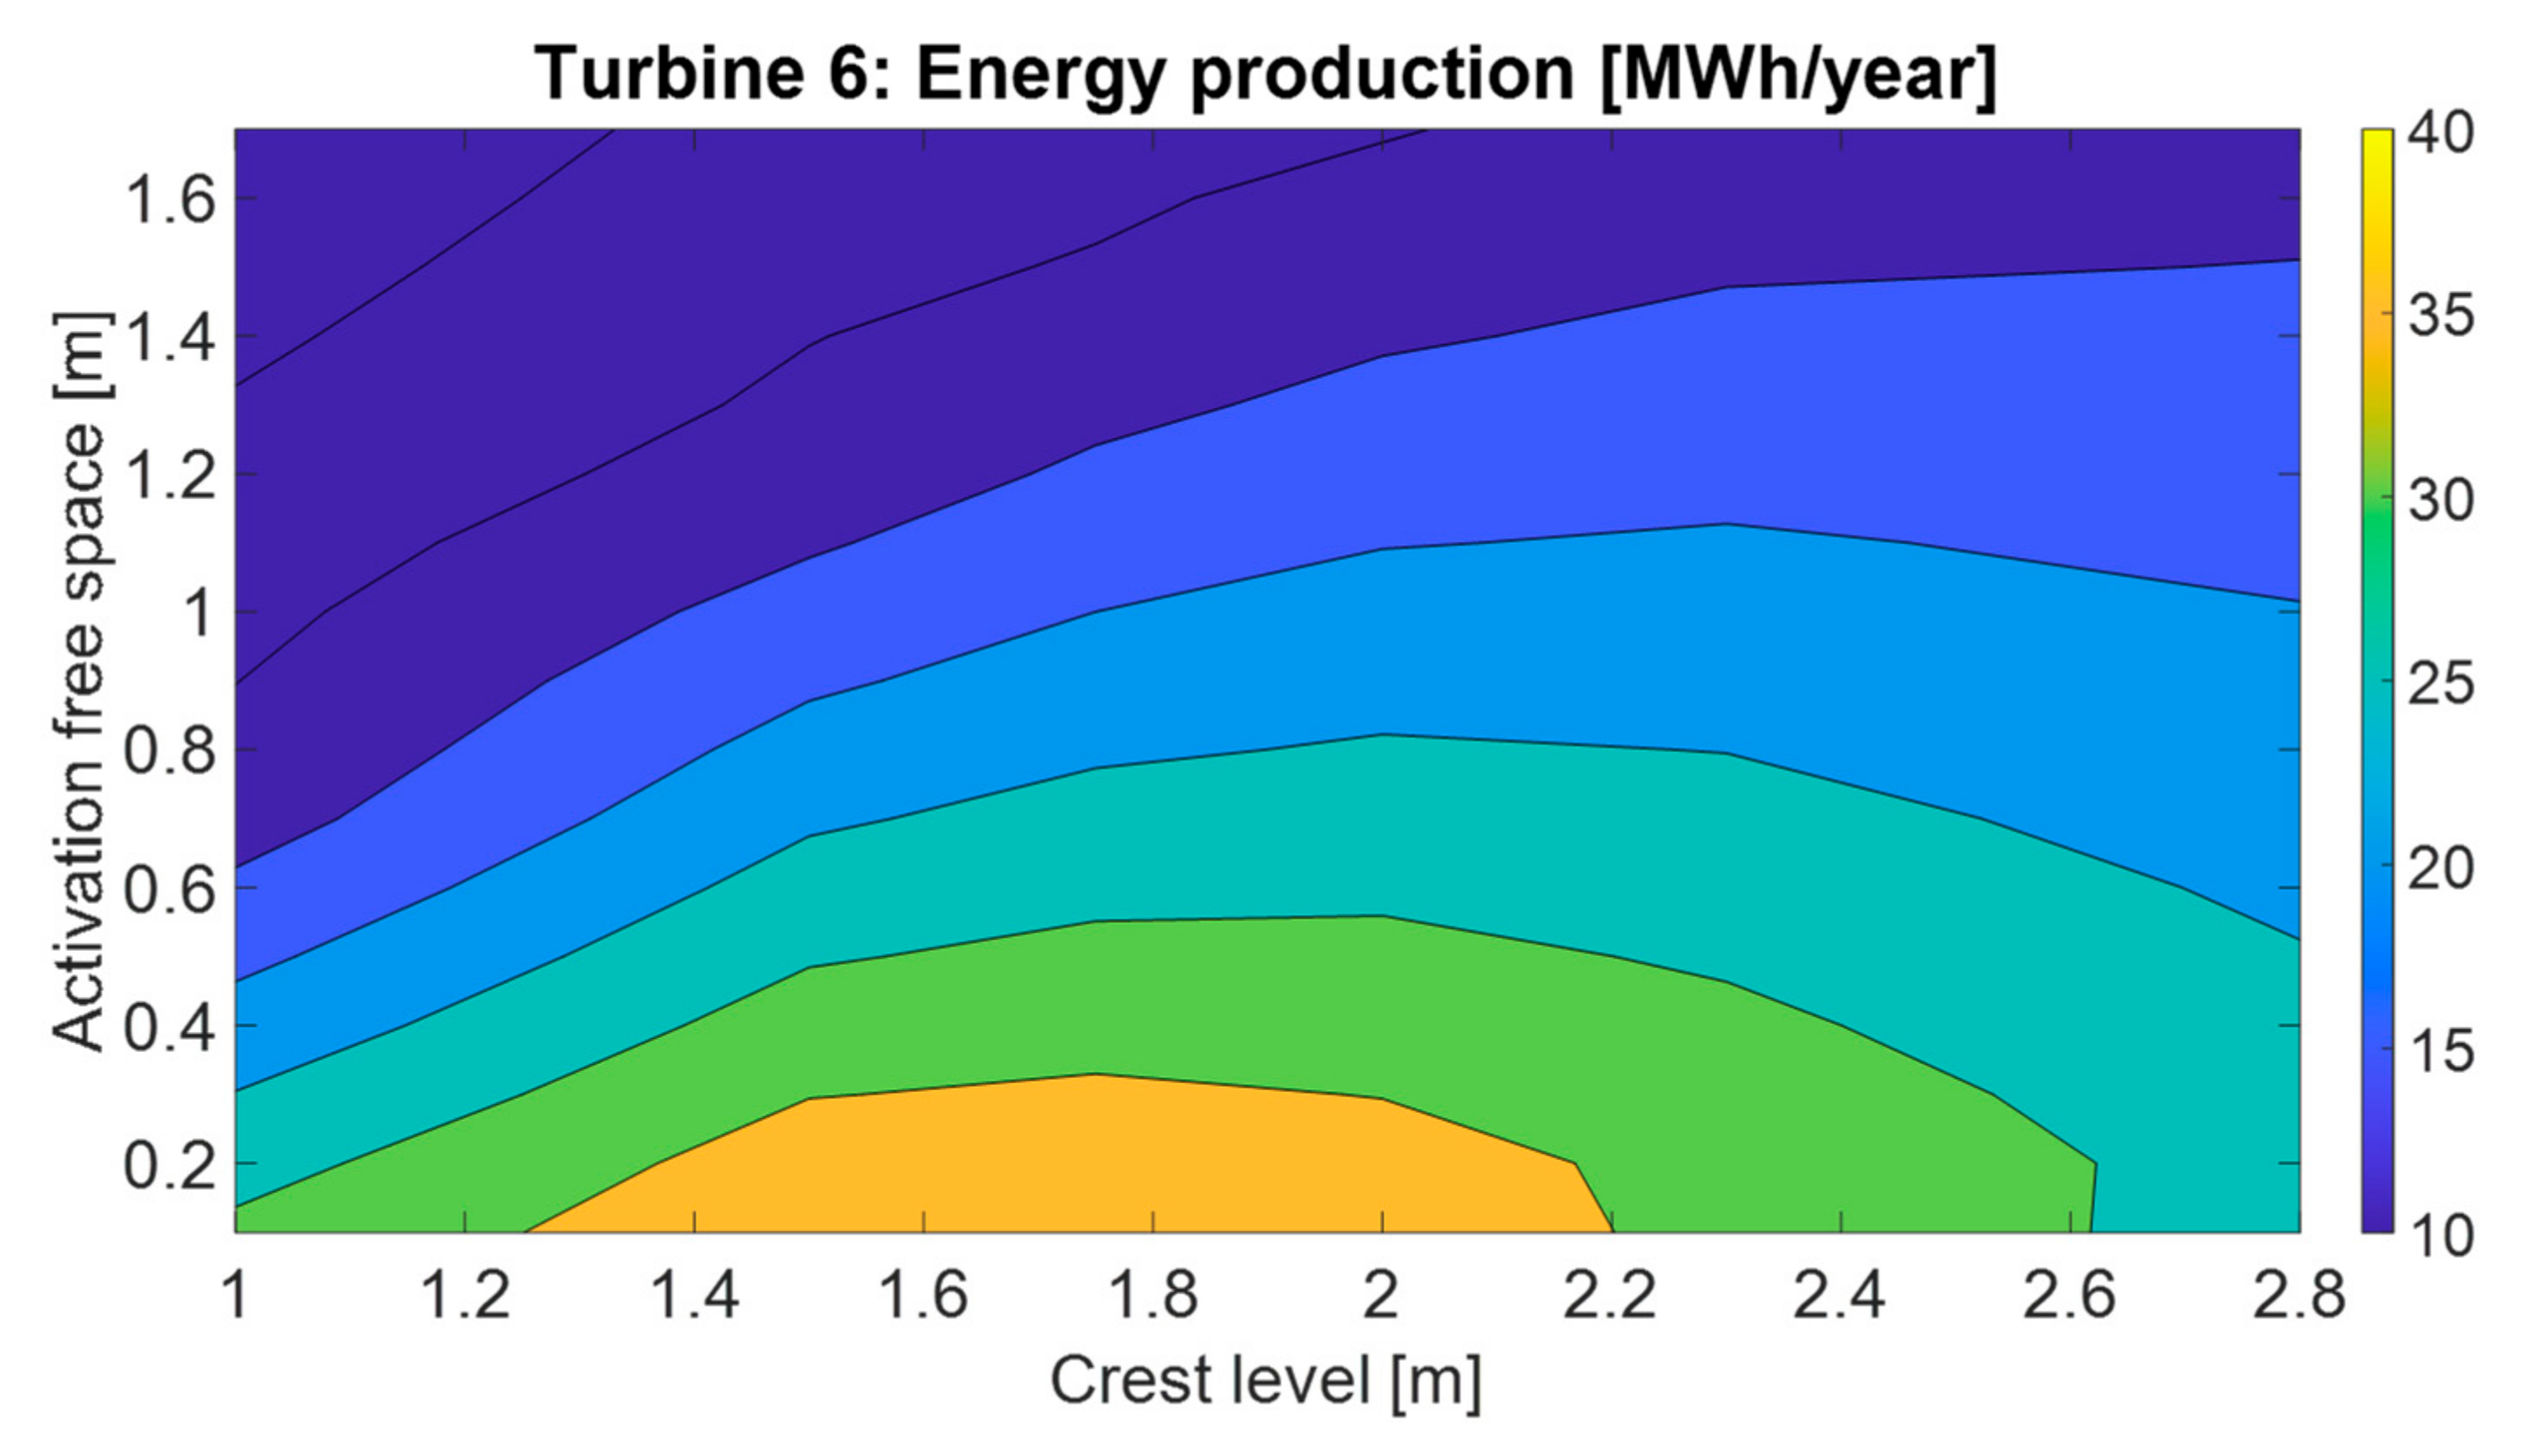
3. Results

This section describes the results of the simulations for the sea states reported in Table 4. Simulations were performed considering six axial-flow turbines with a runner diameter ranging from 0.5 m to 1.7 m, to evaluate the effect of the turbine flow rate on the head in the reservoir and the resulting produced energy. In this section the model input characteristics are presented together with simulation results.
Figure 5 shows the normalized turbine discharge Qnorm versus head, being Qnorm defined according to the following equation:
Q n o r m = Q Q r e f
being Q the actual turbine discharge, Qref the turbine reference discharge, calculated as:
Q r e f = c x · Ω
being cx the axial component of the velocity at design point and Ω the runner cross-sectional area. The turbine rotational speed is variable according to the head to retain the similitude of velocity triangles. Table 5 reports the runner diameter and Qref for the considered turbines.
Turbine efficiency ηt versus the normalized discharge Qnorm is reported in Figure 6. The curve is the same for all six turbines, being the effect of the runner diameter on the hydraulic losses negligible. This assumption is valid because the runner diameter variation between turbine 1 and turbine 6 is small [46]. The efficiency characteristic is affected by the incidence of mechanical losses, which have been considered independent from the flow rate [47].
Both discharge and efficiency characteristics have been used as input for the simulation model.
The system performance was studied varying the ramp crest level hcr and the control strategy for all turbines. The variation of hcr has a direct impact on the water flow into the reservoir which, conversely, is not affected by the turbine runner diameter. hcr also determines the maximum head for turbine operation. The control strategy defines the head for turbine activation/deactivation. In fact, being the water flow discontinuous and dependent on the sea state, it is of interest to allow turbine operation only if the head is above a certain value. This way, the turbine operates at higher efficiency conditions, Figure 6. However, if the free space f (the elevation difference between the ramp crest level and the head H in the reservoir, Figure 4) is too small and consequently the turbine does not operate for head values below the defined threshold, there can be water loss due to overflow. This condition happens when the free space f is not enough for receiving the water flow coming from the next wave. The optimal control strategy balances the two effects, that is a high-head turbine operation, minimizing water overflow.
The yearly energy produced by each turbine is reported as a function of fa and hcr from Figure 7, Figure 8, Figure 9, Figure 10, Figure 11, Figure 12 and Figure 13. The results show that both design parameters strongly influence the system performance. As turbine runner diameter increases, the energy production maximizes for lower fa values, i.e., the turbine operates for head values closer to the crest level. Consequently, the turbine operates with higher efficiency. In fact, as the turbine gets larger, it can process a higher flow rate for a fixed value of H. This allows the adoption of a small free space for turbine control without water overflow. An activation head lower than 80% of the crest level has been imposed to prevent a too short turbine operational time, which would cause frequent transient conditions. The results show that the energy production E ranges from 20.5 MWh/y for Turbine 1 with hcr = 2.0 m and fa = 0.6 m to 34.8 MWh/y for Turbine 6, with hcr = 1.5 m and fa = 0.3 m. The reduction of the optimal crest level for maximum energy production as turbine runner diameter increases is due to the potential of a larger turbine to process a higher flow rate. In fact, the water flow into the reservoir is higher for smaller crest levels but, conversely, the maximum head consequently reduces. The trade-off between the waterflow trough turbine and the average turbine efficiency (function of the head) determines the optimal configuration. The trend is visible in Figure 13 reporting the energy produced as a function of turbine runner diameter and crest level for the optimal turbine control strategy, i.e., for the free space maximizing the energy production. For hcr < 1.5 m, the energy production reduces also for turbine 6 because the reduction of the turbine efficiency caused by a lower head prevails on the increase of the waterflow through turbine. As turbine runner diameter increases, so does the ramp crest level. The turbine-on percentage time was also considered as a design parameter for OBREC optimization, as it reduces as the runner diameter becomes larger, Figure 14. This necessity was also recognized by Cavallaro et al. [24]. In their study the authors observed that the increase of the number of active turbines led to a reduction of the percentage of time during which the system operated, with a consequent reduction of the produced energy. Additionally, the lowest admissible turbine-on time should take into consideration the increase of maintenance costs caused by prolonged periods of standstill and frequent transients.
The average value of turbine efficiency is reported in Figure 15, as a function of the turbine runner diameter. It demonstrates that all turbines operate in a range of conditions close to the maximum efficiency, due to the optimized control strategy and the adoption of an appropriate crest level. The increase of the runner diameter allows to produce more energy due to the ability of processing a higher flow rate, i.e., reducing water overflow, Figure 16.
The average system efficiency ηOBREC is reported in Figure 17 as a function of the turbine runner diameter. The efficiency increases with the runner diameter due to the combined effect of the of water overflow and water through turbine. The maximum system efficiency of 4.2% demonstrated that the OBREC reservoir design is not optimized for energetic sea states as those considered in this study. In fact, a wider reservoir would have allowed a higher system efficiency, while the adopted reservoir would perform better in a mild wave climate, with nearshore wave power of 4–10 kW/m.

4. Conclusions

This paper presents the results of a multivariable optimization aimed at estimating the effects of crest level, turbine runner diameter and turbine control strategy on the performance of an Overtopping BReakwater for Energy Conversion (OBREC) device, located at San Antonio Port, Chile. Energy production has been determined comparing axial-flow turbines of different runner diameters. The ramp crest level and the turbine control strategy have been optimized for each turbine. Results demonstrated that all parameters strongly influence system performance and the optimal setup changes as the runner diameter is varied. In fact, as turbine runner diameter increases, the activation free space which maximizes the energy production reduces, meaning that the turbine operates for head values close to the crest level. Consequently, the turbine operates in a portion of the characteristic curve where the efficiency is high. The energy production was 20.5 MWh/y for the smallest turbine (Turbine 1) for a crest level of 2 m and an activation free space of 0.6 m and reached a maximum of 34.8 MWh/y for the largest turbine (Turbine 6) for a crest level of 1.5 m and an activation free space of 0.3 m. The reduction of the optimal crest level for maximum energy production as turbine runner diameter increases is due to the potential of a larger turbine of processing a higher flow rate. In fact, for a small free space, the reservoir has less capacity for storing the water coming from the next wave and if the turbine is not able to process it there will be water overflow, with a consequent energy loss. The trade-off between the waterflow trough turbine and the average turbine efficiency (function of the head) determines the optimal crest level for the specified turbine. The average system efficiency ranged from 2.5% to 4.2% showing an increasing trend with the runner diameter.
Results also demonstrated that the turbine-on percentage time must be considered for the evaluation of the candidate OBREC configurations. In fact, prolonged period of standstill or frequent on-off transients would result in increased maintenance costs and reduced system durability. Results also indicated that for energetic sea states, as for the site considered in this article, the reservoir capacity should be designed for limiting head fluctuations.
The proposed approach can be applied for any site, once the local wave climate is available.

Author Contributions

Conceptualization, A.M., P.C. and A.U.; methodology, A.M. and A.U.; numerical analysis, A.M., G.C. and P.C.; validation, A.M. and A.U.; investigation, A.M. and G.C.; data curation, A M.; writing—original draft preparation, A.M., G.C. and P.C.; writing—review and editing, A.M., G.C. and A.U.; supervision, C.G. and D.V.; project administration, F.C., C.G. and D.V.; funding acquisition, D.V. and P.C. All authors have read and agreed to the published version of the manuscript.

Funding

The present research is part of the “Ricerca di Sistema” project (RSE—PTR 2019/2021, 1.8 “Energia elettrica dal mare”), funded by Italian Ministry of Economic Development (MISE).

Institutional Review Board Statement

Not applicable.

Informed Consent Statement

Not applicable.

Acknowledgments

Authors gratefully acknowledges the Italian Ministry of University and Research (MUR) for supporting this innovative research through “A.I.M.—Attrazione e Mobilità Internazionale” project, within the National Operational Program for “Research and Innovation” (PON R&I 2014-2020).

Conflicts of Interest

The authors declare no conflict of interest.

References

  1. Aderinto, T.; Li, H. Ocean Wave energy converters: Status and challenges. Energies 2018, 11, 1250. [Google Scholar] [CrossRef] [Green Version]
  2. Falcao, A. Modelling and control of oscillating-body wave energy converters with hydraulic power take-off and gas accumulator. Ocean Eng. 2007, 34, 2021–2032. [Google Scholar] [CrossRef]
  3. Fernandez, H.; Iglesias, G.; Carballo, R.; Castro, A.; Fraguela, J.A.; Taveira-Pinto, F.; Sanchez, M. The new wave energy converter WaveCat: Concept and laboratory tests. Mar. Struct. 2012, 29, 58–70. [Google Scholar] [CrossRef]
  4. Vicinanza, D.; Contestabile, P.; Quvang Harck Nørgaard, J.; Lykke Andersen, T. Innovative rubble mound breakwaters for overtopping wave energy conversion. Coast. Eng. 2014, 88, 154–170. [Google Scholar] [CrossRef]
  5. Contestabile, P.; Crispino, G.; Di Lauro, E.; Ferrante, V.; Gisonni, C.; Vicinanza, D. Overtopping breakwater for wave Energy Conversion: Review of state of art, recent advancements and what lies ahead. Renew. Energy 2020, 147, 705–718. [Google Scholar] [CrossRef]
  6. Boren, B.C.; Lomonaco, P.; Batten, B.A.; Paasch, R.K. Design, Development, and Testing of a Scaled Vertical Axis Pendulum Wave Energy Converter. IEEE Trans. Sustain. Energy 2017, 8, 155–163. [Google Scholar] [CrossRef]
  7. Patrizi, N.; Pulselli, R.M.; Neri, E.; Niccolucci, V.; Vicinanza, D.; Contestabile, P.; Bastianoni, S. Lifecycle environmental impact assessment of an overtopping wave energy converter embedded in breakwater systems. Front. Energy Res. 2019, 7, 1–10. [Google Scholar] [CrossRef] [Green Version]
  8. Vicinanza, D.; Di Lauro, E.; Contestabile, P.; Gisonni, C.; Lara, J.L.; Losada, I.J. Review of Innovative Harbor Breakwaters for Wave-Energy Conversion. J. Waterw. Port. Coast. Ocean Eng. 2019, 145, 1–18. [Google Scholar] [CrossRef]
  9. Contestabile, P.; Crispino, G.; Russo, S.; Gisonni, C.; Cascetta, F.; Vicinanza, D. Crown wall modifications as response towave overtopping under a future sea level scenario: An experimental parametric study for an innovative composite seawall. Appl. Sci. 2020, 10, 2227. [Google Scholar] [CrossRef] [Green Version]
  10. Iuppa, C.; Cavallaro, L.; Musumeci, R.E.; Vicinanza, D.; Foti, E. Empirical overtopping volume statistics at an OBREC. Coast. Eng. 2019, 152, 103524. [Google Scholar] [CrossRef]
  11. Palma, G.; Formentin, S.M.; Zanuttigh, B.; Contestabile, P.; Vicinanza, D. Numerical simulations of the hydraulic performance of a breakwater-integrated overtopping wave energy converter. J. Mar. Sci. Eng. 2019, 7, 38. [Google Scholar] [CrossRef] [Green Version]
  12. Rosa-Santos, P.; Taveira-Pinto, F.; Clemente, D.; Cabral, T.; Fiorentin, F.; Belga, F.; Morais, T. Experimental study of a hybrid wave energy converter integrated in a harbor breakwater. J. Mar. Sci. Eng. 2019, 7, 33. [Google Scholar] [CrossRef] [Green Version]
  13. Palma, G.; Formentin, S.M.; Zanuttigh, B.; Contestabile, P.; Vicinanza, D. Design optimization of a multifunctional wave energy device. In Progress in Renewable Energies Offshore, Proceedings of the 2nd International Conference on Renewable Energies Offshore (RENEW2016), Lisbon, Portugal, 24–26 October 2016; Taylor & Francis Group: London, UK, 2016; pp. 235–240. [Google Scholar] [CrossRef]
  14. Di Lauro, E.; Lara, J.L.; Maza, M.; Losada, I.J.; Contestabile, P.; Vicinanza, D. Stability analysis of a non-conventional breakwater for wave energy conversion. Coast. Eng. 2019, 145, 36–52. [Google Scholar] [CrossRef]
  15. Senior, J.; Saenger, N.; Müller, G. New hydropower converters for very low-head differences. J. Hydraul. Res. 2010, 48, 703–714. [Google Scholar] [CrossRef]
  16. Quaranta, E. Optimal Rotational Speed of Kaplan and Francis Turbines with Focus on Low-Head Hydropower Applications and Dataset Collection. J. Hydraul. Eng. 2019, 145, 1–5. [Google Scholar] [CrossRef]
  17. Knapp, W.; Holmén, E.; Schilling, R. Considerations for Water Turbines to be used in Wave Energy Converters. In Proceedings of the Fourth European Wave Energy Conference, Aalborg, Denmark, 4–6 December 2000. [Google Scholar]
  18. Aderinto, T.; Li, H. Review on power performance and efficiency of wave energy converters. Energies 2019, 12, 4329. [Google Scholar] [CrossRef] [Green Version]
  19. dos Santos, E.D.; Machado, B.N.; Zanella, M.M.; Das Neves Gomes, M.; Souza, J.A.; Isoldi, L.A.; Rocha, L.A.O. Numerical study of the effect of the relative depth on the overtopping wave energy converters according to constructal design. Defect Diffus. Forum 2014, 348, 232–244. [Google Scholar] [CrossRef]
  20. Musa, M.A.; Maliki, A.Y.; Ahmad, M.F.; Yaakob, O.; Samo, K.B.; Ibrahim, M.Z. Prediction of energy performance by adopting overtopping breakwater for energy conversion (OBREC) concept in Malaysia waters. J. Environ. Sci. Technol. 2016, 9, 417–426. [Google Scholar] [CrossRef] [Green Version]
  21. Kralli, V.E.; Theodossiou, N.; Karambas, T. Optimal Design of Overtopping Breakwater for Energy Conversion (OBREC) Systems Using the Harmony Search Algorithm. Front. Energy Res. 2019, 7, 1–11. [Google Scholar] [CrossRef] [Green Version]
  22. Calheiros-Cabral, T.; Clemente, D.; Rosa-Santos, P.; Taveira-Pinto, F.; Ramos, V.; Morais, T.; Cestaro, H. Evaluation of the annual electricity production of a hybrid breakwater-integrated wave energy converter. Energy 2020, 213, 118845. [Google Scholar] [CrossRef]
  23. Victor, L.; Troch, P.; Kofoed, J.P. On the effects of geometry control on the performance of overtopping wave energy converters. Energies 2011, 4, 1574–1600. [Google Scholar] [CrossRef] [Green Version]
  24. Cavallaro, L.; Iuppa, C.; Castiglione, F.; Musumeci, R.E.; Foti, E. A simple model to assess the performance of an overtopping wave energy converter embedded in a port breakwater. J. Mar. Sci. Eng. 2020, 8, 858. [Google Scholar] [CrossRef]
  25. Cumbajín, M.; Sánchez, P.; Hidalgo, A.; Gordón, C. Multi-criteria analysis of turbines for pico-hydro power plant in water irrigation channel. Adv. Intell. Syst. Comput. 2020, 1137 AISC, 200–209. [Google Scholar] [CrossRef]
  26. Williamson, S.J.; Stark, B.H.; Booker, J.D. Low head pico hydro turbine selection using a multi-criteria analysis. Renew. Energy 2014, 61, 43–50. [Google Scholar] [CrossRef]
  27. Di Lauro, E.; Contestabile, P.; Vicinanza, D. Wave Energy in Chile: A Case Study of the Overtopping Breakwater for Energy Conversion (OBREC). In Proceedings of the 12th European Wave and Tidal Energy Conference, Cork, Ireland, 27 August–1 September 2017; Volume 27. [Google Scholar]
  28. European Centre for Medium-Range Weather Forecasts (ECMWF). Available online: https://climate.copernicus.eu/climate-reanalysis (accessed on 30 March 2021).
  29. Mazzaretto, O.M.; Lucero, F.; Besio, G.; Cienfuegos, R. Perspectives for harnessing the energetic persistent high swells reaching the coast of Chile. Renew. Energy 2020, 159, 494–505. [Google Scholar] [CrossRef]
  30. Lucero, F.; Catalán, P.A.; Ossandón, Á.; Beyá, J.; Puelma, A.; Zamorano, L. Wave energy assessment in the central-south coast of Chile. Renew. Energy 2017, 114, 120–131. [Google Scholar] [CrossRef]
  31. Paredes, J.; Cruz, J.; Thomson, M.D.; Stavroulia, E.R.-S.R. Preliminary Site Selection—Key to Document Classification; Garrad Hassan and Partners Limited: Bristol, UK, 2009. [Google Scholar]
  32. Bay, B.; Sea, T.; Contestabile, P.; Conversano, F.; Centurioni, L.; Golia, U.M.; Musco, L.; Danovaro, R.; Vicinanza, D. Multi-Collocation-Based Estimation of Wave Climate in a Non-Tidal Bay: The Case Study. Water 2020, 12, 1936. [Google Scholar]
  33. Monárdez, P.; Acuña Hugo, S.D. Evaluation of the potential of wave energy in Chile. In Proceedings of the ASME 27th International Conference on Offshore Mechanics and Arctic Engineering, Estoril, Portugal, 15–20 June 2008. [Google Scholar]
  34. Mediavilla, D.G.; Sepúlveda, H.H. Nearshore assessment of wave energy resources in central Chile (2009–2010). Renew. Energy 2016, 90, 136–144. [Google Scholar] [CrossRef]
  35. Dee, D.P.; Uppala, S.M.; Simmons, A.J.; Berrisford, P.; Poli, P.; Kobayashi, S.; Andrae, U.; Balmaseda, M.A.; Balsamo, G.; Bauer, P.; et al. The ERA-Interim reanalysis: Configuration and performance of the data assimilation system. Q. J. R. Meteorol. Soc. 2011, 137, 553–597. [Google Scholar] [CrossRef]
  36. HR Wallingford to Undertake Studies for San Antonio Port Expansion Project. Available online: https://www.hrwallingford.com/news/hr-wallingford-to-undertake-studies-for-san-antonio-port-expansion-project (accessed on 5 May 2021).
  37. Cornett, A. A global wave energy resource assessment. Sea Technol. 2008, 50, 59–64. [Google Scholar]
  38. Contestabile, P.; Ferrante, V.; Vicinanza, D. Wave energy resource along the coast of Santa Catarina (Brazil). Energies 2015, 8, 14219–14243. [Google Scholar] [CrossRef] [Green Version]
  39. Contestabile, P.; Di Lauro, E.; Galli, P.; Corselli, C.; Vicinanza, D. Offshore Wind and wave energy assessment around Malè and Magoodhoo Island (Maldives). Sustainability 2017, 9, 613. [Google Scholar] [CrossRef] [Green Version]
  40. DHI. Available online: https://www.dhigroup.com (accessed on 30 March 2021).
  41. GEBCO. Available online: https://download.gebco.net/ (accessed on 30 March 2021).
  42. Jensen, P.M.; Gilling, L.; Kofoed, J.P. User Manual for SSG Power Simulation 2; Technical Report; Department of Civil Engineering, Aalborg Universit: Aalborg, Denmark, 2006. [Google Scholar]
  43. Bogarino, B.; Kofoed, J.P.; Meinert, P. Development of a Generic Power Simulation Tool for Overtopping Based WEC; DCE Technical Report; Department of Civil Engineering, Aalborg Universit: Aalborg, Denmark, 2007. [Google Scholar]
  44. Contestabile, P.; Vicinanza, D. Coastal defence integrating wave-energy-based desalination: A case study in Madagascar. J. Mar. Sci. Eng. 2018, 6, 64. [Google Scholar] [CrossRef] [Green Version]
  45. Palma, G.; Contestabile, P.; Zanuttigh, B.; Formentin, S.M.; Vicinanza, D. Integrated assessment of the hydraulic and structural performance of the OBREC device in the Gulf of Naples, Italy. Appl. Ocean Res. 2020, 101, 1–14. [Google Scholar] [CrossRef]
  46. Dixon, S.L.; Hall, C.A. Fluid Mechanics and Thermodynamics of Turbomachinery; Elsevier Inc.: Burlington, MA, USA, 2010; ISBN 978-1-85617-793-1. [Google Scholar]
  47. Krivchenko, G. Hydraulic Machines: Turbines and Pumps; CRC Press Inc.: Boca Raton, FL, USA, 1993; ISBN 1-56670-001-9. [Google Scholar]
Figure 1. (a) ERA—Interim grid points (P1-P40) along the Chilean coast. (b) Map of the nearshore area with indication of the position of the point P20 (P20 from ERA5 dataset and nearshore point S are also depicted). (c) Detailed view of the study site showing location of the analyzed installation at San Antonio Port.
Energies 14 04618 g001
Figure 2. ECMWF grid points along the Chilean coast, with indication of contour lines of the averaged offshore wave power flux per unit of wave-crest length.
Energies 14 04618 g002
Figure 3. Bathymetry of the study area. The blue circle represents the point S, where nearshore wave data are extracted.
Energies 14 04618 g003
Figure 4. OBREC geometry layout and main notations.
Energies 14 04618 g004
Figure 5. Normalized flow rate characteristic as function of the head.
Energies 14 04618 g005
Figure 6. Turbine efficiency characteristic as function of the normalized flow rate.
Energies 14 04618 g006
Figure 7. Energy produced by Turbine 1 as a function of the activation free space fa and the crest level hcr.
Energies 14 04618 g007
Figure 8. Energy produced by Turbine 2 as a function of the activation free space fa and the crest level hcr.
Energies 14 04618 g008
Figure 9. Energy produced by Turbine 3 as a function of the activation free space fa and the crest level hcr.
Energies 14 04618 g009
Figure 10. Energy produced by Turbine 4 as a function of the activation free space fa and the crest level hcr.
Energies 14 04618 g010
Figure 11. Energy produced by Turbine 5 as a function of the activation free space fa and the crest level hcr.
Energies 14 04618 g011
Figure 12. Energy produced by Turbine 6 as a function of the activation free space fa and the crest level hcr.
Energies 14 04618 g012
Figure 13. Energy production as function of the crest level and turbine runner diameter.
Energies 14 04618 g013
Figure 14. Turbine-on time as a function of the turbine runner diameter, at optimal configuration.
Energies 14 04618 g014
Figure 15. Average turbine efficiency as a function of the turbine runner diameter, at optimal configuration.
Energies 14 04618 g015
Figure 16. Water flow through turbine and water overflow, as a function of the turbine runner diameter, at optimal configuration.
Energies 14 04618 g016
Figure 17. Average system efficiency as a function of the turbine runner diameter, at optimal configuration.
Energies 14 04618 g017
Table 1. Geographical information, main wave climate parameters, yearly average wave power and wave energy (based on 10-year average) at the ERA-Interim points P1–P40.
PointLatLonHs [m]Tm [s]θm [°]PmEw
[°][°]MeanMaxMeanMean[kW/m][MWh/(m∙y)]
118.75 S70.50 W1.83.9910.49214.521.2185.9
219.50 S70.50 W1.463.3210.49221.814.0122.8
320.25 S70.50 W1.463.3210.49221.814.0122.8
421.00 S70.50 W1.753.8310.29219.419.4170.2
521.75 S70.50 W1.423.3710.59226.913.4117.0
623.25 S71.25 W1.914.2910.36219.623.4204.9
724.00 S71.25 W1.944.5210.39220.524.1211.2
824.75 S71.25 W1.914.4510.38221.523.4204.8
925.50 S71.25 W1.94.2610.34222.823.0201.4
1026.25 S71.25 W1.844.1810.31224.921.5188.6
1127.00 S72.00 W2.235.1410.15219.830.9270.2
1227.75 S72.00 W2.194.9510.09220.629.8260.8
1328.50 S72.00 W2.174.7410.05221.829.0253.9
1429.25 S72.00 W2.144.7110.04223.228.1246.2
1530.00 S72.00 W2.084.810.04224.426.8234.4
1630.75 S72.00 W2.155.4410.02224.528.6250.3
1731.50 S72.00 W2.075.3610.09227.026.8235.1
1832.25 S72.00 W1.835.0210.24231.721.3186.3
1933.00 S72.75 W2.446.399.96225.236.4318.8
2033.75 S72.00 W2.135.959.95231.928.0245.1
2134.50 S72.75 W2.275.899.96233.231.9279.3
2235.25 S72.75 W2.275.899.96233.231.9279.3
2336.00 S73.50 W2.66.410.13230.042.5372.0
2436.75 S73.50 W2.326.110.17236.434.2299.8
2537.50 S74.25 W2.476.0210.26235.239.2343.2
2638.25 S74.25 W2.816.7310.34233.251.1447.3
2739.00 S74.25 W2.767.0210.37237.950.0437.7
2839.75 S74.25 W2.657.0310.34243.346.1404.1
2940.50 S74.25 W2.657.0310.34243.346.1404.1
3041.25 S74.25 W2.326.7510.45250.436.3317.7
3142.75 S75.00 W2.777.8110.16253.649.8435.8
3243.50 S75.00 W2.737.9810.02255.247.9420.0
3344.25 S75.00 W2.638.039.87257.443.7382.8
3445.00 S75.00 W2.417.669.82258.836.6320.7
3546.50 S76.50 W3.359.210.27256.874.2650.0
3648.00 S76.50 W3.359.5710.17261.874.1648.8
3750.25 S76.50 W3.6510.4710.02266.686.6758.9
3852.50 S75.75 W4.0512.6610.15266.3110.1964.2
3954.00 S74.25 W3.5110.579.52262.577.4678.4
4055.50 S70.50 W4.0912.8210.13265.1113.3992.3
Table 2. Main wave climate parameters for the extended dataset (from January 2007 to December 2020) for point P20, obtained from ERA-Interim and ERA5 datasets.
PointHs [m]Tm [s]Tp [s]θm [°]PmEw
MeanMeanMeanMean[kW/m][MWh/(m∙y)]
20 (ERA-Interim + ERA5)2.099.4212.66233.127.5240.8
Table 3. Main wave climate parameters, whole yearly average wave power, available yearly wave power (from the sector 225–315° N) and available yearly wave energy for study point S (San Antonio).
PointHs [m]Tm [s]Tp [s]θm [°]PmPm,aEw
MeanMeanMeanMean[kW/m][kW/m][MWh/(m∙y)]
S1.694.9812.64244.917.715.3134.1
Table 4. Simulated sea states for the case-study location.
No. [-]Hs [m]Tp [s]Prob [%]Ew [MWh/y]
10.102.50.11.00 · 10−3
20.505.70.13.20 · 10−2
30.757.00.43.53 · 10−1
41.008.04.68.33 · 100
51.259.016.75.28 · 101
61.509.925.01.25 · 102
71.7510.622.91.68 · 102
82.0011.414.61.50 · 102
92.2512.17.51.03 · 102
102.5012.73.96.98 · 101
112.7513.41.84.09 · 101
123.0013.91.23.39 · 101
133.5015.10.83.32 · 101
144.0016.10.42.32 · 101
Table 5. Runner diameter and reference discharge Qref for all considered turbines.
TurbineRummer Diameter [m]Qref [m3/s]
10.510.49
20.741.04
30.941.65
41.152.48
51.403.71
61.725.57
Publisher’s Note: MDPI stays neutral with regard to jurisdictional claims in published maps and institutional affiliations.

