Article

Duct Attachment on Improving Breaking Wave Zone Energy Extractor Device Performance

Quantum Wave Microscopy Unit, Okinawa Institute of Science and Technology Graduate University, 1919-1 Tancha, Onna-son, Okinawa 904-0495, Japan
*
Author to whom correspondence should be addressed.
Energies 2021, 14(19), 6428; https://doi.org/10.3390/en14196428
Submission received: 10 August 2021 / Revised: 27 September 2021 / Accepted: 28 September 2021 / Published: 8 October 2021

Abstract

:
A challenging wave energy converter design that utilized the denser energy part of the nearshore breaking wave zone to generate electricity was introduced in 2016 by Shintake. The Okinawa Institute of Science and Technology Graduate University’s project aims to take advantage of breaking wave energy to harness electricity. The 2016 version of the device consisted only of a bare turbine and power generator. Early exploration of the design recorded short periods and high impact wave pressures were experienced by the structure, with the turbine unable to harvest energy effectively. Additional structure to not only reduce incoming impact pressure but also increase the duration of water flow through the turbine was needed. These are the main reasons behind incorporating the duct attachment into the design. This paper show that the duct is capable of halving the impact pressure experienced by the turbine and can increase the energy exposure by up to 1.6 times the bare turbine configuration. Furthermore, it is also said that wave angle (β) = 40° is the critical angle, although the duct still increases wave energy exposure to the power take-off up to β = 60°.

1. Introduction

In 2020, the Japanese government pledged for Japan to be carbon neutral by 2050. This ambitious goal requires huge efforts from research and scientific communities to find more sustainable and renewable sources of electricity. It is estimated that Japan has up to 260 TWh/year of ocean energy within its reachable offshore (30 km off the coastline) [1]. That is roughly 40% of the country’s total electricity consumption per year and thus could provide a major contribution to this carbon-neutral goal. Takahashi and Adachi [2] estimate that around 7 kW/m of power hits Japan’s coastline every year. Sasaki [3] further analyzed long-term wave data across Japan at 25 different locations from 1980 to 2009—and found that there was an increasing trend of wave energy, especially around Okinawa Prefecture, by about 0.4 kW/m over the next 30 years. This data increases the appeal of using wave energy as a source of electricity.
There have been many attempts to harvest energy delivered by waves over the years with main focuses on oscillating water column (OWC) type and point absorber type wave energy converters (WEC), which deployed in the shallow water part of the ocean. In principle an OWC device takes advantage of the hydrodynamics changes induced by passing waves to oscillate the water column inside the OWC structure. This movement then forces the air to inhale into and exhale from the chamber. The power is generated by placing a power take-off (PTO) mechanism on the airways. In 2001, a groundbreaking OWC type WEC called Land Installed Marine Power Energy Transmitter (LIMPET) was installed in the Isle of Isla, Scotland, marking the first WEC device to be connected to the main power grid in the UK [1,2,3]. Together with the development of LIMPET, another near shore stand-alone OWC project was also started at Pico in the Azores, Portugal. The single 12 m × 12 m cross-section water column was rated at 400 kW and was completed in 1999 [4]. After almost 20 years of operation, the project was finally concluded in 2018 due to partial failure at the base of the structure as stated by WavEc’s latest press release. While generating less power than designed, both LIMPET and Pico power plant managed to show the reliability of wave energy. LIMPET, despite only generating 20% of its design capability, was operating for about 98% of its lifetime, with minimum down time, and was shown to be robust against any weather condition [5]. Pico power plant, furthermore, managed to produce energy output constantly for 400 h in November 2012 [4].
Previous experiences in designing, constructing, and operating a stand-alone wave energy converter have shown the cost to be very high. The latest report shows electricity generation costs of about EUR 330–630 per MWh, which is significantly higher than other renewable energies such as wind and solar power [6]. Because of this, recent developments concerning combining a much-needed coastal defense structure, such as breakwater or seawall, and a wave energy converter have been growing in popularity. In Europe, the construction of the Mutriku Wave Energy plant at the Port of Mutriku, Basque Country, Spain, marked the world’s first grid connected integrated wave energy converter (WEC) in a vertical breakwater. This concept allows the cost to be split between energy generation and coastal defense. Furthermore, the way energy was harvested in this project does not interfere with the structure’s ability to protect the coastline and has a minimal impact on the original design of the breakwater [7]. Despite careful planning, however, the construction suffered from severe storm damages, which caused some of the WEC chamber to be exposed and partially destroyed. Subsequent studies found the structure experienced operational limits of wave pressure during each storm at least six times [8]. This emphasized the difficulties and the risk of installing such structures in a very energetic sea condition. Europe’s newest attempt at exploiting the wave energy to produce electricity is the currently constructed resonant wave energy converter (REWEC) or U-OWC project at the Port of Civitavecchia since 2011 [9,10,11]. The concept for U-OWC is very similar to conventional OWC, with an additional wall in front of the front wall forming a “U” shape. Early experiments showed that this configuration may lead to a higher absorption rate at a wider wave frequency range [12]. At the same, it is important to note that adding a wall that is separated with the main structure could only increase the difficulty and the cost of construction.
In addition to the fixed structures discussed so far, floating WEC has also been extensively explored over the past 20 years. Japan’s first floating OWC concept was tested in Gokasho Bay, Nansei Town, in September 1998. During open ocean testing, the so called “Mighty Whale” device managed to endure a typhoon induced sea condition with significant wave height and a period of 5.57 m and 12.5 s [13]. Unlike a standalone OWC device, a floating WEC can have two peak frequencies due to the movement of the water column chamber and the water column inside the chamber. This allows floating OWC devices to work better at a wider operating range [14]. Furthermore, due to its mobility, the device can be towed to a more energetic part of the ocean, although at the same this will increase the difficulty and the cost of the installation. This was proven by the failure experienced in both the GreenWAVE in Australia and the Ocean Swell Powered Renewable Energy 1, OSPREY 1, in Scotland. The former was a 1 MW floating WEC device built by Oceanlinx in 2014 and intended to be placed at Port McDonnell. Unfortunately, the device was damaged beyond repair during transport from Port Adelaide and failed to be installed [15]. The latter device, furthermore, experienced a similar fate. OSPREY 1 was built and installed near Dounreay, Scotland, in 1995, before it sank to the bottom of the ocean after being caught in the 3 m swell of Hurricane Felix, as reported by the Heralds [16].
Learning from past projects, several main obstacles faced by a deployment, or an implementation of a wave energy converter project were the production and installation cost, harsh environmental condition, and relatively low energy absorption efficiency. Aspects like the sheer size of the wave energy device and the difficult-to-reach deployment location were some of the biggest contributions to the high installation cost. These problems may be mitigated by utilizing simpler design, smaller size, and closer installation location. Based on these considerations, the Okinawa Institute of Science and Technology Graduate University (OIST) WEC design was design to be placed in the shallower part of the ocean where the waves sometime break. Because of this, it is better for the device not to be designed for very harsh sea conditions, but rather moderate sea conditions with typical significant wave heights of 0.75 m to 1.0 m.
When designing an effective wave energy extractor, one must consider the wave height, wave period, and direction of the wave [17], as an unfavorable wave angle could reduce the device’s performance by as much as 75% [18]. This condition is important as [19] argues that by 2042 the long wave, where the peak wave period Tp > 8 s, will become more frequent, so much so that the wave energy converter’s design made under current wave conditions may become less efficient in the future. This is critical as other coastal structures, such as seawalls and breakwaters, are designed to last centuries.
Unlike deep-water waves, once a wave travels to a shallower area, the wave diffracts due to the interaction between the wave and the seabed. This action forces the direction of the wave to be parallel with the shoreline. Furthermore, around the breaking wave zone area, the wavelength shortens, and the wave height increases due to shoaling, before it ultimately breaks. Following the linear wave theory, in shallow water, wave phase velocity also becomes independent of the wave period (T) and both the group velocity and phase velocity become similar. Thus, wave characteristics become much more uniform in shallow water surf zones, as they are less affected by deep-water sea characteristics. Due to this consideration, one can speculate that a device designed for a narrower band of wave characteristics when placed in this area may enable the device to work more efficiently during operational hours. The shape of the wave, furthermore, is slightly elongated as the water around the still water level travels faster than water near the seafloor. This condition means that the horizontal water flow is faster compared to the vertical motion of the water; therefore, a widely available horizontal axis-type turbine would be suitable to capture wave energy. This is the idea behind the breaking wave zone Wave Energy Converter (WEC) developed by the Okinawa Institute of Science and Technology Graduate University (OIST) [20]. Furthermore, since it is less likely to be affected by deep-sea waves, the same design may work well in many locations, as long as there are enough waves (energy) to justify the production and installation cost.
To take advantage of the breaking wave vortex, the diameter of the OIST WEC’s turbine is limited to the wave height. This relatively small dimension means that the OIST WEC is relatively cheaper to fabricate, easier to install, and can be located closer to the shore, thus reducing the cost further in both installation and maintenance, and in line with the lesson learned from the failures of WEC projects in the past. The power generator itself consists of a five-blade turbine which is directly connected to a permanent magnet generator. It is expected that the turbine will operate in harsh environments, so this configuration is expected to be able to withstand the breaking wave impact. To minimize the possibility of sea water entering the generator, the inside of the generator is filled with pressurized oil. More details of the turbine design and considerations can be seen in [21].
To select a suitable design for the intended testing location, an onsite wave measurement was done at the Port of Seragaki in October 2015. The measurement was recorded using five Teledyne RD Instrument Acoustic Doppler Current Profilers (ADCP) called workhorse sentinels. The recording frequency was 2 Hz for one month. It was found that the Port of Seragaki, Okinawa, has a horizontal velocity between 1.8 m/s to 3.5 m/s at a depth of 0.4 m. Furthermore, the significant wave height (Hs) of the location was also measured to be 1.7 m. For more details on this research, please see [22].
Based on the sea characteristics, the selected turbine was 700 mm in diameter and rated to generate 12 kW at peak power. The turbine characteristics are summarized in [23] and a preliminary field test on a 1:2 scale physical model was done in Maldives. The Maldives location was chosen due to its relatively uniform wave characteristics throughout the year (Tp = 9.8 s; 1.0 m < Hs < 2.0 m for 68% of the year) [
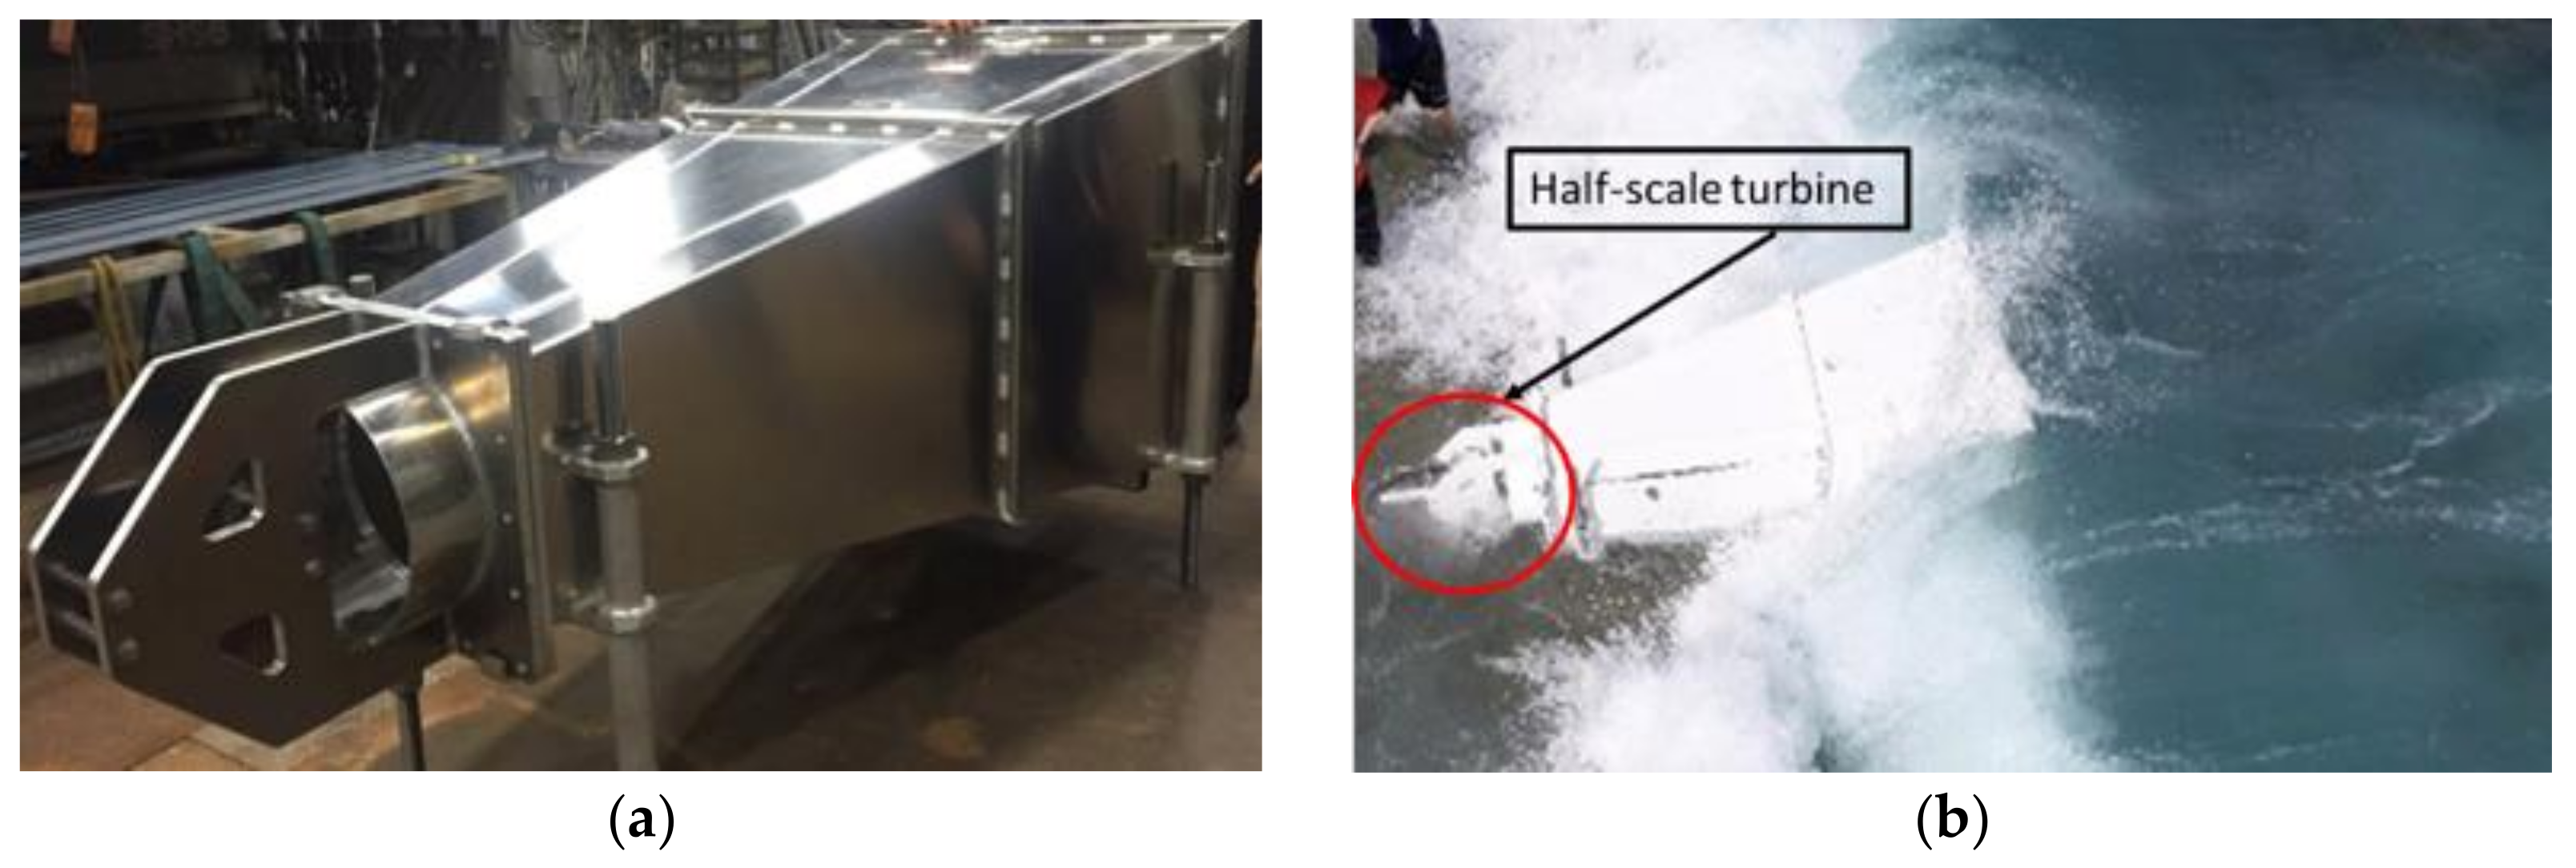
24]. Two half-scale physical models of the turbine tested here were located at the same distance from the shore, about 10 m distance between each model. Each model, however, was mounted at a different height. One was about 1 m from the seabed and roughly located just above the still water level during low tide. The other was mounted about 1.5 m from the seabed, located just above the still water level during high tide. Due to the impulsive nature of breaking waves, the installation work of the WECs brought a significant challenge. First, a 75 cc two-cycle gasoline engine core drill was utilized to drill four 110 mm diameter holes on the seabed, at the designated location. Each hole had the depth of about 400 mm. Then the mount sockets were inserted into the holes with the gap between the hole and the socket filled with 2–3 mm diameter ceramic balls and epoxy cement. Once the cement was dry and the socket was strongly attached to the ocean floor, the half scale turbine generator was towed to the location by boat and fastened to the socket. To store the generated electricity momentarily, a set of 24 electronic double layer capacitors was used and connected to a set of LED lights to lighten the monitoring room. The experimental results showed that the turbine installed around the low tide still water level produced, on average, more power than the one located in a higher position. The peak power measurement, however, showed that the higher location had higher peaks, albeit with longer non-productive periods. The details of the experiments, along with the novel monitoring system of the half-scale physical model testing in Maldives, can be read in [25,26].
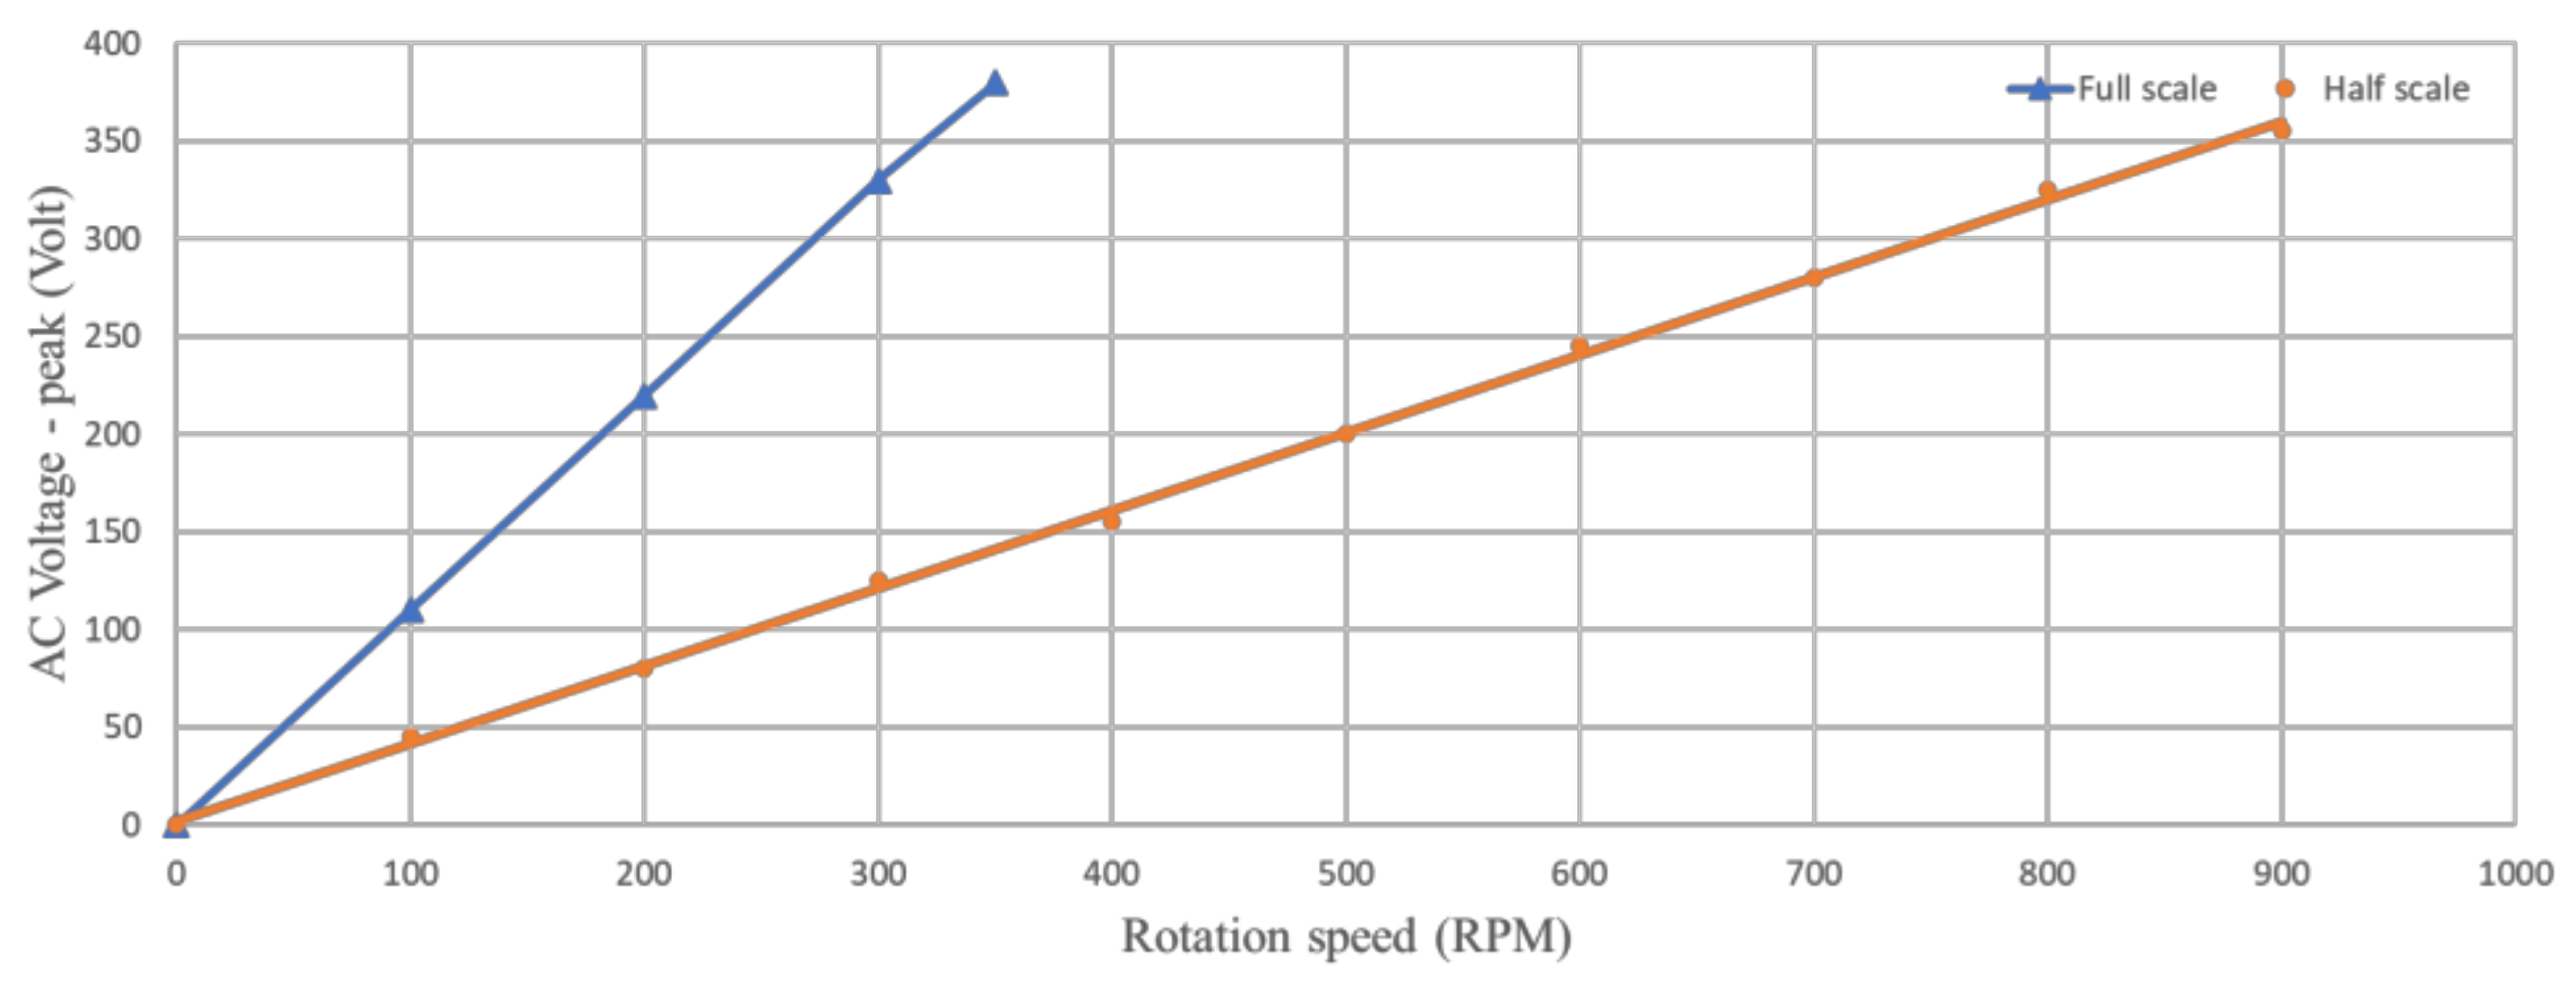
Full-scale turbine testing of the turbine generator was done in November 2018. Two full-scale 0.6 m diameter OIST WEC turbines were installed at about 10 m landward from the half-scale turbines with the same 10 m distance between them, using the same installation method of the half-scale experimental campaign. This location was selected based on video observation of the breaking wave location. The center of the turbines was located 0.6 m above the seafloor. This allowed the bottom of the turbines to reach the low tide still water level. For reference, the difference between low tide and high tide in Maldives during this experiment was around 0.8 m, so it was expected that the turbines would be fully submerged during high tide. It is also important to note that half-scale data revealed that energy was still generated while submerged. The full-scale generator showed a lower turbine RPM when compared to the half-scale WEC’s model, while the power produced in total was larger. 
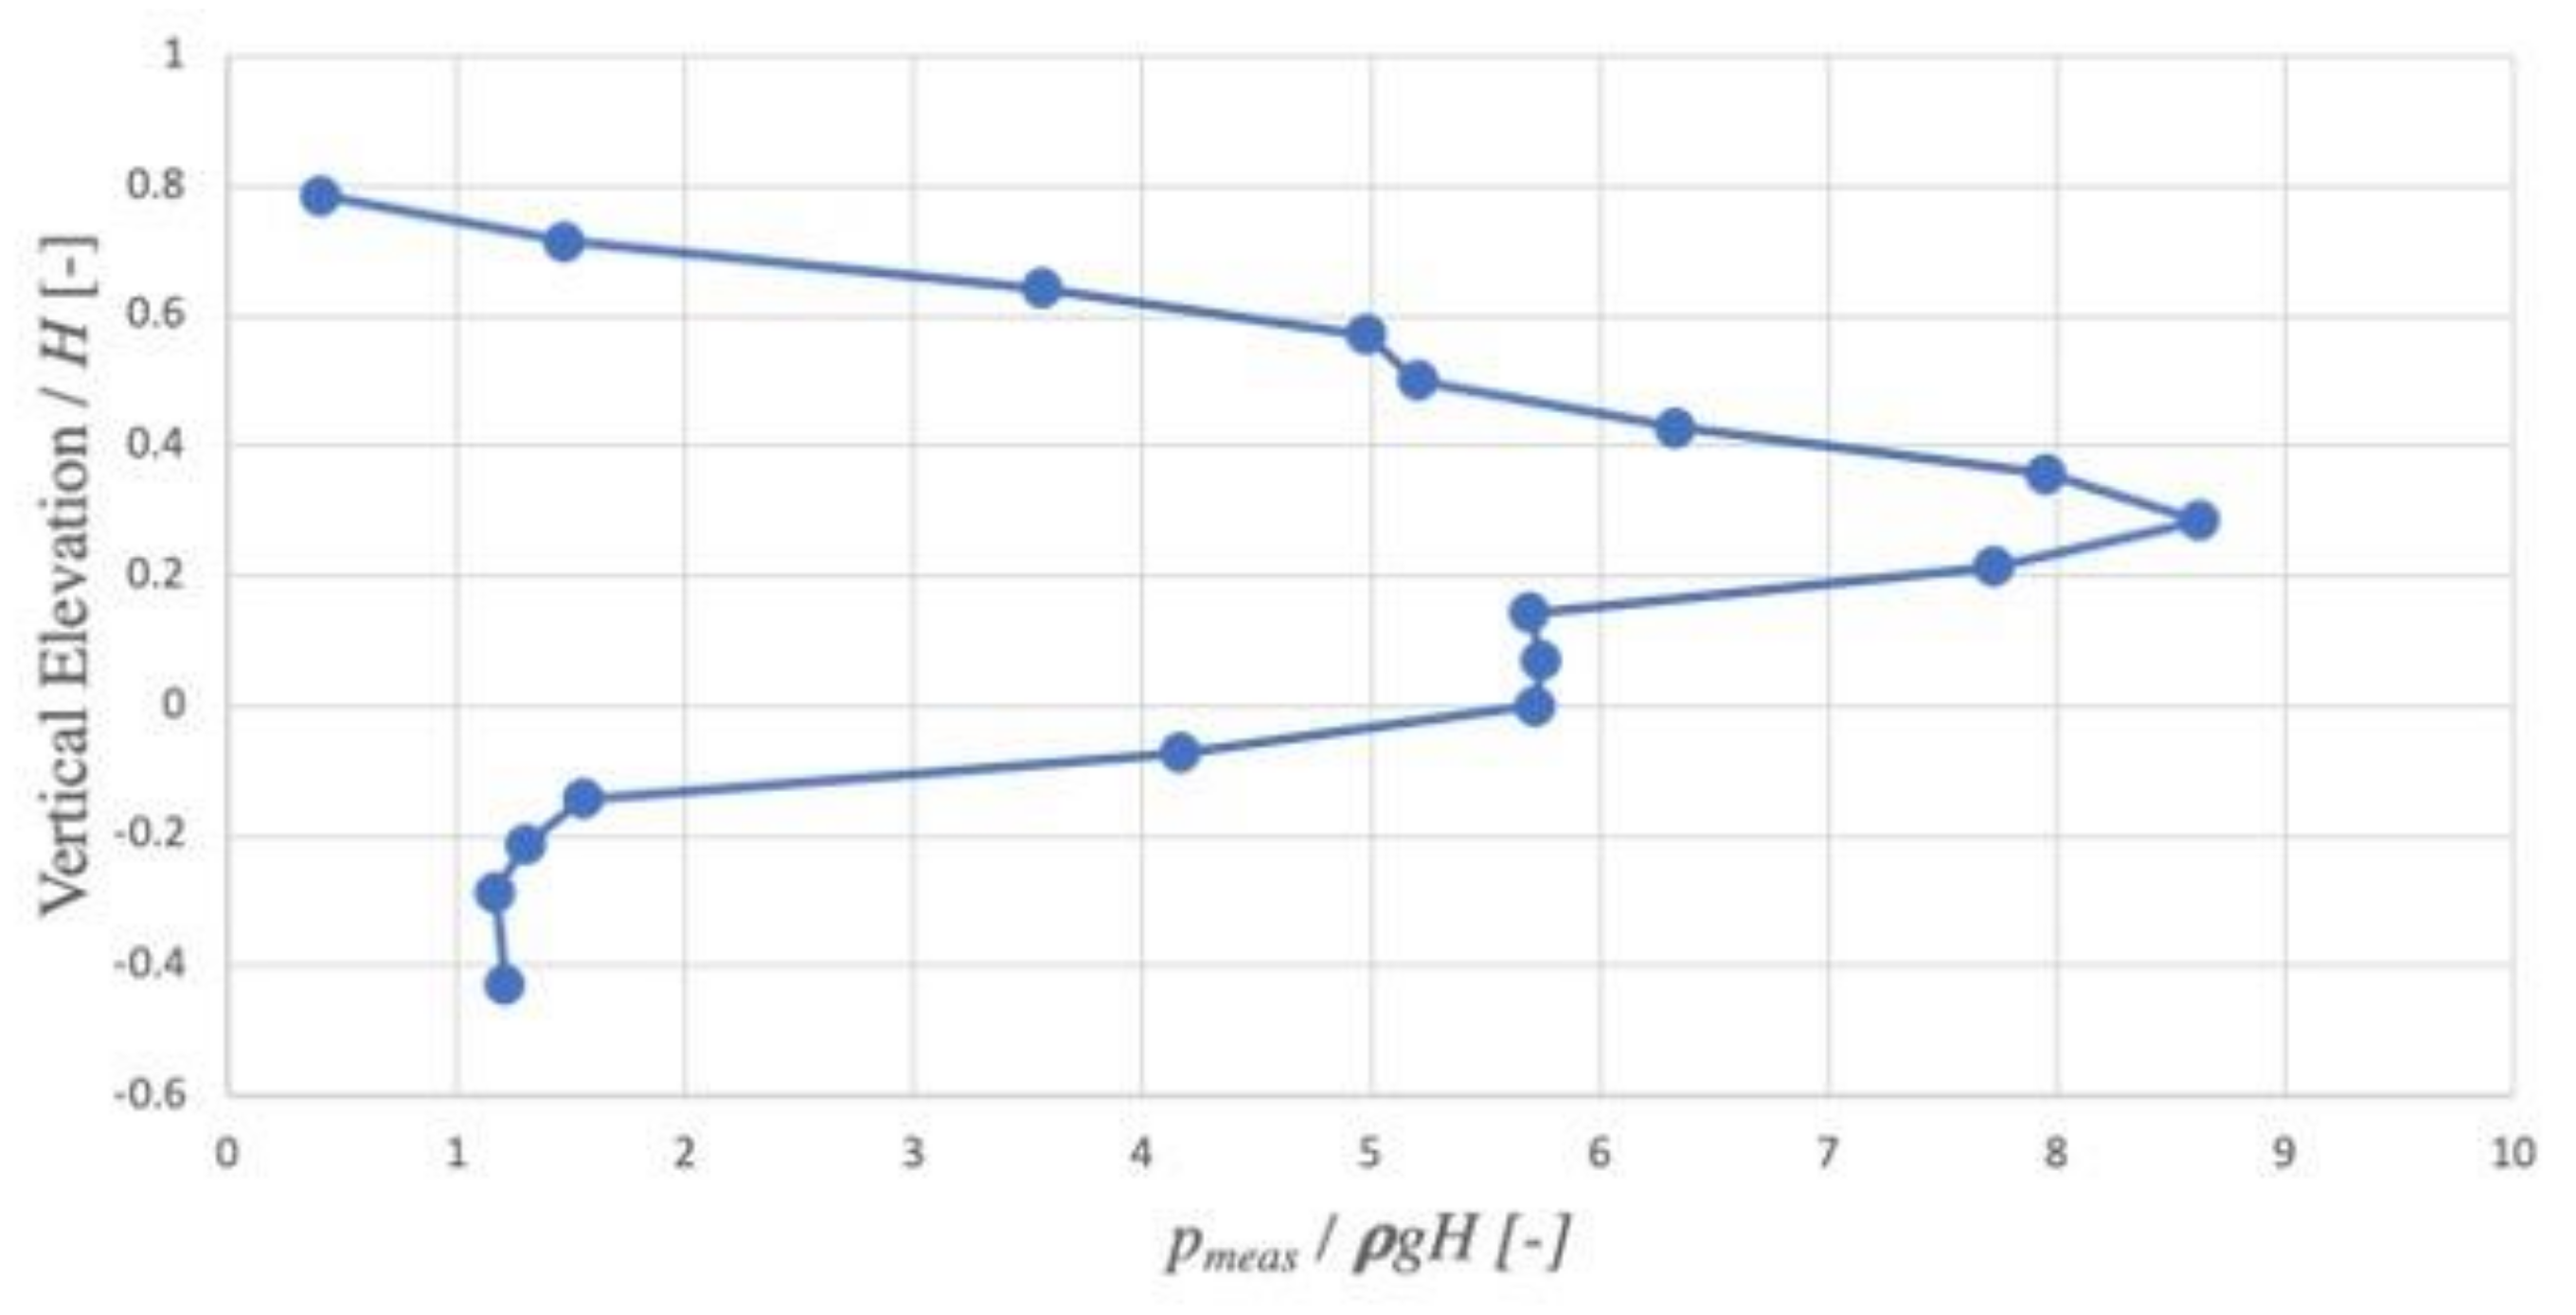
Figure 1 shows the relationship between the turbine rotation speed in revolutions per minute (RPM), against the voltage output of the generator. As can be seen from the figure, the full-scale (blue triangle) line has a much steeper gradient when compared to the half-scale (orange circle) result. For more detailed analysis, please see [27].
Based on the Maldives experiment, it was found that current devices are still unable to harness the breaking wave energy optimally [28]. The preliminary observation showed that most of the time, the very fast and turbulent water and air mixture of a breaking wave hit the turbine when it was not rotating (still) and passed before it could absorb all of its energy. Because of this, a duct was incorporated into the turbine design to act as a concentrator of the water flow toward the turbine and slow down the incoming water flow. Furthermore, these breaking waveloads on a still turbine led to a high impact pressure experienced by the turbine’s blade. Bagnold [29] speculates that high impact pressure occurs due to air trapped and compressed inside a body of water. Reference [30] further shows that a small bubble may exacerbate this impact pressure peak. Due to this, removing the bubble may be beneficial in improving the survivability of the turbine, so the duct is expected to also suppress the incoming near-breaking wave and reduce the aeration of the breaking wave.
There are two parameters of the duct design that need to be taken into consideration: The inlet dimension and the duct length. In order to make sure that most, if not all, of the water will enter the duct, it needs to be at least twice the breaking wave height. The breaking wave height can be calculated using
H b r = 0.1025 + 0.0217   C * L p i tanh 2 π   h / L p i
as suggested by [31], where L p i denotes the peak period wavelength in the water depth h, and can be calculated using
L p i = g T p 2 / 2 π tanh 2 π   h / L p i
where g denotes the gravity acceleration and Tp denotes the peak period of the significant wave. Furthermore, C * is the reflection constant depending on the overall reflection coefficient of the beach Cr and can be calculated using
C * = 1 C r / 1 + C r
Unfortunately, getting the necessary parameters in the real ocean was difficult. Because of that, early exploration on the design of the duct was done numerically by recreating Maldives’ Kandomaa Island bathymetry in a numerical wave flume. The simulations were calculated by Free-Surface Flow Solver for Gravity-Driven Hydraulic Events, or SURGE, which is a computational fluid dynamics solver for free-surface flow, modelled using the volume-of-fluid method (VOF) based on the finite difference method. The results show a breaking wave height (Hbr) equal to 1.0 m when the incident wave height at water depth (h) equal to 5 m is Hinc = 0.75 m, which are the typical wave condition at the designated location. More details of the experiment can be seen in [32]. Based on this result, the inlet dimension of the duct is selected to be two times the Hbr, or a 2.0 m by 2.0 m rectangle, where the still water level is located at the center of the duct. This should guarantee that most, if not all, of the water of the incoming wave enters. A contraction factor of 9 is selected to increase the flow velocity and increases the performance of the device, leading to a 0.67 m by 0.67 m rectangular outlet dimension. To decide the length of the duct, one needs to consider the distance a breaking wave travels from the moment it reached the breaking wave height (Hbr) until the wave is broken. One can imagine that this distance is similar to the diameter of the circular air pockets, which form when a wave is breaking, and can be approximated by
D = π / 12 · H b r
as proposed by [33], where D denotes the characteristic linear dimension of the circular air pockets formed by breaking wave with breaking wave height Hbr. Assuming Hbr equals 1, as predicted by the numerical simulation, the minimum duct length should be D = 0.26 m. To be sure that the duct will be able to capture the breaking wave, the early duct design was chosen to be about 20 times that number, to be 4.0. In addition to the breaking wave height analysis, two design configurations were tested in the numerical wave flume, using the same numerical method, as reported in [34]. The experiments compared the total pressure ( P t o t ) and the effective pressure ( P e f f ) at the duct outlet, but only if the breaking wave occurred in the middle of the duct. Effective pressure is the total pressure with the gravitational potential power removed because the gravitational potential power cannot be captured by the electric generator. The first duct design is a 4 m long taper duct with 2.0 m × 2.0 m rectangular inlet and 0.67 m × 0.67 m rectangular outlet (Figure 2a), while the second duct design has a 2.0 m straight tube with rectangular 2.0 m × 2.0 m cross-section and an open roof, followed by a 2 m long taper configuration with 0.67 m × 0.67 m outlet dimension (Figure 2b). The results showed that the first configuration (Figure 2a) may increase both the Ptot and Peff up to 1.5 times the second configuration.
Based on the numerical results shown in [34], the first configuration was selected for a preliminary half scale field testing which was done in Maldives (see Figure 3). Early prototypes of the duct design were made from aluminum plates with a rectangular cross-section as shown in Figure 3a. The aerial view of the initial testing using the painted prototype (corrosion prevention) in Maldives can be seen in Figure 3b, and most of the sea water enters the duct as expected. The half-scale turbine was then mounted at the outlet of the tapered duct to measure the power generated and to compare it to the bare turbine configuration.
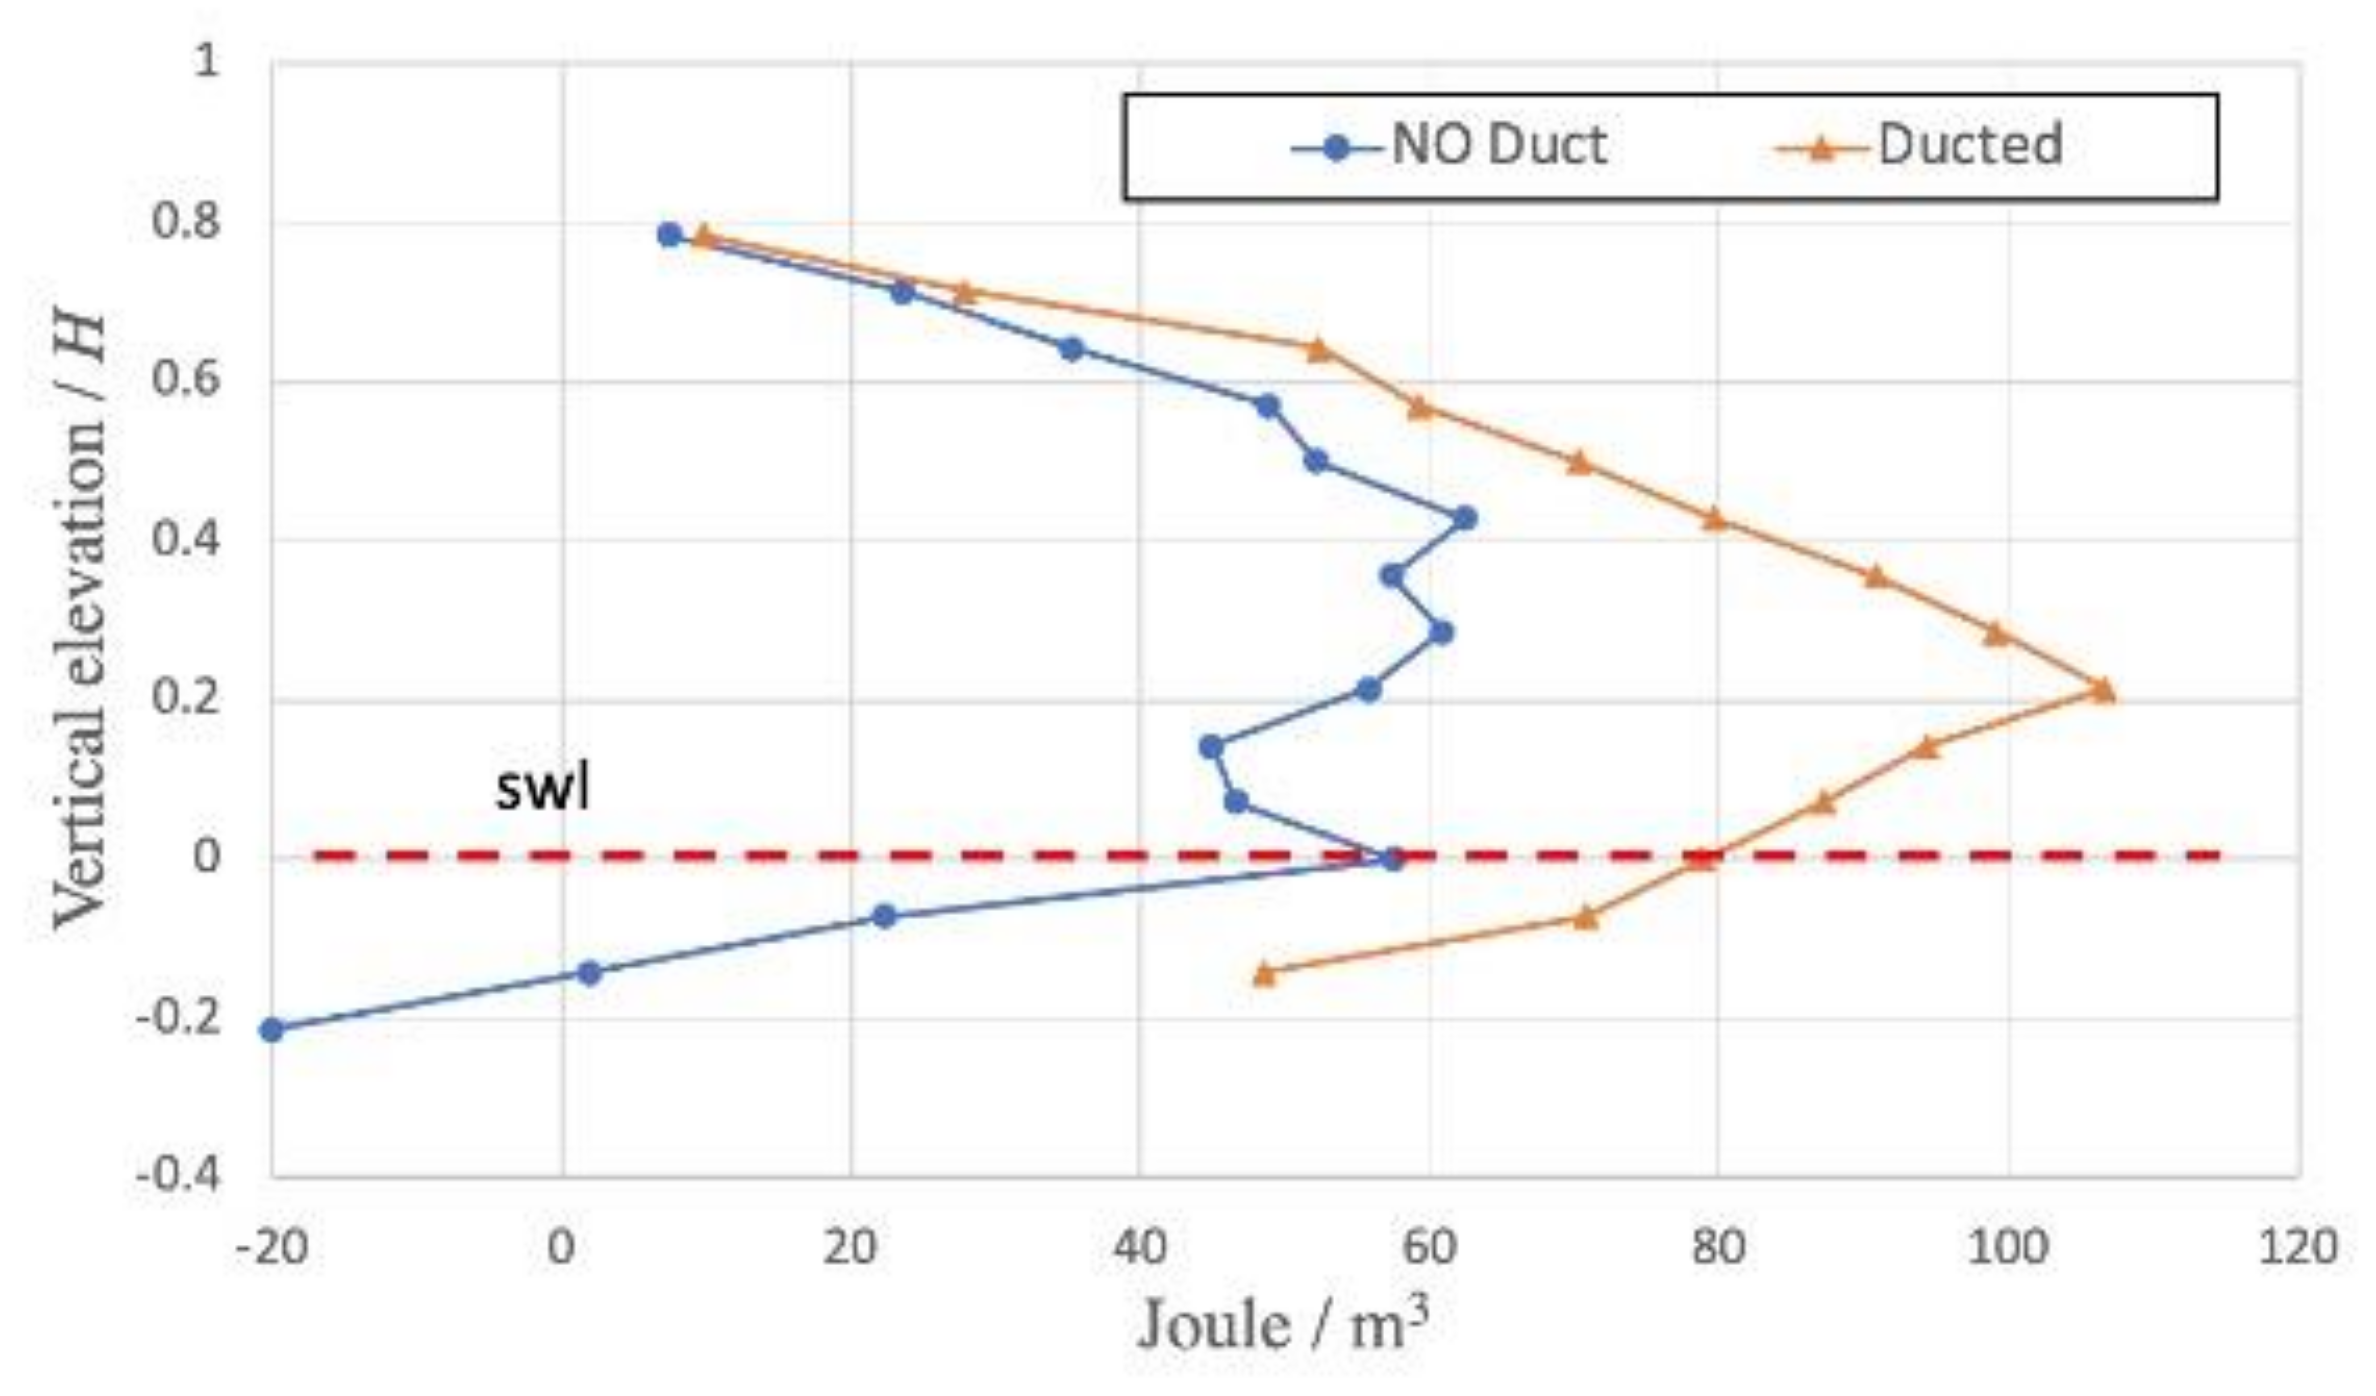
The measured voltage generated by the half-scale turbine and duct configuration showed an increase by a factor of 2.5 when compared to the bare turbine as reported in [26]. Theoretically, this may lead to six times more power being harvested just from adding the duct. Unfortunately, due to the very high breaking wave impact, the corner wall of the duct failed with the water leaked. Furthermore, the turbine mount attached at the outlet bent. Because of this, both designs shown in Figure 2 were combined for the final design. While the outlet pressure is expected to be lower, it is expected that the device will be able to hold the incoming breaking wave pressure. 
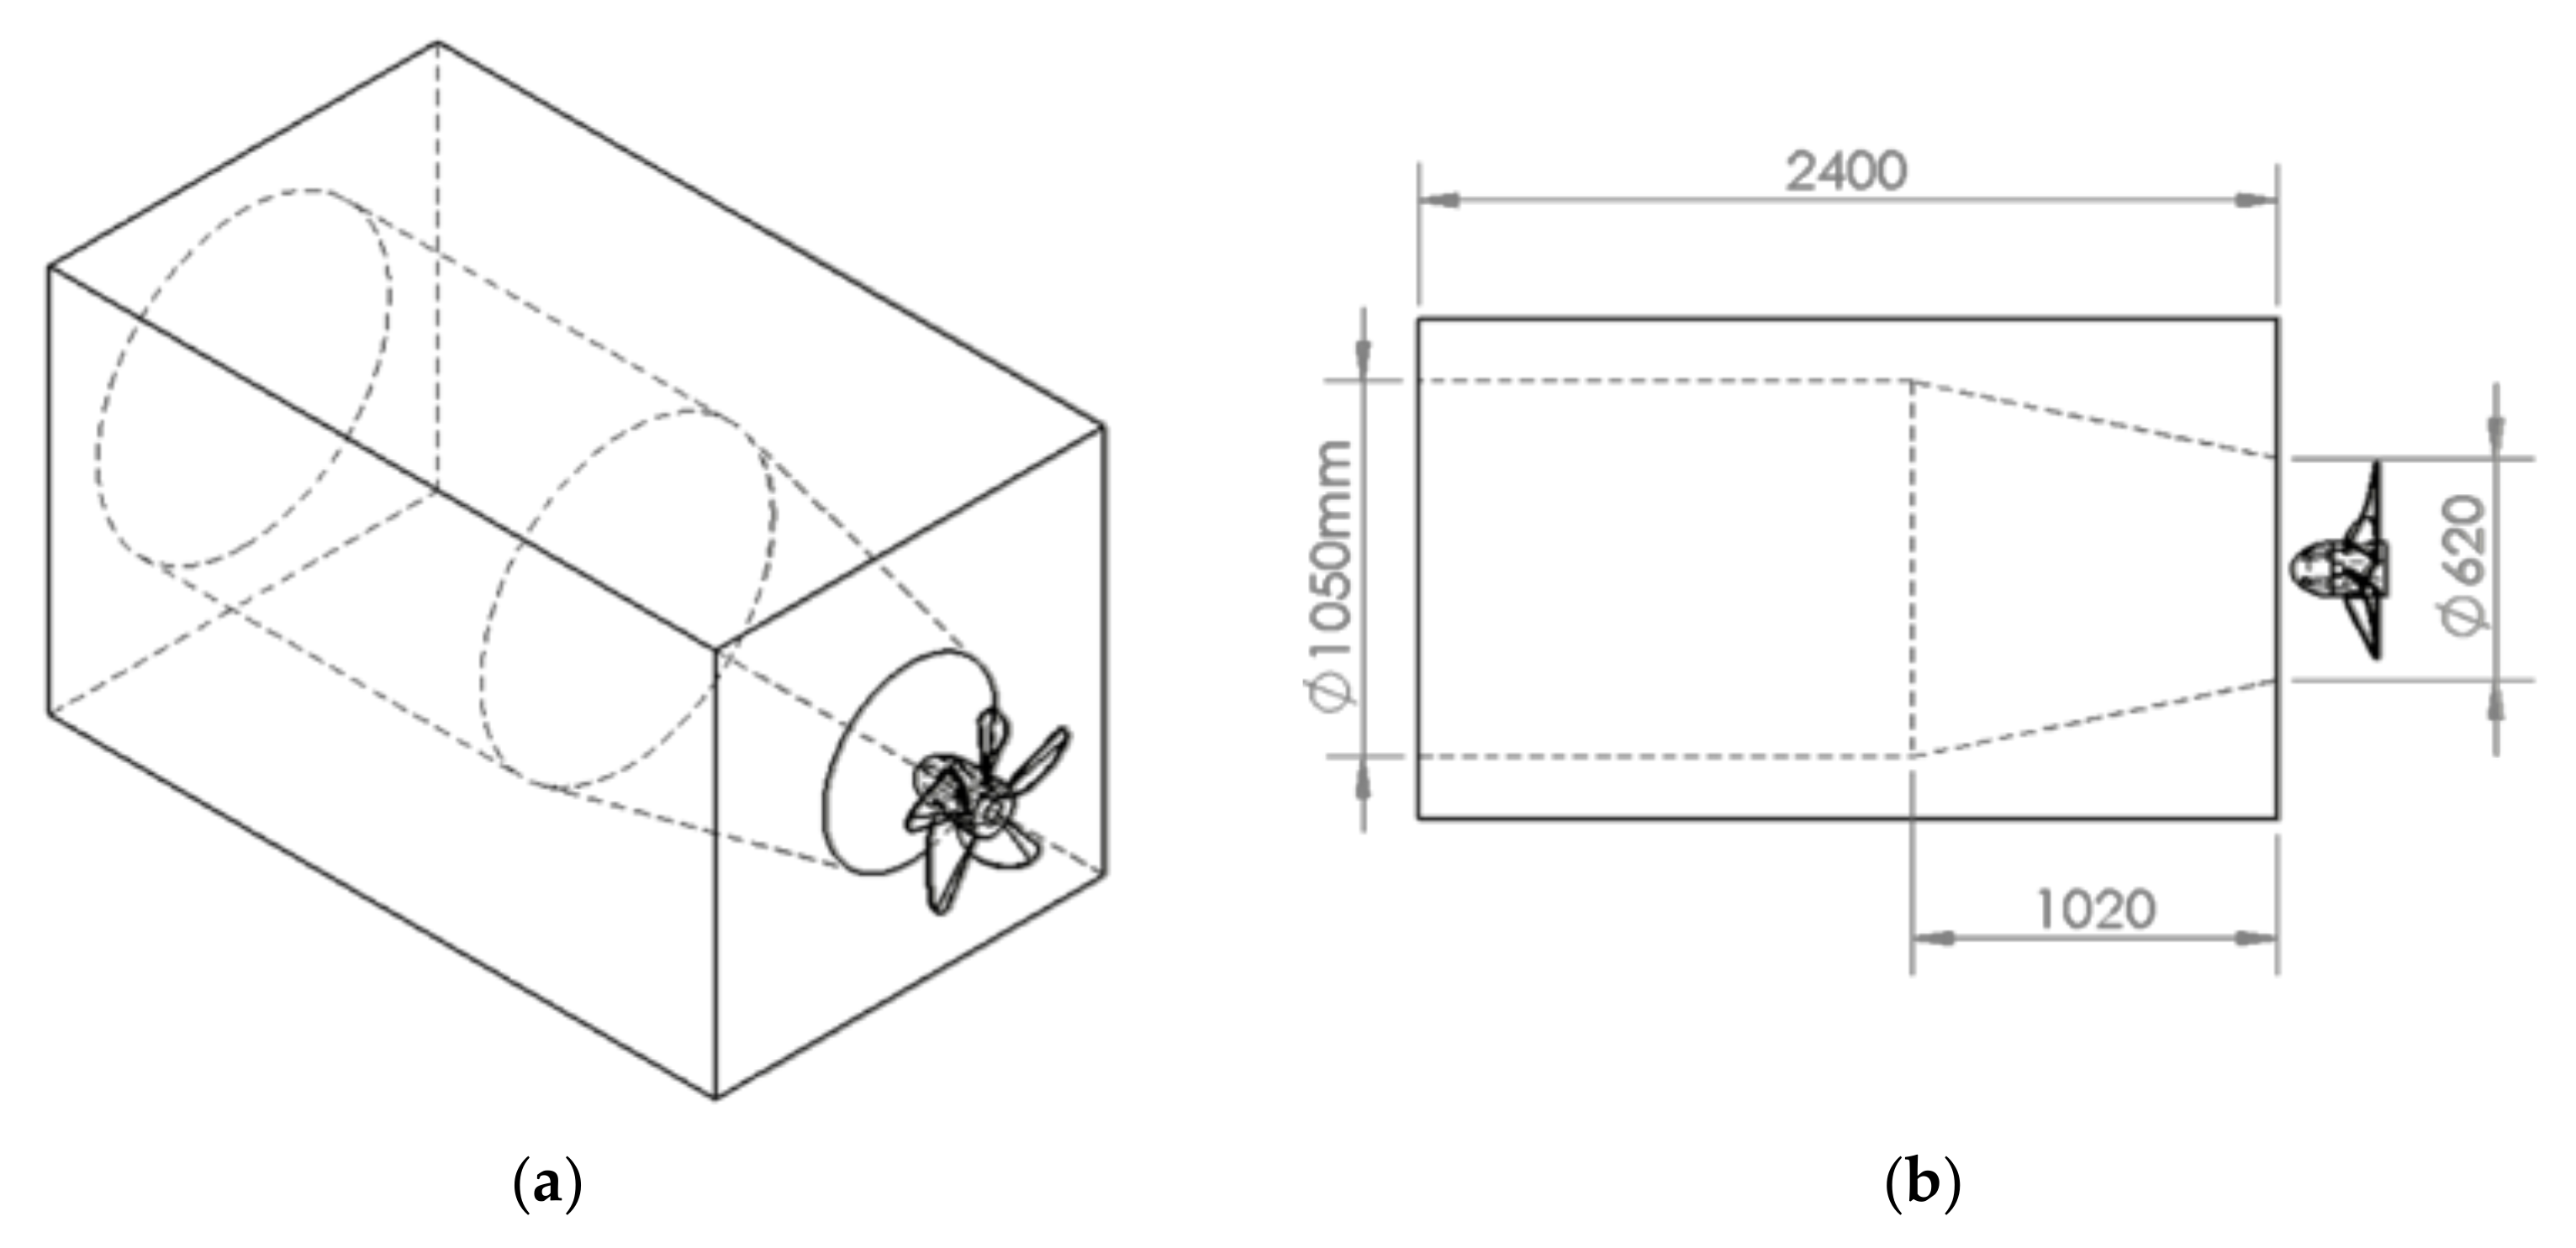
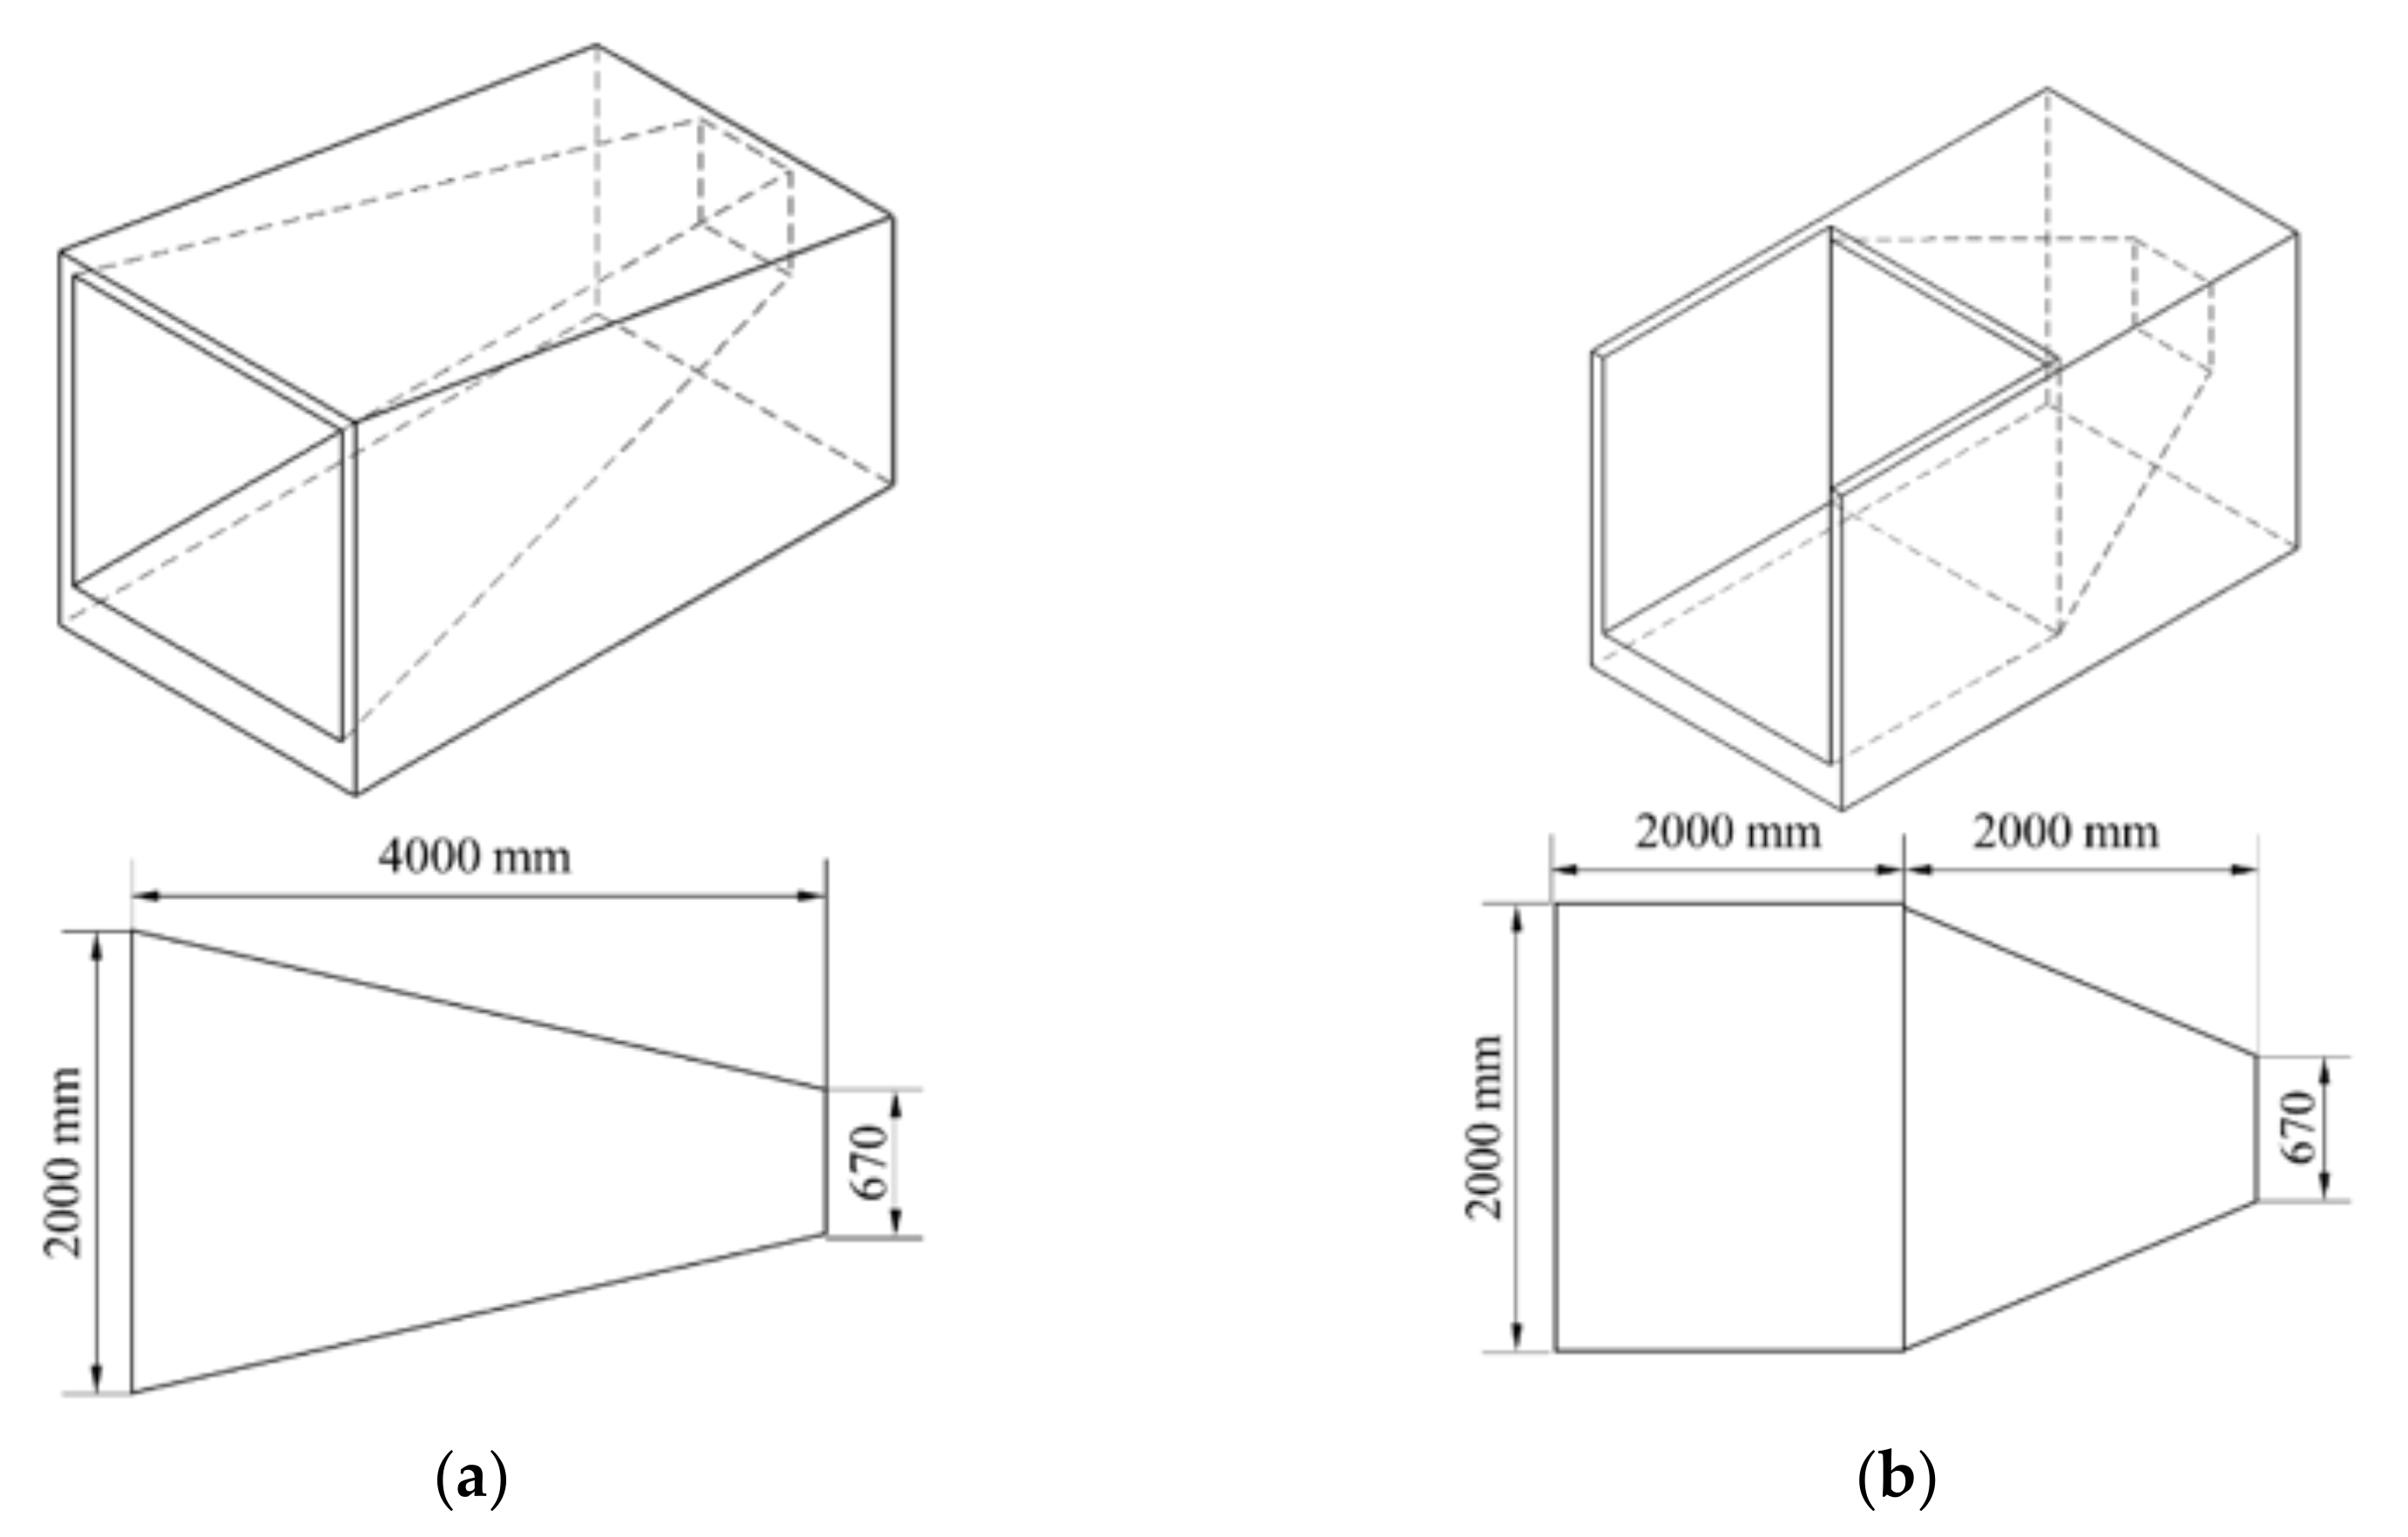
Figure 4a,b show the duct design based on the lesson learned from preliminary testing in Maldives with dimensions shown in mm; it is the one being considered in current study. The length is shortened to 2.4 m to simplify the fabrication, thus further reducing the cost associated with the installation. This length is about 10 times the minimum length calculated using Equation (4). Furthermore, data also show that a previous design’s contraction factor may lead to a significant amount of water being reflected seaward, so the contraction factor is lowered to 2.8. Furthermore, a rectangular cross-section, although easier to fabricate, may lead to a pressure concentration at the corner, so a circular cross-section is considered for the current study.
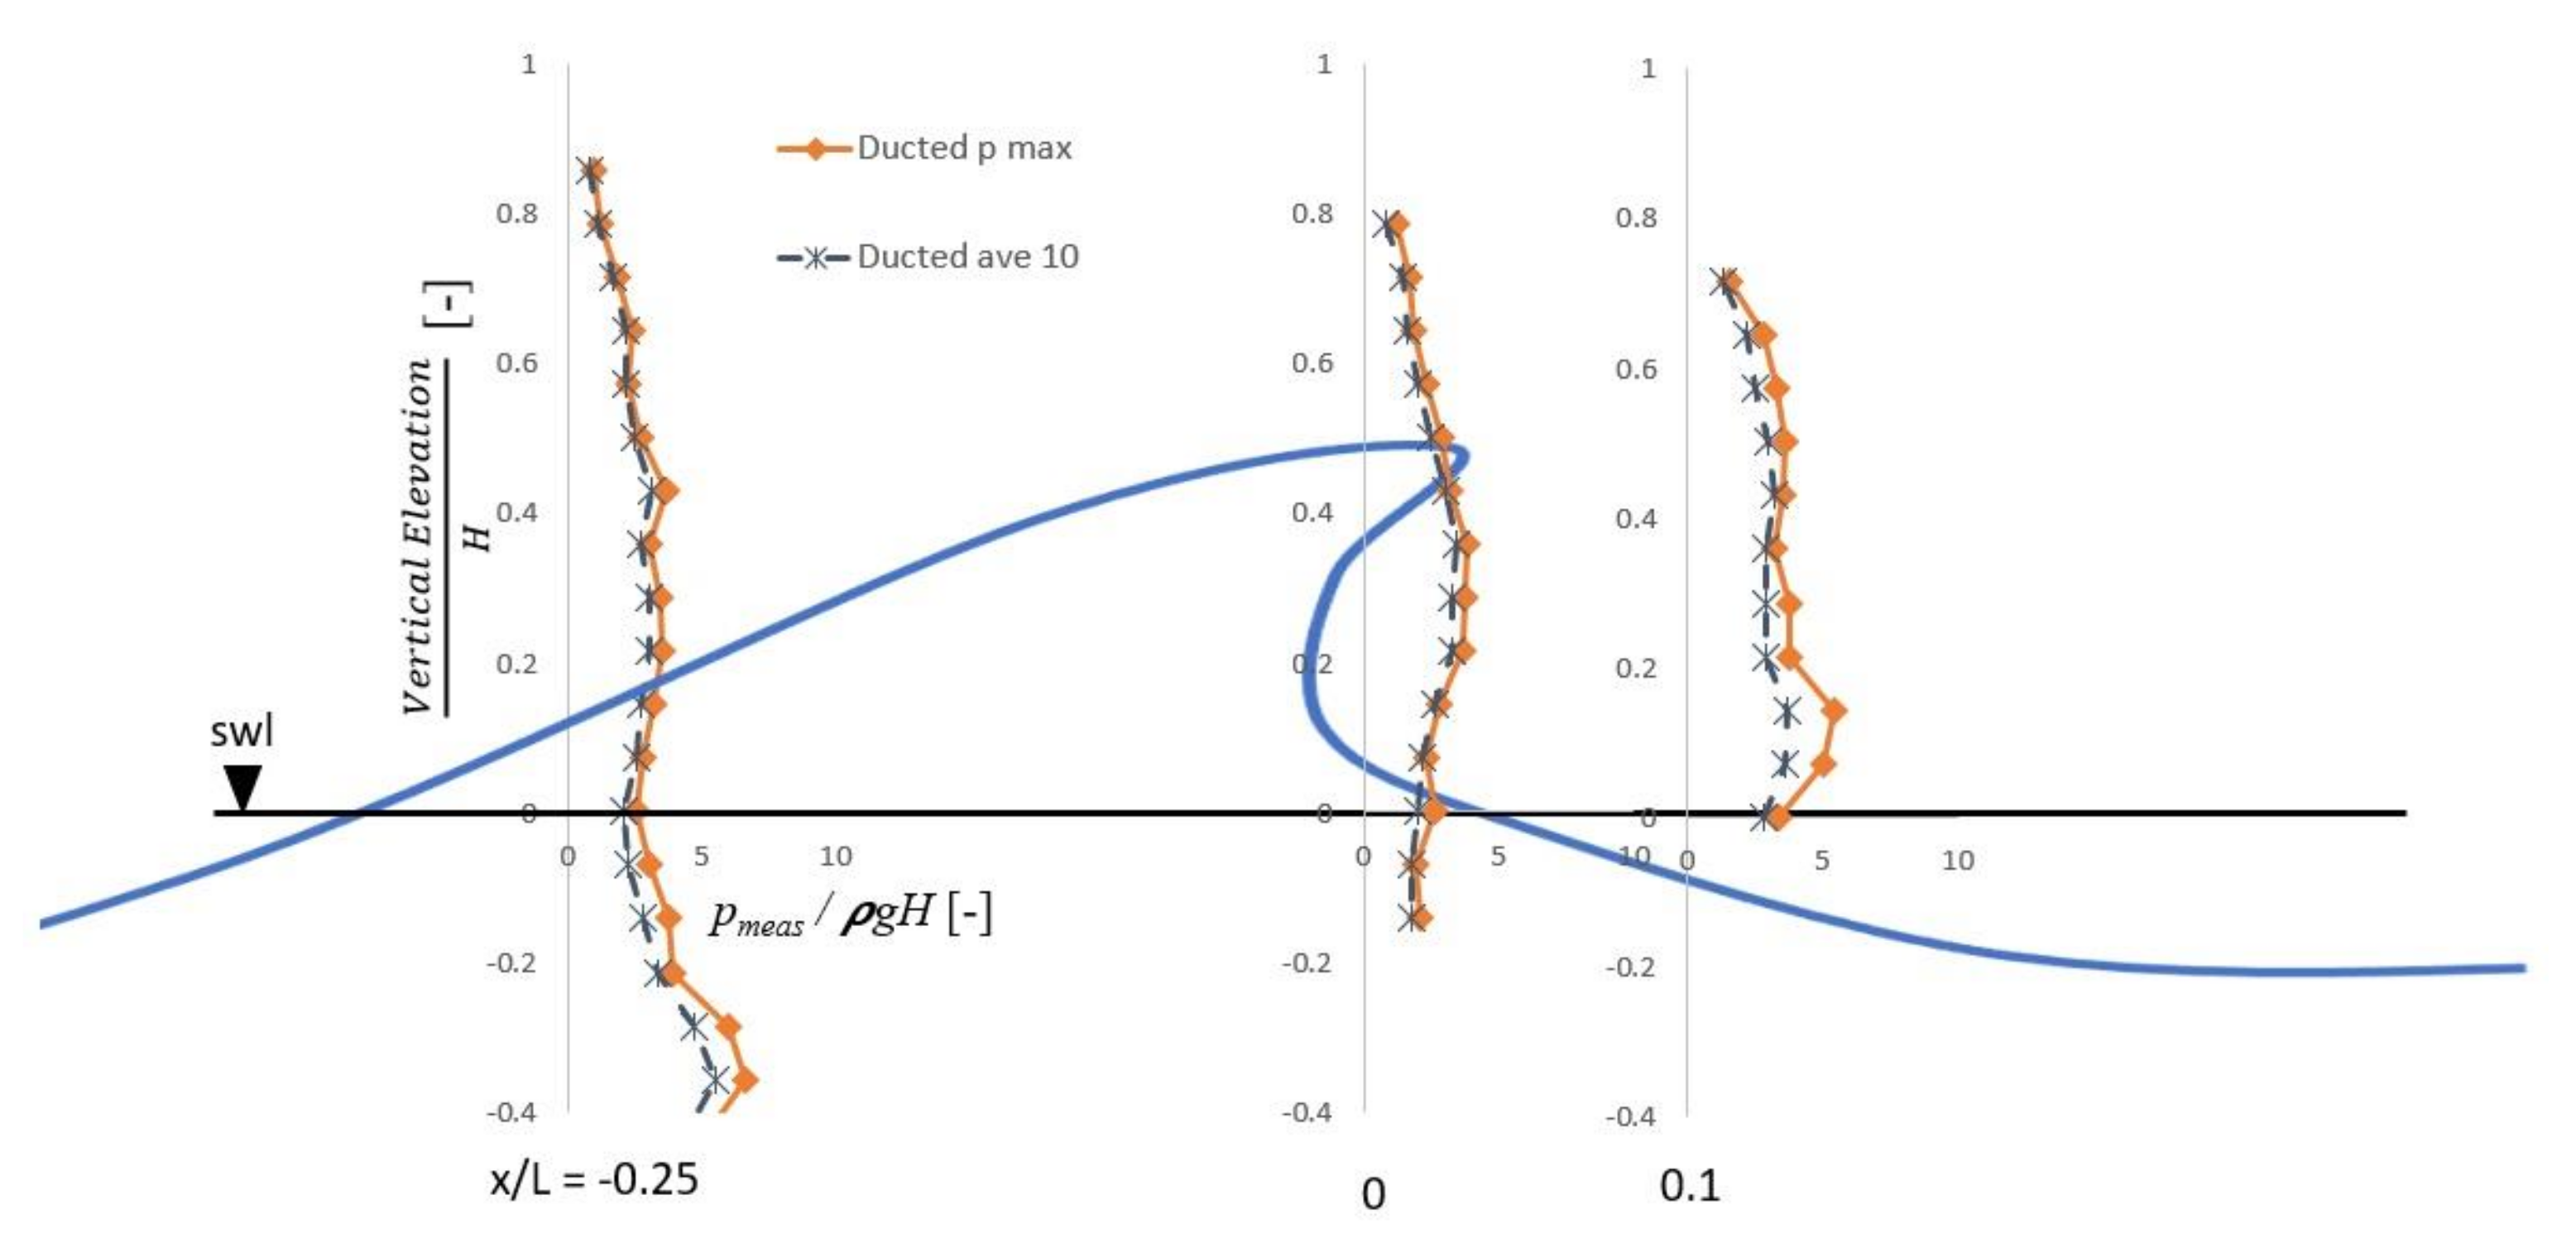
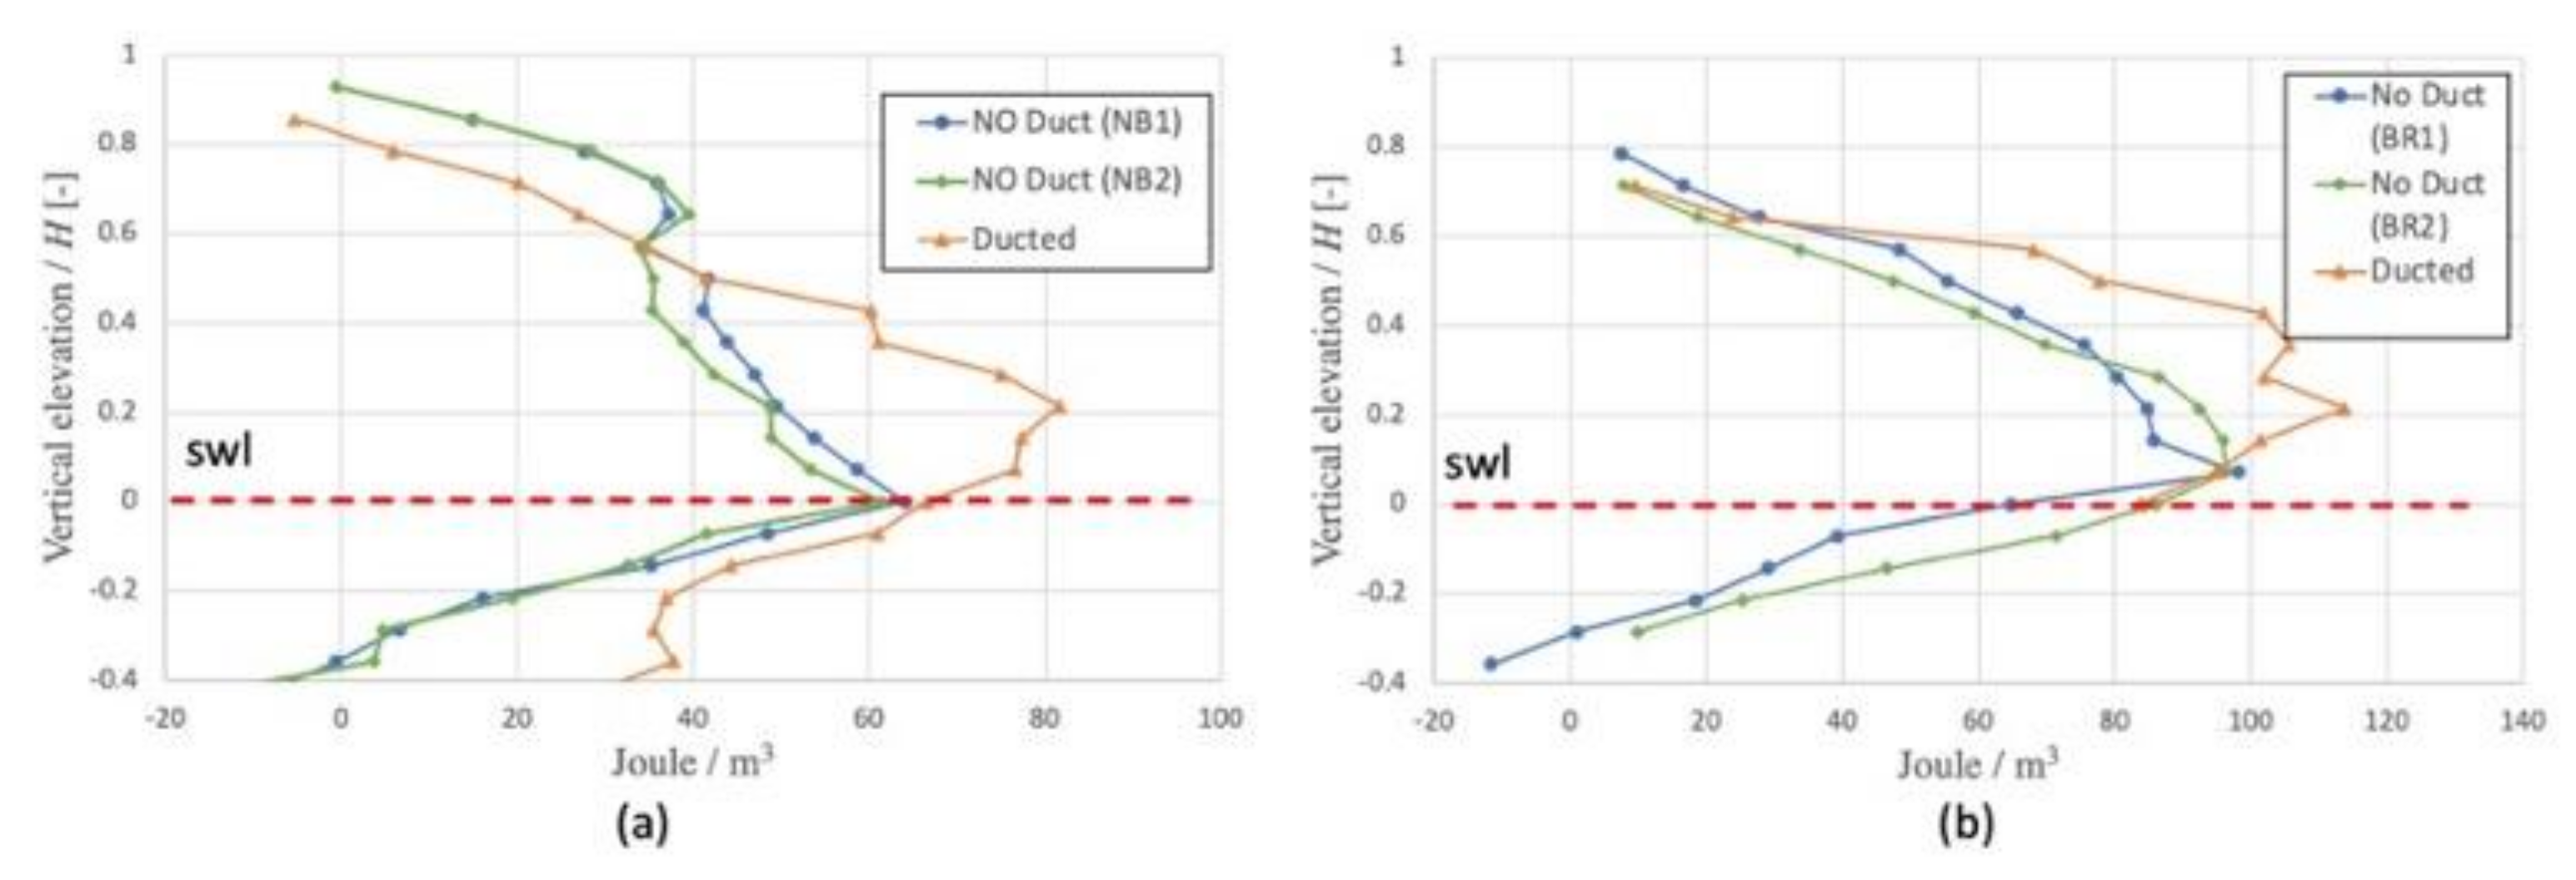
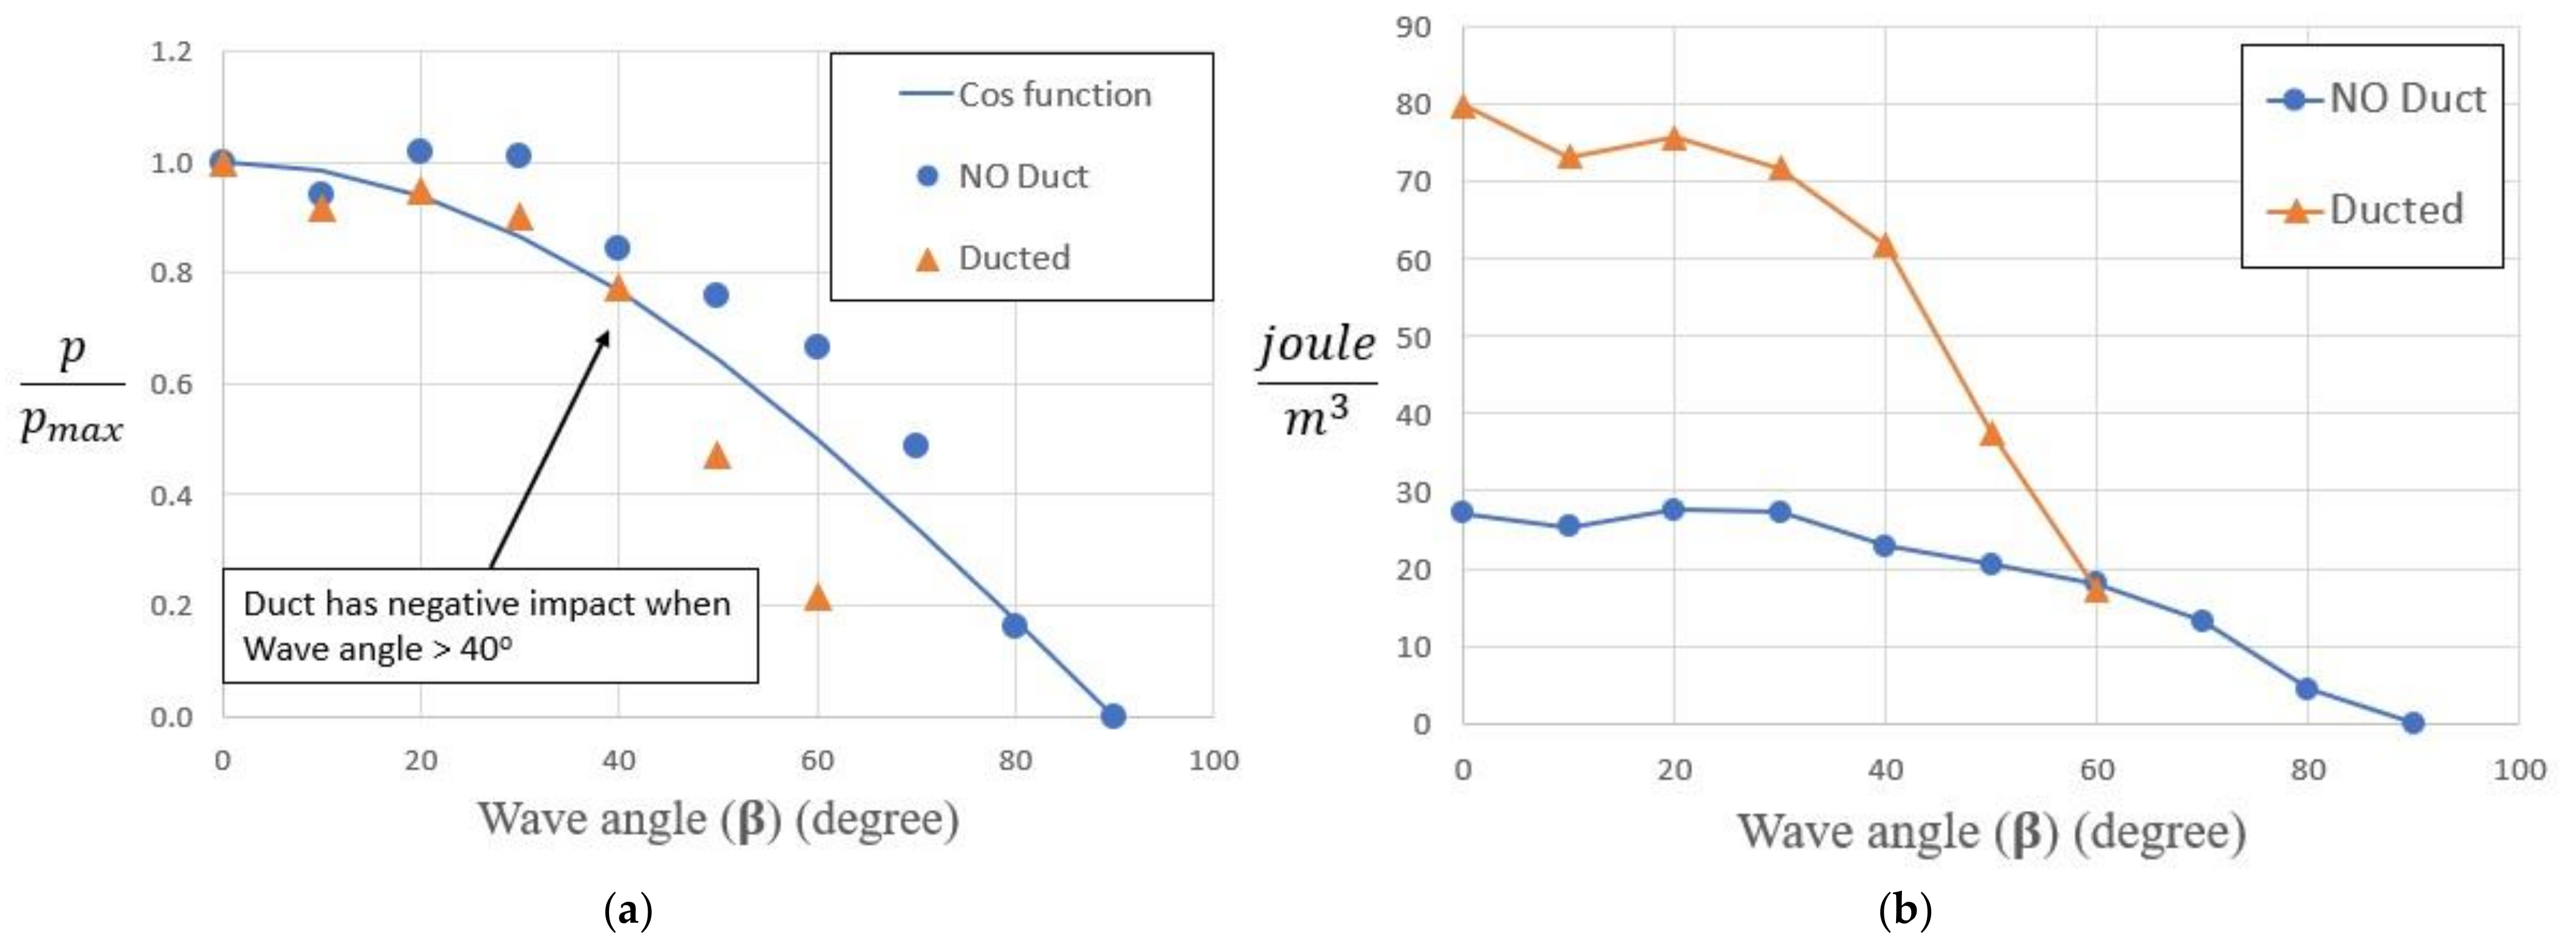
In summary, the current study aims to characterize the influence of the most recent duct design to the overall performance of the OIST WEC device, by means of Figure 4a quantifying the increase in energy exposure to the turbine by adding the duct into the WEC design and Figure 4b observing the impact of the directionality of the incoming wave to the performance of the ducted WEC design when compared to a bare turbine design.

2. Methodology and Experimental Apparatus

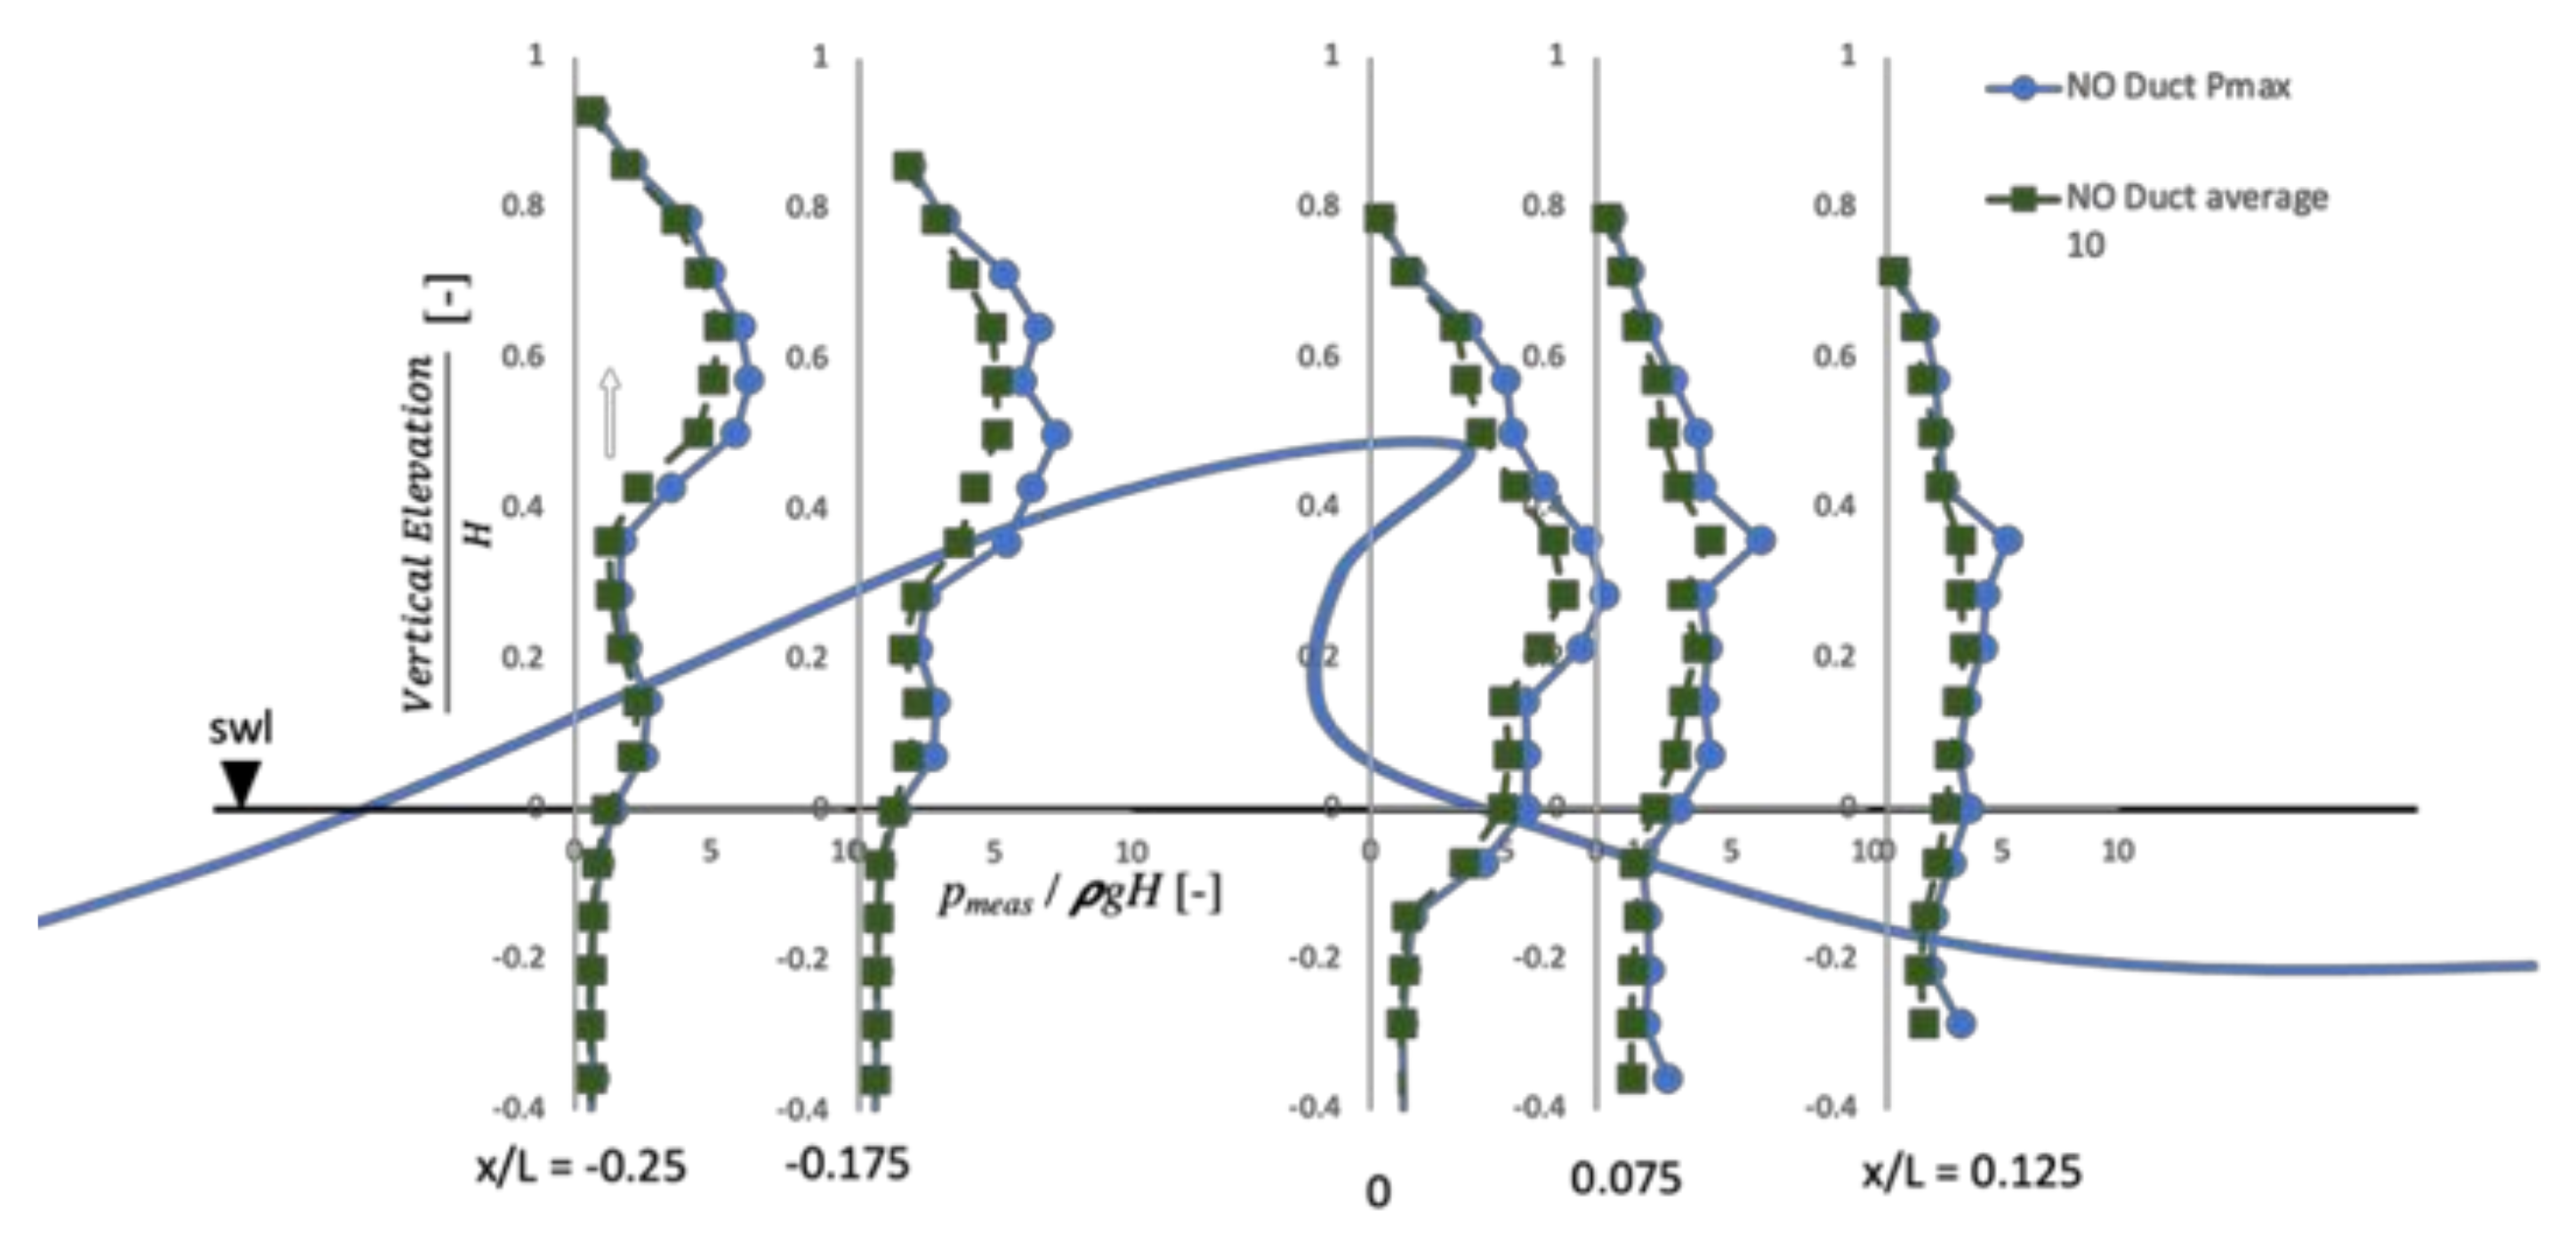
To further observe the effects of the current duct design to the overall performance of the device, small-scale physical model experiments were done at the OIST’s wave flume facility. The wave flume is a 1 m × 0.5 m × 0.2 m and is made of a 10 mm thick perplex board to enable multi-angle observations. A paddle-type wavemaker is installed at one end and wave-absorbing sponges are placed at the other end of the tank. The paddle is connected to a step-motor which is operated by an Arduino® board using a computer. The wave generator is tuned to a single monochromatic wave characteristic with a nominal wave height (H) equal to 0.07 m and an incident wave period of 0.57 s. The wave height is chosen based on real wave conditions in Kandooma Island, Maldives, and scaled down following Froude similitude law. For the wave period, however, the flume was unable to produce the scaled down version of Maldives’ significant wave period. Nevertheless, because this study compared the pressure measurement with and without the duct, it is safe to assume that by keeping similar wave conditions for both the bare turbine configuration and the ducted turbine configuration, the results should be comparable with the one that used the appropriate scaled down version of the wave period of the real sea in Maldives. The wave period is selected as 0.57 s, which is the largest wave period the wave generator can produce at H = 0.07 m.
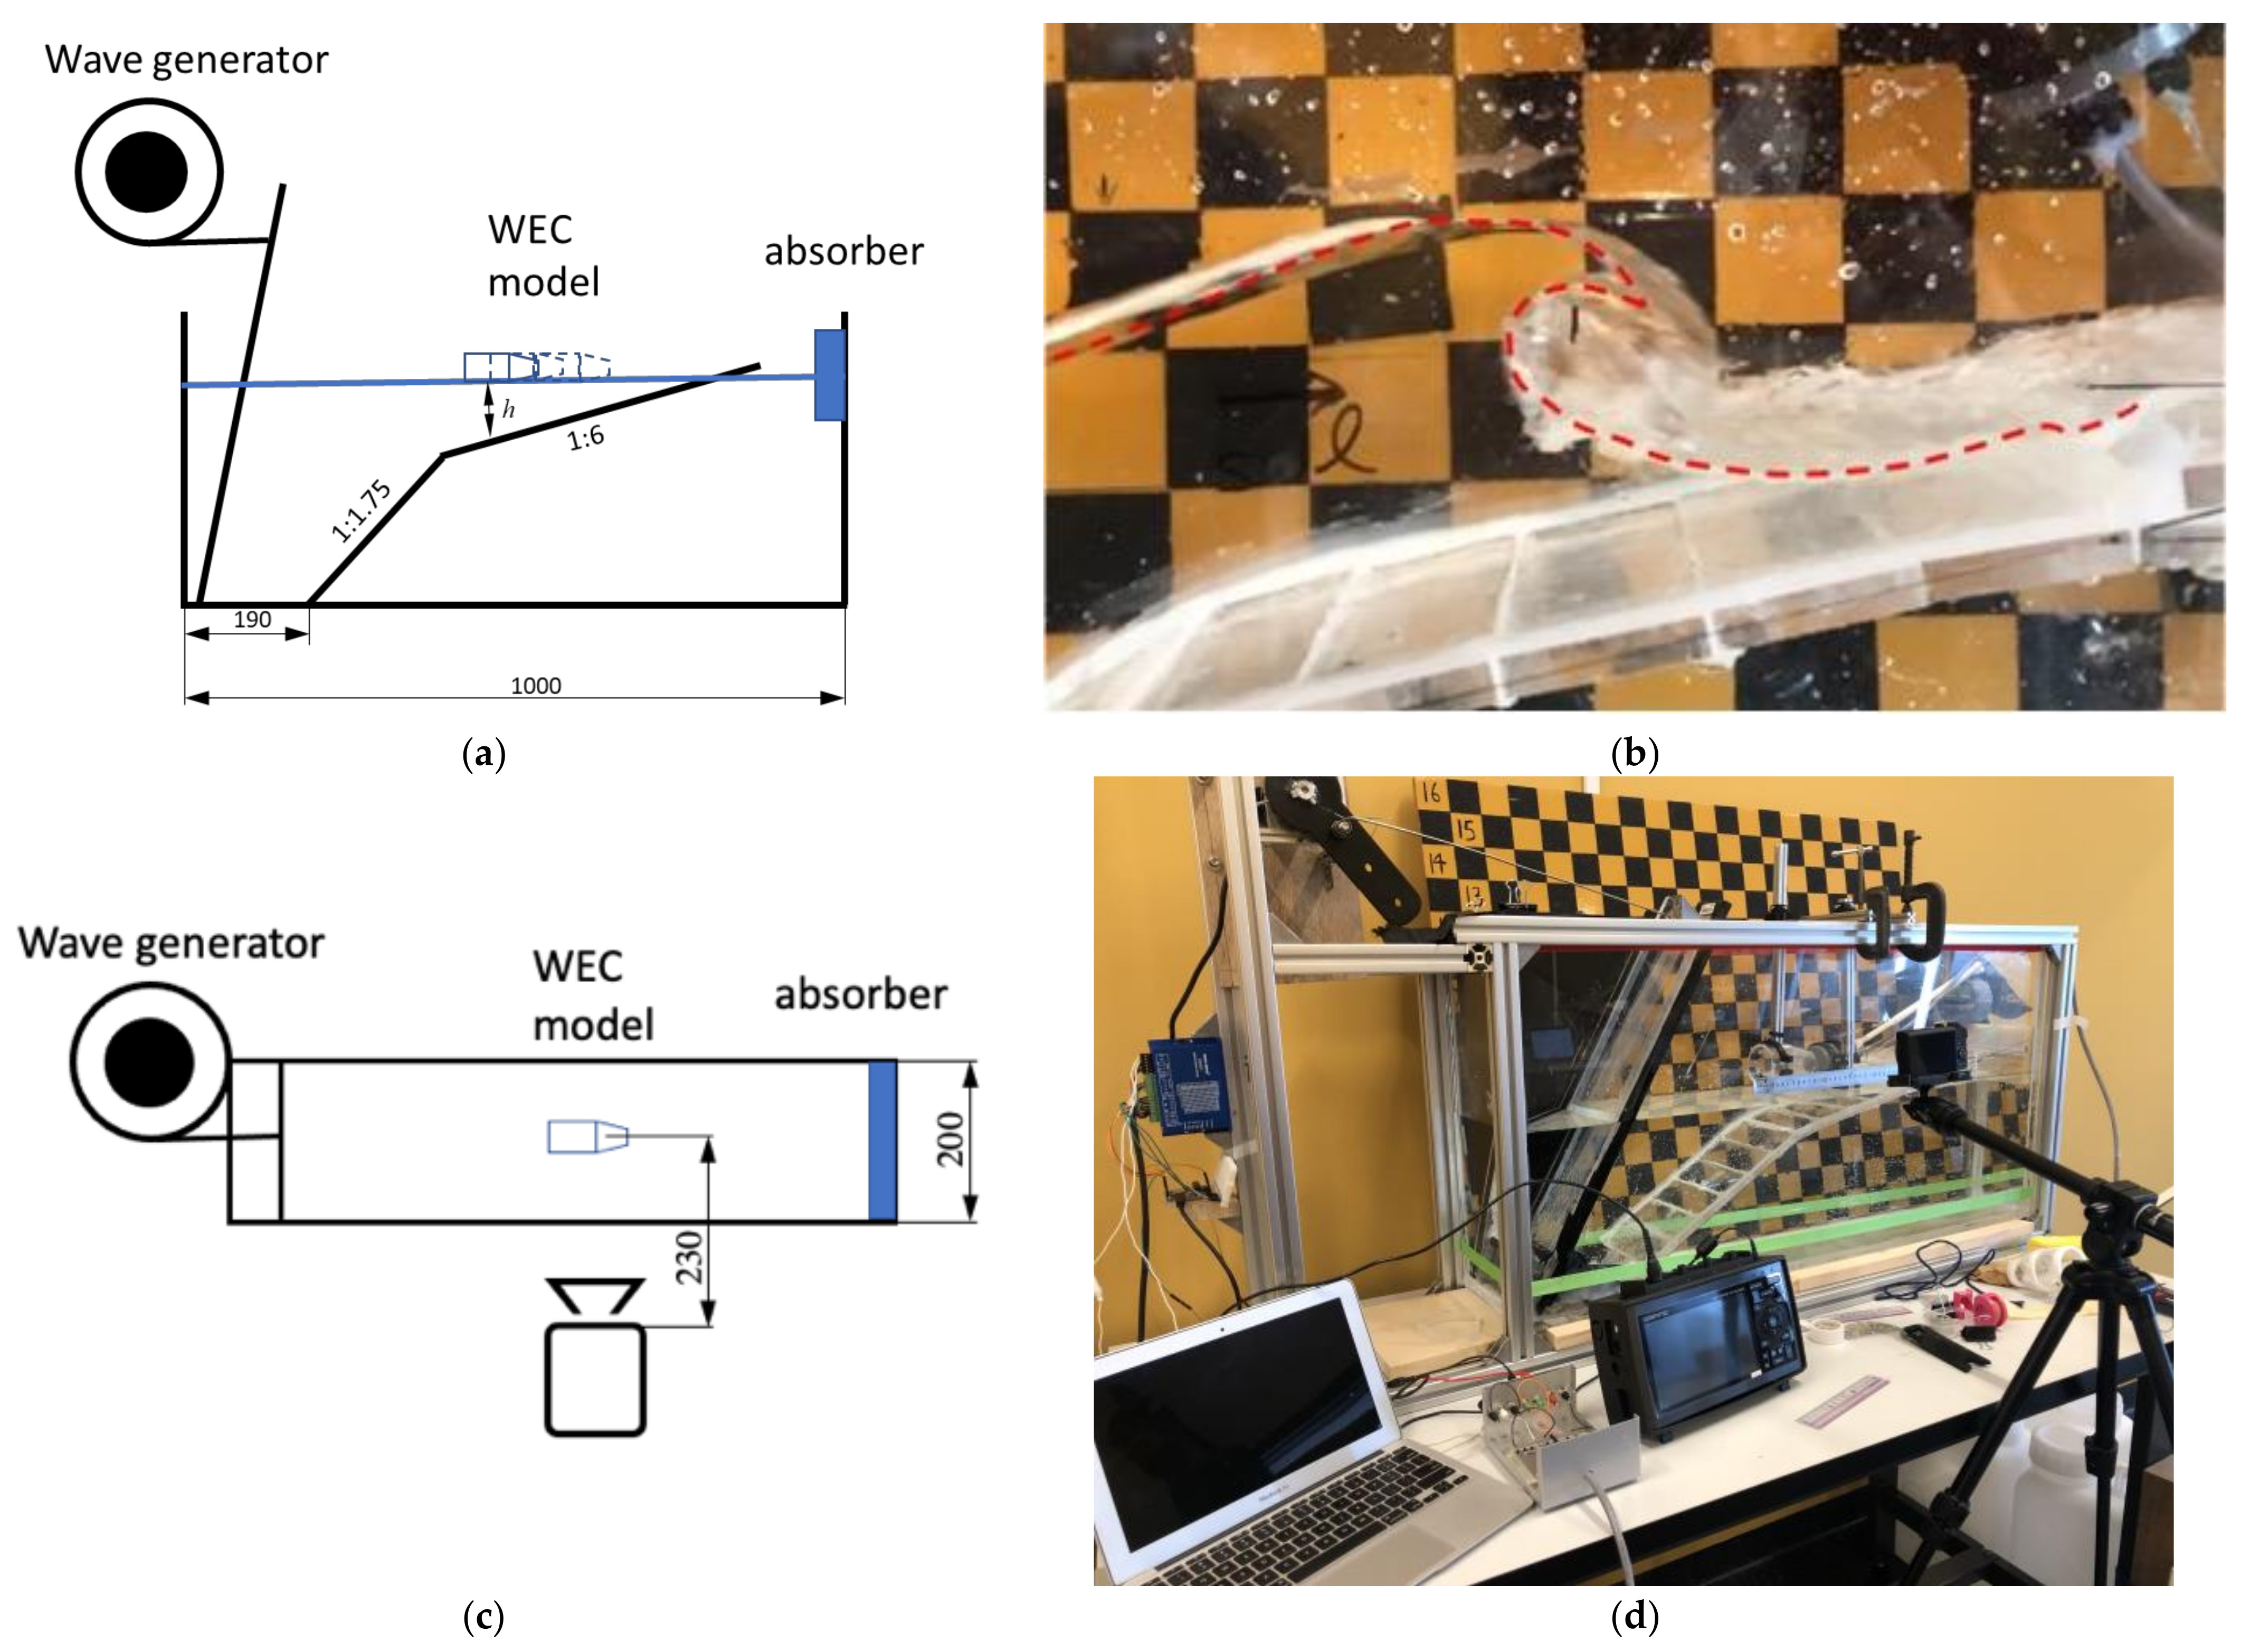
The simple schematics of the flume with the beach installed can be seen in (a) with the dimensions shown in mm. Here h denotes the water depth at various bare turbine and ducted turbine configurations and the value of h can be seen in Table 1. The beach bathymetry installed is loosely based on Kandooma Island beach bathymetry. The breaking wave’s profile at the breaking location generated by the monochromatic wave can be seen in Figure 5b with the profile highlighted with a dashed red line. The wave height generated during the experiment was measured using a high-speed camera located about 230 mm from the duct model, as can be seen in Figure 5c. The camera position was maintained to be perpendicular to the inlet of the duct model in order to minimize error due to parallax. The flume and camera set up for the experiment can be viewed in Figure 5d.
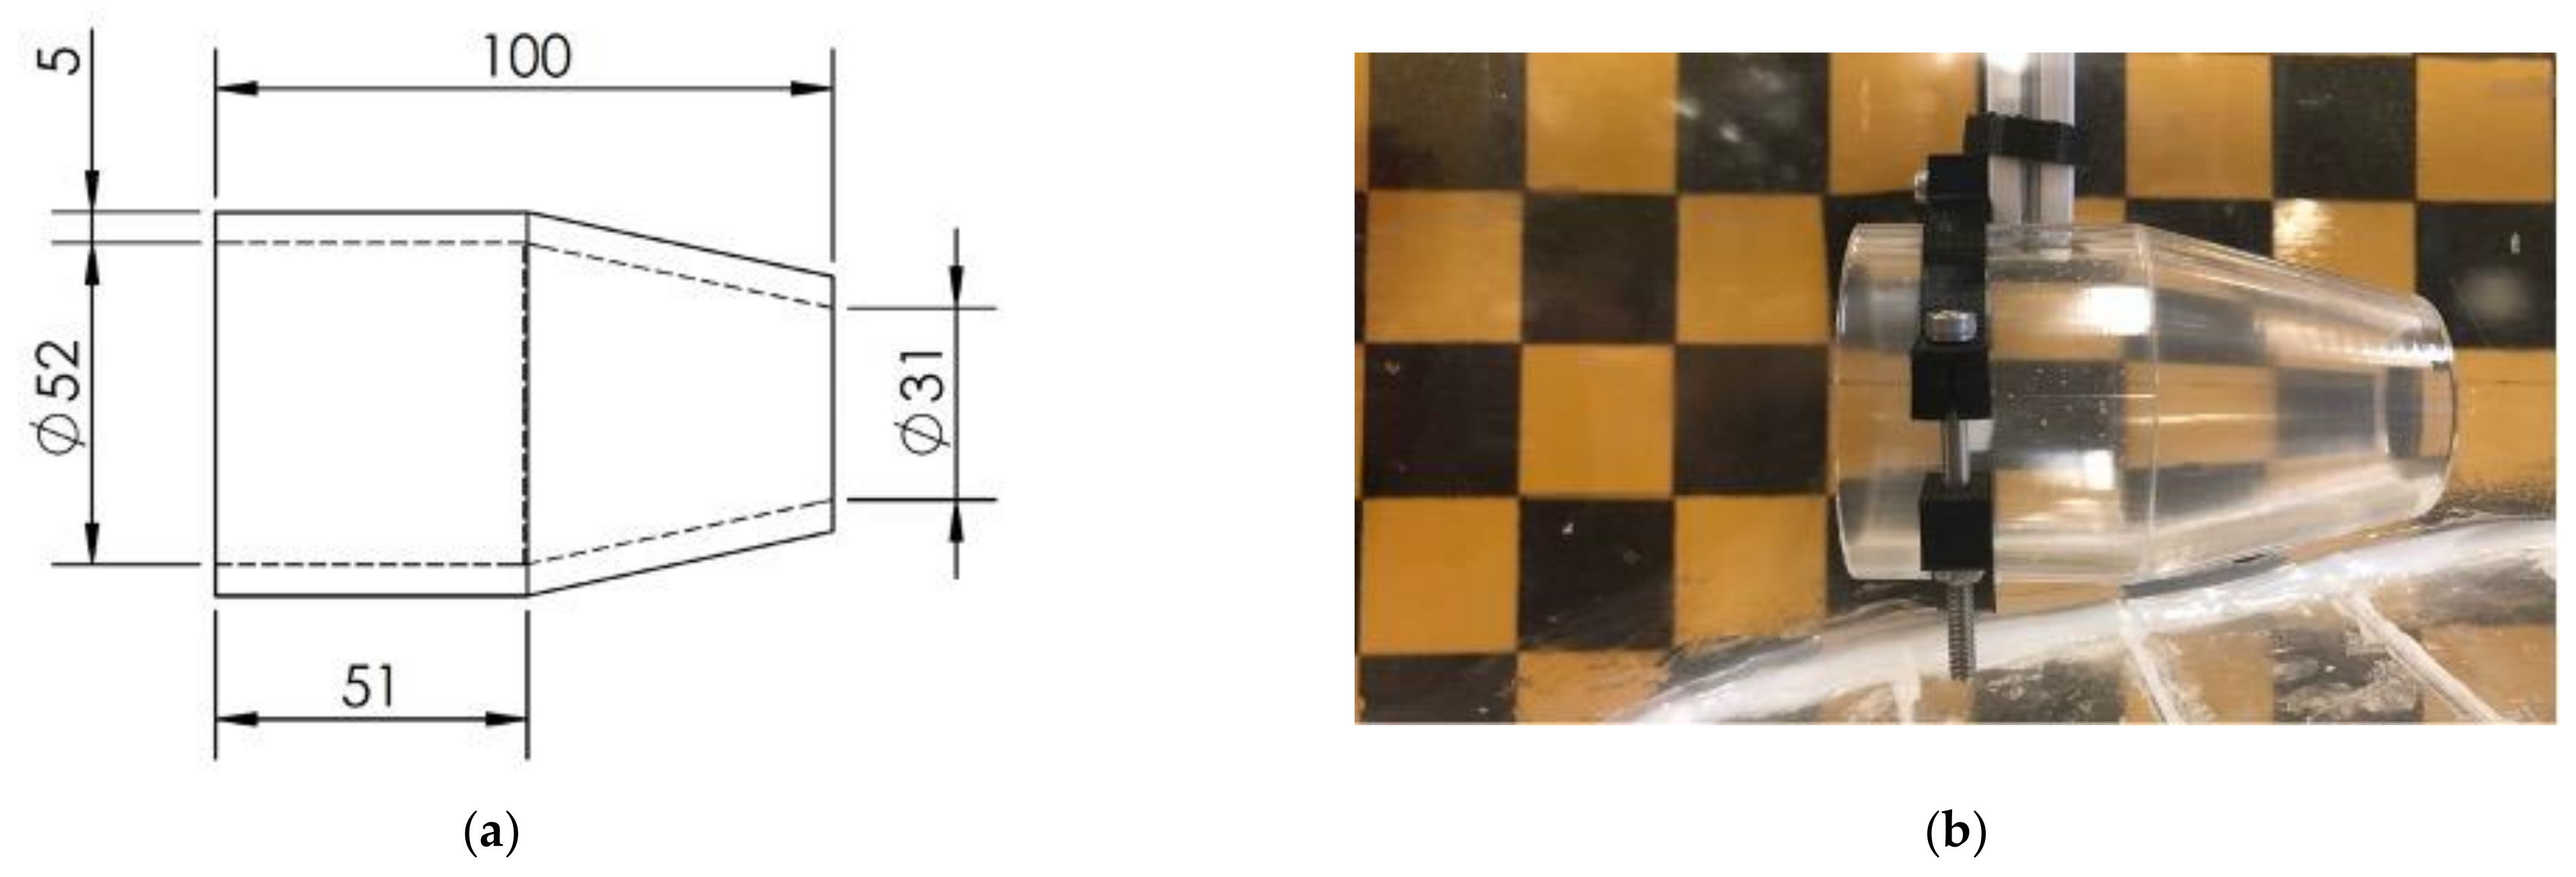
The 1:20 scale of the duct design can be seen in Figure 6a, with the dimensions shown in mm. The small-scale physical model made from acrylic tube is then mounted onto the extruded aluminum holder and fixed into the position using C-clamp, see Figure 6b. This small-scale physical model design consists of a straight tube, followed by a nozzle-like chamber following the one illustrated in Figure 4. The small-scale physical model of the duct is then placed at various positions relative to the location of the breaking waves.
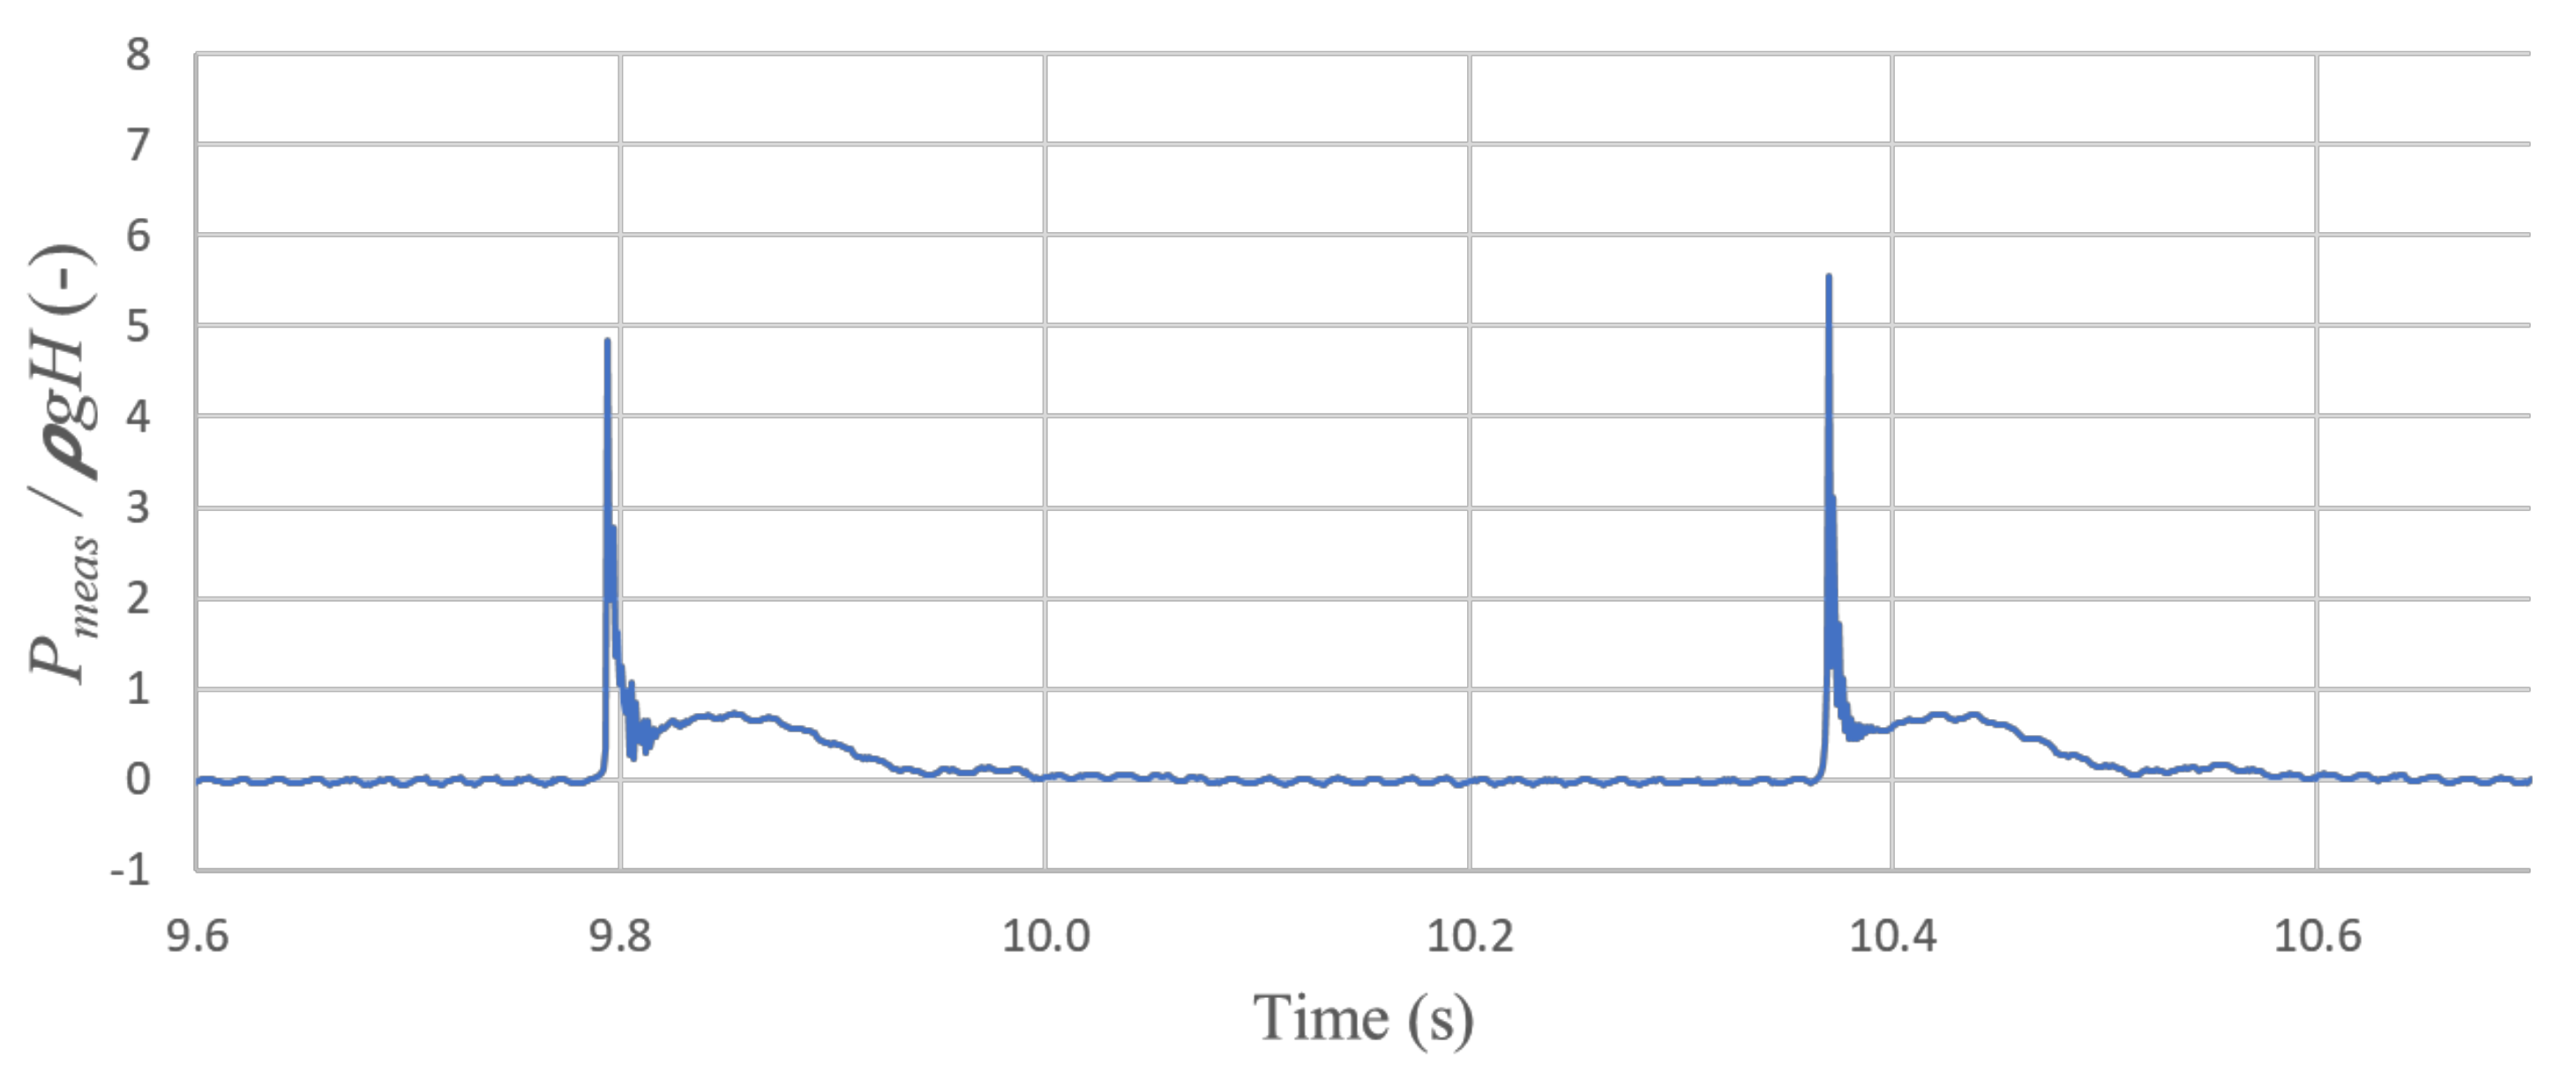
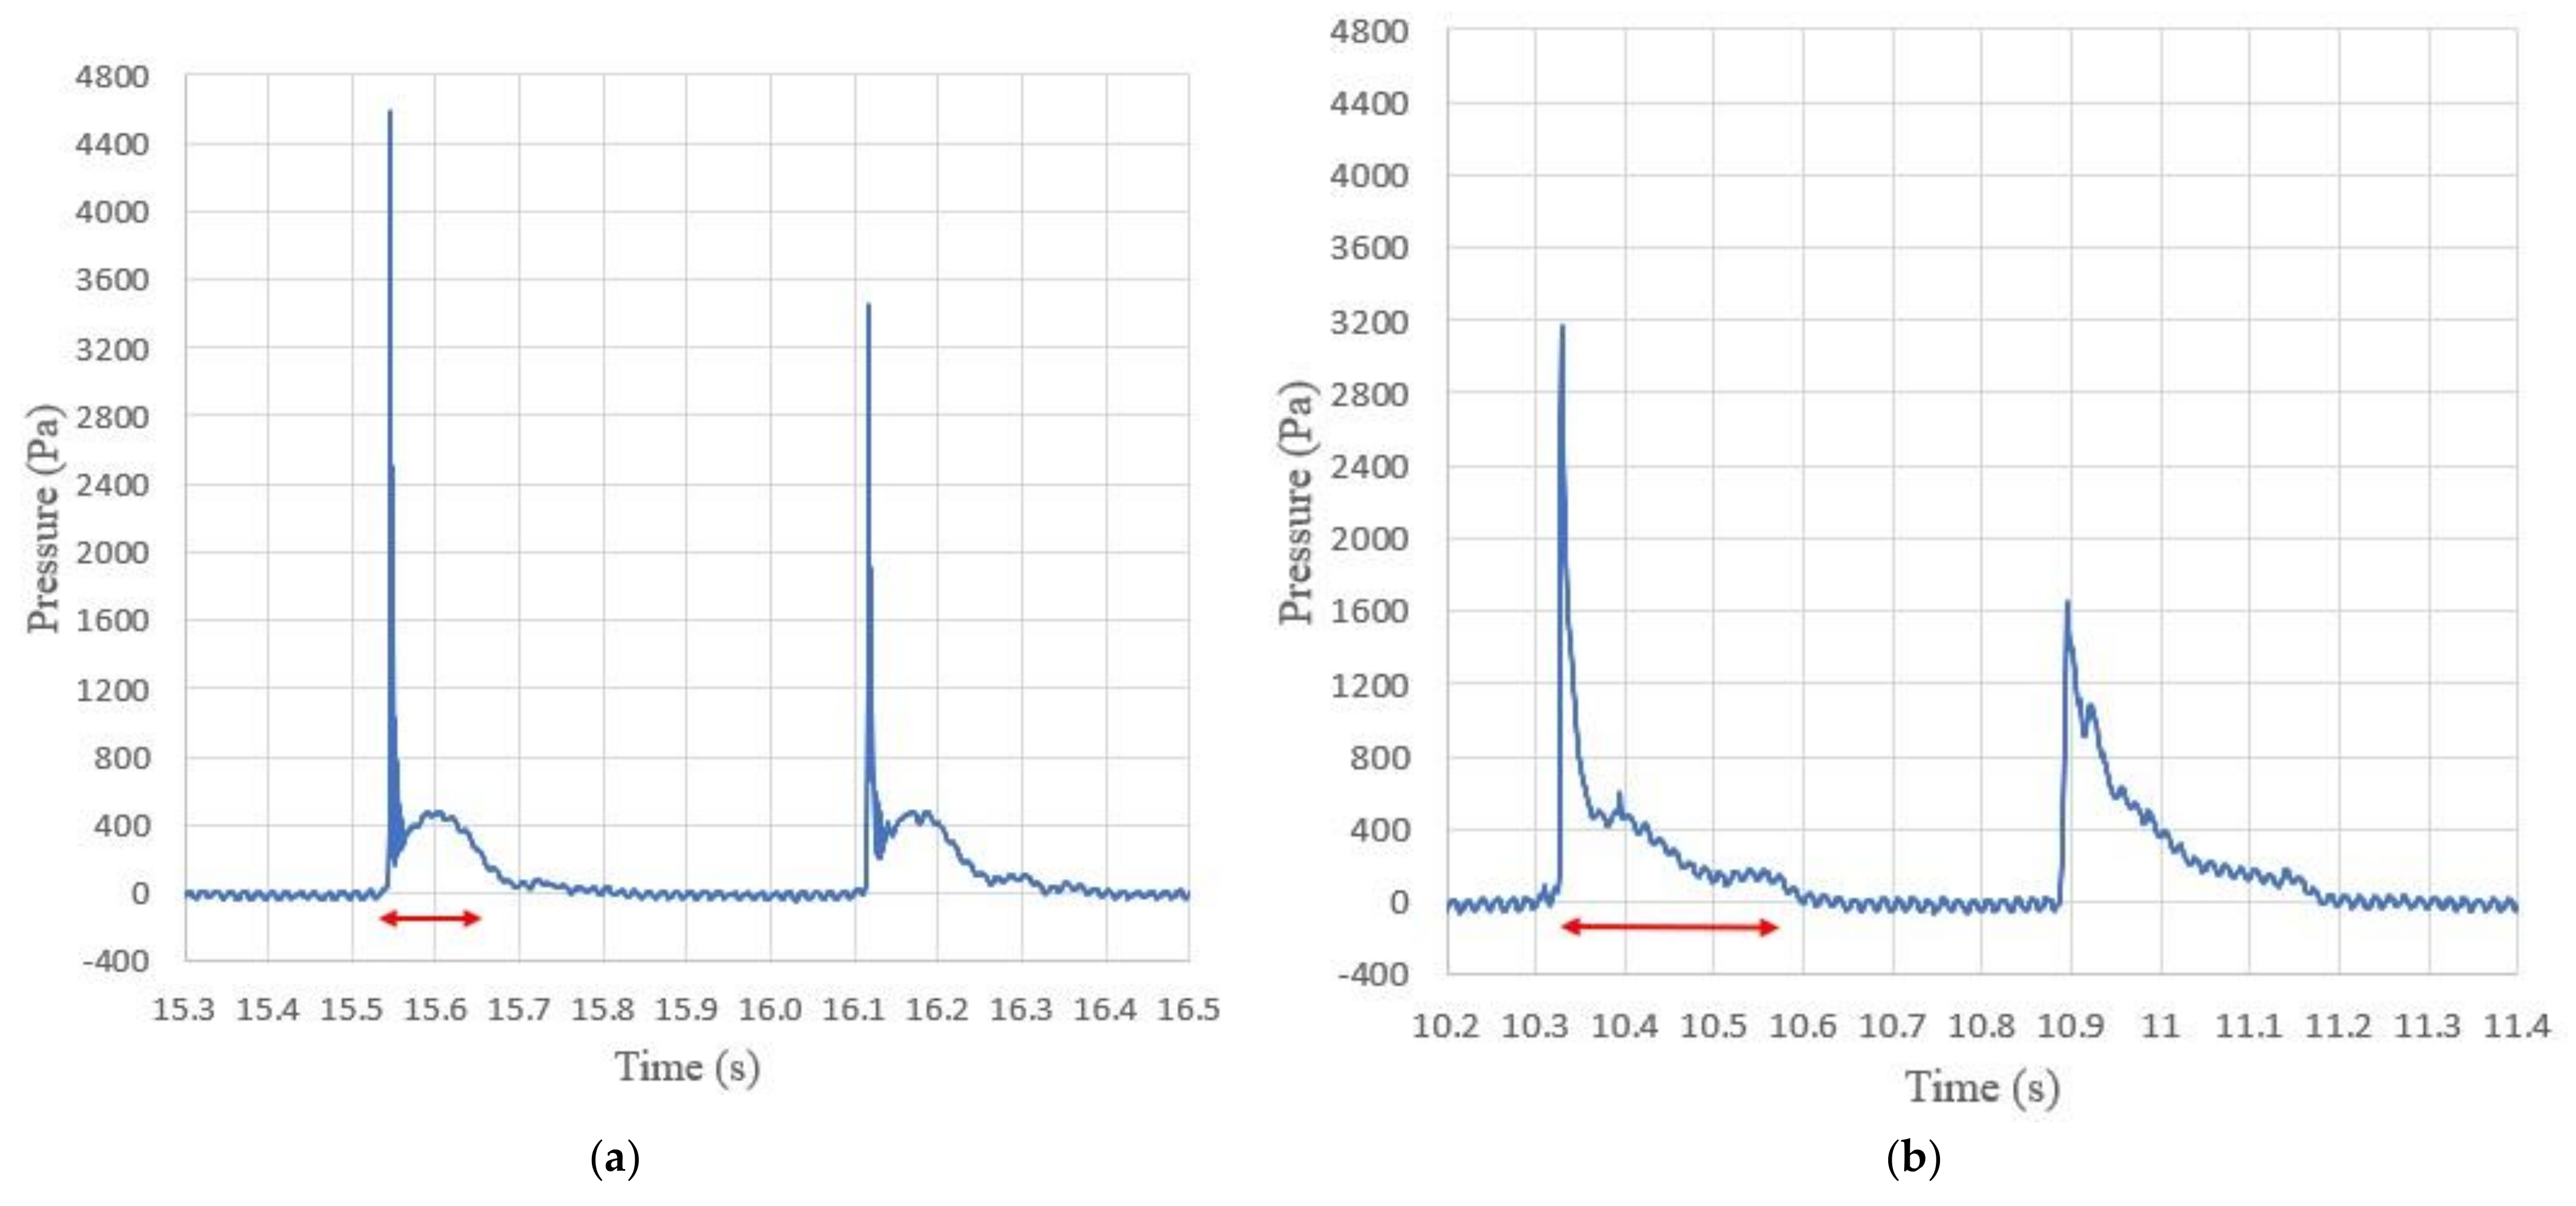
To measure the wave pressure as experienced by the turbine, a P-8300-501G-10 series made with a Nidec–Copal pressure transducer (PT) was placed at the outlet of the duct. The pressure transducer can measure up to 49 kPa with a response time of about 2 ms. The sensor has a diameter of 20 mm which is suitable to simulate the swept area of the scaled-down version of the turbine (about 29 mm). The pressure sensor is placed by itself to simulate a bare turbine configuration and placed at a 10 mm distance landward from the outlet of the duct to allow water to flow past the PT with minimum water reflection. This is also the scaled down distance between the duct and the turbine at full scale.
To get an accurate wave height measurement, a 240-fps high-speed camera was utilized to record a slow-motion image of the wave during experiment. A previously taken measurement grid image placed on the wall of the flume from the same camera angle and location is then superimposed to the recorded video to measure the incident wave height. Because the pressure measured in the current study is only focused on the landward wave pressure, the reflected wave is omitted in the current study and the reflection analysis was, consequently, not done.
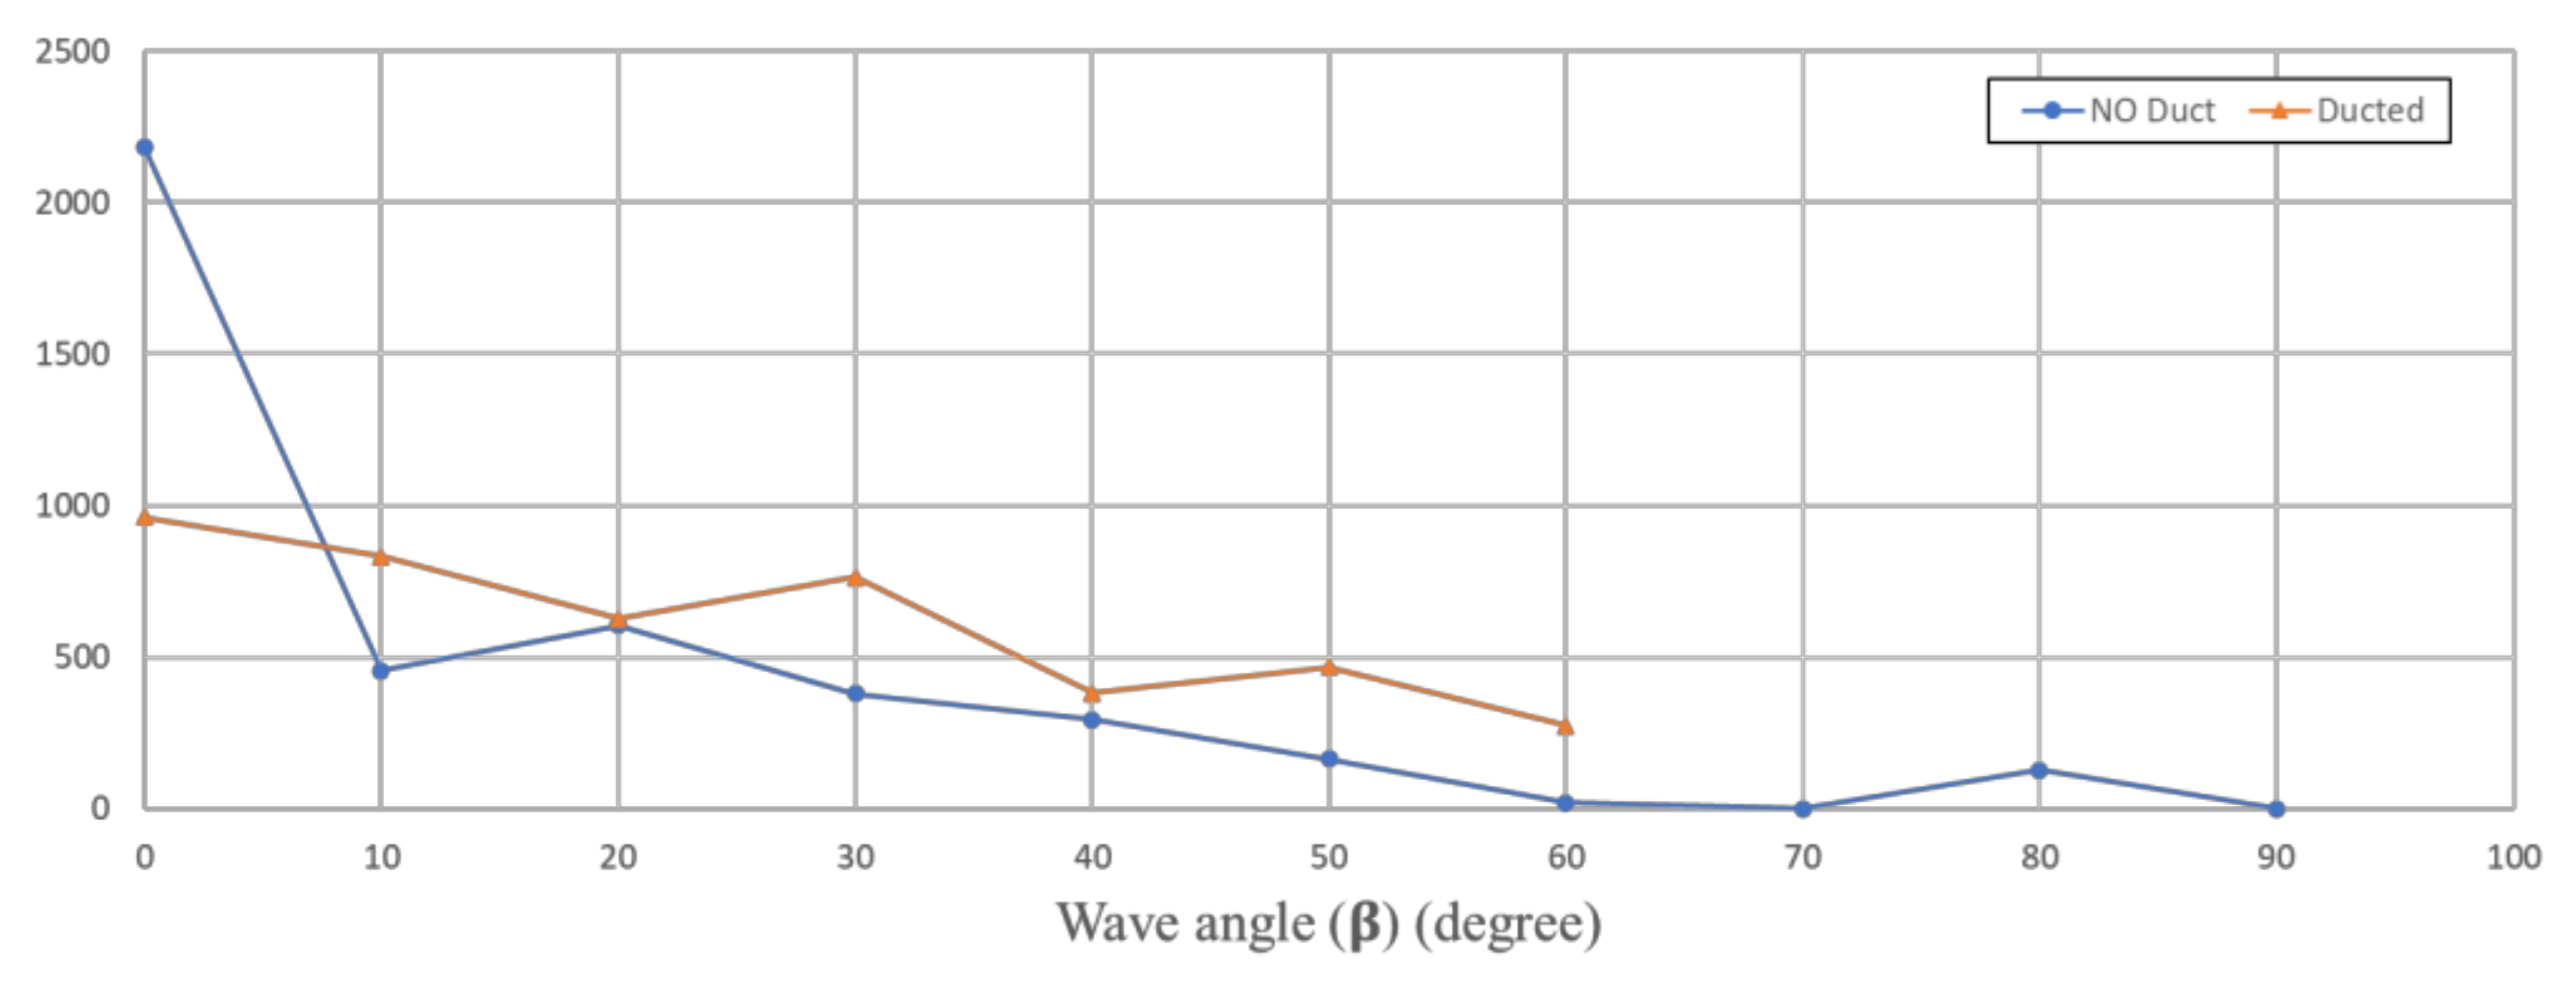
The second part of the experiment is to explore the influence of wave angle on the performance of the ducted OIST WEC. Wave angle is defined as the angle between the direction of the incident wave to the normal direction of the WEC device. Naturally, a significant wave angle will reduce the wave energy exposure to the turbine. Contrary to a bare turbine, a ducted turbine should be more sensitive to a big wave angle, as the angle between the incoming wave and the inlet of the duct could potentially prevent the water from entering the duct and flow through the power take-off. Due to this consideration, it is important to extend the characterization of the duct to include the directionality characteristics of the device.
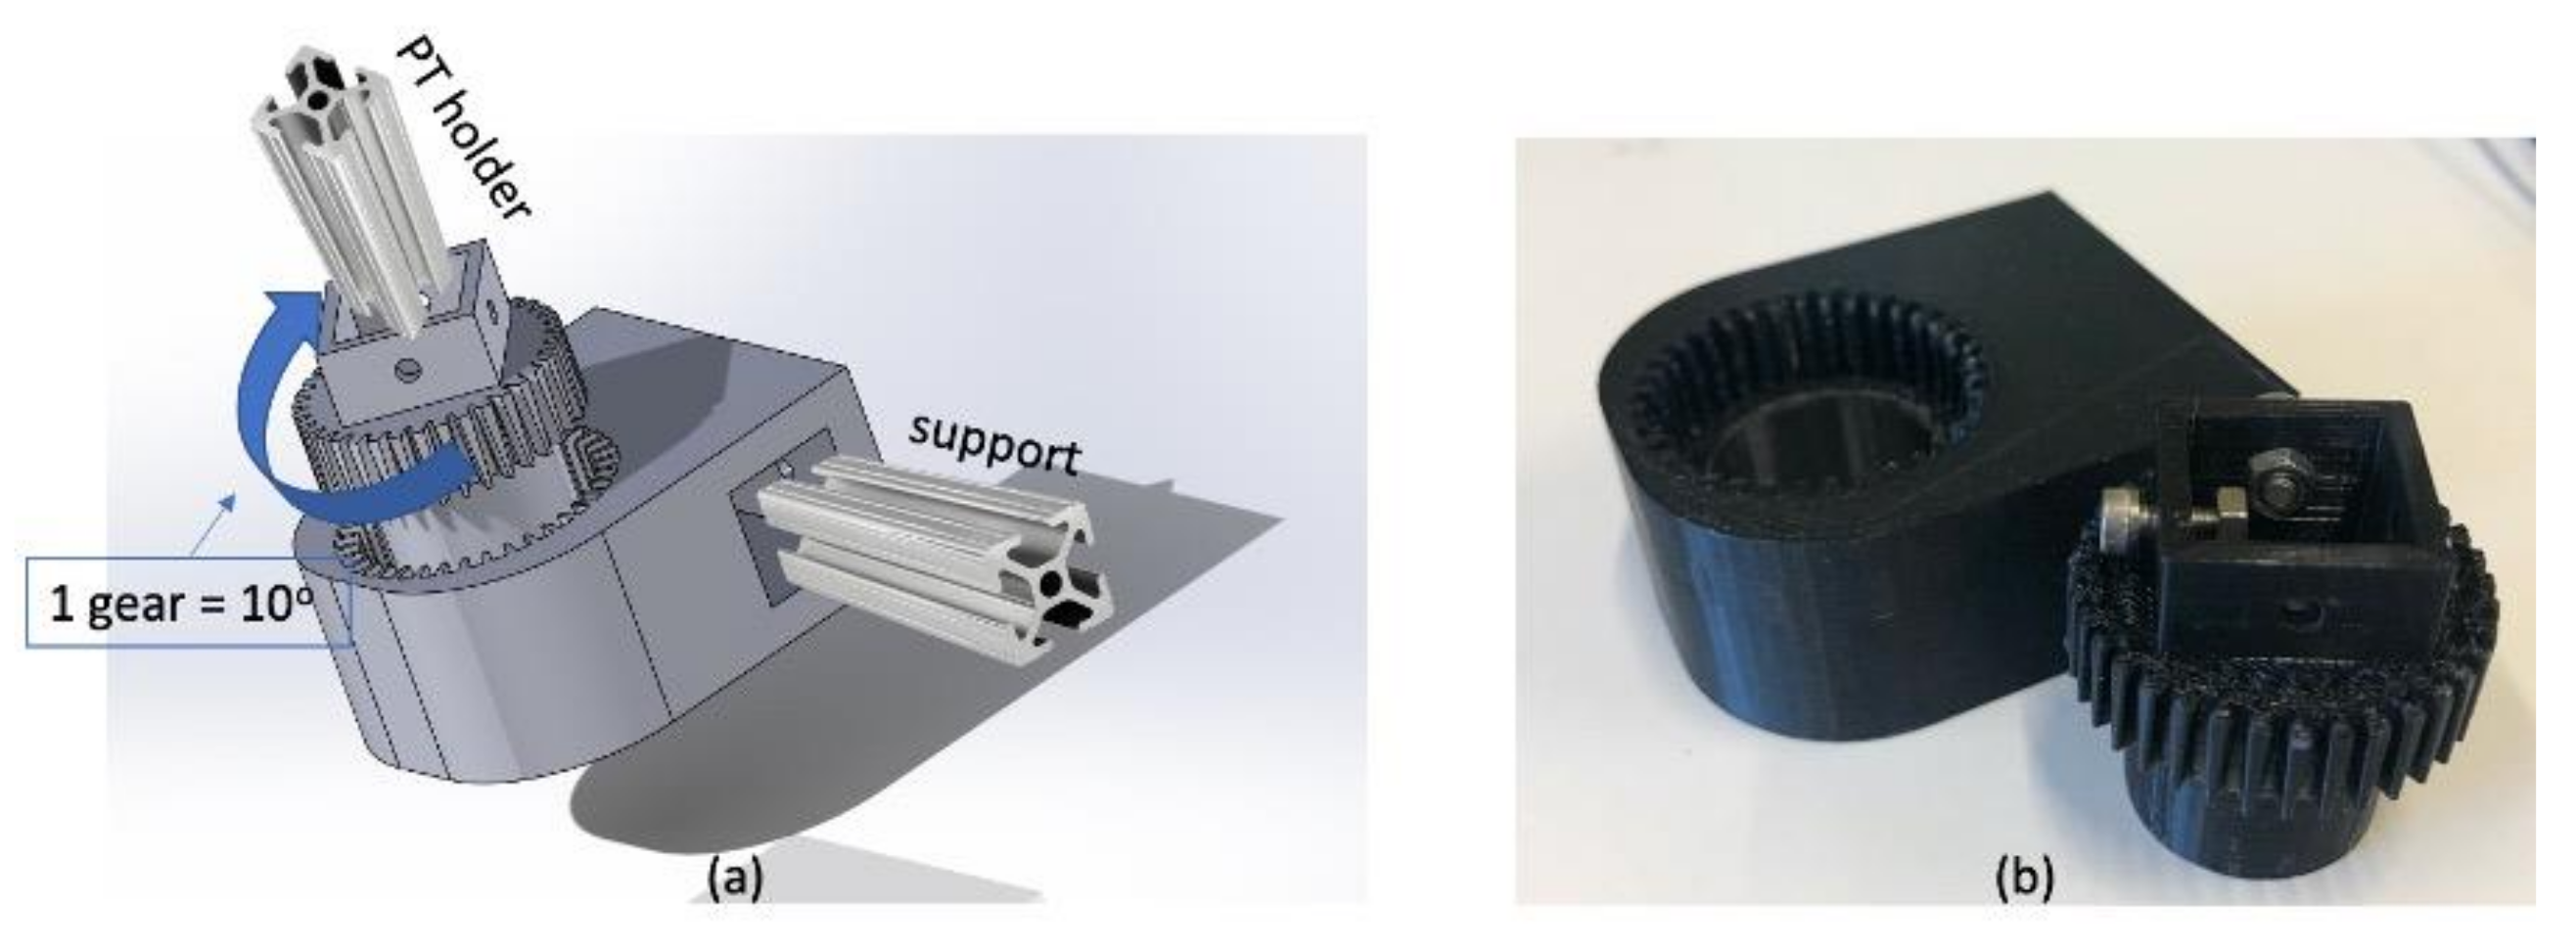
Due to the wave flume and wave generator limitation, generating an angled wave is not possible. So, to do the directional exploration, 3D printed holders were utilized allowing a multiple angle movement to the physical model at the same location. Figure 7a illustrates the holder design using Solidworks® with each gear representing 10° of rotation. The printed product made from tough polylactic acid (PLA) is shown in Figure 7b. This rotating mount is placed on the extruded aluminum holder of the duct as shown in Figure 6.
To record the pressure measured by the pressure transducer, a Graphtech® midi logger HV GL2000 series is deployed to record the pressure measured by the pressure sensor. The data recording frequency is 1000 Hz for a duration of about 15 s to 20 s with at least 10 clear breaking waves recorded. Furthermore, the location of the duct and the pressure transducer relative to the breaking wave position (
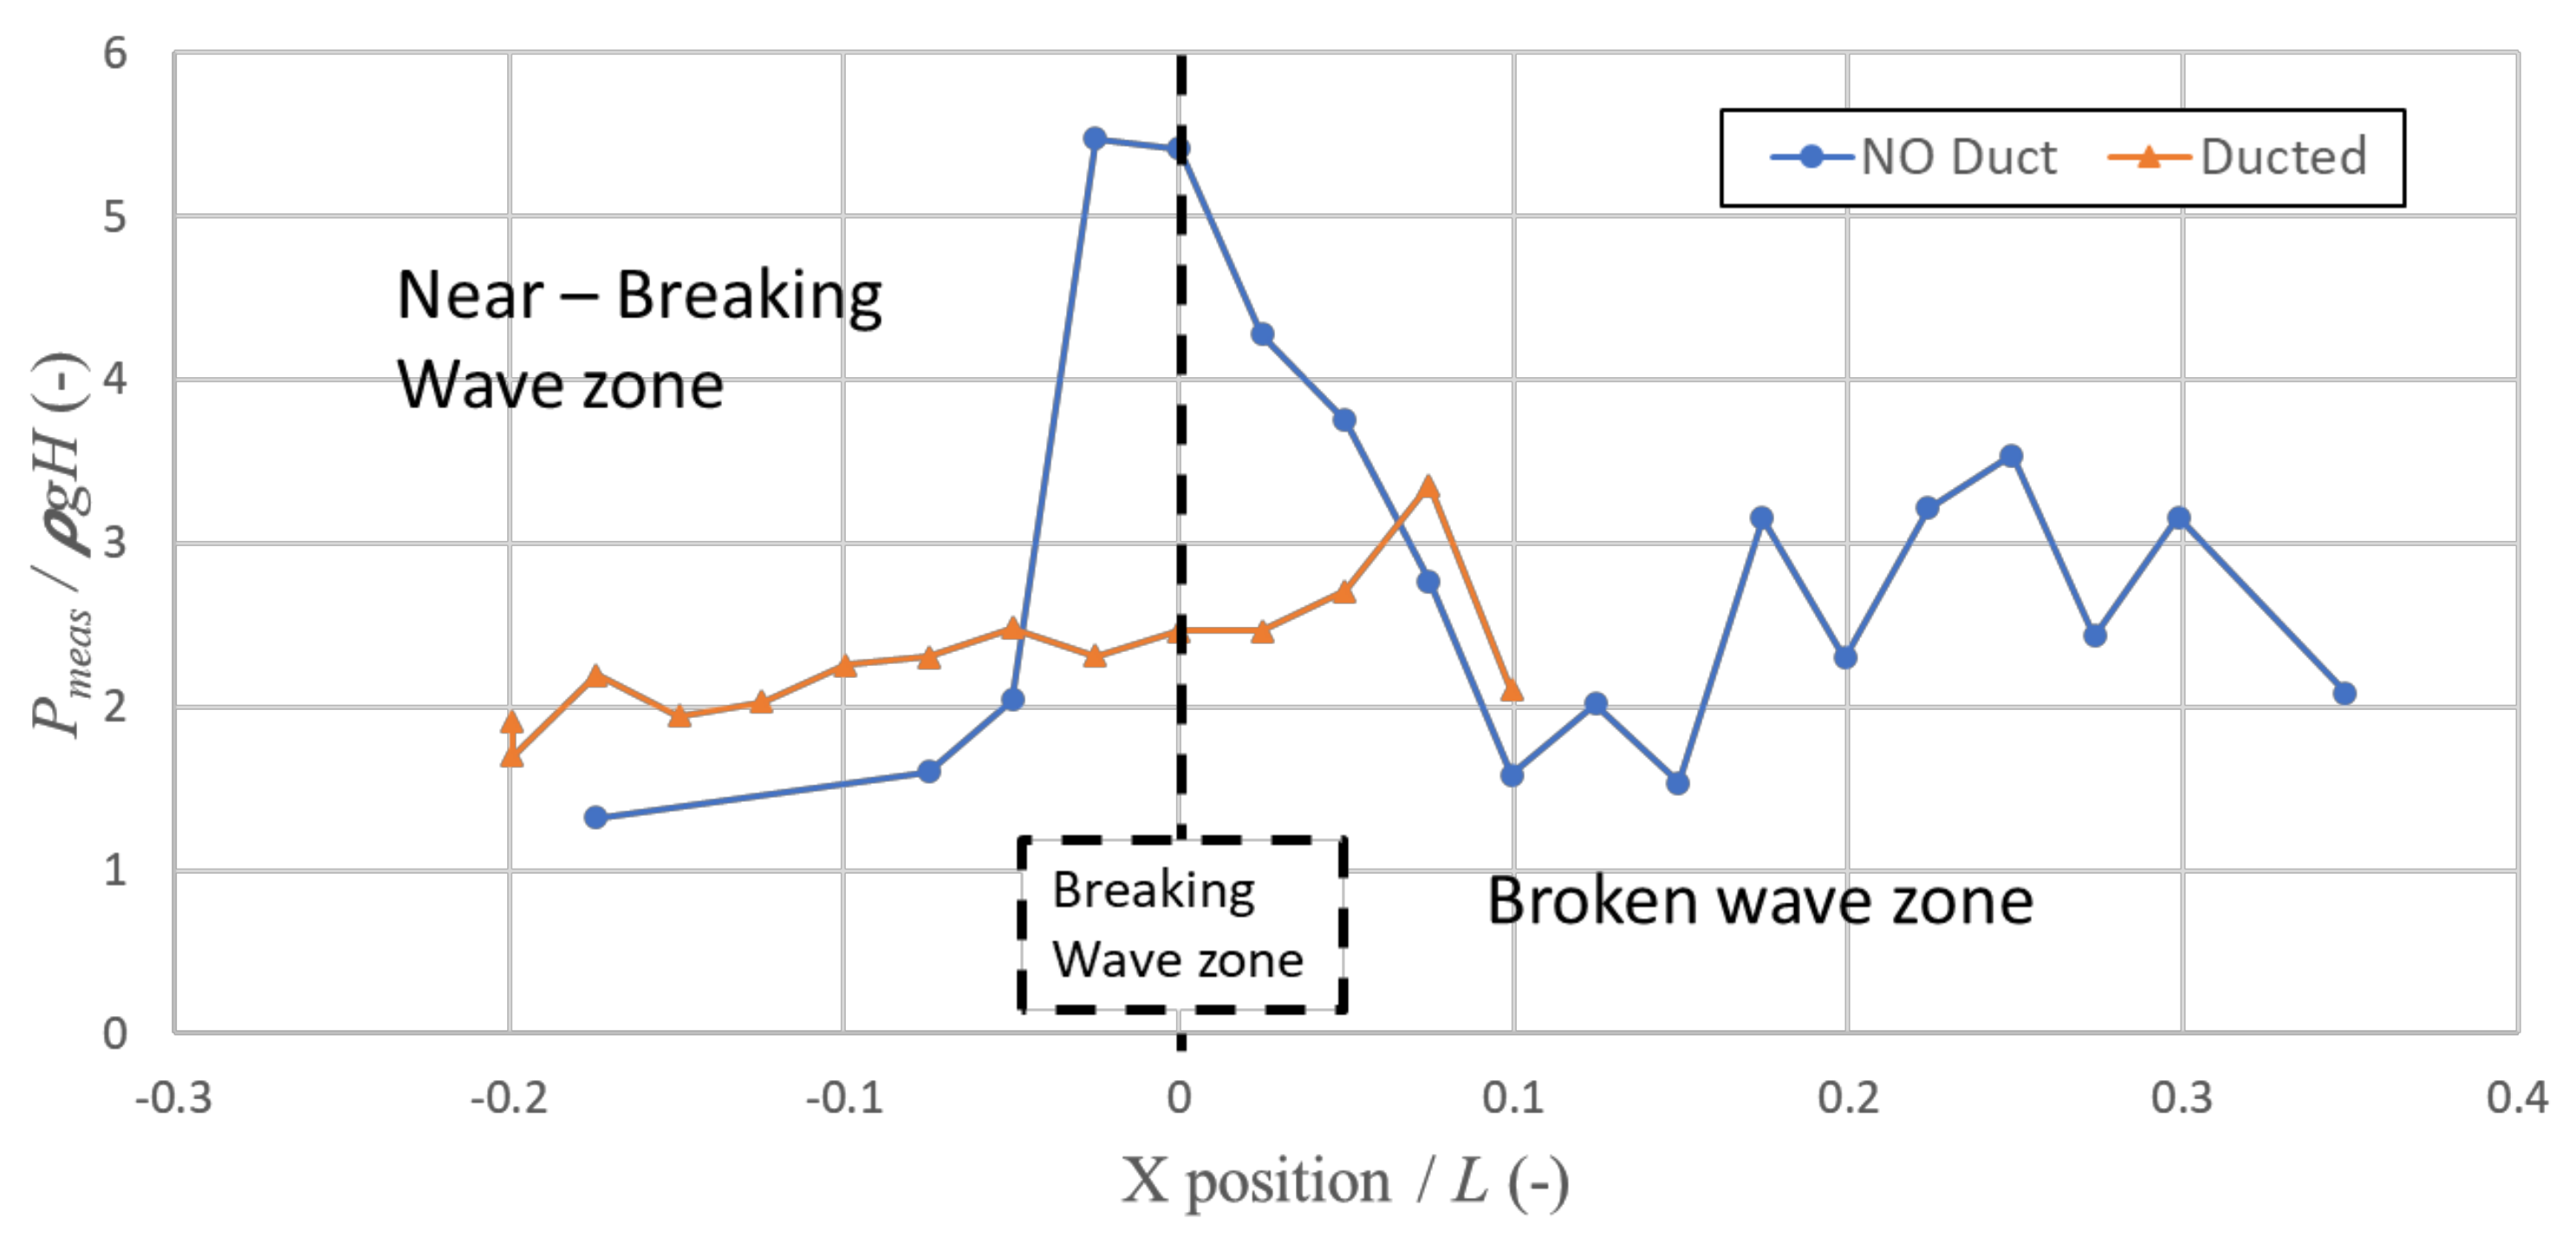
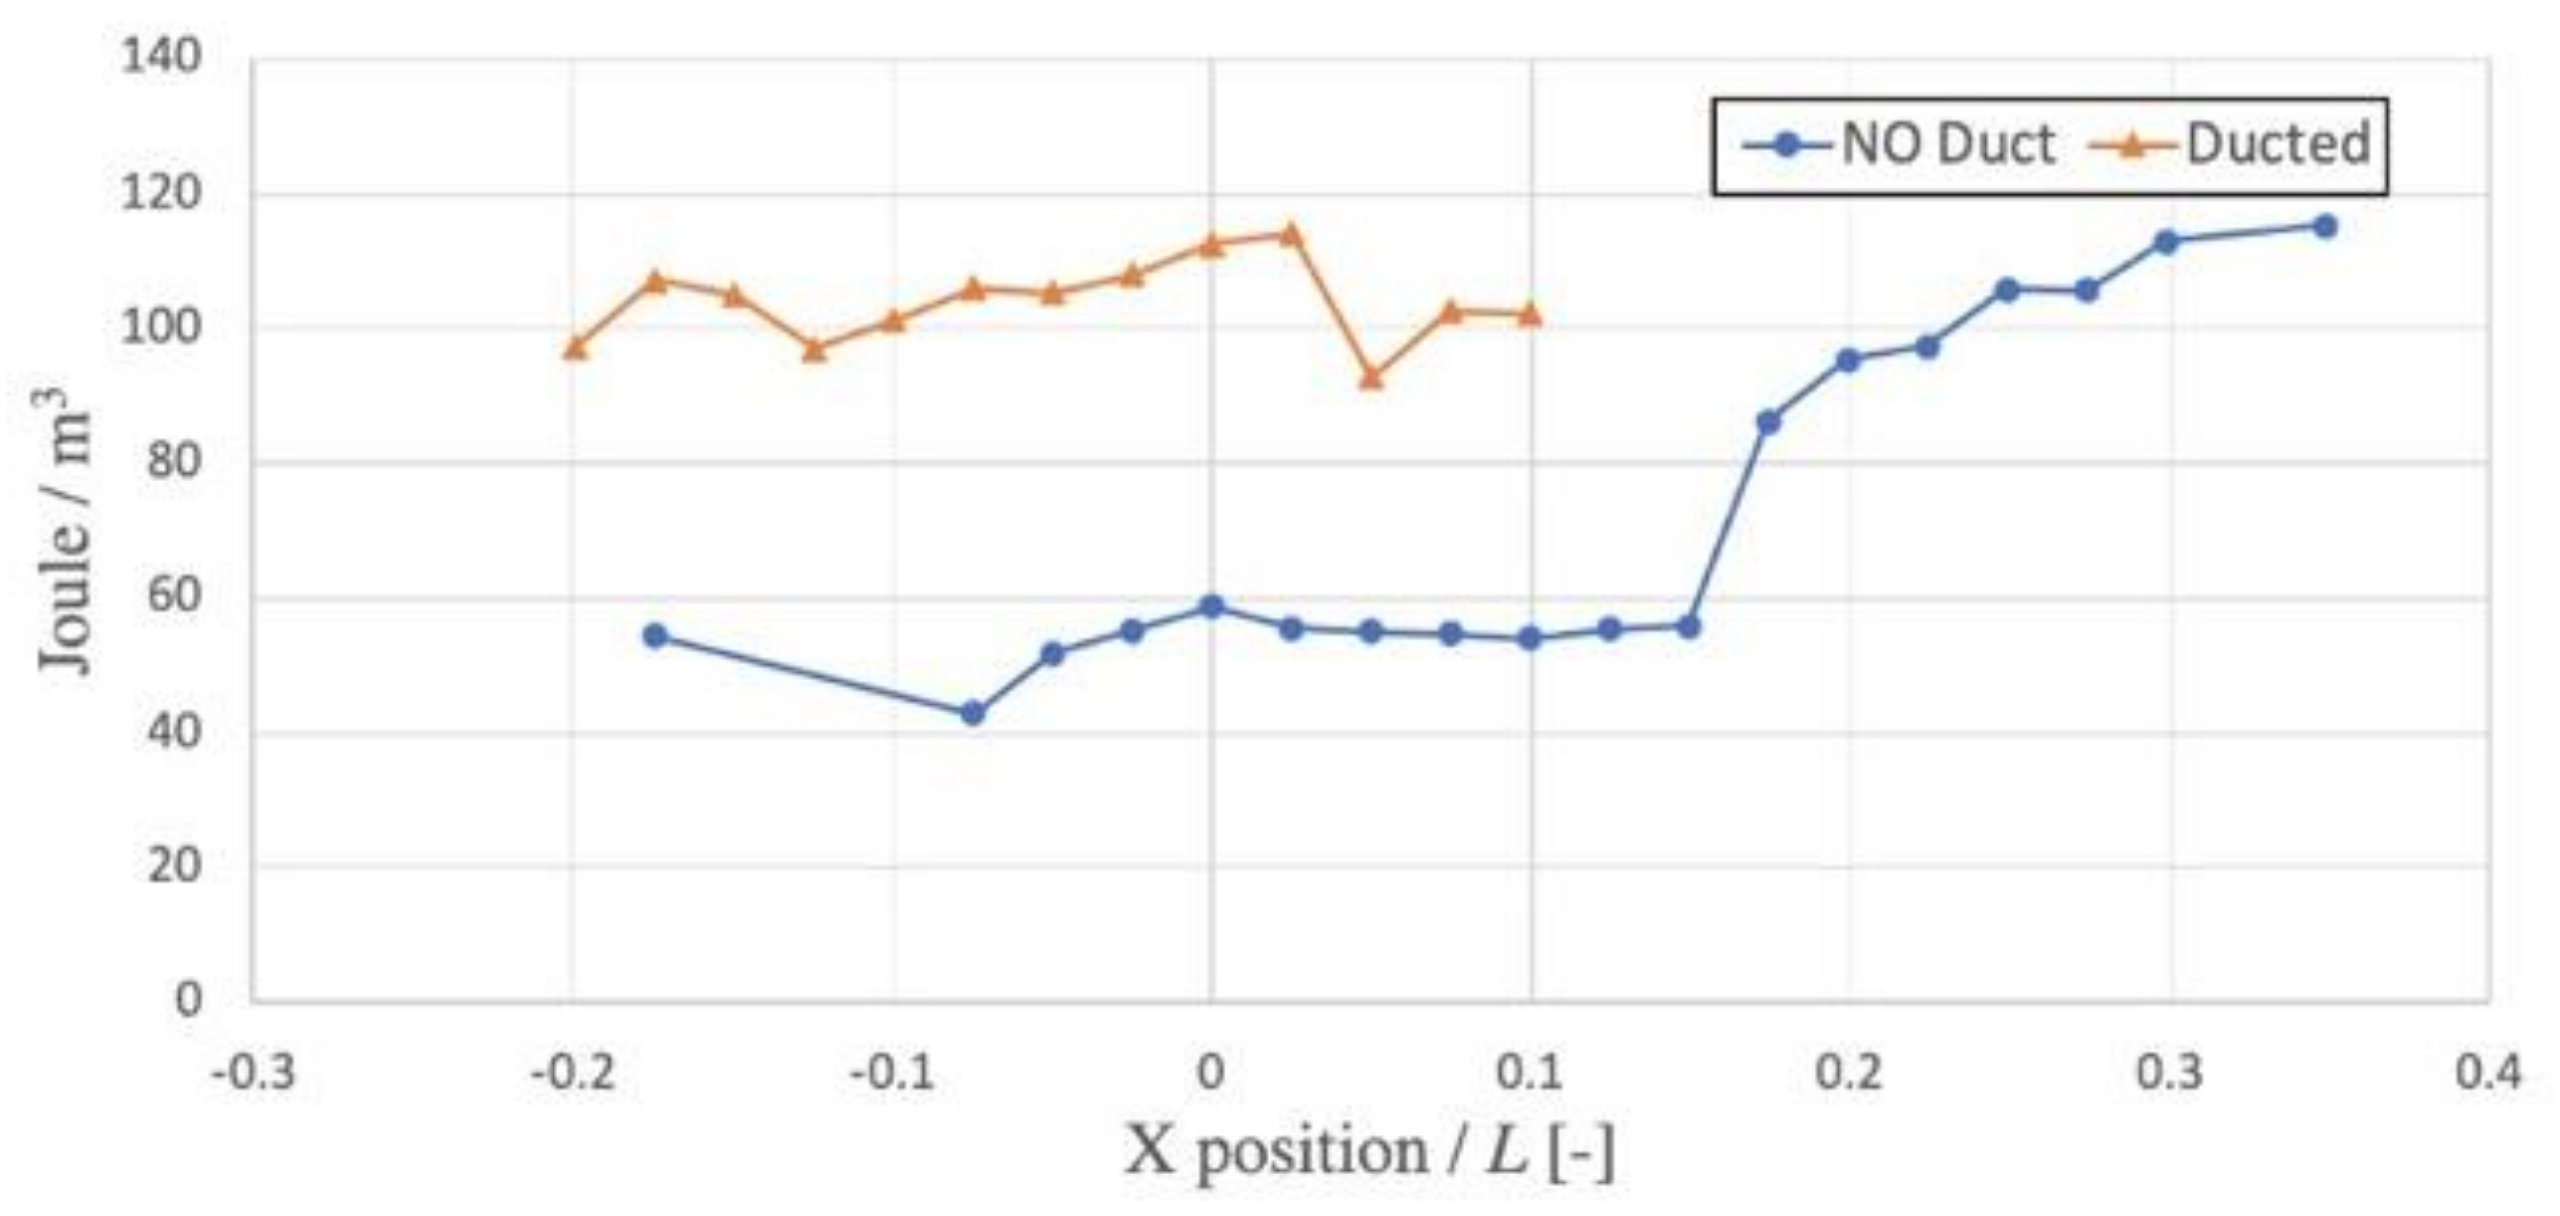
x/L) and the breaking wave height (y/Hbr), the corresponding water depth h, and the incident wave angle β used for the current study are shown in Table 1. For the bare turbine case (ND), the x/L and y/Hbr location indicates the location of the pressure sensor, while for the ducted case (DT) the x/L and y/Hbr location indicates the inlet of the duct with the pressure sensor located 10 mm landward from the duct’s outlet. Here, the x/L = 0 value indicates the location of the breaking wave, and the y/Hbr = 0 indicates the still water level.

3. Results and Analysis

3.1. Landward Pressure at Various Horizontal and Vertical Positions at β = 0°

The first case considered here is the wave angle (β) = 0° (wave coming from normal direction of the device) case. For this, the measurements were done at multiple horizontal positions relative to the shallow water wavelength and at multiple vertical elevations, relative to the wave height, with zero indicating the still water level. Measurements were done twice, once with only the pressure sensor to measure the pressure experienced by a bare turbine, and then another one with the duct attached in front of the pressure sensor. It is important to note that for the bare pressure sensor case, the location is stated at the PT location, while for the case where the duct is deployed, the location stated is at the inlet of the duct, not the PT location.
Figure 8 shows the comparison of pressure measured at the still water level of the bare pressure transducer (blue circle) and the ducted case (orange triangle). The y-axis shows the impact pressure measured, normalized using the hydrostatic pressure (ρgH) where ρ is water density at 25 °C, g is gravitational acceleration, and H is the wave height of 0.07 m. The x-axis, on the other hand, represents the location of the measurement relative to the breaking position (zero value) and normalized with the shallow water wavelength in accordance with the linear wave theory of period (T) = 0.057 s.
As demonstrated in Figure 8, the swl impact pressure is at its highest at or near the breaking wave for the bare turbine case (blue circle), up to about 5.5 times the hydrostatic pressure. This result agrees with the impact pressure measured by [35,36,37] on a vertical wall breakwater. When placed on the broken wave zone (positive x-axis value), the pressure is drastically reduced until x/L = 0.1 and then rises again. This increase in pressure is observed to be the result of the breaking trajectory, where the lowest landward pressure (x/L = 0.1) occurs, as the tip of the breaking wave curves downward due to gravity and then “plunges” forward after touching the water surface (x/L > 0.1).
The ducted case (orange triangle) on the other hand shows a very steady pressure measurement along the breaking position. Both the non-breaking wave zone and the broken wave zone have a higher pressure. This indicates the duct reduced the impulsive pressure due to breaking waves from around 5.5 times to 2.6 times the ρgH, a reduction by a factor of about two. This may reduce the possibility of failure associated with breaking wave impact, which is generally considered as one of the main sources of a coastal structure’s failure [38]. As pressure is expected to be lower towards a further seaward direction, the exploration for the ducted case is stopped at x/L equal to 0.1. In addition, while water will flow past the turbine (unlike a breakwater), the duration of the impact is also crucial in determining how much energy can be harvested. Based on these results and to simplify the analysis, the observation will be divided into three regions: Near-breaking wave (x/L < 0), broken wave (x/L > 0), and breaking wave (x/L = 0) zones.
Figure 9 shows the impact measurement time-series data of Figure 8 at x/L = 0 of the no duct case. The rise time (tr), defined as the time from minimum pressure to maximum pressure, of 0.003 s, can be considered as between severe to moderate impact [39], with the quasi-static loads following behind the impact. Given the reaction time of the turbine is much larger than tr [40], the turbine may not be able to utilize the momentum before water flow passes the turbine. This is another important function of the duct, as it is expected to enable the reduction of impact, which may lead to a shorter rise time, giving the turbine more time to react to incoming wave flow.
It is important to identify if the reduction of impact pressure leads to an increase in energy exposure to the power take-off mechanism. For this comparison, the energy (Joule) per m3 of water per wave is calculated based on the area under the pressure time series for each wave cycle. The pressure time series plotted in Figure 10 appears to support this statement, as the figure is arranged similarly to Figure 9, with the bare turbine case (blue circle) and the ducted case (orange triangle). The ducted case measurements indicate that the turbine is exposed to almost twice the energy of a bare turbine. There is a significant increase after x/L = 0.15 in the bare turbine case, as the same location could not test the ducted case due to the pressure sensor touching the seabed in the small-scale model. It is, however, expected to have a similar increasing trend in practice as the duct should act like a concentrating channel. It is also observed that the significant increase in impact pressure shown in Figure 9 does not lead to a higher energy exposure to the turbine.
Cases observed so far are around the still water level. However, because of the ocean tide, the location of a deployed device relative to the swl will change over time. Further exploration on multiple vertical elevations is important and can be seen in Figure 11 (at the breaking wave location) for the no duct case. The y-axis in the figure represents the normalized vertical elevation divided by wave height (H), while the x-axis shows the pressure measured, normalized by ρgH, where ρ denotes water density at room temperature and g represents gravitational acceleration. The circular blue line represents the highest impact pressure measured in each case, with the highest pressure measured around y/Hbr = 0.4. It is important to note the zero-valued wave amplitude represents the still water level with a maximum pressure measured up to 8.5 times the hydrodynamic pressure.
The exploration is then done for multiple locations for both near-breaking wave regions (negative x/L) and broken wave regions (positive x/L). The results can be seen in Figure 12, although, unlike the previous figure, the graphs are shown together with the same range for both the x-axis (pmeas/pgH) and y-axis (vertical elevation/H). Furthermore, in addition to the maximum pressure measured (blue circle), the average of the 10 pressures (green rectangular) is added. The locations of each measurement (x/L) are represented below the y-axis of each figure. A simplified breaking wave illustration is added to the figure and intended as a visual aid and not as a representation of the actual breaking wave measured during the experiment. Both the x-axis and the y-axis range are kept the same for all of the cases.
As demonstrated in Figure 12, in the near breaking wave zone, the maximum wave pressure (blue circle) occurred around the wave amplitude of y/Hbr = 0.5, with the highest pressure appearing to be up to seven times the hydrodynamic pressure at around x/L = 0.25. The average of 10 waves of pressure (dashed green square), however, shows a consistent maximum pressure of about 5ρgH for both cases. The pressure profile, furthermore, is quite different for the near-braking wave when compared to the broken wave zone. At breaking position, the pressure has a wider higher-pressure profile starting from the swl up to y/Hbr = 0.6, while in the near-breaking zone, the significant landward pressure is mainly measured only around the wave amplitude. This near breaking condition may create a twisting torque in the wave energy device during operation, which may lead to the device overturning or fatigue failure. In the broken wave zone, on the other hand, the energy dissipates and spreads relatively more uniformly along the vertical elevation.
Figure 13 shows pressure measurement once the duct is incorporated and is displayed in a similar way. Three measurement locations were carried out, to represent: Near-breaking wave zone, breaking wave zone, and broken wave zone for both the maximum pressure (solid orange line diamond) and the average of 10 pressure measurements (dashed grey asterisk). The pressure measured shows a more uniform profile above the still water level (swl) for every location. The x-axis, which shows the normalized pressure measurement (pmeas/ρgH), is kept in the same range as Figure 11 to make the comparison clearer. This shows that the duct managed to reduce the incoming impact pressure at all positions and also managed to redistribute the pressure in the near-breaking wave zone more evenly. In the near-breaking zone, the duct reduced the impact pressure received by the turbine by a factor of 1.9 from about 7 to 3.6 times the hydrostatic pressure. In the breaking wave position, the duct is even more effective in suppressing the impact pressure by a factor of 2.2, from 8.6 to about 3.8 times the hydrostatics pressure. In the broken wave zone, the duct had minimal impact on the pressure as both the no duct case and the ducted case show similar pressure measurements of around 5.5 ρgH. This is expected in this zone because most of the wave’s energy has been dissipated. Furthermore, looking at the difference between the maximum pressure measured and the average 10 highest waves of the same case, one can see that the duct could reduce the unpredictability of the impact pressure experienced by the power take-off mechanism.
Moving from the impact pressure, Figure 14 shows the wave energy expected to be experienced by the turbine per m3 of water (Joule/m3) (x-axis) at the breaking wave position at various vertical elevations (y-axis). Here, the duct appears to increase the turbine’s exposure to the wave energy when compared to the bare turbine case. If the 0 (still water level) ≤ y/Hbr ≤ 0.5 (wave amplitude) region is considered the main operational elevation of the device, then it can be shown that incorporating the duct into the design will increase the exposure of the turbine to 1.6 times more wave energy when compared to a bare turbine.
In addition to the breaking wave position, Figure 15a,b show the results of the experiments for the near-breaking wave zone and the broken wave zone. The duct appears to increase and focus the energy so that the energy exposure per m3 of water is higher near the still water level but may reduce quickly as it goes passed the y/L = 0.5 elevation. Nevertheless, in operational elevation, the duct may expose 1.3 time more energy to the turbine in both the near-breaking wave zone and the broken wave zone.
This additional energy exposure can occur due to the duct not only reducing the impact pressure, but also lengthening the period where the water flows past the turbine as shown in the pressure time series data. Figure 16a shows the pressure time series for the no duct case where the impact rise time was very high and dropped immediately, followed by the quasi-static pressure from the wave crest before the pressure became flat due to water falling below the turbine location during the wave’s trough. Once the duct was added, see Figure 16b, the pressure flattens for longer durations (red arrows), thus increasing the potential of energy absorption by the power take-off.

3.2. Wave Angle (β) Effect to the Performance of the Ducted OIST WEC

The measurements result of the average of 10 highest horizontal wave pressures measured can be seen in Figure 17. As expected, the pressure significantly reduces once the wave reaches the device at an angle. Interestingly, both the ducted case (orange triangle) and the no duct case (blue circle) exhibit similar results after just 10° of wave angle. Relatively low landward wave pressure was measured at β > 60°.
Figure 18a shows the average wave pressure measurements for both the ducted case and the no duct case with the average pressure normalized by the maximum average pressure of each case. A cosine function line (blue) is added as theoretical guidance as the pressure experienced by the turbine at an angle should be a cosine function and therefore should follow this line. The measurements show that the no duct case appears to consistently follow this line. For the ducted case, on the other hand, it follows the line up to around β = 40°, then it begins to decline, meaning the reduction in wave energy exposure to the turbine is more than anticipated when the duct is added to the overall device after this critical angle. However, it is important to note that less impact pressure does not equate to less energy exposure. Figure 18b shows that in terms of energy exposure per m3 of water the duct still provides an advantage compared to the no duct case by a factor of two up to about β = 40° and declining up to β = 60°. Any angle larger than this is expected for the duct to have a negative impact on the device’s performance because there may not be enough water to enter the duct’s inlet, thus limiting the waterflow through the turbine.

4. Conclusions

A challenging wave energy converter design placed in a breaking wave zone was introduced in 2016. This WEC project, run by the Okinawa Institute of Science and Technology Graduate University (OIST), aims to take advantage of the breaking wave energy to harness electricity. The directionality of the incident wave plays a big role in a device’s performance, leading to the placement of an energy converter in a place where the wave typically travels in a narrow band of directional wave (toward the coast). This may lead to a more specifically designed device, enabling higher efficiency in the future. The initial testing of the device, including a full-scale prototype deployment in Maldives has been described in Section 2.
A campaign of experimental exploration was carried out to comprehensively observe the effect of adding a duct structure to the early design of the OIST Wave Energy Converter device. The exploration was divided into three regions of near breaking, breaking, and broken wave zones.
For the near-breaking zone, it was observed that adding the duct into early designs of the WEC not only reduces the impact pressure by a factor of 1.9, but also increases the wave energy exposure to the turbine by 1.3 times at the main operational elevation of 0 (still water level) ≤ y/Hbr ≤ 0.5 (wave amplitude). In the broken wave zone, the duct had less effect on the reduction of the impact pressure; however, it managed to increase the energy exposure by 1.3 times to the power take-off mechanism, similar to the near-breaking location results. In the breaking wave zone, a 1.6 higher increase in wave energy exposure was recorded with the ducted case compared to that of the no duct case, while the duct also managed to reduce the impact pressure by a factor of 2.2.
Continuing the wave angle exploration, both the no duct case and the ducted case were exposed to multiple directional waves. The test was done for the breaking wave position at still water level (y/Hbr = 0). The results show that the no duct case follows a cosine function as expected with the impact pressure significantly reduced once the wave hits at an angle, even as small as 10°, and becomes similar to the ducted case results. For the ducted case, however, it is found that 40° wave angle (β) was the critical angle where the performance becomes significantly worse at any angle greater than this. The duct, however, still provides a beneficial influence on the device performance up to β = 60°. From this, one can expect the duct may prevent the waterflow to the turbine at any degree greater than that.

Author Contributions

Conceptualization, K.A.P., S.M., J.F. and T.S.; Formal analysis, K.A.P. and T.S.; Methodology, K.A.P. and H.A.; Supervision, T.S.; Writing–original draft, K.A.P.; Writing—review & editing, K.A.P., H.T., H.A. and T.S. All authors have read and agreed to the published version of the manuscript.

Funding

This work is supported by Kokyo Tatemono Co. Ltd. Research Trust fund for Ocean Energy Project and Okinawa Institute of Science and Technology Graduate University Proof of Concept program. APC was funded by the internal funding of OIST.

Institutional Review Board Statement

Not Applicable.

Informed Consent Statement

Not Applicable.

Data Availability Statement

Data is available upon request to the corresponding author.

Acknowledgments

The authors would like to express gratitude to the OIST mechanical workshop team without whom we will never be able to finish the experiment. The work in Maldives is done in collaboration with the Maldives Ministry of Environment and Energy and the Government of the Republic of Maldives. This work was supported by Kokyo Tatemono Co. Ltd and the Okinawa Institute of Science and Technology Graduate University.

Conflicts of Interest

The authors declare no conflict of interest.

References

  1. Whittaker, T.J.T.; Beattie, W.; Folley, M.; Boake, C.; Wright, A.; Osterried, M.; Heath, T. The Limpet Wave Power Project–the first years of operation. Renew. Energy 2004, 29. [Google Scholar]
  2. Falcão, A.F.; Henriques, J.C. Oscillating-water-column wave energy converters and air turbines: A review. Renew. Energy 2016, 85, 1391–1424. [Google Scholar] [CrossRef]
  3. Heath, T.; Whittaker, T.J.T.; Boake, C.B. The design, construction and operation of the LIMPET wave energy converter (Islay, Scotland) [Land Installed Marine Powered Energy] Transformer. In Proceedings of the 4th European Wave Energy Conference, Aalborg, Denmark, 4–6 December 2000. [Google Scholar]
  4. Monk, K. A review of the Pico project 2010 to 2012—mistake, milestones, and the future [Press Release]. WavEc. 2012. [Google Scholar]
  5. Heath, T. Islay LIMPET Project Monitoring: Final Report; Department of Enterprise, Trade and Investment (DETI): Dublin, Ireland, 2002. [Google Scholar]
  6. Mofor, L. Ocean Energy Technology: In-novation, Patents, Market Status and Trends. International Renewable Energy Agency (IRENA): Masdar City, United Arabs Emirates, 20 June 2014. [Google Scholar]
  7. Torre-Enciso, Y.; Ortubia, I.; López de Aguileta, L.I.; Marqués, J. Mutriku wave power plant: From the thinking out to the reality. In Proceedings of the 8th European Wave and Tidal Energy Conference, Uppsala, Sweden, 7–11 September 2009; Volume 710, p. 319329. [Google Scholar]
  8. Medina-Lopez, E.; Allsop, N.W.H.; Dimakopoulos, A.; Bruce, T. Conjectures on the Failure of the OWC Breakwater at Mutriku. In Proceedings of the Coastal Structures and So-lutions to Coastal Disasters Joint Conference, Boston, MA, USA, 9–11 September 2015. [Google Scholar]
  9. Boccotti, P. On a new wave energy absorber. Ocean. Eng. 2003, 30, 1191–1200. [Google Scholar] [CrossRef]
  10. Boccotti, P. Comparison between a U-OWC and a conventional OWC. Ocean. Eng. 2007, 34, 799–805. [Google Scholar] [CrossRef]
  11. Malara, G.; Gomes, R.P.F.; Arena, F.; Henriques, J.C.C.; Gato, L.M.C.; Falão, A.F.O. Hydrodynamic characteristics of a U_OWC plant: Comparison between analytical and numerical results. In Proceedings of the 11st European Wave and Tidal Energy Conference, Nantes, France, 6–11 September 2015. [Google Scholar]
  12. Arena, F.; Romolo, A.; Malara, G.; Fiamma, V.; Laface, V. The First Full Operative U-OWC Plants in the Port of Civitavecchia. In Proceedings of the ASME 2017 36th International Conference on Ocean, Offshore and Arctic Engineering American Society of Mechanical Engineers, Trondheim, Norway, 25 September 2017; p. V010T09A022. [Google Scholar]
  13. Washio, Y.; Osawa, H.; Nagata, Y.; Fujii, F.; Furuyama, H.; Fujita, T. The offshore floating type wave power device “Mighty Whale”: Open sea tests. In Proceedings of the Tenth International Offshore and Polar Engineering Conference, San Francisco, CA, USA, 28 May 2000; International Society of Offshore and Polar Engineers: Seattle, WA, USA, 2000. [Google Scholar]
  14. Gomes, R.P.F.; Henriques, J.C.C.; Gato, L.M.C.; Falcão, A.D.O. Design of a floating oscillating water column for wave energy conversion. In Proceedings of the 9th Eu-ropean Wave and Tidal Energy Conference, Southampton, UK, 9 September 2011. [Google Scholar]
  15. Parkinson, G. Oceanlinx Launches World’s First 1MW Wave Energy Machine in S.A. Renew Economy. Available online: renewecono-my.com.au/oceanlinx-launches-worlds-first-1mw-wave-energy-machine-s-88176/ (accessed on 25 October 2013).
  16. The Herald. Storm wrecks wave-power Osprey. Available online: https://www.heraldscotland.com/news/12089535.storm-wrecks-wave-power-osprey/ (accessed on 28 August 1995).
  17. Takahashi, S. Hydrodynamic characteristics of wave-power-extracting caisson breakwater. Coast. Eng. 1988, 1989, 2489–2503. [Google Scholar] [CrossRef]
  18. Kofoed, J.P.; Vicinanza, D.; Osaland, E. Estimation of design wave loads on the SSG WEC pilot plant based on 3-D model tests. Proceeding of the Sixteenth International Offshore and Polar Engineering Conference OnePetro, San Francisco, CA, USA, 28 May 2006–2 June 2006. [Google Scholar]
  19. Sasaki, W. Changes in wave energy resources around Japan. Geophys. Res. Lett. 2012, 39, 23. [Google Scholar] [CrossRef]
  20. Shintake, T. Harnessing the Power of Breaking Waves. In Proceedings of the 3rd Asian Wave and Tidal Energy Conference, Taipei, Taiwan, China, 9–13 September 2016; Volume 174, pp. 9–13. [Google Scholar]
  21. Shintake, T.; Shirasawa, K.; Minami, J.; Fujita, J.; Toda, K.; Ito, Y.; Inoue, K.; Anan, M.; Nakajima, T.; Nagahama, T.; et al. Technical R&D on a Surf Zone WEC. In Proceedings of the 12th European Wave and Tidal Energy Conference, Cork, Ireland, 27 August 2017–1 September 2017. [Google Scholar]
  22. Takebe, H.; Minami, J.; Fujita, J.; Shirasawa, K.; Toda, K.; Shintake, T. Water Speed Measurements at a Wave Energy Converter Test Site. In Proceedings of the EWTEC2017, the 12th Eu-ropean Wave and Tidal Energy Conference, Cork, Ireland, 27 August 2017–1 September 2017. [Google Scholar]
  23. Takahasi, S.; Adachi. Wave Power Around Japan from A Viewpoint of Its Utilization; Techical Note 654; Port and Harbor Research Institution: Yokosuka, Japan, 1989; (In Japanese with English Abstract). [Google Scholar]
  24. Windguru. Available online: https://www.windguru.org.cz (accessed on 3 July 2019).
  25. Takebe, H.; Shirasawa, K.; Fujita, J.; Misumi, S.; Shintake, T. Development of OIST Wave Energy Converter Monitoring System for Maldives Island Experiment. J. Energy Power Eng. 2018, 12, 375–384. [Google Scholar] [CrossRef]
  26. Shintake, T.; Shirasawa, K.; Minami, J.; Fujita, J.; Misumi, S.; Halder, P.; Nagahama, T.; Shindou, T.; Taggart, H.; Kamimura, H.; et al. Results of Wave Energy Experiments in the Maldives. In Proceedings of the 13th European Wave and Tidal Energy Conference, Centro Congressi della Stazione Marittima, Napoli, Italy, 1–6 September 2019. [Google Scholar]
  27. Takebe, H.; Shirasawa, K.; Fujita, J.; Misumi, S.; Halder, P.; Shintake, T. Wave Power Measurement at Breaking Wave Zone in Maldives using Horizontal-Axis Turbine WEC. In Proceedings of the EWTEC2019, the 13th European Wave and Tidal Energy Conference, Centro Congressi della Stazione Marittima, Napoli, Italy, 1–6 September 2019. [Google Scholar]
  28. Shintake, T.; Shirasawa, K.; Fujita, J.; Misumi, S.; Nagahama, T.; Shindou, T.; Taggart, H.; Takebe, H. Wave Energy Experiment in the Maldives. Proceedings of Asian Wave and Tidal Energy Conforence, Taipei, Taiwan, China, 9–13 September 2018. [Google Scholar]
  29. Bagnold, R.A. Interim report on wave-pressure research.(includes plates and photographs). J. Inst. Civ. Eng. 1939, 12, 202–226. [Google Scholar] [CrossRef]
  30. Hattori, M.; Arami, A.; Yui, T. Wave impact pressure on vertical walls under breaking waves of various types. Coast. Eng. 1994, 22, 79–114. [Google Scholar] [CrossRef]
  31. Oumeraci, H.; Kortenhaus, A.; Allsop, W.; de Groot, M.; Crouch, R.; Vrijling, H.; Voortman, H. Probabilistic Design Tools for Vertical Breakwaters; CRC Press: Boca Raton, FL, USA, 2001. [Google Scholar]
  32. Uchibori, K. 3D Simulation of Coastal Wave Energy Generation in Maldives. Intern. Icfd Rep. 2018. Unpublished work. [Google Scholar]
  33. Cuomo, G.; Allsop, W.; Takahashi, S. Scaling wave impact pressures on vertical walls. Coast. Eng. 2010, 57, 604–609. [Google Scholar] [CrossRef] [Green Version]
  34. Uchibori, K. Energy Evaluation of Breaking Wave Passing through Two Type of Caissons in Maldives. Intern. Icfd Rep. 2019. Unpublished work. [Google Scholar]
  35. Pawitan, K.A.; Vicinanza, D.; Allsop, W.; Bruce, T. Front Wall and In-Chamber Impact Loads on a Breakwater-Integrated Oscillating Water Column. J. Waterw. Port Coast. Ocean. Eng. 2020, 146, 04020037. [Google Scholar] [CrossRef]
  36. McKenna, J.; Allsop, W. Statistical distribution of horizontal wave forces on vertical breakwaters. Coast. Eng. 1999, 1998, 2082–2095. [Google Scholar]
  37. Allsop, N.W.H.; McKenna, J.E.; Vicinanza, D.; Whittaker, T.T.J. New design methods for wave impact loadings on vertical breakwaters and seawalls. Coast. Engi-Neering 1997, 1996, 2508–2521. [Google Scholar]
  38. Oumeraci, H. Review and analysis of vertical breakwater failures—Lessons learned. Coast. Eng. 1994, 22, 3–29. [Google Scholar] [CrossRef]
  39. Allsop, N.W.H.; Vicinanza, D.; McKenna, J.E. Wave Forces on Vertical and Composite Breakwaters; HR Wallingford: Wallingford, UK, 1996; pp. 1–94. [Google Scholar]
  40. Halder, P.; Takebe, H.; Pawitan, K.; Fujita, J.; Misumi, S.; Shintake, T. Turbine Characteristics of Wave Energy Conversion Device for Extraction Power Using Breaking Waves. Energies 2020, 13, 966. [Google Scholar] [CrossRef] [Green Version]
Figure 1. Full-scale (blue triangle) and half-scale (orange circle) AC voltages against the rotation speed of the physical model test of the OIST WEC generator in Maldives after [27].
Energies 14 06428 g001
Figure 2. (a) First duct design with taper configuration from the inlet to the outlet, dimension in mm. (b) Second duct design with initial straight open roof duct, followed by taper configuration, with dimension in mm. Both designs were tested in [34] by means of a numerical approach.
Energies 14 06428 g002
Figure 3. The early prototype of the duct design made from aluminum during fabrication (a); and during the field test (b). The model was painted white for protection against corrosion. The half-scale turbine was attached to the outlet of the duct during testing.
Energies 14 06428 g003
Figure 4. (a) The full-scale duct design considered for the current study was based on the lesson learned from the early testing. The turbine was added to the duct outlet. (b) The same design shown from the side, with dimensions shown in mm.
Energies 14 06428 g004
Figure 5. (a) Schematics of OIST’s wave flume facility with dimensions in mm. The wave is generated using a wave paddle at one end with a wave absorber installed at the other end. Here, h denotes the water depth at various WEC locations. (b) The breaking wave at the breaking wave position with the profile highlighted with a dashed red line. (c) Schematics of the high-speed camera location relative to the model location, top view, with (d) showing the photograph of the flume and the camera setup for the experiment.
Energies 14 06428 g005
Figure 6. (a) The small-scale duct design with dimensions in mm. (b): The physical model installed into the simple wave flume during the experiment.
Energies 14 06428 g006
Figure 7. The (a) design in Solidworks® and (b) 3D printed angle switching mechanism for the wave angle (β) exploration, where each gear rotation translates to a 10° rotation of the pressure transducer (PT) and physical model.
Energies 14 06428 g007
Figure 8. Landward pressure measurement graph of the no duct case (blue circle) and the ducted case (orange triangle). Pressure is normalized with hydrostatic pressure; the x-axis shows the location of the measurements normalized with the shallow water wavelength, with zero indicating the breaking wave position.
Energies 14 06428 g008
Figure 9. Impact pressure measured during the no duct case at the breaking wave position with H = 0.07 m and T = 0.57 s. A maximum pressure of up to 6.5 times the hydrodynamics pressure was recorded, with rise time (tr) of 0.003 s recorded.
Energies 14 06428 g009
Figure 10. A comparison between the energy (Joule) per m3 of water of the no duct case (blue circle) and the ducted case (orange triangle) at multiple x/L positions.
Energies 14 06428 g010
Figure 11. The landward pressure measurement at various vertical positions for the no duct case at breaking position.
Energies 14 06428 g011
Figure 12. Pressure measurements at various elevations and horizontal locations for the no duct case for maximum pressure measured (blue circle) and average of 10 highest pressures measured (green square). The simplified breaking wave image on the background is intended as a visual aid only and does not represent the actual breaking wave during measurement.
Energies 14 06428 g012
Figure 13. Pressure measurements at various elevations and horizontal locations for the ducted case for both the maximum pressure (orange line diamond) and average of the 10 highest wave impact pressures (dashed grey asterisk). The simplified breaking wave image on the background is intended as a visual aid only and does not represent the actual breaking wave during measurement.
Energies 14 06428 g013
Figure 14. The energy per m3 of water comparison between the no duct case (blue circle) and the ducted case (orange triangle) at the breaking wave zone.
Energies 14 06428 g014
Figure 15. The energy per m3 of water comparison at (a) the near breaking wave zone of the no duct case at (x/L) = −0.175, (blue circle), no duct case at (x/L) = −0.25 (green diamond), and the ducted case (orange triangle); and (b) the broken wave zone of the no duct case at (x/L) = 0.075 (blue circle), no duct case at (x/L) = 0.125 (green diamond) and ducted case (orange triangle). Here L denotes the shallow water wavelength.
Energies 14 06428 g015
Figure 16. Measured pressure time series for the (a) no duct case at breaking wave position, and (b) the ducted case at breaking location and y/Hbr = 0 (swl). Red arrow indicates the duration of the pressure.
Energies 14 06428 g016
Figure 17. The pressure measured (in Pascal) of each wave angle (β) for the no duct case (blue circle) and the ducted case (orange triangle).
Energies 14 06428 g017
Figure 18. (a) The normalized pressure measurement for the no duct case (blue circle) and ducted case (orange triangle) at various wave angles (β). A theoretical cosine line (blue line) is added as a guidance; (b) the energy per m3 of water measurements for the no duct case (blue circle) and the ducted case (orange triangle) at various wave angles (β).
Energies 14 06428 g018
Table 1. Data test setting used in the current study.
NameDucth (m) x/Ly/HbrWave Angle (β)
ND01Novariousvarious *0 **0
ND02No0.0650 ***various0
ND03No0.095−0.25various0
ND04No0.08−0.175various0
ND05No0.0570.075various0
ND06No0.0530.125various0
ND07No0.06500.2various
DT01Yesvariousvarious00
DT02Yes0.0650various0
DT03Yes0.095−0.25various0
DT04Yes0.0550.1various0
DT05Yes0.06500.2various
* Various means the data are taken at multiple points for every Δ(x/L) = 0.025, Δ(y/Hbr) = 0.07, or Δβ = 10°. ** y/Hbr = 0 indicates still water level. *** x/L = 0 indicates the breaking wave location.
Publisher’s Note: MDPI stays neutral with regard to jurisdictional claims in published maps and institutional affiliations.

