Article

Cyclic Subcritical Water Injection into Bazhenov Oil Shale: Geochemical and Petrophysical Properties Evolution Due to Hydrothermal Exposure

1
Skolkovo Institute of Science and Technology, 121205 Moscow, Russia
2
Gazpromneft STC (Science & Technology Centre), 190000 Saint Petersburg, Russia
3
Bazhen TC (Technology Centre), 190000 Saint Petersburg, Russia
*
Author to whom correspondence should be addressed.
Energies 2021, 14(15), 4570; https://doi.org/10.3390/en14154570
Submission received: 25 May 2021 / Revised: 20 July 2021 / Accepted: 23 July 2021 / Published: 28 July 2021
(This article belongs to the Special Issue Development of Unconventional Reservoirs 2021)

Abstract

:
In situ shale or kerogen oil production is a promising approach to developing vast oil shale resources and increasing world energy demand. In this study, cyclic subcritical water injection in oil shale was investigated in laboratory conditions as a method for in situ oil shale retorting. Fifteen non-extracted oil shale samples from Bazhenov Formation in Russia (98 °C and 23.5 MPa reservoir conditions) were hydrothermally treated at 350 °C and in a 25 MPa semi-open system during 50 h in the cyclic regime. The influence of the artificial maturation on geochemical parameters, elastic and microstructural properties was studied. Rock-Eval pyrolysis of non-extracted and extracted oil shale samples before and after hydrothermal exposure and SARA analysis were employed to analyze bitumen and kerogen transformation to mobile hydrocarbons and immobile char. X-ray computed microtomography (XMT) was performed to characterize the microstructural properties of pore space. The results demonstrated significant porosity, specific pore surface area increase, and the appearance of microfractures in organic-rich layers. Acoustic measurements were carried out to estimate the alteration of elastic properties due to hydrothermal treatment. Both Young’s modulus and Poisson’s ratio decreased due to kerogen transformation to heavy oil and bitumen, which remain trapped before further oil and gas generation, and expulsion occurs. Ultimately, a developed kinetic model was applied to match kerogen and bitumen transformation with liquid and gas hydrocarbons production. The nonlinear least-squares optimization problem was solved during the integration of the system of differential equations to match produced hydrocarbons with pyrolysis derived kerogen and bitumen decomposition.

1. Introduction

Due to the worldwide increase in energy consumption caused by rapid industrial development, the request for alternative hydrocarbon resources has emerged. However, despite the energy problem, oil is a strategic source of raw material for the petrochemical industry today. Driven by the growing demand, the petroleum industry innovated its way into the unconventional deposits of bitumen, heavy oil, and shale oil, which have changed the oil and gas industry’s structure during the last decade [1]. The application of thermal enhanced oil recovery (EOR) methods today is one of the most efficient ways to significantly increase the recovery factor, especially in oil shale, heavy oil, and bitumen reservoirs [2,3].
Oil shale is a fine-grained sedimentary rock with a high content of solid organic matter (kerogen and bitumen), characterized by extremely low porosity and permeability. According to Energy Information Administration (EIA) World Shale Gas and Shale Oil Assessment, world shale resources include 335 billion barrels of technically recoverable shale oil. The Upper Jurassic one million km2 Bazhenov Formation consists mainly of a marine type II shale, rich in total organic carbon (TOC), considered the primary source rock for the Western Siberian Basin, the largest petroleum basin in the world. The technically recoverable shale oil resources of the Bazhenov Formation are estimated at ~74.6 billion barrels [4].
Classification of organic-rich oil shale source rocks is based on kerogen properties and initial H/C and O/C ratio [5]. Three main types seem to account for all kerogens. They are usually characterized by their respective evolution path in the van Krevelen (H/C, O/C) diagram and can be recognized by optical tests and physicochemical analyses. Type II kerogen is found in many petroleum source rocks with relatively high H/C and low O/C ratios. The organic material comprises abundant naphthenic and aromatic rings, aliphatic chains of moderate length. Sulfur is generally higher than in other kerogen types and is located in heterocycles or sulfide bonds. Type II kerogen is usually related to marine sediments where planktonic microorganisms and algae have been deposited in a reducing sedimentary environment. Pyrolysis of this type of kerogen produces more valuable liquid hydrocarbons than type III, but less than type I.
The conventional way of oil shale processing was mining, followed by surface retorting [2]. However, since the middle of the 20th century, significant advancements in theoretical and experimental modeling were performed by world-leading scientific groups to develop in situ retorting methods successfully on a commercial scale. The conducted research resulted in Shell ICP [6], Exxon Mobil Electrofrac [7], Total CCR [8], Chevron CRUSH [9], and the development of many other technologies. The most promising results of subsurface organic matter transformation today were obtained from an in situ electrical heating process [10,11], and high-pressure air injection [12,13]. However, these technologies still do not satisfy existing economic and safety requirements. Recently, it was shown that hybrid technologies as combustion after in situ pyrolysis could also improve the ultimate hydrocarbon products recovery [14,15].
Water is an efficient heat carrier substance: at high temperatures (>300 °C), water’s polarity or ability to solvate non-polar organic hydrocarbons is comparable to organic solvents—acetone, toluene, and benzene [16]. Low self-ionization values in such conditions make water a powerful acid-base bicatalyst due to the high concentration of hydroxonium and hydroxide ions [17,18]. Depending on the pressure and temperature conditions, water above boiling point exists in various states—water, wet and dry steam, superheated steam, and supercritical water (T > 374 °C, P > 22 MPa).
Subcritical water is a special term used to define water in the range of temperatures from 100 °C to 374 °C above the saturation curve. Subcritical water and steam injection are the most popular onshore EOR methods, especially for heavy oil and bitumen reservoirs [19]. Additionally, there is a special term, aquathermolysis, that describes chemical reactions occurring during subcritical water or steam injection into the heavy oil reservoir in the presence of reservoir minerals and resulting in viscosity reduction and oil quality improvement [20,21,22]. Subcritical water is also widely applied as a “green” and environmentally friendly solvent with tunable properties in biomass treatment studies [23]. Sub- and supercritical water could be applied for oily sludge treatment, demulsification of stable oil-water emulsions, naphthenic acids and asphaltene reduction, upgrading the oil [24]. Injection of the subcritical and supercritical water into the oil shale deposits has proved to be a promising technique for delivering sufficient enthalpy to the system to generate liquid hydrocarbons in situ and develop deep (2–3 km) organic-rich unconventional reservoirs [25,26,27]. A pilot field project of in situ oil shale conversion by subcritical water is under development in Jilin Province, China [28].
A major concern of heating agent injection into oil shale reservoir is related to heat losses to surrounding formation. However, recently, it was shown numerically that in high pressure and high temperature conditions, initial steam quality, fluid flow rate, and insulation’s thermal conductivity are vital parameters influencing the further water phase state along the tubing [29]. Hydrostatic and frictional pressure gradients are significant contributors to changes in thermodynamic properties and temperature profile along the well. However, cost optimization includes not only accounting for heat losses but also finding optimal technological parameters (temperature, injection and soaking time duration, etc.), which are dependent on kinetics of organic matter decomposition in the presence of water.
Hydrous pyrolysis or pyrolysis in the presence of water was first used by Lewan et al. to describe oil-generation kinetics of source rocks [30]. Lewan showed that in the case of pyrolysis of type II kerogen, water promotes thermal cracking reactions and inhibits carbon–carbon bond cross-linking compared to anhydrous conditions. It was observed that pyrolysate collected from the water surface at the end of the experiment has a composition of saturates, aromatics, resins, and asphaltenes (SARA) similar to natural petroleum [31]. Later, a comparative analysis of type III kerogen pyrolysis in open-system, closed-system anhydrous, and hydrous conditions was carried out [32]. The reaction products of closed-system hydrous pyrolysis contained less hydrocarbon gas than products of the anhydrous open-system pyrolysis. The yield of liquid hydrocarbons was maximum after open-system anhydrous and closed-system hydrous pyrolysis, whereas it was three times lower under closed-system anhydrous conditions. The observed effect was attributed to the extra-high yield of aromatic and polar compounds compared to closed-system anhydrous pyrolysis [32]. Water as a heat carrier also has an important disadvantage: at very high temperatures and high pressure, there will be a lot of mutual solubility of water and oil even in heavy oils and bitumen [33]. Industrial application of the approach requires taking into account the problem of separating the fluids.
Many studies on numerical modeling are devoted to oil shale in situ retorting procedure development, including the following: acceleration of simulations using fast upscaled dynamic models [34], parameter space reduction and sensitivity analysis [35], reaction parameters estimation using inverse modeling [36], simulation with fully coupled thermal-hydraulic-mechanical properties [37], application of various operator splitting techniques [38], different kinetic models and heat delivery methods application [39,40,41].
However, to specify the optimal in situ oil shale retorting conditions, a few critical effects should be accounted for, such as developing a reliable kinetic model associated with organic matter conversion, natural porosity, and permeability, and the evolution of geomechanical properties during in situ retorting. We report the results of cyclic subcritical water injection into Bazhenov oil shale samples at 350 °C and 25 MPa and provide a description of the alteration of geochemical, elastic, and microstructural properties after treatment. Additionally, a common kinetic model was tuned to match kerogen and bitumen transformation with the produced hydrocarbons.

2. Materials and Methods

2.1. Samples

In this study, 15 samples of kerogen-bearing oil shale samples from Bazhenov Formation wells A, B, and C were used for subcritical water injection experiments. Namely, the samples were from the depth of 2327–2328 m (Well C; samples BF 2, 6), 2462–2476 m (Well A; samples BF 1, 3, 4, 10, 11, 15), 2485–2491 m (Well A; sample BF 5, 14), 2983–2990 m (Well B; samples BF 7, 8, 9, 12, 13). The samples were not crushed to maintain reservoir-close conditions—the average size of rock chips varied from 2 cm to 5 cm.

2.2. Subcritical Water Injection

In the experiment, 460.8 g of non-extracted oil shale samples were introduced into a one-liter Hastelloy C-276 autoclave (Parr Instrument Company, Moline, IL, USA) to simulate subcritical water injection at reservoir conditions. After the reactor was sealed, 900 mL of distilled and deionized water was injected to implement complete water contact with the oil shale chips and maintain pressure at 7 MPa. After checking for leaks, temperature was raised to 350 °C in 60 min with an average slope of 5 °C/min. During heating, the autoclave pressure was maintained at 25 MPa using a back-pressure regulator to simulate reservoir pressure (Figure 1). Exposure temperature was chosen following the results of previous studies, which showed significant liquid hydrocarbons yield in laboratory conditions, only starting from 350 °C [25].
The back-pressure regulator allowed the experiment to be conducted in a self-purging regime to simulate true in situ retorting. The generated products remained in the reactor’s heated part until the pressure buildup was sufficient to produce them. The test consisted of 9 five-hour cycles with a pressure drop by 7 MPa at the end of each stage to produce generated gas and liquid hydrocarbons. During each cycle, the exposure period at reservoir pressure and temperature was followed by pressure decrease and water flushing at a rate of 3 mL/min to produce generated hydrocarbons (Figure 1). After the experiment, the autoclave was cooled down to ambient temperature with simultaneous gradual pressure decrease over 4 h to prevent water phase change. The experimental system was disassembled; lines were rinsed with toluene. Produced gas and liquids, spent shale samples were collected for further analysis.

2.3. Rock-Eval Pyrolysis

Programmed Rock-Eval pyrolysis was performed by HAWK (Wildcat Technologies, Humble, TX, USA) on both original shale samples pre- and post-extraction, and after exposure to subcritical water pre- and post-extraction. Table 1 summarizes the properties derived from the Rock-Eval analysis of fifteen non-extracted oil shale samples before and after the experiment. Parameters S0 and S1 indicate gas and light liquid hydrocarbons adsorbed on the organic or mineral surface, while parameter S2 demonstrates the amount of hydrocarbons that could be generated through pyrolysis of heavy oil, bitumen, and kerogen. The amount of CO2 released during pyrolysis is denoted as S3.
According to the modified Van Krevelen diagram (Figure 2), samples BF 7, 8, 9, and 10 belong to type I-II kerogen with average TOC 11.8%; samples BF 6, 14, and 15 relate to type II-III kerogen with average TOC 7.3%; samples BF 5 and 11 belong to type III kerogen with average TOC 4.1%; while the others relate to type II with average TOC 9.7%.

2.4. Three-Dimensional X-ray Computed Microtomography

X-ray computed microtomography is a non-invasive and non-destructive laboratory method to characterize the properties and structure of the pore space. Phoenix v|tome|x L240 (General Electric, Boston, MA, USA) equipped with unipolar 240 kV micro-focus and 180 kV high-power nano-focus X-ray source allows the structure of oil shale samples to be scanned and reconstructed with up to 1 µm resolution. The oil shale samples were mounted on a rotary stage, irradiated by micro-focus polychromatic X-ray source, and imaged on a detector.

2.5. Elastic Properties

The samples’ elastic properties were studied using pulse transmission acoustic experiments on PIK-UZ (Geologika, Novosibirsk, Russian Federation). Acoustic wave velocities were measured at ambient conditions and then recalculated to Young’s module and Poisson’s ratio. Measurements were performed on non-extracted oil shale samples before and after the experiment with axial stress applied parallel to bedding to study the variation after artificial thermal maturation by subcritical water injection.

2.6. Product Analysis

The volume of produced gases was monitored by the gas meter. Helium with a 100 mL/min flow rate was used in the experiment as a carrier gas to deliver produced gases to the gas chromatograph (Agilent 7890B, Santa Clara, CA, USA). Chromatograms were recorded in 20 min intervals. The gas vent between the condenser and gas meter (Figure 1) was opened only during the pressure drop at the end of each cycle.
The produced hydrocarbons and water were separated using chloroform and a separating funnel. The SARA composition of hydrocarbons was determined by Iatroscan Thin-Layer Chromatography with Flame Ionization Detector (TLC-FID) using solvents: n-heptane, toluene:n-heptane 80:20 mixture, dichloromethane:methanol 95:5 mixture according to IP 469. The boiling point distribution of produced hydrocarbons was obtained by Simulated Distillation (SimDis) gas chromatography according to ASTM D2887.
After the experiment, the spent shale samples were dried in an oven at 105 °C for 24 h. Bitumen was extracted with chloroform from several samples to study the contribution of kerogen and bitumen to the generation of hydrocarbons separately. Rock-Eval pyrolysis was used to characterize the organic matter transformation after the experiment.

3. Results and Discussion

3.1. Laboratory Investigation

The open-system Rock-Eval pyrolysis results showed how organic matter distribution changed after the test (Table 1, Figure 2). Parameter S0 decreased on average by 89.4%, S1 and S2 also lost 86.3% and 73.2%, respectively. Tmax mean value increased from 440 °C to 456 °C after subcritical water injection. Hydrogen index mean value reduced from 294 to 104, and the production index mean value dropped 2.2 times from 0.163 to 0.075.
Gas was generated along with oil from bitumen, kerogen, and various minerals within a sample. The GC results showed the dominant production of non-hydrocarbon gases (carbon dioxide and hydrogen sulfide). CO2 was possibly generated due to organic matter decarboxylation reactions [42,43]. However, some studies show the possibility of CO2 formation from carbonate mineral decomposition [43,44]. Hydrogen sulfide was conceivably produced due to organic compounds desulfurization reactions and pyrite to pyrrhotite transformation [45,46,47,48]. As for hydrocarbon gases, methane, ethane, propane, and butane each showed about 120 mg cumulative mass yield (Figure 3). It should be noted that according to Figure 3, maximum molar fraction peak shift is observed depending on the compound: methane and ethane have a maximum generation peak at 20 h, propane and butane at 15 h, pentane and hexane at 5–10 h. The effect could be explained due to more energy (exposure time) needed to crack large molecules into smaller fragments. The non-monotonic gas production behavior could also be partially caused by the overlay effect of gas desorption, microfractures appearance with further gas release from non-isolated pores, and thermal cracking of generated hydrocarbons.
Liquid hydrocarbons yield also showed non-monotonic behavior with a maximum at the fifth cycle (25 h). This could be attributed to the overlay effect of hydrocarbons desorption, appearance of microfractures due to thermal expansion, continuous hydrocarbon release from non-isolated pores, and thermal cracking of kerogen, bitumen, and generated hydrocarbons. However, a substantial amount of hydrocarbons was obtained after rinsing the autoclave with toluene (Figure 4). Results of the simulated distillation of the produced liquid hydrocarbons (Figure 4) showed the insignificant contribution of >C35 fraction of hydrocarbons, which did, however, slightly increase during the experiment. Hydrocarbons C18–C34 showed gradual fraction growth, and fraction of light hydrocarbons <C17 significantly reduced. Previously mentioned intervals C6–C17 and >C17 were used to split produced hydrocarbons on light oil and heavy oil pseudo-components to construct kinetic model of the organic matter transformation.
SARA analysis of the produced liquid hydrocarbons was performed to understand the mechanism of the organic matter decomposition reactions during the experiment. The results showed that there was a significant decrease in the fraction of saturates (−7%) and a slight reduction in aromatic compounds (−3%) yield during the experiment (Figure 5). As for polar compounds, the yield of resins and portion of asphaltenes soluble in dichloromethane:methanol mixture significantly increased (+8%), in contrast to the reduction in saturates and aromatics. The fraction of the remaining part of asphaltenes also slightly increased (+2%). The predominance of the aromatic compounds over saturates could be explained by the fact that almost all the samples are related to aromatic-rich type II and III kerogen (Figure 2). Tissot and Vandenbroucke showed that kerogen pyrolysates and natural extracts of these types of organic matter contain large amounts of aromatics [49,50]. As for the significant yield of polar compounds, a similar effect was observed by Behar in a comparative study of open-system and hydrous/anhydrous closed-system pyrolysis of lignite samples [32]. The authors explained the observed effect by accelerated primary cracking of kerogen compared with anhydrous conditions resulting in the generation of additional polar compounds. In our experiment, the strong solvent power of water possibly allowed these high-molecular-weight compounds to be produced. However, since the fluids were produced each five hours, the secondary cracking did not occur enough to transform resins and asphaltenes to low-molecular-weight compounds. Behar et al. studied thermal cracking of high-molecular-weight compounds. They performed C14+ saturates, aromatics, and polar compounds closed-system pyrolysis to account for the role of secondary cracking during the maturation process [51]. Results showed that C14+ aromatic and polar compounds generate a significant proportion of saturates and new heavy polyaromatics. It implies that corrected exposure time could improve the quality of the final liquid product.
X-ray computed microtomography of original and spent oil shale samples showed that extra pore space was generated by hydrothermal treatment (Figure 6). Microstructural properties of oil shale samples were characterized based on comparing the same sections of samples before and after the treatment. Samples BF13 and BF15 were scanned with 18 µm resolution. The porosity of the BF13 sample increased 3.3 times from 0.37% to 1.23%, specific pore surface raised from 149.6 m2/m3 to 423.4 m2/m3. Porosity of BF15 increased 155.6 times from 0.0056% to 0.8716%, and specific pore surface area raised from 10.9 m2/m3 to 897.8 m2/m3. The 3D-rendering of the pore space (Figure 6) shows an interbedding effect, which could be explained by the observation that pores and microfractures are generated primarily in the organic-rich layers [52,53,54,55]. It should be noted that visible fractures appeared in almost all the samples. According to Kim et al., microfractures generally exist, and the cracks’ dilation expands after the thermal treatment [54]. However, the alteration of microstructural properties is dependent on organic matter type because of pore structure connection with organic matter activation energy [56]. Saif et al. investigated the porosity evolution of source rock from room temperature to 500 °C using the dynamic X-ray synchrotron imaging technique. They showed that during step-like pyrolysis, first disconnected pores appear, then the poorly connected pore network transforms into a well-connected one accordingly with maturation and expulsion process, which was proved using TGA [57]. The maturation process also affects the surface roughness of the pores, which is demonstrated by means of multifractal analysis [58].
The elastic properties were determined only for sample BF14, which retained its shape and did not fracture. Acoustic wave propagation velocities were measured, axial stress was applied parallel to the bedding plane before and after the experiment. Young’s modulus and Poisson’s ratio were calculated from the acoustic velocities. The results showed a 7% decrease in the modulus from 39.56 to 36.76 GPa and a 12% decrease in the Poisson’s ratio, from 0.27 to 0.24, measured parallel to bedding. This behavior of elastic properties is expected for oil shale hydrous pyrolysis experiments [59,60,61]. However, it is shown in the literature that Young’s modulus increases with maturity in natural conditions. The decrease in the macroscopic Young’s modulus observed in the experiments is explained by transformation of kerogen to bitumen and heavy oil, which have lower Young’s modulus (~2 GPa) and could stay trapped in the pore network before further transformation and expulsion of light oil and gas [62]. Ultimately, the elastic properties of oil shale strongly depend on the organic matter state in the rock.
The results of the laboratory studies showed a significant change in the oil shale properties: organic matter and partial mineral decomposition, thermal expansion resulted in micropores and microfractures appearance. Microstructural and elastic properties were found to be in a strong correlation with geochemical properties and organic matter state. Produced hydrocarbons comprise a substantial fraction of polar compounds, which could be attributed to the high solvent power of subcritical water and lack of secondary cracking due to the short one-cycle exposure time (5 h), respectively.

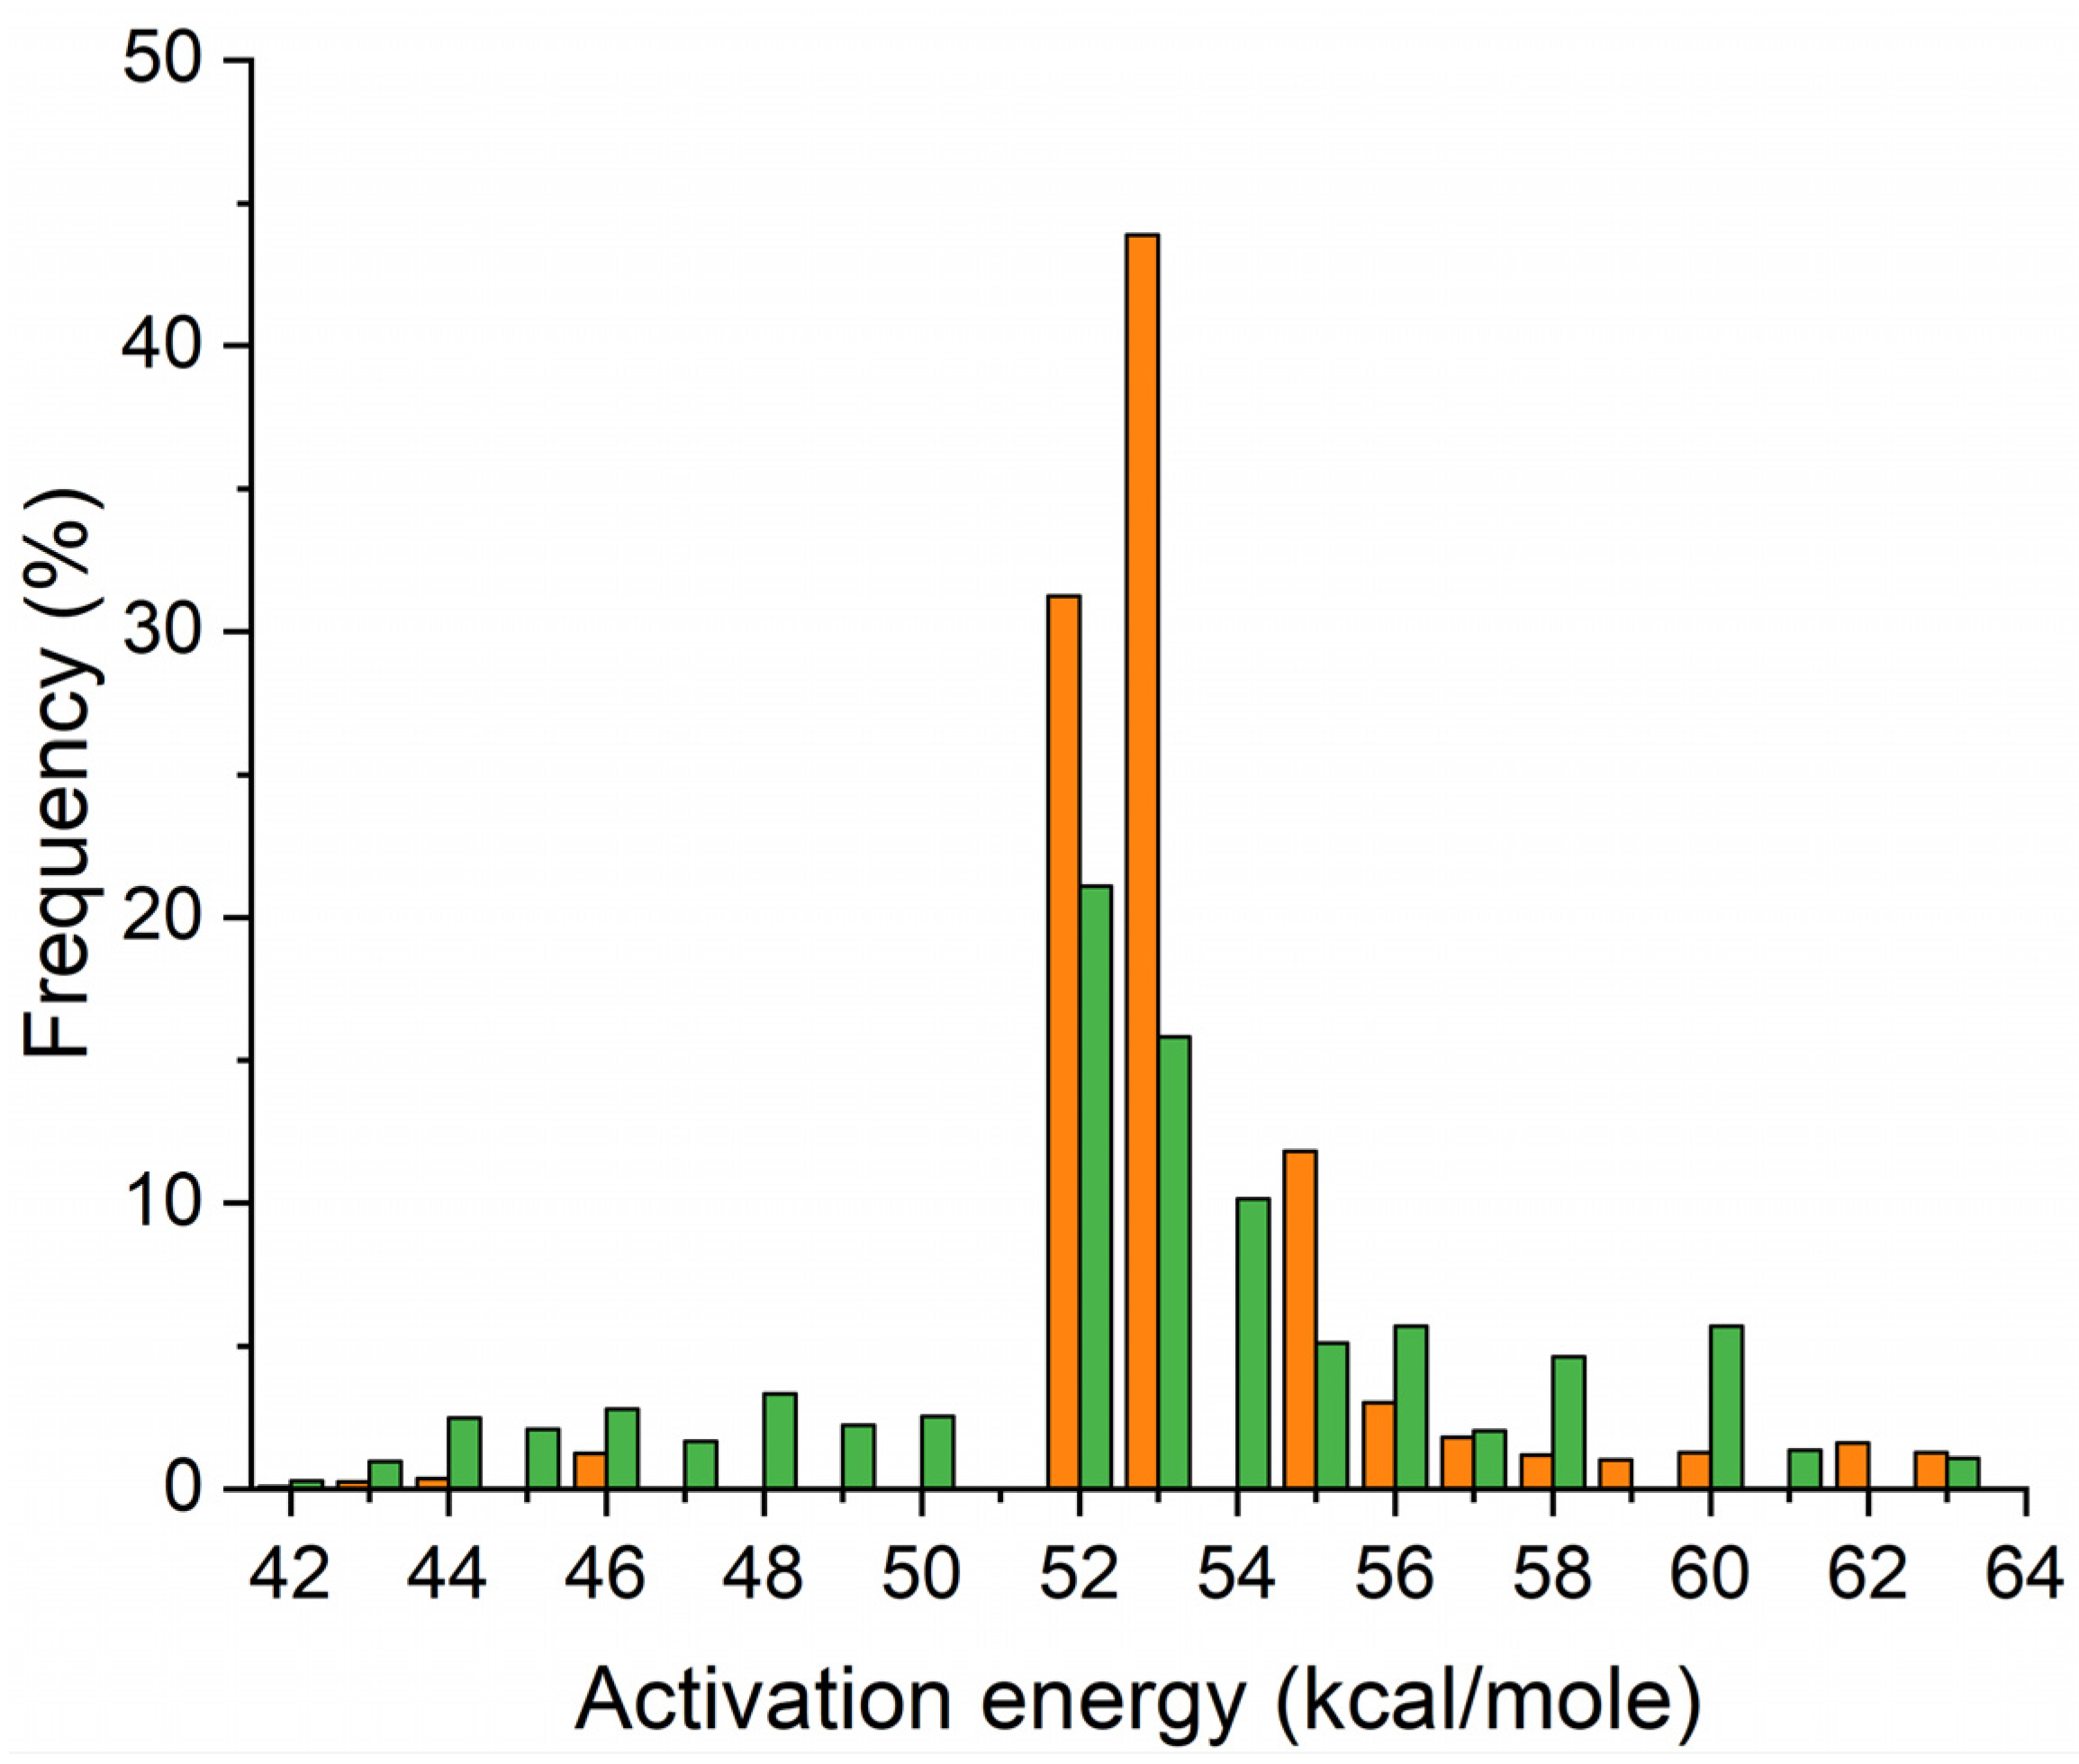
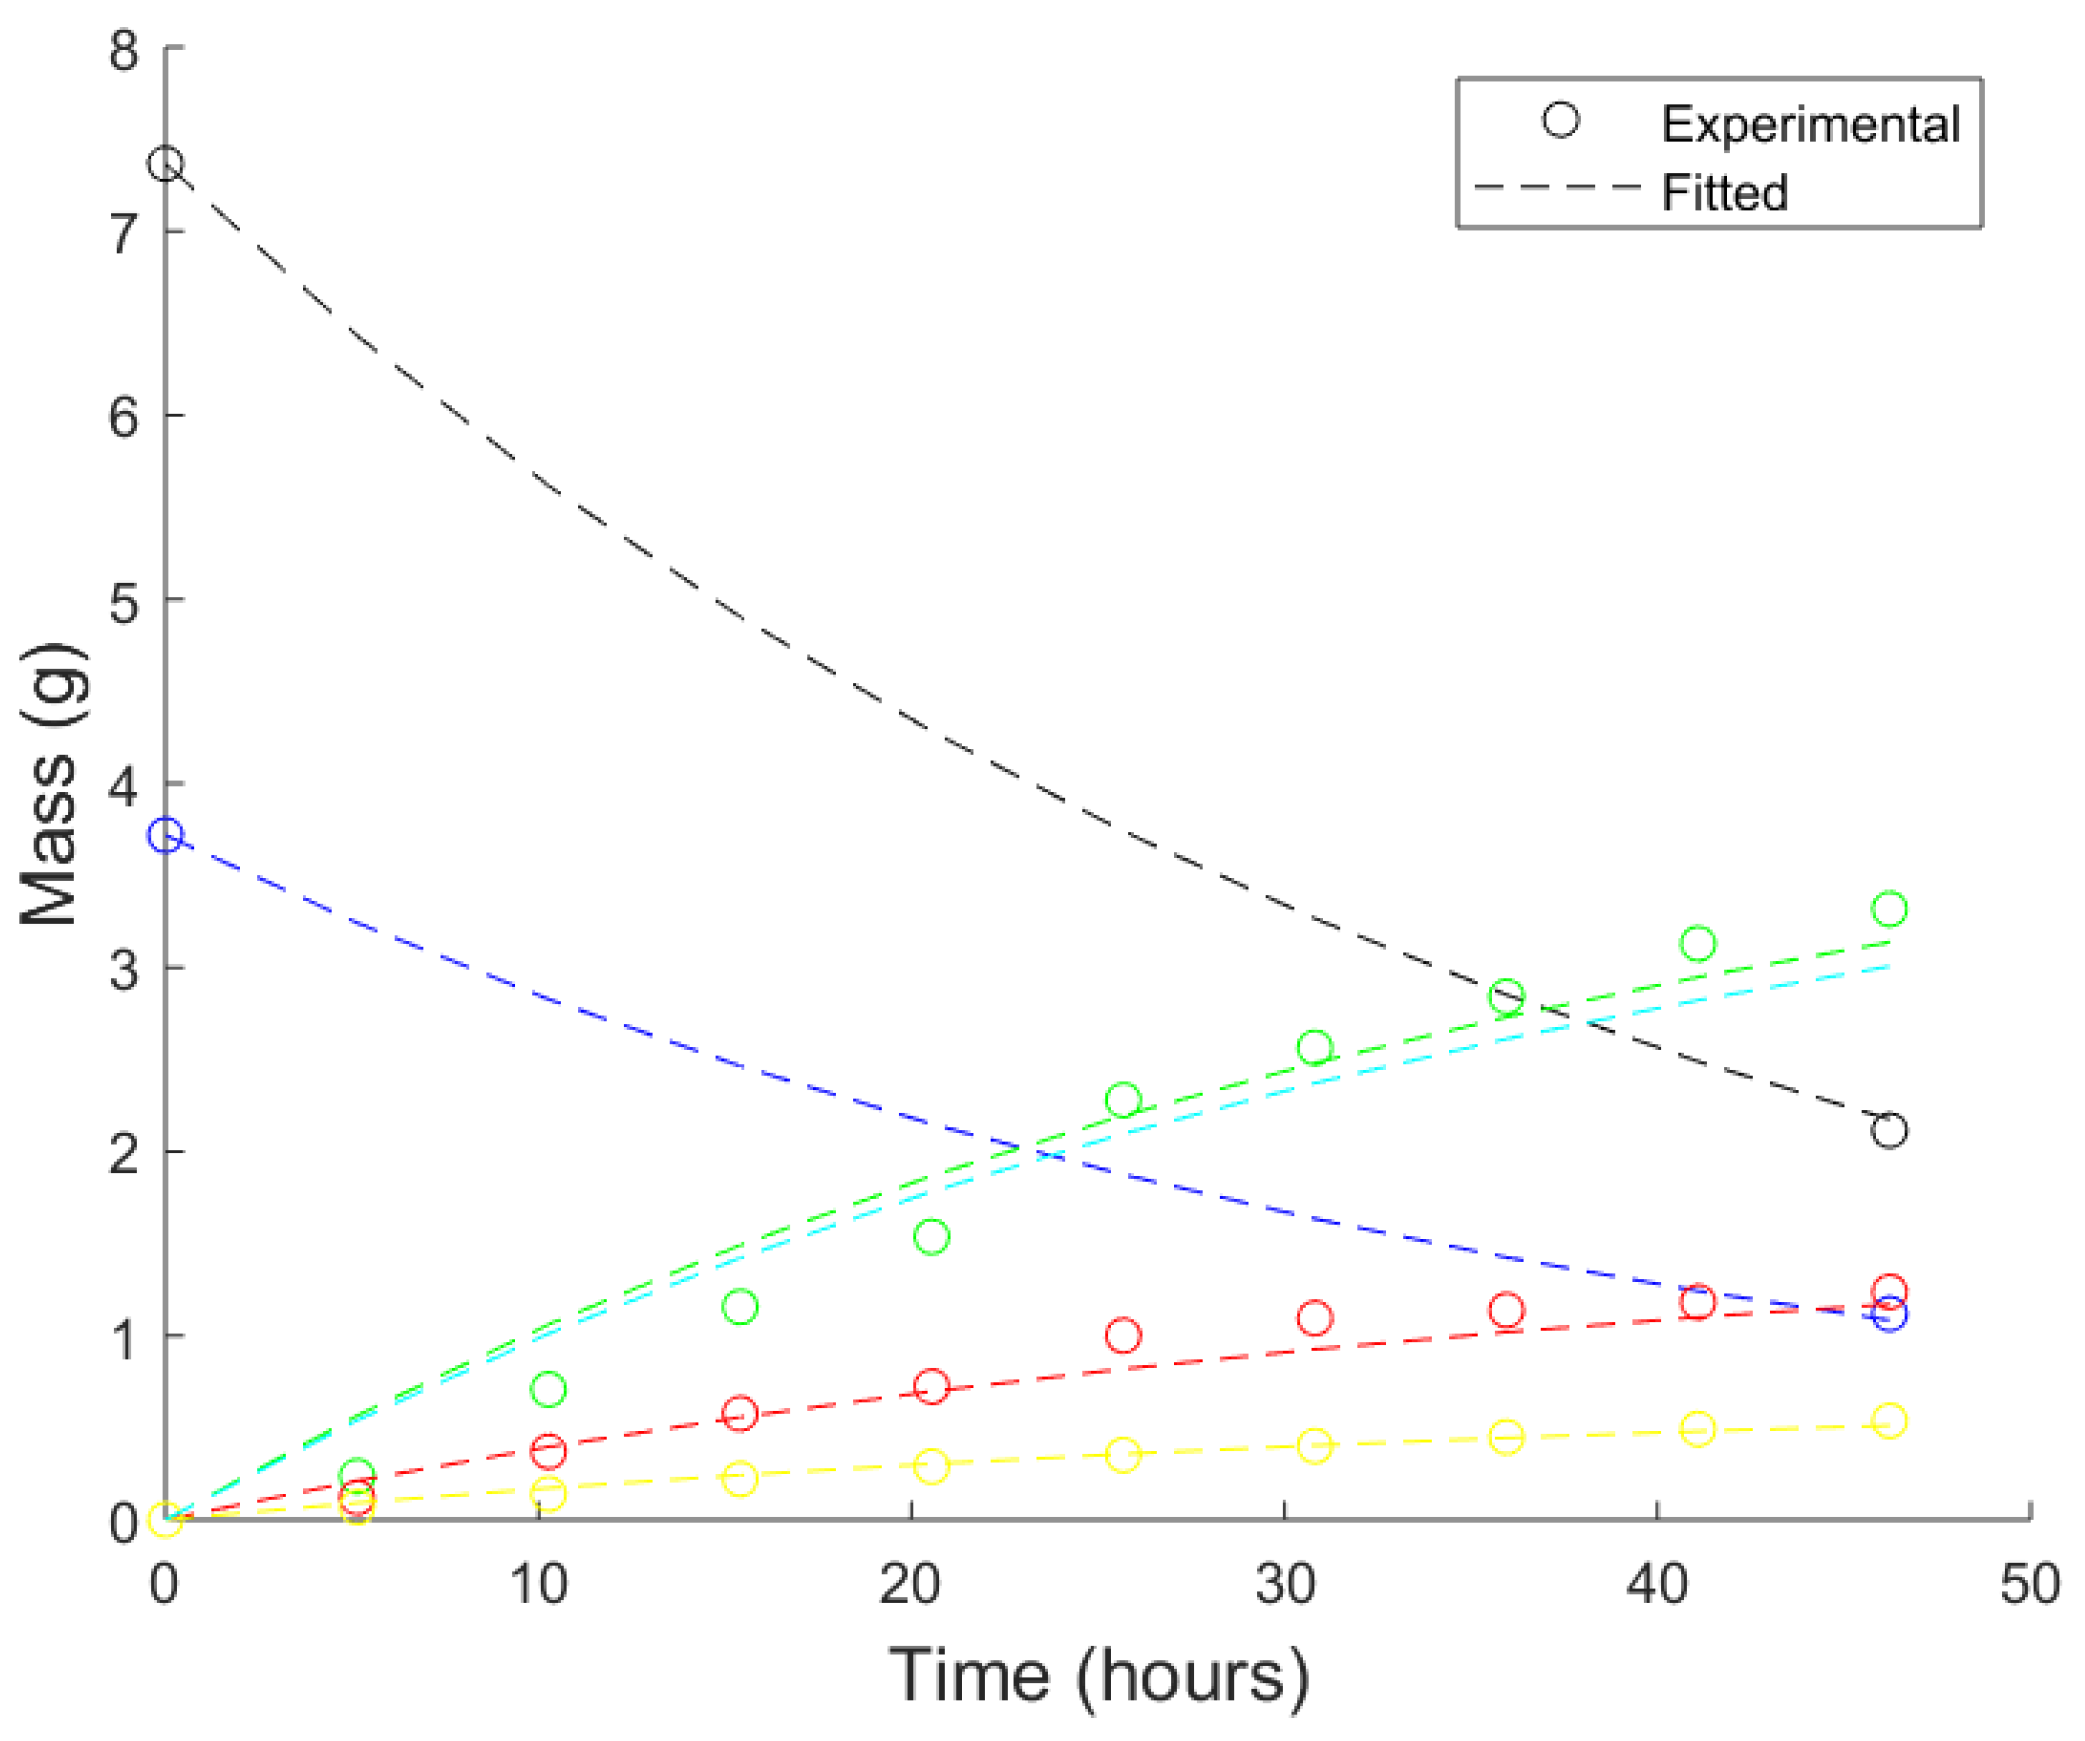
3.2. Numerical Investigation: Optimization of the Kinetic Model

Bulk kinetic analysis was performed using HAWK workstation and Kinetics2015 software on the original and chloroform extracted oil shale samples from well D of the same reservoir. Three different heating rates (3, 10 and 30 °C/min) from 300 °C to 650 °C were used to obtain Ea distribution. Discrete activation energy spectra with 1 kcal/mol spacing were obtained for fixed frequency factor A = 1014 s−1 (Figure 7) to make the results of non-extracted and extracted samples pyrolysis comparable. The value of the frequency factor was chosen according to the observation that in most kerogen pyrolysis cases, the A value is between 3 1013 s−1 and 8 1014 s−1, with a dominance near 1014 s−1.
The kinetic spectra were utilized to calculate logarithmic mean values of the activation energy for the original (bitumen + kerogen) and extracted (kerogen) samples. The following model was applied to determine the bitumen logarithmic mean value of the activation energy:
p b i t E a   b i t L M + p k e r E a   k e r L M = E a   L M
where p b i t = 0.35 is a mass fraction of bitumen in S2 peak, p k e r = 0.65 is a mass fraction of kerogen in S2 peak, E a   k e r L M = 53.3 kcal/mol and E a L M = 53.1 kcal/mol were calculated from the spectra. Ultimately, the logarithmic mean value of the bitumen decomposition activation energy was determined from the equation: E a   b i t L M = 53.2 kcal/mol, which is extremely close to the kerogen activation energy. The obtained kinetic parameters from the open-system pyrolysis were used as an initial guess for further kinetic model optimization to derive relevant values of activation energy and frequency factor, that could be applied in field-scale reservoir simulations using commercial software (CMG, Eclipse, etc.).
In this study, a sequential reaction mechanism was utilized, where solid and immobile pseudo-components, kerogen and bitumen, crack to mobile and producible in the experiment heavy oil, light oil, hydrocarbon gas, and immobile char. This approach is widely used in the literature [36,63] and allows all real chemical species and reactions to be lumped into a few pseudo-components and pseudo-reactions. Adequate computational cost and moderate complexity make the model useful for petroleum reservoir simulations. Hydrocarbon gas cracking was neglected due to the high activation energy of the reaction and relatively low pyrolysis temperature of the experiment (Equations (1)–(5)):
kerogen→a1 heavy oil + a2 light oil + a3 hydrocarbon gas + a4 char,
bitumen→b1 heavy oil + b2 light oil + b3 hydrocarbon gas + b4 char,
heavy oil→c1 light oil + c2 hydrocarbon gas + c3 char,
light oil→d1 hydrocarbon gas + d2 char.
Kerogen (K) and bitumen (B) masses were calculated cumulatively for all samples (BF1–BF15 in Table 1) using S2 values of Rock-Eval pyrolysis of non-extracted and extracted oil shale samples before and after the experiment. Produced hydrocarbon gas (HCG) mass was determined using gas chromatography and gas meter data. Liquid hydrocarbon mass was weighted and divided into light (LO) and heavy oil (HO) using simulated distillation measurements (C6–C17 for light oil, and >C17 for heavy oil). Generated char mass was estimated as a remaining part of organic matter transformation. All mentioned masses are listed in Table 2.
The gas and liquid hydrocarbons produced after the final gradual pressure decrease to ambient conditions and the rinsing of the lines after the experiment were measured separately (row “after” in the left part of Table 2). These masses were further distributed among the nine cycles by multiplying each cycle hydrocarbon yield by (m1–9cum + mafter)/m1–9cum for each of the group: HCG, LO, and HO. Such renormalization does not disturb the relationship between produced hydrocarbons at each cycle (Figure 8) and allows the hydrocarbons to be accounted for, which left the rock but were produced only after final pressure release. The difference between Rock-Eval S0 and S1 peaks before and after the experiment (0.52 g and 1.8 g, respectively) was further deducted from the ultimate amount of the produced hydrocarbons in order to account for only hydrocarbons obtained due to pyrolysis reactions, not physical desorption process. However, such mechanisms also contribute to hydrocarbon production, and should be taken into account in the case of reservoir simulation.
Under the assumption that all mentioned reactions belong to the first order type, the following system of ordinary differential equations (ODE) was obtained. The ODE system was solved numerically using Matlab software and assuming Arrhenius law dependence of reaction rate constants (Equations (5)–(11)).
ki = Ai exp(−Eai/RT),
d[K]/dt = −k1[K],
d[B]/dt = −k2[B],
d[HO]/dt = k1a1[K] + k2b1[B] − k3[HO],
d[LO]/dt = k1a2[K] + k2b2[B] + k3c1[HO] − k4[LO],
d[HCG]/dt = k1a3[K] + k2b3[B] + k3c2[HO] + k4d1[LO],
d[CHAR]/dt = k1a4[K] + k2b4[B] + k3c3[HO] + k4d2[LO].
Stoichiometry coefficients were calculated based on the mass conservation law and molecular weights of pseudo-components (Table 3 and Table 4). The best match of the experimental data was reached by utilizing the least-squares approach based on the Levenberg–Marquardt algorithm. The objective function for this problem is the sum of squares of the differences between the ODE solution with parameters A, Ea, and the experimental data (Equation (12)).
∑(micalc − miexper)2 → min.
The optimized activation energy and frequency factors for Equations (6)–(11) are listed in Table 3. The results show (Figure 8) that the developed kinetic model describes organic matter evolution adequately. However, it should be noted that the short cycle durations (5 h) with further mobile hydrocarbons production allowed the secondary reaction contribution to be diminished and the mainly primary cracking regime of the experiment to be provided. To improve the quality of the produced hydrocarbons, more attention should be paid to secondary reactions and their kinetic model development.
The results demonstrated in this study indicate that the evolution of oil shale composition during hydrothermal exposure could be adequately described using a number of pseudo-components (kerogen, bitumen, heavy oil, light oil, hydrocarbon gas, char) and a sequential reaction model. The relevant kinetic parameters were determined, especially for kerogen and bitumen decomposition. The obtained parameters might be applied for reservoir modeling of the in situ retorting process in the oil shale reservoir with comparable geochemical and petrophysical properties.

4. Conclusions

Cyclic subcritical water injection into the oil shale samples was studied as a promising in situ retorting technology for the first time. Artificial maturation noticeably alters geochemical parameters, elastic and microstructural properties of the oil shale. Rock-Eval pyrolysis of pre- and post-extraction oil shale samples before and after hydrothermal exposure showed bitumen and kerogen transformation to mobile hydrocarbons and immobile char. SARA analysis of the produced hydrocarbons showed a significant fraction of aromatic compounds due to the predominance of aromatic-rich type II and type III kerogen. Additionally, a large fraction of polar compounds was observed because of the high solvent power of subcritical water and lack of secondary cracking due to the short one-cycle exposure time. Hydrocarbons produced during the experiment were matched using nonlinear least-squares approach and a developed kinetic model, which adequately described kerogen and bitumen transformation with the production of liquid and gas hydrocarbons.
The X-ray computed microtomography derived porosity and specific surface area notably rose after the experiment due to thermal expansion and microfractures generation primarily in the organic-rich layers, kerogen and bitumen transformation to mobile hydrocarbons with further expulsion. It implies high potential efficiency of the cyclic subcritical water injection for the development of Bazhenov Formation and other oil shale reservoirs with similar geochemical and petrophysical properties.

Author Contributions

Conceptualization, A.T. (Aman Turakhanov), A.T. (Albina Tsyshkova), E.M., E.P., D.K., E.D.; methodology, A.T. (Aman Turakhanov), A.T. (Albina Tsyshkova), E.M., D.K.; software, A.T. (Aman Turakhanov); investigation, A.T. (Aman Turakhanov), A.T. (Albina Tsyshkova), E.P.; resources, D.K., E.D., K.P., A.K.; data curation, A.T. (Aman Turakhanov), A.T. (Albina Tsyshkova); writing—original draft preparation, A.T. (Aman Turakhanov) and E.M.; writing—review and editing, D.K., E.D., A.K., K.P., and A.C.; visualization, A.T. (Aman Turakhanov), A.T. (Albina Tsyshkova); supervision, A.K., A.C. All authors have read and agreed to the published version of the manuscript.

Funding

This research was supported by the Ministry of Science and Higher Education of the Russian Federation under agreement No. 075-10-2020-119 within the framework of the development program for a world-class Research Center.

Acknowledgments

The authors would like to acknowledge the Integrated Center for Hydrocarbon Recovery of Skolkovo Institute of Science and Technology and Gazpromneft Scientific Centre.

Conflicts of Interest

The authors declare no conflict of interest.

References

  1. BP Statistical Review of World Energy. 2019. Available online: https://www.bp.com/content/dam/bp/business-sites/en/global/corporate/pdfs/energy-economics/statistical-review/bp-stats-review-2019-full-report.pdf (accessed on 16 May 2020).
  2. Speight, J.G. Synthetic Fuels Handbook: Properties, Process, and Performance; McGraw-Hill: New York, NY, USA, 2008; ISBN 9780071490238. Available online: https://www.amazon.com/Synthetic-Fuels-Handbook-Performance-McGraw-Hill/dp/007149023X (accessed on 30 June 2008).
  3. Markovic, S.; Bryan, J.L.; Turakhanov, A.; Cheremisin, A.; Mehta, S.A.; Kantzas, A. In-Situ Heavy Oil Viscosity Prediction at High Temperatures Using Low-Field NMR Relaxometry and Nonlinear Least Squares. Fuel 2020, 260, 116328. [Google Scholar] [CrossRef]
  4. EIA/ARI. World Shale Gas and Shale Oil Resource Assessment. 2013. Available online: https://www.eia.gov/analysis/studies/worldshalegas/pdf/overview.pdf (accessed on 16 May 2020).
  5. Tissot, B.P.; Welte, D.H.; Tissot, B.P.; Welte, D.H. Kerogen: Composition and Classification. In Petroleum Formation and Occurrence; Springer: Berlin/Heidelberg, Germany, 1984; pp. 131–159. [Google Scholar]
  6. Ryan, R.C.; Fowler, T.D.; Beer, G.L.; Nair, V. Shell’s In Situ Conversion Process−From Laboratory to Field Pilots. 2010, pp. 161–183. Available online: https://pubs.acs.org/doi/abs/10.1021/bk-2010-1032.ch009 (accessed on 16 May 2020).
  7. Symington, W.A.; Kaminsky, R.D.; Meurer, W.P.; Otten, G.A.; Thomas, M.M.; Yeakel, J.D. ExxonMobil’s Electrofrac TM Process for In Situ Oil Shale Conversion. 2010, pp. 185–216. Available online: https://pubs.acs.org/doi/abs/10.1021/bk-2010-1032.ch010 (accessed on 16 May 2020).
  8. Burnham, A.K.; Day, R.L.; Hardy, M.P.; Wallman, P.H. AMSO’s Novel Approach to In-Situ Oil Shale Recovery. 2010, pp. 149–160. Available online: https://pubs.acs.org/doi/abs/10.1021/bk-2010-1032.ch008 (accessed on 16 May 2020).
  9. Crawford, P.M.; Killen, J.C. New Challenges and Directions in Oil Shale Development Technologies; ACS Symposium Series; American Chemical Society: Washington, DC, USA, 2010; Volume 103, pp. 21–60. [Google Scholar] [CrossRef]
  10. Meijssen, T.E.M.; Emmen, J.; Fowler, T.D. In-Situ Oil Shale Development in Jordan through ICP Technology. In Proceedings of the Abu Dhabi International Petroleum Exhibition and Conference; Society of Petroleum Engineers, Abu Dhabi, UAE, 10–13 November 2014. [Google Scholar]
  11. Hascakir, B.; Babadagli, T.; Akin, S. Experimental and Numerical Simulation of Oil Recovery from Oil Shales by Electrical Heating. Energy Fuels 2008, 22, 3976–3985. [Google Scholar] [CrossRef]
  12. Gutierrez, D.; Taylor, A.R.; Kumar, V.; Ursenbach, M.G.; Moore, R.G.; Mehta, S.A. Recovery Factors in High-Pressure Air Injection Projects Revisited. SPE Soc. Pet. Eng. 2008, 11, 1097–1106. [Google Scholar] [CrossRef]
  13. Kokorev, V.I.; Darishchev, V.I.; Akhmadeishin, I.A.; Shchekoldin, K.A.; Boksernam, A.A. The Results of the Field Tests and Prospects of Termogas Development of Bazhenov Formation in OJSC RITEK. In Proceedings of the SPE Russian Oil and Gas Exploration & Production Technical Conference and Exhibition; Society of Petroleum Engineers, Moscow, Russia, 14–16 October 2014. [Google Scholar]
  14. Bauman, J.H.; Deo, M. Simulation of a Conceptualized Combined Pyrolysis, In Situ Combustion, and CO2 Storage Strategy for Fuel Production from Green River Oil Shale. Energy Fuels 2012, 26, 1731–1739. [Google Scholar] [CrossRef]
  15. Kar, T.; Hascakir, B. In-Situ Kerogen Extraction via Combustion and Pyrolysis. J. Pet. Sci. Eng. 2017, 154, 502–512. [Google Scholar] [CrossRef]
  16. Luong, D.; Sephton, M.A.; Watson, J.S. Subcritical Water Extraction of Organic Matter from Sedimentary Rocks. Anal. Chim. Acta 2015, 879, 48–57. [Google Scholar] [CrossRef] [PubMed] [Green Version]
  17. Siskin, M.; Katritzky, A.R. Reactivity of Organic Compounds in Superheated Water: General Background. Chem. Rev. 2001, 101, 825–836. [Google Scholar] [CrossRef] [PubMed]
  18. Thiruvenkadam, S.; Izhar, S.; Yoshida, H.; Danquah, M.K.; Harun, R. Process Application of Subcritical Water Extraction (SWE) for Algal Bio-Products and Biofuels Production. Appl. Energy 2015, 154, 815–828. [Google Scholar] [CrossRef]
  19. Kang, P.-S.; Lim, J.-S.; Huh, C. Screening Criteria and Considerations of Offshore Enhanced Oil Recovery. Energies 2016, 9, 44. [Google Scholar] [CrossRef] [Green Version]
  20. Askarova, A.; Turakhanov, A.; Markovic, S.; Popov, E.; Maksakov, K.; Usachev, G.; Karpov, V.; Cheremisin, A. Thermal Enhanced Oil Recovery in Deep Heavy Oil Carbonates: Experimental and Numerical Study on a Hot Water Injection Performance. J. Pet. Sci. Eng. 2020, 194, 107456. [Google Scholar] [CrossRef]
  21. Al-Muntaser, A.A.; Varfolomeev, M.A.; Suwaid, M.A.; Feoktistov, D.A.; Yuan, C.; Klimovitskii, A.E.; Gareev, B.I.; Djimasbe, R.; Nurgaliev, D.K.; Kudryashov, S.I.; et al. Hydrogen Donating Capacity of Water in Catalytic and Non-Catalytic Aquathermolysis of Extra-Heavy Oil: Deuterium Tracing Study. Fuel 2021, 283, 118957. [Google Scholar] [CrossRef]
  22. Al-Muntaser, A.A.; Varfolomeev, M.A.; Suwaid, M.A.; Yuan, C.; Chemodanov, A.E.; Feoktistov, D.A.; Rakhmatullin, I.Z.; Abbas, M.; Domínguez-Álvarez, E.; Akhmadiyarov, A.A.; et al. Hydrothermal Upgrading of Heavy Oil in the Presence of Water at Sub-Critical, near-Critical and Supercritical Conditions. J. Pet. Sci. Eng. 2020, 184, 106592. [Google Scholar] [CrossRef]
  23. Carr, A.G.; Mammucari, R.; Foster, N.R. A Review of Subcritical Water as a Solvent and Its Utilisation for the Processing of Hydrophobic Organic Compounds. Chem. Eng. J. 2011, 172, 1–17. [Google Scholar] [CrossRef]
  24. Khan, M.K.; Cahyadi, H.S.; Kim, S.-M.; Kim, J. Efficient Oil Recovery from Highly Stable Toxic Oily Sludge Using Supercritical Water. Fuel 2019, 235, 460–472. [Google Scholar] [CrossRef]
  25. Popov, E.; Kalmykov, A.; Cheremisin, A.; Bychkov, A.; Bondarenko, T.; Morozov, N.; Karpov, I. Laboratory Investigations of Hydrous Pyrolysis as Ternary Enhanced Oil Recovery Method for Bazhenov Formation. J. Pet. Sci. Eng. 2017, 156, 852–857. [Google Scholar] [CrossRef]
  26. Turakhanov, A.; Tsyshkova, A.; Popov, E.; Cheremisin, A. In-Situ Hydrocarbon Generation Method from Oil Shale Using Hydrous Pyrolysis. In Proceedings of the Conference Proceedings, EAGE/SPE Workshop on Shale Science 2019, Moscow, Russia, 8–9 April 2019; Volume 2019, pp. 1–4. [Google Scholar] [CrossRef]
  27. Askarova, A.; Turakhanov, A.; Mukhina, E.; Cheremisin, A.; Cheremisin, A. Unconventional Reservoirs: Methodological Approaches for Thermal EOR Simulation. SPE/AAPG/SEG Unconv. Resour. Technol. Conf. 2020, 12. [Google Scholar] [CrossRef]
  28. Sun, Y.; Kang, S.; Wang, S.; He, L.; Guo, W.; Li, Q.; Deng, S. Subcritical Water Extraction of Huadian Oil Shale at 300 °C. Energy Fuels 2019, 33, 2106–2114. [Google Scholar] [CrossRef]
  29. Yusupov, R.; Meretskaya, E.; Cheremisin, A.; Eskin, D. Modeling Steam Flow in an Injection Tubing and Analysis of Flow Regimes for High Pressure-High Temperature Initial Parameters. Chem. Eng. Process. Process Intensif. 2020, 158, 108168. [Google Scholar] [CrossRef]
  30. Lewan, M.D.; Winters, J.C.; McDonald, J.H. Generation of Oil-like Pyrolyzates from Organic-Rich Shales. Science 1979, 203, 897–899. [Google Scholar] [CrossRef] [PubMed]
  31. Lewan, M.D. Experiments on the Role of Water in Petroleum Formation. Geochim. Cosmochim. Acta 1997, 61, 3691–3723. [Google Scholar] [CrossRef]
  32. Behar, F.; Lewan, M.D.; Lorant, F.; Vandenbroucke, M. Comparison of Artificial Maturation of Lignite in Hydrous and Nonhydrous Conditions. Org. Geochem. 2003, 34, 575–600. [Google Scholar] [CrossRef]
  33. Shinta, A.A.; Firoozabadi, A. Predicting Phase Behavior of Water/Reservoir-Crude Systems With the Association Concept. SPE Reserv. Eng. 1997, 12, 131–137. [Google Scholar] [CrossRef]
  34. Alpak, F.O.; Vink, J.C. Rapid and Accurate Simulation of the In-Situ Conversion Process Using Upscaled Dynamic Models. J. Pet. Sci. Eng. 2018, 161, 636–656. [Google Scholar] [CrossRef]
  35. Bauman, J.H.; Deo, M.D. Parameter Space Reduction and Sensitivity Analysis in Complex Thermal Subsurface Production Processes. Energy Fuels 2011, 25, 251–259. [Google Scholar] [CrossRef]
  36. Lee, K.J.; Finsterle, S.; Moridis, G.J. Estimating the Reaction Parameters of Oil Shale Pyrolysis and Oil Shale Grade Using Temperature Transient Analysis and Inverse Modeling. J. Pet. Sci. Eng. 2018, 165, 765–776. [Google Scholar] [CrossRef] [Green Version]
  37. Wang, H.Y. A Numerical Study of Thermal-Hydraulic-Mechanical Simulation With Application of Thermal Recovery in Fractured Shale-Gas Reservoirs. SPE Reserv. Eval. Eng. 2017, 20, 513–531. [Google Scholar] [CrossRef]
  38. Maes, J.; Muggeridge, A.H.; Jackson, M.D.; Quintard, M.; Lapene, A. Modelling In-Situ Upgrading of Heavy Oil Using Operator Splitting Method. Comput. Geosci. 2016, 20, 581–594. [Google Scholar] [CrossRef] [Green Version]
  39. Youtsos, M.S.K.; Mastorakos, E.; Cant, R.S. Numerical Simulation of Thermal and Reaction Fronts for Oil Shale Upgrading. Chem. Eng. Sci. 2013, 94, 200–213. [Google Scholar] [CrossRef]
  40. Lee, K.J.; Moridis, G.J.; Ehlig-Economides, C.A. Numerical Simulation of Diverse Thermal in Situ Upgrading Processes for the Hydrocarbon Production from Kerogen in Oil Shale Reservoirs. Energy Explor. Exploit. 2017, 35, 315–337. [Google Scholar] [CrossRef] [Green Version]
  41. Lee, K.J.; Finsterle, S.; Moridis, G.J. Analyzing the Impact of Reaction Models on the Production of Hydrocarbons from Thermally Upgraded Oil Shales. J. Pet. Sci. Eng. 2018, 168, 448–464. [Google Scholar] [CrossRef] [Green Version]
  42. Huss, E.B.; Burnham, A.K. Gas Evolution during Pyrolysis of Various Colorado Oil Shales. Fuel 1982, 61, 1188–1196. [Google Scholar] [CrossRef]
  43. Burnham, A.K.; Huss, E.B.; Singleton, M.F. Pyrolysis Kinetics for Green River Oil Shale from the Saline Zone. Fuel 1983, 62, 1199–1204. [Google Scholar] [CrossRef]
  44. Larsen, J.W.; Hu, J. Kerogen Chemistry. 8. Hydrous Pyrolysis of Rundle Kerogen: Source of the Oxygen in CO2 and Mineral Catalysis. Energy Fuels 2005. [Google Scholar] [CrossRef]
  45. Chen, H.; Li, B.; Zhang, B. Decomposition of Pyrite and the Interaction of Pyrite with Coal Organic Matrix in Pyrolysis and Hydropyrolysis. Fuel 2000, 79, 1627–1631. [Google Scholar] [CrossRef]
  46. Gai, R.; Jin, L.; Zhang, J.; Wang, J.; Hu, H. Effect of Inherent and Additional Pyrite on the Pyrolysis Behavior of Oil Shale. J. Anal. Appl. Pyrolysis 2014, 105, 342–347. [Google Scholar] [CrossRef]
  47. Wong, C.M.; Crawford, R.W.; Burnham, A.K. Determination of Sulfur-Containing Gases from Oil Shale Pyrolysis by Triple Quadrupole Mass Spectrometry. Anal. Chem. 1984, 56, 390–395. [Google Scholar] [CrossRef]
  48. Ma, X.; Zheng, G.; Sajjad, W.; Xu, W.; Fan, Q.; Zheng, J.; Xia, Y. Influence of Minerals and Iron on Natural Gases Generation during Pyrolysis of Type-III Kerogen. Mar. Pet. Geol. 2018, 89, 216–224. [Google Scholar] [CrossRef]
  49. Tissot, B.P.; Vandenbroucke, M. Geochemistry and Pyrolysis of Oil Shales. 1983, pp. 1–11. Available online: https://pubs.acs.org/doi/abs/10.1021/bk-1983-0230.ch001 (accessed on 16 May 2020).
  50. Vandenbroucke, M. Kerogen: From Types to Models of Chemical Structure. Oil Gas Sci. Technol. 2003, 58, 243–269. [Google Scholar] [CrossRef] [Green Version]
  51. Behar, F.; Lorant, F.; Mazeas, L. Elaboration of a New Compositional Kinetic Schema for Oil Cracking. Org. Geochem. 2008, 39, 764–782. [Google Scholar] [CrossRef]
  52. Tiwari, P.; Deo, M.; Lin, C.L.; Miller, J.D. Characterization of Oil Shale Pore Structure before and after Pyrolysis by Using X-Ray Micro CT. Fuel 2013, 107, 547–554. [Google Scholar] [CrossRef]
  53. Glatz, G.; Castanier, L.M.; Kovscek, A.R. Visualization and Quantification of Thermally Induced Porosity Alteration of Immature Source Rock Using X-Ray Computed Tomography. Energy Fuels 2016, 30, 8141–8149. [Google Scholar] [CrossRef]
  54. Kim, T.W.; Ross, C.M.; Guan, K.M.; Burnham, A.K.; Kovscek, A.R. Permeability and Porosity Evolution of Organic-Rich Shales from the Green River Formation as a Result of Maturation. SPE J. 2020, 25, 1377–1405. [Google Scholar] [CrossRef]
  55. Saif, T.; Lin, Q.; Gao, Y.; Al-Khulaifi, Y.; Marone, F.; Hollis, D.; Blunt, M.J.; Bijeljic, B. 4D in Situ Synchrotron X-Ray Tomographic Microscopy and Laser-Based Heating Study of Oil Shale Pyrolysis. Appl. Energy 2019, 235, 1468–1475. [Google Scholar] [CrossRef]
  56. Liu, K.; Ostadhassan, M.; Hackley, P.C.; Gentzis, T.; Zou, J.; Yuan, Y.; Carvajal-Ortiz, H.; Rezaee, R.; Bubach, B. Experimental Study on the Impact of Thermal Maturity on Shale Microstructures Using Hydrous Pyrolysis. Energy Fuels 2019, 33, 9702–9719. [Google Scholar] [CrossRef]
  57. Saif, T.; Lin, Q.; Singh, K.; Bijeljic, B.; Blunt, M.J. Dynamic Imaging of Oil Shale Pyrolysis Using Synchrotron X-Ray Microtomography. Geophys. Res. Lett. 2016, 43, 6799–6807. [Google Scholar] [CrossRef] [Green Version]
  58. Liu, K.; Ostadhassan, M.; Zou, J.; Gentzis, T.; Rezaee, R.; Bubach, B.; Carvajal-Ortiz, H. Nanopore Structures of Isolated Kerogen and Bulk Shale in Bakken Formation. Fuel 2018, 226, 441–453. [Google Scholar] [CrossRef]
  59. Eseme, E.; Urai, J.; Littke, R.; Krooss, B. Review of Mechanical Properties of Oil Shales: Implications for Exploitation and Basin Modelling. Oil Shale 2007, 24, 159–174. [Google Scholar]
  60. Kim, T.W.; Yun, W.; Kovscek, A.R. Application of Digital Volume Correlation to X-Ray Computed Tomography Images of Shale. Energy Fuels 2020, 34, 13636–13649. [Google Scholar] [CrossRef]
  61. Moyer, J.; Prasad, M. Property Changes of Oil Shale during Artificial Maturation: The Irati Formation from the Paraná Basin, Brazil. Geophysics 2017, 82, MR175–MR190. [Google Scholar] [CrossRef] [Green Version]
  62. Zargari, S.; Prasad, M.; Mba, K.C.; Mattson, E.D. Organic Maturity, Elastic Properties, and Textural Characteristics of Self Resourcing Reservoirs. Geophysics 2013, 78, D223–D235. [Google Scholar] [CrossRef]
  63. Bauman, J.H.; Huang, C.K.; Gani, M.R.; Deo, M.D. Modeling of the In-Situ Production of Oil from Oil Shale. 2010, pp. 135–146. Available online: https://pubs.acs.org/doi/abs/10.1021/bk-2010-1032.ch007 (accessed on 16 May 2020).
Figure 1. (a) Experimental set-up scheme; (b) injection pressure (green) and cumulative water volume (blue) profile.
Energies 14 04570 g001
Figure 2. (a) Modified Van Krevelen diagram of original (red) and thermally treated (green) non-extracted oil shales; (b) S2 and S1 Rock-Eval parameters before the experiment and extraction (red), before the experiment and after extraction (blue), after the experiment and before extraction (brown), after the experiment and after extraction (green).
Energies 14 04570 g002
Figure 3. Molar fraction (green) and cumulative mass (red) of produced hydrocarbon gases as a function of time.
Energies 14 04570 g003
Figure 4. (a) Hydrocarbons yield during the experiment; (b) SimDis distribution of produced liquid hydrocarbons.
Energies 14 04570 g004
Figure 5. (a) SARA composition of the produced liquid hydrocarbons; (b) SARA ternary diagram of reservoir oil (red) and produced hydrocarbons (green).
Energies 14 04570 g005
Figure 6. X-ray computed microtomography results: sample BF13 (a) before (left) and after treatment (right); sample BF15 (b) before (left) and after treatment (right).
Energies 14 04570 g006
Figure 7. Discrete activation energy spectra for original (green) and extracted (orange) oil shale samples.
Energies 14 04570 g007
Figure 8. Cumulative production results of experiments (circles) and numerical simulation (dashed lines). Black, kerogen; blue, bitumen; green, heavy oil; red, light oil; yellow, hydrocarbon gas; light blue, char.
Energies 14 04570 g008
Table 1. Rock-Eval pyrolysis parameters of the non-extracted oil shale samples before / after the experiment.
SampleWellS0 (mg/g)S1 (mg/g)S2 (mg/g)S3 (mg/g)TOC (%)Tmax (°C)HI (mg/g TOC)PI (S1/(S1 + S2))
BF1A2.61/0.354.96/1.4041.26/12.860.45/0.3214.11/10.21440/450292/1250.107/0.098
BF2C0.55/0.0811.96/0.1817.42/1.240.85/0.325.56/1.68431/459313/730.407/0.13
BF3A1.78/0.195.94/0.5518.5/5.090.77/0.397.11/6.96437/456260/730.243/0.098
BF4A1.96/0.215.22/0.6534.69/7.311.00/0.4512.66/11.1438/454273/650.131/0.082
BF5A0.15/0.041.19/0.101.77/0.570.55/0.251.82/1.63441/454108/310.401/0.145
BF6C1.15/0.052.70/0.3224.28/6.650.62/0.4811.23/8.03444/455216/820.1/0.046
BF7B2.52/0.246.67/0.7356.7/13.960.57/0.3212.85/8.9443/457441/1560.105/0.05
BF8B2.45/0.166.38/0.6951.33/13.140.36/0.3112.66/6.45443/460405/2030.111/0.05
BF9B2.49/0.366.90/0.9253.02/14.040.52/0.3412.84/9.85445/457412/1420.115/0.062
BF10A0.83/0.052.14/0.3246.43/9.520.37/0.328.91/4.78448/454521/1990.044/0.033
BF11A0.63/0.062.39/0.187.95/1.920.67/0.246.83/6.54433/446121/280.231/0.084
BF12B0.88/0.092.24/0.3436.01/8.630.49/0.2910.23/8.03440/460351/1070.059/0.038
BF13B0.92/0.11.98/0.4629.38/8.790.42/0.248.79/7.56439/458334/1160.063/0.05
BF14A0.66/0.021.50/0.177.12/1.940.48/0.384.26/3.07443/462167/630.174/0.08
BF15A1.23/0.12.29/0.6112.6/6.660.57/0.356.99/6.33444/460198/950.154/0.084
Table 2. Cumulative masses of produced hydrocarbons (left) and organic matter distribution in the oil shale before and after the experiment based on Rock-Eval pyrolysis results (right).
SampleProduced Hydrocarbons, gHydrocarbons in the Rock, g
HCGLOHOS0 (HCG)S1 (LO + HO)S2a (B)S2b (K)
before---0.5812.0243.7197.366
cycle 10.0680.0960.159----
cycle 20.1400.2950.479----
cycle 30.2210.4590.782----
cycle 40.2890.5771.040----
cycle 50.3520.7981.543----
cycle 60.4000.8731.735----
cycle 70.4490.9081.923----
cycle 80.4930.9432.118----
cycle 90.5260.9872.245----
after0.5320.5922.5310.0610.2230.7192.115
Table 3. Stoichiometry coefficients and kinetic parameters used for numerical simulation.
ReactionStoichiometry CoefficientActivation Energy, kcal/molFrequency Factor, s−1
11.8761.9092.22558.88153.91014
20.6570.6680.77920.60954.31014
30.6840.79821.101-60.51014
40.39010.332--61.11014
Table 4. Molecular weights of pseudo-components (in Daltons).
KBHOLOHCGCHAR
2000700428.6157.258.613
Publisher’s Note: MDPI stays neutral with regard to jurisdictional claims in published maps and institutional affiliations.

