Article

Design and Evaluation of High-Temperature Well Cementing Slurry System Based on Fractal Theory

College of Petroleum Engineering, Southwest Petroleum University, Chengdu 610500, China
*
Authors to whom correspondence should be addressed.
Energies 2021, 14(22), 7552; https://doi.org/10.3390/en14227552
Submission received: 12 October 2021 / Revised: 2 November 2021 / Accepted: 8 November 2021 / Published: 12 November 2021
(This article belongs to the Special Issue Development of Unconventional Reservoirs 2021)

Abstract

:
The efficient development of oil and gas resources is inseparable from the progress of drilling technology and the safety of the long life cycle of wellbore. At present, exploration and development is expanding to deep and ultra-deep areas. The long life cycle safety of deep and ultra-deep wells is mainly realized by the sealing performance of cement slurry. Additionally, the accumulation degree of cement slurry particles is closely related to sealing performance. Based on fractal theory, an accumulation model of continuous distribution of additive material particles was designed, which can determine the range of fractal dimension necessary to realize the tight stacking and guide the proportion of solid admixture. The formulation of high temperature-resistant cement slurry was prepared by designing the ratio of solid admixture and optimizing the high temperature-resistant liquid admixture. The evaluation of engineering and temperature resistance of the cement slurry proves the rationality of the accumulation model, which can be applied to the design of a high temperature cementing slurry system in deep and ultra-deep wells.

1. Introduction

With the depletion of conventional shallow resources, oil-gas exploration and development is gradually expanding to complex environments such as unconventional resources, deep land and deep water [1,2,3,4]. According to statistics, more than 40% of the world’s remaining oil and gas resources are distributed in deep formations below 5000 m. The static temperature of deep wells at the bottom hole can reach more than 200 °C, and the pressure bottom hole can reach more than 100 MPa [5]. With their high temperature and high pressure, underground operations pose a significant challenge to the performance design of a high-temperature well cementing slurry. The physical and chemical properties of oil-well cement change with the increase in temperature. If the cement slurry system is not carefully designed, then the strength of cement stone will decline at a high temperature. At the same time, the permeability will increase, the sealing will lose efficacy, which will seriously affect the production safety of cementing well in a long life cycle. In the actual production process of oil and gas wells, the safety problem of wellbore sealing failure caused by high temperature is very common: in some countries, such as China, the United States and Norway, the proportion of wellbore isolation failure exceeds 20% [6]. It at least leads affect the production of oil and gas wells, and even more would lead to the abandonment of wellbore. Therefore, it is of great significance to improve the development of deep oil and gas to study the strength decline mechanism of cement stone and design the cement slurry with long-term stable performance in high temperature and high-pressure environments.
Fractal theory has been widely used in petroleum fields and can be used to describe the spatial filling ability of geometric forms [7,8,9]. The particle size distribution characteristics of oil-well cement and its solid-phase admixtures show a series of fractal characteristics [10,11,12,13,14,15], especially the uncertainty, fuzziness, nonlinearity and other characteristics, which fully reflect the complexity of microstructure. To improve the temperature resistance of oil-well cement, silica sand is typically used, and the particle ratio and dosage of cement dry mixture are reasonably designed to reduce the content of harmful holes in cement stone [16]. Studies on grain composition have formed some classical models of close packing theory, such as the Horsfield model [17], Andersen equation, the Aim and Goff model, the linear packing model and the Dinger–Funk model [18]. The establishment of these models is based on the mean particle diameter of materials, but they cannot reflect the real particle size distribution characteristics of materials.
Portland cement, including conventional oil well cement, is the most important and largest construction material in the world. The main minerals in ordinary Portland cement are tricalcium silicate (C3S), dicalcium silicate (C2S), tricalcium aluminate (C3A) and tetra calcium aluminoferrite (C4AF). Among them, C3S and C2S account for about 80% of the total mineral content. When the temperature is low, the hydration products of the two minerals are mainly C-S-H gel and Ca(OH)2, and these hydration products have good mechanical properties [19,20]. Existing studies have shown that a critical temperature value exists in the strength retrogression of oil well Grade G cement stone with the increase in temperature [5]. When the temperature exceeds 110–120 °C, a hydration product C2SH2 will undergo the crystal transformation to form a mixture phase with low strength. At the same time, the transformation leads to the change of the microstructure of cement stone from a three-dimensional network structure to a plate shape or a crumby structure, resulting in a significant drop in the strength of cement stone. When the temperature reaches 150 °C, the intensity decline becomes stronger [21]. At present, Portland cement with sand is the most widely studied and applied high-temperature oil well cement system. It has been recognized for many years that the optimal sand content is about 30~40% of cement quality. More and more studies show that the optimal amount of sand is closely related to the particle size of silica sand, particle size gradation and curing temperature of cement slurry [22,23,24,25,26]. Therefore, with the help of fractal grading theory [17,27,28], the optimal theoretical ratio under different sand dosages is solved based on the particle size distribution characteristics of coarse sand and fine sand [8,14,29,30,31,32]. At the same time, according to the change in the viscosity of the aqueous solution of polymer admixture before and after elevated-temperature curing [33,34,35], the high-temperature-resistant liquid-phase admixture is selected. On the basis of this finding, the high-temperature cement slurry system is designed.
API RP 10B Recommended Practice for Testing Well Cements of the American Petroleum Institute provides a method for evaluating high-temperature cementing slurry systems. The engineering performance of cement slurry includes fluidity, stability, fluid loss, initial consistency, thickening time, transient time, SPN value and compressive strength. As for the high temperature resistance of cement, according to the method specified in GB/T 19139-2012, it is necessary to test the change of compressive strength of cement stone. At the same time, phase analysis and microstructure analysis of cement stone are necessary to verify the change of hydration products and the accumulation state of cement particles.

2. Fractal Theory and Grading Model

2.1. Fractal and Fractal Dimension

Fractal refers to a pattern, phenomenon or physical process with self-similar characteristics [12,36,37]. It has scale-free property and self-similarity. Scale-free properties include complexity, shape, irregularity and other characteristics of fractal images that do not change with the change in scale. Self-similarity is defined as the statistical similarity of an object to the whole in structure, shape, information, space and other aspects. The measure M(ε) and measurement scale ε of a fractal object are subordinated to the following scaling relationship [36,38,39]:
M ( ε ) ε D f
where Df refers to fractal dimension, M(ε) can be used to describe the mass, volume, area or curve length of an object and ε refers to the measurement scale.

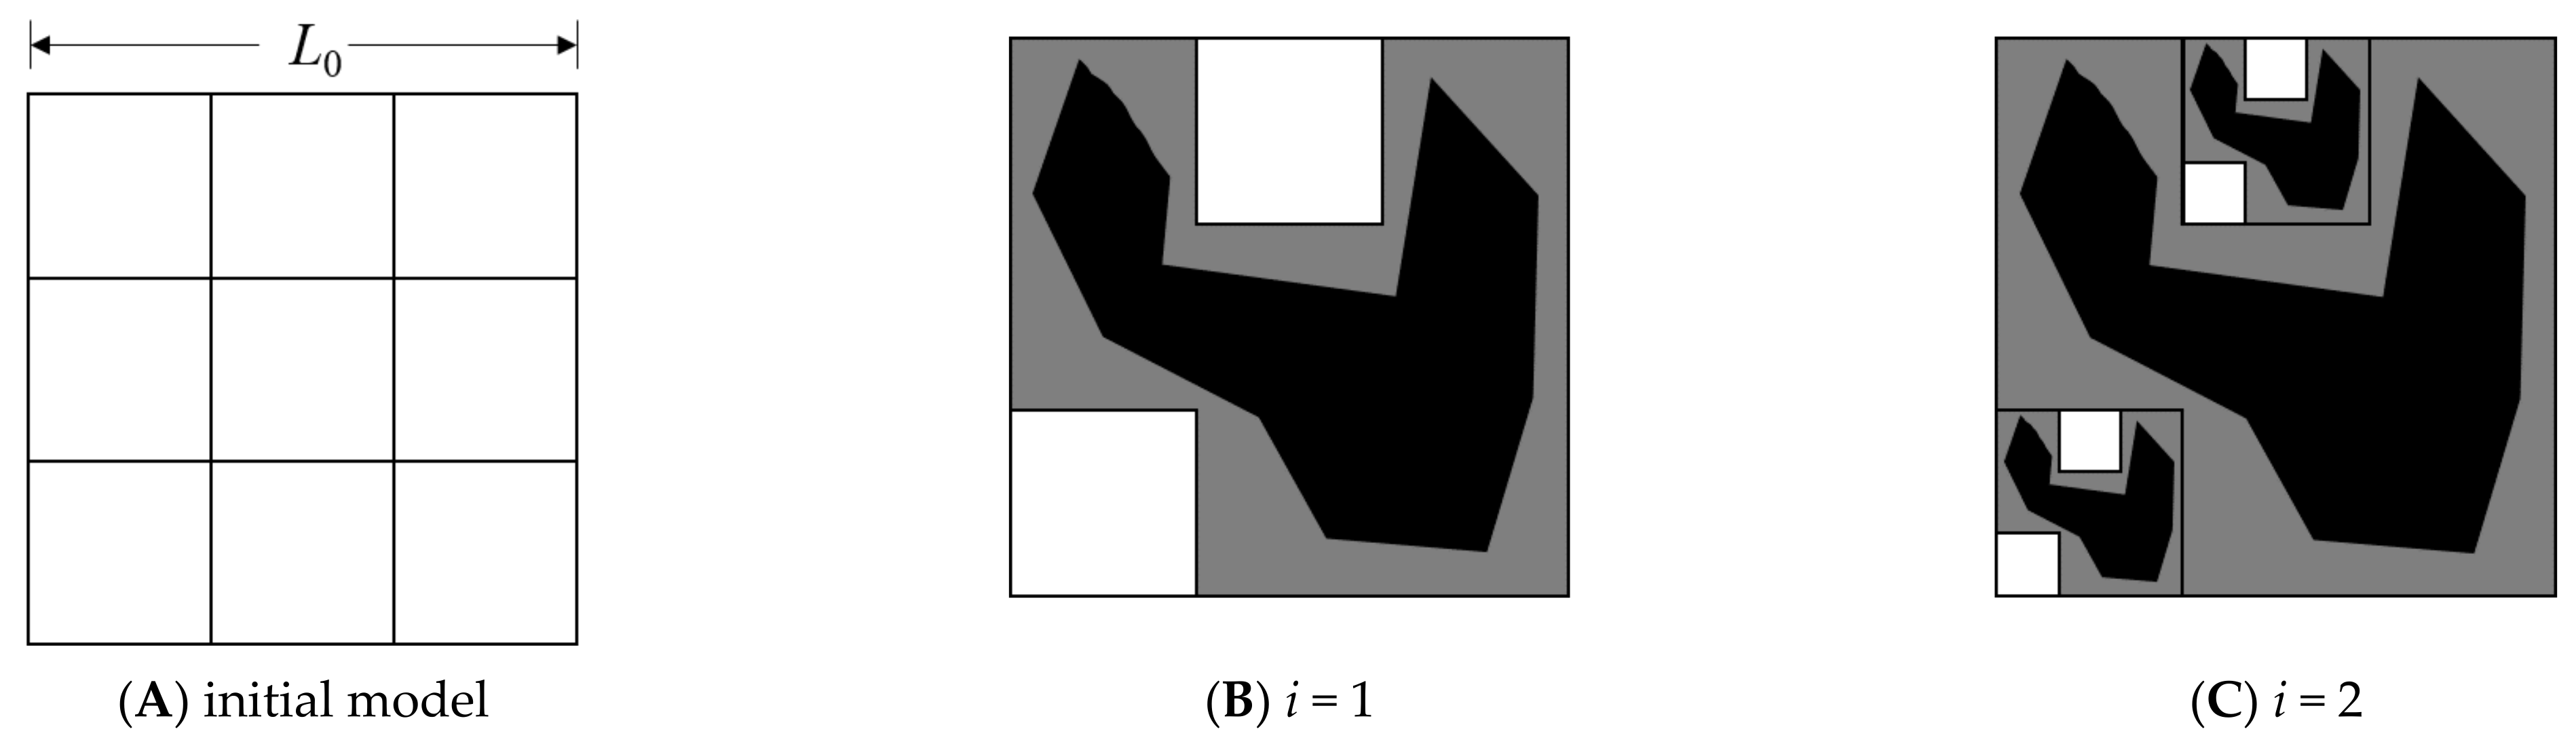
2.2. Basic Structure and General Properties of Fractal Model

Fractal theory has been widely used in research on the multi-scale structure of rock and other porous media, including basic theory and application research as well as modeling: fractal number size distribution (pore size distribution and particle size distribution) [40], fractal surface (pore–solid interface) [13], mass fractal characteristics (solid mass fractal) [41,42], polymer distribution [43,44], pore mass fractal [12] and pore–solid fractal [45]. The basic characteristics that coexist in fractal models are scale invariance and self-similarity.
In Euclidean space (dimension is dE), a self-similarity fractal model with the fractal dimension D is shown in Figure 1. Each side b of a square with an initial side length L0 is divided equally (scale factor), and then N subregions with equal size are obtained. The subregions are divided into two parts, namely, Nz (light gray) and N(1 − z) (dark gray). Nz regions are iterated continuously. Different colors are found in N(1 − z), showing that the phase is non-uniform. The number N of small squares from the first iteration is
N = b d E
The fractal dimension can be obtained from the number Nz of iterative regions and scale factor b in the figure
D = l n N z l n b

2.2.1. Pore Mass Fractal Model

The 2D pore mass fractal model is shown in Figure 2, which can be used to simulate the distribution of uniform solid media (uniform means that the black part has a single material inside) at different scales. The white part is the iteration region. At a certain iterative scale, solid and pore sizes gradually decrease with the increase in iterations. Finally, the iteration region disappears. The relationship between the porosity of pore mass fractal model φ and iterations i is shown in Figure 2.
φ = 8 9 i
On the basis of the iteration rule, the relationship between the number m of remaining subregions and the removal proportion is b2 − m = Nz and N = b2, and the fractal dimension is
D = l n b 2 m l n b

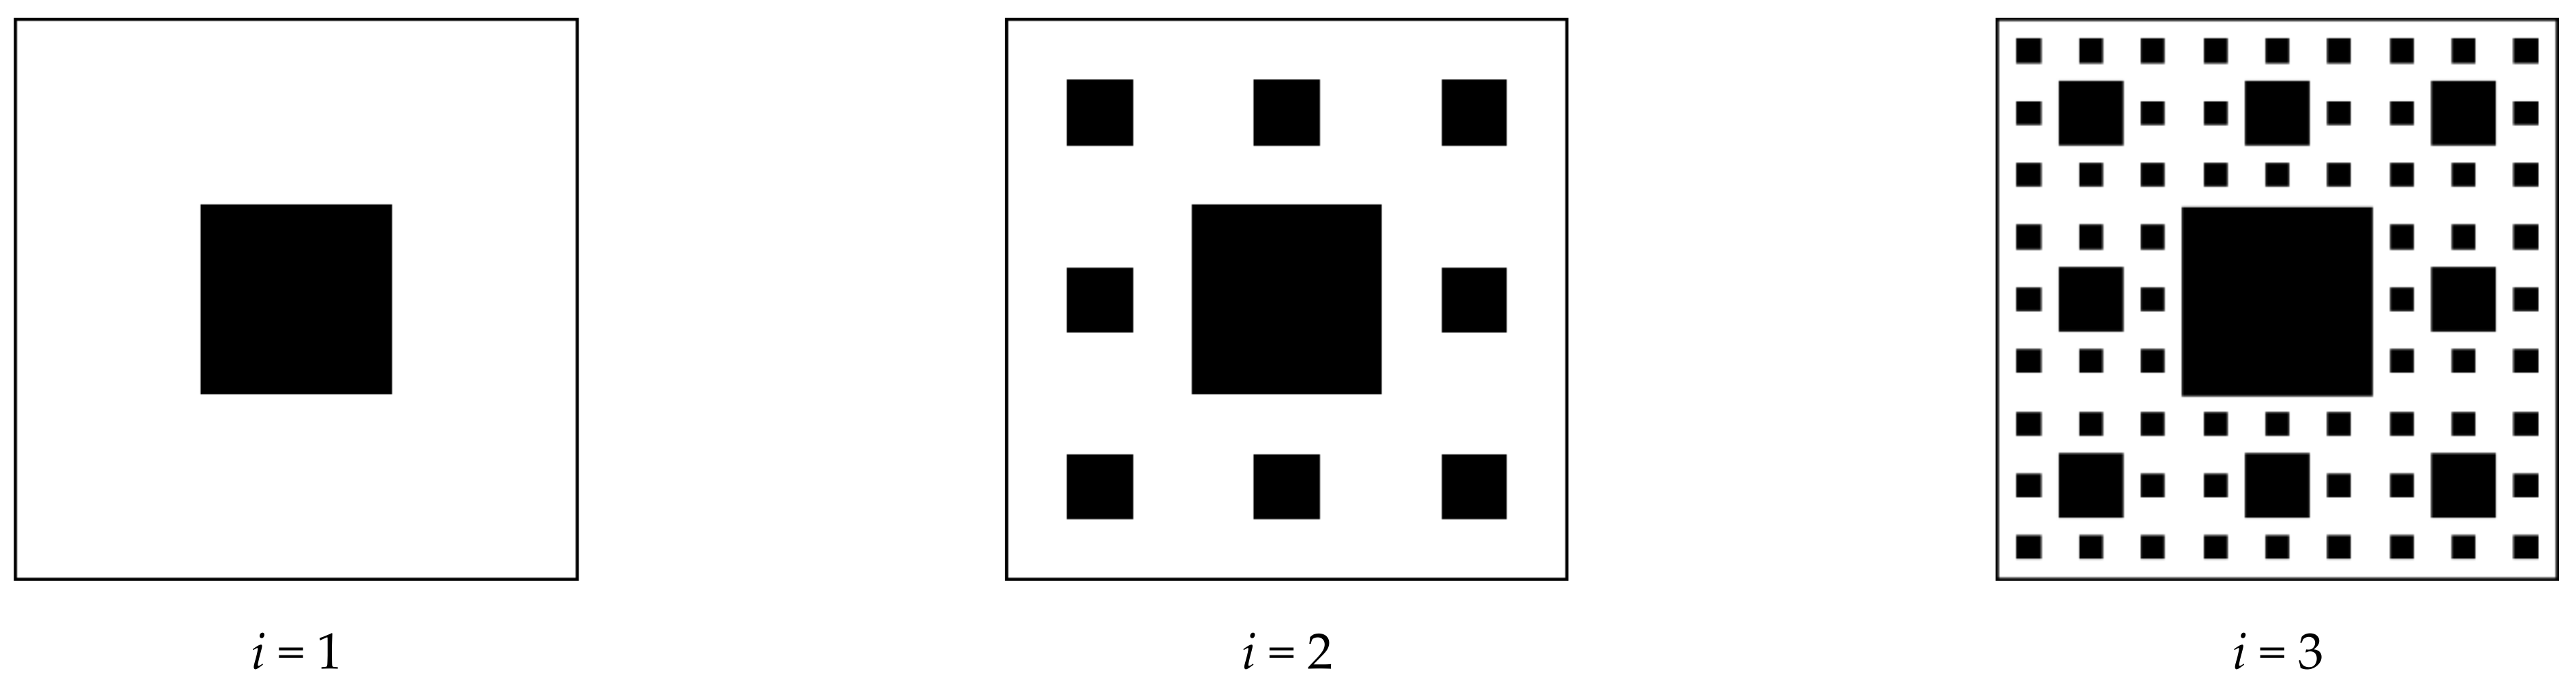
2.2.2. Solid Mass Fractal Model

The 2D solid mass fractal model is shown in Figure 3, which can be used to simulate the distribution of uniform pore at different scales. The black part is the iteration region. At a certain iterative scale, solid and pore sizes gradually decrease with the increase in iterations. Finally, the iteration region disappears.

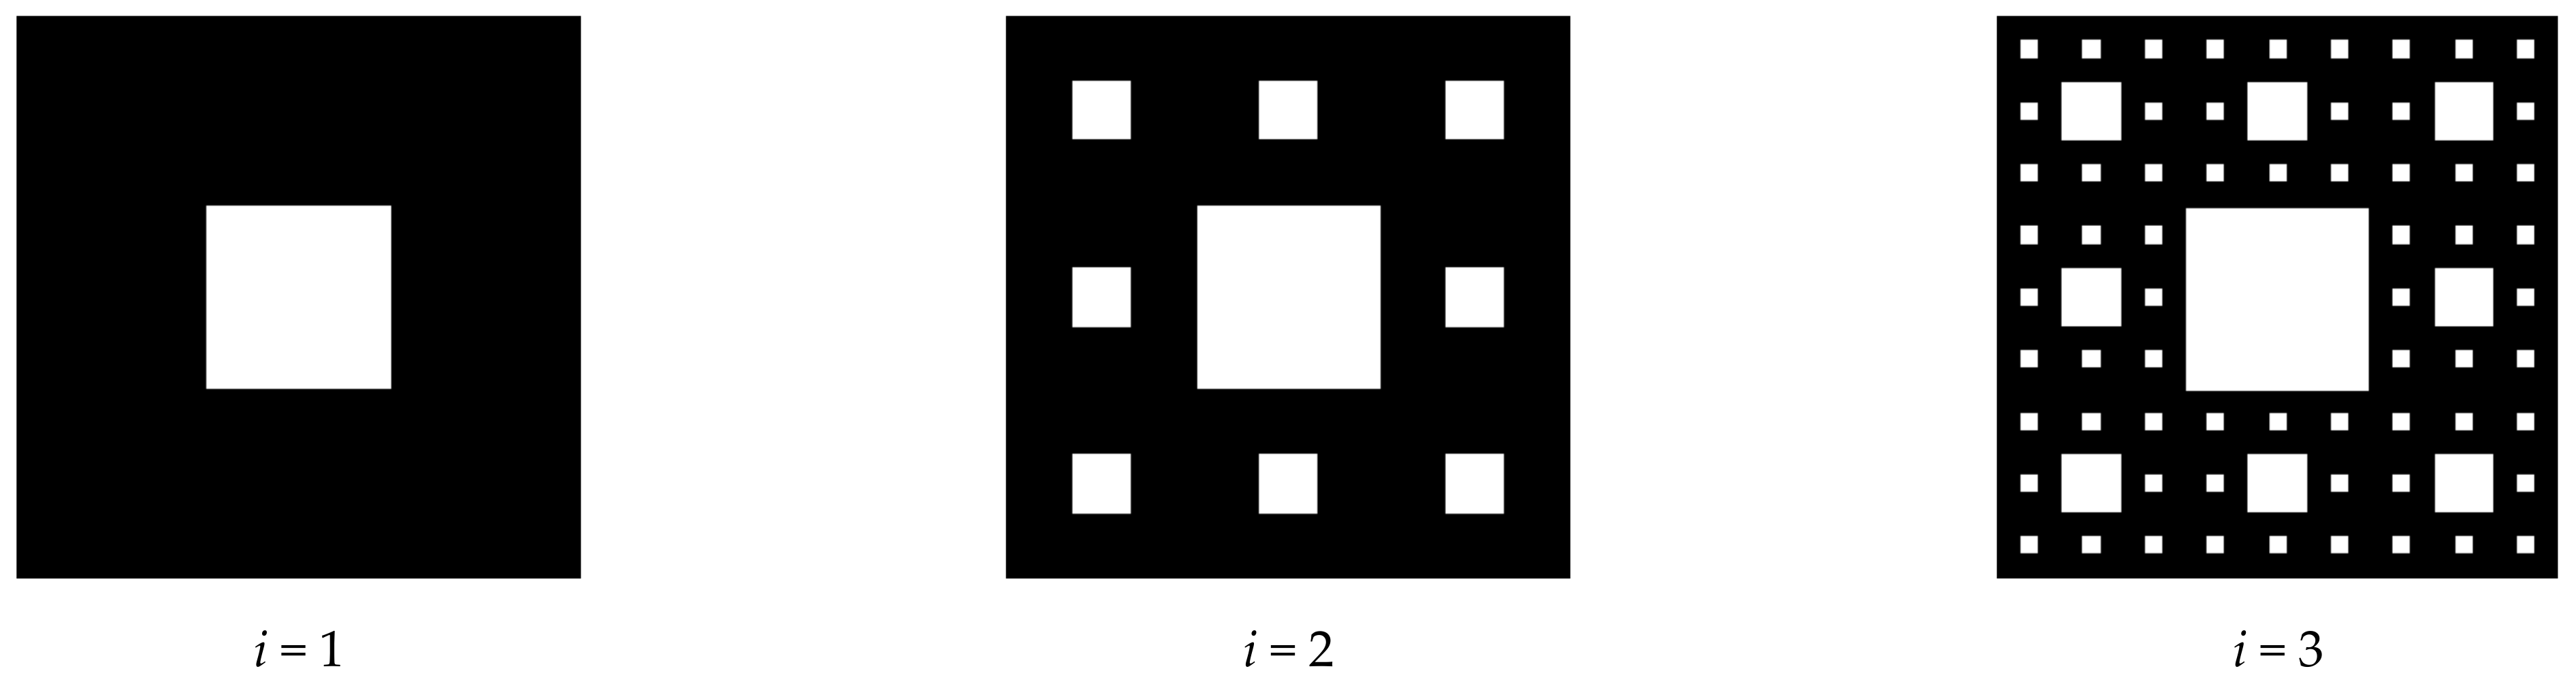
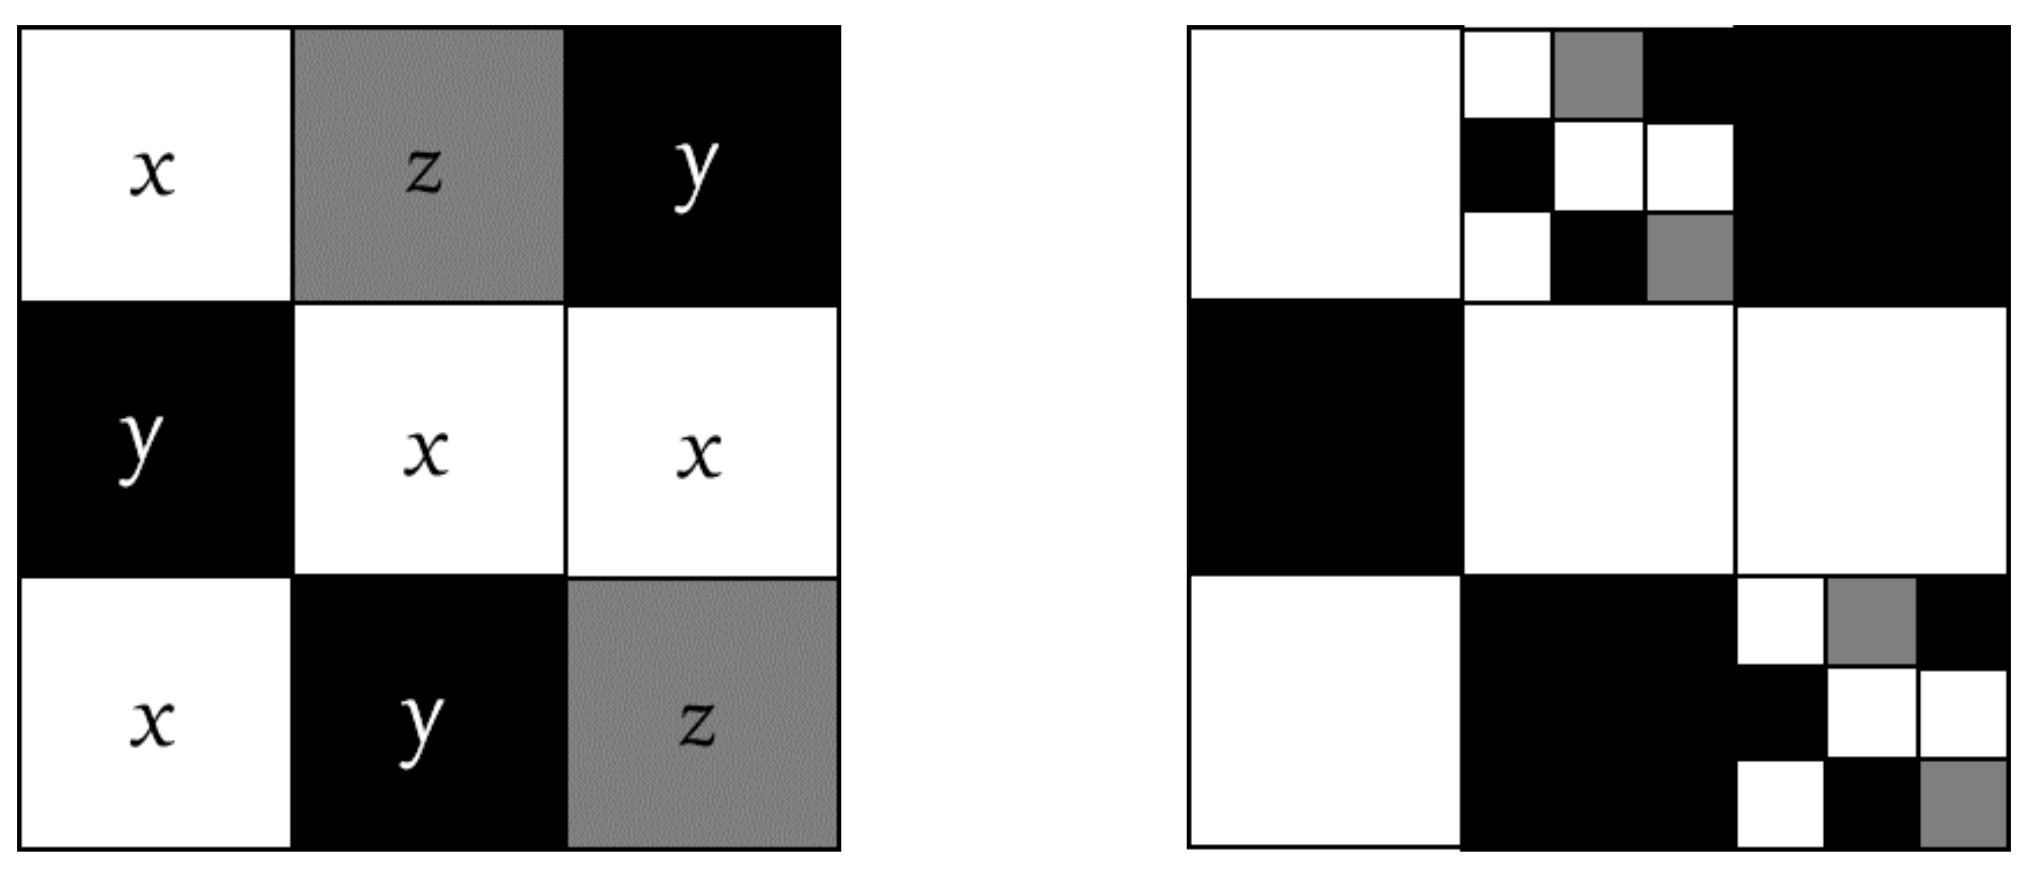
2.2.3. Pore Solid Fractal Model

The proportion z of the regions that can be iterated (the entire shape is repeatedly iterated) is defined as 1 − z = x + y, where x refers to the proportion of porous phase and y refers to the proportion of solid phase. The solid phase and porous phase that are generated after each iteration form a fractal set (figure). In Figure 4, N (1 − z) subregions are divided into Nx = 4 pore subregions (white) and Ny = 3 solid subregions (black), and subregions Nz = 2 for iteration.
In Figure, dE = 2, b = 3, N = 9, z = 2/9, m = 1, x = 4/9, y = 3/9, Equation (4) shows that D = 0.631
D = d E + l n   1     x     y l n b

2.3. Fractal Grading Model

The fractal grading model is a continuous distribution model of particle size established on the basis of the relationship between the cumulative volume fraction of particles less than a certain size and the fractal dimension [38], which can be used to guide the design of the proportion and dosage of the solid-phase admixture of oil-well cement. According to the normalization conditions of fractal theory, the particle size distribution of mixture (oil-well cement, silica sand, and solid-phase admixture) can be found from laser particle size analysis. Among them, the distribution of oil-well cement mixture particle size l m i n     l m a x satisfies fractal theory [46].
l m i n l m a x D     0
The particle size distribution function of the mixture after dry mixing of oil-well cement and admixture is set as
f l = N l N 0
where N l refers to the total number of mixture particles less than the current particle size scale l . N 0 refers to the total number of particles of mixture system and l refers to the current particle size scale, in μm.
In the dry mixture of oil-well cement, the cumulative number N of particles with the diameter less than l is subordinated to the scaling rate relation. It can be obtained from statistical self-similarity of mixture particle size
N l = l l m a x D
where D refers to the particle size fractal dimension, and l m a x refers to the maximum particle size in the mixture, in μm.
In Equation (9), with the assumption that the lower limit of statistical self-similarity is the minimum particle diameter l m i n and the upper limit is the maximum particle diameter l m a x , the distribution in the range from l m i n to l m a x satisfies the fractal power law. Equation (9) is a continuously differentiable function, as indicated by the large number of particles in the mixture. Then, the number of particles in the range of l and l + l is
d N = D l m a x D l D + 1 d l
The correction coefficient k of particle shape is introduced. The admixture used in this paper is quartz sand. Oil-well cement is not greatly different from quartz sand in terms of density. Therefore, with the assumption that oil-well cement is similar to admixture in density, the total mass of particles in the range of ( l m i n ,   l m a x ) obtained from the mass integral d M of particles in the range of ( l ,   l + l ) is M :
d M = l 3 k d N = k D l m a x D l 2     D d l
M = m i n m a x d M = k D l m a x D l 3     D l m a x 3     D     l m i n 3     D
The mass of mixture with a particle size less than l M l is obtained as
M l = m i n l d V l = k D l m a x D l 3 D l m a x 3 D     l 3 D
The mass distribution function of the oil-well cement mixture is defined as g l :
g l = M l M
On the basis of simultaneous Equations (12)–(14), the fractal grading model is obtained
g l = l 3 D l m i n 3 D l m a x 3 D l m i n 3 D
In a certain particle size range, particle size fractal dimension D can reflect the particle size distribution (grading) and thickness in this model. The precondition of its application is that each component is assumed to form a series of continuous accumulation system. The model is derived on the assumption that the density of each component is equal. Under the condition of different density of each component, the same accumulation effect can be transformed into volume distribution function V l .
V l = l 3 D l m i n 3 D l m a x 3 D l m i n 3 D
After the particle size distribution of all mixtures is clarified, the boundary condition and fractal dimension D of mixture particle size are selected to obtain the volume fraction of each admixture by using Equation (16). Then, the mass proportion of each component can be obtained through mass conversion to design the solid-phase formula of high-temperature cement slurry system.

3. Design of High-Temperature Well Cementing Slurry System

3.1. Design Principles

Wellbore conditions and casing program of deep wells and ultra-deep wells are complicated [6], which is why the operation in well-cementing operation is difficult. The influence of underground high temperature, high pressure, narrow clearance and other factors is usually considered in well-cementing operations [19,20]. It needs to be designed from the perspectives of slurry rheology, density stability, water loss control, thickening time regulation, early compressive strength development and long-term sealing performance. At the same time, the requirements of smooth cementing operation need to be satisfied, thus improving injection and displacement efficiency and long-term effective sealing in the whole oil-well life cycle.

3.2. Experimental Materials

Fluid loss additive A, retarder B, dispersant C and gas channeling proof agent D with good temperature resistance are selected as the fluid-phase admixture. Chuanfeng coarse sand and fine sand are selected as the solid-phase admixture. The cement is Sanxia Grade G. The particle size distribution of each solid-phase material is measured by using a Master—sizer 2000 laser particle size analyzer, as shown in Table 1.

3.3. Design of Solid Phase Formula

In solid-phase particle grading design, when different specifications of oil-well cement and solid-phase admixture are used, the upper and lower limits of the particle size of the mixture change accordingly, which can be adjusted by appropriately changing the limit particle size and fractal dimension of the fractal grading model. Solid-phase admixtures of cement slurry system with high temperature resistance mainly include coarse sand and fine sand. The use of fluid-phase admixture in the design process should be reasonably optimized and proportioned according to engineering performance requirements.
The particle size distribution of the three kinds of materials in Table 1 shows that the particle size of materials meets continuous distribution characteristics. The boundary condition of the mixture is selected as follows: the maximum particle size l m a x is 175 μm, and the minimum particle size l m i n is 0.4 μm. The particle size of the mixture is divided into three levels, namely, 0.4–20 μm, 20–34 μm, and 34–175 μm. Andersen proposed a packing model of continuously distributed particle size based on statistical similarity, where U l refers to the cumulative percentage; l refers to the current particle size; l m a x refers to the maximum particle size, in μm; q refers to the Fuller index.
U l = λ l l m a x q
The statistical data of this packing model show that, when 1 / 3     q     1 / 2 , the proportion of solid-phase particles in unit volume is the largest; that is, the porosity is the smallest, resulting in compact packing. At this moment, the fractal dimension D of the particle size distribution of solid-phase materials of the high-temperature cement slurry system is 2.50–2.67. This result shows that oil-well Grade G cement, fine sand and coarse sand can realize compact packing in the particle size distribution range. Then, the D value is 2.52, 2.55, 2.58, 2.61, 2.64 and 2.67. According to the theory of silicon–calcium ratio, the total amount of sand added in high-temperature cement slurry is designed to be 35% and 45% (proportion of cement mass). The volume fraction of the particles in each particle size range is calculated based on fractal grading and then converted into the mass fraction of three components. The calculation results are shown in Table 2 and Table 3.
Table 2 and Table 3 show that when the total amount of sand is determined, the content of fine sand will gradually increase with the increase in fractal dimension D, whereas the content of coarse sand will gradually decrease; that is, if the fractal dimension is larger, then the particles become finer, and conversely, the particles become thicker. With cement slurry configured as 1.88 g/cm3 is taken as an example, when the amount of added sand is determined, if the D value decreases, then the amount of coarse sand increases, and the high-temperature resistance of cement stone decreases (the experimental result is shown in Figure 5 and Figure 6), and the flowability of cement slurry is good. If the D value is larger, then the amount of fine sand increases, the high-temperature resistance of cement stone improves, and the flowability of cement slurry is worse. In accordance with the amount of added sand corresponding to particle size fractal dimension D and the comprehensive performance result of cement from the experiment, when the amount of added sand is 35%, the D value is 2.61; when the amount of added sand is 45%, the D value is 2.64.

3.4. Design of Fluid-Phase Formula

If the change rate (absolute value) of the molecular weight of the polymer admixture before and after high-temperature treatment is smaller, then its temperature resistance is better. With the help of Ubbelohde’s viscosity experiment, the temperature resistance of polymer admixture is evaluated by analyzing the change of the viscosity–molecular weight of polymer admixture. As a means of optimizing the high-temperature polymer admixture, it can be used to guide the design of a high-temperature well-cementing slurry system.
The samples of three kinds of fluid loss additives and retarder were each placed in a roller heating furnace at 180 °C for 3 h. They were then taken out after cooling for later use. Temperature and curing time were determined according to the field experimental conditions of the well-cementing operation. In this paper, four open-operation environments exist in Chuanshen Well No. 1; the experimental temperature is 180 °C, and the concentration of fluid loss additive and retarder is similar to the water distribution concentration of well-cementing working fluid, which is 10% in this work. The experimental results are shown in Table 4 and Table 5.
The experimental results show that, after heat treatment (180 °C), the change rates (absolute values) of the molecular weights of three fluid loss additives are as follows: fluid loss additive A is 25.79%, fluid loss additive B is 73.58%, and fluid loss additive C is 62.70%, thereby indicating that the change in the molecular weight of fluid loss additive A is small after high-temperature (180 °C) treatment. By comparison, it has good temperature resistance.
The experimental results also that, after heat treatment (180 °C), the change rates (absolute values) of the molecular weights of three retarders are 36.14% for retarder A, 19.20% for retarder B, and 33.97% for retarder C, thereby indicating that the change in the molecular weight of retarder B is small after high-temperature (180 °C) treatment. By comparison, it has good temperature resistance. Finally, fluid loss additive A and retarder B with good temperature resistance are selected as the fluid-phase admixture.

4. Performance Evaluation of High-Temperature Well Cementing Slurry System

4.1. Experimental Methods

Cement slurry was prepared according to the API RP 10B Recommended Practice for Testing Well Cements of the American Petroleum Institute, in which the dosage of the admixture is calculated as its percentage in the mass of dry cement [47].

4.2. Performance Evaluation of Cement Slurry

The performance evaluation of the cement slurry system is performed. Table 6 shows that the density of high-temperature cement slurry can be adjusted in the range of 1.90–2.30 g/cm3. The slurry has good stability, with water loss less than 50 mL, a short transition time, and low early volume shrinkage. With an anti-channeling performance coefficient (SPN) less than 1.63, it has good anti-gas channeling performance and high compressive strength, which can meet the requirements of high-temperature and high-pressure well-cementing construction.

4.3. Evaluation of Temperature Resistance of Cement Slurry

A cement stone sample was prepared and cured according to GB/T 19139-2012 [48]. The prepared cement slurry was placed in a test mold to check the compressive strength. Four test pieces were used for each formula, which were placed in a pressurized curing kettle for curing at 180 °C. After the curing time was reached, the cement samples were taken out to analyze their compressive strength, phase, and micromorphology.

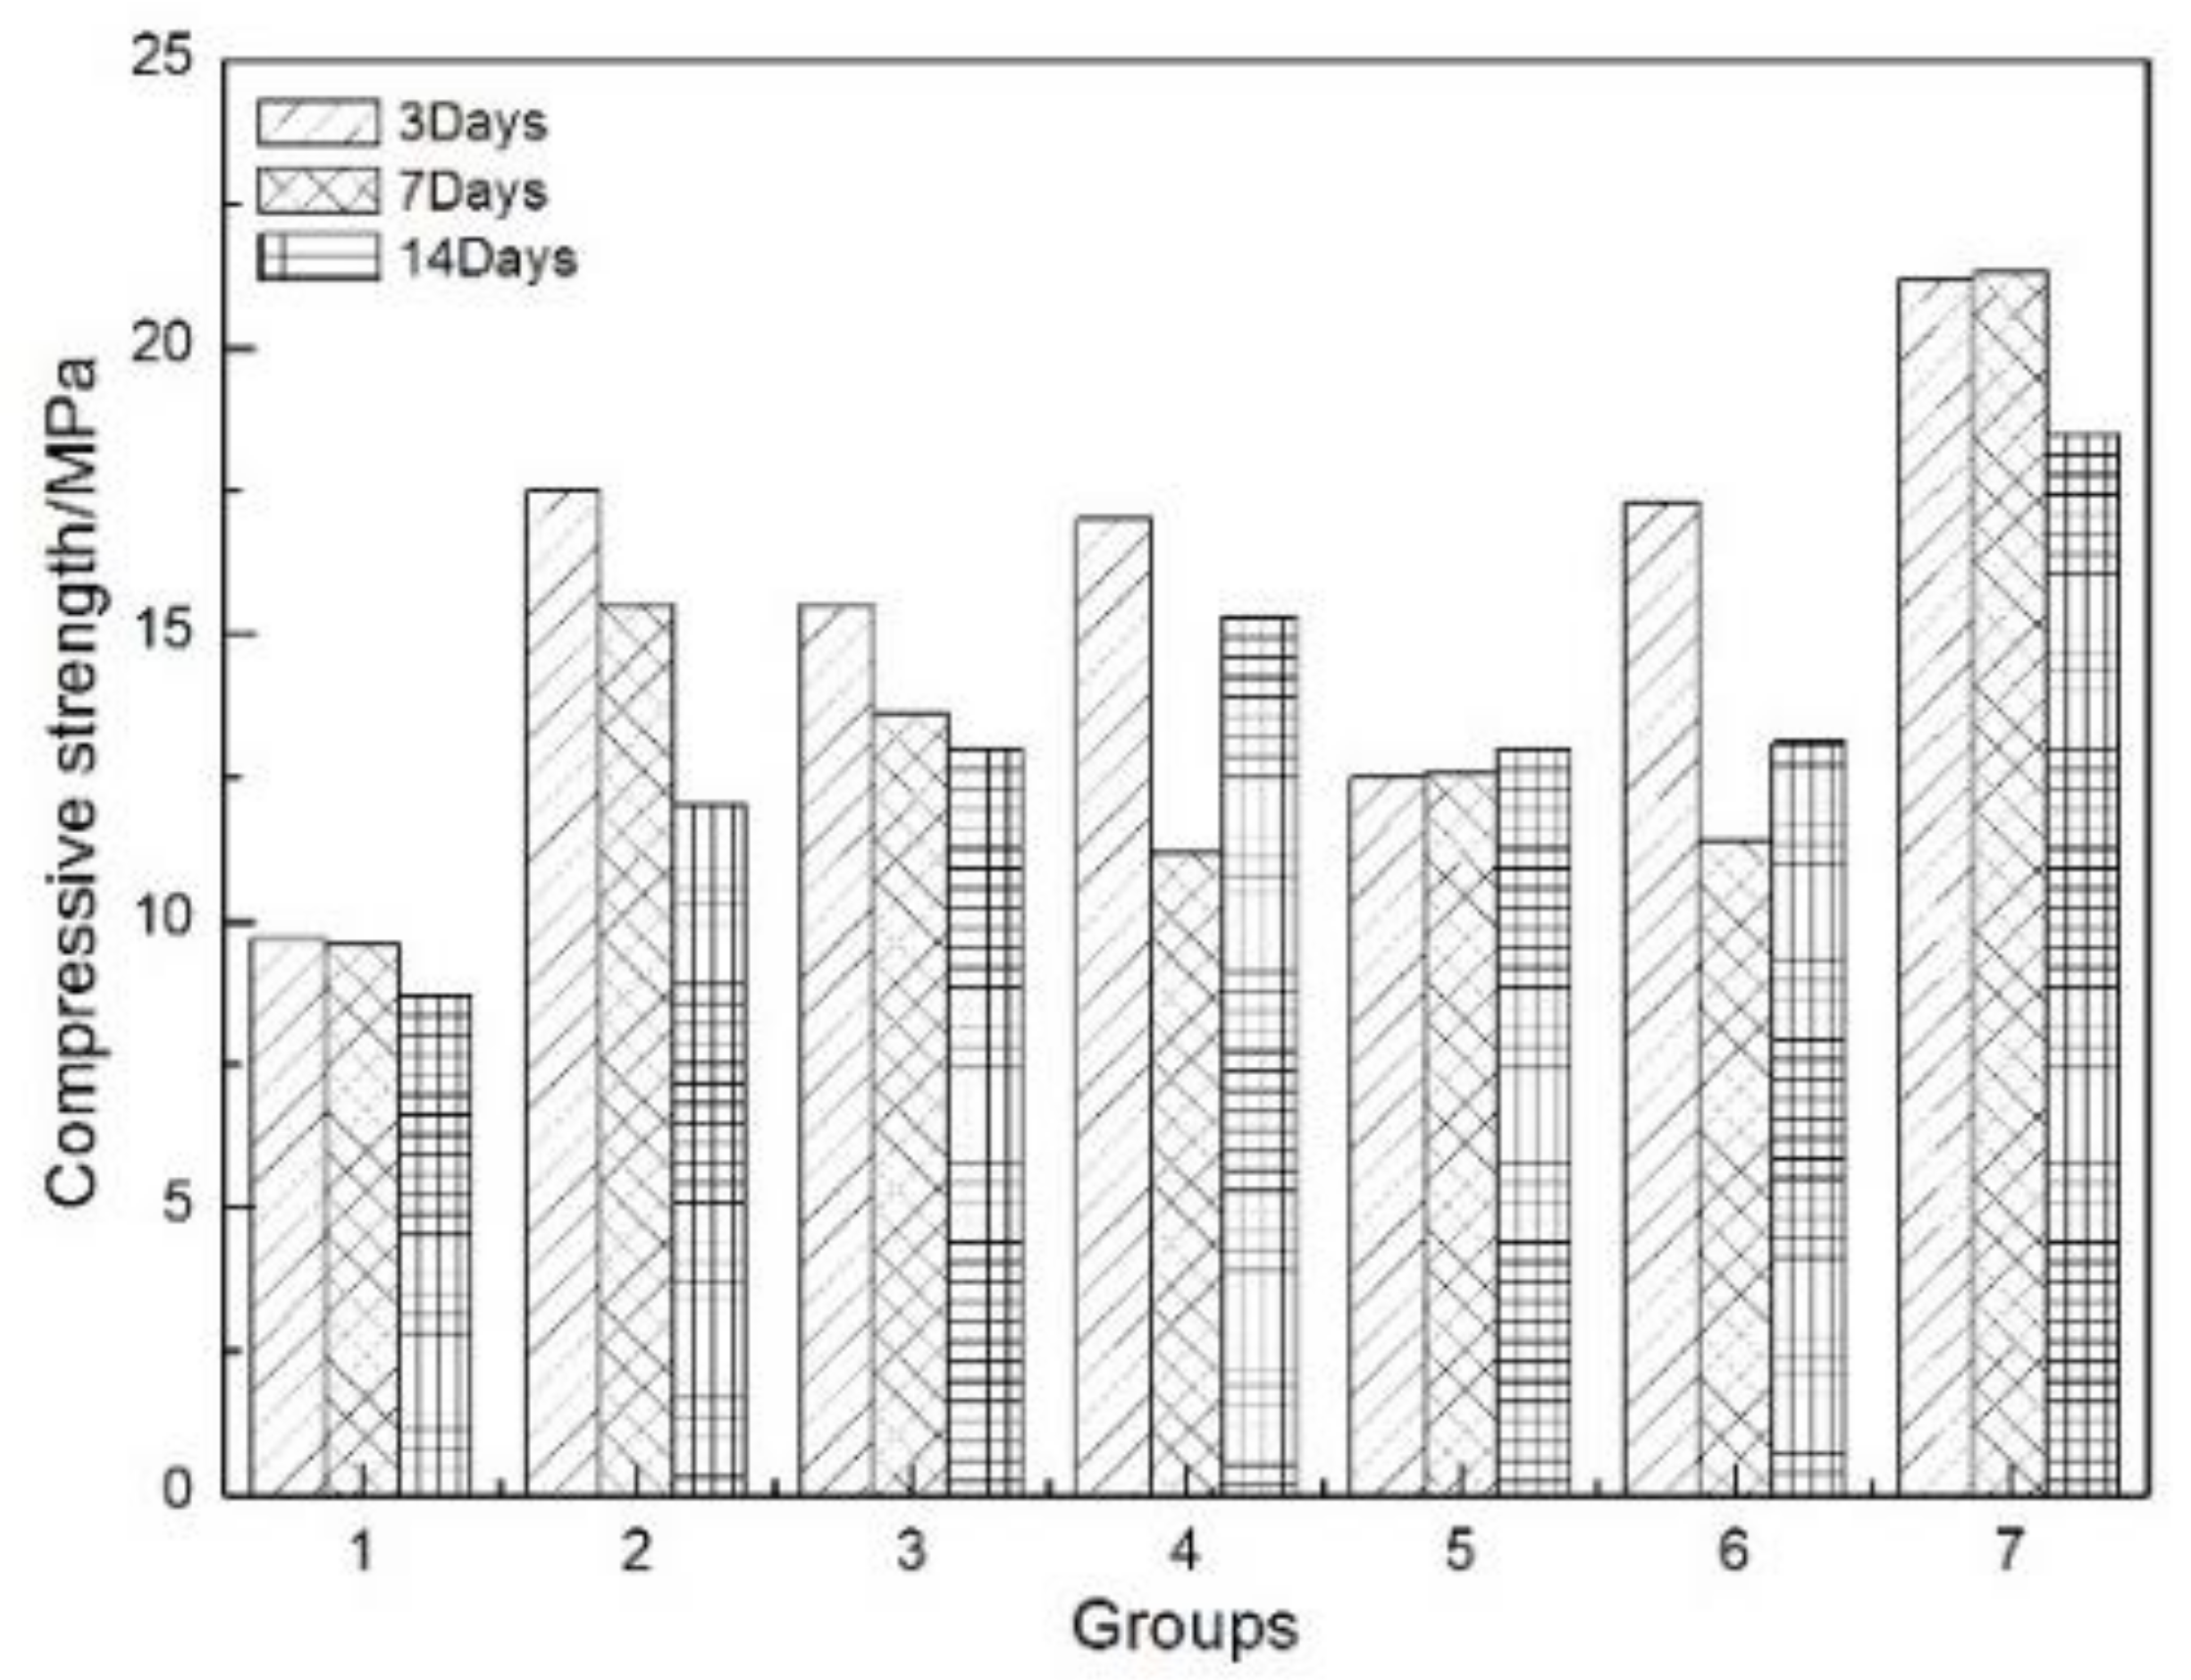
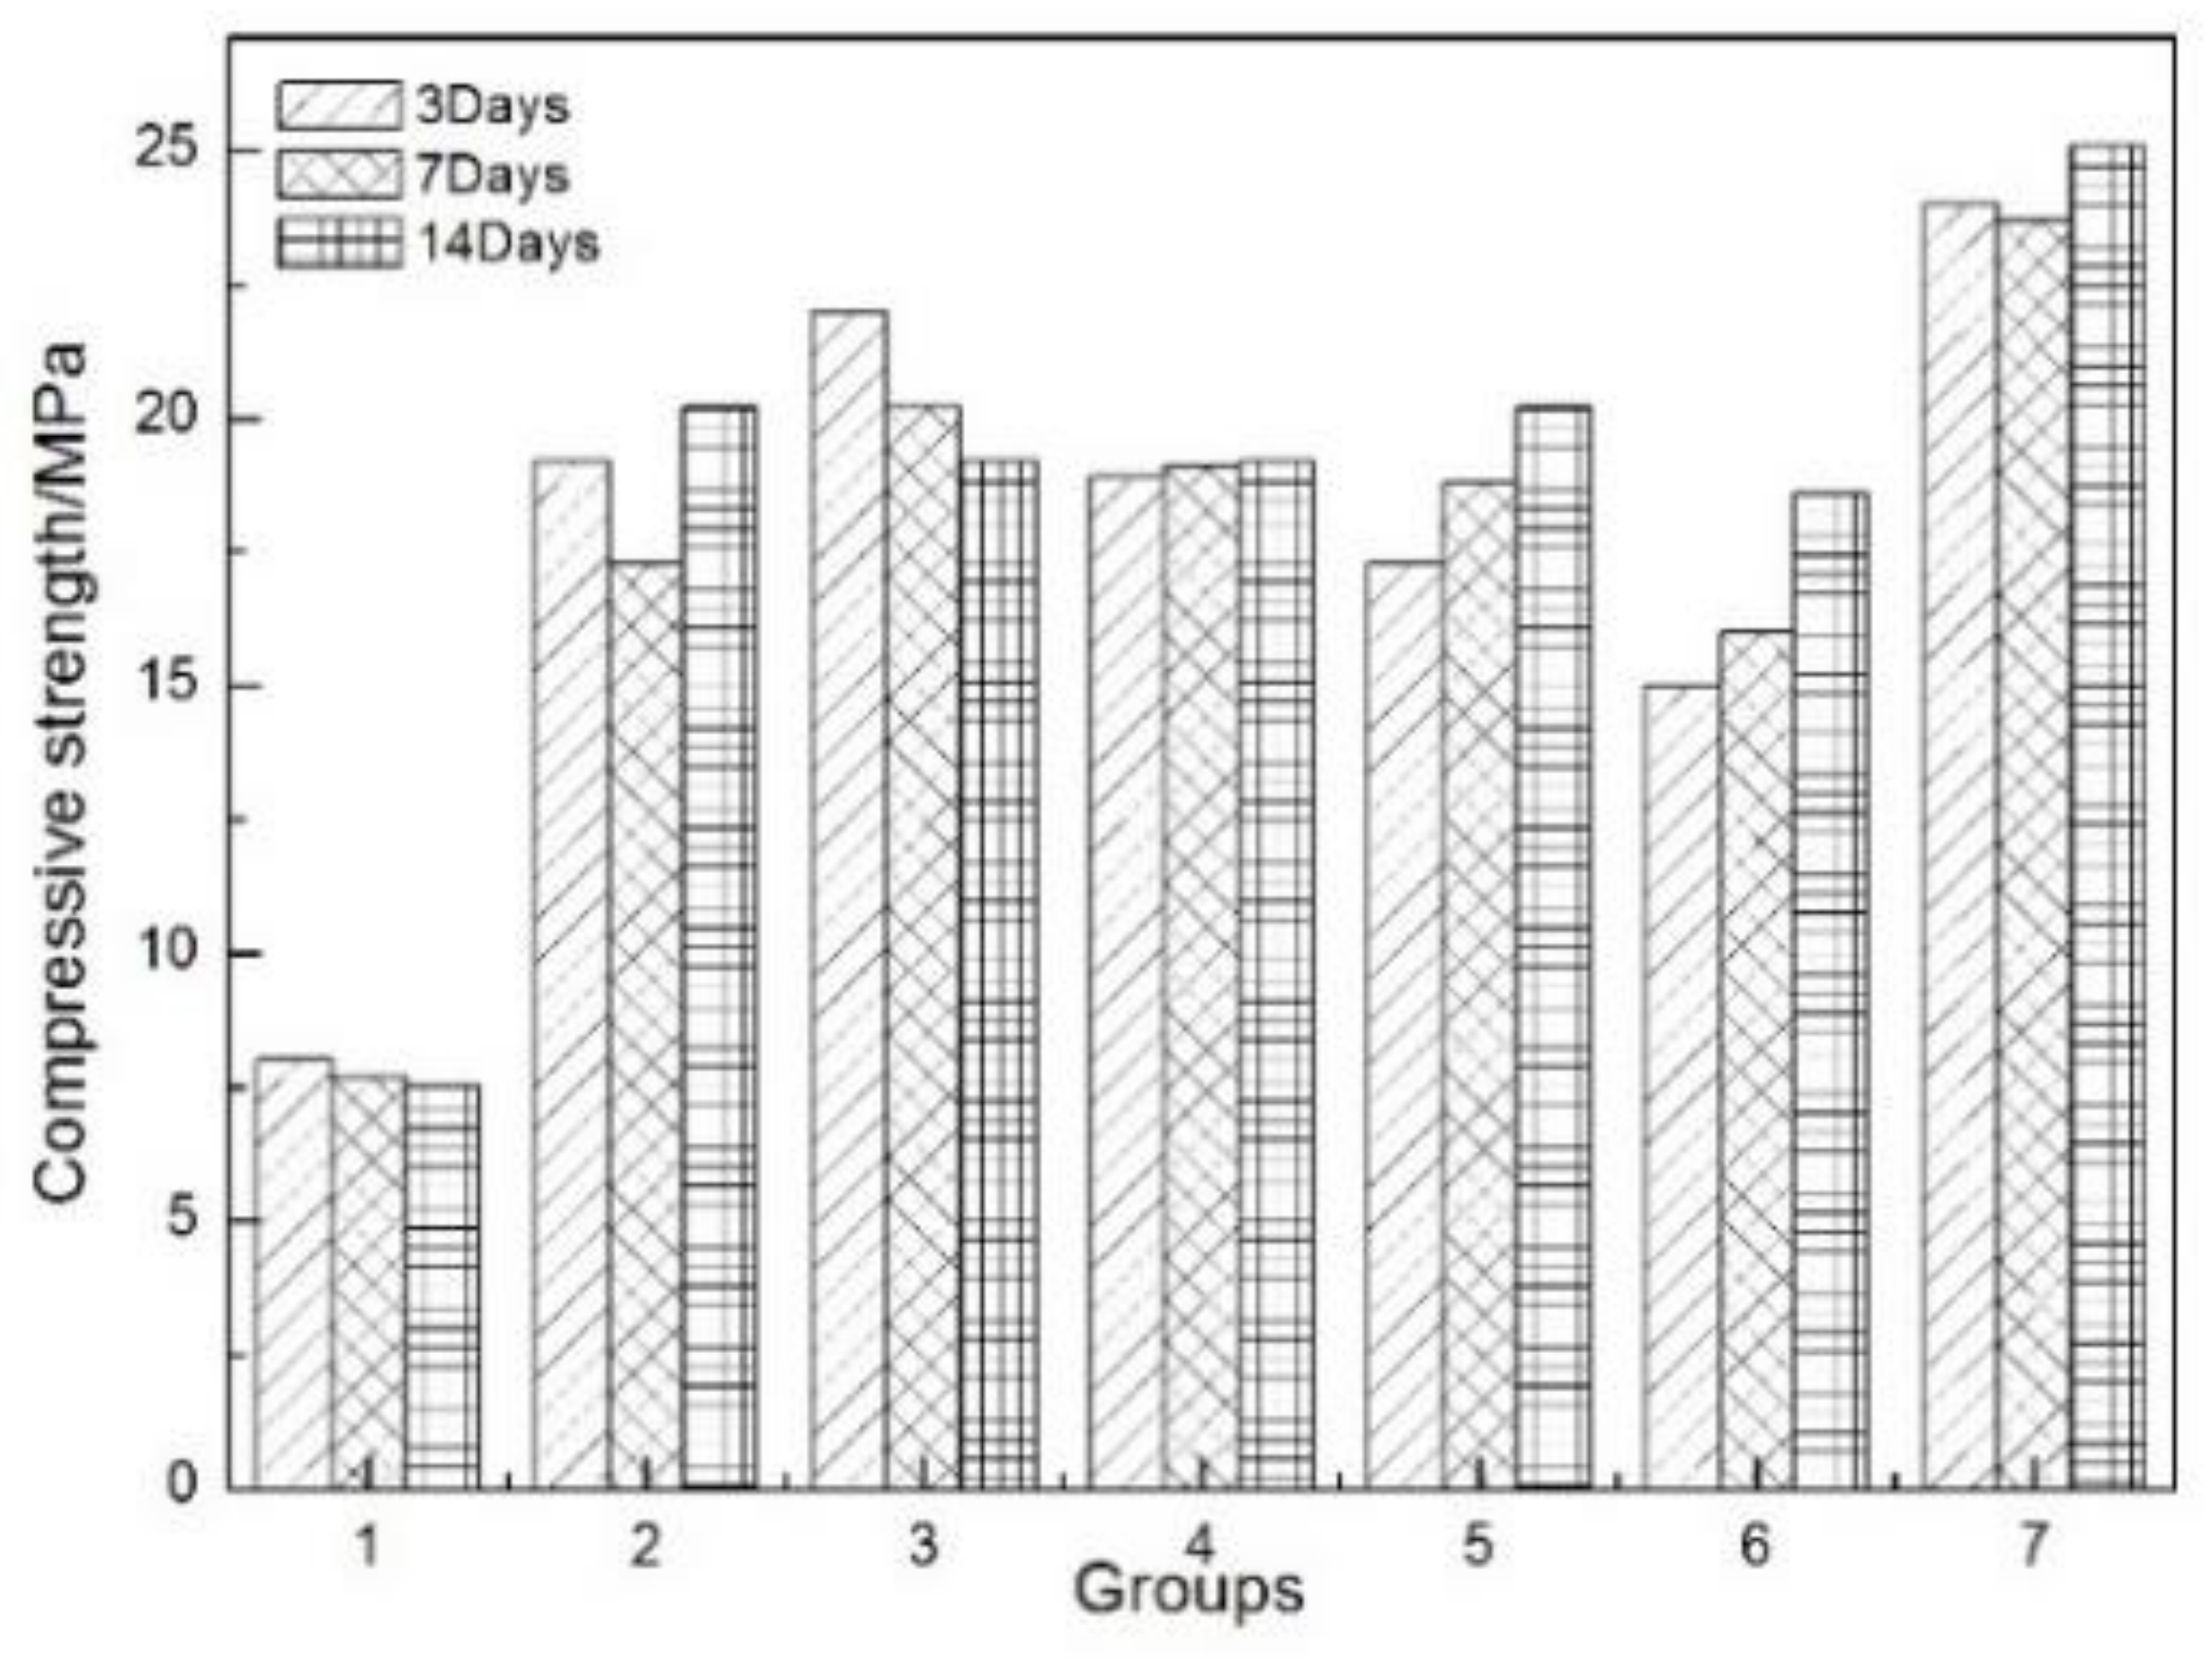
4.3.1. Compressive Strength of Cement Stone

According to the design of the fractal grading model, for the cement slurry system with the 35% and 45% added sand [22,23,24,25,49,50,51], the solid phase formulas are Formulas (1)–(7), as shown in Table 2 and Table 3. The fluid-phase admixture is adjusted based on different working environments. The density of the cement slurry is 1.88 g/cm3. To cure at 180 °C, the samples were placed in a high-temperature pressurized curing kettle (OWC-9380) at 20 MPa, with the formulas corresponding to cement samples with D values of 2.52, 2.55, 2.58, 2.61, 2.64, and 2.67. They are cured for 3, 7, and 14 days and compared with blank control (cement + water). The experimental results are shown in Figure 5 and Figure 6.
The analysis results show that when the cement stone is cured at 180 °C, adding sand can effectively alleviate the strength retrogression. By comparison, 45% sand addition can better prevent the strength retrogression of cement stone than 35% sand addition. Compared with the blank control, after the cement stone has been cured for 14 days, the strength of cement stone with 35% sand addition is 13–15.6 MPa, whereas the strength of cement stone with 45% sand addition is 17–20 MPa. Under the same amount of added sand, adding fine sand is conducive to the development of early strength. However, coarse sand is conducive to the growth of long-term strength. The strength performance is the best only when fine sand is added, yet the rheology will be seriously affected. When coarse sand is used together with fine sand, the cement slurry shows good engineering performance and high strength at high temperature.

4.3.2. Phase Analysis

After cement stone samples with Formulas (1)–(7) (35% sand addition) were cured at 180 °C for 7 days, X-ray powder diffraction test was performed after drying for phase analysis to compare the changes of hydration products with different proportions of coarse and fine particles [52,53]. The experimental results are shown in Figure 7.
Phase analysis results show that the Ca(OH)2 content of cement stone containing sand is significantly lower than that of blank cement stone. With the increase in fine sand content, the contents of Ca(OH)2 and SiO2 are significantly lower than those of cement stone that contains coarse sand, showing that the ability of fine sand to participate in the reaction is stronger than that of coarse sand (the specific surface area of fine sand is 13 times of coarse sand). At the same time, with the increase in the proportion of fine sand, the peak intensity of high-temperature-resistant hydration product C6S6H gradually increases, and the peak intensity of Ca(OH)2 and C2SH further decreases, thereby improving the strength retrogression of cement stone.

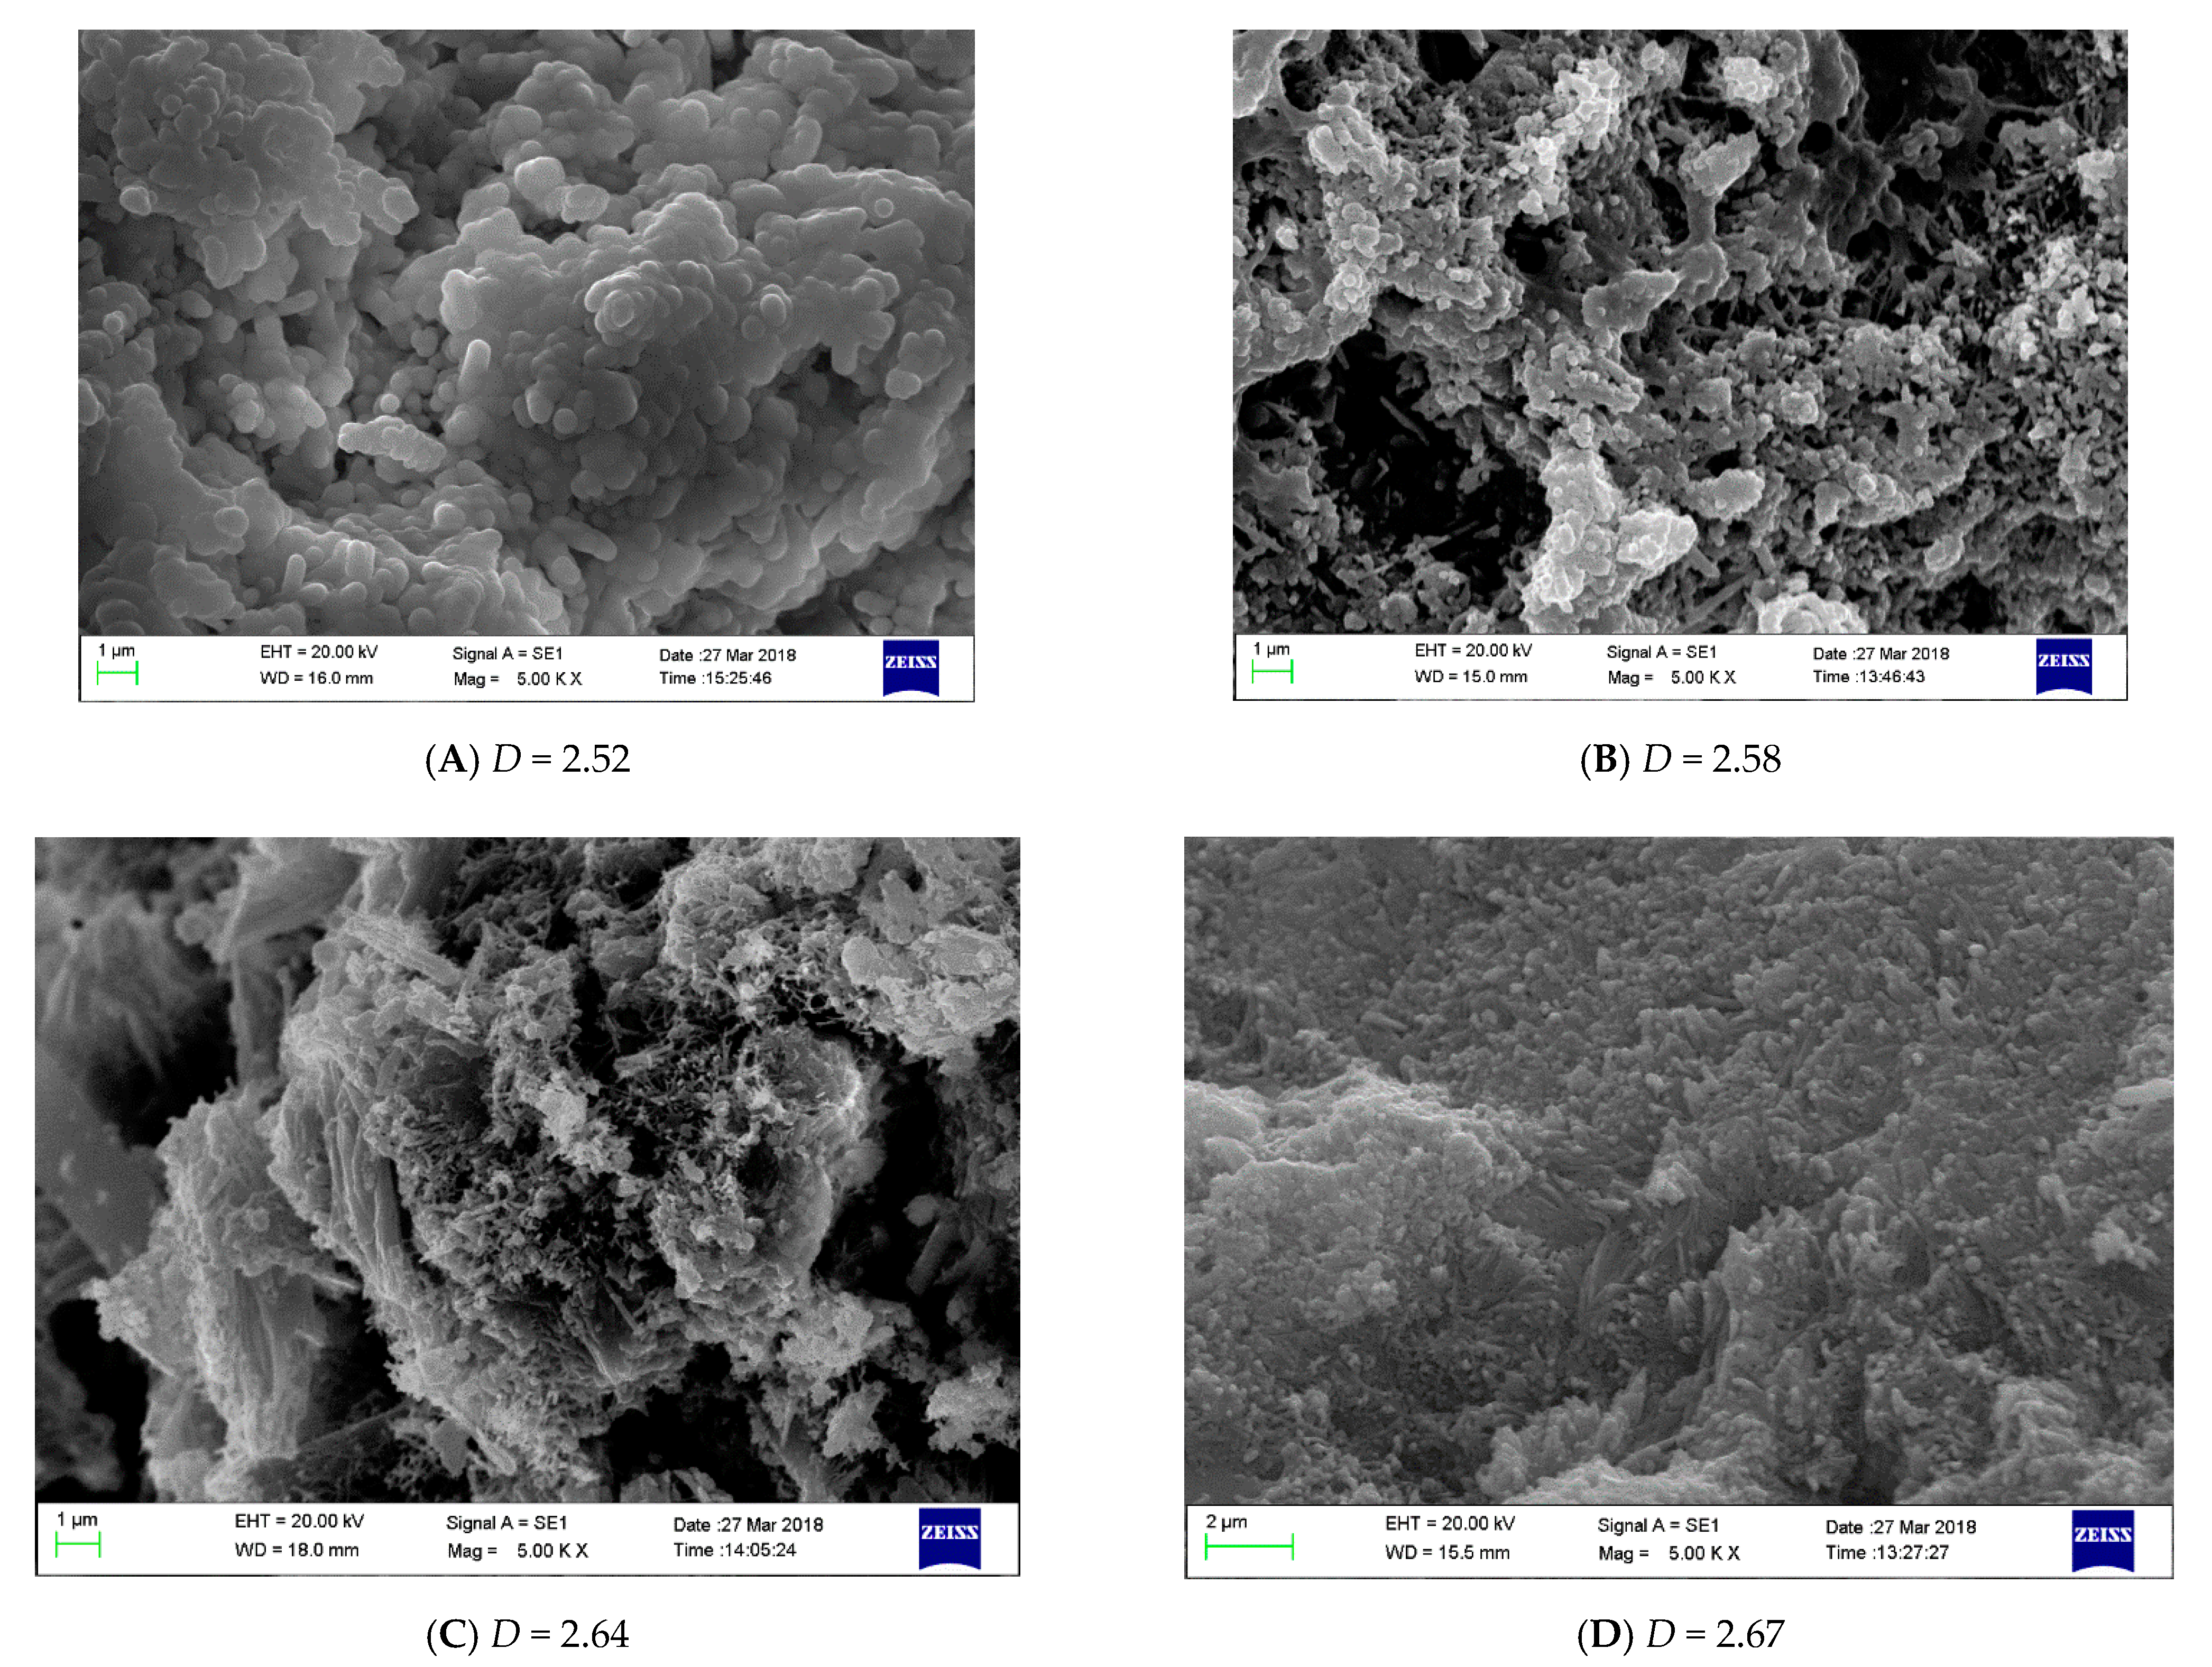
4.3.3. Analysis of Micromorphology

After cement stone samples with Formulas (2), (4), (6) and (7) (35% sand addition) are cured at 180 °C for 7 days, micro-morphology analysis is performed. The corresponding fractal dimension D values are 2.52, 2.58, 2.64, and 2.67. The experimental results are shown in Figure 8.
The micromorphology map shows that when the D value is the smallest, that is, only coarse sand is added, incompletely reacted silica sand particles are still present in cement stone; with the increase in the D value, coarse sand and fine sand are graded and packed, and cement hydration products are packed with each other, forming a network structure. When the D value increases—that is, only fine sand is added—cement stone is more dense. This finding also verifies that the high-temperature cement slurry designed in this paper has good temperature resistance and proves the feasibility of designing a high-temperature cement slurry system.

5. Conclusions

The traditional particle packing model is established on the basis of the average particle size. The fractal packing model is based on continuous particle size distribution, which more conforms to the particle size characteristics of oil-well cement admixture.
When the maximum particle size of high-temperature cement admixture l m a x is 175 μm and the minimum particle size l m i n is 0.4 μm, the corresponding particle size distribution fractal dimension D is 2.50–2.67. At this moment, the porosity is minimum and compact packing is realized. On the basis of a comprehensive evaluation of engineering performance, when the amount of added sand is 35%, the D value is 2.61. At this time, the content of fine sand is 15.6%, and the content of coarse sand is 19.4%. When the amount of added sand is 45%, the D value is 2.64. At this time, the content of fine sand is 20.7%, and the content of coarse sand is 24.3%.
In this paper, solid-phase materials of the high-temperature cement system include oil-well Grade G cement, fine sand and coarse sand. The particle size ranges of three kinds of particle materials conform to the characteristics of continuous distribution. However, the difference in the particle size of Grade G cement and fine sand particles is small. In the future, the evaluation of packing characteristics and cement slurry performance will be designed and studied through optimizing several particle materials with particle size difference.
The cement slurry designed by the fractal packing model has good engineering performance and anti-gas channeling ability. At 180 °C, when the amount of added sand is 45%, the strength on the 14th day is 17–20 MPa and the space grid structure is formed, with good high temperature resistance. These findings verify the feasibility of designing a high-temperature cement slurry system on the basis of the fractal packing model.

Author Contributions

Conceptualization, J.S.; Data curation, G.Z.; Formal analysis, Z.L.; Funding acquisition, X.G.; Investigation, G.Z. and Z.L.; Methodology, X.G.; Project administration, X.G.; Validation, J.S.; Visualization, Z.L.; Writing—original draft, G.Z. and J.S.; Writing—review & editing, G.Z. and Z.L. All authors have read and agreed to the published version of the manuscript.

Funding

National Natural Science Foundation of China: 5157041530.

Institutional Review Board Statement

Not applicable.

Informed Consent Statement

Not applicable.

Conflicts of Interest

The authors declare no conflict of interest.

References

  1. Ahn, Y.; Kim, J.; Kwon, J.S.-I. Optimal design of supply chain network with carbon dioxide injection for enhanced shale gas recovery. Appl. Energy 2020, 274, 115334. [Google Scholar] [CrossRef]
  2. Liu, Y.; Jin, S.-D.; Cao, Q.; Zhou, W. Tertiary hydrothermal activity and its effect on reservoir properties in the Xihu Depression, East China Sea. Pet. Sci. 2019, 16, 14–31. [Google Scholar] [CrossRef] [Green Version]
  3. Zhao, J.-Z.; Li, J.; Wu, W.-T.; Cao, Q.; Bai, Y.-B.; Er, C. The petroleum system: A new classification scheme based on reservoir qualities. Pet. Sci. 2019, 16, 229–251. [Google Scholar] [CrossRef] [Green Version]
  4. Lan, W.-J.; Wang, H.-X.; Zhang, X.; Chen, S.-S. Sealing properties and structure optimization of packer rubber under high pressure and high temperature. Pet. Sci. 2019, 16, 632–644. [Google Scholar] [CrossRef]
  5. Xu, T.; Liu, C.; Huang, B.; Liu, X. Theory and Application of Cementing in Oil and Gas Wells; Petroleum Industry Press: Beijing, China, 2001. [Google Scholar]
  6. Jimenez, W.C.; Urdaneta, J.A.; Pang, X.; Garzon, J.R.; Nucci, G.; Arias, H. Innovation of Annular Sealants during the Past Decades and Their Direct Relationship with On/Offshore Wellbore Economics; SPE-180041; SPE Bergen One Day Seminar: Bergen, Norway, 2016. [Google Scholar] [CrossRef]
  7. Majumdar, A.; Bhushan, B. Role of Fractal Geometry in Roughness Characterization and Contact Mechanics of Surfaces. J. Tribol. 1990, 112, 205–216. [Google Scholar] [CrossRef]
  8. Moskovits, M. The fractal nature of particle size distributions of grounds clinker. Cem. Concr. Res. 1990, 20, 499–505. [Google Scholar] [CrossRef]
  9. Thompson, A.H.; Katz, A.J.; Krohn, C.E. The microgeometry and transport properties of sedimentary rock. Adv. Phys. 1987, 36, 625–694. [Google Scholar] [CrossRef]
  10. Xia, C.; Liu, H. Research on Fractal Characteristics of the Size-Distribution of Concrete Aggregates. J. Southwest Jiaotong Univ. 2002, 2, 186–189. (In Chinese) [Google Scholar]
  11. Wang, Q.; Hu, J. Concrete aggregate gradation and fractal. Rock Soil Mech. 1997, 3, 93–99. (In Chinese) [Google Scholar]
  12. Katz, A.; Thompson, A. Fractal sandstone pores: Implications for conductivity and formation. Phys. Lett. 1985, 54, 1325–1328. [Google Scholar] [CrossRef]
  13. Dathe, A.; Eins, S.; Niemeyer, J.; Gerold, G. The surface fractal dimension of the soil–pore interface as measured by image analysis. Geoderma 2001, 103, 203–229. [Google Scholar] [CrossRef]
  14. Arandigoyen, M.; Alvarez, J.I. Pore structure and mechanical properties of cement–lime mortars. Cem. Concr. Res. 2007, 37, 767–775. [Google Scholar] [CrossRef] [Green Version]
  15. Arandigoyen, M.; Alvarez, J.I. Blended pastes of cement and lime: Pore structure and capillary porosity. Appl. Surf. Sci. 2006, 252, 8077–8085. [Google Scholar] [CrossRef] [Green Version]
  16. Huang, B. Cementing materials and process system optimized close packing theory. Drill. Fluid Completion Fluid 2001, 6, 4–12. [Google Scholar]
  17. Horsfield, H.T. The strength of asphalt mixtures. J. Soc. Chem. Ind. 1934, 53, 107–115. [Google Scholar]
  18. Liu, H. Particle size distribution and accumulation theory. J. Silic. 1991, 19, 164–172. [Google Scholar]
  19. Abid, K.; Gholami, R.; Tiong, M.; Nagaratnam, B.; Sarmadivaleh, M.; Mostofi, M.; Bing, C.H.; Muktadir, G. A Pozzolanic Supplementary Material to Reinforce Class G Cement Used for Drilling and Completion Operations. J. Pet. Sci. Eng. 2019, 177, 79–92. [Google Scholar] [CrossRef]
  20. Vidal, A.V.; Araujo, R.G.; Freitas, J.C. Sustainable Cement Slurry Using Rice Husk Ash for High Temperature Oil Well. J. Clean. Prod. 2018, 204, 292–297. [Google Scholar] [CrossRef]
  21. Swayze, M. Effect of High Temperature on Strength of Oil-Well Cements (Mid-Continent District Study Committee on Cementing Practices and Testing of Oil-Well Cements); Drilling and Production Practice: New York, NY, USA, 1954; API-54-072. [Google Scholar]
  22. Rust, C.F.; Wood, W.D. Laboratory Evaluations and Field Testing of Silica-CMHEC-Cement Mixtures. J. Pet. Technol. 1960, 12, 25–29. [Google Scholar] [CrossRef]
  23. Krakowiak, K.J.; Thomas, J.J.; Musso, S.; James, S.; Akono, A.-T.; Ulm, F.-J. Nano-Chemo-Mechanical Signature of Conventional Oil-Well Cement Systems: Effects of Elevated Temperature and Curing Time. Cem. Concr. Res. 2015, 67, 103–121. [Google Scholar] [CrossRef]
  24. Krakowiak, K.J.; Thomas, J.J.; James, S.; Abuhaikal, M.; Ulm, F.-J. Development of Silica-Enriched Cement-Based Materials with Improved Aging Resistance for Application in High-Temperature Environments. Cem. Concr. Res. 2018, 105, 91–110. [Google Scholar] [CrossRef]
  25. Reddy, B.R.; Zhang, J.; Ellis, M. Cement Strength Retrogression Issues in Offshore Deep Water Applications—Do We Know Enough for Safe Cementing. In Proceedings of the Offshore Technology Conference, Houston, TX, USA, 2–5 May 2016. [Google Scholar] [CrossRef]
  26. Thomas, J.; James, S.; Ortega, J.A.; Musso, S.; Auzerais, F.; Krakowiak, K.; Akono, A.-T.; Ulm, F.-J.; Pellenq, R. Fundamental Investigation of the Chemical and Mechanical Properties of High-Temperature-Cured Oilwell Cements. In Proceedings of the Offshore Technology Conference, Houston, TX, USA, 30 April–3 May 2012. [Google Scholar] [CrossRef]
  27. José Maria Gómez de Salazar, A.; Ureña, M.; Dolores, E. Diffusion Bonding of Discontinuously Reinforced SiC/Al Matrix Composites: The Role of Interlayers. Key Eng. Mater. 1995, 104, 523–540. [Google Scholar]
  28. Tsivilis, S.; Parissakis, G. A mathematical model for the prediction of cement strength. Cem. Concr. Res. 1995, 25, 9–14. [Google Scholar] [CrossRef]
  29. Ji, X.; Chan, S.Y.N.; Feng, N. Fractal model for simulating the space-filling process of cement hydrates and fractal dimensions of pore structure of cement-based materials. Cem. Concr. Res. 1997, 27, 1691–1699. [Google Scholar] [CrossRef]
  30. Yin, H. Study the Fractal Characteristic of Concrete’s Pore Structure; Guangxi University: Nanning, China, 2006. [Google Scholar]
  31. Chen, Y.; Li, Y.; He, X.; Wei, J.; Zhang, W.; Zhang, H.; Guo, S. Pore volume fractal dimension of fly ash-cement paste and its relationship between the pore srtucture and strength. J. Chin. Ceram. Soc. 2003, 31, 774–779. [Google Scholar]
  32. Tang, M. Study on the fractal characteristics of concrete pores. Concrete 2000, 8, 3–5. [Google Scholar]
  33. Orford, J.D.; Whalley, W.B. The use of the fractal dimension to quantify the morphology of irregular-shaped particles. Sedimentology 1983, 30, 655–668. [Google Scholar] [CrossRef]
  34. Chen, Y.P.; Shi, M.H. Determination of permeability using fractal method far porous media. Sci. China (Ser. E Technol. Sci.) 2001, 44, 625–630. [Google Scholar]
  35. Wang, Y.; Diamond, S. A fractal study of the fracture surfaces of cement pastes and mortars using a stereoscopic SEM method. Cem. Concr. Res. 2001, 31, 1385–1392. [Google Scholar] [CrossRef]
  36. Mandelbrot Benoit, B. The Fractal Geometry of Nature, Updated ed.; Times Books: New York, NY, USA, 1982. [Google Scholar]
  37. Mandelbrot Benoit, B. Fractals: Form, Chance and Dimension; W. H. Freeman: San Francisco, CA, USA, 1977. [Google Scholar]
  38. Yu, B.; Li, J. Some fractal characters of porous media. Fractals 2001, 9, 365–372. [Google Scholar] [CrossRef]
  39. Falconer, K.J. The Hausdorff dimension of self-affine fractals. Math. Proc. Camb. Philos. Soc. 2008, 103, 339–350. [Google Scholar] [CrossRef]
  40. Yu, B. Fractal dimensions for multiphase fractal media. Fractals 2006, 14, 111–118. [Google Scholar] [CrossRef]
  41. Crawford, J.; Matsui, N.; Young, I. The relation between the moisture-release curve and the structure of soil. Eur. J. Soil Sci. 1995, 46, 369–375. [Google Scholar] [CrossRef]
  42. Perrier, E.M.A.; Bird, N.R.A. Modelling soil fragmentation: The pore solid fractal approach. Soil Tillage Res. 2002, 64, 91–99. [Google Scholar] [CrossRef]
  43. Gmachowski, L. Transport properties of fractal aggregates calculated by permeability. Colloids Surf. A Physicochem. Eng. Asp. 2003, 215, 173–179. [Google Scholar] [CrossRef]
  44. Li, X.; Logan Bruce, E. Permeability of fractal aggregates. Water Res. 2001, 35, 3373–3380. [Google Scholar] [CrossRef]
  45. Bird, N.R.A.; Perrier, E.M.A. The pore–solid fractal model of soil density scaling. Eur. J. Soil Sci. 2003, 54, 467–476. [Google Scholar] [CrossRef]
  46. Yu, B. Fractal Porous Media Transport Physics; Science Press: Beijing, China, 2014; pp. 21–25. [Google Scholar]
  47. API RP 10B. Recommended Method for Testing Well Cement, version 2; American Petroleum Institute: Washington, DC, USA, 1997. [Google Scholar]
  48. GB/T 19139-2012. Oil Well Cement Test Method; Standards Press of China: Beijing, China, 2012. [Google Scholar]
  49. Maxson, J.; Bour, D.; Iverson, B. Strength Retrogression in Cements under High-Temperature Conditions. In Proceedings of the Thirty-Fifth Workshop on Geothermal Reservoir Engineering, Stanford, CA, USA, 1–3 February 2010. [Google Scholar]
  50. Swayze, M.A. Effects of High Pressures and Temperatures on Strength of Oil-Well Cements. In API Spring Meeting of the Mid-Continent District; Division of Production: Oklahoma City, OK, USA, 1954. [Google Scholar]
  51. Meyer, C.; Pang, X.; Darbe, R.; Darbe, R.; Funkhouser, G.P. Modeling the Effect of Curing Temperature and Pressure on Cement Hydration Kinetics. ACI Mater. J. 2013, 110, 137–148. [Google Scholar]
  52. Wilkinson, A.P.; Jupe, A.C.; Luke, K.; Funkhouser, G.P. Class H Cement Hydration at 180 °C and High Pressure in the Presence of Added Silica. Cem. Concr. Res. 2008, 38, 660–666. [Google Scholar]
  53. Yu, Y.; Liu, H.; Liu, H.; Jin, J.; Liu, S. Hybrid Effects of Nano-Silica and Graphene Oxide on Mechanical Properties and Hydration Products of Oil Well Cement. Constr. Build. Mater. 2018, 191, 311–319. [Google Scholar]
Figure 1. Basic constitution of fractal model. (A) The initial side length of the model in spatial dimension dE is L0, which is equally divided into N; (B) the first iteration is divided into two subregions, namely, Nz (light gray) and N (1 − z) (dark gray); (C) in the second iteration, the last iteration is repeated in the subregion Nz (dE = 2, b = 3, z = 2/9, D = ln2/ln3 = 0.631, Nz = 2).
Energies 14 07552 g001
Figure 2. Pore mass fractal model. The black part is solid, and the white part is pore (dE = 2, b = 3, z = 8/9, m = 1, D = 1.893).
Energies 14 07552 g002
Figure 3. Solid mass fractal model. The black part is solid, and the white part is pore (dE = 2, b = 3, z = 8/9, m = 1, D = 1.893).
Energies 14 07552 g003
Figure 4. Pore solid fractal model. The black part is solid, the white part is pore and the gray part is the iterative area.
Energies 14 07552 g004
Figure 5. Compressive strength of 35% added sand.
Energies 14 07552 g005
Figure 6. Compressive strength of 45% added sand.
Energies 14 07552 g006
Figure 7. Phase analysis.
Energies 14 07552 g007
Figure 8. Microscopic morphology analysis.
Energies 14 07552 g008
Table 1. Material particle size distribution.
GranularityWell Cement (μm)Fine Sand (μm)Coarse Sand (μm)
D(0.1)0.4540.53821.838
D(0.5)2.8252.39097.209
D(0.9)19.19619.678174.992
D[4, 3]26.48434.139132.205
D[4, 3] is the average volume diameter.
Table 2. Three component mass fractions by different fractal dimensions (sand amount 35%).
/D
2.522.552.582.612.642.67
Formula1234567
Slurry100100100100100100100
Fine Sand005.610.615.620.625.6
Coarse Sand03529.424.419.414.49.4
Table 3. Three component mass fractions by different fractal dimensions (sand amount 45%).
/D
2.522.552.582.612.642.67
Formula1234567
Slurry100100100100100100100
Fine Sand005.710.715.720.726.7
Coarse Sand04539.334.329.324.318.3
Table 4. Rate of change in molecular weight of fluid loss agent.
Fluid Loss AgentIntrinsic ViscosityRate of Molecular Weight Change (%)
Before Heat TreatmentAfter Heat Treatment
A2.1241.77625.79
B6.2762.82473.58
C5.3812.97862.70
Table 5. Rate of change in molecular weight of retarder.
RetarderIntrinsic ViscosityRate of Molecular Weight Change (%)
Before Heat TreatmentAfter Heat Treatment
A0.2800.21436.14
B1.3481.18619.20
C0.7650.59633.97
Table 6. Performance evaluation of high temperature cement slurry system.
FormulaDensity/
(g/cm3)
Temperature/
°C
Fluidity/
cm
Stability/
(g/cm3)
Fluid Loss
/mL
Initial Consistency/BcThickening Time/minTransient Time/minSPNCompressive Strength (74 h)/MPa
11.9140210.012012472141.0216
22.0140200.011626330181.6317.3
2.0160210.01292031220.3215
2.0180200.01472451220.5723
32.1170200.01352131771.2715.8
2.1180200.01351849520.4321
42.2190200.02372545710.3225
52.3200200.02422947110.1525
Publisher’s Note: MDPI stays neutral with regard to jurisdictional claims in published maps and institutional affiliations.

