
Two Current-Based Methods for the Detection of Bearing and Impeller Faults in Variable Speed Pumps


Abstract
1. Introduction
2. Methodology
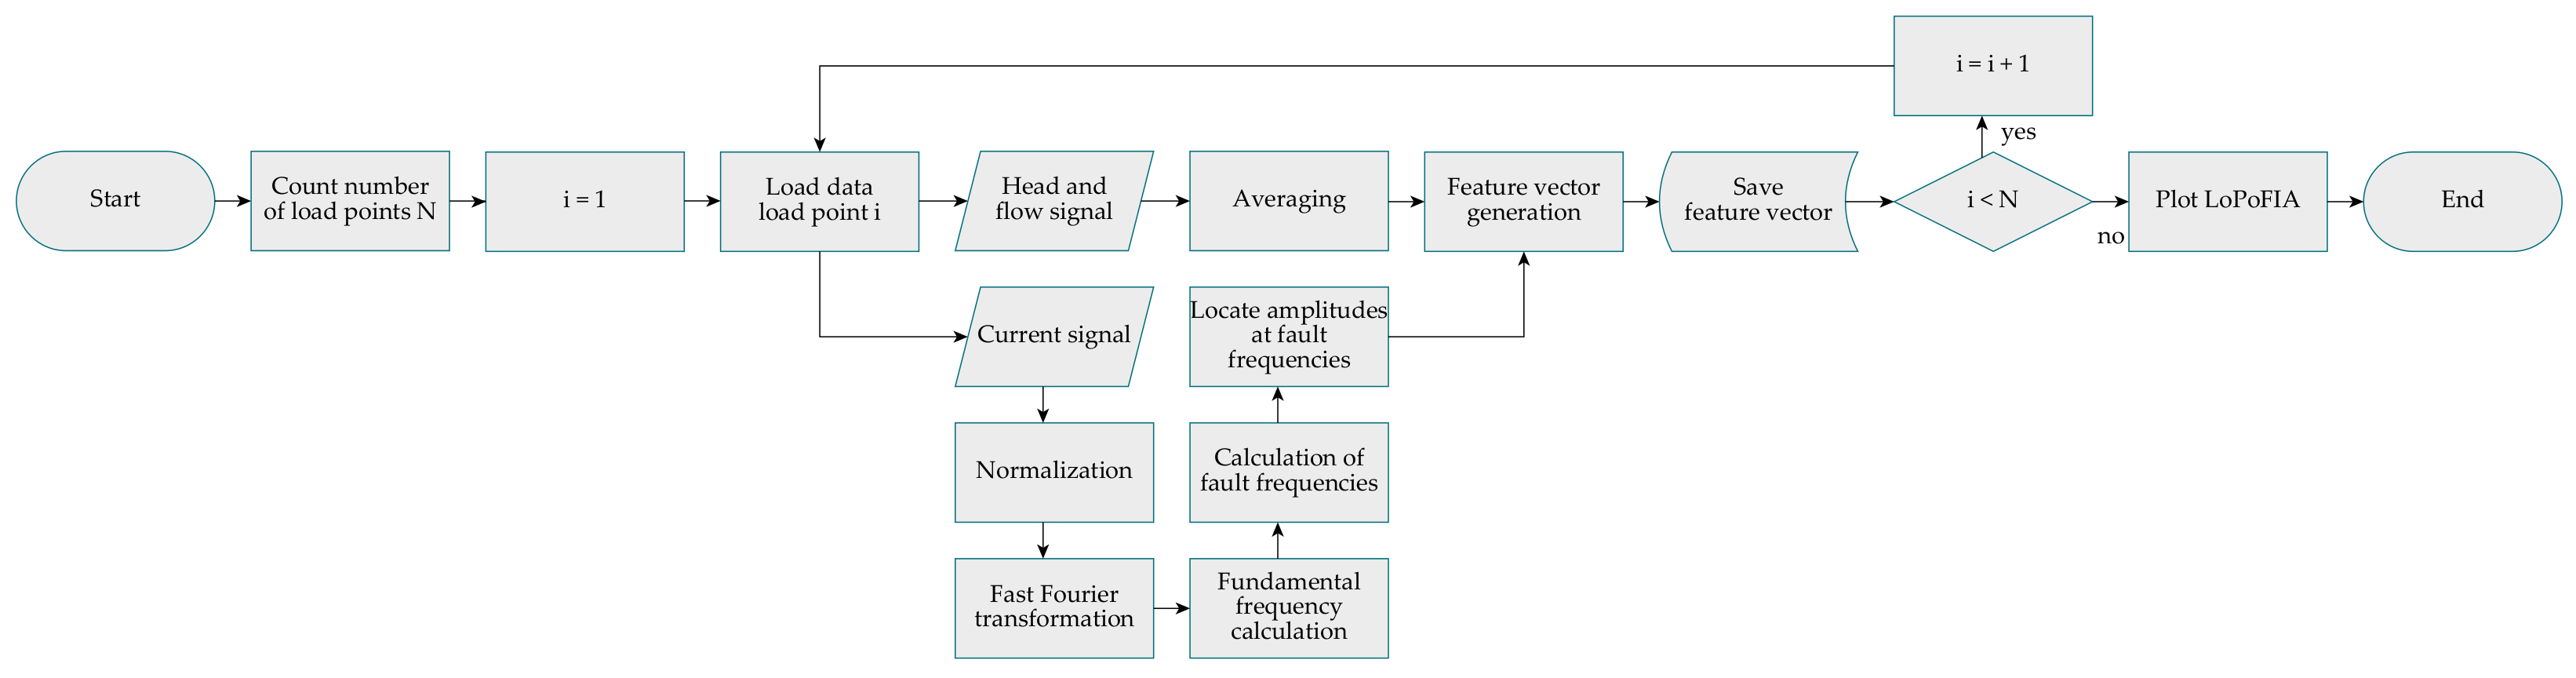
2.1. Implementation of the Methods
2.2. Material
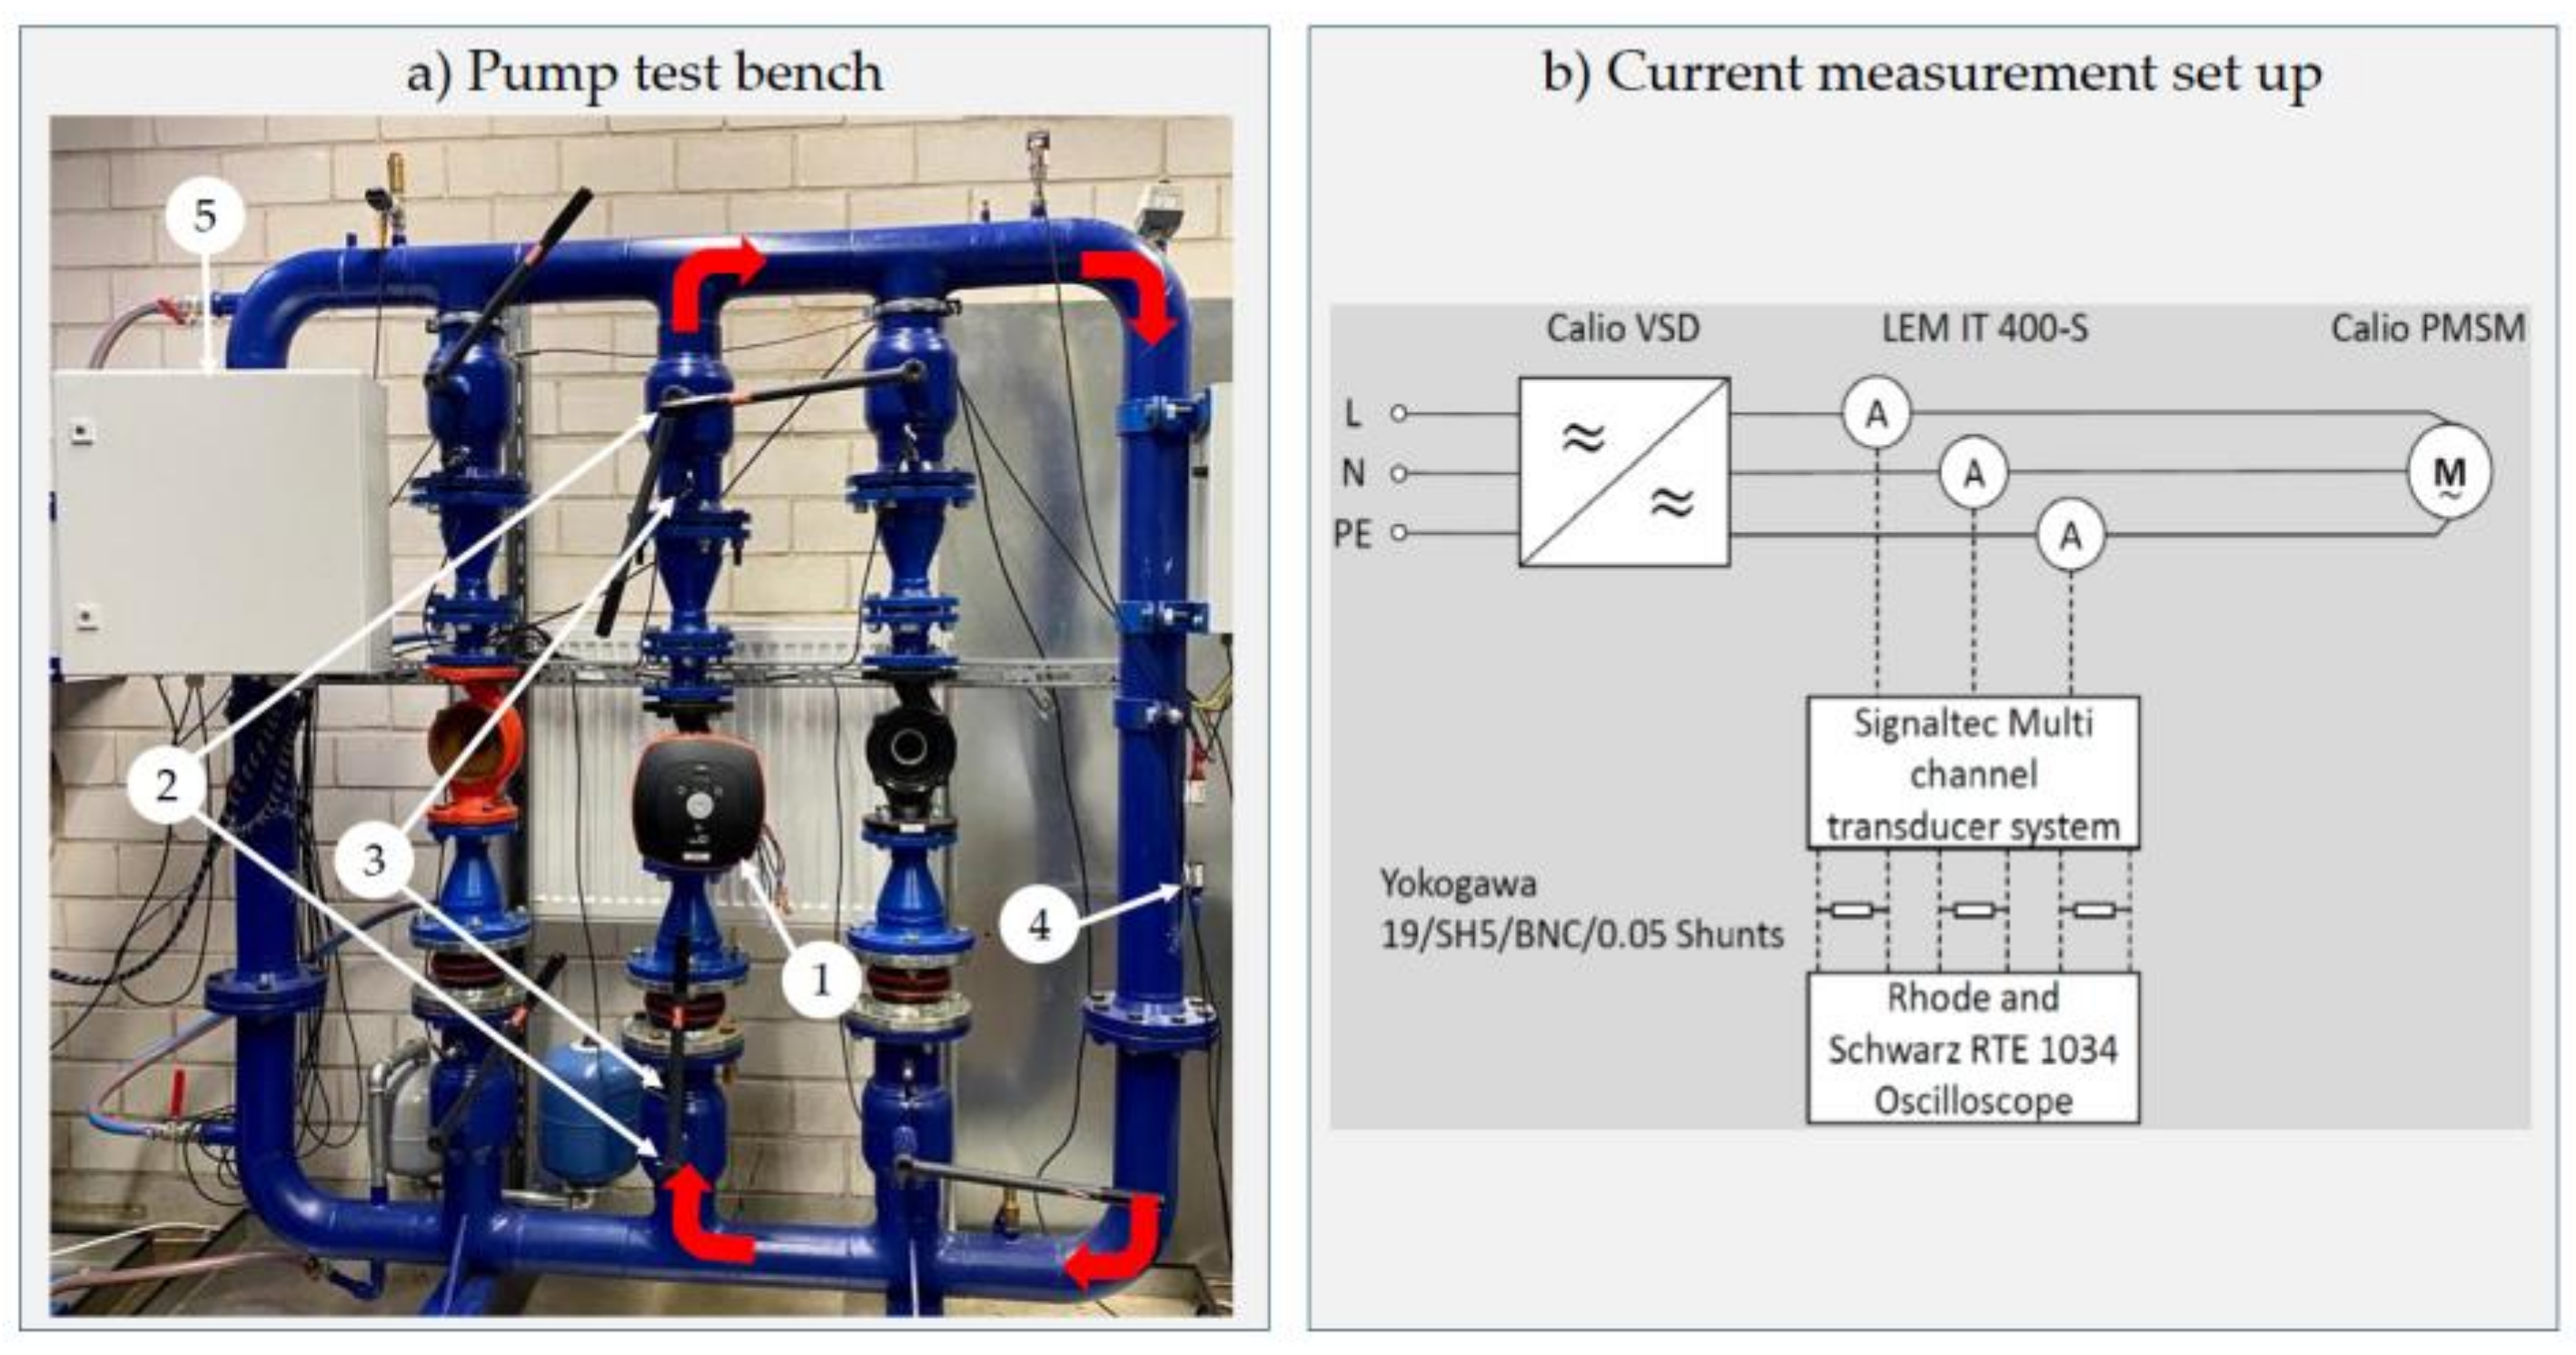
2.2.1. The Pump Test Bench
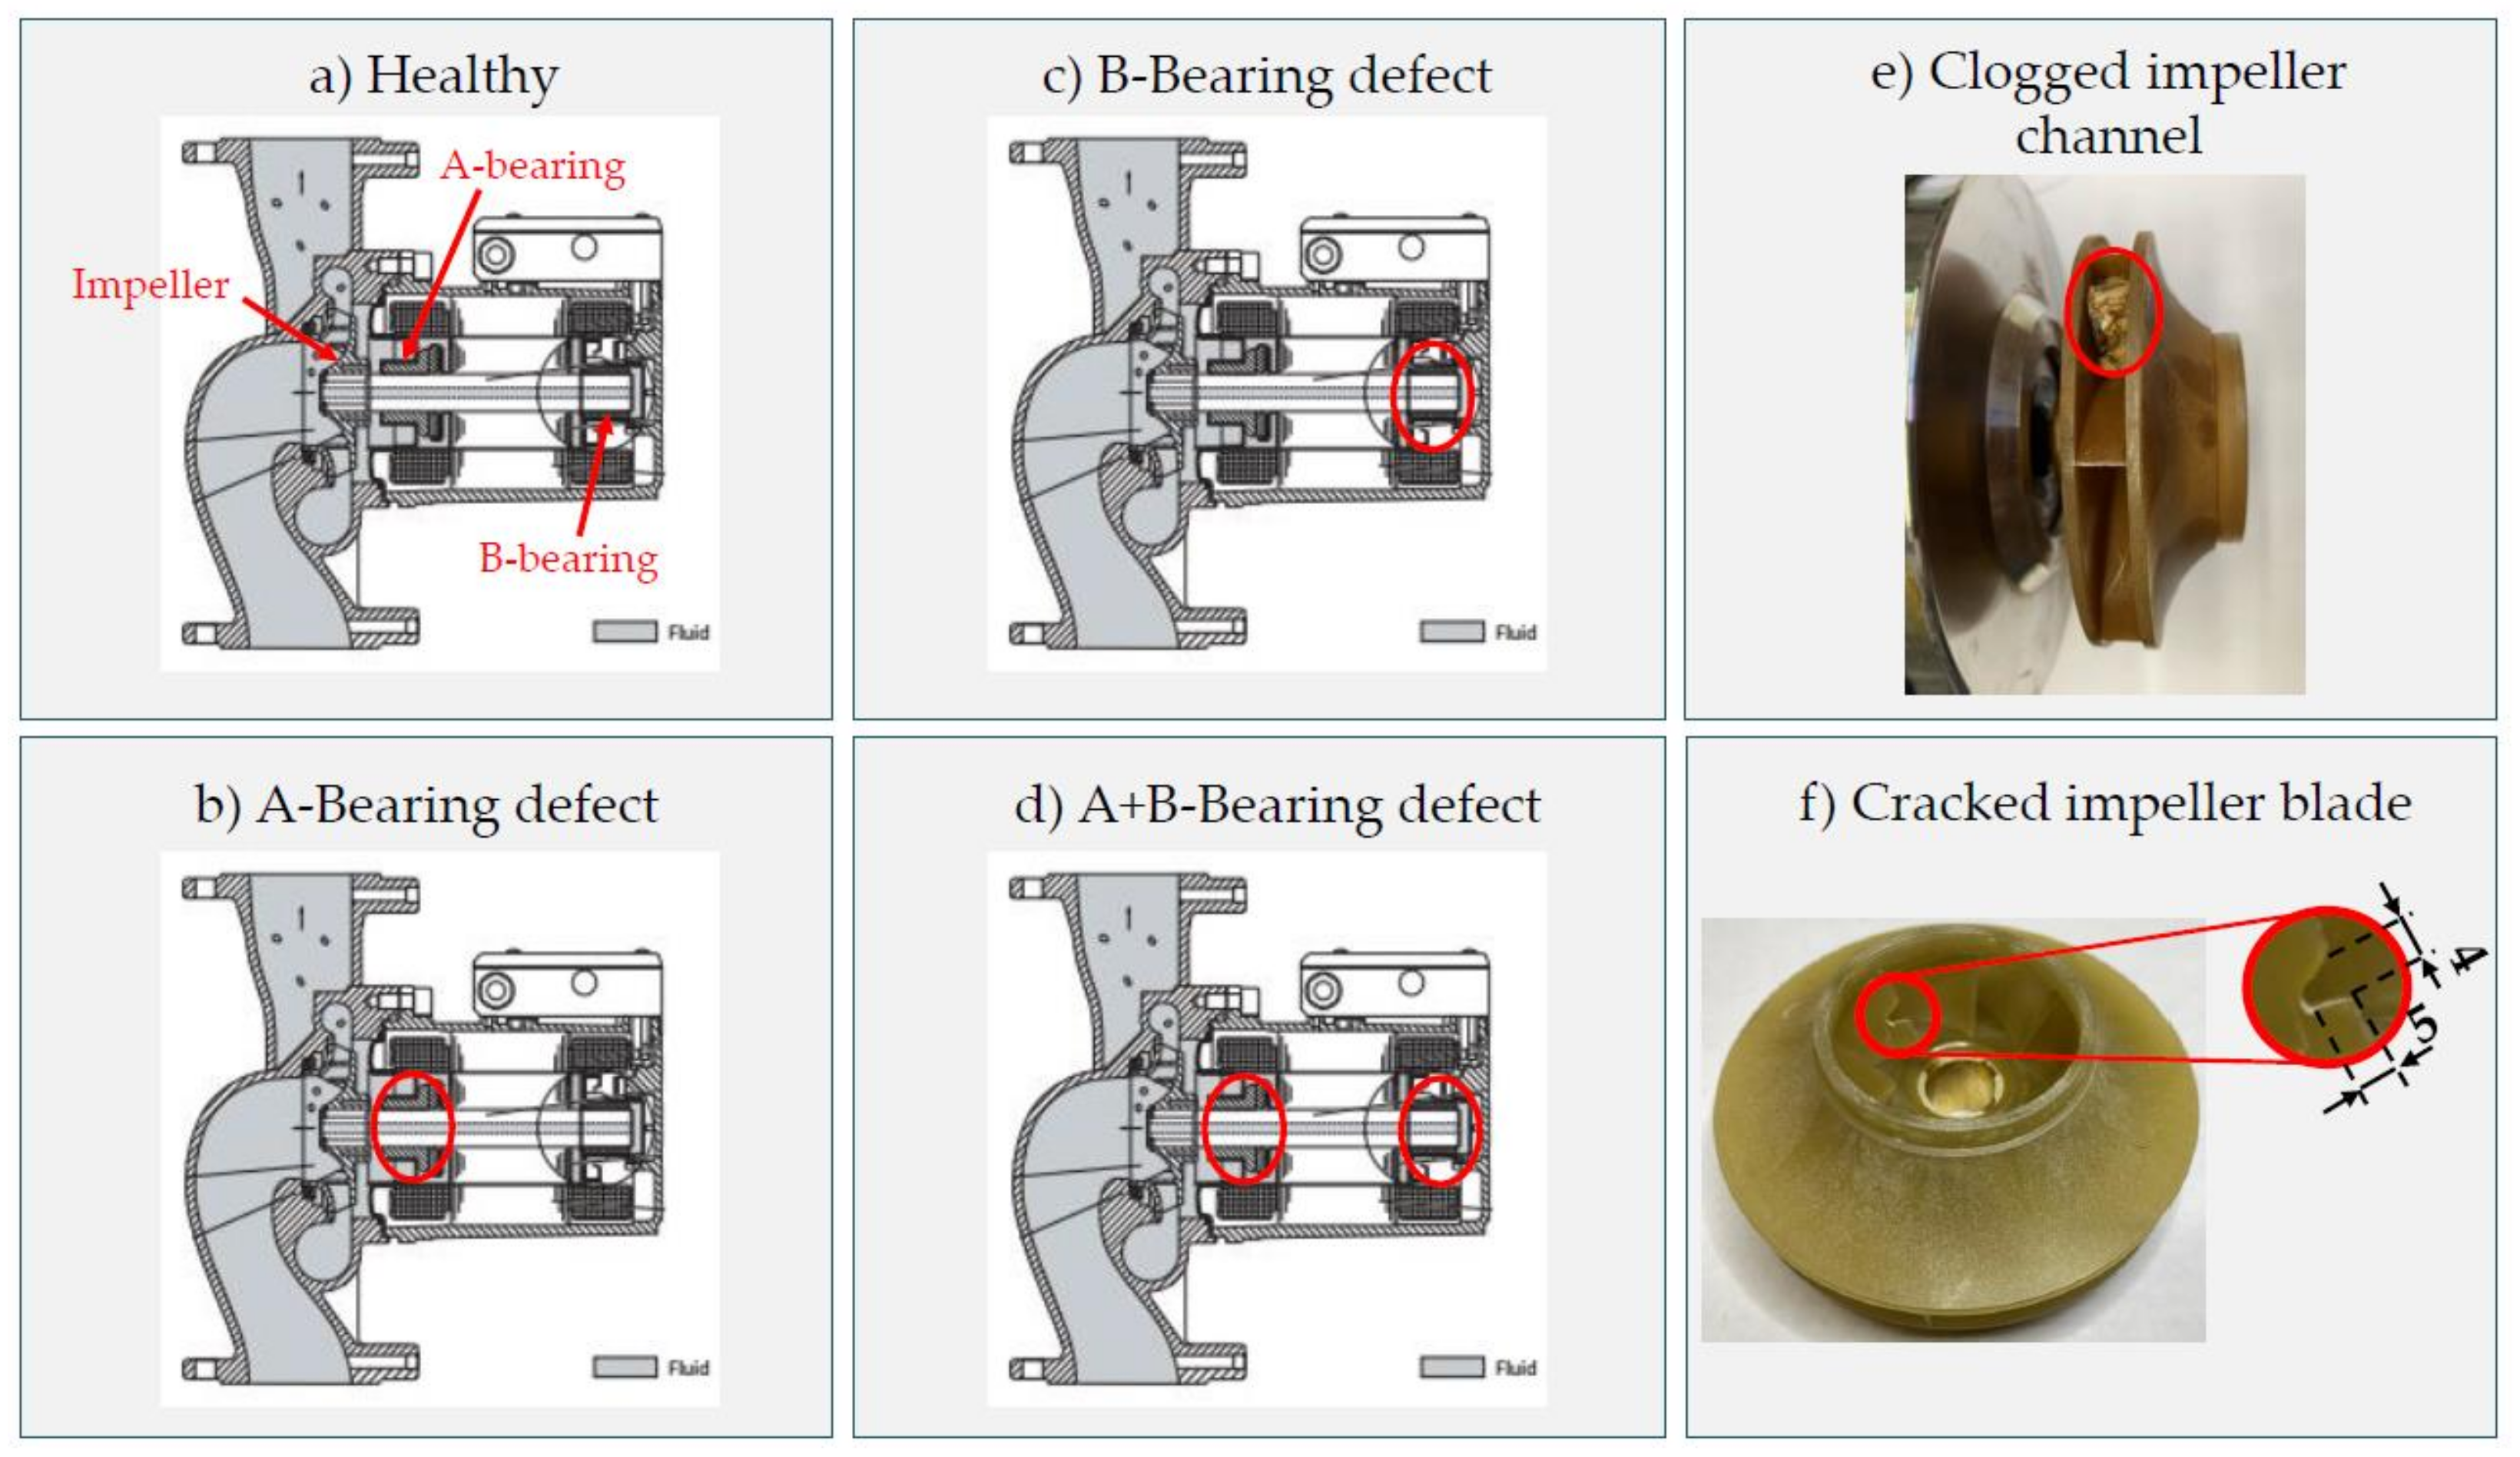
2.2.2. Investigated Faults
2.2.3. Experiment Execution
3. Results
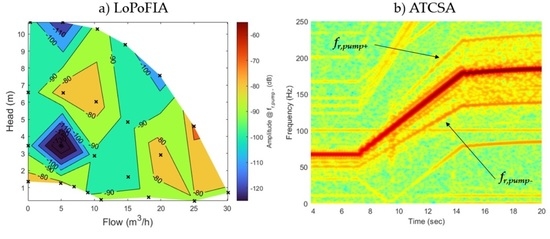
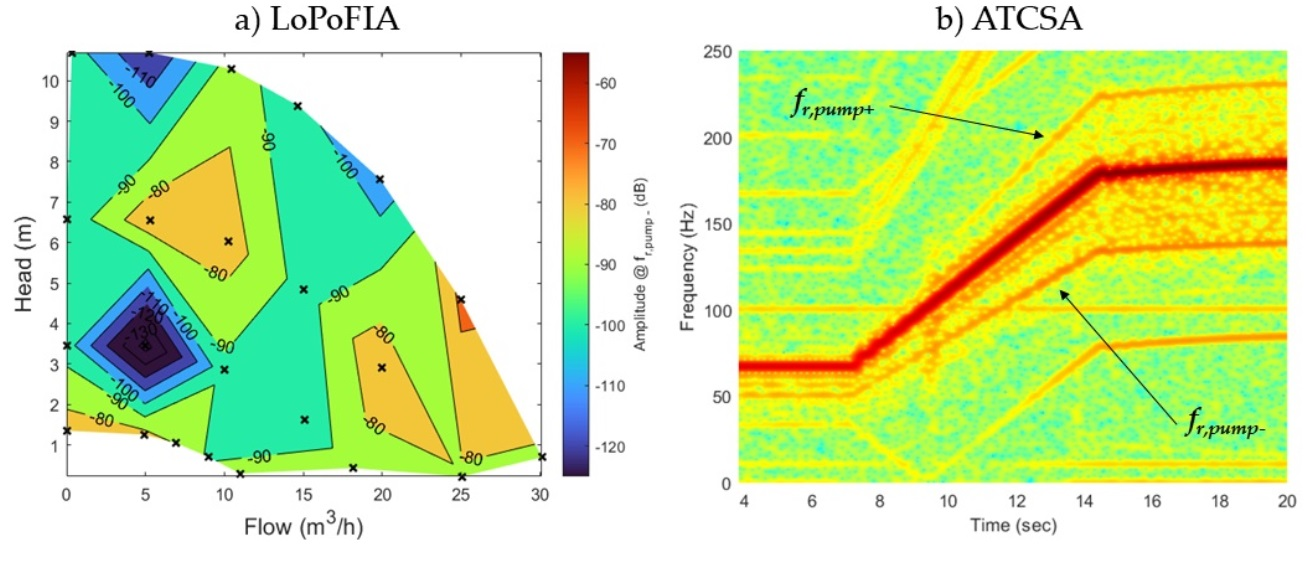
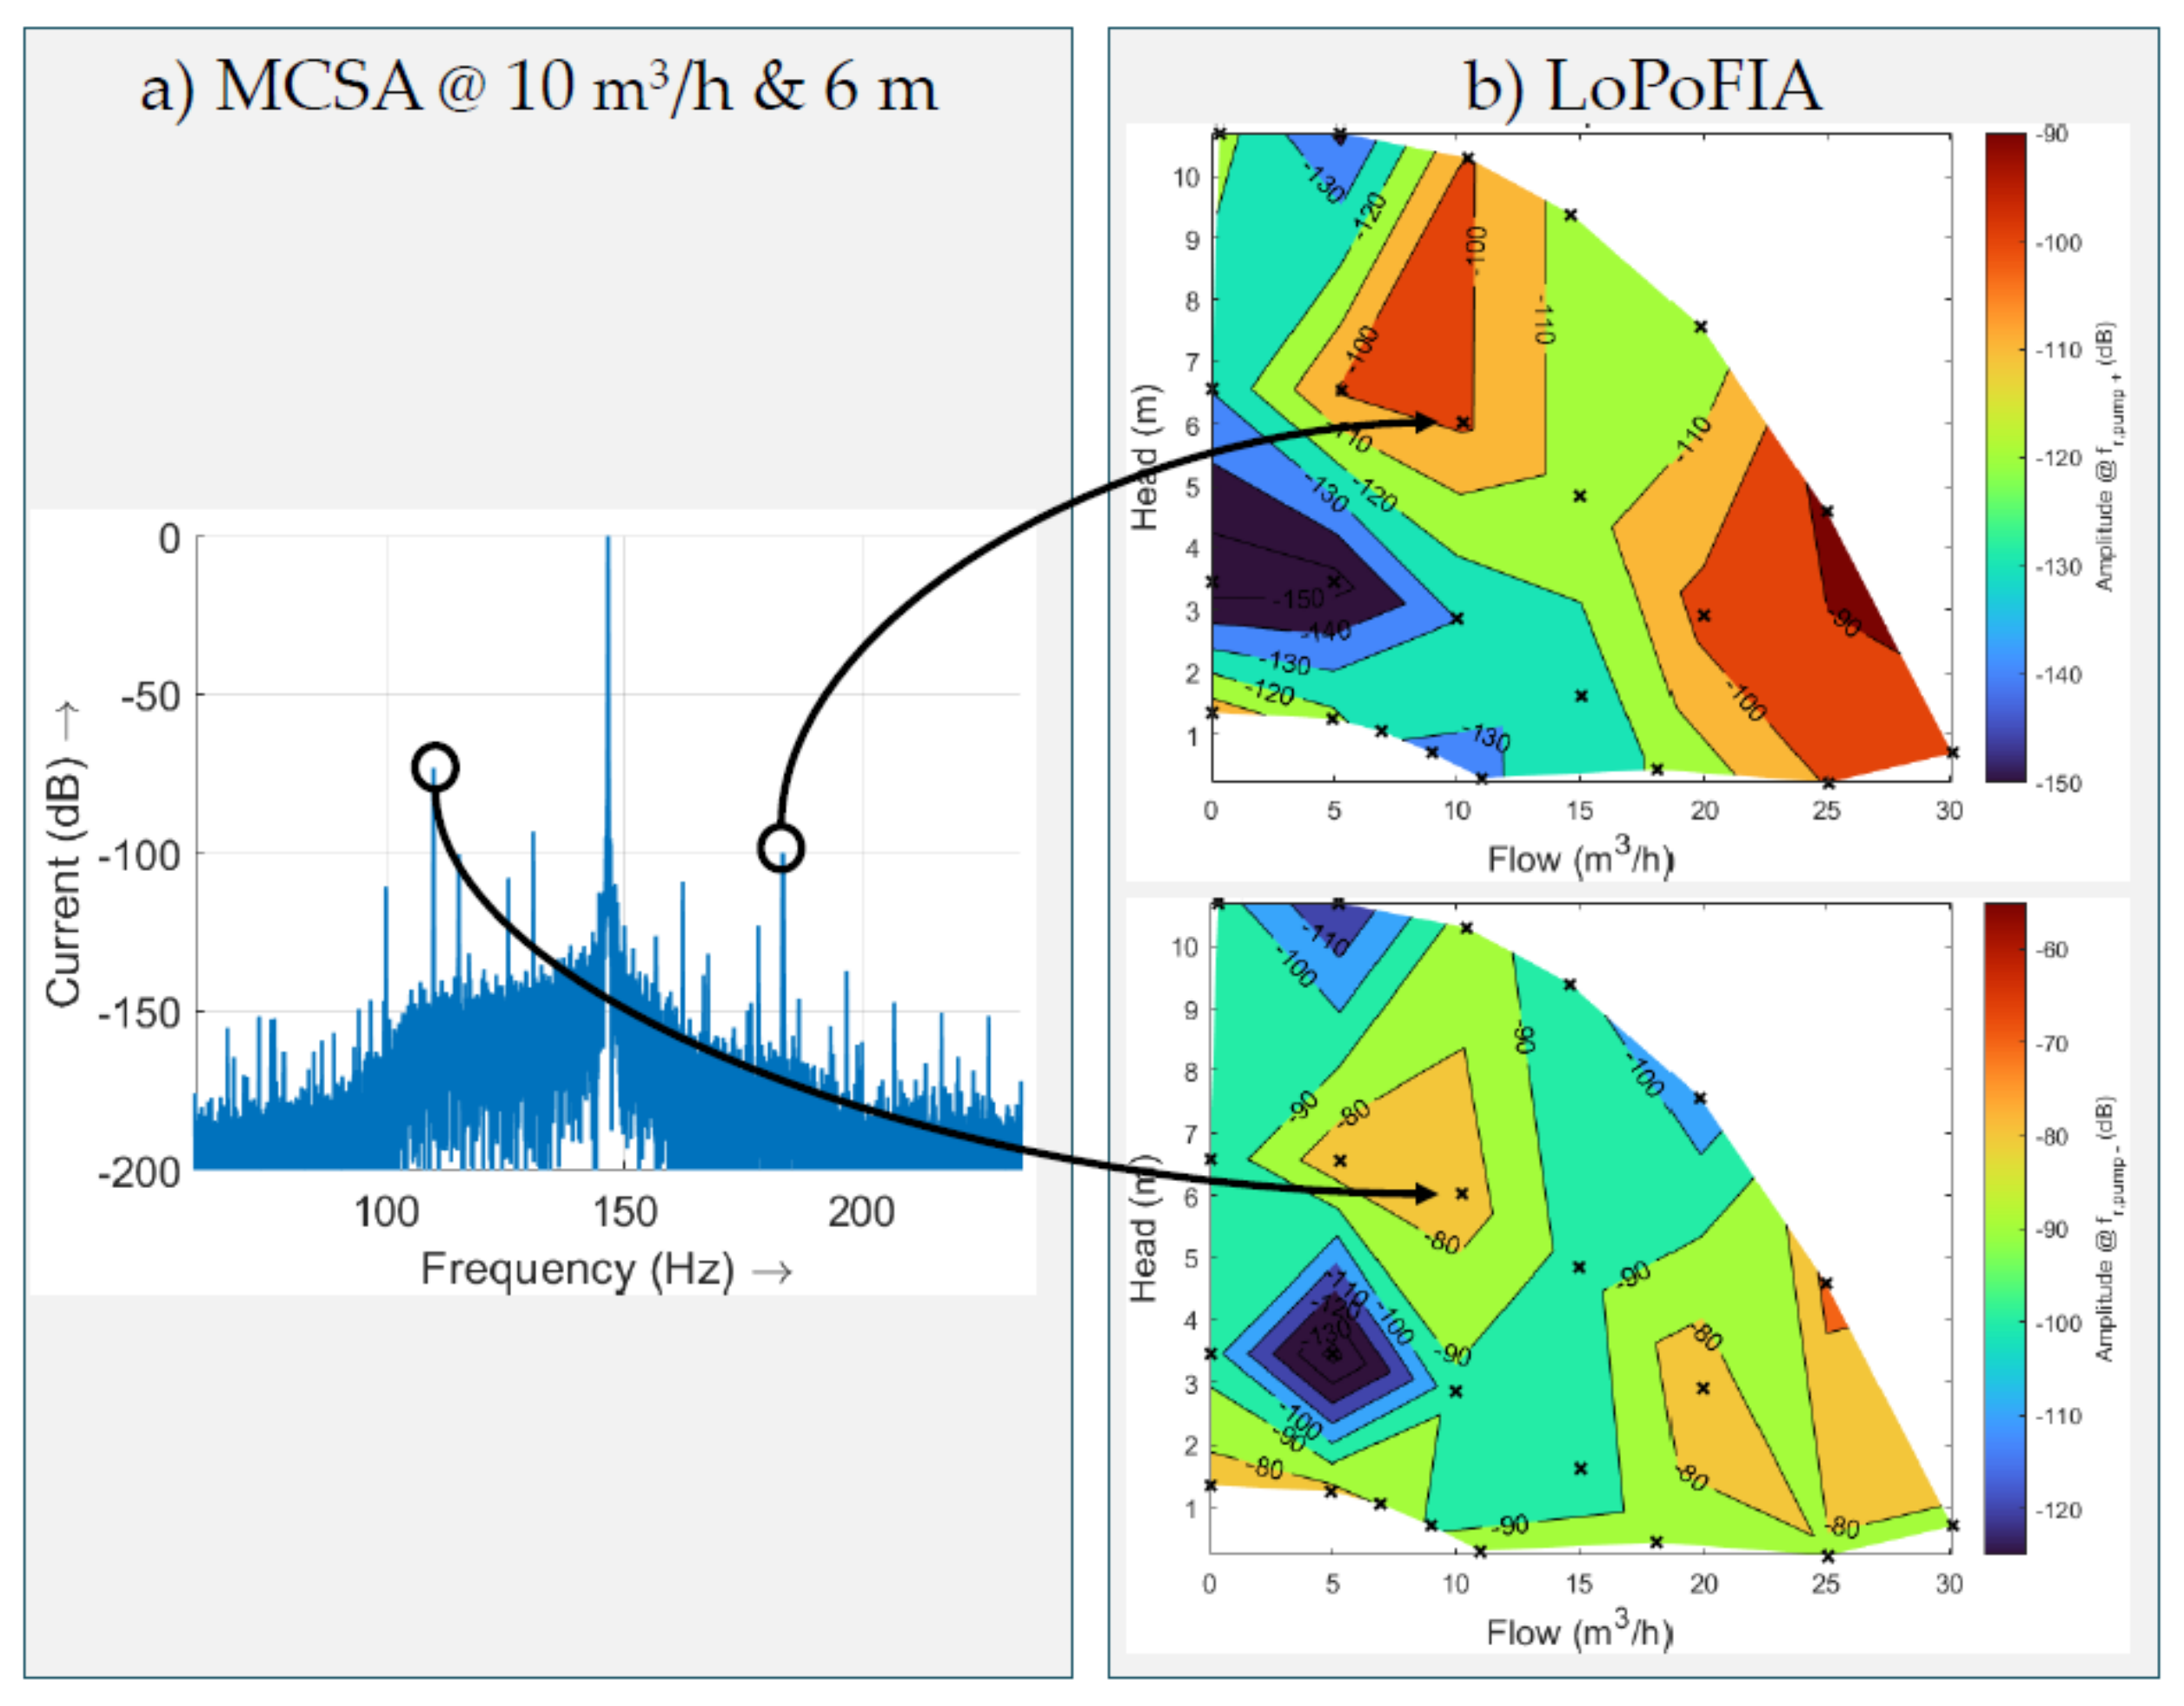
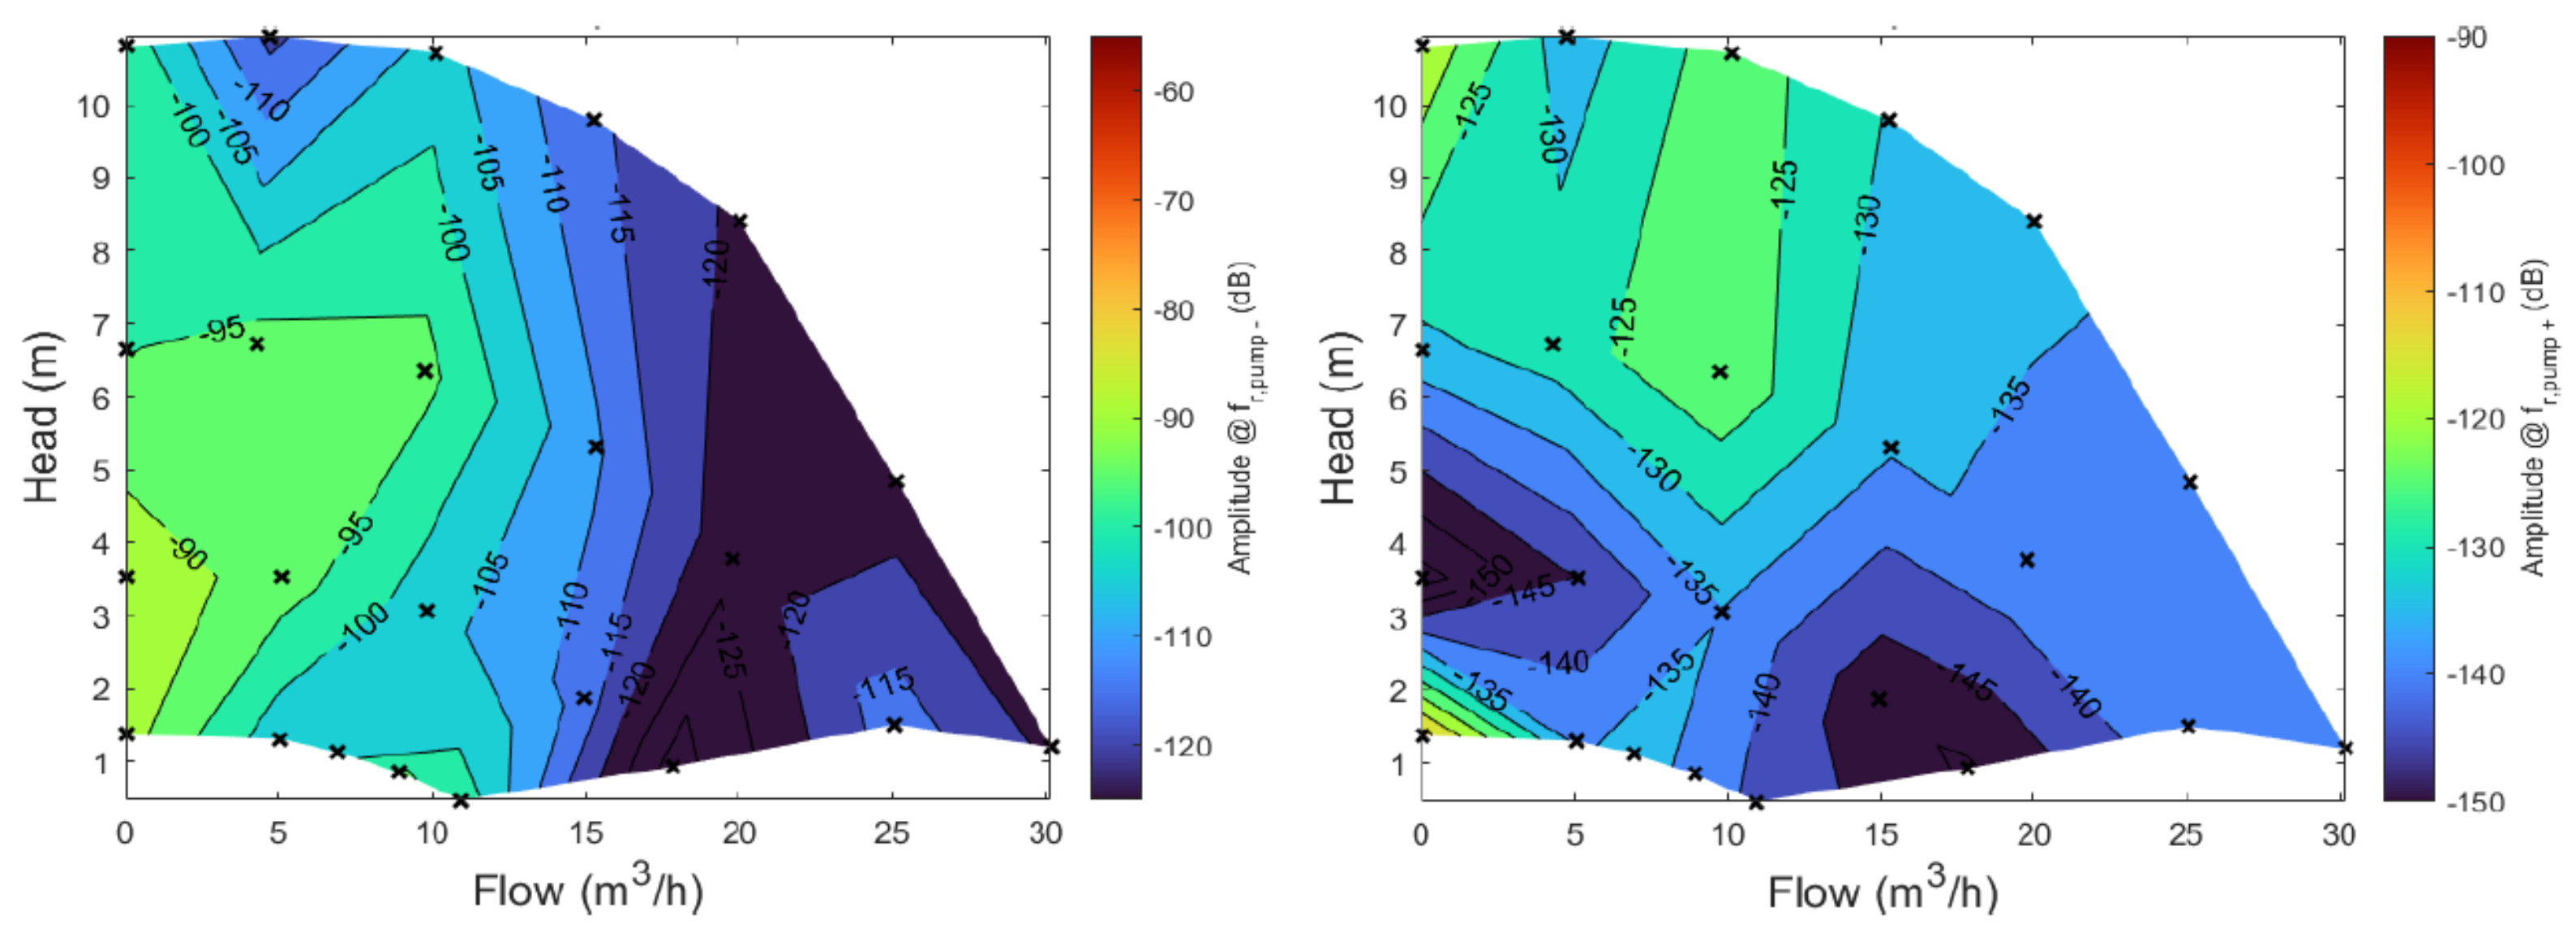
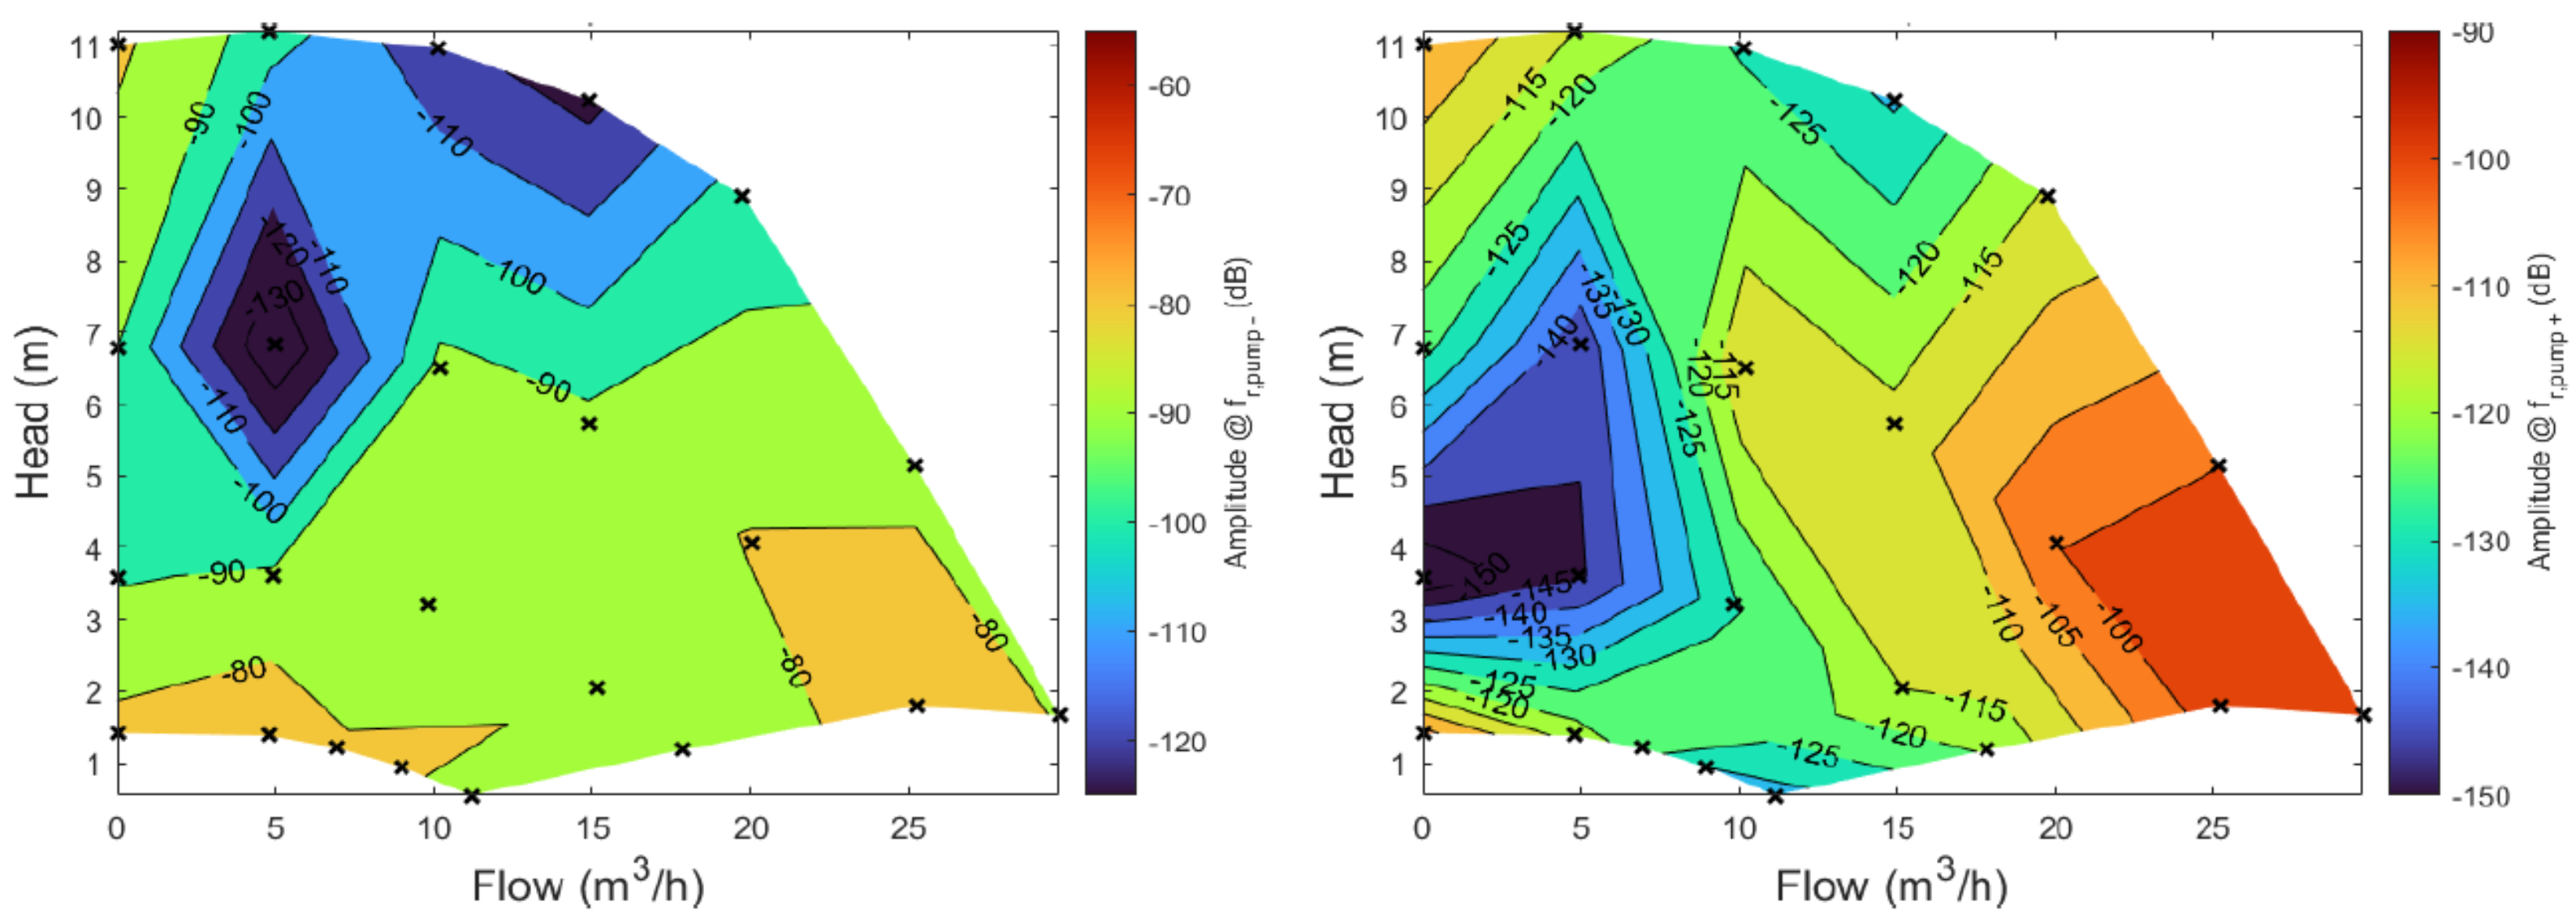
3.1. LoPoFIA
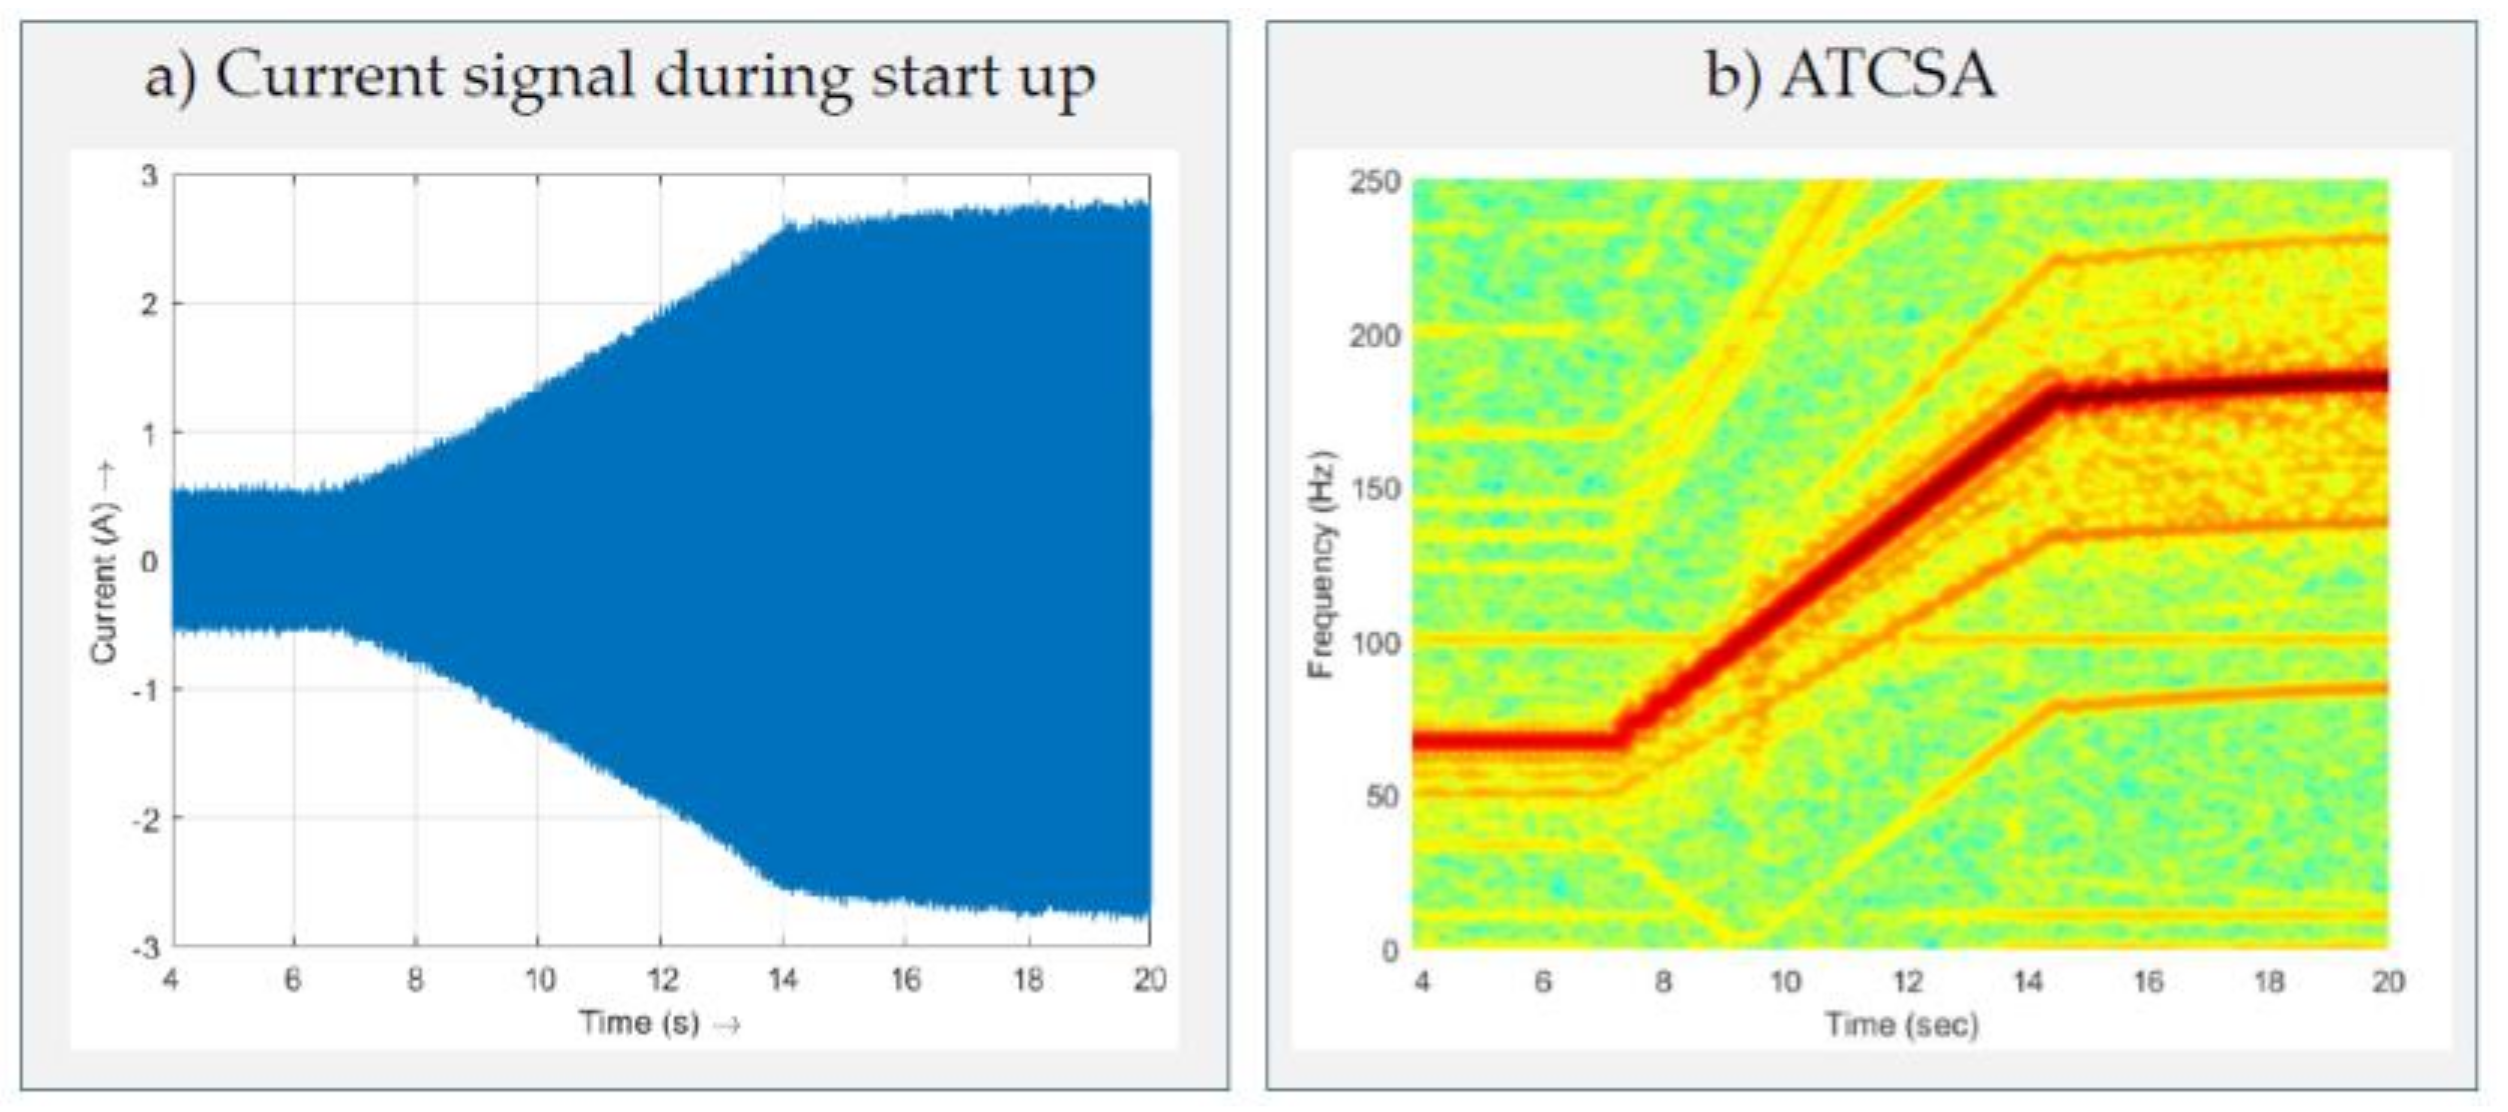
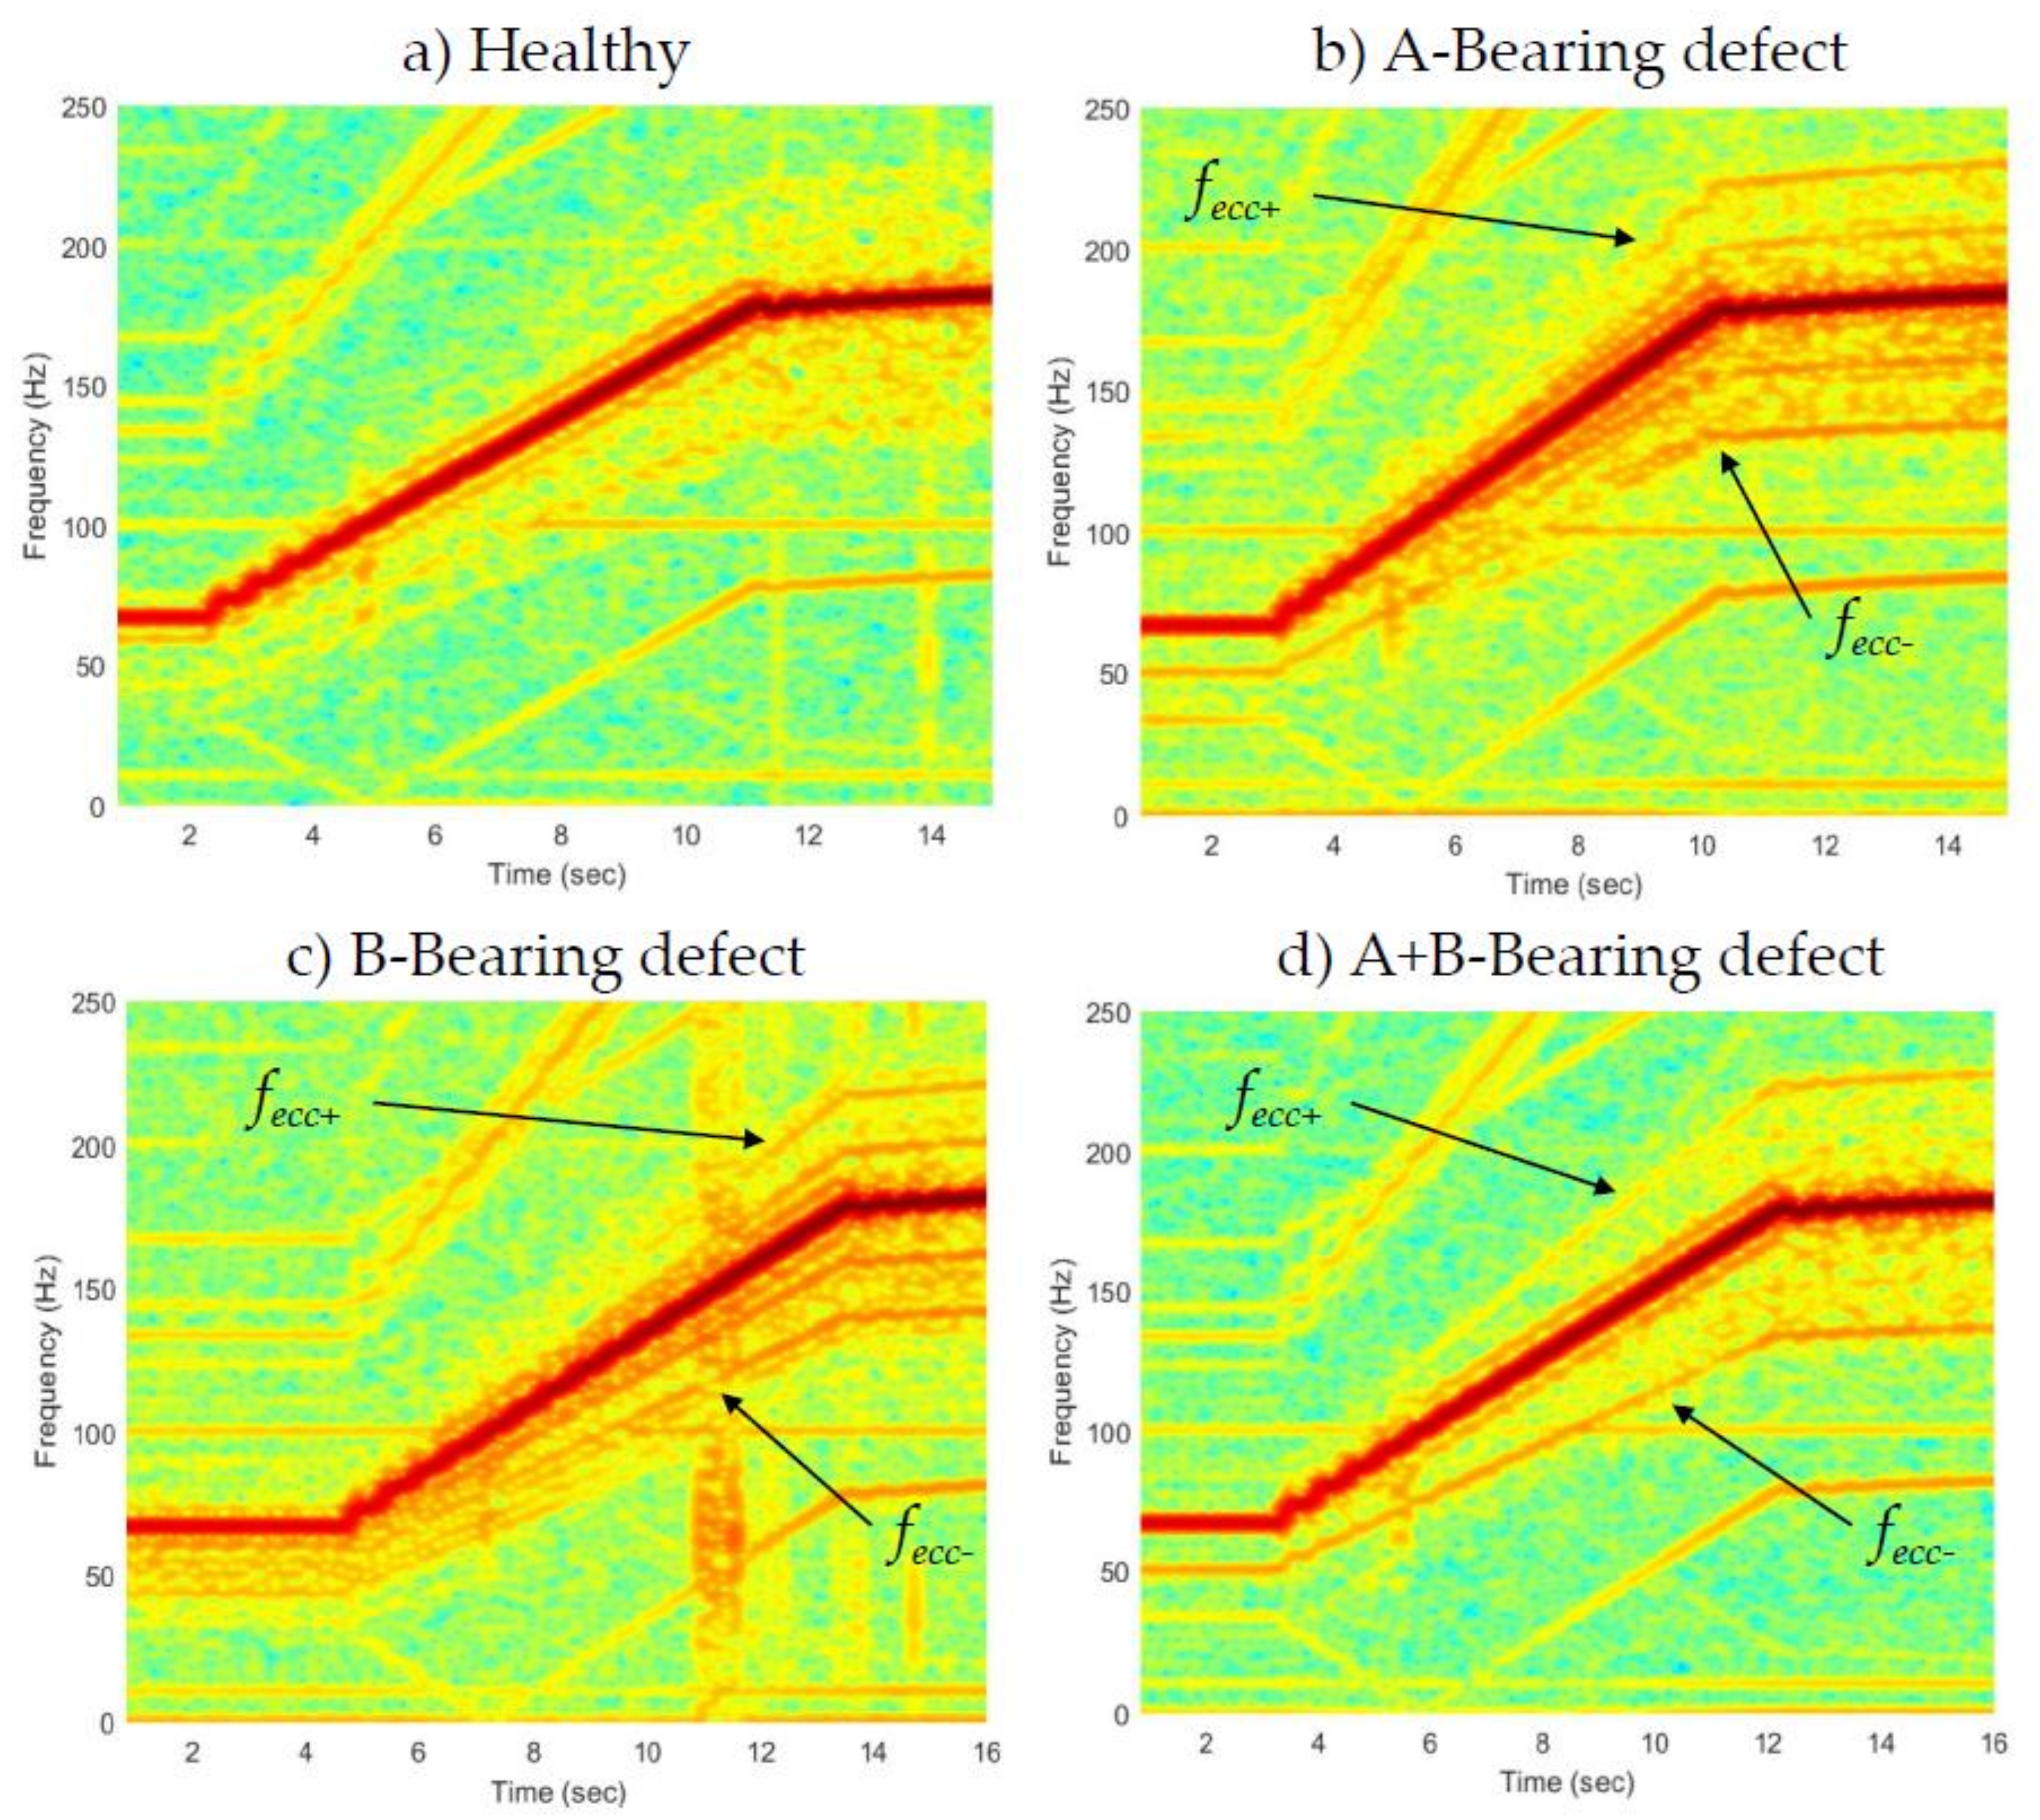
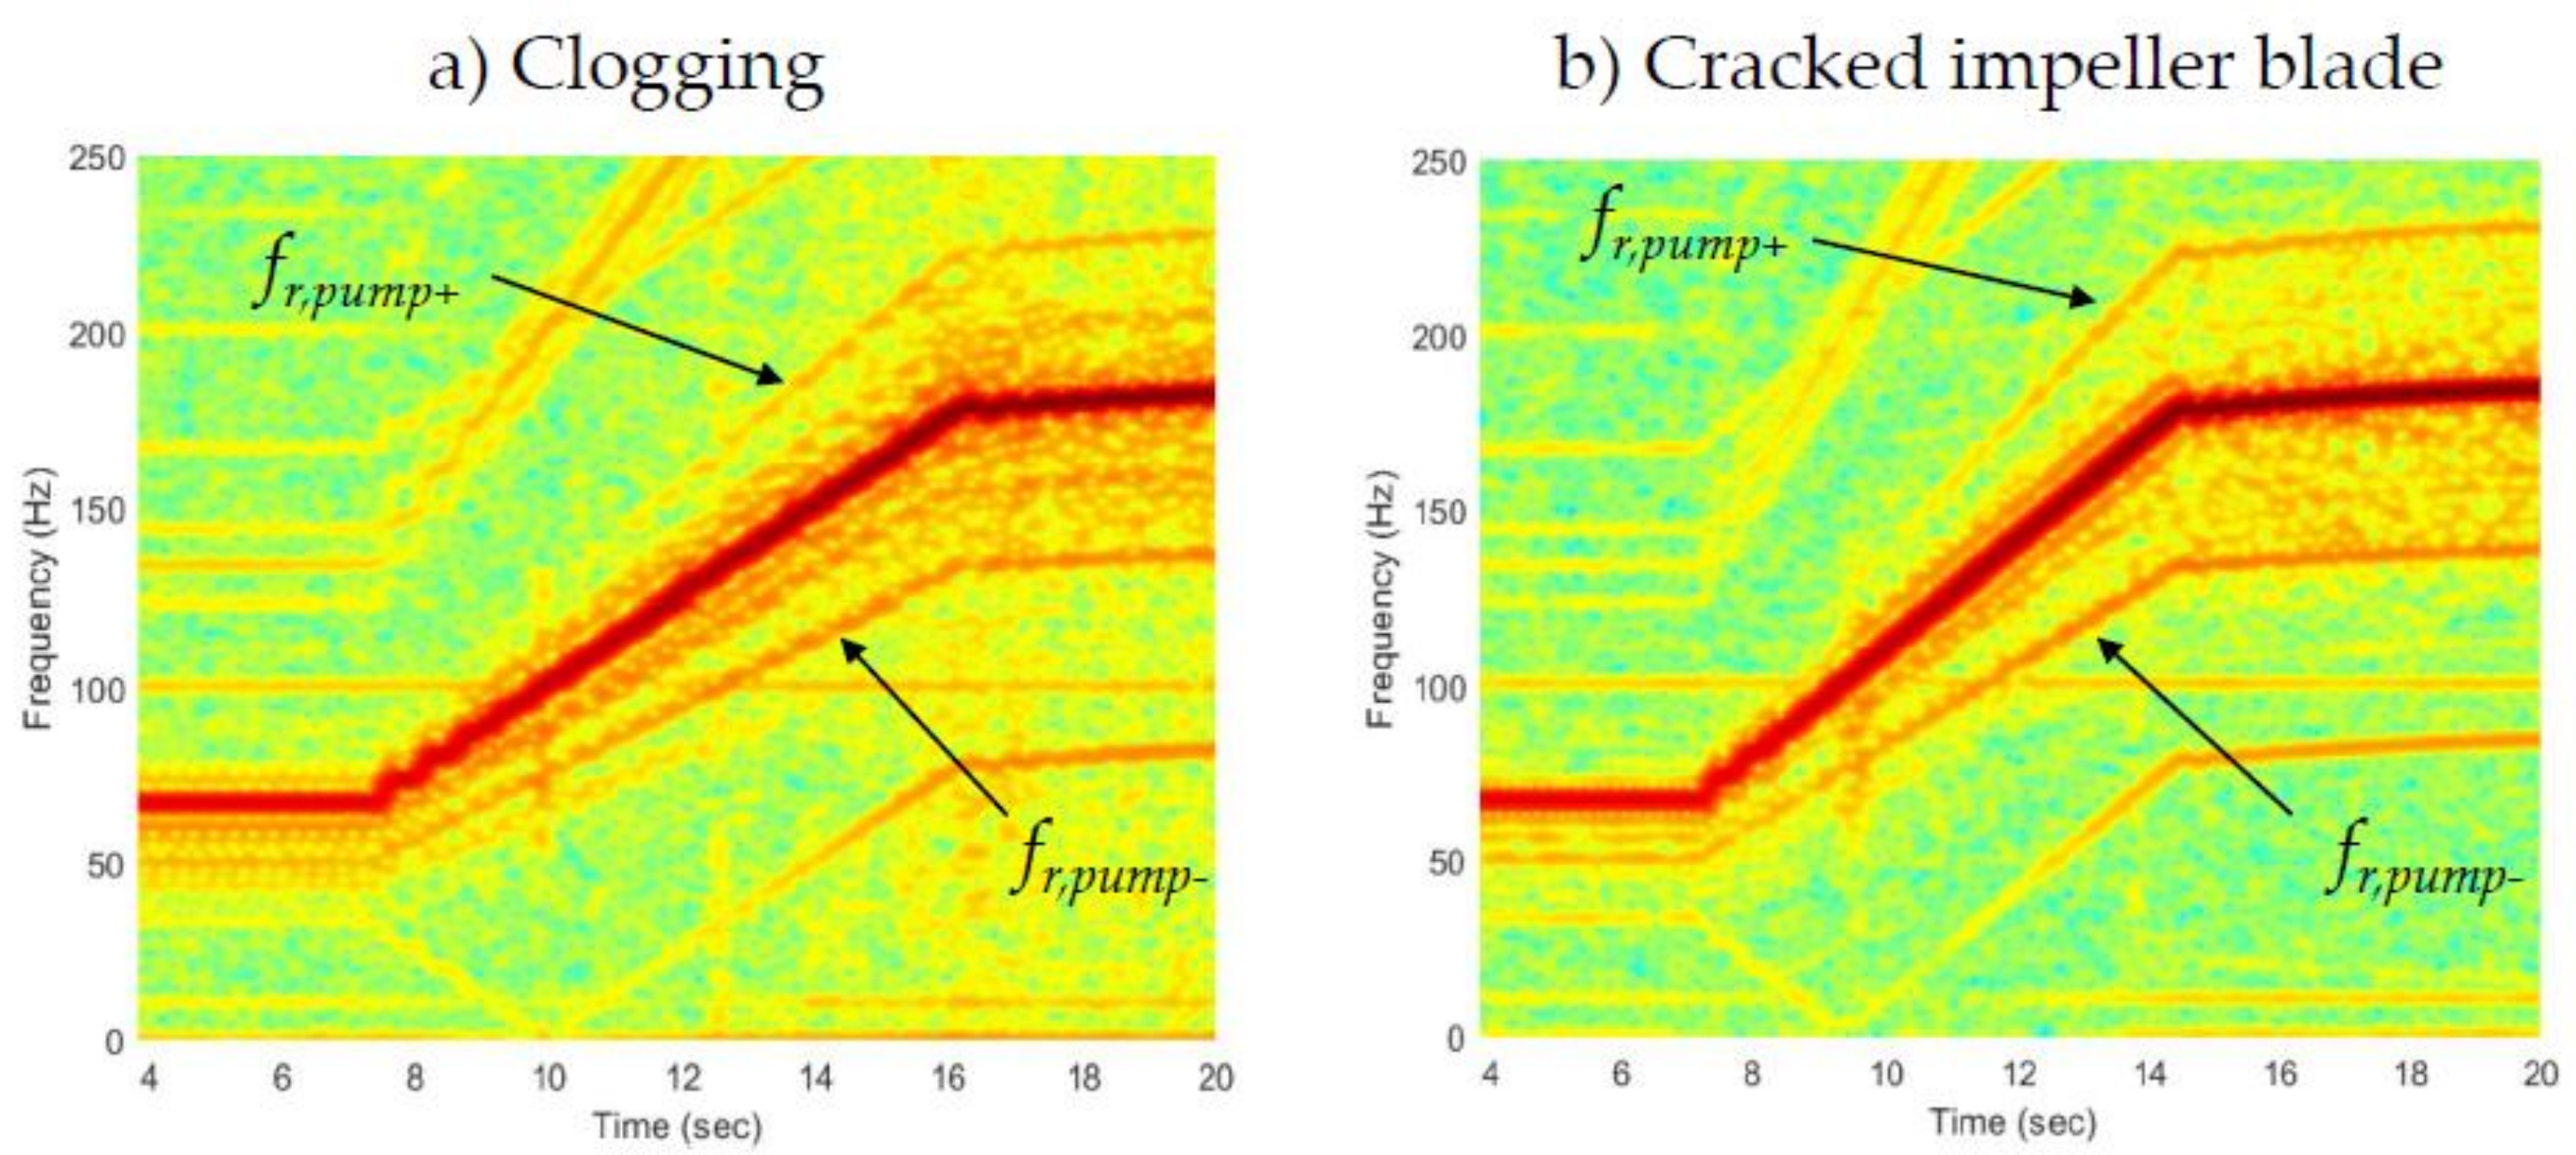
3.2. ATCSA
4. Conclusions
Author Contributions
Funding
Institutional Review Board Statement
Informed Consent Statement
Conflicts of Interest
Abbreviations
| The following abbreviations are used in this manuscript: | |
| ATCSA | Advanced transient current signature analysis |
| IM | Induction motor |
| LoPoFIA | Load point-dependent fault indicator analysis |
| MCSA | Motor current signature analysis |
| PMSM | Permanent magnet synchronous motor |
| PVA | Park’s vector approach |
| VSD | Variable speed drive |
References
- Businesswire.com. Available online: https://www.businesswire.com/news/home/20210415005587/en/Global-Frequency-Converter-Market-2021-to-2026---Increasing-Demand-for-Water-Wastewater-Treatment-Plants-is-Driving-Growth---ResearchAndMarkets.com (accessed on 30 May 2021).
- De Almeida, T.A.; Fonsecaa, P.; Falkner, H.; Bertoldi, P. Market transformation of energy-efficient motor technologies in the EU. Energy Policy 2003, 31, 563–575. [Google Scholar] [CrossRef][Green Version]
- Becker, V.; Bold, S.; Urschel, S. Comparison of fixed and variable speed pumps under consideration of manufacturer and operator aspects. In Proceedings of the International Conference EEMODS’19 Energy Efficiency in Motor Driven Systems, Tokyo, Japan, 17–19 September 2019. [Google Scholar]
- Fernandez-Cavero, V.; García-Escudero, L.A.; Pons-Llinares, J.; Fernández-Temprano, M.A.; Duque-Perez, O.; Morinigo-Sotelo, D. Diagnosis of Broken Rotor Bars during the Startup of Inverter-Fed Induction Motors Using the Dragon Transform and Functional ANOVA. Appl. Sci. 2021, 11, 3769. [Google Scholar] [CrossRef]
- Asad, B.; Vaimann, T.; Kallaste, A.; Belahcen, A.; Rassõlkin, A.; Iqbal, M.N. Broken rotor bar fault detection of the grid and inverter fed induction motor by effective attenuation of the fundamental component. IET Electr. Power Appl. 2019, 13, 2005–2014. [Google Scholar] [CrossRef]
- Cruz, S.M.A.; Toliyat, H.A.; Cardoso, A.J.M. DSP implementation of the multiple reference frames theory for the diagnosis of stator faults in a DTC induction motor drive. In Proceedings of the 4th IEEE International Symposium on Diagnostics for Electric Machines, Power Electronics and Drives, Atlanta, GA, USA, 24–26 August 2003; pp. 223–228. [Google Scholar] [CrossRef]
- Cruz, S.M.A.; Cardoso, A.J.M. Multiple reference frames theory: A new method for the diagnosis of stator faults in three-phase induction motors. IEEE Trans. Energy Convers. 2005, 20, 611–619. [Google Scholar] [CrossRef]
- Leonow, S.; Mönnigmann, M. Soft sensor based dynamic flow rate estimation in low speed radial pumps. In Proceedings of the 2013 European Control Conference (ECC), Zurich, Switzerland, 17–19 July 2013; pp. 778–783. [Google Scholar] [CrossRef]
- Thomson, W.T.; Gilmore, R.J. Motor current signature analysis to detect faults in induction motor drive—fundamentals, data interpretation, and industrial case histories. In Proceedings of the Thirty-Second Turbomachinery Symposium; Texas A&M University. Turbomachinery Laboratories: College Station, TX, USA, 2003. [Google Scholar]
- Abitha, M.W.; Rajini, V. Park’s vector approach for online fault diagnosis of induction motor. In Proceedings of the 2013 International Conference on Information Communication and Embedded Systems (ICICES), Chennai, India, 21–22 February 2013; pp. 1123–1129. [Google Scholar] [CrossRef]
- Kostic-Perovic, D.; Arkan, M.; Unsworth, P. Induction motor fault detection by space vector angular fluctuation. Conference Record of the 2000 IEEE Industry Applications Conference. In Proceedings of the Thirty-Fifth IAS Annual Meeting and World Conference on Industrial Applications of Electrical Energy (Cat. No.00CH37129), Rome, Italy, 8–12 October 2000; pp. 388–394. [Google Scholar] [CrossRef]
- Antonino-Daviu, J.; Popaleny, P. Detection of Induction Motor Coupling Unbalanced and Misalignment via Advanced Transient Current Signature Analysis. In Proceedings of the 2018 XIII International Conference on Electrical Machines (ICEM), Alexandroupoli, Greece, 3–6 September 2018; pp. 2359–2364. [Google Scholar]
- Antonino-Daviu, J. Electrical Monitoring under Transient Conditions: A New Paradigm in Electric Motors Predictive Maintenance. Appl. Sci. 2020, 10, 6137. [Google Scholar] [CrossRef]
- Irfan, M.; Alwadie, A.; Glowacz, A. Design of a novel electric diagnostic technique for fault analysis of centrifugal pumps. Appl. Sci. 2019, 9, 5093. [Google Scholar] [CrossRef]
- Tiana, X.; Fenga, G.; Chenb, Z.; Albraika, A.; Guab, F.; Balla, A.D. The investigation of motor current signals from a centrifugal pump for fault diagnosis. In Proceedings of the 27th International Congress of Condition Monitoring and Diagnostic Engineering, Brisbane, Australia, 16–18 September 2014. [Google Scholar]
- Pradhan, P.K.; Roy, S.K.; Mohanty, A.R. Detection of Broken Impeller in Submersible Pump by Estimation of Rotational Frequency from Motor Current Signal. J. Vib. Eng. Technol. 2019, 8, 613–620. [Google Scholar] [CrossRef]
- Jahangiri, M.; Roknizadeh, S.A.S. Clogged impeller diagnosis in the centrifugal pump using the vibration and motor current analysis. J. Appl. Comput. Mech. 2018, 4, 310–317. [Google Scholar] [CrossRef]
- Becker, V.; Schwamm, T.; Urschel, S.; Antonino-Daviu, J.A. Fault Investigation of Circulation Pumps to Detect Impeller Clogging. Appl. Sci. 2020, 10, 7550. [Google Scholar] [CrossRef]
- Stopa, M.M.; Filho, B.J.C.; Martinez, C.B. Incipient detection of cavitation phenomenon in centrifugal Pumps. IEEE Trans. Ind. Appl. 2014, 50, 120–126. [Google Scholar] [CrossRef]
- Bold, S.; Urschel, S. Assessment of approaches for technical diagnostic of pump faults with induction motor as transducer. In Proceedings of the 23rd International Conference on Electrical Machines and Systems (ICEMS), Virtual, 24–27 November 2020; pp. 810–815. [Google Scholar] [CrossRef]
- Stopa, M.M.; Filho, B.J.C.; Lage, B.L.O. An evaluation of the MCSA method when applied to detect faults in motor driven loads. In Proceedings of the IECON 2010—36th Annual Conference on IEEE Industrial Electronics Society, Glendale, CA, USA, 7–10 November 2010; pp. 760–765. [Google Scholar] [CrossRef]
- Mabrouk, A.E.; Zouzou, S.E.; Sahraoui, M.; Khelif, S. Discriminating time-varying loads and rotor cage fault in induction motors. In Proceedings of the 2013 9th IEEE International Symposium on Diagnostics for Electric Machines, Power Electronics and Drives (SDEMPED), Valencia, Spain, 27–30 August 2013; pp. 309–316. [Google Scholar] [CrossRef]
- Blodt, M.; Regnier, J.; Faucher, J. Distinguishing Load Torque Oscillations and Eccentricity Faults in Induction Motors Using Stator Current Wigner Distributions. IEEE Trans. Ind. Appl. 2009, 45, 1991–2000. [Google Scholar] [CrossRef]
- Becker, V.; Schwamm, T.; Urschel, S.; Antonino-Daviu, J.A. Detection of Rotor and Impeller Faults in Wet-rotor Pumps. In Proceedings of the 2020 International Conference on Electrical Machines (ICEM), Virtual, 23–26 August 2020; pp. 1308–1314. [Google Scholar] [CrossRef]
- Becker, V.; Schwamm, T.; Urschel, S.; Antonino-Daviu, J.A. Fault Detection of Circulation Pumps on the Basis of Motor Current Evaluation. IEEE Trans. Ind. Appl. 2021. [Google Scholar] [CrossRef]
- Park, Y.; Jeong, M.; Lee, S.B.; Daviu, J.A.; Teska, M. Influence of Blade Pass Frequency Vibrations on MCSA-Based Rotor Fault Detection of Induction Motors. IEEE Trans. Ind. Appl. 2017, 53, 2049–2058. [Google Scholar] [CrossRef]
- Antonino-Daviu, J.A.; Riera-Guasp, M.; Roger Folch, J.; Molina-Palomares, M.P. Validation of a new method for the diagnosis of rotor bar failures via wavelet transform in industrial induction machines. IEEE Trans. Ind. Appl. 2006, 42, 990–996. [Google Scholar] [CrossRef]
- Schoen, R.R.; Habetler, T.G. Evaluation and implementation of a system to eliminate arbitrary load effects in current-based monitoring of induction machines. IEEE Trans. Ind. Appl. 1997, 33, 1571–1577. [Google Scholar] [CrossRef]
- Bidstrup, N.; Elburg, M.; Lane, K. Promotion of Energy Efficiency in Circulation Pumps, Final Report. EU SAVE II Project; Environmental Change Institute: Oxford, UK, 2001. [Google Scholar]
- Wilo SE “Pump Diagram”. Designations were Adjusted by Vincent Becker. Available online: https://creativecommons.org/licenses/by-sa/3.0/legalcode (accessed on 30 May 2021).


Publisher’s Note: MDPI stays neutral with regard to jurisdictional claims in published maps and institutional affiliations. |
© 2021 by the authors. Licensee MDPI, Basel, Switzerland. This article is an open access article distributed under the terms and conditions of the Creative Commons Attribution (CC BY) license (https://creativecommons.org/licenses/by/4.0/).
Share and Cite
Becker, V.; Schwamm, T.; Urschel, S.; Antonino-Daviu, J.A. Two Current-Based Methods for the Detection of Bearing and Impeller Faults in Variable Speed Pumps. Energies 2021, 14, 4514. https://doi.org/10.3390/en14154514
Becker V, Schwamm T, Urschel S, Antonino-Daviu JA. Two Current-Based Methods for the Detection of Bearing and Impeller Faults in Variable Speed Pumps. Energies. 2021; 14(15):4514. https://doi.org/10.3390/en14154514
Chicago/Turabian StyleBecker, Vincent, Thilo Schwamm, Sven Urschel, and Jose Alfonso Antonino-Daviu. 2021. "Two Current-Based Methods for the Detection of Bearing and Impeller Faults in Variable Speed Pumps" Energies 14, no. 15: 4514. https://doi.org/10.3390/en14154514
APA StyleBecker, V., Schwamm, T., Urschel, S., & Antonino-Daviu, J. A. (2021). Two Current-Based Methods for the Detection of Bearing and Impeller Faults in Variable Speed Pumps. Energies, 14(15), 4514. https://doi.org/10.3390/en14154514