Abstract
Partial discharge measurement is part of the monitoring of equipment in power engineering systems. It provides important information about the condition of the equipment and in particular the condition of the insulation components. This information serves to take necessary preventive measures at an early stage to avoid failures of the affected energy system and thus ensure a high level of energy supply security. Possible causes of partial discharges in energy technology equipment include high field strengths at edges with small radii or defects within insulation materials itself. Depending on the location and extent of the occurrence, partial discharge events may cause lasting damage to components of equipment. In order to be able to interpret the measurement results of partial discharge monitoring with regard to the exact cause and, if necessary, to evaluate them automatically, a precise understanding of the physical phenomena that occur during a partial discharge is necessary. The physical replication of a partial discharge pulse helps to better understand, evaluate, and interpret measurement results and thus create a synergy between measurement data and model-based results.
1. Introduction
Partial discharges occur in gaseous as well as in solid and liquid insulating materials. Gases indicate low losses and an almost frequency-independent dielectric constant and are used at low electric field strengths. For use at higher electric field strengths, on the other hand, solids and liquids with a significantly higher dielectric strength are used [1]. Possible causes of partial discharges in the insulation of power engineering systems include high field strengths at edges with small radii or defects within the insulation material itself [2]. Such defects in solid or liquid insulating materials manifest themselves, for example, as air cavities or contamination within the material. The formation of electrical discharges in air, in particular the partial discharges in strongly inhomogeneous fields, will be examined in more detail in the following. A special focus is placed on the Trichel pulse at negative voltage stress, the impulse like discharge at a needle-plane arrangement. In the present work, on the one hand, the physical properties necessary for a field physical calculation are explained and reduced to a level necessary for the convergence of a numerical calculation. On the other hand, the mathematical description of the partial discharge pulse at the particle level is considered, which, with the help of the field physically calculated particle movements, makes it possible to calculate the partial discharge current in the external circuit of a corresponding experimental arrangement. Finally, this calculated partial discharge current is compared with the results of the measurement on a corresponding arrangement. This results in a symbiosis between field physical and mathematical description as well as corresponding measurement data, which complete each other in such a way that an interpretation of partial discharge measurements with regard to location and damage potential is possible. Despite highly developed measurement systems, it is still not possible to clearly identify the type and occurrence of partial discharges [1].
1.1. Physical Fundamentals of Electrical Discharges
The ignition condition according to Townsend describes the initiation of an electron avalanche by a free start electron. This electron acquires so much energy by drifting in the direction of the electric field that this kinetic energy is high enough to cause impact ionization when it collides with a gas molecule. This creates other electrons, which in turn are also accelerated by the electric field and, consequently, increasing impact ionization takes place. This is called an accumulating electron avalanche [3,4,5]. The ionized positive gas molecules drift against the electric field, hit the electrode, and may in turn knock out new starting electrons. This reverse effect is described by the secondary emission coefficient [1,3]. As a consequence, the process for the formation of an electron avalanche takes place again [1,6]. The ionization coefficient describes how many electrons per unit length are newly generated by an electron. Similarly, the attachment coefficient describes how many electrons attach to gas molecules again per unit length. In inhomogeneous fields, these coefficients are not constant, as they depend on the field strength and thus the energy of the electrons. In case of partial discharges in strongly inhomogeneous fields, the ionization coefficient is greater than the attachment coefficient in the area of high field strength directly at the curved electrode. In the weaker field region, on the other hand, the attachment coefficient dominates [1,6].
The partial discharges described according to Townsend’s ignition condition appear as glow discharges. However, if the number of electrons in the avalanche increases to to , e.g., due to an increase of voltage, then space charge weighted streamer discharges occur, which extinguish in the field weaker region. Based on a negative applied voltage, a positive space charge arises directly at the curved electrode due to the previous ionization of the gas molecules. This leads to an increase of the field strength in the immediate surroundings of the high-voltage electrode. A negative space charge, on the other hand, arises in the field-weaker area, since electrons attach to gas molecules there in this area, especially to molecules. The negative space charge weakens the basic field to such an extent that a new partial discharge is only ignited after this negative space charge has been removed. Thus, partial discharge pulses are generated in a regular sequence, the so-called Trichel pulses [1,6,7].
1.2. State of the Art in Partial Discharge Science
In [6,8,9,10], two-dimensional numerical models of DC corona discharges on a needle plane setup in air are presented. Electrons, as well as positive and negative ions, are considered. The influence of some model parameters is investigated, as well as the comparison with measurement results of a needle set at high voltage positioned above a grounded plate. In addition, the field deformation due to the discharges is discussed and illustrated by simulation results. Moreover, in [10], a model with an additional dielectric placed in the air space in the form of a glass plate above the grounding electrode is developed. A model reduced to electrons and negative ions is built in [11], focusing on the effects of the ambient pressure on the electron density as well as on the density of the negative ions.
In [12] a formula based on the energy balance equation is provided for describing the discharge current flowing in the external circuit due to an electric discharge in an air gap between any electrode arrangements. This takes into account both the space charge accumulation during the discharge process and the displacement current caused by the particle motion. It is noted that, in the derived expression for the description of the discharge current, the space charge weighted field component is no longer taken into account. However, the expression is nevertheless compatible with the superposition principle of the space-charge-weighted and space charge unweighted field components if the external fundamental field is caused by a constant voltage. The motion of the charge carriers caused by particle diffusion is neglected in the final equation for the discharge circuit. Based on this in [13], also on the basis of the energy balance equation, an expression adapted to time varying fundamental fields is developed to describe the discharge current. In addition, the diffusion component of the particle movements is taken into account. The expression from [12] is extended by a term which takes into consideration the displacement current induced by the time varying fundamental field.
In investigations presented in [14,15], the pulse shape of Trichel pulses is analyzed by using a reflection free measurement cell and measurement technique with a high bandwidth. Thereby, in [14], the pulse shape parameters rise time, pulse width, and fall time at alternating and direct voltage load are investigated and compared. In [15], the pulse shape parameters and the repetition rate are investigated as a function of the DC voltage level. The measurement setup based on this research is used in [16] to compare the results of a simplified numerical model for the field theoretical calculation of a partial discharge pulse with experimental measurement results.
2. Methodical Approach
First of all, in Section 3, the geometry of the numerical model, as well as the necessary boundary conditions and fundamental physical equations are presented. Thereby, the continuity Equation (2) is a central component. On the one hand, it describes the change in particle densities due to the mobilization of the charge carriers as a result of the electric field and the natural diffusion of the particles. On the other hand, the reaction or source term is considered, representing the generation of the charge carriers under consideration of the implemented reaction equations and the essential reaction parameters. In Section 4, the derivation of a mathematical expression follows based on the continuity equation, allowing the calculation of the discharge current of a needle-plane configuration with particle properties such as particle density and particle velocity. This expression is used in the postprocessing to read out the partial discharge pulse from the field physically determined variables of the numerical calculation model. Afterwards, the measurement setup is presented, which is used to record a partial discharge pulse without reflections. In the discussion of the results, the calculated and measured partial discharge pulses are compared and the results interpreted. The methodical procedure is shown in Figure 1.
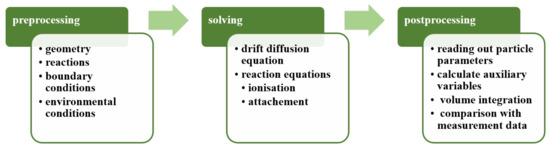
Figure 1.
Scheme for the methodical procedure of the modeling of a partial discharge pulse.
3. Fieldphysical Modeling
The continuity equation and the Poisson equation, which is mentioned in Section 4, represent the central equations for the field physical calculation of the relevant particle properties for the calculation of the partial discharge current. The source term of the continuity equation as well as geometry and boundary condition, but also further model parameters are discussed in Section 3.1 and Section 3.2.
3.1. Geometry and Boundary Conditions
In Figure 2, the simulation area implemented in the numerical model is shown. To reduce the number of nodes and thus the computational effort, the axis symmetry is realized directly at the z-axis between the needle tip and the ground electrode. The negative high voltage potential is implemented as a boundary condition at the needle tip and the ground potential at the ground electrode. The physical relevant processes take place in the immediate area of the axis of symmetry between the needle tip and the ground electrode. Correspondingly, at a distance of 3 cm in radial direction to the needle tip, an isolation condition is implemented as a boundary condition in the form of
These describe that, on the one hand, the normal component of the particle flux at the outer edge of the model geometry is zero. This means that no particles leave the area at this edge. On the other hand, the normal component of the dielectric displacement flux density is zero, whereby it is also taken into account that no particle flux goes beyond the model boundary. In addition, a step change in the electric field, which occurs due to a change in the dielectric constant , is prevented. At the surface of the high voltage electrode and ground electrode, the emission of a secondary electron by an impacting positive ion is taken into account in the form of a surface reaction, taking into account the secondary emission coefficient . Negative ions do not contribute to the supply of secondary electrons and are neutralized at the surface of the electrodes. In the total model volume, electron impact reactions are implemented following [17], which are presented in Table 1. These electron impact reactions are discussed in more detail below.
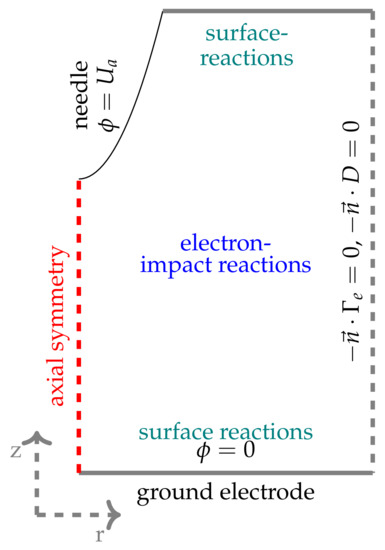
Figure 2.
Geometry of the field physical calculated area.

Table 1.
Types of reaction with associated reaction equations and reaction parameters.
3.2. Physics of Gas Discharge Processes
Within the scope of the field physical simulation, there are different methods for calculating the gas discharge processes. One option is to solve the the following continuity equation [3,4,18,19] for all charge carriers, such as the electrons and the positive and negative ions:
where characterizes the respective particle type. Here, e stands for the electrons, n for the negative ions, and p for positive ions. It describes the change of the particle densities in time and space. The mobility represents the mobility of the charge carriers as a result of the force effect of an electric field. The diffusion constant accounts for natural random motion of particles, such as due to pressure or density differences. Besides the method of solving the continuity Equation (2) for electrons as well as for positive and negative ions, there is an alternative approach which considers the conservation of mass in the whole system. In this approach, the Maxwell–Stefan equation is solved for charge carriers of larger mass like positive and negative ions. This methodology is applied in the used numerical calculation program [20]. Here, the Maxwell–Stefan equation is solved as
The continuity Equation (2) is then solved only for electrons . The density of the mixture is considered as , and denotes the mass fraction of the species. In a similar way to the continuity Equation (2), describes the diffusive flux and rate expression for positive and negative ions, while represents the mass averaged fluid velocity. Similar to Equation (2), there is an expression to calculate the mean electron energy density. If it is assumed that the rate of electron energy gain is locally balanced by the electric field in terms of a rate of energy loss, then the local field approximation is used [20]. On the one hand, this results in a reduction of the complexity of the numerical problem, since the additional equation for the mean particle energy density is not solved. On the other hand, the transport coefficients are then calculated by the reduced electric field [20]:
Thereby, the local field strength E is related to the neutral particle density . The mean electron energy is then obtained as a function of the reduced electric field strength and is shown in Figure 3 [17,20]. In addition, visualized is the reduced electron mobility as a function of the reduced electric field strength
Due to the greater mass inertia of the ions, the reduced mobility for positive and negative ions is assumed to be a constant of [17]. The diffusion constant of the electrons is calculated from the electron mobility and the electron temperature to
The diffusivity of the positive and negative ions are calculated as follows:
where is the Boltzmann constant, T is the gas temperature, and e is the elemental charge.
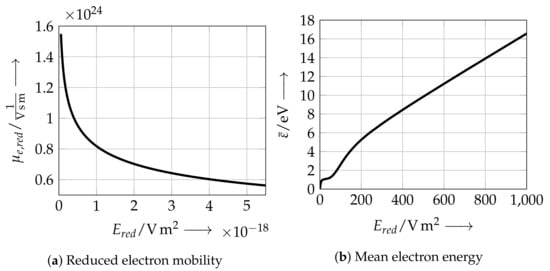
Figure 3.
Reduced electron mobility and mean electron energy as a function of reduced field strength according to [17].
The right part of the continuity Equation (2) is called the impact term or source term and describes the generation rate of particles per unit volume. Since the Maxwell–Stefan Equation (3) is solved for the ions, this becomes due to the then applicable condition . It takes into account the ionization and attachment processes that result in a change in particle densities of the different species [4,19]. In Table 1, the implemented reaction equations are shown with the corresponding reaction parameters. According to [17], electron impact ionization is considered, in which an impact between an electron and a neutral atom results in either a positive ion and two electrons or a negative ion. Both reactions are implemented considering the Townsend coefficient. The Townsend coefficients of both reactions are shown in Figure 4 as a function of the mean electron energy [20]. The source term for these two electron impact reactions is given as
Here, represents the molar mass of the species involved in the reaction.
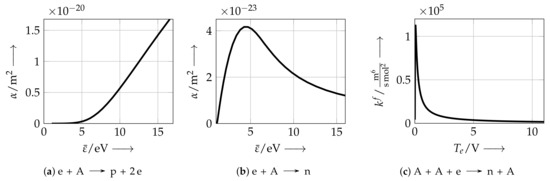
Figure 4.
Townsend coefficients and rate constant for different ionization reactions according to [17].
Furthermore, the formation of a negative ion and a neutral atom by a collision between two neutral atoms and an electron is considered. The reaction parameter to be implemented is the rate constant , so the source term for this reaction turns out to be
The respective rate constants are listed in Table 1 and Figure 4. The diffusive flux in the Maxwell–Stefan Equation (3) is calculated as
were describes the diffusion velocity. Neglecting thermal diffusion, this diffusion velocity is considered as
The diffusivity and mobility are defined in Equation (7). The mean molar mass of the mixture is represented by and the charge number by . A more detailed description of the complex theory of diffusion theory by the Maxwell–Stefan equation is given in [20]. A large number of auxiliary variables and conditions are also described there, which are not discussed any further at this stage.
At the needle tip, an initial distribution implements the electron density and the positive and negative ion densities as initial conditions. According to [6,10], this is taken into account as
In the present investigations, this is supplemented by a complementary particle density minimum to improve numerical stability. The maximum of the particle density is represented by . Moreover, 250 describes the diameter of the charge cloud.
4. Physical Description of the Discharge Current
In the following, an expression is presented for calculating the discharge current in the context of postprocessing (see Figure 1). The field and particle sizes calculated with the model presented in Section 2 are used to evaluate the discharge current. The expression is based on the derivations in [12,13] and is presented here in an abbreviated form. As described in Section 3.2, as one possible method, the continuity Equation (2) must be solved for all charge carriers, namely the electrons and the positive and negative ions, to calculate the discharge current in the context of the field physical calculation [3,6,10,12,13]. By using the particle densities , the change in the space charge density is described by [12,13]:
The particle flux consists of a drift and a diffusion component according to [13]:
Here, defines the velocity and is the particle diffusivity of the specific charge carrier species. The electric field is composed of a component deformed by space charge
and a Laplacian field component, which is not deformed by space charge
These two components superpose each other according to:
The superposition of the electric field components and the resulting movement of the various charge carriers caused by the electric field within the air space between the needle tip and the ground electrode is shown schematically in Figure 5 based on [12]. Furthermore, Maxwell’s equation is required to describe the discharge current resulting from an electrical gas discharge as it is used in [12,13] to derive the expression for describing the discharge current:
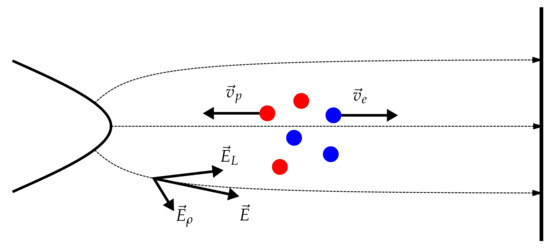
Figure 5.
Schematic representation of the electric fields and the velocities of the charged particles based on [12].
It describes the total displacement current density and allows the conclusion on the current flowing in the external circuit as a result of an electrical discharge [13]. By taking into account the energy equilibrium condition, a relationship between the applied voltage and the resulting discharge current I as well as the field values like the current density and the electric field strength is obtained [12,13]:
Based on this energy equilibrium condition, an expression for the description of the resulting discharge current, which is measured in the external circuit, is generated as a function of the applied voltage taking into account the fundamental particle properties and plasma-physical quantities in the gas volume. Considering the relation
part I of Equation (19) is written as
Taking into account the Gaussian integral theorem and other regularities like Maxwell’s induction law part Ia, consequently, part I is further modified. The exact derivation is presented in [12,13]. Thus, the energy equilibrium condition (19) results in
where, taking into account the superposition of the electric field strength according to Equation (17), the last two summands of Equation (22) are combined:
It is assumed that the Laplacian component of the electric field strength, which is caused by the external applied DC voltage and thereby does not take into account the space charge accumulations that occur during the discharge, is constant. This makes the partial derivation [12]. It must be taken into account that, for an applied time varying voltage, the Laplacian component of the electric field strength is not constant and therefore is not neglectable [13]. Consequently, the discharge current in the external circuit at a constant DC voltage results in:
To reduce the effort in postprocessing, the diffusion part in the volume integral is neglected. However, the diffusion fraction is still taken into account by solving the continuity Equation (2) and so still has an influence on the particle densities . Thus, the discharge current analyzed in the present investigations is determined by the volume integral:
5. Measurement Setup
The measurement of the partial discharge pulses is based on the measurement circuit presented in [14,15,21,22] shown in Figure 6. This corresponds to the standard IEC 60270 partial discharge measurement circuit with decoupling impedance , coupling capacitor , and coupling device (CD). The circuit according to the standard is extended by a conical measuring cell with a needle plane arrangement for reflection free measurement. The part of the measuring circuit implemented according to the IEC 60270 standard is used to detect the regular partial discharge activity. Here, the impedance serves to decouple the discharge circuit from the high voltage source. If an equalizing current flows in the circuit consisting of coupling capacitor and the capacitance of the measuring cell due to an occurring partial discharge, this is detected by the coupling unit (CD) as a voltage pulse [1]. However, in order to detect this partial discharge pulse with high time resolution, the partial discharge pulse as a function of time is recorded with an oscilloscope (MI) using a coaxial connection to the measuring cell. The measurement cell has a conical geometry to eliminate impedance discontinuities and resulting reflections. In addition, external sources of interference are reduced by shielding [21]. In investigations in [21], a bandwidth of is elaborated for the measuring cell. The oscilloscope has an analog bandwidth of and a sampling rate of . In addition, 1000 partial discharge events are recorded with the oscilloscope and averaged for further analysis in the following studies. In Section 6.3 a measured partial discharge pulse is shown normalized to the maximum value. In addition associated pulse shape parameters are enumerated. The area which is implemented in the field physical model taking benefit of the axial symmetry between the needle tip and the ground electrode (see Figure 2) is indicated by a red box in Figure 6.
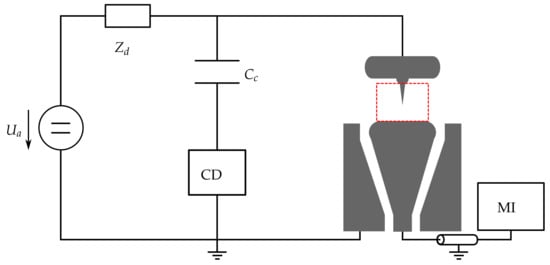
Figure 6.
Scheme of the measurement setup based on [22] and simulated area (red box).
6. Results and Discussion
6.1. Space and Particle Components of the Discharge Current
Due to the vector magnitude of the electric field , particle motions in the different space directions of the considered volume result, contributing to a total partial discharge current according to Equation (25). In Figure 7, the total partial discharge current calculated according to the equation in the previous chapters is shown, as well as the components in r- and z-directions. The component in direction is zero, since there is no significant force component and thus particle motion. Due to the symmetric initial distribution of particle density at the needle tip implemented in Section 3.2, the r- and z-component fractions are approximately identical at the time of 0 . The electric field magnitude is much larger in the z-direction than in the r-direction, so that the contribution of the z-component to the total current clearly predominates. Until the decay to 20% of the total amplitude at about 30 , the contribution of the r- component is non-neglectable with up to a 20% proportion of the total current. In this time interval, the increase in the magnitude of the fundamental field due to the accumulation of positive ions at the nail tip is the most significant (see Section 6.2). This temporarily causes a stronger increase of the fundamental field in its r- than in its z-component due to a rounding of the needle tip by positive ions. It should be recognized that the diffusion component in Equation (25) is not read out within the postprocessing, but, nevertheless, the diffusion component influences the particle densities of the charge carriers by solving the continuity Equation (2). Thus, the space charge accumulations of the respective charge carriers will additionally diffuse in the r-direction. This also explains the again increasing fraction of the r-component from about 70 . At this time, the electric field strength is strongly weakened by the accumulation of negative ions, whereby the change of the particle densities by diffusion increases in proportion and takes place in r- and z-direction.
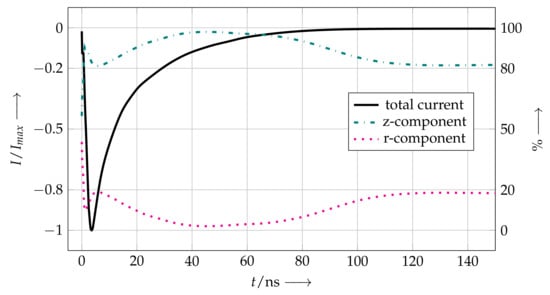
Figure 7.
Simulated discharge current and proportions of the space components.
In addition to the different directional components, the total partial discharge current is composed of the different charge carriers, electrons and positive, as well as, negative ions. In Figure 8, the current fractions provided by the individual species are shown in relation to the total current. For this purpose, only the density and velocity of the given species are evaluated in each case in Equation (25). For the total current, the total volume integral is still considered, taking all species into account. The largest contribution with up to 90% is provided by the electrons. Due to the ionization processes and the high acceleration, very fast electrons are present in the gas volume compared to the ions, contributing a significant fraction through the velocity in Equation (25). The ions move more slowly and initially deform the fundamental field (see Figure 9). Only after the pulse decays to 10% of the maximum amplitude of the total current the fraction of positive and negative ions increases. The positive ions migrate toward the tip of the needle, while the negative ions migrate toward the ground electrode, thus contributing a higher proportion to the discharge current. The space charges that lead to field deformation are reduced. Only when the space charges are largely dissipated another discharge is ignited [1,6]; therefore, the ion current influences the re-ignition of the gas and the repetition rate rather than the pulse shape parameters of a Trichel pulse.
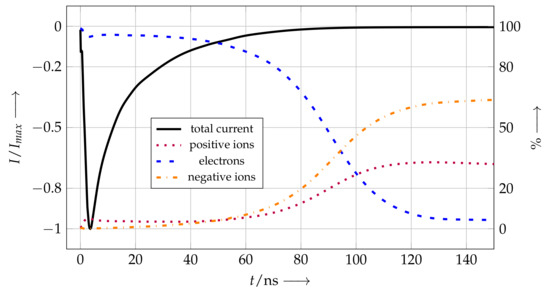
Figure 8.
Simulated discharge current and proportions of the different charge carrier species.
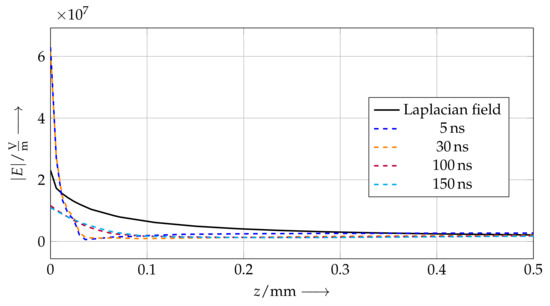
Figure 9.
Electric field at the needle tip with and without consideration of space charge accumulation.
6.2. Field Displacement Due to Space Charge Accumulation
The electric field along the axis of symmetry between needle tip and ground electrode at different times is shown in Figure 9. Here, a steady state under DC voltage stress is assumed for the basic Laplacian field without considering charge carrier accumulations. This means that all time varying processes, which are caused for example by switching on the DC voltage, have decayed, and a stationary electric field is present. Already 5 after ignition of the gas volume, a clear deformation of the fundamental field occurs. At this point, approximately the maximum of the partial discharge current is reached (see Figure 7 and Figure 8). As visualized in Figure 8, the partial discharge current determined by the volume integral is dominated to 95% from the fraction of electrons. According to Equation (25), it follows that the velocity and density of the electrons highly exceed those of the other species. The electron avalanche leaves heavier positive ions in the ionization region immediately in front of the needle tip, which increases the electric field strength compared to the fundamental field. In addition, in the accumulation zone, the enrichment with negative ions leads to a negative space charge accumulation and thus to a weakening of the fundamental field [1,6]. Since, at this time, both positive and negative ions are not yet sufficiently accelerated by the electric field and the electron generating by ionization predominates, the ions contribute a very small fraction to the discharge current according to Equation (25) as shown in Figure 8. About 30 after ignition of the gas volume, the field strength in the immediate surroundings of the nail tip still corresponds to that at the time of 5 , since the positive space charge cloud is not yet dissipated. In the attachment region, on the other hand, the negative space charge accumulation intensifies as more negative ions are generated. At this point, the ratio of the electron current to the total discharge current already begins to decrease, whereas the ratio of the negative ion current begins to increase. In the further process of time, the amount of electron current continues to decrease, since, due to the field weakening, a sufficiently high field strength is only present in the direct surroundings of the needle. Positive ions have already accumulated in this area, which cannot be further ionized due to the much higher energy required for secondary ionization and thus no further electrons are generated. In addition, the amount of the negative ion current in the total current increases, since these have accumulated due to the predominant attachment reactions and are accelerated by the electric field after some time. Furthermore, the fraction of positive ion current increases due to the accumulation in front of the needle tip and the acceleration towards the needle tip. This results in a reduction of the positive and negative space charge as seen in the field curves at 100 and 150 shown in Figure 9. The negative ions in the region of lower field strength follow a longer path toward the ground electrode, resulting in longer time for acceleration and thus the predominance of the negative ion current illustrated in Figure 8. However, due to the mass inertia and the low field strength, these move so slowly that, according to Equation (25), this results in a neglectable current during the Trichel pulse compared to the maximum value of the partial discharge current. After 150 , a large part of the distortion of the base field due to the accumulation of space charges is dissipated. A further partial discharge only begins when the space charges are almost completely reduced.
6.3. Validation with Measurement Results
To characterize the pulse form of the Trichel pulse, the pulse shape parameters [14,15] visualized in Figure 10 are used:
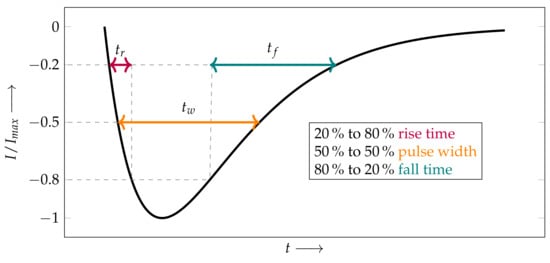
Figure 10.
Pulse shape parameters.
- 20% to 80% pulse rise time ,
- 50% to 50% pulse width ,
- 80% to 20% pulse fall time .
Furthermore, the following relations are introduced for an extended description of the pulse shape:
- 80% to 20% pulse fall time related to 50% to 50% pulse width ,
- 50% to 50% pulse width related to 20% to 80% pulse rise time .
These describe the typical asymmetry of the Trichel pulse. The smaller the ratio and the larger in comparison the ratio , the more the pulse maximum is shifted to the left on the time axis and the longer the decay of the partial discharge pulse takes. To evaluate the agreement between measured and simulated discharge current using the pulse shape parameters, the agreement is determined according to
In Figure 11, the measured and the simulated partial discharge current normalized to the maximum value is shown. The pulse shape parameters are shown in each case in Table 2. In addition, the results are included from the previous investigation on which the investigation presented here is based. In these previous investigations, the simulated discharge current is evaluated as the surface integral of the normal component of the electron current density at the electrode surfaces [16]. Both positive and negative ions are neglected. In addition, the components of the current density in r- and -direction are not evaluated. By taking into account the normal component of the electron current density at the electrode surfaces, there is already a 58.5% age agreement between the rise time of the measured and simulated discharge current. By considering electrons as well as positive and negative ions and furthermore the evaluation by a volume integral, a 69.2% age agreement is obtained. Since ionization processes take place directly in front of the needle at the beginning of the discharge and thus a growth of the electrons takes place, which moves in the direction of the electric field, an improvement of the agreement of about 10% points results here by taking into account all space components and particle species. Moreover, in the case of the pulse width, the extension of the model to include the named aspects has a much stronger effect. Here, there is an improvement in the agreement between the measured and simulated discharge current and its pulse width by slightly more than 40% points. In this time interval, the r-component of the discharge current represents an almost 20% share (see Figure 7), which is taken into account by the volume integration. Furthermore, the discharge current is also composed of a 5% share of positive ions, as shown in Figure 8.
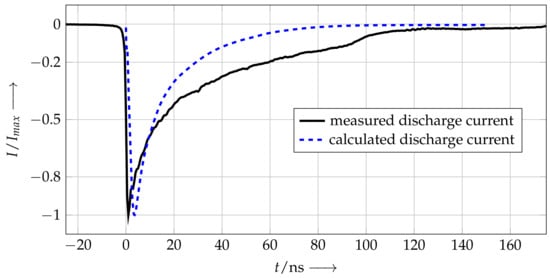
Figure 11.
Measured and calculated discharge current.
Table 2.
Pulse shape parameters of the measured and calculated discharge current and their agreement.
The agreement of the pulse decay time is improved by approximately 35% points by considering all space components and charge carrier types. In this time interval, the r-component represents a 10 to 20% share of the total discharge current. The share of positive ions in the total current is continuously 5%. The ratio between pulse rise time and pulse width is improved by almost 45% points by calculating the discharge current using the volume integral (25). In addition, the ratio between pulse width and fall time increases by 33% points. This reflects the typical asymmetry of the Trichel pulse, which is highly shifted to the left on the time axis. By taking into account all space components and all charge carrier species, this characteristic appearance is reproduced more completely.
7. Conclusions
In this work, a method for determining the discharge current at a needle plane arrangement is presented. A field physical model is realized and, afterwards, the discharge current is determined on a particle physical level by use of a volume integral considering all charge carrier species. The method is a further development of earlier work in which the normal component of the electron current density at the electrode surface is evaluated as a surface integral. Compared to the method used in previous work, the pulse shape parameters agree with a measured pulse up to more than 40% points better. In addition, the asymmetry of the pulse, represented by the ratio between pulse width to pulse rise time and pulse fall time to pulse width, is reproduced by the evaluation of all charge carrier types by the use of a volume integral. This is mainly caused by the consideration of the different space components in the direction of which the electric field is developed and thus particle motions take place. The physical modeling and measurement of partial discharges complement each other to improve the understanding and classification of partial discharge processes. This serves to achieve a better diagnosis of equipment and thus to detect damage relevant partial discharge types at an early stage.
Author Contributions
Conceptualization, K.F. and F.J.; Methodology, K.F.; Software, K.F.; Validation, K.F.; Formal Analysis, K.F.; Investigation, K.F.; writing—original draft preparation, K.F.; writing—review and editing, K.F. and F.J.; Visualization, K.F.; Supervision, F.J.; Project Administration, F.J.; Funding Acquisition, F.J. All authors have read and agreed to the published version of the manuscript.
Funding
This project was supported by the European Regional Development Fund (MoLu HGÜ FKZ: EFRE-0801546).

Institutional Review Board Statement
Not applicable.
Informed Consent Statement
Not applicable.
Data Availability Statement
Not applicable.
Conflicts of Interest
The authors declare no conflict of interest.
Nomenclature
The following abbreviations are used in this manuscript:
| Symbol | Unit | Meaning |
| Coupling capacitor | ||
| Electric flux density | ||
| Diffusivity of charge carrier species | ||
| Electric field strength | ||
| Laplacian electric field strength | ||
| Local reduced field strength | ||
| Electric field strength deformed by space charge | ||
| e | Elementary charge | |
| I | Discharge current | |
| Current density | ||
| Diffusive flux of ions | ||
| Boltzmann constant | ||
| Rate constant of reaction | ||
| Mean molar mass of the mixture | ||
| Neutral particle density | ||
| Normal vector | ||
| Density of charge carrier species | ||
| Maximum particle density of the initial distribution | ||
| Source term | ||
| rate expression for ions | ||
| r-coordinate of needle tip | ||
| Radius of initial distribution of particle densities | ||
| T | Gas temperature | |
| Electron temperature | ||
| 20% to 80% Pulse rise time | ||
| 50% to 50% Pulse width | ||
| 80% to 20% Pulse fall time | ||
| Applied voltage | ||
| Mass averaged fluid velocity of ions | ||
| Diffusion velocity of ions | ||
| Velocity of charge carrier species | ||
| Mass fraction of ions | ||
| x | Molar fraction | |
| Decoupling impedance | ||
| Charge number of ions | ||
| z-coordinate of needle tip | ||
| Townsend coefficient | ||
| Particle flux | ||
| Secondary emission coefficient | ||
| Dielectric constant of material | ||
| Dielectric constant of the vacuum | ||
| Attachment coefficient | ||
| Mobility of charge carrier species | ||
| Reduced mobility of charge carrier species | ||
| Space charge density | ||
| Density of the mixture | ||
| Potential | ||
| Potential according to Laplacian field | ||
| Potential according to a deformed field by space charge | ||
| Index | Meaning | |
| Electrons | ||
| Number of reaction | ||
| Total number of reactions leading to growth or decay of particle density | ||
| Negative Ions | ||
| Positive Ions |
References
- Küchler, A. Hochspannungstechnik; Springer: Berlin/Heidelberg, Germany, 2017. [Google Scholar] [CrossRef]
- Schon, K. Hochspannungsmesstechnik; Springer Vieweg: Wiesbaden, Germany, 2016. [Google Scholar] [CrossRef]
- Stroth, U. Plasmaphysik—Phänomene, Grundlagen und Anwendungen; Springer: Berlin/Heidelberg, Germany, 2018. [Google Scholar] [CrossRef]
- Lieberman, M.A.; Lichtenberg, A.J. Principles of Plasma Discharges and Materials Processing, 2nd ed.; Wiley-Interscience: Hoboken, NJ, USA, 2005. [Google Scholar] [CrossRef] [Green Version]
- Loeb, L.B. Electrical Coronas; University of California Press: Berkeley, CA, USA, 1965. [Google Scholar] [CrossRef]
- Dordizadeh Basirabad, P. Numerical and Experimental Study of the Trichel Pulses in Needle-Plane Geometry. Ph.D. Thesis, The University of Western Ontario, London, ON, Canada, 2016. Electronic Thesis and Dissertation Repository, 4167. [Google Scholar]
- Trichel, G.W. The Mechanism of the Negative Point to Plane Corona Near Onset. Phys. Rev. 1938, 54, 1078–1084. [Google Scholar] [CrossRef]
- Sattari, P.; Castle, G.P.; Adamiak, K. Numerical Simulation of Trichel Pulses in a Negative Corona Discharge in Air. IEEE Trans. Ind. Appl. 2011, 47, 1935–1943. [Google Scholar] [CrossRef]
- Serdyuk, Y.V. Propagation of Cathode-Directed Streamer Discharges in Air. In Proceedings of the COMSOL Conference Rotterdam, Rotterdam, The Netherlands, 23–25 October 2013. [Google Scholar]
- Tran, T.N.; Golosnoy, I.O.; Lewin, P.L.; Georghiou, G.E. Numerical modelling of negative discharges in air with experimental validation. J. Phys. D Appl. Phys. 2011, 44, 257–260. [Google Scholar] [CrossRef] [Green Version]
- Zhang, J.; Adamiak, K.; Castle, G.S.P. Numerical modeling of negative corona discharge in oxygen under different pressures. J. Electrost. 2007, 65, 174–181. [Google Scholar] [CrossRef]
- Sato, N. Discharge current induced by the motion of charged particles. J. Phys. D Appl. Phys. 1980, 13, L3–L6. [Google Scholar] [CrossRef]
- Morrow, R.; Sato, N. The discharge current induced by the motion of charged particles in time-dependent electric fields; Sato’s equation extended. J. Phys. D Appl. Phys. 1999, 32, L20–L22. [Google Scholar] [CrossRef]
- Lühring, U.; Wienold, D.; Jenau, F. Comparative investigation on pulse shape parameters of partial discharges in air under AC and DC voltage stress. In Proceedings of the 2016 51st International Universities Power Engineering Conference (UPEC), Coimbra, Portugal, 6–9 September 2016; pp. 1–4. [Google Scholar] [CrossRef]
- Lühring, U.; Wienold, D.; Jenau, F. Investigation on the pulse shape of DC corona discharges in air under varying test voltage level. In Proceedings of the 2018 IEEE 2nd International Conference on Dielectrics (ICD), Budapest, Hungary, 1–5 July 2018; pp. 1–6. [Google Scholar] [CrossRef]
- Friebe, K.; Wienold, D.; Jenau, F. Optimized Numerical Modeling and Validation of negative DC Corona Discharges by using Pulse Shape Parameters. In Proceedings of the 2020 55th International Universities Power Engineering Conference (UPEC), Turin, Italy, 1–4 September 2020; pp. 1–5. [Google Scholar] [CrossRef]
- Atmospheric Pressure Corona Discharge in Air; COMSOL Multiphysics® v. 5.6; COMSOL AB: Stockholm, Sweden, 2020.
- Raju, G.G. Dielectrics in Electric Fields; CRC Press Taylor & Francis Group: New York, NY, USA, 2017. [Google Scholar]
- Raizer, Y.P.; Allen, J.E. Gas Discharge Physics; Springer: Berlin/Heidelberg, Germany, 1991. [Google Scholar]
- Plasma Module User’s Guide; COMSOL Multiphysics® v. 5.6; COMSOL AB: Stockholm, Sweden, 2020.
- Kurrat, M. Modellierung und Messung von Teilentladungen in Hohlräumen zur Bestimmung schädigungsrelevanter Energien. Ph.D. Thesis, Universität Dortmund, Dortmund, Germany, 1993. [Google Scholar]
- Wienold, D.; Lühring, U.; Jenau, F. Data analysis procedure and verification for DC PD measurements in the high frequency range. In Proceedings of the 2018 IEEE 2nd International Conference on Dielectrics (ICD), Budapest, Hungary, 1–5 July 2018; pp. 1–4. [Google Scholar] [CrossRef]
Publisher’s Note: MDPI stays neutral with regard to jurisdictional claims in published maps and institutional affiliations. |
© 2021 by the authors. Licensee MDPI, Basel, Switzerland. This article is an open access article distributed under the terms and conditions of the Creative Commons Attribution (CC BY) license (https://creativecommons.org/licenses/by/4.0/).