1. Introduction
Energy efficiency is one of the critical points of focus in achieving the overall energy and climate goals. The European Union (EU) Energy Efficiency Directive 2018/2002 (EED) has established an energy efficiency target for 2030 of at least 32.5% (compared to projections of the expected energy consumption in 2030) [
1]. EU member states shall achieve the amount of energy savings required by the EED either by establishing an energy efficiency obligation scheme (EEOS) or by adopting alternative policy measures or by combining them both. According to the EED, the obligation can be assigned to energy distributors, retail energy companies, transport fuel distributors, or transport fuel retailers operating in their territory.
Before the introduction of EED, five European countries (Denmark, France, Italy, the UK, and the Flanders region of Belgium) were already implementing EEOS [
2], which includes about 40% of the EU population [
3]. The first country in Europe that introduced an obligation on suppliers to save energy among final customers was the UK in 1994 [
4]. The introduction of EED in 2012 led to a rapid increase in EEOS. As a result, in 2018, already 12 EU countries had active EEOSs (Austria, Bulgaria, Denmark, France, Ireland, Italy, Luxembourg, Malta, Poland, Slovenia, Spain, UK), while another 3 were intending to start shortly (Croatia, Greece, Latvia) [
5]. In April 2020, there were 16 active EEOSs in the EU Member States and the UK, with other countries still planning implementation [
6]. EEOS is used relatively rarely compared to all the policy instruments used to comply with the target set out in EED. Meanwhile, grant schemes are the most common in all sectors [
5]. However, the frequency of policy measures used to comply with the EED energy efficiency target does not always represent proportional energy savings. According to the European Commission’s report in 2020 [
1], EEOS is the most crucial policy measure regarding cumulative energy savings and delivered more than one-third (35.59%) of all cumulative energy savings during the period from 2014 to 2017. EEOS delivers more than twice the savings from energy or CO
2 taxes (16.07%), followed by financing scheme/instrument (13.12%) and regulation (9.75%).
The summary of EEOS in selected EU countries and the UK compiled by [
7] represents the differences between EEOSs. Regarding the obligated parties, all energy suppliers were set as obligated in France, while in Belgium, for instance, only electricity distributors are obligated. In Italy, energy-saving measures refer to all sectors, including transport, while only residential customers are eligible in the UK. In Denmark, France, and the UK, savings are attributed to the delivered energy. Meanwhile, in Italy, Belgium, and Poland, it is primary energy. The target amount of energy savings is difficult to compare as the final consumption of energy is an important factor [
8]. Denmark, France, and Belgium have set a fixed penalty per kWh for the shortfall of savings, while in Italy and Poland, the penalty can vary widely, but the UK only determines a possibility to impose a penalty [
9]. Nearly all selected countries allow some trading of the white certificates, except for Belgium. Overall, costs are passed on to the end-users through energy bills, and this is the primary source for funding the programs among these countries [
10].
The success of EEOS implementation depends on various factors, such as policy design, implementation, governance, and market structure and conditions [
11]. Bertoldi et al. [
12] concluded that although supplier obligations seem to be well-suited for the residential sector, end-user saving obligations may also offer advantages to the industrial and commercial sectors. Oftentimes, EEOS are coupled with a trading system, and one of the leading trading options is white certificates [
13].
Fawcett et al. [
11] provided evidence that a good quality EEOS may deliver significant, cost-effective energy savings over many years. The overall benefits of EEOS are distributed over different domains, such as energy end-users, utilities, and society [
5,
14]. However, these benefits are not automatically guaranteed with every launch of EEOS. For example, while theoretically, energy savings under the EED should be about 10.5% by 2020 (1.5% per year for seven years), in practice, these savings are expected to be about half this amount [
2]. In addition, the European Commission reported that 13 EU Member States risked not meeting their national energy savings obligation by December 2020 [
1], including Latvia.
The most important disadvantages of EEOS are considered to be transaction costs and administration costs [
3]. Furthermore, it is suggested that the accredited savings in the course of the scheme are likely to be higher than the actual savings achieved due to possible bargains during negotiations between stakeholders. Another view suggests that efficiency measures might not deliver the theoretically estimated range of efficiency because of the rebound effect [
15,
16]. Finally, the duration of the policy is shown to be more important than the mere existence of the policy in demonstrating the policy’s effectiveness [
17].
Another study [
18] analyzed the distributional effects of EEOS derived by analysis on delivery and financing of measures and concluded that high-income households and large enterprises are the beneficiaries. In contrast, low-income households and small enterprises are the ones to pay. Other studies have also found that the effects of EEOS may be regressive for low-income households [
19]. The previous statement suggests that such a scheme is not well balanced, and thus, its success might be questionable in some cases.
Despite many studies on the evaluation of energy efficiency policy impact that have been carried out over the past several decades, there is a gap of knowledge about the role of policy and market interventions in delivering energy savings and emissions reduction [
20].
Following the introduction of EED in 2012, the Latvian government has conceptually decided to introduce EEOS in 2013 [
21]. The scheme officially started in 2017. A forecast on the implementation success of EEOS in Latvia presented by [
13] predicted that Latvia is at high risk of savings shortfalls because it may not deliver savings at the predicted rate. This statement was built on the arguments that the Latvian scheme was originally neither built on the existing experience of a voluntary scheme for obligated parties nor did it adopt (and adapt) a successful EEOS design from another country.
In this study, we have two goals. The first goal is to assess the implementation of EEOS in Latvia and its ability to deliver significant savings in the first phase of the new EEOS. Thus, this paper questions whether a new EEOS can reach saving goals without prior experiences with voluntary agreement schemes and emulation of successful EEOS from other countries. The second goal is to create a web-based optimization tool as an Interactive Learning Environment to help both policymakers and EEOS obliged parties to create a goal-reaching strategy based on the most cost-effective energy efficiency measures in the framework of the current EEOS legislation. The paper starts with a description of the methodology. This is followed by a chapter presenting results from the ex-post evaluation and simulation results. Furthermore, the obtained results are discussed. Finally, the conclusions and implications for policymakers are presented.
2. Methodology
An ex-post evaluation of EEOS is carried out by combining a theory-based policy analysis method to reach the first goal of the study [
22,
23] with the criteria from the Better Regulation Agenda (BRA) guidelines [
24]. This method has several advantages compared to other ex-post evaluation methods. First, it evaluates the whole process of policy implementation, not only focusing on the final impacts. Second, it develops indicators for each phase of the implementation process. It helps assess progress and failures as widely as possible. Finally, it helps to determine whether policies are successful or not, why they are successful or fail, and how they can be improved. System dynamics modeling is used to reach the second goal of the study.
2.1. Combined Ex-Post Evaluation Method
A theory-based policy analysis method is intended to systematically assess all phases of the policy implementation process, success and failure factors, and end-effects, such as target achievement, the impact of energy savings, and cost-effectiveness. At the core of this evaluation method lies the policy theory. This is an approach to describe how the policy measure is expected to reach energy efficiency goals.
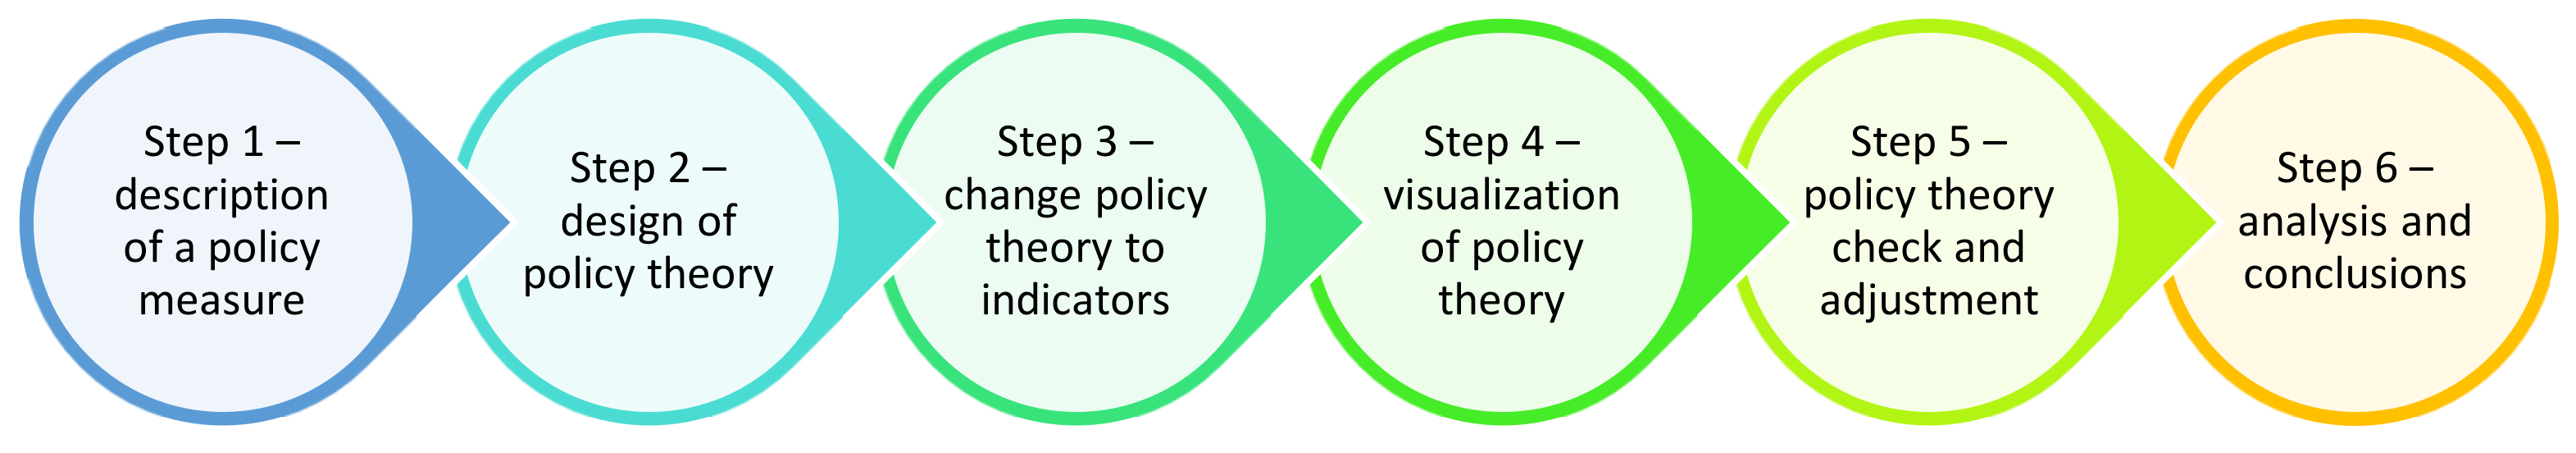
Figure 1 illustrates the different steps of this method. First, all steps of the implementation process are listed. It is presented in the form of a cause–impact relationship between the different steps of implementation. For each step, indicators are identified to measure the cause–impact relationship and determine whether the change occurred due to the implementation of the policy measure. Both quantitative and qualitative indicators can be applied. Second, the major success and factors of failure in policy implementation are identified for each step of the policy theory. Finally, the relation to other policy instruments is determined to understand whether and how they reinforce or balance implementation of the policy measure. If policymakers have clearly described how they foresee implementing the policy measure before implementing it, the explicit theory is available. If the description is not available, the policy theory is implicit, and evaluators have to draw it up. The theory-based policy evaluation is presented as a flow chart.
In this study, the policy theory is transformed into indicators for each causal relation by applying “The Better Regulation Agenda” evaluation criteria:
Effectiveness—determines progress towards achieving the goal. It should be based on evidence on why, whether, and how these changes are related to a policy measure;
Efficiency—assesses both the costs and the benefits of the measure, as they arise to different stakeholders, by determining what these costs/benefits are and how these factors are related to the policy measure;
Relevance—assesses how well objectives of the policy measure meet the needs and challenges;
Coherence—determines how well the policy measure works internally and with other policy measures;
Value-added—consider arguments on the value of a policy measure, which is in addition to the value that could be created by policy measures initiated at regional or national level by both public authorities and the private sector;
Validity—assesses to what extent the policy measure does or does not satisfy the needs of stakeholders and what is the difference between the satisfaction of the various stakeholders;
Equality—assesses how fairly the effects are shared between different groups of society;
Sustainability—assesses the likelihood that the effect of the policy measure continues after the end of the measure;
Acceptability—assesses to what extent a change in the perception of a policy measure in the target audience and in general in society is reached;
In addition to the criteria mentioned above, the institutional capacity was studied, and three indicators reflect it:
Clear objectives and powers of the policy implementing body;
Ability to balance and consolidate both flexibility (the ability to adapt to changing conditions and reducing potential failure factors in the implementation process) and continuity (stable and predictable conditions);
Degree of involvement of stakeholders in the design and implementation of the policy measure.
2.2. Data Collection for the Evaluation
The verification of the policy theory was carried out with mixed methods, in which quantitative and qualitative methods are combined. Quantitative data alone do not fully provide insights and a comprehensive understanding of the causal mechanisms. Therefore, a qualitative method was used to capture essential aspects from the perspective of EEOS parties and to identify non-quantifiable factors that enable to explain the success and failure of the policy measure. This approach enables data triangulation and can limit the bias associated with the application of any single method.
The quantitative method included data collection from different data sources:
As qualitative research focuses on in-depth exploration, a small but diverse sample is recommended, for example, [
27] suggests that eight long interviews are a sufficient basis for qualitative research. In 2019, 15 companies were eligible as EEOS parties. From the 15 companies, 9 had to fulfill EEOS obligations. In total, seven in-depth interviews with EEOS responsible parties were conducted from September to December 2019. Their particular knowledge and understanding were valuable sources of information to gain insight into the nature of problems and give recommendations for solutions. Semi-structured interviews were conducted face-to-face with each participant at a time and place chosen by the interviewee. The interviews focused on extracting specific energy efficiency-related information from stakeholders and understanding the knowledge held by those stakeholders. Interviews lasted on average 95 min and were digitally recorded for transcription purposes.
An interview guide with eight questions was used: (1) Could you describe what you do here? (2) What happened in your company after the government issued the Law on Energy Efficiency with defined obligations for EEOS parties? Can you walk me through the process? (3) What happened in your company after it became an EEOS obliged party? Can you walk me through the process? (4) Has the process always worked this way? If it has changed, can you tell me about when that happened and how it went? (5) What challenges have you experienced during the process? (6) What role do technology suppliers, energy consultants, and researchers play? (7) Do you see any added value of the EEOS? (8) Would you continue the energy efficiency program in your company if the government withdraws the obligations? Can you elaborate on this? A deductive coding approach with a pre-selected coding pattern was applied.
Pre-selected coding was developed based on the literature review ([
2,
13,
18]). Following each interview, the recording was transcribed verbatim and an analysis was conducted. The credibility of the results was increased by both the pilot interviews and the triangulation method.
2.3. System Dynamics Model
The annotation of Regulation No. 226 [
21] states that the EEOS obliged parties are interested in finding the most cost-effective solutions for implementing energy efficiency measures in the free electricity market. Thus, no significant impact on the final consumer’s electricity costs is expected. According to legislation, the EEOS party can fulfill the obligation in several ways. It can either carry out information dissemination and educational activities, implement energy efficiency measures at the end-user, or pay a 70 EUR per MWh fee to fund the state or municipal Energy Efficiency Fund. All three approaches can be combined. The Ministry of Economics, which is the administrator of the EEOS, has developed the Energy Savings Catalogue [
28]. It facilitates the accounting of deemed energy savings for the EEOS parties if they carry out standard energy efficiency measures. Costs for information and education activities can be included in the energy tariff via operational costs, but energy efficiency measures have to be included in the bill of an individual consumer who receives these measures. EEOS parties are obliged to deliver energy savings in the household sector and among small and medium companies.
The legal framework defined by the government has several limitations that should be taken into account when EEOS parties design their strategies. First, the intensity of information dissemination and educational activities is limited by the maximum frequency of events per year. If the frequency is too high, the customer of the EEOS party is overflooded with information, e.g., several e-mails sent every day, which might lead to losing attention to this information. Second, costs for energy efficiency measures have to be included in the bill of an individual consumer who receives these measures, which means that the obliged party has either to sell ESCO services or sell products directly or via leasing contracts. In other words, the EEOS obliged party has to invest resources in selling products or ESCO services. This calls for an optimization tool to search for the most cost-effective strategy to reach the goal set by the government. Apart from that, this tool can also be used to simulate different scenarios to develop a goal-reaching strategy. Both policymakers and EEOS obliged parties could use such a web-based, freely accessible simulation tool.
For this purpose, system dynamics modeling is used in this study. This mathematical modeling approach created by Jay Forrester [
29] is used to study the dynamics of complex systems with feedbacks, nonlinearities, and delays. Stocks and flows are the main building blocks of the model. Stocks are accumulations, and they are filled in or depleted over time through inflows and outflows. The stock and flow structure of systems helps to carry out a quantitative analysis.
Stella Architect has been used as the software tool for building stock and flow structure, generating simulations of the system’s behavior, and creating an Interactive Learning Environment. An optimization function was used for optimization scenarios. The model is made as a generic structure that can be adapted and applied to different cases and countries. The model was populated with data from interviews of EEOS parties as default, but it is built to input their values.
3. Results
3.1. Description of the Policy Measure
In 2016, Latvia committed to contributing 9.85 TWh of cumulative energy savings to the EU’s overall energy efficiency goal by 2020. EEOS was one of the policy measures in the broader package of national energy efficiency policies described in the Energy Efficiency Policy Plan for Alternative Measures for the Achievement of the Energy End-use Savings Target for 2014–2020 [
30].
The EEOS in Latvia entered into force in 2017. The EEOS was introduced in accordance with the Energy Efficiency Law [
31] and under the Cabinet of Ministers Regulation No.226 Rules for the Energy Efficiency Obligation Scheme [
21]. The legislation stipulates that during the initial (2014–2017) and first (2018–2021) commitment periods of EEOS, the responsible parties of EEOS are electricity retailers. The criterion for the inclusion of responsible parties is the amount of electricity sold per year, and it should be over 10 GWh. EEOS parties are obliged to achieve the following amount of energy savings:
For year 2018: P2018 = 1.5% × A2018;
For year 2019: P2019 = 1.5% × (A2018 + A2019);
For year 2020: P2020 = 1.5% × (A2018 + A2019 + A2020),
where:
Pn—amount of the EEOS party’s annual obligation (MWh);
An—amount of electricity sold by the EEOS party in the year concerned (MWh) minus the amount of electricity sold to large electricity consumers (consumption over 500 MWh/year) and large companies, based on a certified auditor’s certification.
As described above, the EEOS party can fulfill the obligation in several ways. The legislation foresees no financial support activities to energy consumers, and the customer implementing energy efficiency measures bear all costs.
Information and educational measures are defined as campaigns about energy efficiency and energy savings addressing particular target audiences. Four types of information measures are foreseen. First, a single information campaign can include electronic mass media, single activities, and printed materials. Second, a long-term education program or additional information can be included in the bill, non-personalized advice on the EEOS party’s web page, single activities, and printed materials. Third, individual activities can include individual consultations in energy efficiency centers, agencies, or exhibitions. Finally, the installation of energy meters with an information feedback function is considered as another information measure.
Energy efficiency improvement in technologies in both domestic and non-domestic sectors include lighting, solar collectors, thermal resistance of the building envelope, change of low-efficiency boilers, installation of biomass boilers, renovation of heating systems, circulation pumps, heat pumps, industrial motors, alternative fuel vehicles, change of vehicles oil, change of tires, and heat recovery units for ventilation. The lifetime varies across different technologies. The Energy Savings Catalogue foresees measures in addition to thermal resistance improvements of the building envelope, which goes beyond the current building standards.
To assess the costs included in the energy tariff and ensure their transparency and reliability, the EEOS responsible party should draw up an energy efficiency action plan for each commitment period. It should include information on the costs of the measures and the contribution to the Energy efficiency Fund if applicable. The plan should be submitted to the Ministry of Economics for comment and adjusted based on comments and feedback. EEOS parties can adjust their plans every year.
Deemed savings have to be calculated and reported every year based on the Energy Savings Catalogue. Implementation of energy efficiency measures has to be demonstrated by supporting documents, e.g., contracts concluded by the EEOS party to introduce energy efficiency measures to final energy consumers. If the savings goal is overachieved, the savings goal is reduced for the following year. If the party has achieved at least 80% of the committed goal, the gap is added to the following year’s goal. If it is less than 80%, a penalty of 125 EUR per MWh should be paid to the Energy Efficiency Fund. If a party has fulfilled more than 100% of the amount of the obligation, the excess part is removed from the amount of the obligation for the following year. The Ministry of Economics has an obligation to publish savings on its webpage.
The annual electricity sales of nine electricity retailers exceeded 10 GWh in 2015 and 15 in 2019 [
32]. Total sales of these retailers amount to 99.2% of the total national final electricity consumption. The objective set by the Cabinet of Ministers in the annotation of Regulations for this policy measure [
21] is to achieve total energy savings of 234 GWh by 2020 as a result of the introduction of the EEOS. This amount equals 2.4% of Latvia’s binding energy efficiency goal by 2020 [
30]. EEOS energy savings targets were initially low to reduce potential uncertainties and risks related to the impact of the EEOS on administrative resources and energy costs for different energy users. Initial assumptions forecasted that half of all EEOS savings would come from information and education activities carried out by EEOS parties, and the other half from the contribution to the Energy Efficiency Fund or the implementation of the most cost-effective energy efficiency measures, the cost of which is equivalent to the contribution to the Fund. The ex-ante evaluation estimated indicative total annual costs for EEOS administration and regulation by the Ministry of Economics in the amount of 17,135 EUR, which includes audit costs, review of energy efficiency plans and their amendment, review, calculation of required data processing of annual reports, etc. Planned indicative costs of EEOS parties (average costs per party) are around 4700 EUR per year, covering the planning costs and costs for collecting and reporting information on the energy savings achieved.
3.2. Combined Ex-Post Evaluation Method
The annotation of Regulation No.226 [
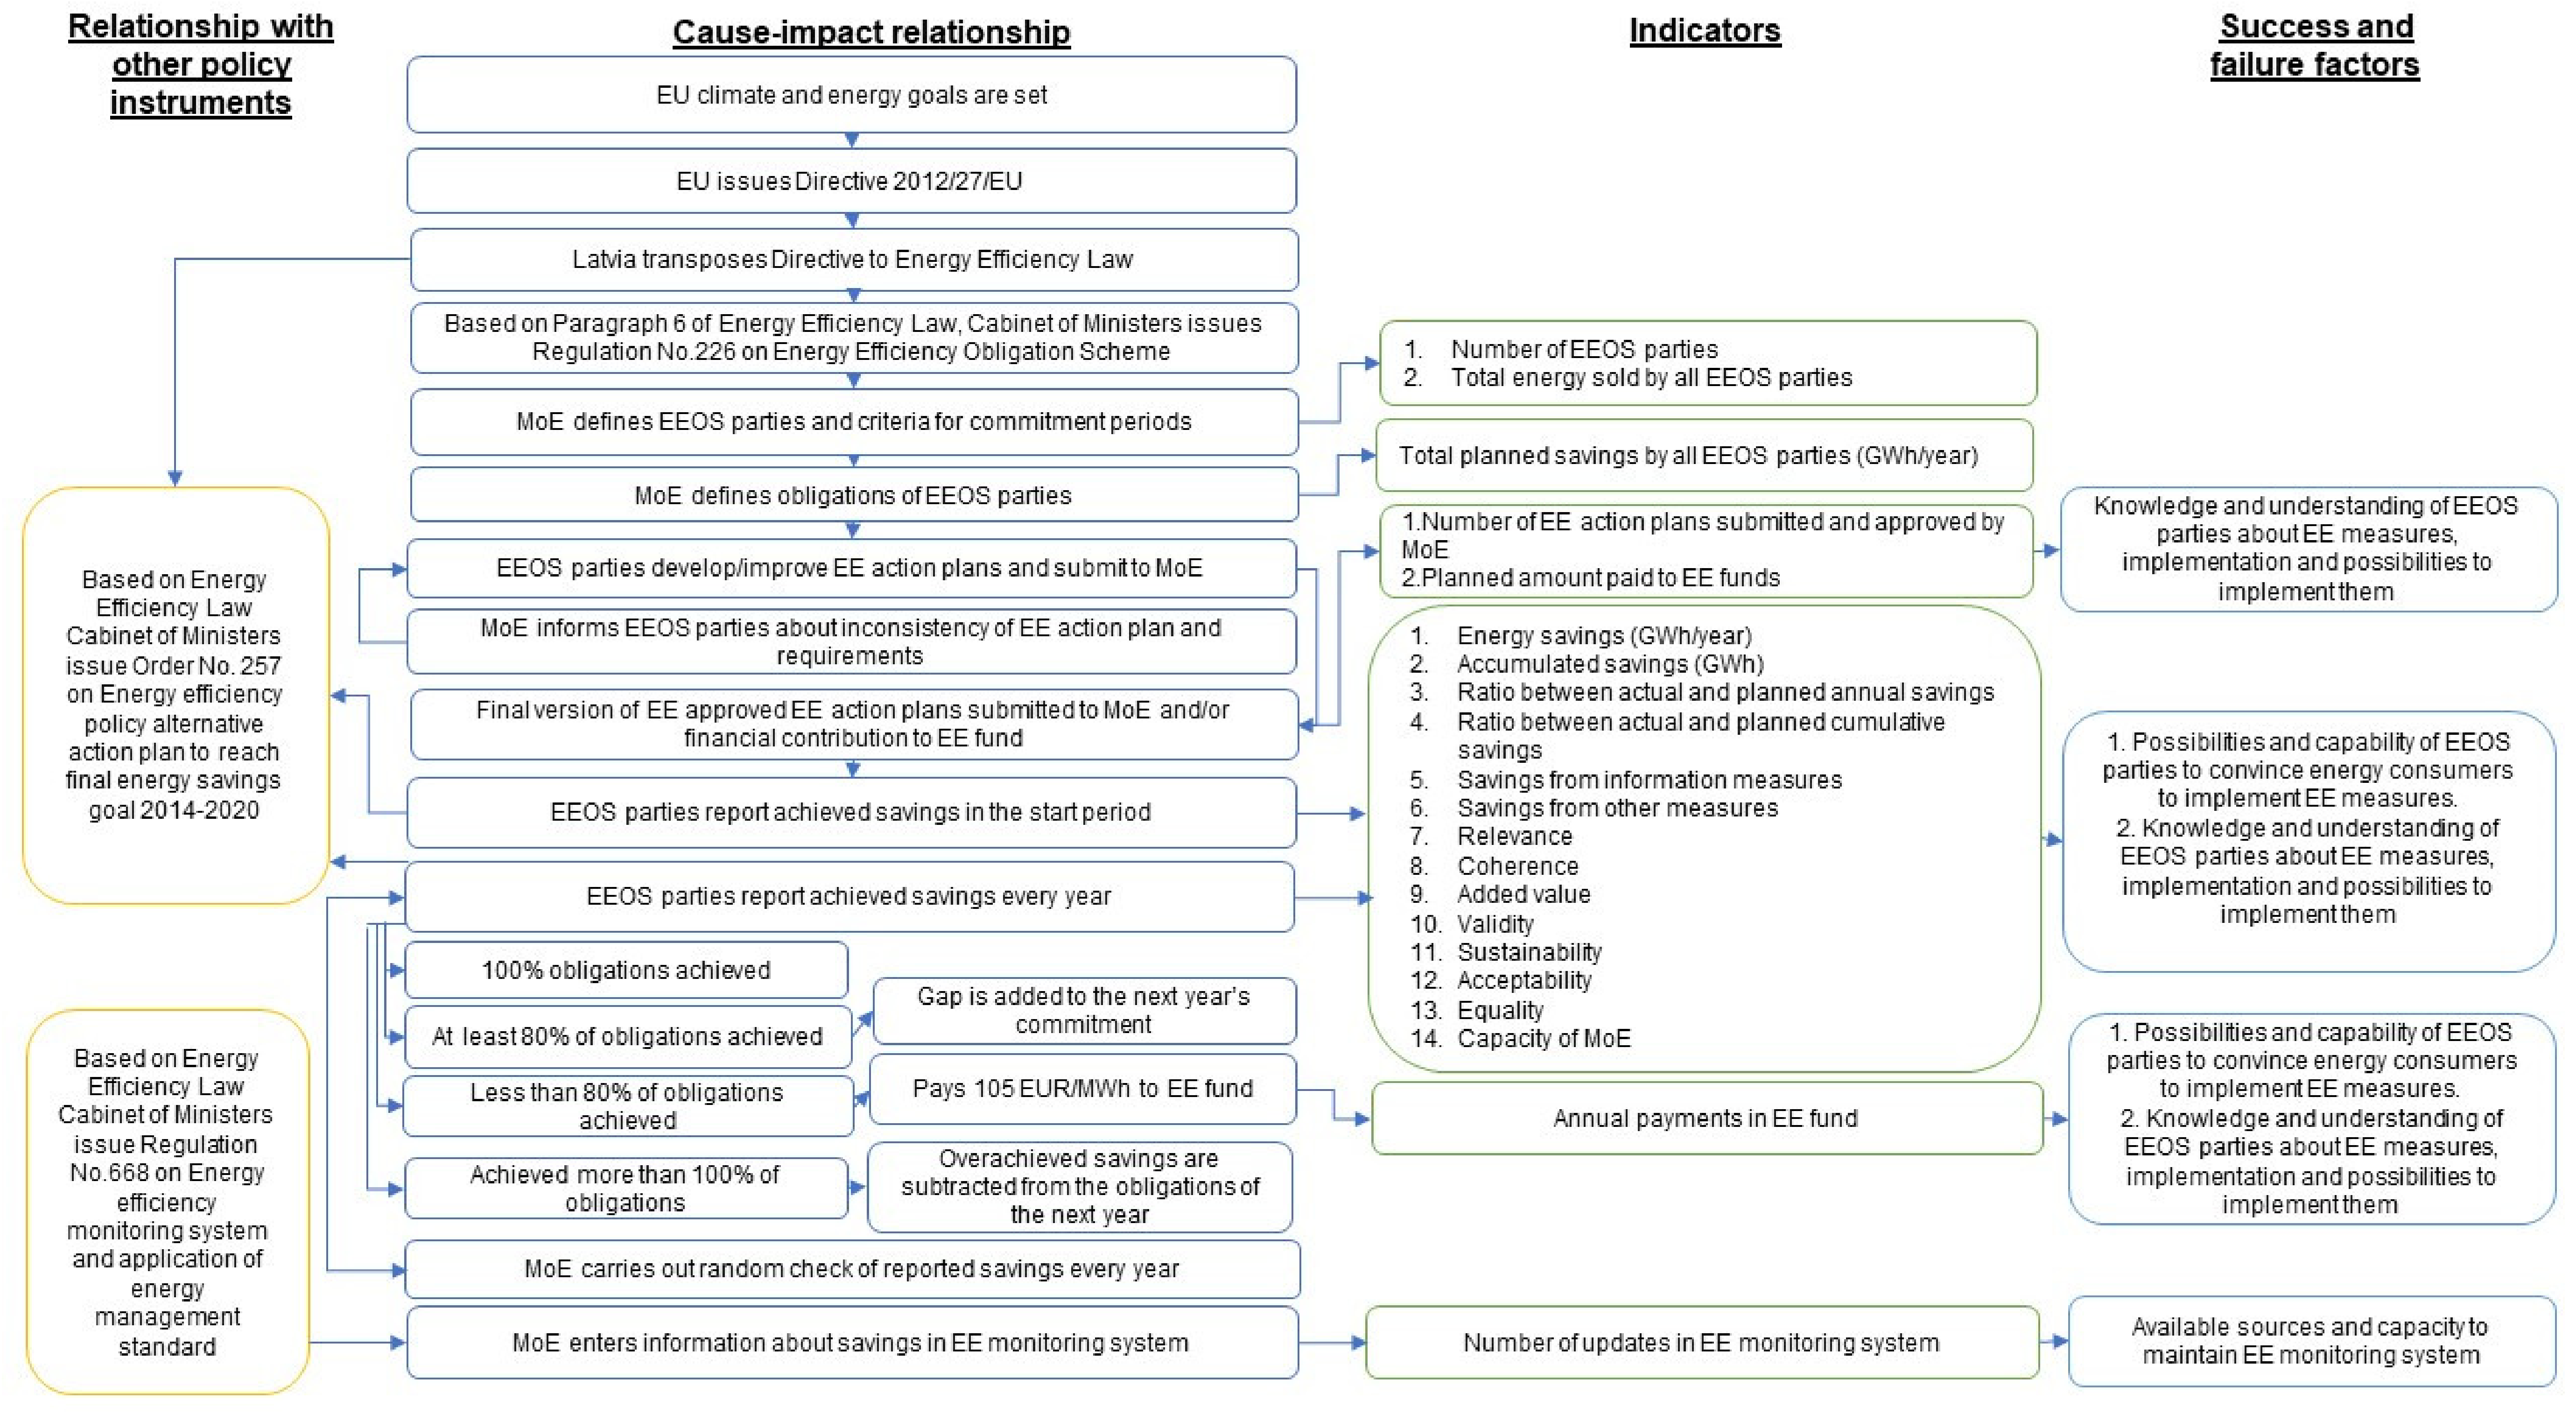
21] was used to build the policy theory for this case study, and it was detailed enough to build an explicit political theory. A theory-based policy analysis chart for the EEOS is presented in
Figure 2. The implementation process starts with the climate and energy objectives set by the EU, the requirements of which are embedded in EED. The Energy Efficiency Law takes over the requirements of the EED in Latvia. Based on the Energy Efficiency Law, the Cabinet of Ministers issued a regulation, which stipulates that the Ministry of Economics determines the EEOS obliged parties, the criteria for each commitment period, and the scope of the obligation. Companies included in the EEOS prepare a plan for energy efficiency measures and submit it to the Ministry of Economics. The Ministry performs the verification of the conformity of the plans in accordance with regulations and, if necessary, informs the participants regarding the non-compliance of the plan with the requirements. Parties have to resubmit the modified plan of measures and/or the number of contributions to the Energy Efficiency Fund. This is followed by a report from EEOS parties to the Ministry of Economics on the energy savings obtained during the starting period. Each year, EEOS parties report to the Ministry of Economics on the savings achieved. The Ministry of Economics has to insert information regarding the annual savings into the Energy Efficiency Monitoring System and has the right to perform an audit of the reported savings.
For the most crucial cause–impact relationship, indicators are established to measure whether the cause–impact has occurred and measure whether the policy measure is that which caused the changes. Success or failure factors increase or decrease the values of the indicators. The number of participants and their total amount of energy sold (GWh/year) are used as indicators for the analysis of the participants and criteria included in the EEOS during each commitment period. The amount of energy savings planned by participants (GWh/year) indicates the EEOS party’s duty. The number of energy efficiency plans approved by the Ministry of Economics and planned contributions to the Fund describes the process efficiency. It also indicates what the obliged parties carry out as related to the EEOS obligation and what part of their obligation they entrust to the Fund. The knowledge and understanding of the EEOS party about energy efficiency measures and the possibilities to implement them is a factor of success or failure, which affects the values of both indicators. Two indicators are used to assess the savings of the starting period: annual reduced energy consumption and accumulated savings during the starting period. Similarly, failures/successes are the knowledge of the EEOS party. For an analysis of the savings reported annually by EEOS parties, several indicators can be used: energy savings (GWh/year), accumulated energy savings (GWh), the ratio of the actual annual energy savings to the expected, estimated savings from awareness-raising activities, estimated savings from other measures, and the amount of planned investment. The values of these indicators are influenced by two success/failure factors: the capability of EEOS parties to convince energy end-users to implement energy efficiency measures and the knowledge about energy efficiency measures and how to implement them. The annual contribution to the Fund reflects the dynamics of the contributions.
The Ministry of Economics controls the reported savings on a random basis, and this process is characterized by the number of reports checked. Therefore, success or failure depends on the resources and capacity available to carry out the verification [
33].
The bottleneck in the EEOS scheme is the possibilities and capabilities of the EEOS parties to convince energy end-users of the implementation of energy efficiency measures, as well as the knowledge, understanding of energy efficiency measures and the possibilities to implement them.
3.3. Effectiveness
Three main metrics are used to measure and report energy savings in EEOS, namely cumulative savings, lifetime savings, and annual incremental savings. Deeming of savings over a stated period is commonly used in EEOS in Europe, Australia, and in some cases in the US [
13].
In December 2019, information published on the Ministry of Economics website showed 15 EEOS parties in Latvia. Nine parties sell energy to households and small- and medium-sized enterprises. Most of the savings planned by EEOS depend on the most significant power market participant, state-owned utility Latvenergo.
In the Report on Progress Towards the National Energy Efficiency Target for 2020 [
25], the estimated new and cumulative savings achieved by the EEOS during the starting period (2014–2017) are presented (see
Table 1). Estimated cumulative savings obtained during starting phase are 68% higher (329.2 GWh) than the cumulative savings planned for 2020 (234 GWh).
Interviews of EEOS parties show that the majority of savings are gained through “soft” or information and educational activities, and only a minor part of annual new savings come from the “hard” energy efficiency measures implemented by consumers. The responsible parties have not contributed to the Energy Efficiency Fund. The estimated breakdown of actual measures by a group of measures is:
Information and educational activities (representing around 95% of total savings): information in mass media, seminars, individual consumer advice, participation in exhibitions, seminars, festivals, etc., home page information, e-mails;
Sale of energy-efficient technologies in an internet store (representing around 5% of total savings) as an interest-free loan; direct sale of energy-efficient technologies to energy consumers through a distributed payment, by concluding an agreement that an EEOS member will report energy savings.
In assessing the possibilities and capabilities of EEOS parties to convince energy end-users of the implementation of energy efficiency measures, the EEOS parties provided the following information:
Perform surveys of the target audience on the main reasons for selecting an energy efficiency measure and then take targeted actions based on the results of the surveys. Surveys show that major barriers are related to costs and a lack of information;
General marketing techniques are used to promote energy efficiency measures;
Energy-efficient products are offered for a distributed payment on the home page or directly to customers.
The expertise, understanding, and feasibility of energy efficiency measures and their implementation significantly impact developing and implementing a plan for energy efficiency measures. The interviews indicated that the EEOS parties had employed persons who have expertise in energy efficiency, thereby reducing the risk of not reaching the target. Therefore, decisions are based on cost-efficiency.
In 2019, the Ministry of Economics reported that the functions of administration of the EEOS are not fully achieved because of the lack of capacity [
25]. All reports received from EEOS parties are being compiled as far as possible, but no qualitative and detailed evaluation and analysis of these reports has been carried out. Furthermore, no reports on the success or failure of the EEOS have been prepared and published. It also revealed a lack of feedback from the Ministry on the reports and revisions, if needed. The report concludes that the capacity of the Ministry has to be increased. In December 2019, the monitoring function of EEOS was transferred to the Latvian State Construction Control Bureau.
3.4. Efficiency
The cost of saved energy is a typical metric used to assess the energy efficiency costs across different EEOS [
34].
Although the legislation demands that EEOS parties publish reports about the costs of measures on their web pages, most EEOS parties have not done so. Information published by the energy utility Latvenergo shows that in 2018:
Costs of information and educational measures to improve energy efficiency implemented are 327,624 EUR, of which 262,100 EUR applies to households and 65,524 EUR to other users. These costs are included in the operational costs of the utility;
Households have purchased energy efficiency equipment for a total of 411,803 EUR, while the other users have spent only 4043 EUR;
The average cost of savings reported is 4.78 EUR/MWh [
26].
When carrying out a cost-effectiveness analysis for each group of measures, EEOS parties have found that the most cost-effective information measures are on social networks, e-mails, mass media, and other information measures (the advantage depends on the method of assessing the effect). In contrast, the least cost-effective is individual communication.
Data on the actual costs of the Ministry of Economics on the administration of the scheme have not been obtained.
3.5. Relevance
Interviews show that EEOS parties analyze target audience needs based on surveys, interviews, and individual communication. The household sector surveys reveal that it is essential to provide information and measures that are economically viable. On the other hand, the most valuable information for companies is the increase of capacity, economically viable measures, and available funding. The EEOS ensures that both these needs are met. They also ensure that the policy measure is adapted to technological, scientific, environmental, and social changes. This is done by following the latest technological solutions in cooperation with technology producers and analyzing changes in target audience interests.
3.6. Coherence
The EEOS has faced several serious challenges rooted in the setup of the policy measure. The dominance of information measures over technological measures is determined by the definitions set by legislation (for more details, see Discussions).
This policy measure is aligned with other legislation. Thus, energy savings from EEOS are summed up with savings from other policy measures, thus contributing to the national energy efficiency goal. If the EEOS party has to contribute to the Energy Efficiency Fund, the responsibility for fulfilling the EEOS obligation is transferred from the EEOS party to the Ministry of Economics and a state-owned finance institution “Altum”, which provides financial support for energy efficiency projects.
The double accounting of savings within EEOS is avoided by parties providing documented evidence for each implemented activity. The Energy Efficiency Monitoring System ensures the double accounting of savings with other policy instruments outside EEOS.
3.7. Added Value
EEOS parties see the added value of this policy measure as a trigger in changing other habits of energy end-users, such as green thinking, reducing waste, etc. They also noted that boosting energy efficiency increases customer loyalty to the EEOS’s parties, which is a critical aspect of the market competition.
3.8. Complementarity
The introduction of the EEOS was significantly hampered by poor communication from the Ministry of Economics side. Many important aspects were not described sufficiently. As a result, the legislative documents were widely interpreted by EEOS parties. For example, the methodology for evaluating information campaigns was published only at the end of 2018. The lack of feedback from the Ministry of Economics after the approval of the initial plans confused the EEOS parties. There was no information available on the overall progress and data of the implementation of the EEOS. The Ministry also did not provide information on whether the parties’ performance complies with the requirements for energy efficiency measures to achieve Latvia’s overall objective. The legislation does not provide the procedure for revising a savings report, i.e., whether the report has been approved or corrections are needed. This led to the situation when the EEOS parties were not provided with information on whether the activities carried out were in line with the overall objectives and if any adjustment has to be made for further activities.
3.9. Equality
EEOS parties indicate that they focus on all households under the EEOS scheme. No special attention is paid to fuel poverty. Costs for information measures are included in the operating costs of EEOS parties, thus impacting overall tariffs. However, due to the low values of cost efficiency of measures, the impact is marginal. If the large consumers request information on energy efficiency measures, the EEOS parties provide this information. The EEOS parties ensure that information is provided in Latvian, Russian, and English.
3.10. Sustainability
The sustainability of this policy measure depends on the capacity of each EEOS party to continue this measure. For example, the energy utility Latvenergo has been operating an Energy Efficiency Centre for the last two decades and would continue to deal with energy efficiency issues without the EEOS. Other EEOS parties also confirm that the resources invested in human resources during the first phase of EEOS and accumulated knowledge would be applied further. However, smaller retailers with insufficient resources would suspend further energy efficiency measures if the EEOS were to be discontinued.
3.11. Compliance
EEOS parties mentioned that the policy measure is being seen more and more positively as energy efficiency becomes an integral part of life. The change of perception about energy efficiency is experienced within the EEOS obliged parties as increased interest and awareness among employees. If the EEOS party has fulfilled its obligation before the deadline, it continues energy efficiency activities. The EEOS parties have observed that the interest in energy efficiency is increasing when energy price increases.
3.12. System Dynamics Model and Simulation Results
The EEOS model includes several sub-modules developed based on the Energy Efficiency Catalogue. In this study, sub-models were developed for the most popular measures used in the starting and first phases of EEOS in Latvia: one-time or single publications in mass media, one-time or single informative e-mails, e-mail campaigns, mass media campaigns, and individual consultations. Information about energy savings from applying any particular energy-efficient technology is considered part of the information activities. Purchase of any energy efficiency technology directly from the EEOS parties, e.g., light bulbs, is not considered in this model because the costs for bulbs are 100% covered by the consumers and are not included in the costs of EEOS parties. However, the model has a general sub-model for any energy efficiency technology, which can be easily updated with any technology provided in the Energy Efficiency Catalogue.
The model is developed to assist both EEOS participants and policymakers in determining which activities to carry out if different parameters are changing over time. The stock and flow structure of the mathematical model is supplemented with a free access Internet-based interface that can be used as a simulation tool by any EEOS party or policymakers. The tool can also be used as an Interactive Learning Environment.
The structure of the model is built as goal-seeking: the model searches for the most cost-effective solution to close the gap between the savings target set by the legislation for EEOS participants and the actual savings generated by the model. The target function for the optimization is defined as the minimization of cumulative total costs over cumulative energy savings (EUR/MWh). The dependent parameter is the size of the target audience for different measures for information and education activities. The model has a logit function, which is used to calculate the share of each measure in the entire set of measures based on the cost-effectiveness, taking into account limitations set for different activities.
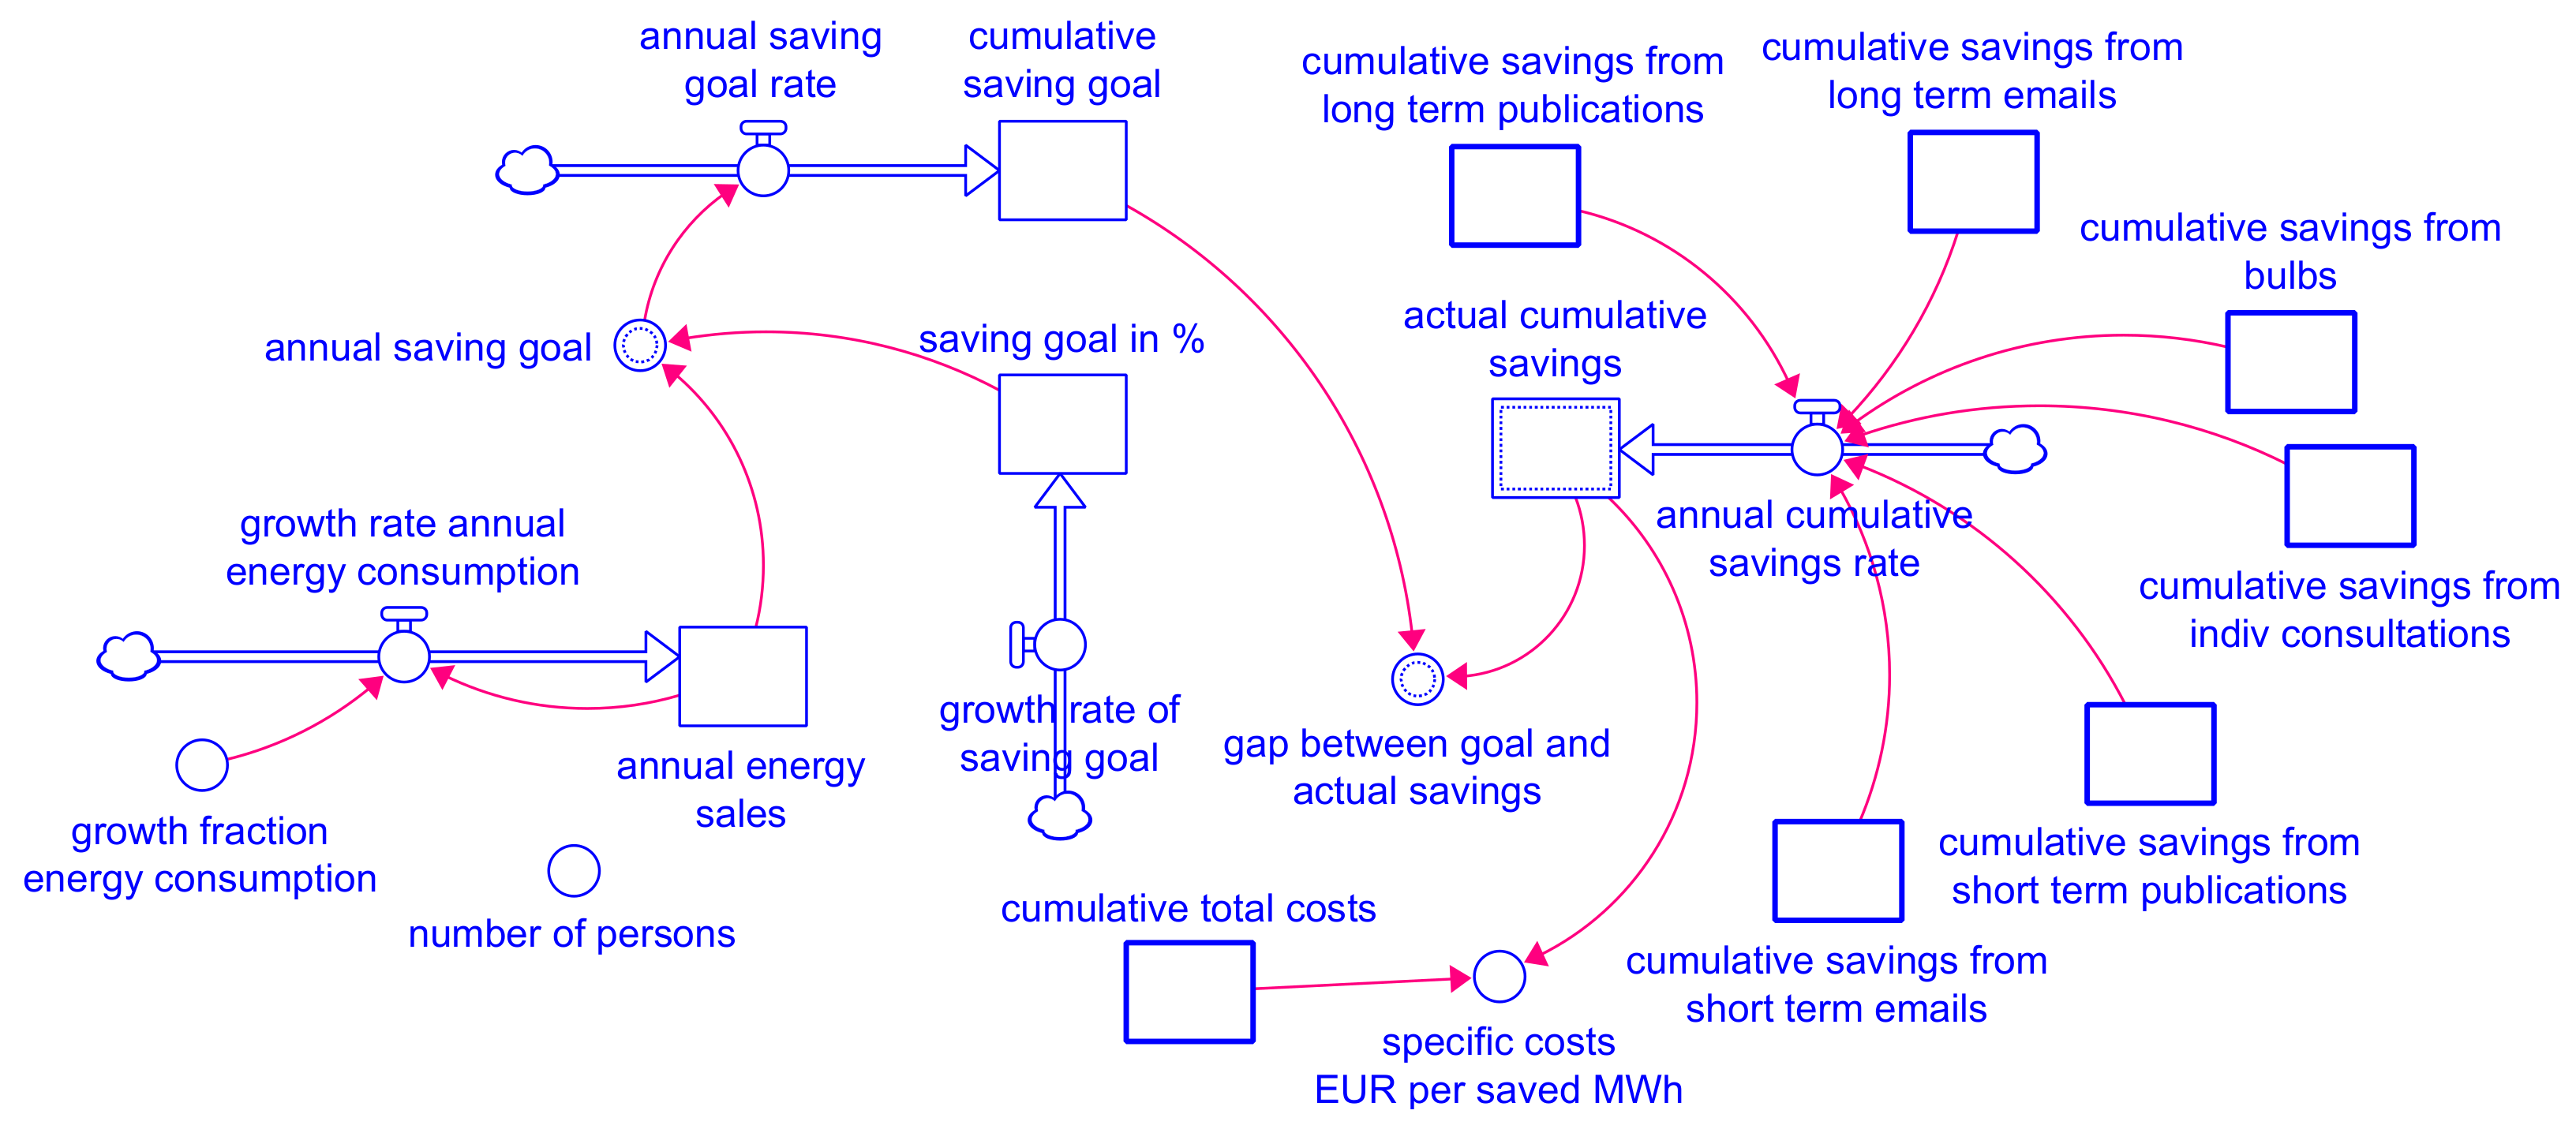
Figure 3 shows the stock and flow structure of the savings module, which includes the cumulative savings goal that depends on the amount of energy sold and the savings goal set by the government. The actual cumulative savings accumulate over the years as the sum of savings delivered by individual measures. The model then calculates the gap between cumulative saving goal and actual cumulative savings. The savings goal can be increased or decreased by changing the growth rate. The annual energy sales can also be increased or decreased by adjusting the growth rate fraction.
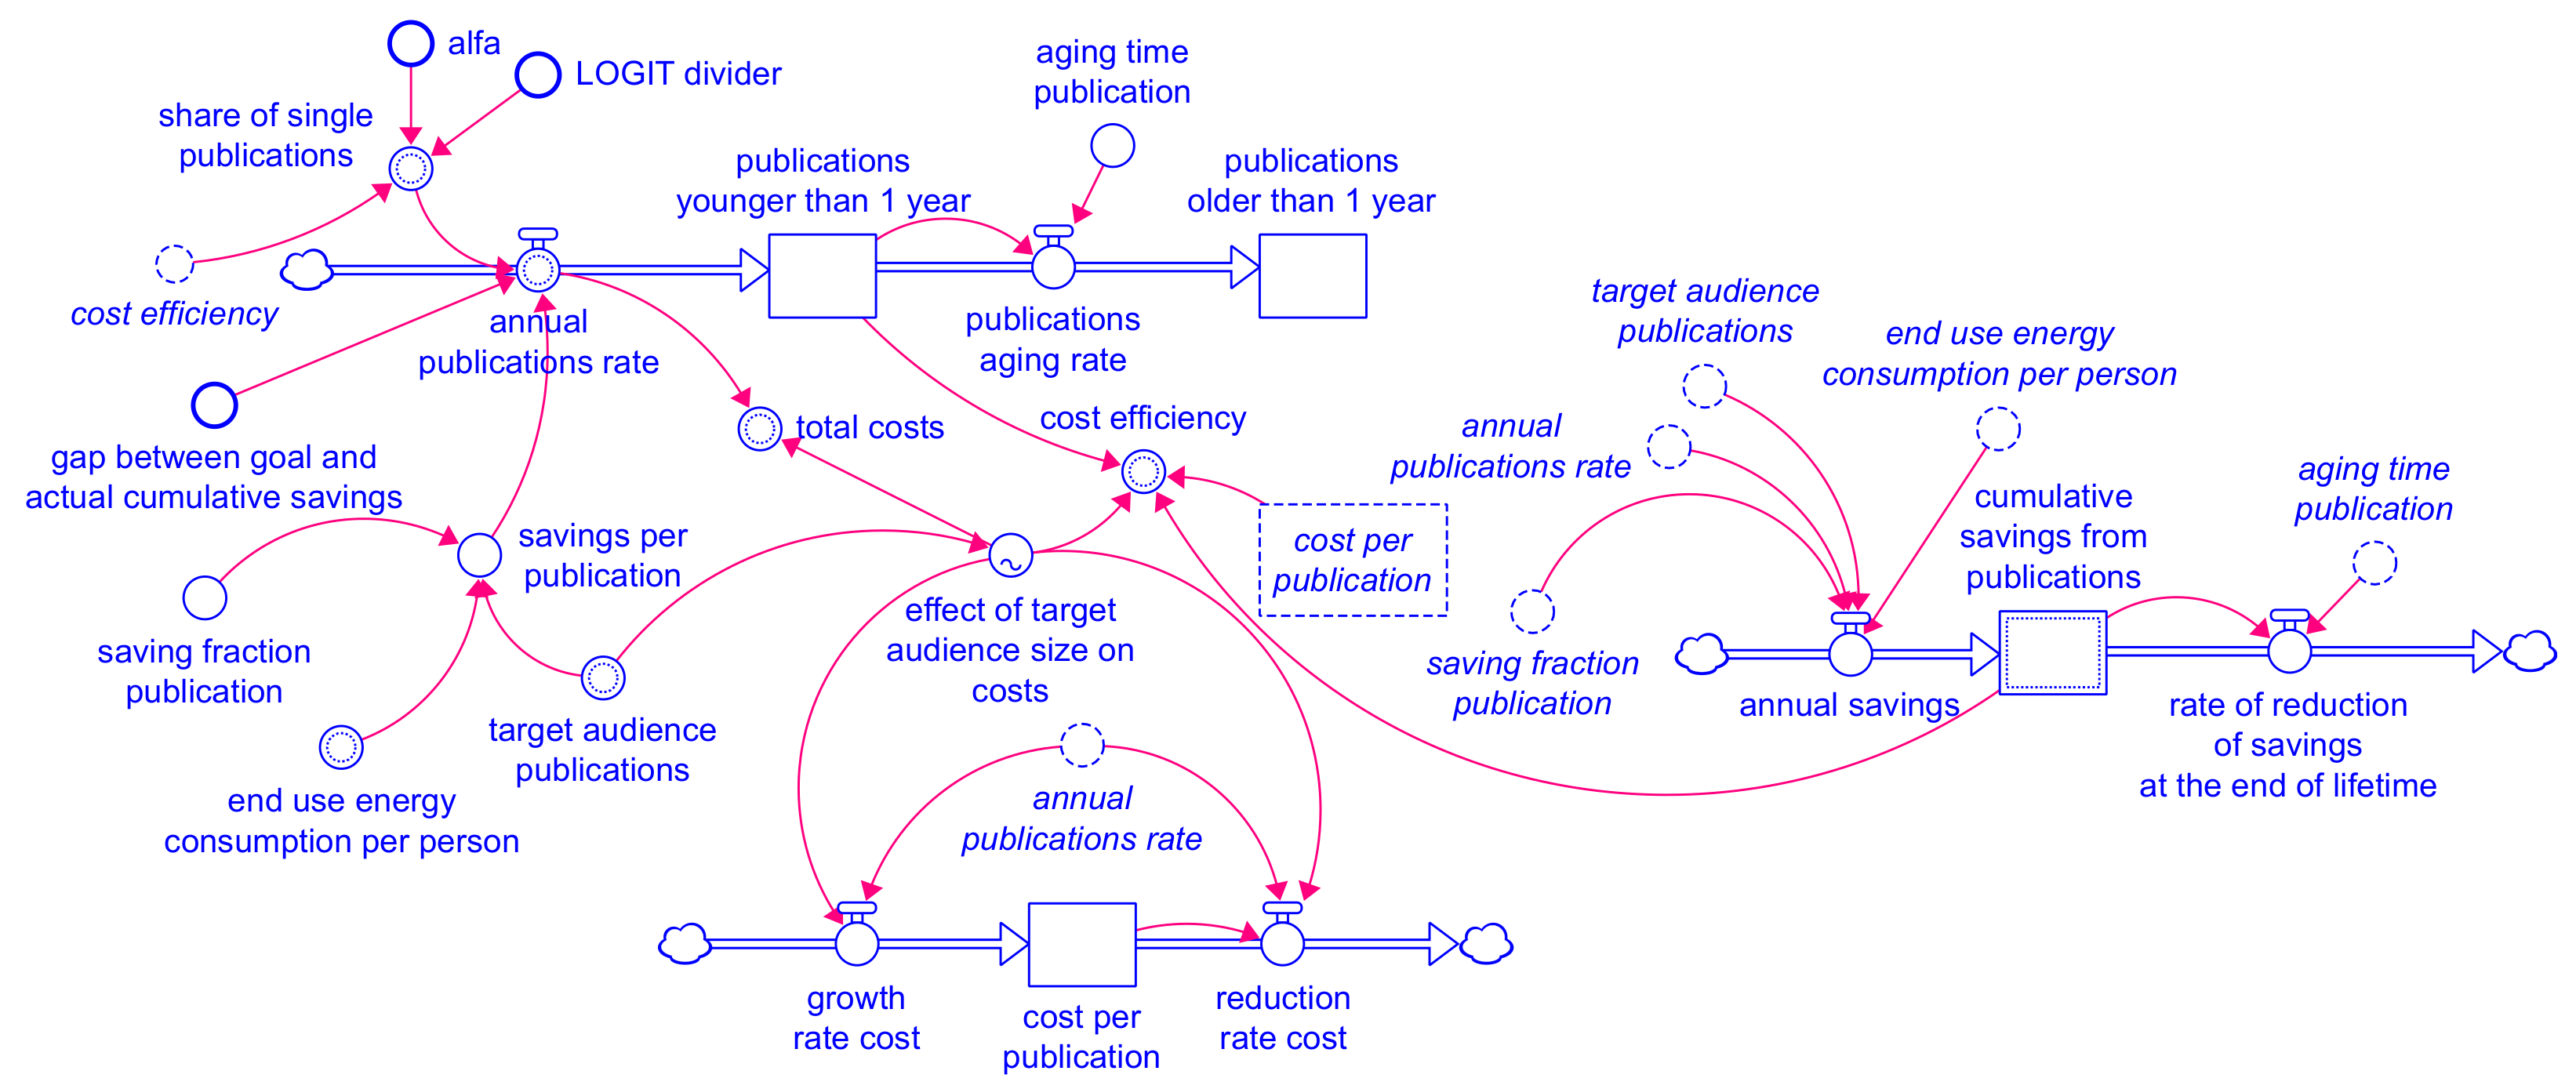
Figure 4 shows the stock and flow structure of the one-time publication in the mass media module. It includes the savings of a single publication, costs, the size of the target audience, its impact on costs, and the impact of the measure on the savings target. The values of these parameters can be changed during the application of the model. The logit function is used to calculate the share of a particular measure in the overall target. The Alfa value used for the logit function can be adjusted. The same stock and flow structure is used for other types of information activities. For example, both single e-mails and e-mail campaigns sub-model are supplemented with additional parameters required by the Ministry of Economics that define the opening rate of e-mails.
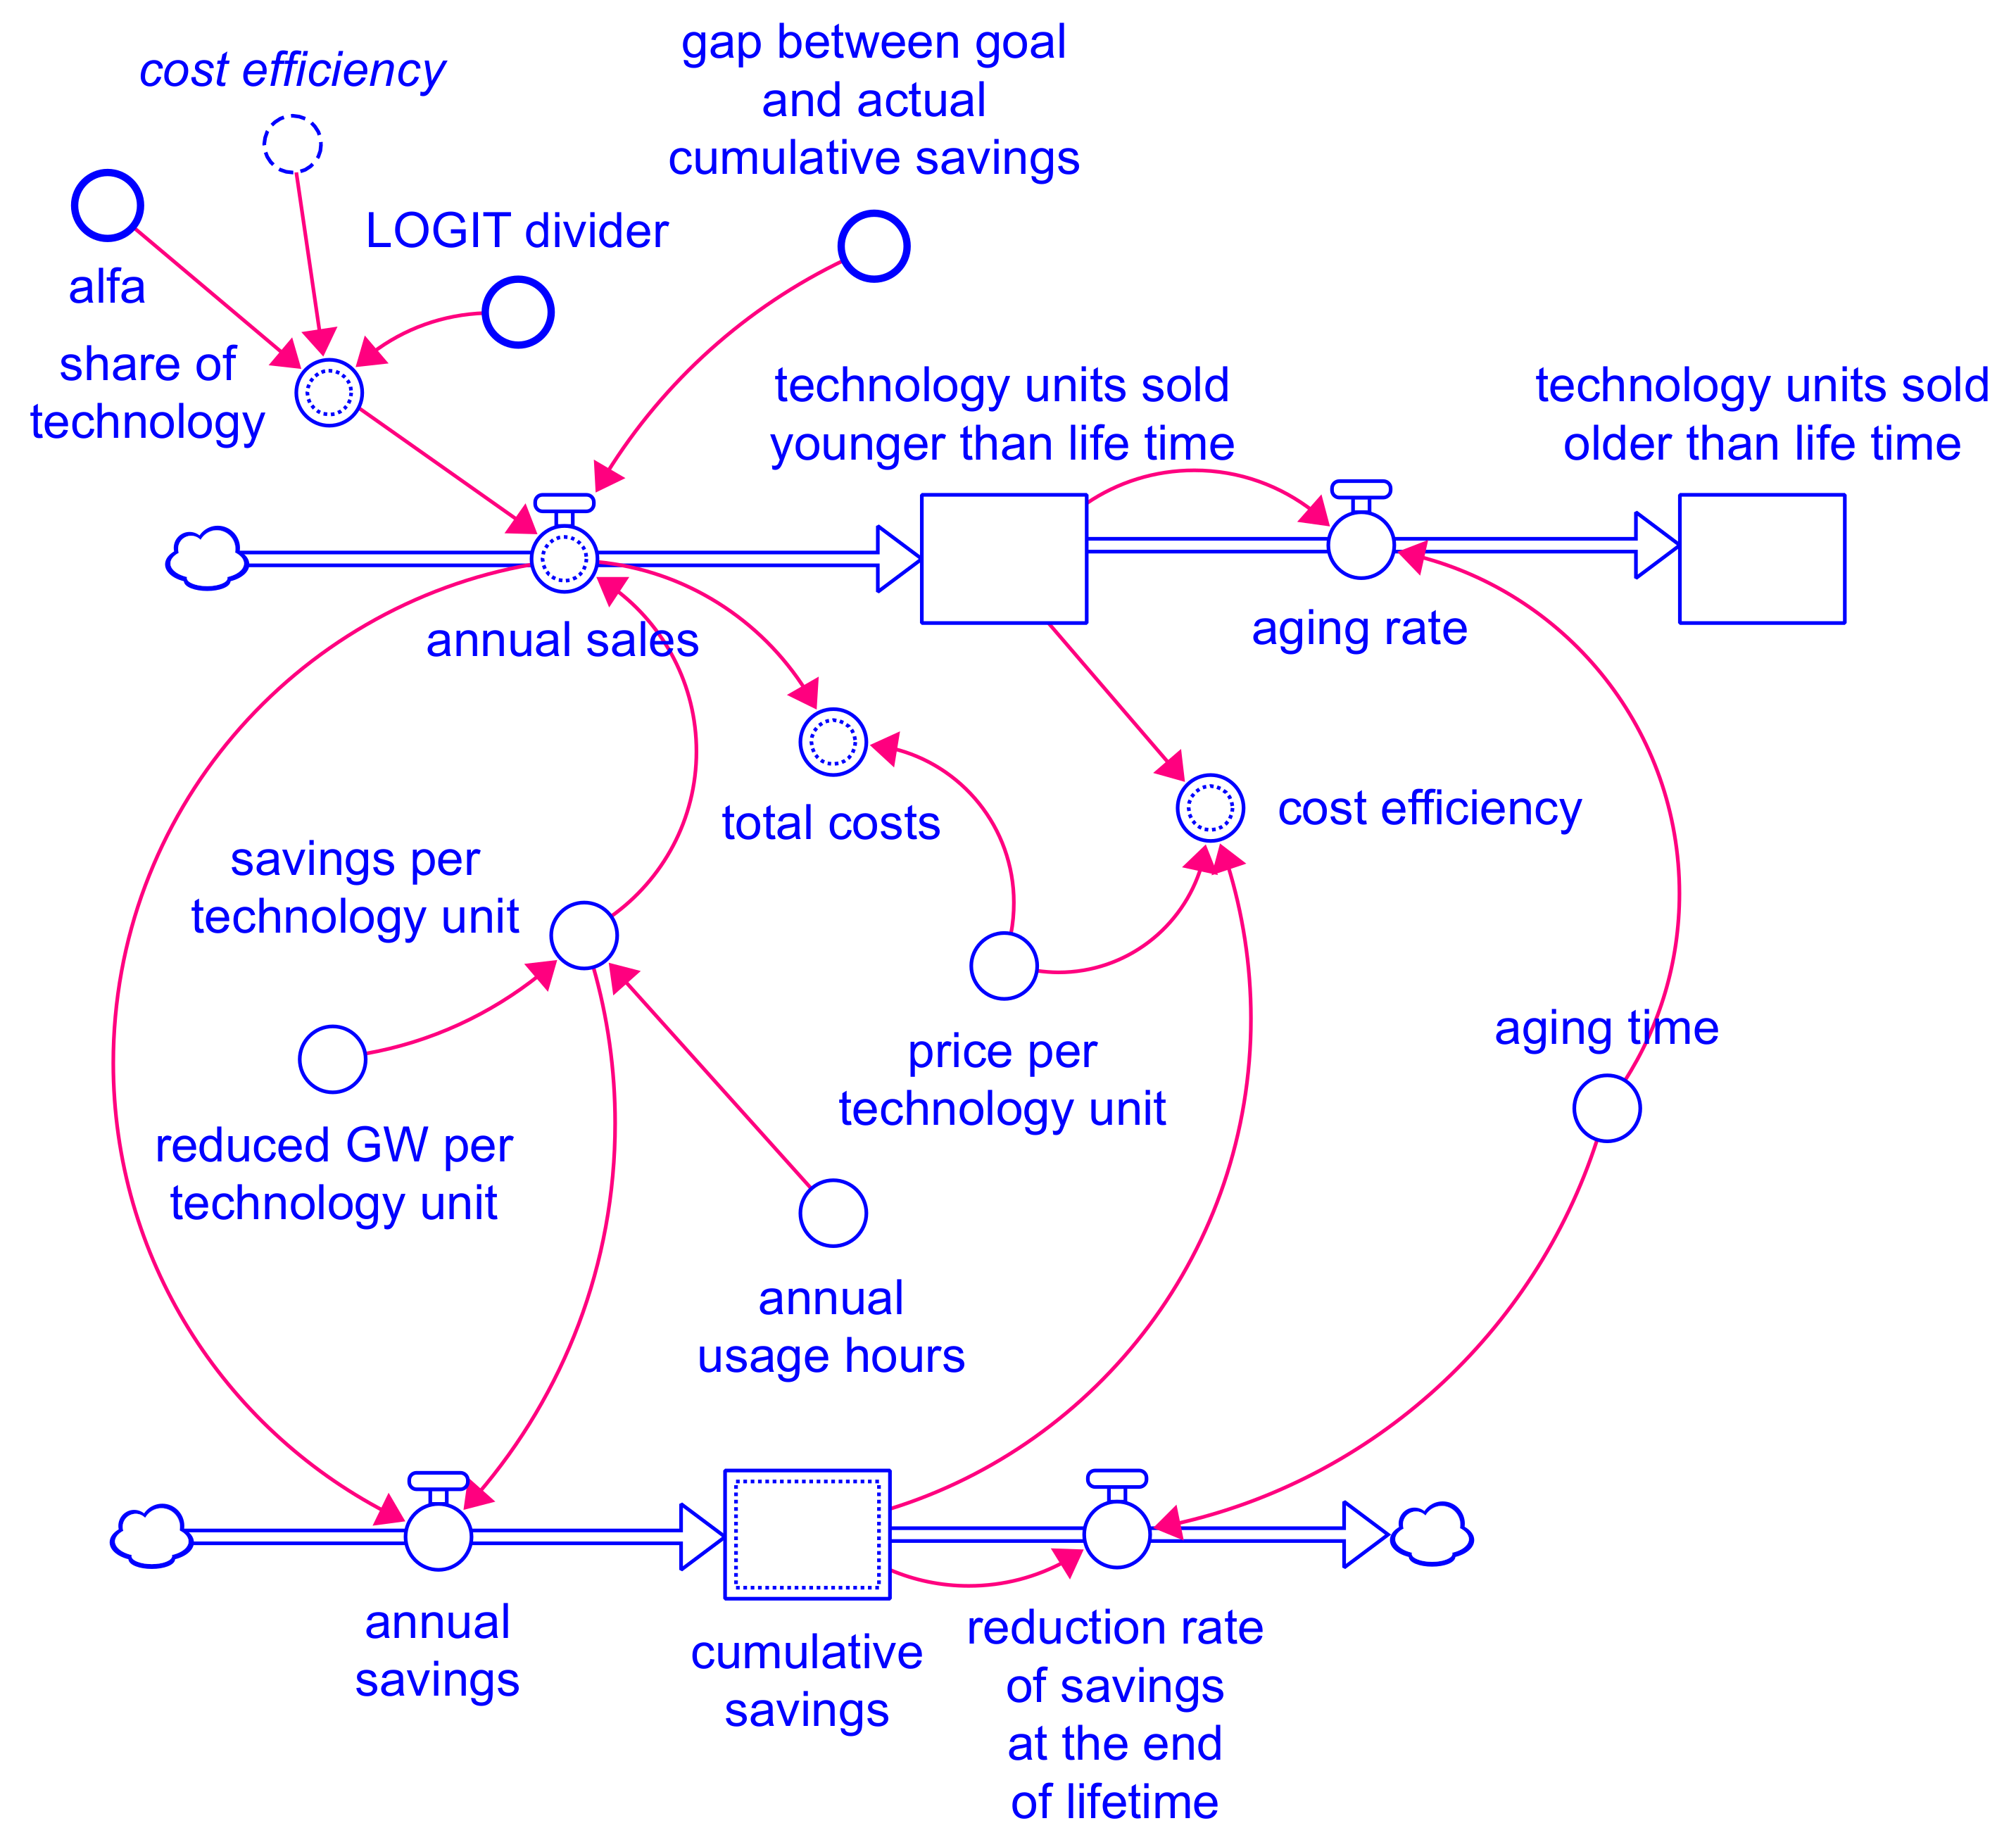
The stock and flow structure of the energy efficiency technological measures sub-module is presented in
Figure 5. It can be applied to any technology that is replaced by more energy efficient technology, including efficiency, planned savings, costs, a lifetime measure, and the share allocated to the measure from the overall target, which is calculated as the logit function.
Validation of the model was carried out for both structure and behavior [
35]. Structure validity tests included direct structure tests, structure-oriented behavior tests. Behavior tests were carried out after structure tests were finished.
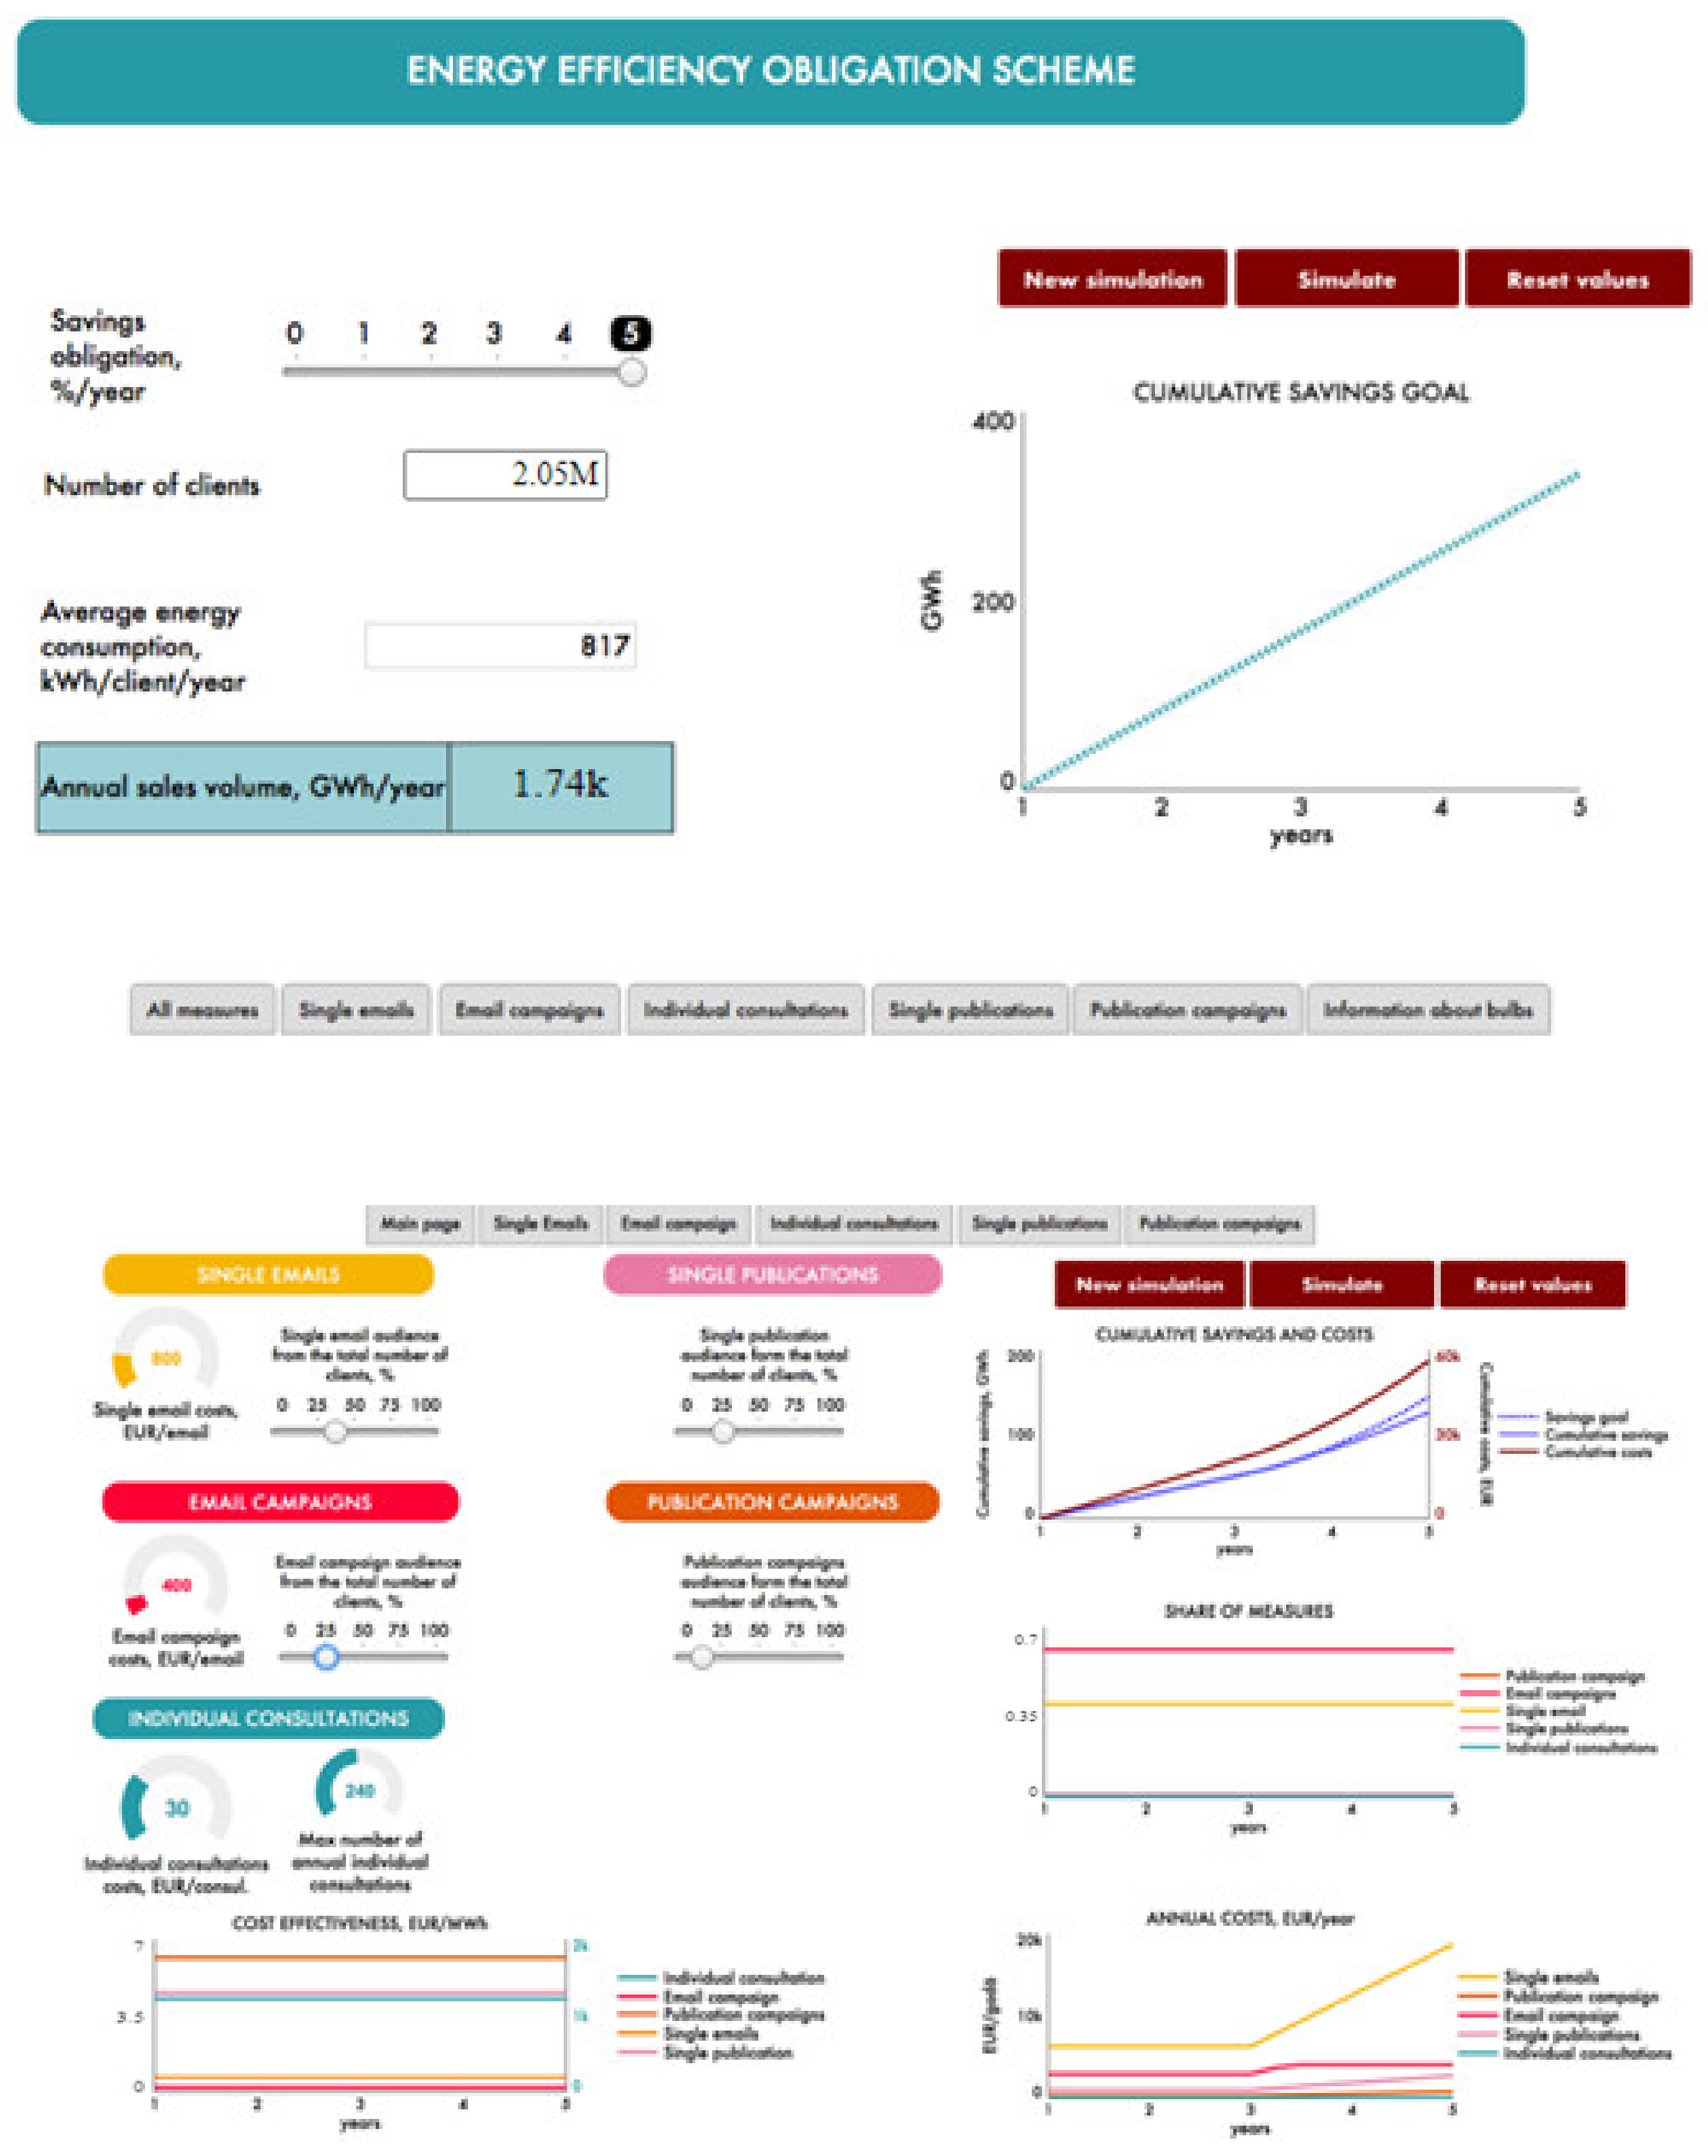
Figure 6 illustrates the main page of the free access Internet-based interface tool (
https://exchange.iseesystems.com/public/andra/eps/index.html#page1, accessed on 23 July 2021), where users can manually insert input parameters (savings obligation per year, number of clients, average annual energy consumption per client) and calculate annual energy sales volume. The illustration presents a graphical presentation of EEOS obligations.
The second page of the interface (
Figure 7) is dedicated to all measures defined by the legislation. In the first phase of the EEOS in Latvia, only information activities are applied by EEOS parties. Therefore, the interface can be easily supplemented with energy efficiency technological measures. The user can either manually find the set of measures to reach the savings goal or run the optimization model. Users can change the costs of a single unit and the size of the audience from the total number of clients per particular measure. The graphs show the dynamics of the impact of choice on cumulative savings, cumulative costs, the share of measures, cost-effectiveness, and annual costs in a live mode. Other pages of the tool provide more internal details of each of the measures.
3.13. Model Input Variables and Their Values
The saving fraction from the end-user consumption is defined by the Energy Savings Catalogue: single publication and e-mail 1%, publication and e-mail campaigns 2.5%, and individual consultation 3%. The maximum number of units per year was obtained during the interviews with EEOS parties and are 24 single publications, 1 publication campaign (5 publications per campaign), 24 single e-mails, 1 e-mail campaign (10 e-mails per campaign), 240 individual consultations. Costs per each information measure were also obtained from the EEOS parties: 800 EUR per single e-mail, 400 EUR per e-mail in the e-mail campaign, 30 EUR per individual consultation, up to 20 kEUR per single publication (depends on the target audience size), and up to 40 kEUR per publication campaign (depends from the target audience size). According to the Energy Savings Catalogue, the life cycle of information and education measures is 1 year. The e-mail opening rate is 0.2. For the simulation example, the initial values for the model are annual energy sales 1.74 GWh, energy sales growth fraction 1%/year, initial savings goal of 1.5%/year, savings goal growth rate 0%/year (year 1–2) and 1.5%/year (year 3–5). Simulation time is 5 years, equal to one commitment period for EEOS parties set by the government. A differential evolution algorithm with 10 generations and a population size of 20 is used for optimization.
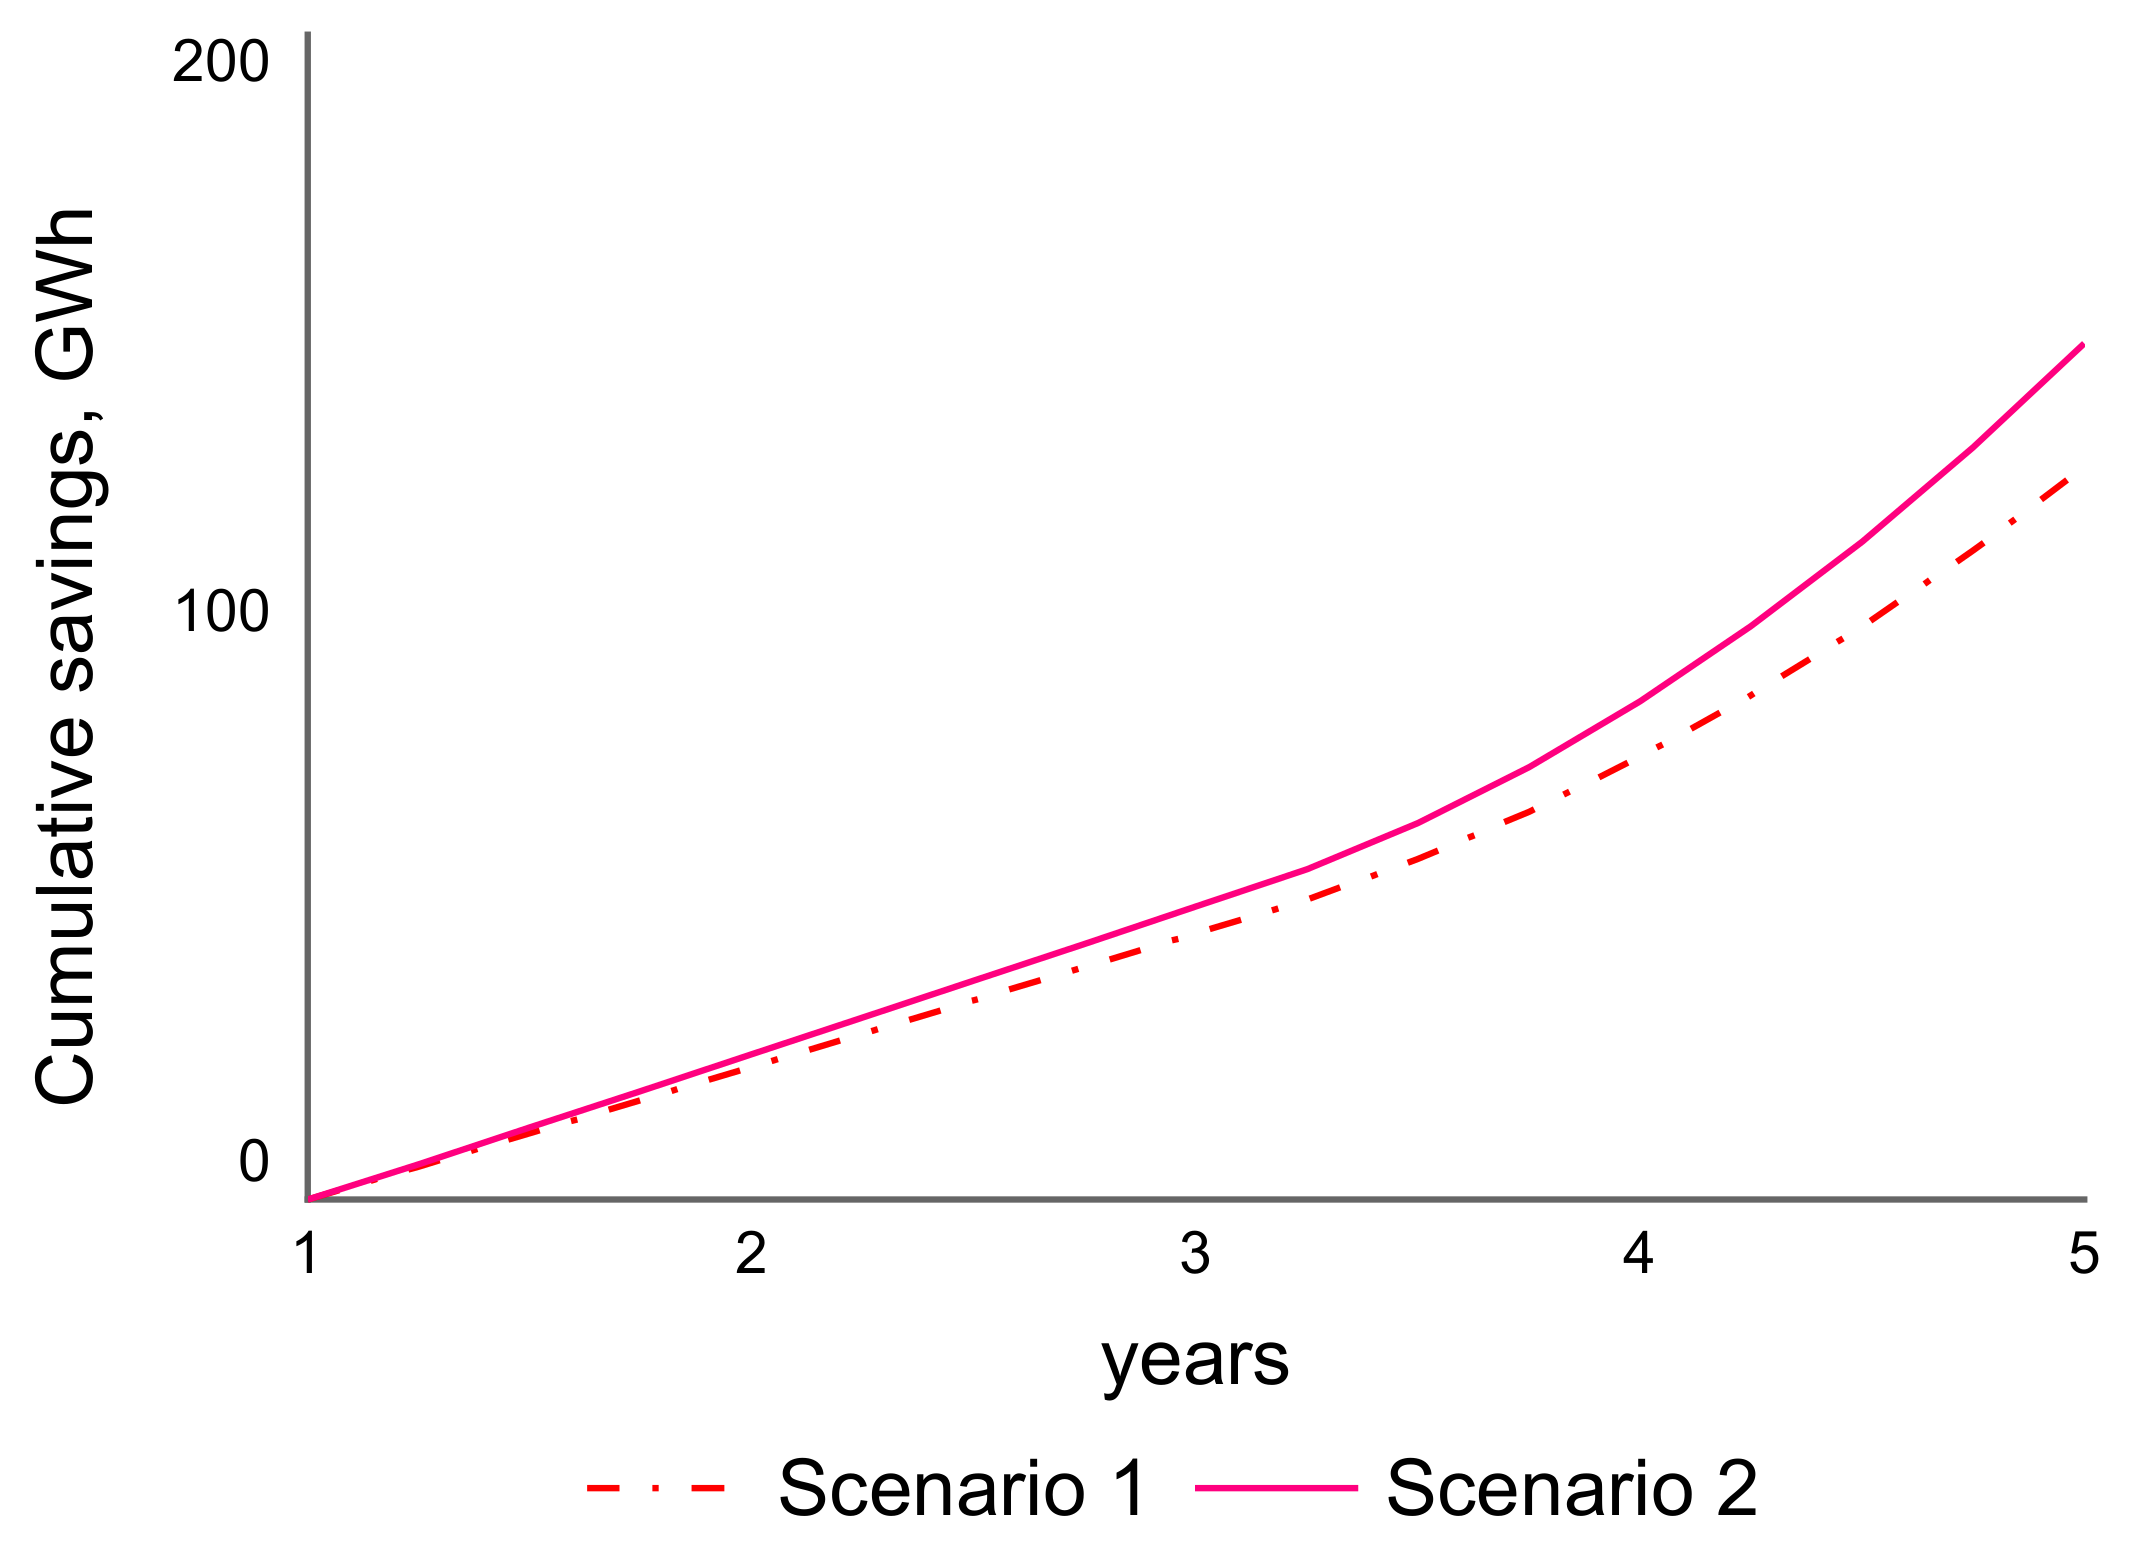
Two scenarios were developed. Scenario 1 is based on manually set input variables: share of audience from the total number of clients is 0.5 for both e-mails and publications. Scenario 2 is an optimization scenario to minimize cumulative costs for every saved energy unit (EUR/MWh) by closing the gap between savings goal and actual savings.
Figure 8 illustrates cumulative savings for both scenarios. Scenario 1 does not reach the saving goal with selected measures, but Scenario 2 reaches the goal set. Both graphs follow a linear tendency in the first two years and then change behavior as the target increases every year.
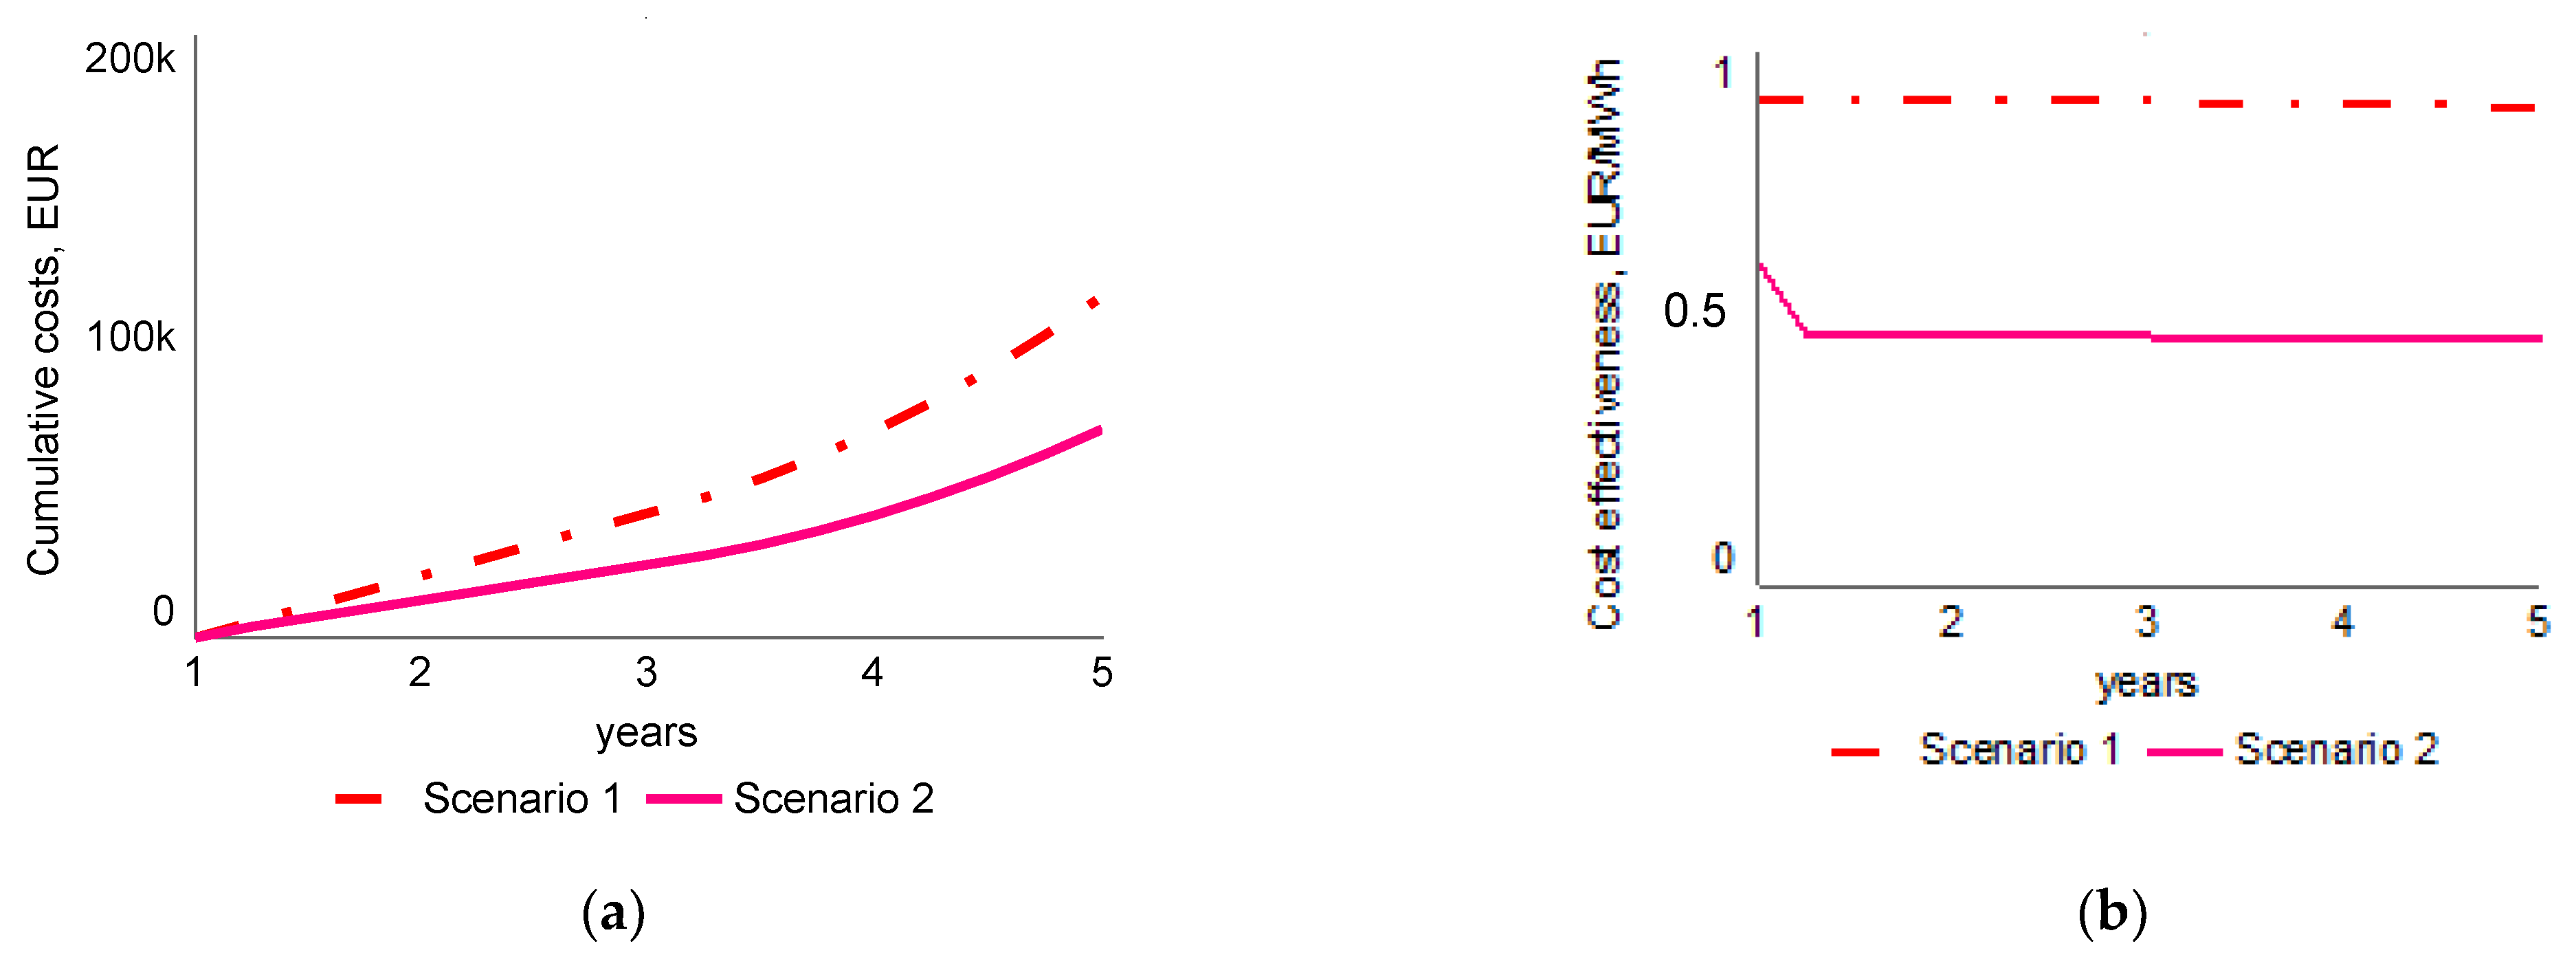
Figure 9 presents simulation results for both scenarios. In Scenario 1, cumulative costs in year 5 reach 114 kEUR, while in Scenario 2, only 70 kEUR. The cost-efficiency for Scenario 1 is 0.9 EUR/MWh, while for Scenario 2 is 0.47 EUR/MWh. In Scenario 1, single e-mails take up a 42% share (cost efficiency 0.48 EUR/MWh), followed by e-mail campaigns with a 26% share (cost efficiency 0.96 EUR/MWh), 18% for publication campaigns (cost efficiency 1.3 EUR/MWh), and 14% for single publications (cost efficiency 1.6 EUR/MWh) and no individual consultations (1200 EUR/MWh). For Scenario 2, the share of single e-mails takes up a 65% share from total information measures, and the optimal target audience size for this measure is 100% of the total number of clients, and the publication campaign takes 35% of the share with 95% of the target audience.
4. Discussion
This study adds to the existing research on the EEOS. It is one of the policy tools to enhance the diffusion of energy savings. The applied mixed research method allowed an in-depth analysis of the causal relationships and developed an understanding of how the goal set by the government was reached.
At first glance, the goal set by the Latvian government for the starting and first phase of EEOS has been reached and even overfulfilled. It might lead to the conclusion that the concerns about the implementation success of EEOS in Latvia (high risk of savings shortfalls) described by [
13] has not been met. However, arguments for failure are used by [
13], namely, that the Latvian scheme was originally neither built on the existing experience of a voluntary scheme for obligated parties nor adopted (and adapted) based on a successful EEOS design from another country, are still valid. There are several reasons for that, as described in the next sections.
4.1. Types of Energy Efficiency Measures
First, the Latvian EEOS legislation defines that costs for information and education activities can be included in the energy tariff, whereas energy efficiency measures have to be included in the bill of an individual consumer. This leads to the situation whereby retailers have a clear incentive only to do informational programs, which, given their high cost-effectiveness, will only increase average energy prices marginally. Convincing their customers to actually implement energy efficiency measures, on the other hand, means that the individual consumer would need to bear the total investment costs, which contradicts the economic interests of an energy retailer. This incentive structure explains why 95% of all measures were informational. Second, the reporting on savings relies on the deemed savings. Thus, the EEOS leads to many e-mails being sent and publications being printed, without any evidence of whether any real effect on achieved energy savings has occurred.
4.2. Saving Fraction for Different Energy Efficiency Measures
Another critical issue is the saving fraction from the end-user consumption, which is the most critical parameter for cost-effectiveness calculations. This study did not find any information source that would provide evidence on how deemed savings were defined and justified in the Energy Savings Catalogue. It limits analysis of, for example, why sending a single e-mail would induce an energy user to reduce energy consumption by 1%, while an individual consultation only induces an energy savings rate of three times as high (3%). An individual (targeted) consultation might be more effective than a single e-mail, which will likely be ignored by the vast majority of those who receive it. If the policymakers had built EEOS based on adopted or adapted successful EEOS design from another country, they would have known that information activity alone does not provide actual energy savings (see, e.g., [
36,
37]).
Moreover, no incentives are provided to Latvian EEOS parties to diffuse energy efficiency technologies that would bring actual energy savings. Behavioral and information programs or so-called “nudge” programs are the most cost-effective, but they bring relatively small savings. Financial incentives for technological energy efficiency measures are the least cost-effective but have higher energy savings potential [
20,
38].
EEOS obliged parties admitted that reaching the savings goal was partly due to reporting measures carried out during starting phase, and reaching savings obligations will become more challenging during the subsequent EEOS phases.
4.3. Limitations of the Study
Although different approaches were used to enhance the rigor of findings, this study has several limitations.
The problems related to the caveat that the data used are self-reported utility data are mentioned in the literature [
20]. However, this risk is eliminated by the reporting requirements set by the legislation, which require providing documented evidence for each measure.
Parameters for the model were obtained from EEOS obliged parties, leading to a bias in the parameter estimates. This bias was reduced by comparing the obtained data with publicly available information on the costs of information activities in other domains in Latvia.
Social desirability bias comes from the respondents’ tendency to give answers to portray themselves in a socially desirable manner. In this study, the authors tried to reduce this bias by asking probing questions to spot inconsistent answers during interviews. Recall bias was reduced by anchoring the respondent’s memory in specific events rather than asking them to recall their perceptions and motivations from memory.
The study does not include interviews with the policymakers from the Ministry of Economics due to a lack of response from the Ministry. There could be several reasons for this: lack of capacity, the high turnover rate of Ministry employees, or pluralism anxiety. An extensive study of publicly available documents from and about Ministry activities was used to substitute for the lack of interviews. Additionally, interviews with EEOS parties provided helpful information about governance issues. Still, some bias may exist.
5. Conclusions, Policy Implications, and Recommendations
Information gathered and analyzed within this study shows that EEOS implementation in the electricity retail sector in Latvia as the policy measure has reached its goal during the starting and first phases of EEOS, contrary to the concerns by researchers (see, e.g., [
13]).
EEOS is a policy tool with a stick approach as it demands companies to reach specific goals by punishing them if it is not reached. It is based on the rational choice theory, where the decision is made solely on the highest benefits. An EEOS party can choose to implement either information activities and energy efficiency measures, transfer the obligation to Energy Efficiency Fund, or pay the penalty. In the ex-ante evaluation, the Ministry of Economics projected that 50% of the total EEOS savings would be derived from information and educational measures and 50% through contributions to the Energy Efficiency Fund or by implementing the most cost-effective energy efficiency measures. The ex-post evaluation shows that around 95% of savings are achieved through information measures and the rest by introducing energy efficiency measures on the consumer side. EEOS parties do not contribute to the Fund because the cost of information measures (on average 4 EUR/MWh) is significantly lower than the amount of contributions to the Fund (70 EUR/MWh) or the penalty for not fulfilling obligation (125 EUR/MWh).
The dominance of information measures over other measures is determined by the legislation, which implies that the costs for information measures can be included in EEOS parties’ operational costs. In contrast, the costs for energy-efficient technologies should be covered solely by the energy end-users. This fact hinders the development of technological measures and the achievement of the goal with an actual reduction in consumption. Experience of other countries and scientific research shows that providing the information is an essential “nudging” measure of energy efficiency policy. However, while it changes people’s attitudes only in the short-term, it does not change their behavior. Therefore, the Ministry of Economics has to assess the share of various measures in total savings. An analysis should be carried out whether a limitation should be set on the share of information measures in total savings. In addition to that, during the next EEOS phase, other measures, such as financial incentives, should be added to information measures.
Interviews with EEOS parties revealed that the fear of punishment had triggered innovations and creativity on both positive and negative sides. On the positive side, EEOS parties have invested resources to develop new products for their customers, including applications for advice on energy efficiency, feedback-based information tools, financial tools for purchasing energy-efficient technologies, etc. They also investigate further the habits and preferences of energy end-users. In turn, this increases customer loyalty and provides EEOS parties with additional power in the market competition. However, in some cases, adverse side effects were noticed when innovation and creativity are used by EEOS parties to find ways to avoid or reduce activities but still reach the goal. Moreover, the lack of feedback from the Ministry of Economics, which administrates the EEOS, has reinforced this adverse effect, e.g., due to lack of information in the starting period, the EEOS parties were interpreting the regulatory framework differently.
Lack of feedback and cooperation from the Ministry during the implementation process has confused the meaning and necessity of this policy measure. It gives an impression that legislation has been introduced formally to meet the requirements.
This study has found several added values. Namely, the attitude, capacity, knowledge, and awareness of energy efficiency measures of the stakeholders responsible for the EEOS have improved significantly. In addition, energy consumers who received information on energy efficiency are changing their habits towards a better environment.
The Internet-based free access simulation tool developed in the scope of this study provides both EEOS parties and policymakers with valuable insights into different measures that can be applied in the EEOS.
Latvia plans to start the second phase of EEOS in 2021, and it is vital to base the next steps on what was learned during the first phase. Policymakers have to decide whether to enlarge the scope of the EEOS to all fuel suppliers in all energy demand sectors or to do it partly. Our findings suggest that obligations can be placed on all fuel suppliers in households and small and medium enterprises unless three main obstacles are removed prior to that. First, limitations on information measures have to be set. Second, financial support for energy consumers should be provided. Finally, the Ministry has to increase the capacity and ability to communicate and support EEOS parties actively. This will be in line with experience gained in other countries that have successfully implemented an EEOS, such as France, Denmark, UK, USA, Italy, and Australia [
5,
6,
8,
9,
10].


