1. Introduction
Air pollution in general is among the causes contributing to climate change, causing an environmental risk to human health [
1]. The main cause of climate change is the greenhouse effect. Many of these gases occur naturally, but human activity increases the concentrations of some of them in the atmosphere, particularly carbon dioxide (CO
2) and nitrogen oxides. Other greenhouse gases are emitted by human activity in smaller quantities. The combustion of coal, oil and gas produces carbon dioxide and nitrogen oxide, among the main causes of emissions of these pollutants. This is closely linked to a number of sources including vehicle traffic [
2].
Globally, governments of countries have taken a number of actions to decarbonize and thus reduce CO
2 [
3]. Among the sources are vehicles and therefore Europe has promoted the diffusion of sustainable and resilient forms of mobility that do not incentivize the use of the private vehicle and also the diffusion of motor and electric vehicles. This work focuses on one of the European countries that currently have the highest rates of pollution from vehicle traffic, namely, Poland. Since 2016, Poland has been trying to implement climate change and warming measures that are amplified compared to Europe [
4].
Several measures have been proposed and included in local policies considering the achievement of small-, medium- and large-scale objectives in terms of both demand and transport supply. In general, the former is related to travel habits, modal choices and travel frequency, and the latter is related to infrastructure and services.
The development of electromobility implies new approaches and the need to create new solutions in the field of energy management and vehicle operation [
5].
Within these standards, electrification of road transport is encouraged to ensure the eventual full decarbonization of the sector. There are a number of national measures that can help reduce demand and drive the shift to cleaner modes. Measures include shifting car passengers to trains, car-buses, walking and cycling; improving road freight logistics and shifting road freight to rail; and increasing car and bus ridership. These strategies are in line with the Paris Agreement on Climate Change and the 2030 Agenda for Sustainable Development.
This can facilitate the fundamental changes needed to achieve the objectives of the European Green Deal. The EU’s goal is to reduce greenhouse gas emissions by at least 55% by 2030 and achieve climate neutrality by 2050 [
6,
7]. The bottom-up approach allows for a series of actions to be implemented from the local context (micro scale) while respecting European standards and therefore this can contribute, together with actions on the meso and macro scale, to the achievement of the set objectives. Furthermore, it is important to highlight the studies that focus on the assessment of indicators related not only to the sustainability of cities but also to resilience, especially after the outbreak of the COVID-19 pandemic event [
8,
9]. In general, the estimation of pollutant emissions from all road transport in a given region over a given period of time can be assessed both through the use of sensors and in a preventive manner through the use of emission models and the comparison of scenarios through simulation tools [
10,
11].
The recent pandemic reduced these concentrations in some months of the 2020s due to the lockdown. At the planning level, the study of environmental impacts is covered in the sustainable urban mobility plans (SUMPs) [
12] by defining the following objectives:
ensure transport options for all citizens to access key destinations and services;
improve safety conditions;
reduce air and noise pollution, greenhouse gas emissions and energy consumption;
improve the efficiency and cost-effectiveness of passenger and freight transport;
contribute to improving the attractiveness of the territory and the quality of the urban environment and the city in general to the benefit of citizens, the economy and society as a whole;
short-, medium- and long-term time frames are defined for impact mitigation. On an urban scale, it is essential to consider certain spaces such as intersections where vehicle flow is often concentrated during peak hours and where it is necessary to intervene to reduce the formation of vehicle congestion. In order to reduce emissions, it is therefore necessary to promote:
the direct participation of the population in the strategic choices of local authorities in order to improve the quality of life;
the dissemination of good practices from the urban scale and the assessment of possible mitigation actions in a preventive way;
to reduce the use of own means of transport [
13] and to encourage the purchase [
14], sharing [
15] or rental [
16] of new forms of low-impact mobility.
Among the intersection schemes that provide the greatest benefits not only from a safety perspective [
17,
18] but also from a level of service [
19] and emissions perspective [
20] are roundabouts. In general, roundabouts have a better impact on the environment because they reduce pollution: the elimination of traffic lights reduces the time a car is stationary with its engine running at a given point.
There is also a reduction in traffic congestion. The benefits vary depending on the layout of the roundabout and the traffic flow and its composition. However, their diffusion in Europe is not homogeneous: while in Italy they are not yet regulated, they have already appeared for several years in other European countries such as Slovenia [
21] and Poland [
22] with benefits for safety and sustainability of transport [
23]. The present work therefore focuses on the small-scale assessment of the environmental impacts (emissions) generated by different vehicle traffic scenarios in a multilane roundabout located in Rzeszow city in Poland.
The comparison with a new scheme was made by considering the turbo-roundabout, i.e., a roundabout with a high traffic density. In turbo roundabouts traffic flows run separately before entry into the roundabout and they occupy separate lanes all the way throughout the roundabout [
24].
They may not be suitable for intersections with high demand volumes exceeding 4500 vehicles per hour, and whenever the traffic flow condition is oversaturated [
25].
The physical separation of traffic lanes in turbo roundabouts allows for a reduction in points of conflict between vehicle flow and thus increases safety [
26].
Several researches state that the performance of the turbo-roundabout is strongly influenced by the traffic load of the network, the directional distribution of traffic, both at the inlet and the outlet [
27].
A preliminary study was carried out using a simulative-experimental approach adapted to one of the problems that afflict modern urban and metropolitan areas, namely, air pollution.
The objective pursued was to analyze the level of eco-compatibility of a multilane roundabout as a function of vehicle traffic and a comparison with a design scheme.
The results expressed in terms of concentrations of pollutants produced by vehicles were obtained through indirect estimation, i.e., based on a simulation centered on the measurement of parameters that influence the production of pollutant emissions such as speed, traffic flow, percentage of heavy vehicles and road infrastructure geometry. These parameters are the input data for forecasting models of emissions and fuel consumption in the form of regression formulas or software.
The extremes of the vehicle flow range were defined by considering the flow recorded in the recent pandemic period as the minimum and the peak flow characterizing the analyzed roundabout as the maximum. This work therefore focuses on an assessment of pollutant emissions from pandemic and pre-pandemic flows in two geometric schemes (a current scenario and a projected scenario) in order to investigate the extent to which road geometry can promote pollution reduction under certain conditions.
2. Methodology
The research focused on assessing the emissions produced by vehicle traffic passing through one of Poland’s multi-lane roundabouts.
The aim of the research was to compare the emissions of CO2, NOx and PM10, which arise during peak hours for the standard working day before the pandemic and for a day selected from during the COVID-19 lockdown for Poland. Therefore, the research focused on a first phase of vehicle flow data acquisition and geometric data of a multilane roundabout intersection at Rzeszow.
A design scheme, i.e., a turbo-roundabout, was then hypothesized in order to understand what benefits it could bring in terms of pollutant emissions as well as vehicle traffic. A second step of the investigation assessed how the variation of traffic volume along the ring of the two roundabout schemes can bring about a greater or lesser production of pollutants the implementation of the geometric-functional and traffic parameters; processing was performed using microsimulation software, VISSIM [
17,
28,
29]. Appropriate calibration of the VERSIT+ pollutant dispersion model allowed analyzing of two roundabout schemes (existing and projected) and finally to make some optimal considerations for the implementation of sustainable mobility strategies.
This comparison was useful for advance understand of the ranges within which it is better to replace the current roundabout scheme with the hypothetical one. The study focused on the following phases:
the collection of traffic data and vehicle composition,
the choice of the geometric design scheme to be compared with the current condition,
calibration of the micro simulation model,
data processing,
analysis of the results related to the concentrations of the main pollutants.
2.1. Case Study Description
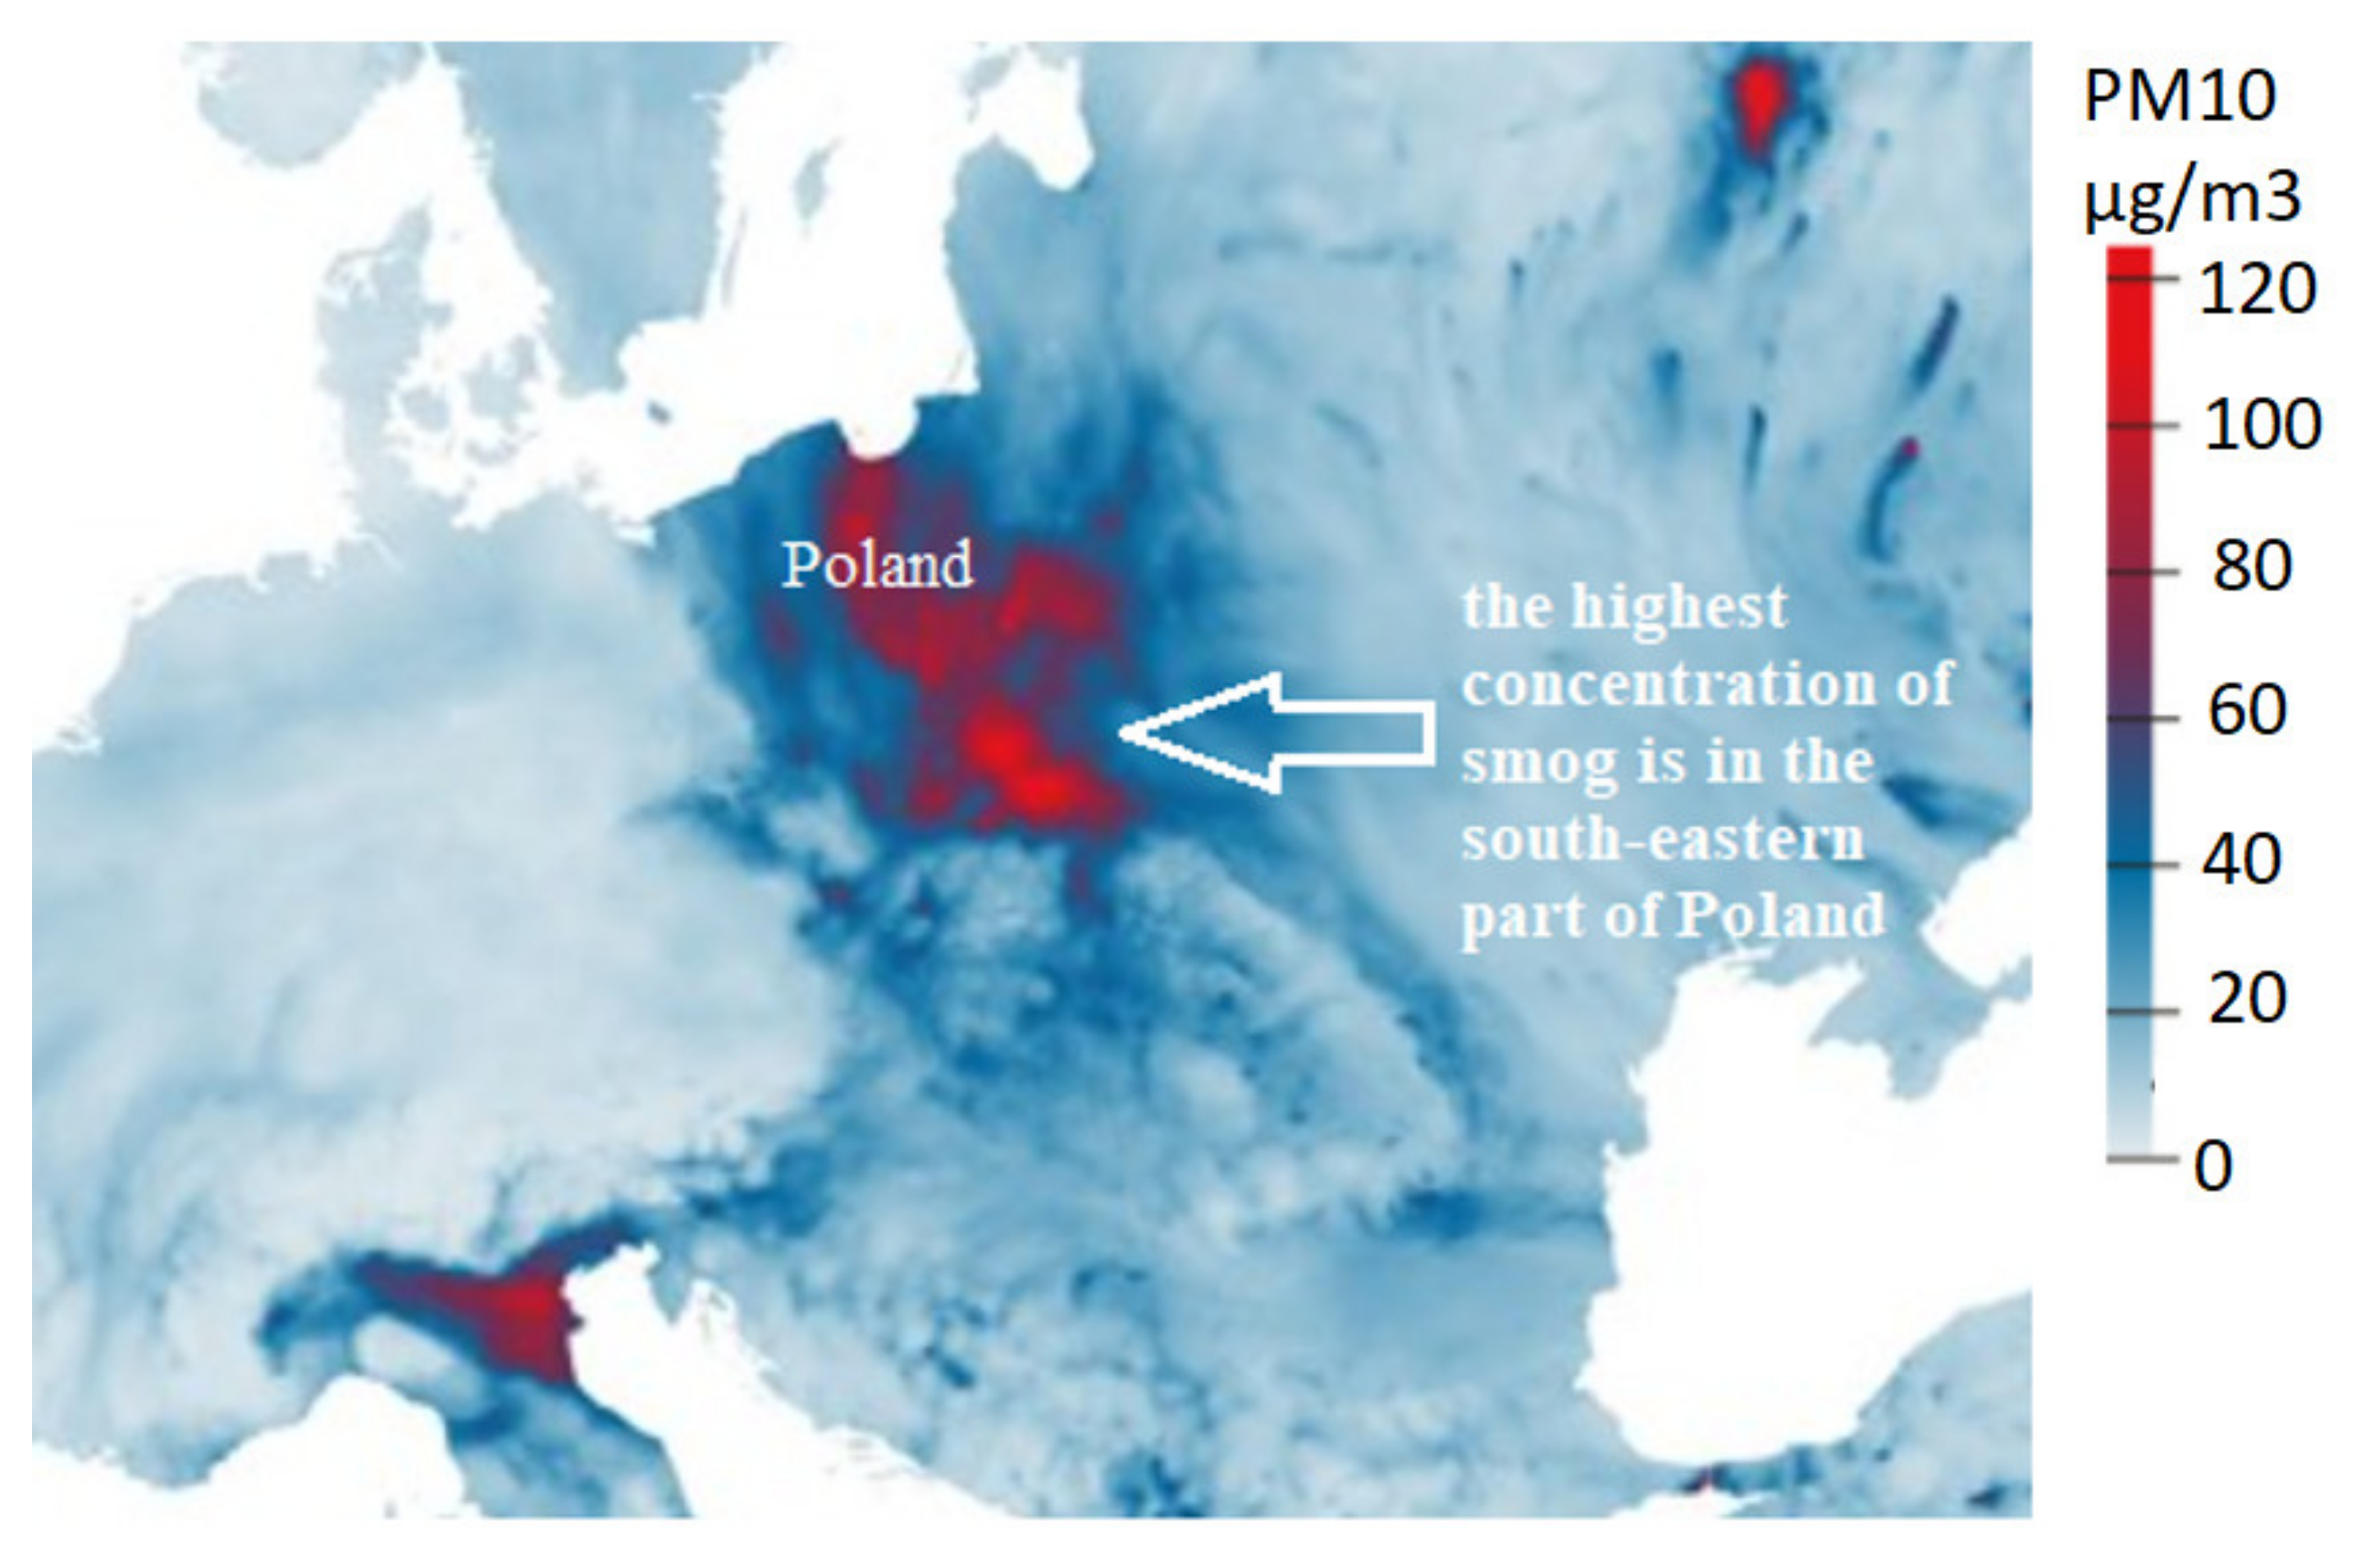
Most air pollution in Poland is the result of the country’s dependence on coal to power its homes and economy. The smog problem will affect most of Poland (
Figure 1). It contributes to a large degradation of the natural environment and significantly affects the health of the inhabitants. In addition, the problem of air pollution is exacerbated by vehicles, which causes permissible standards for concentrations of harmful exhaust components to periodically be exceeded several times.
In particular, the problem of smog occurs in the south-eastern part of Poland for the Sub-Carpathian part, whose capital is Rzeszow, a city that is a case study. Rzeszow is a city with approximately 200,000 inhabitants. The city is divided into 30 regions.
The city is an important transport hub, located about 90 km from the borders with Ukraine and Slovakia.
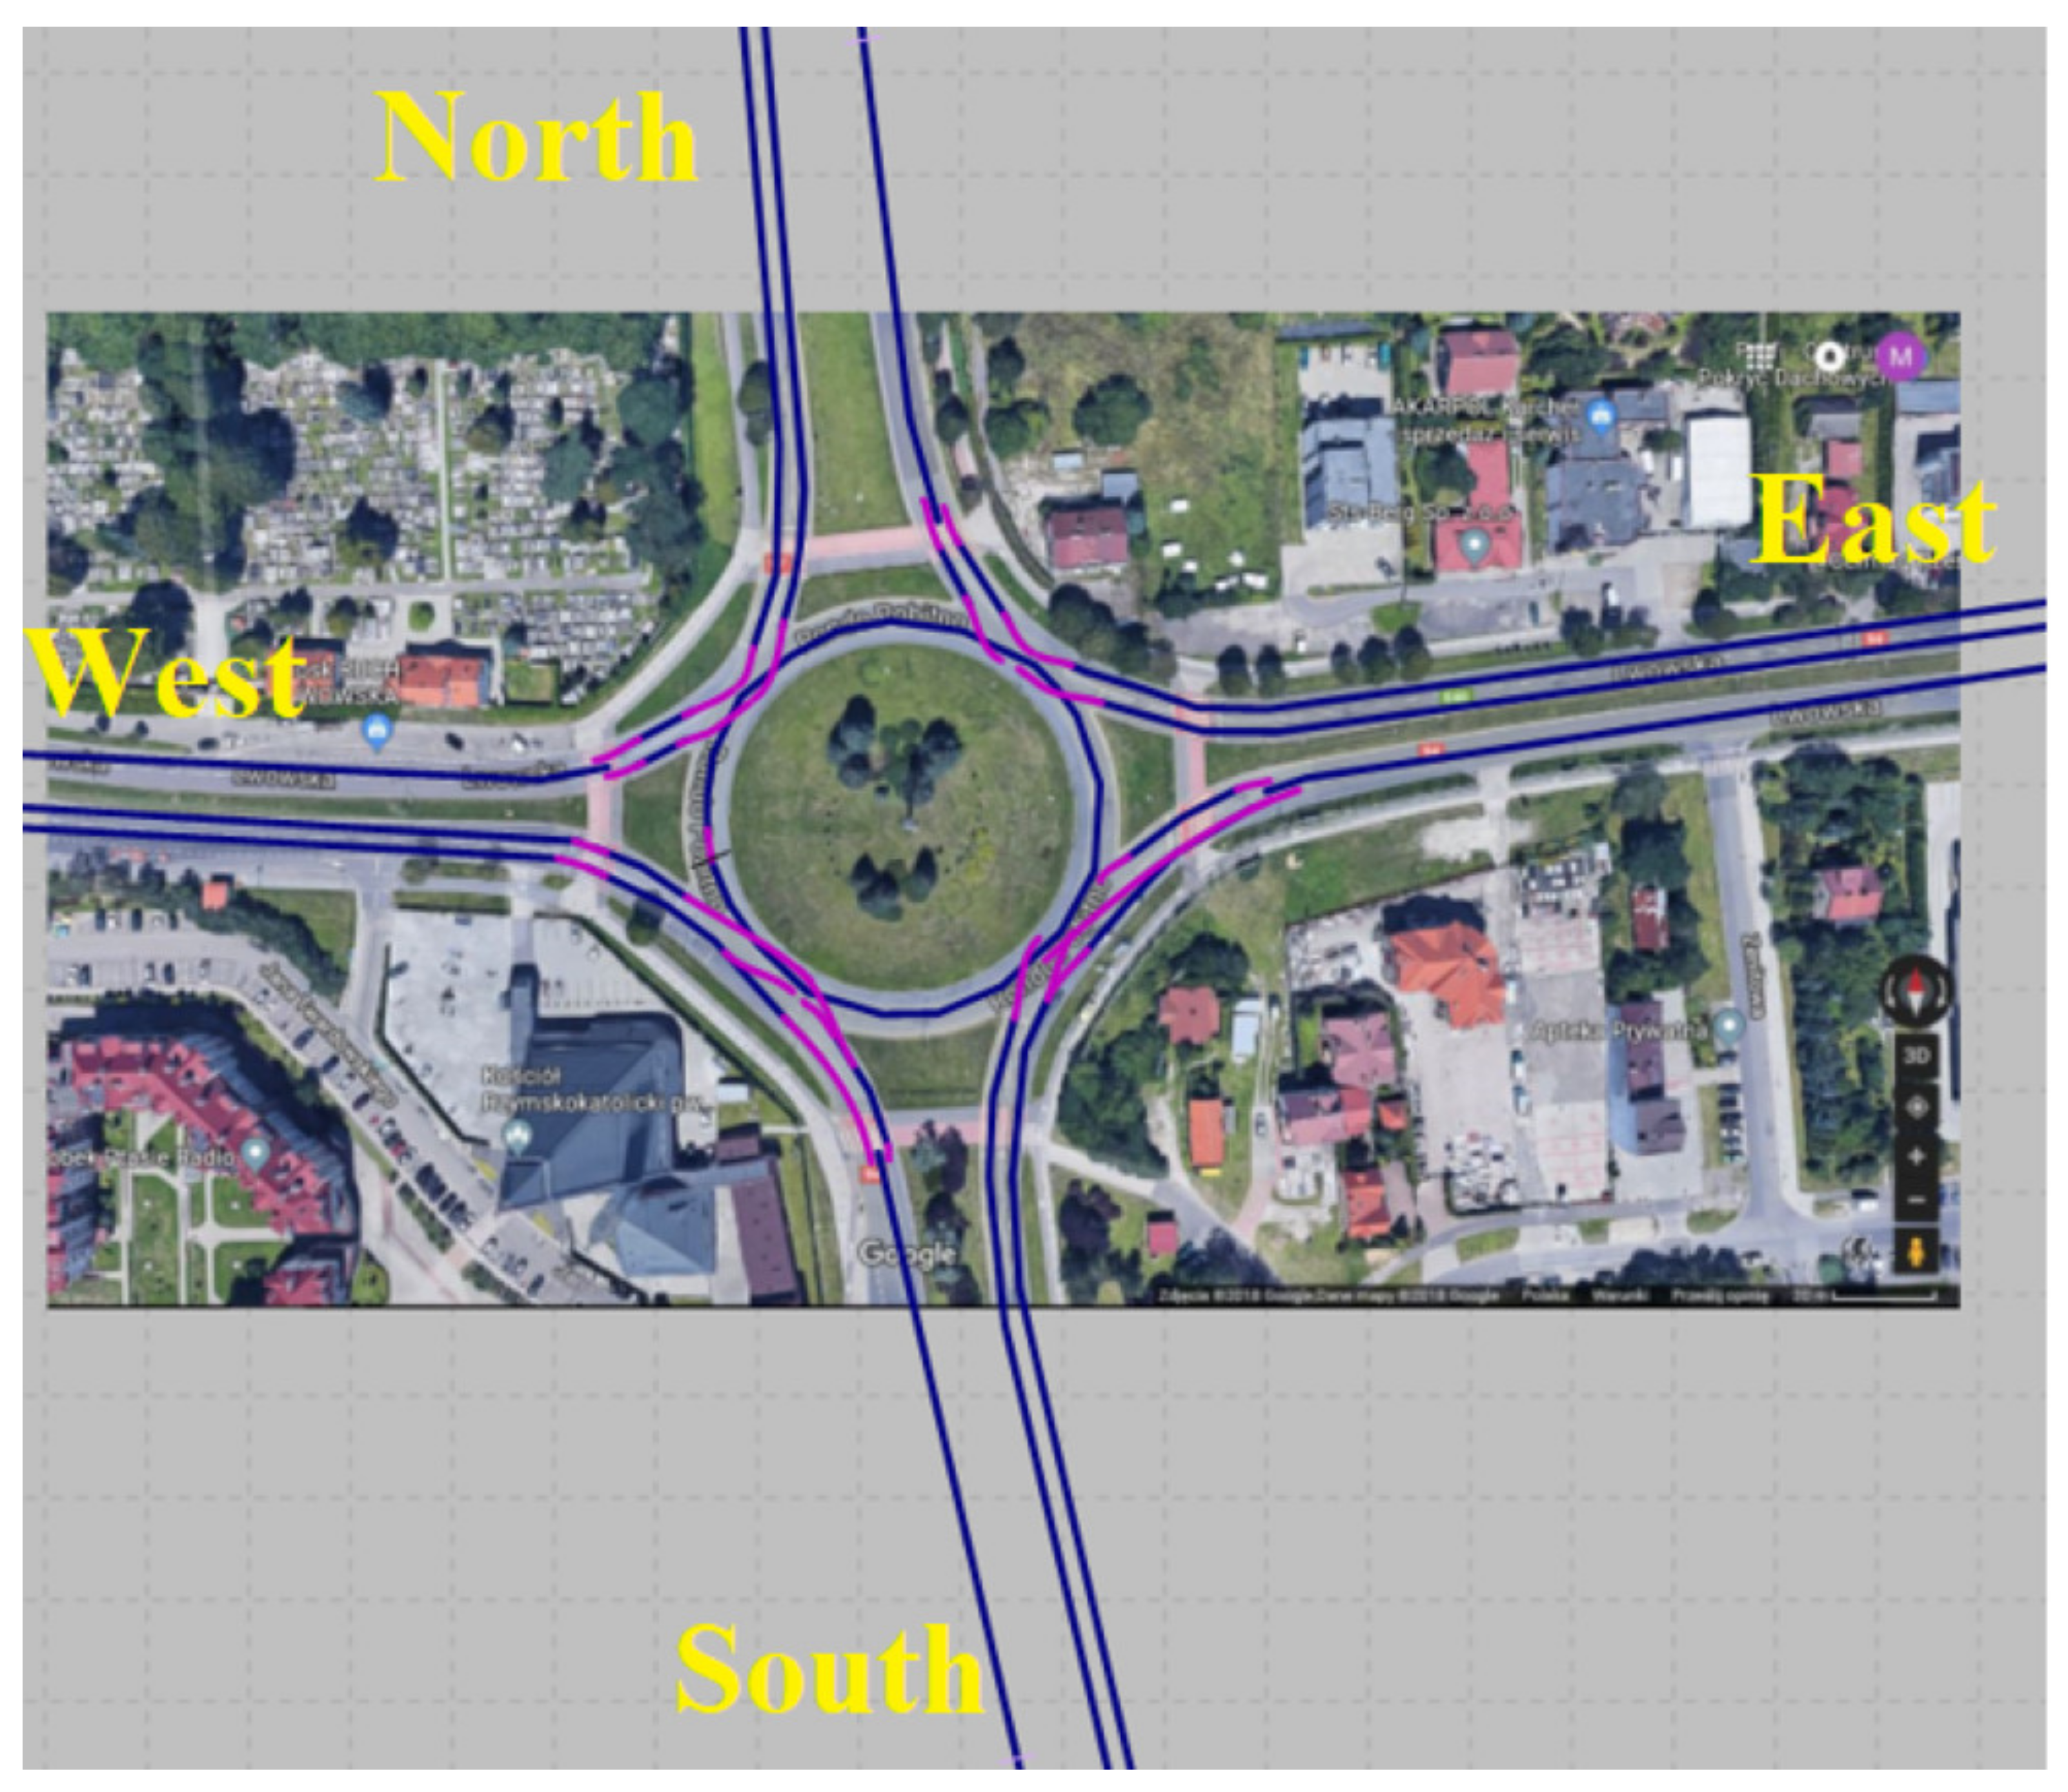
As a result of urbanization and the expansion of borders, Rzeszow suffers from unfavorable effects related to the constantly increasing number of vehicles. This state of affairs contributes to the growing problem of congestion and the increase in travel time [
31]. The analyzed area is characterized by a multilane roundabout as described in
Figure 2.
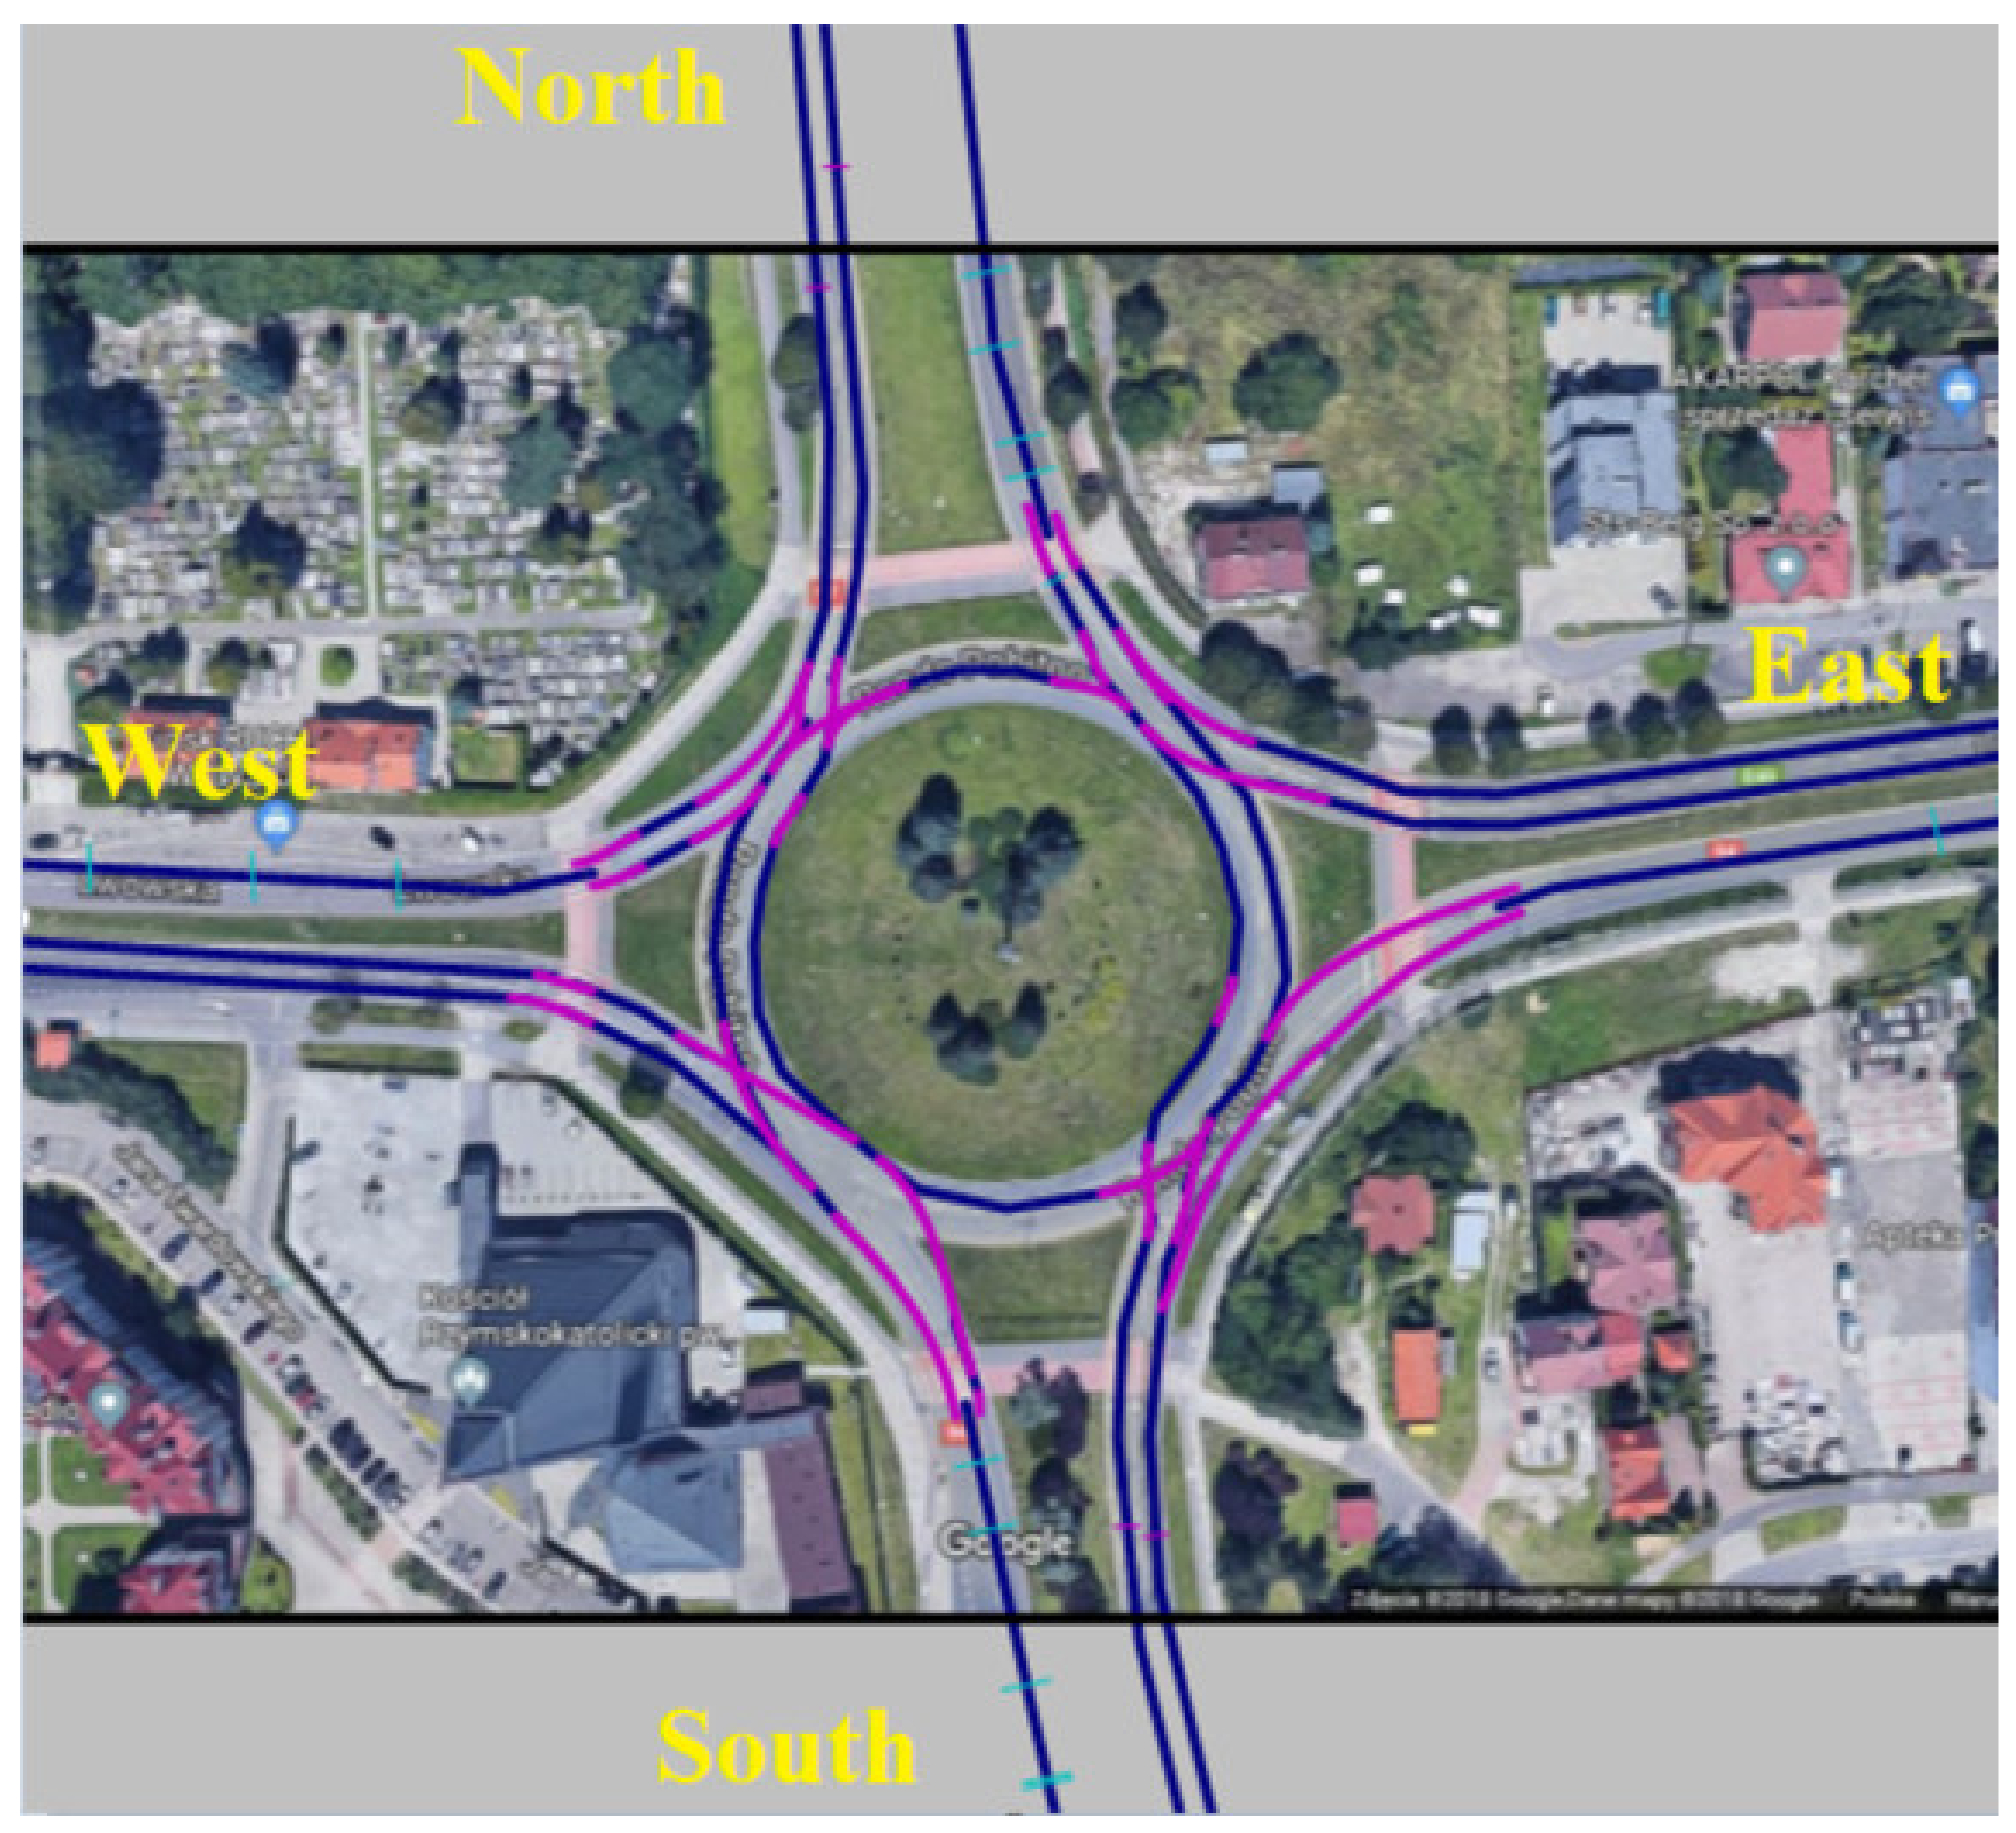
In the area of the roundabout, there are numerous large-format stores, a school and a hospital, the roads that make up the roundabout are also exit roads from the city, so as a result of overlapping the above-mentioned items, numerous congestions occur during rush hour. The current scheme was compared with a turbo roundabout. In general, it is possible to observe two groups of turbo roundabouts currently used in Poland. The first group consists of turbo roundabouts with geometry and traffic organization designed according to the model of Dutch turbo roundabouts with raised lane dividers. The other group is turbo roundabouts with traffic organization that corresponds entirely or partially on the traffic organization of conventional turbo roundabouts, but with no traffic islands, their function being carried out by a single continuous line of type P-2. Turbo roundabouts in the world are considered as solutions that are characterized by a high level of road safety and allow efficient flow at high traffic intensities [
32].
The roundabout under study was modeled using VISSIM software [
33]. The roundabout area tested for simulation was limited to 300 m for access and exit roads from the roundabout.
2.2. Roundabouts Models Constructions
The aim of the research was to compare CO
2, NOx and PM10 emissions, which arise during peak hours for standard working days before the pandemic and for a selected day from during the lockdown related to the COVID-19 for Poland. The comparison concerned the generation of emissions from vehicles for the current multilane roundabout (
Figure 3) and the alternative version of the turbo roundabout (
Figure 4), which was based on the current one.
The results were compared by micro-simulation analysis, i.e., by comparing different geometric schemes and considering the theory of car-following underlying VISSIM. In particular, it contains two models of psychophysical perception of car-following: Widedemann 74 and Wiedemann 99 [
33]. The first model is most commonly used to model urban traffic. The estimation of emitted concentrations was referred to two vehicular flow conditions, namely, minimum flow and peak flow. The first condition occurred recently due to the pandemic effect by reducing the traffic flow by more than 50%. Pollutant concentrations were estimated using VERSIT+ emission-calculation software. An important issue in the traffic simulation in VISSIM is also the question of the terrain height profile, which is a key parameter in calculating the emissions from the modeled models. Therefore, road models were developed on the basis of actual terrain height profiles for access and exit roads and the intersection area.
The model structure of the researched multilane roundabout is shown in
Figure 3. In order to create a route for vehicles entering the multilane roundabout, the access roads to the roundabout were modeled as single sections. This is because cars arriving at the roundabout must determine which lane they will occupy in advance, as this is the direction of the roundabout. The inlet and outlet roads to/from the roundabout are limited to a distance of 300 m from the center. To compare the currently operating multilane roundabout, in the context of the emission of exhaust pollutants generated by the traffic on the roundabout and in its vicinity, an alternative turbo version was modeled in its place. In order to create traffic separators characteristic of turbo roundabouts, all roads, except for exit roads from the roundabout, were modeled on the basis of single sections to level the intersection of vehicle streams. The model of the alternative turbo roundabout is shown in
Figure 4.
2.3. Traffic Input Data Description
The volume of road traffic is counted on the basis of data of car journeys from induction loops and cameras recording traffic located at the intersection inlets. Examples of data for the studied periods concerning the volume of vehicles for the day measured before the COVID-19 pandemic and for one of the days during full lockdown, when the epidemic prevailed, are presented in
Figure 5.
The tested simulation scenarios developed on the basis of real data from induction loops and cameras are presented in
Table 1.
The calculation of emissions took into account data provided by the local database, the type of fuel used and the age of the vehicles [
34].
Therefore, the following values for the composition of the circulating vehicle flow were considered in this study and were applied to VERSIT+:
56% petrol vehicles
31% diesel vehicles
13% LPG
On the basis of these data, the parameters for compliance with the “EURO” emission standards were set as follows:
5% EURO1,
9% EURO2,
17% EURO3,
29% EURO4,
19% EURO5,
22% EURO6.
The present work shows the presence of universal emission factors for different assumed traffic volumes for the selected roundabout entrance and the roundabout circulation loop, as well as emission data with respect to queue length at the roundabout entrance.
2.4. VERSIT+ Emission Model Description
There are several different emission models that can be used for the Vissim simulation purpose. Some of them are based on distance-based average fuel consumption, average speed or power demand for energy. However, for the purpose of microsimulation the best emission model is the one which used the speed profile from the simulation. This is especially necessary when analyzing a particular emission factor or concentration on the given road links is required. Especially beneficial in mentioned terms is VERSIT+ which enables drawing the concentration of emission paths along the analyzed road corridors, which can be used particularly to compare schemes in a preventive way to mitigate possible impacts and improve mobility planning in the analyzed area. For example, this detailed emission map’s results show that if the flow increases, certain emission concentration increase, so road administration or road designers can divert traffic elsewhere or change the road construction or even propose speed limits to mitigate the emission effect.
The VERSIT + model was used to calculate the emissions. The VERSIT + speed profile emission model used in Enviver is a multi-factor regression model in which the variable is the driving cycle of a given vehicle. This requires the prior obtaining of speed profiles in VISSIM, on the basis of which it is possible to estimate the emission factors (g/km) for different vehicle classes [
35,
36]. VERSIT + includes a series of 246 classes of emission models, the algorithms of which are appropriately determined for each of the vehicle categories and the type of toxic exhaust components. Contrary to the emission factors obtained from the New European Driving Cycle (NEDC), the speed profiles used in this model are representative of real road conditions [
37]. The emission factors (
EFj,k,l) are obtained from multiple linear regression to find empirical relationships between the emission rate, the velocity profile and the dynamic variables [
38].
In accordance with [
39] the emission of exhaust pollutants from road transport (g/h) for a specific exhaust component from one or more road sections is calculated as described below:
where,
EFj,k,l—emission factor (g/km),
j—exhaust component,
k—vehicle class,
l—speed profile,
TVk,m—traffic volume (veh/h),
m—road section and
Lm—road length (km). The speed profiles obtained from VISSIM are the input files for the VERSIT+ model after calibrating the model according to the desired speed and acceleration functions on the basis of empirical data. It is then necessary to define the fleet composition according to the previously mentioned statistical data including the percentage of particular emission class, the fuel used and age of vehicles. The calculation of the emission coefficient based on the multivariate regression model was presented. The general scheme of the performed emission calculation is presented in
Figure 6.
2.5. Simulation Models Calibration
The process of traffic microsimulation is characterized by several steps. Initially it is necessary to calibrate the parameters that have a decisive influence on the movement of vehicles. In particular, it is necessary to calibrate the desired speed distribution parameter and acceleration. They have an impact on the subsequent vehicle emission results. The calibration was carried out considering real data from 14 vehicles and 9 different drivers. The input data for real world measurements for drivers were recorded by portable emissions measurement systems (PEMS) through built in global positioning systems (GPS) and also by separate GPS application for later comparison. The data concern the speed of the vehicles and their coordinates. Based on the coordinates the data were extracted for the roundabout region for further calibration. This detailed roundabout vehicle recorded data was particularly selected for 300 m from the inputs, the roundabout drive-through and for 300 m from the outlet of the roundabout. The recorded vehicle data was only limited to passenger cars, future research will focus on some other types of vehicles, such as trucks, buses, etc. The total number of road tests was 28. The drivers were selected to obtain the largest possible scatter of data for different driving dynamics.
The desired speed was calibrated first, followed by the desired acceleration and deceleration. The purpose of this calibration was to achieve the greatest possible convergence of the velocity distribution and acceleration to real values. The parameters of the driving model behind the leader were then calibrated in order to achieve the closest possible values of the traffic volume at the individual inlets to the roundabout model, thus keeping the speed and acceleration distribution at the earlier, calibrated values.
In VISSIM, the desired speed is defined as the distribution and not as a specific unit value [
40]. For each type of vehicle, the desired speed distribution is a key parameter that influences the road capacity and the driving speeds achieved. The standard value of the desired speed distribution is an equal distribution between the minimum and maximum speed. The desired speed was assumed to be the speed at which the vehicle moves when arriving and passing through the tested roundabout in free traffic conditions, i.e., at speeds higher than 30 km/h.
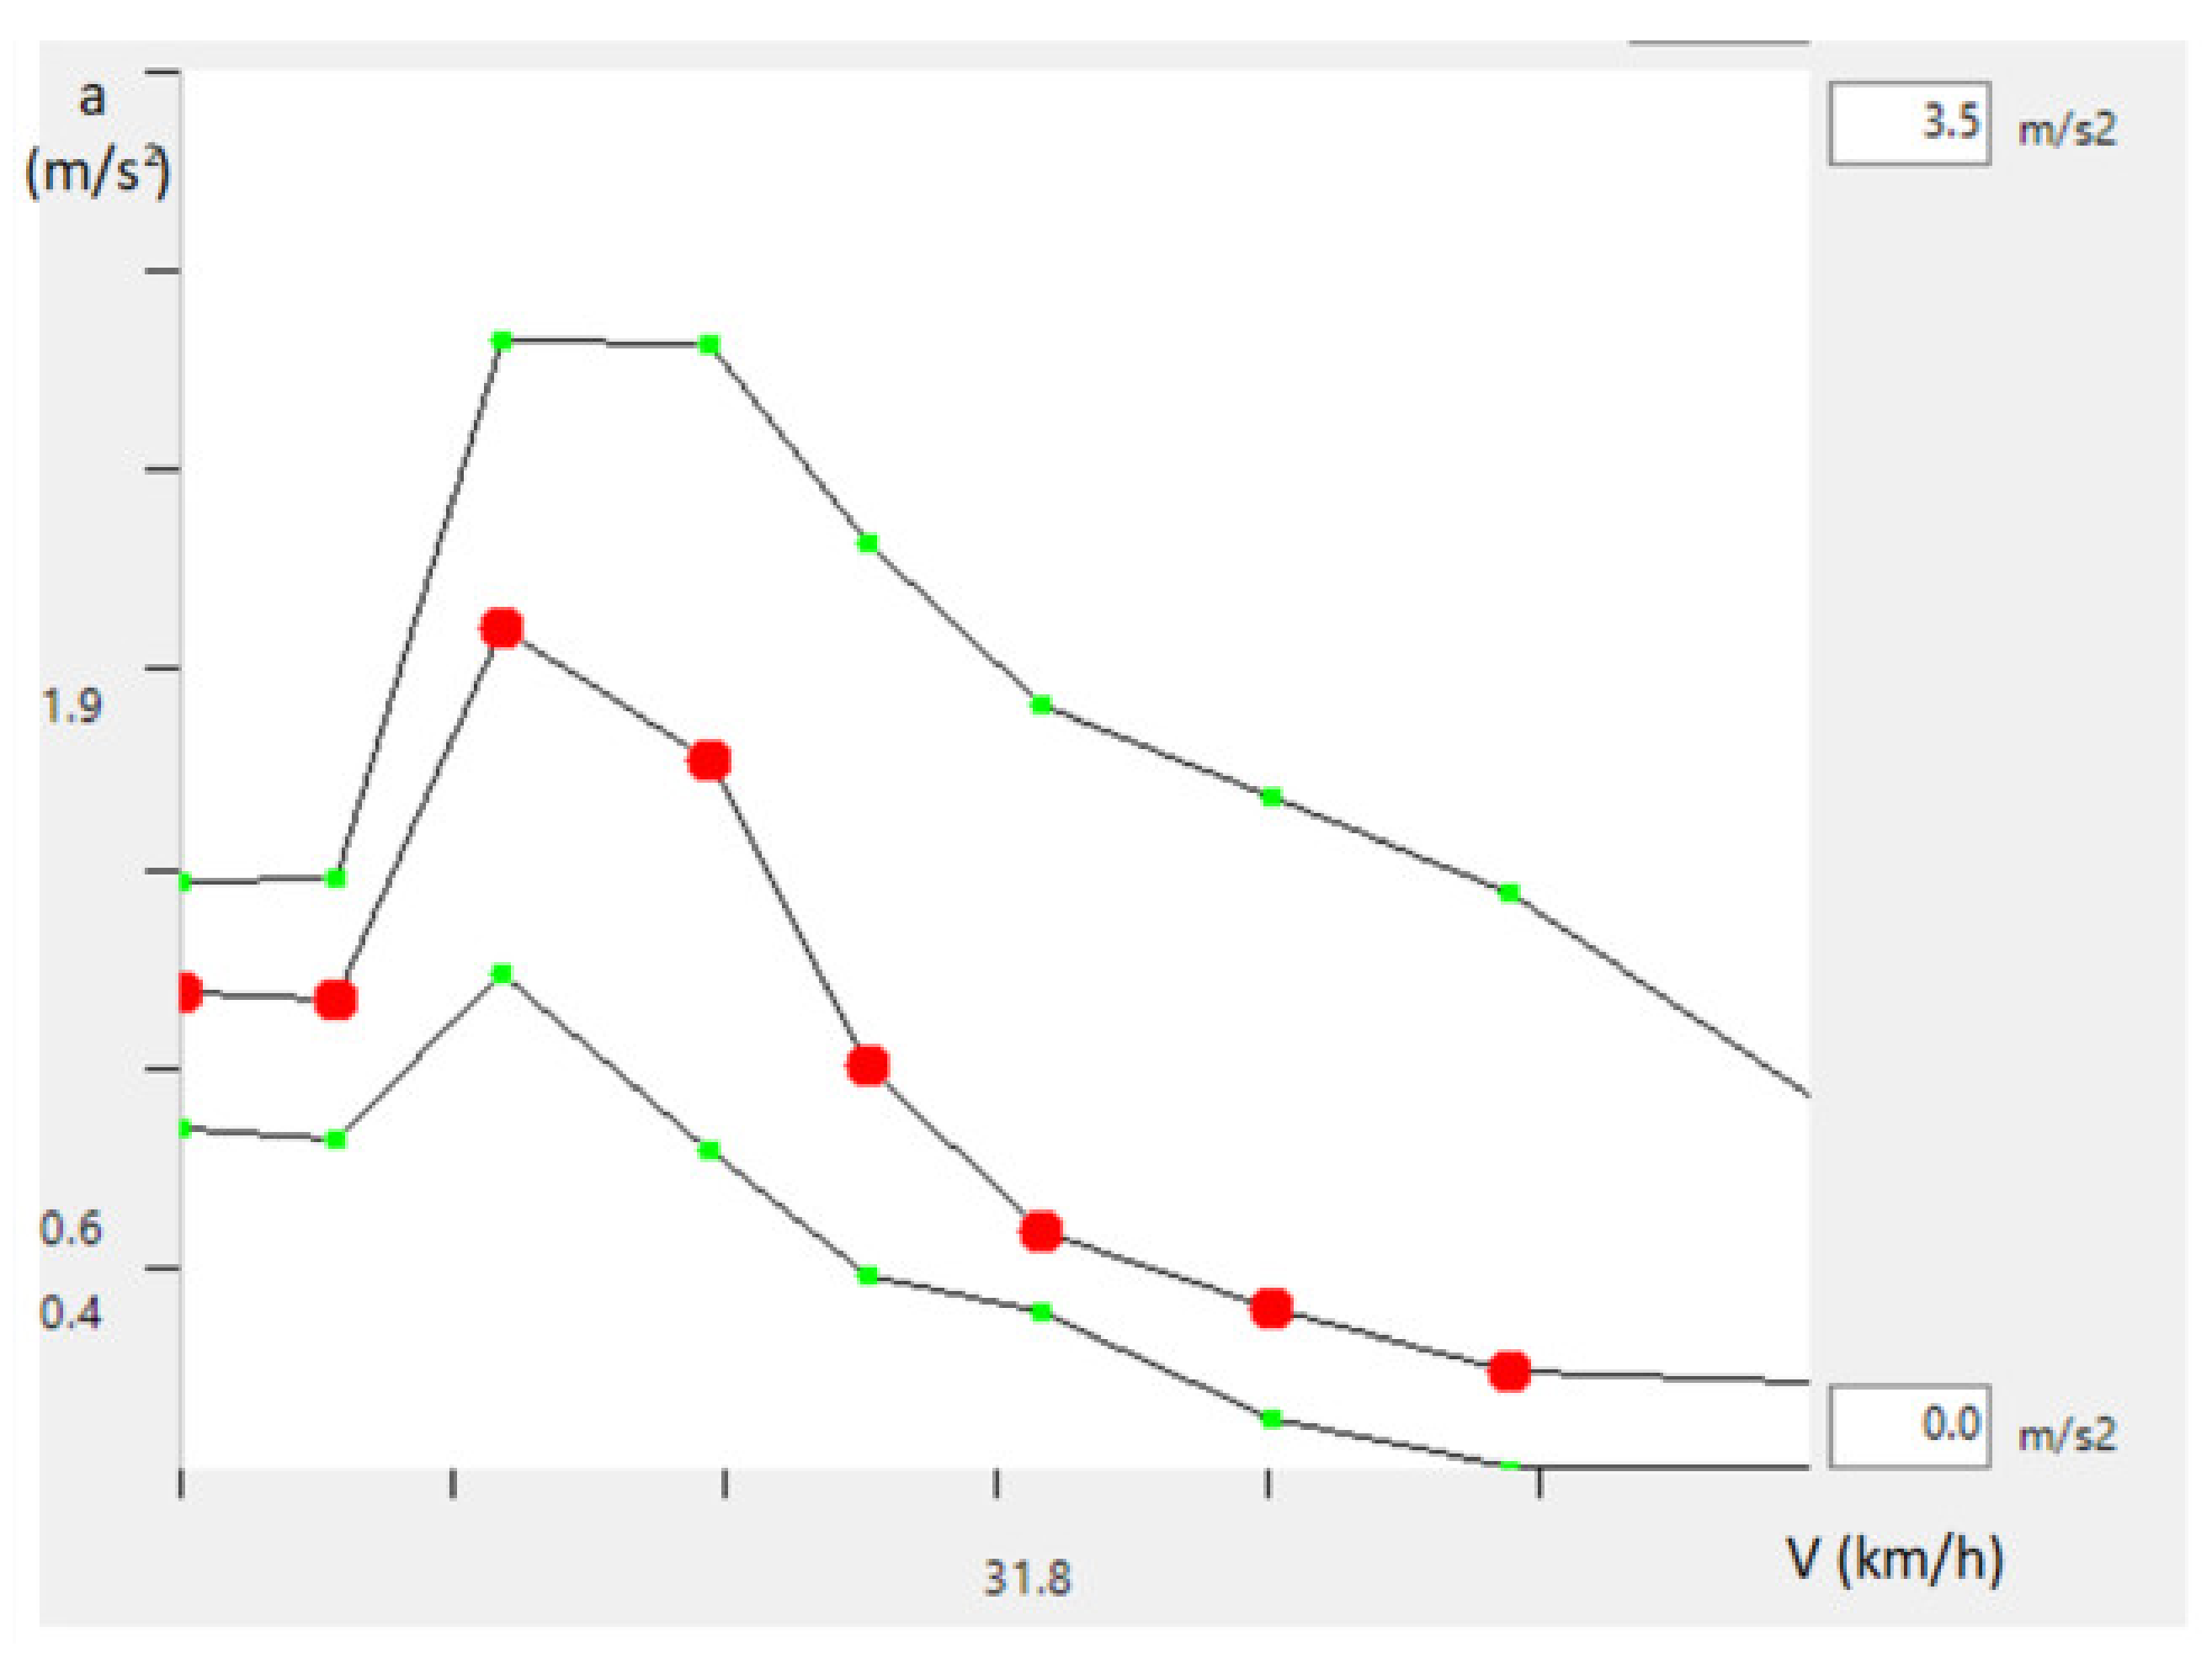
Figure 7 shows the desired speed distribution function from the VISSIM tool developed on the basis of road tests.
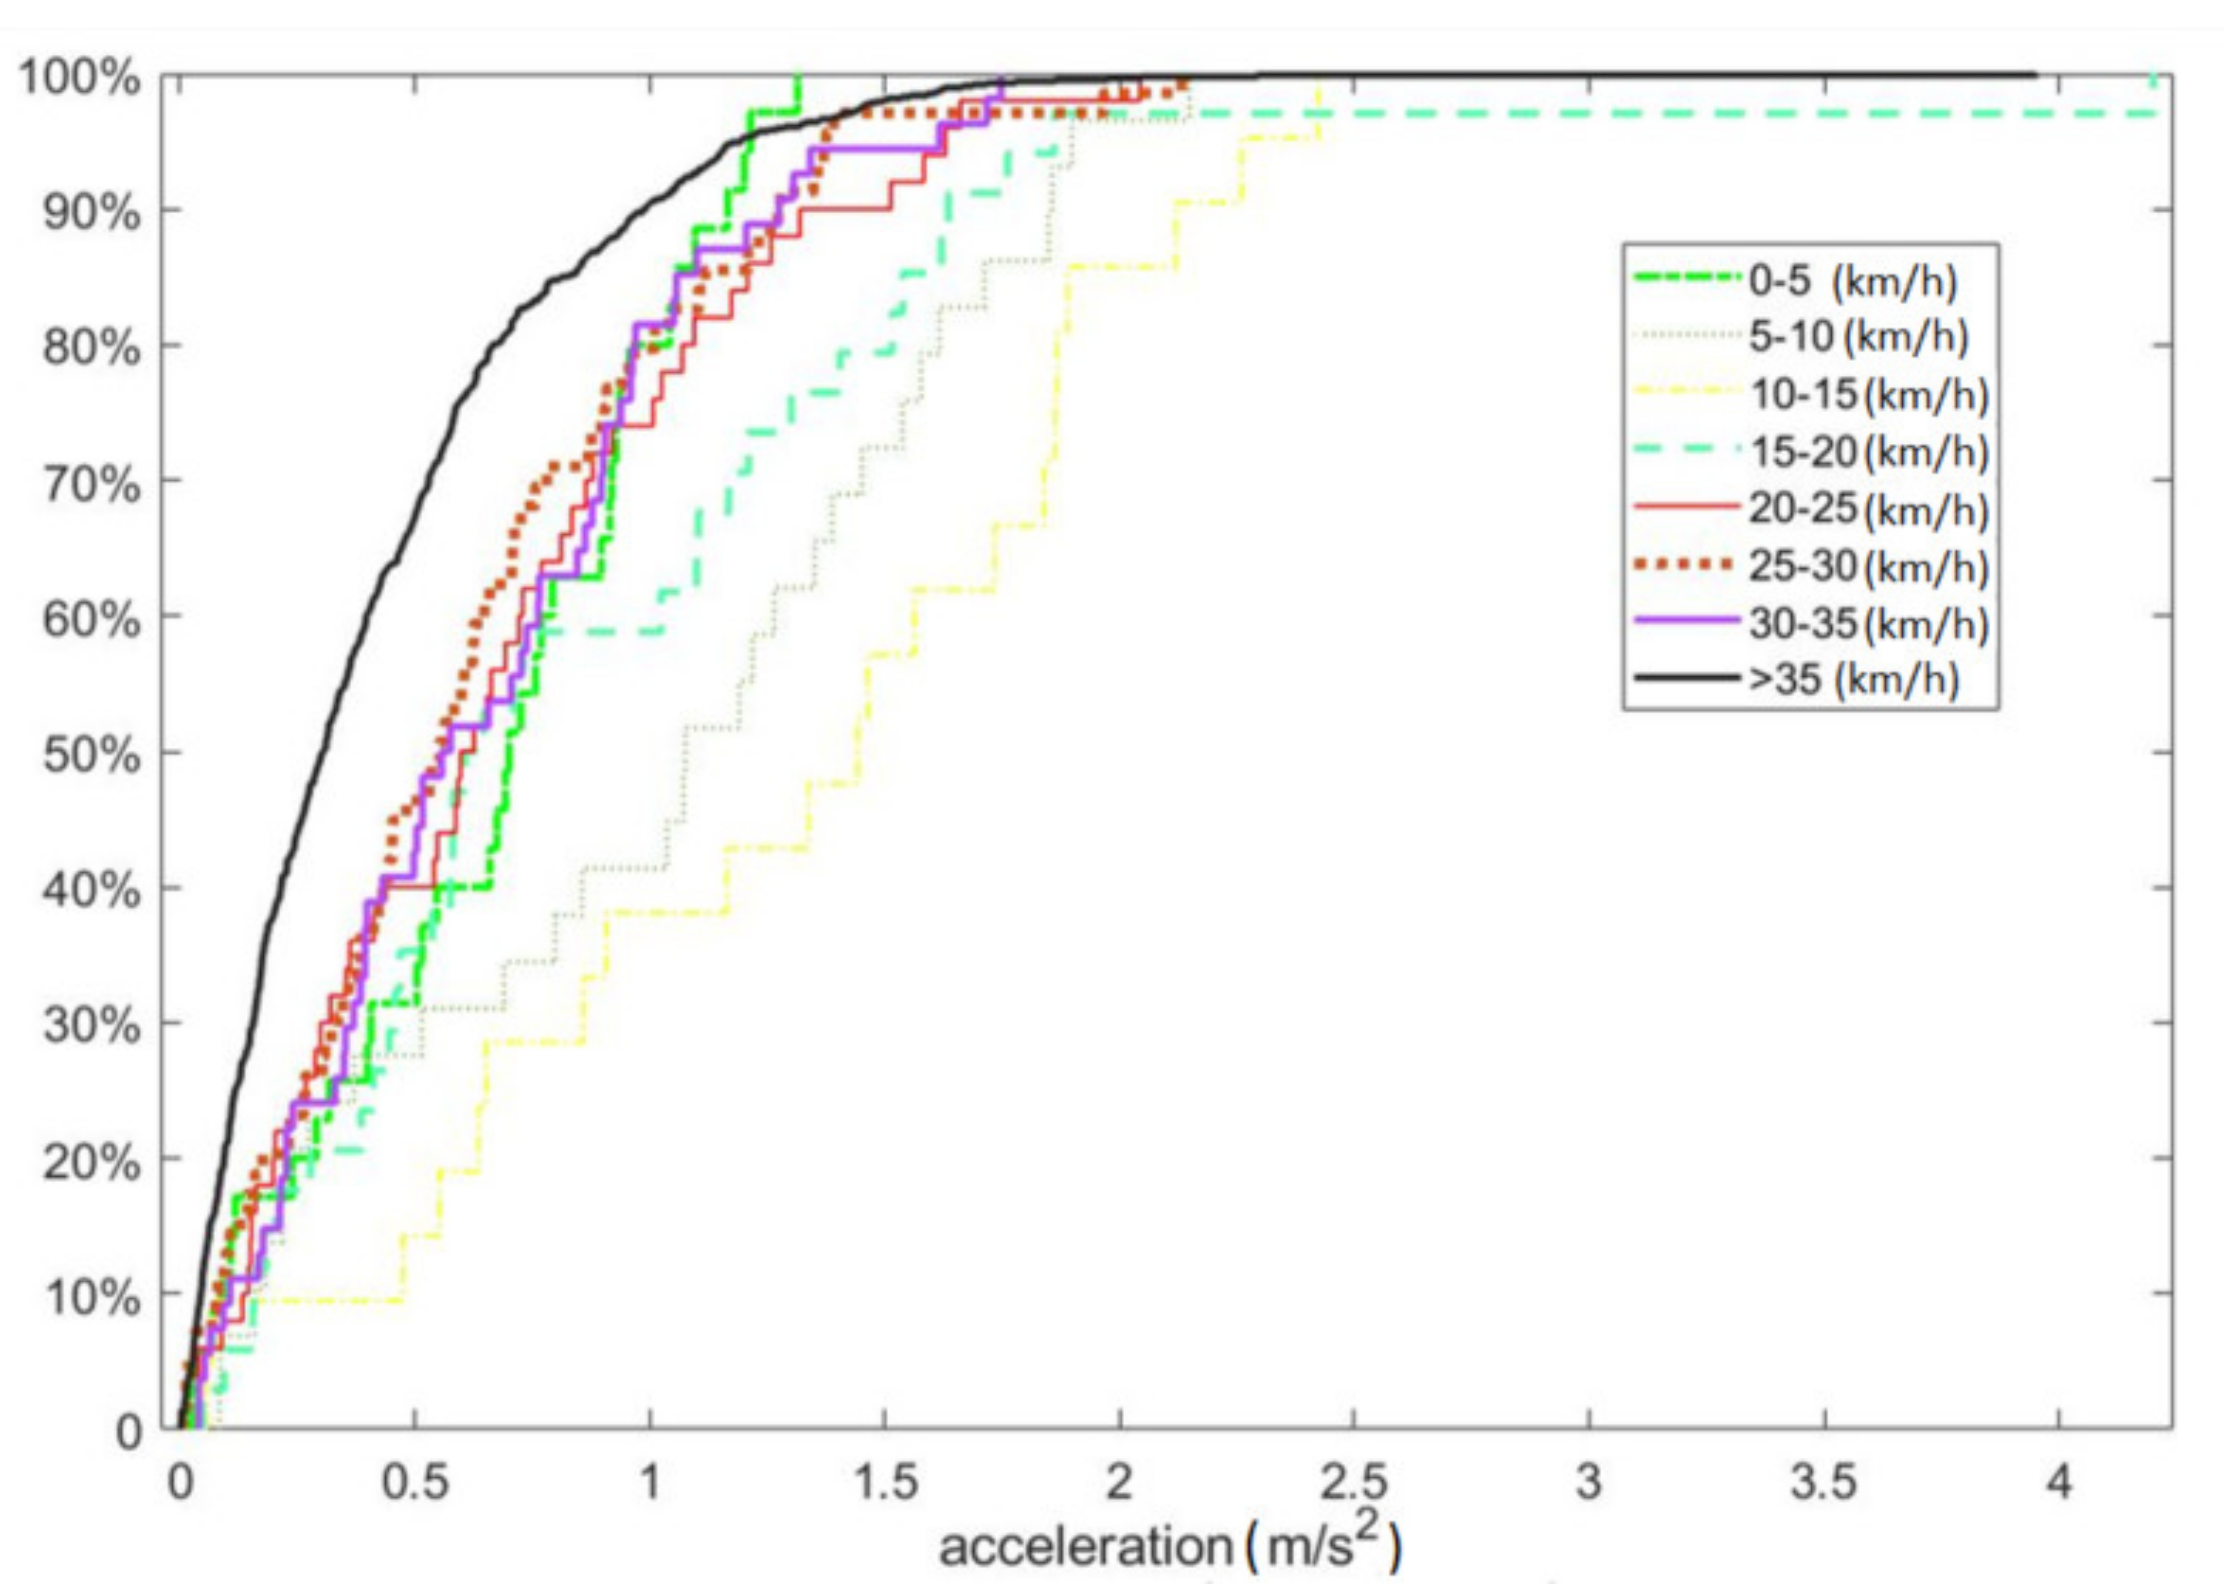
Considering specific driving speeds, the software includes the functions of the desired acceleration and deceleration. The described functions are not constant values, because for each desired acceleration or delay in VISSIM, the minimum, average and maximum functions are determined. The values of these functions may be freely defined by the operator. Calibration of the desired acceleration can also be done in an intuitive way, as well as the calibration of the distribution of the desired speed by determining the average value of the acceleration in certain speed ranges. The maximum and minimum acceleration values can be defined as the 5th and 95th percentiles. However, drivers are not always able to drive at the desired acceleration, in particular when approaching a roundabout and driving around the roundabout envelope when there is another vehicle ahead.
The maximum desired acceleration is the 95th percentile, the minimum 95-p, and the average 95—½ p.
Figure 8 shows the summary distribution of identified accelerations. The observed accelerations in different speed classes were divided, while the parts exceeding the described percentiles were omitted in further considerations. The result of calibration of the desired speed in particular speed ranges is shown in
Figure 9.
In order to check the differences that arise when calculating the emissions from the model data before and after calibration, comparative tests were carried out. The model before and after calibration was run three times with different values of the randomness coefficient. The emission results from the performed tests are presented in
Table 2. The differences in the results of emission of harmful components are noticeable. The highest values are for NOx, while the lowest for PM10.
The reason for the higher emissions for the pre-calibration data is the more aggressive driving style of the drivers in the simulation (higher acceleration values for low driving speeds). If it is desirable to test different model solutions in the VISSIM software in terms of the emissions generated, it is necessary to calibrate the model first, because the presented differences have a large impact on the final result of the exhaust emissions.
3. Results
More than 30 simulations were carried out for the model calibration process, while 40 simulations were performed for the purpose of proper research.
The two roundabout geometric schemes were modelled using VISSIM software, while the vehicle traffic data were imported into the emission calculation model using the VERSIT+ tool. Calculations were made for peak hour traffic data for the day before the pandemic and during the pandemic.
These scenario simulations were performed for both compared geometries.
Figure 10 shows the distribution of speeds and accelerations for the examined scenarios for the pre- and during-pandemic flows.
In particular,
Figure 10 illustrates the obtained cumulative speed points as a function of acceleration for all researched vehicles from the simulation. On this basis, we can observe what the compaction looked like for the analyzed speed ranges in relation to the acceleration parameter (red—high density, blue—lower density). Based on
Figure 9, it can be seen that for pre-COVID-19 flow there is higher density of low speed and acceleration points (red areas). This dependency applies to both multi-lane and turbo roundabouts. For lower traffic volumes for pandemic lockdown day, there is a clear advantage of a higher density of acceleration points from vehicles, which directly translated into smoother traffic and no major congestion.
Based on
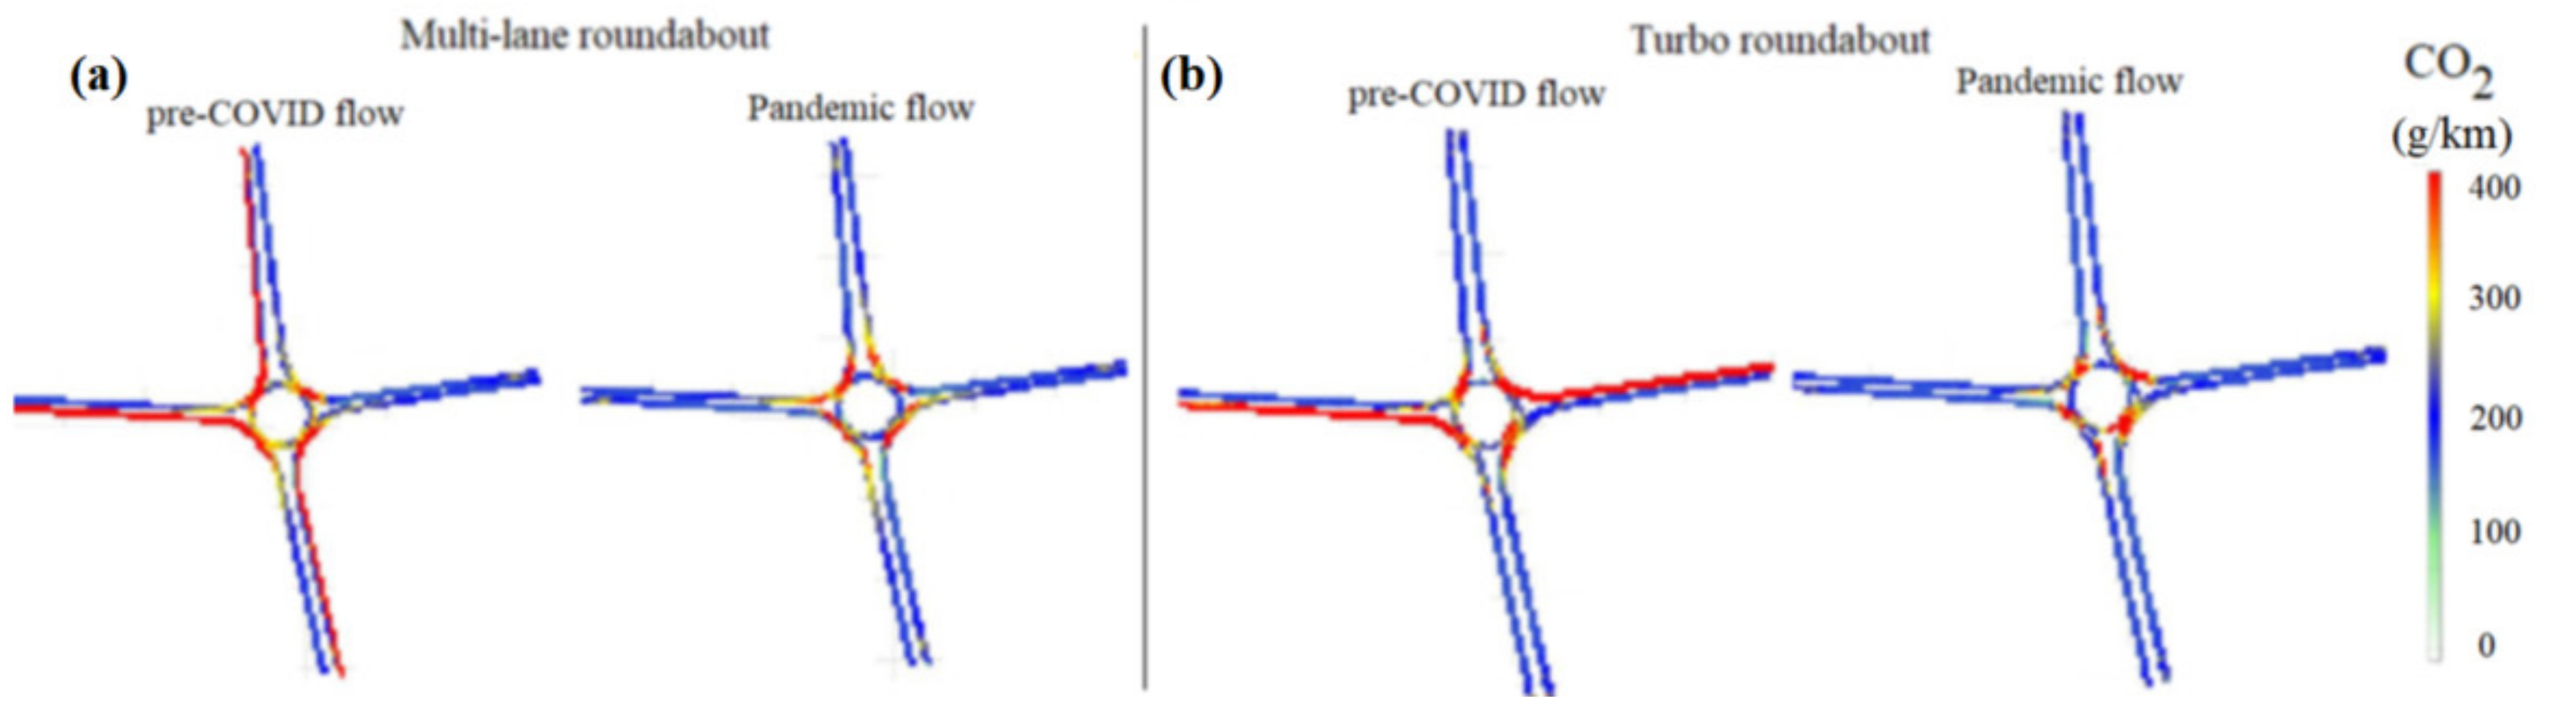
Figure 11 it can be seen that the highest CO
2 emission occurred for a multilane roundabout during the traffic rush hours before the pandemic and it exceeds the emission for a turbo roundabout at the same time by approximately 23%; the maximum values for CO
2 emissions occur in the vicinity of the access roads to the roundabout inlets as well as locally in the roundabout; the lowest CO
2 emissions occur for the pandemic scenarios for both roundabouts.
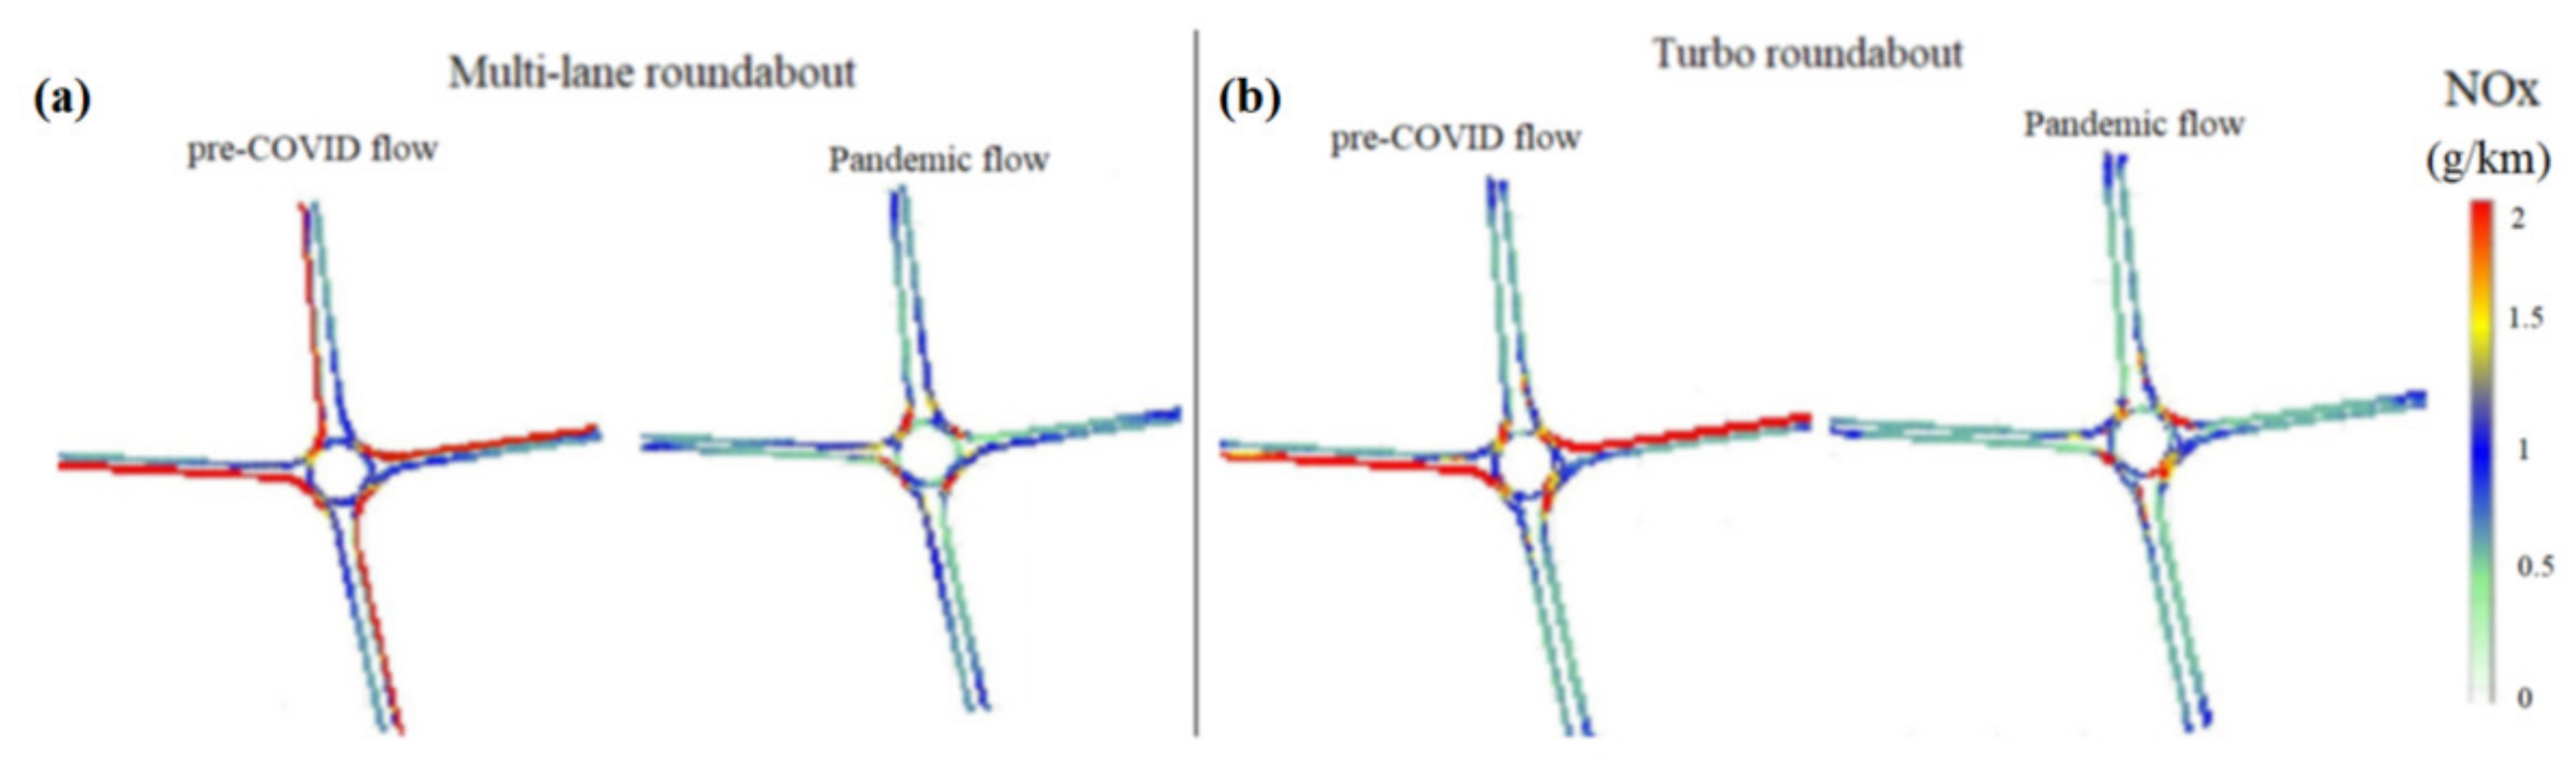
Based on
Figure 12 it can be seen that the highest NOx emissions occur for a multilane roundabout during pandemic free flow traffic conditions and concern entry at inlets; in the case of a turbo roundabout, it is smaller for the inlets allowing faster entry into and driving around the roundabout; the largest difference in NOx emissions occurs for the time before pandemic conditions and amounts to approximately 16% in favor of the turbo roundabout, while for pandemic day it is lower by approximately 9% for the same roundabout solution.
Based on
Figure 13 it can be seen that the highest PM10 emissions are for a multilane roundabout during peak traffic hours before the pandemic and the highest values are for inlets. Comparing the difference of PM10 emissions on a multilane roundabout and a turbo roundabout in the peak hours before the pandemic (approx. 23%) and for pandemic conditions (approx. 2%), in both cases it is in favor of the turbo roundabout.
The emission of the analyzed harmful exhaust components is directly related to the number of stops, driving speed and the acceleration of vehicles. At times when the traffic flow is high, the aforementioned parameters of vehicle traffic automatically deteriorate. The differences in exhaust pollutant emissions for the studied days of the pre-pandemic period and during the pandemic, for the currently operating multilane roundabout, are as follows (
Figure 14): for CO
2—66%, NOx—89% and PM10—75%, in favor of days during lockdown. Regarding the turbo roundabout, these differences are respectively: for CO
2—29%, NOx—43% and PM10—39%, also in favor of the day with widespread lockdown.
Previous work [
11,
41] regarding comparison of two types of roundabouts for the same case study as presented in this work showed that besides changing the geometric shape of the two-lane roundabout into a turbo roundabout can in addition, result in a significant reduction in emissions due to the additional contribution of electric vehicles. This state of affairs determines not only that these vehicles are low-emission or zero-emission, but also the fact that they have other speed and acceleration problems related to a different specificity of engine operation, which additionally emphasizes the problem of model calibration in relation to selected parameters that are discussed in this work.
Analyzing Different Traffic Volumes and Its Influence on Emissions Factors
Due to the fact that the conducted analyses concern the investigated case study, it is necessary to perform further analyses related to other traffic volumes of vehicles, both for the circle of the roundabout and the inlets. Such a research could contribute to the development of more universal emission factors that characterize driving on a given roundabout. This could affect the updating of the documents related to the guidelines for the design of roundabouts with regard to ecological parameters. Previous studies concern the selected case studies for the assumed traffic volumes of vehicles, while in this part of the work, on the basis of numerous simulations for various traffic volumes, both for the inlets and for the roundabout envelope, the results can be generalized to general statements in relation to the different solutions applied for the structure of roundabouts. The works [
41,
42,
43] showed that traffic at the roundabout is characterized mainly by three types of speed profile: without stops, with one stop before entering the roundabout envelopes and with many stops before entering the roundabout. In fact, in cities and during the day on busy roads crossing in the form of roundabouts, mainly the last two types of driving occur. The cases analyzed at work concern these types, with the predominance of driving with multiple stops. This state of affairs causes the engine to idle too often, which means that after another rapid acceleration, the vehicle generates higher emissions of harmful exhaust components.
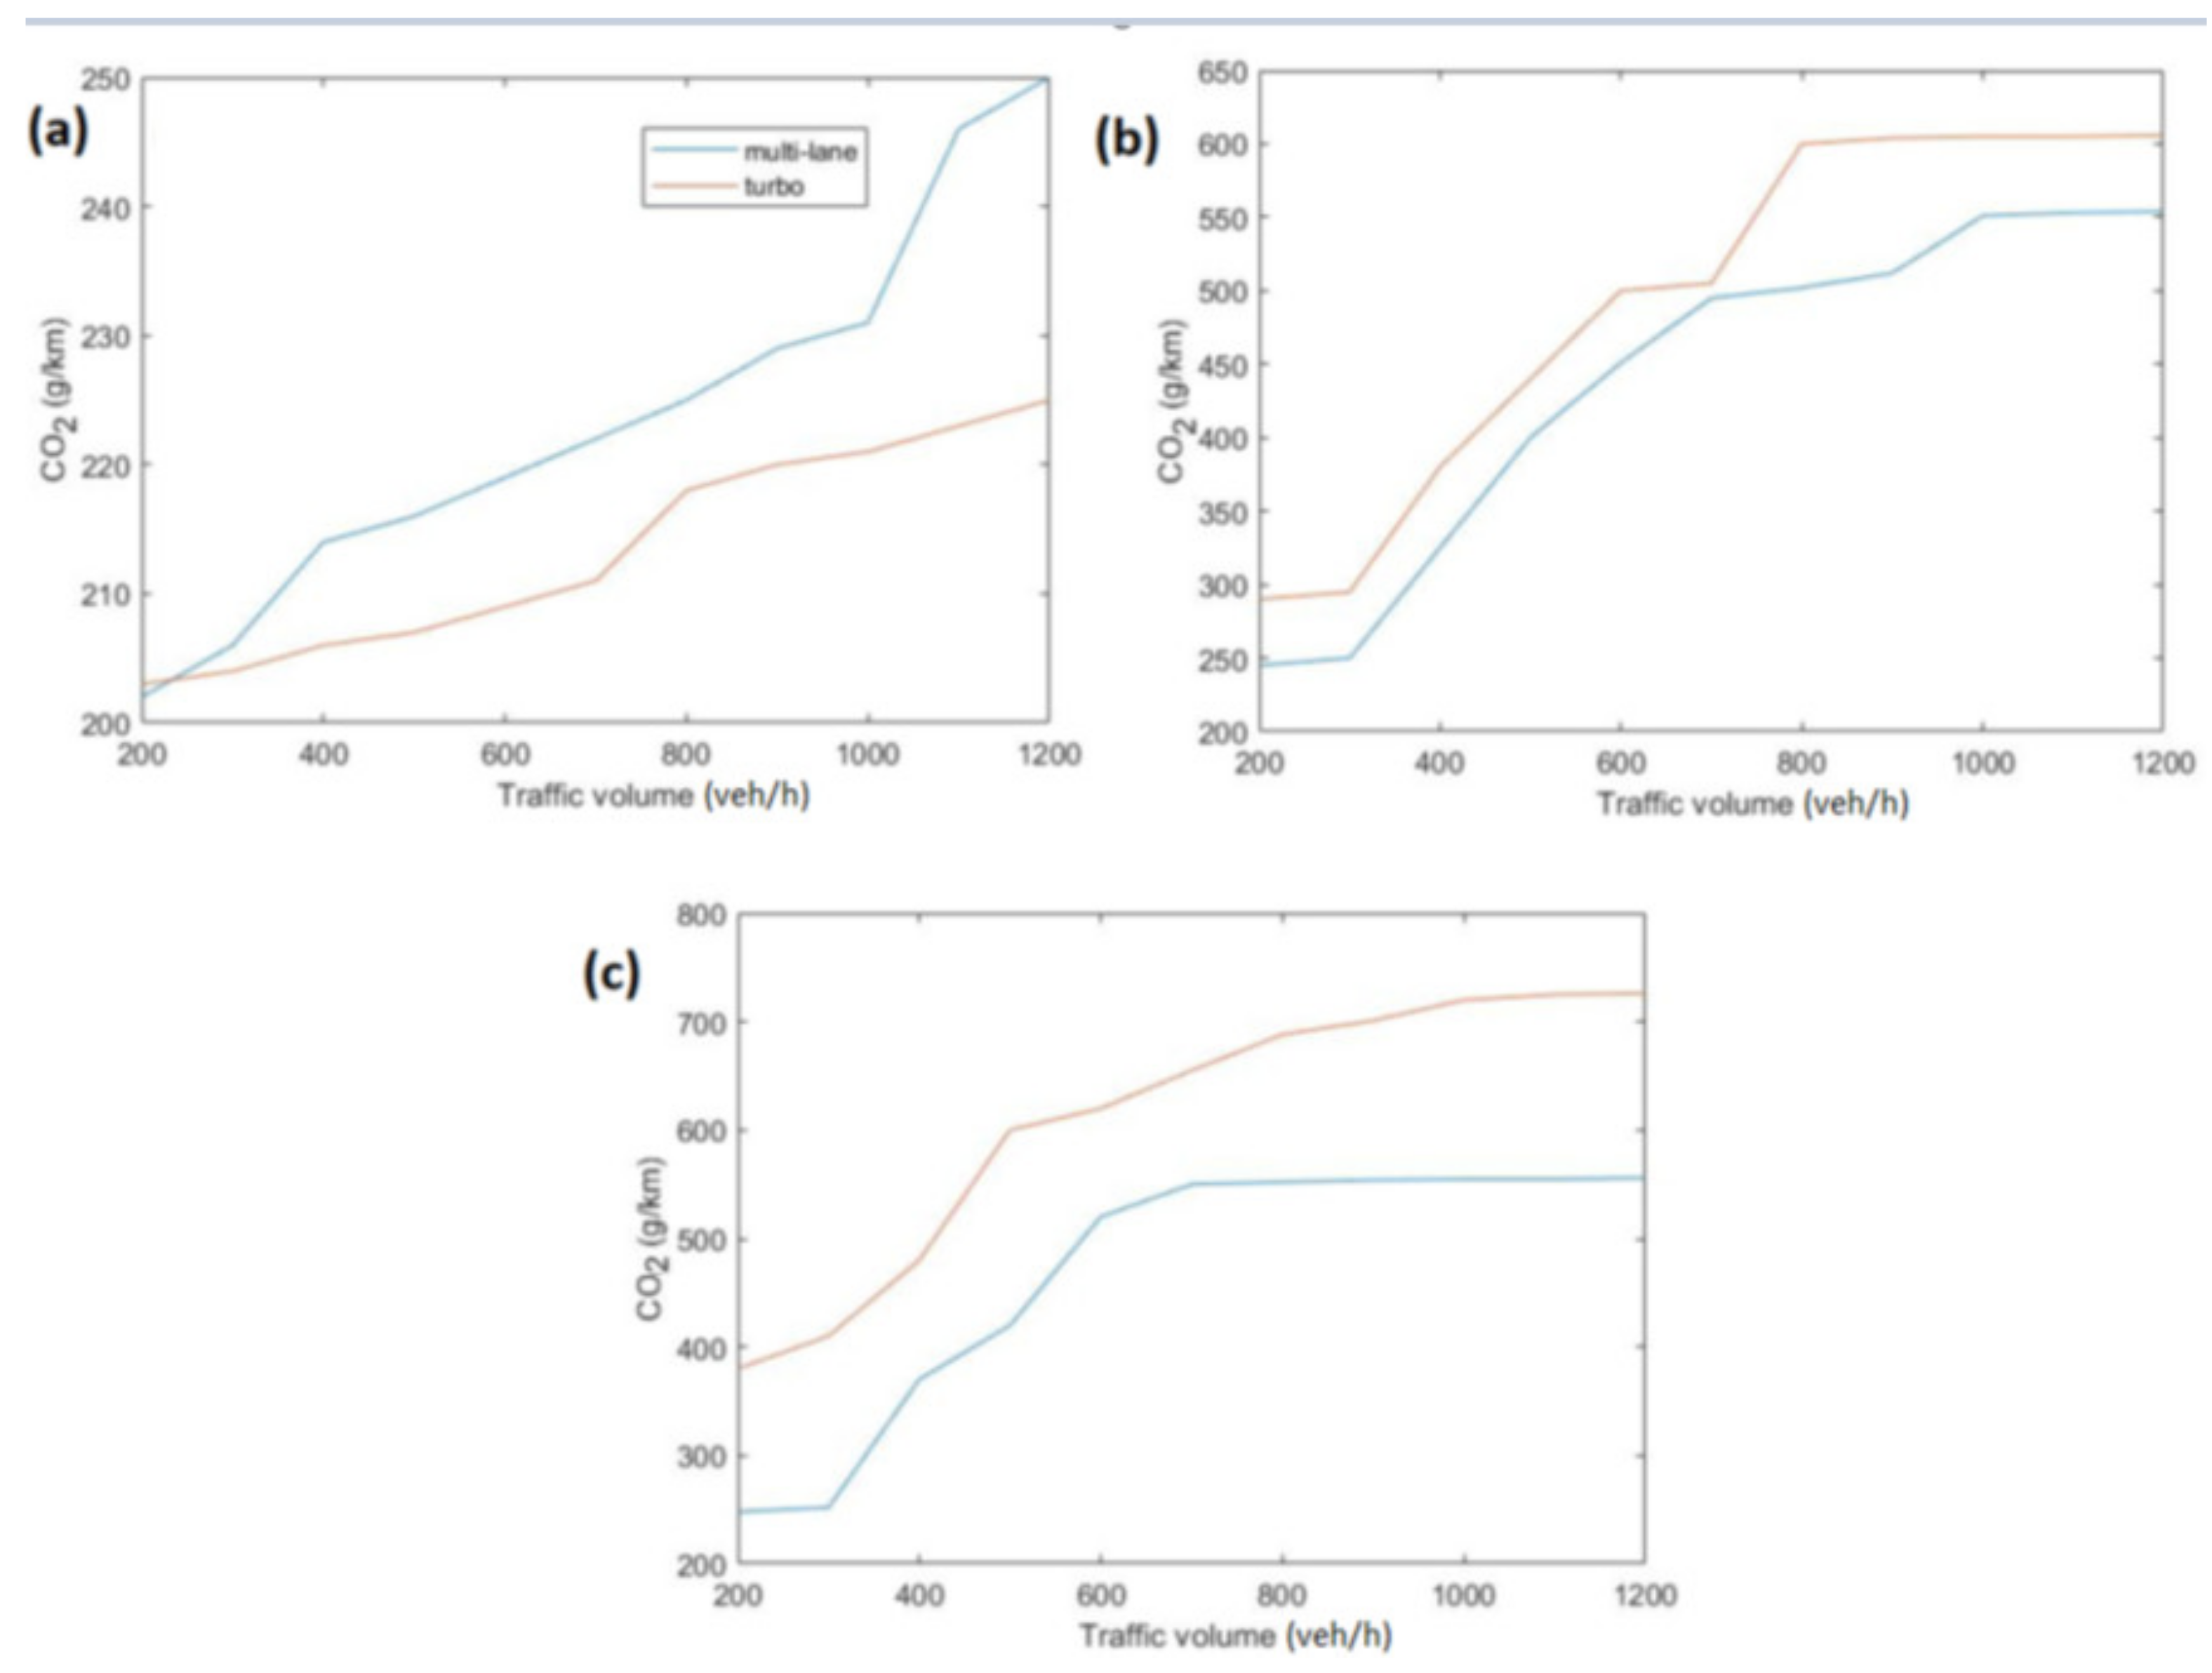
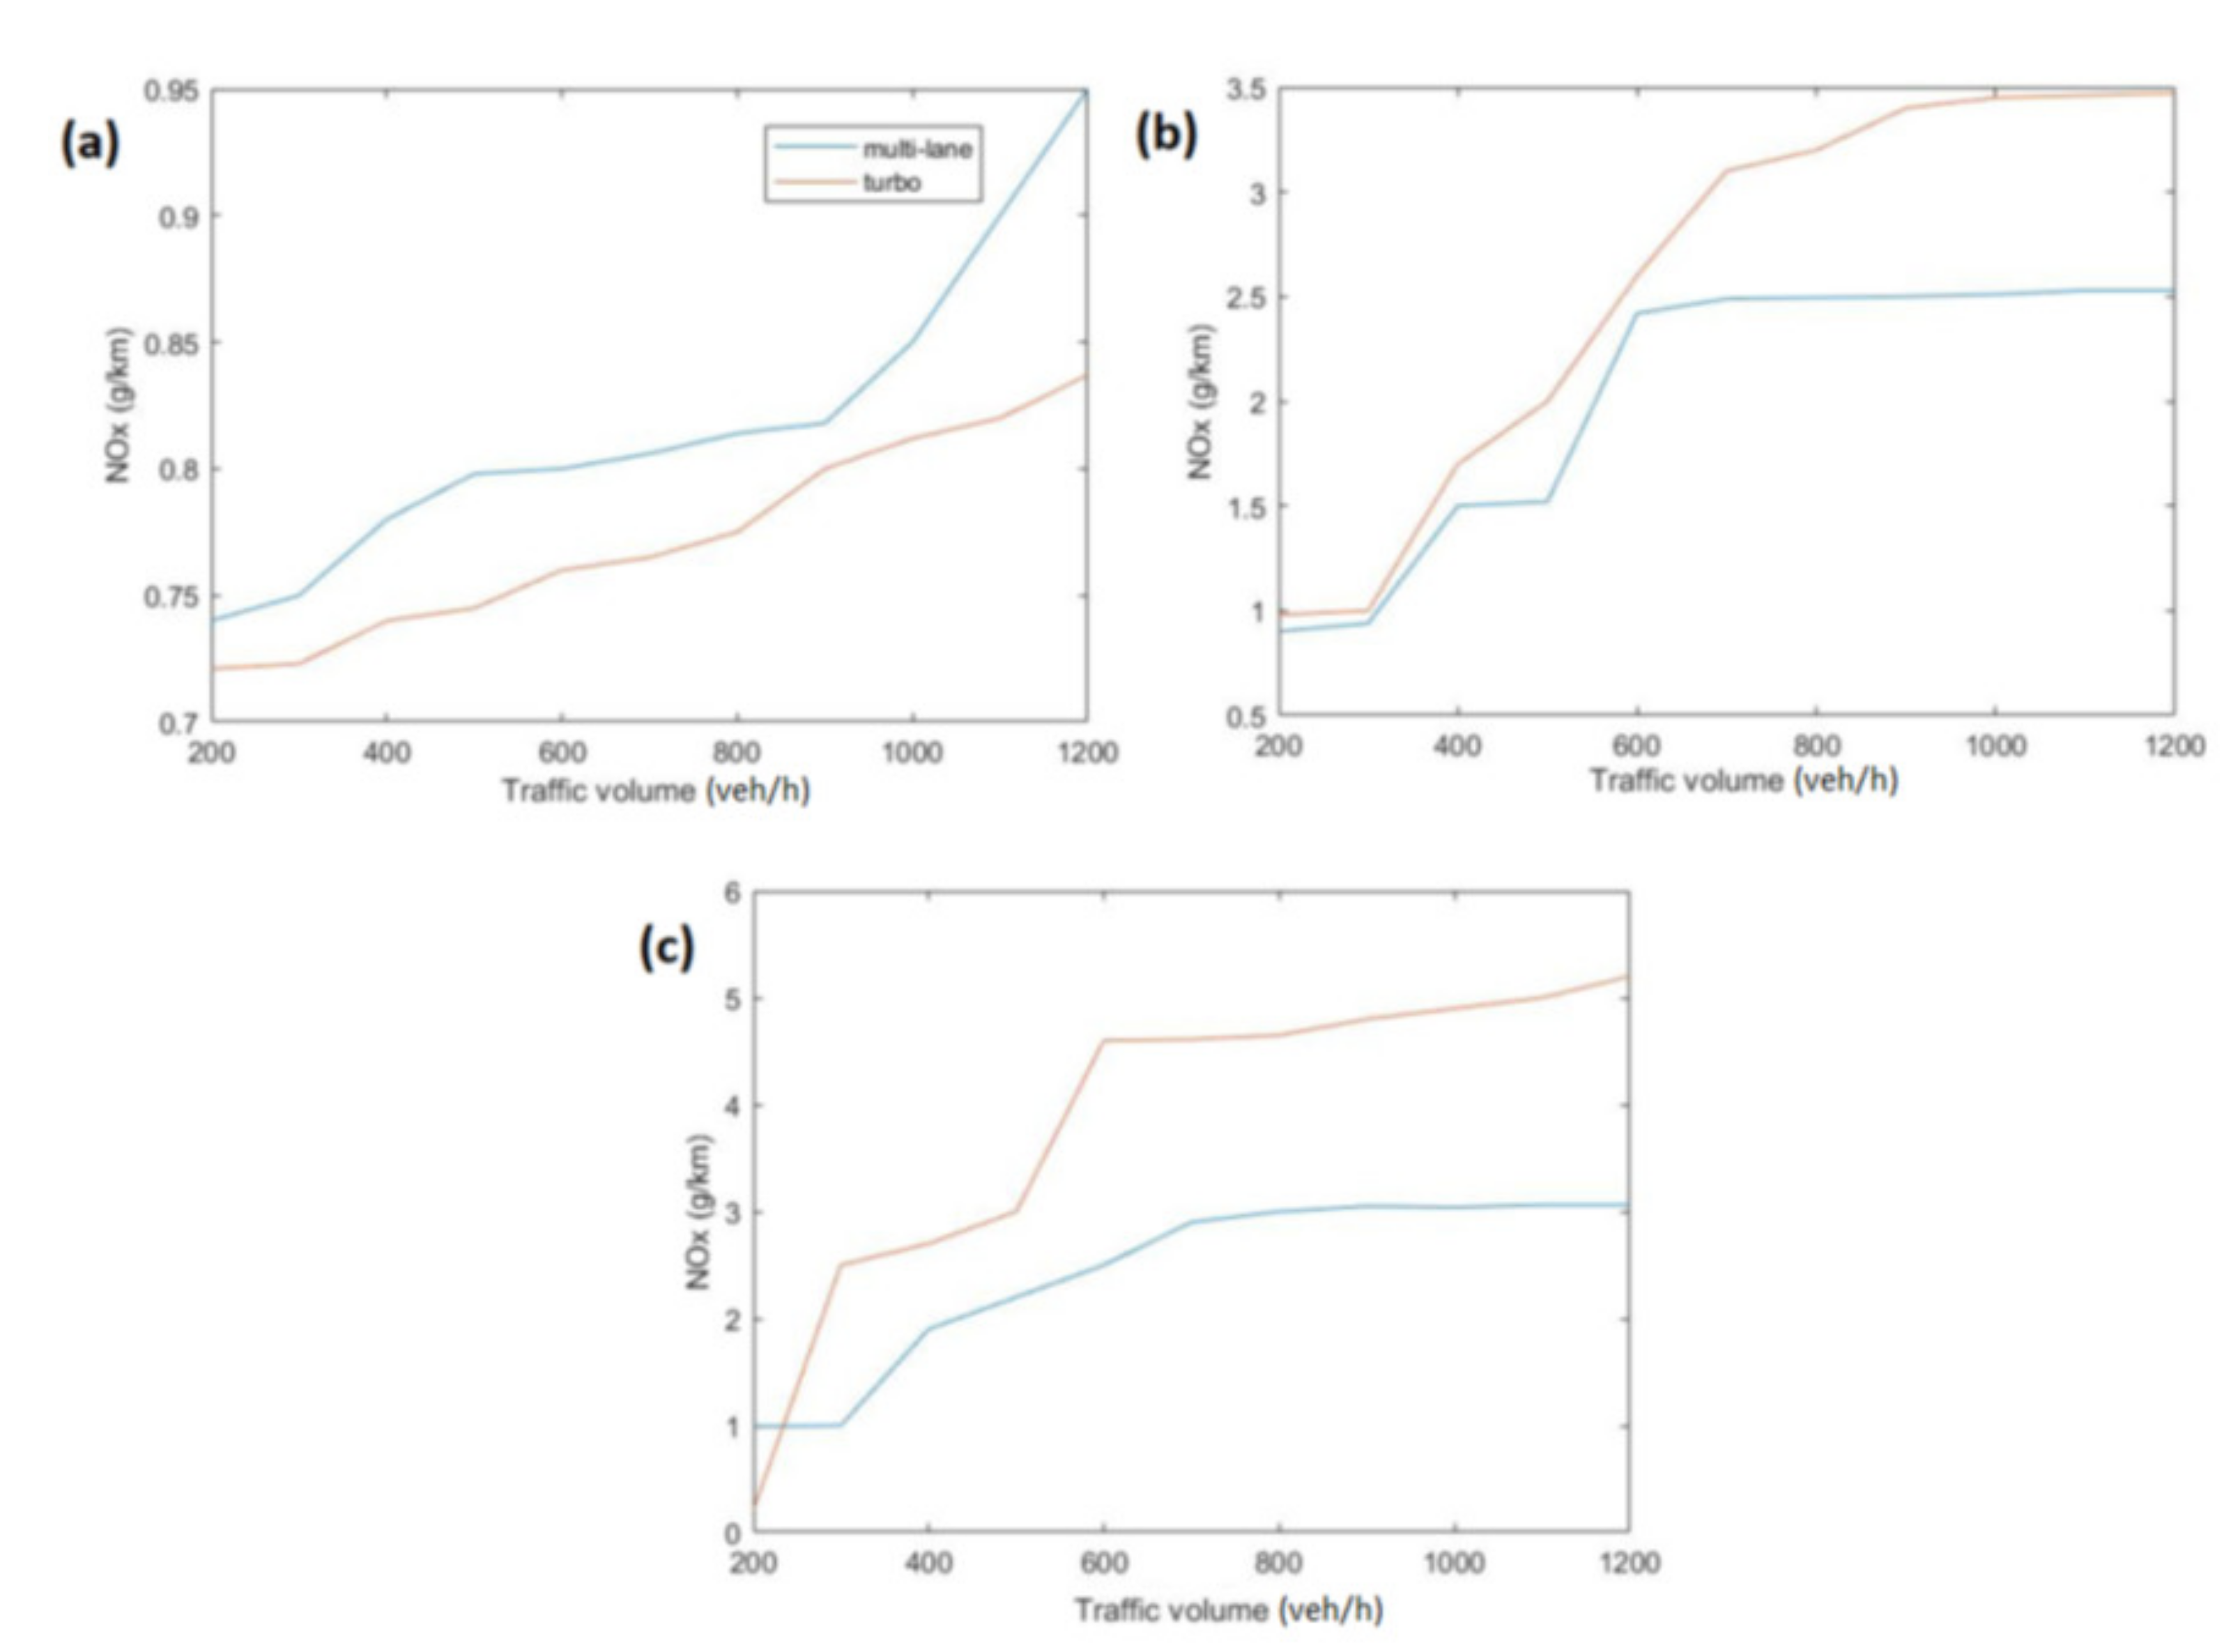
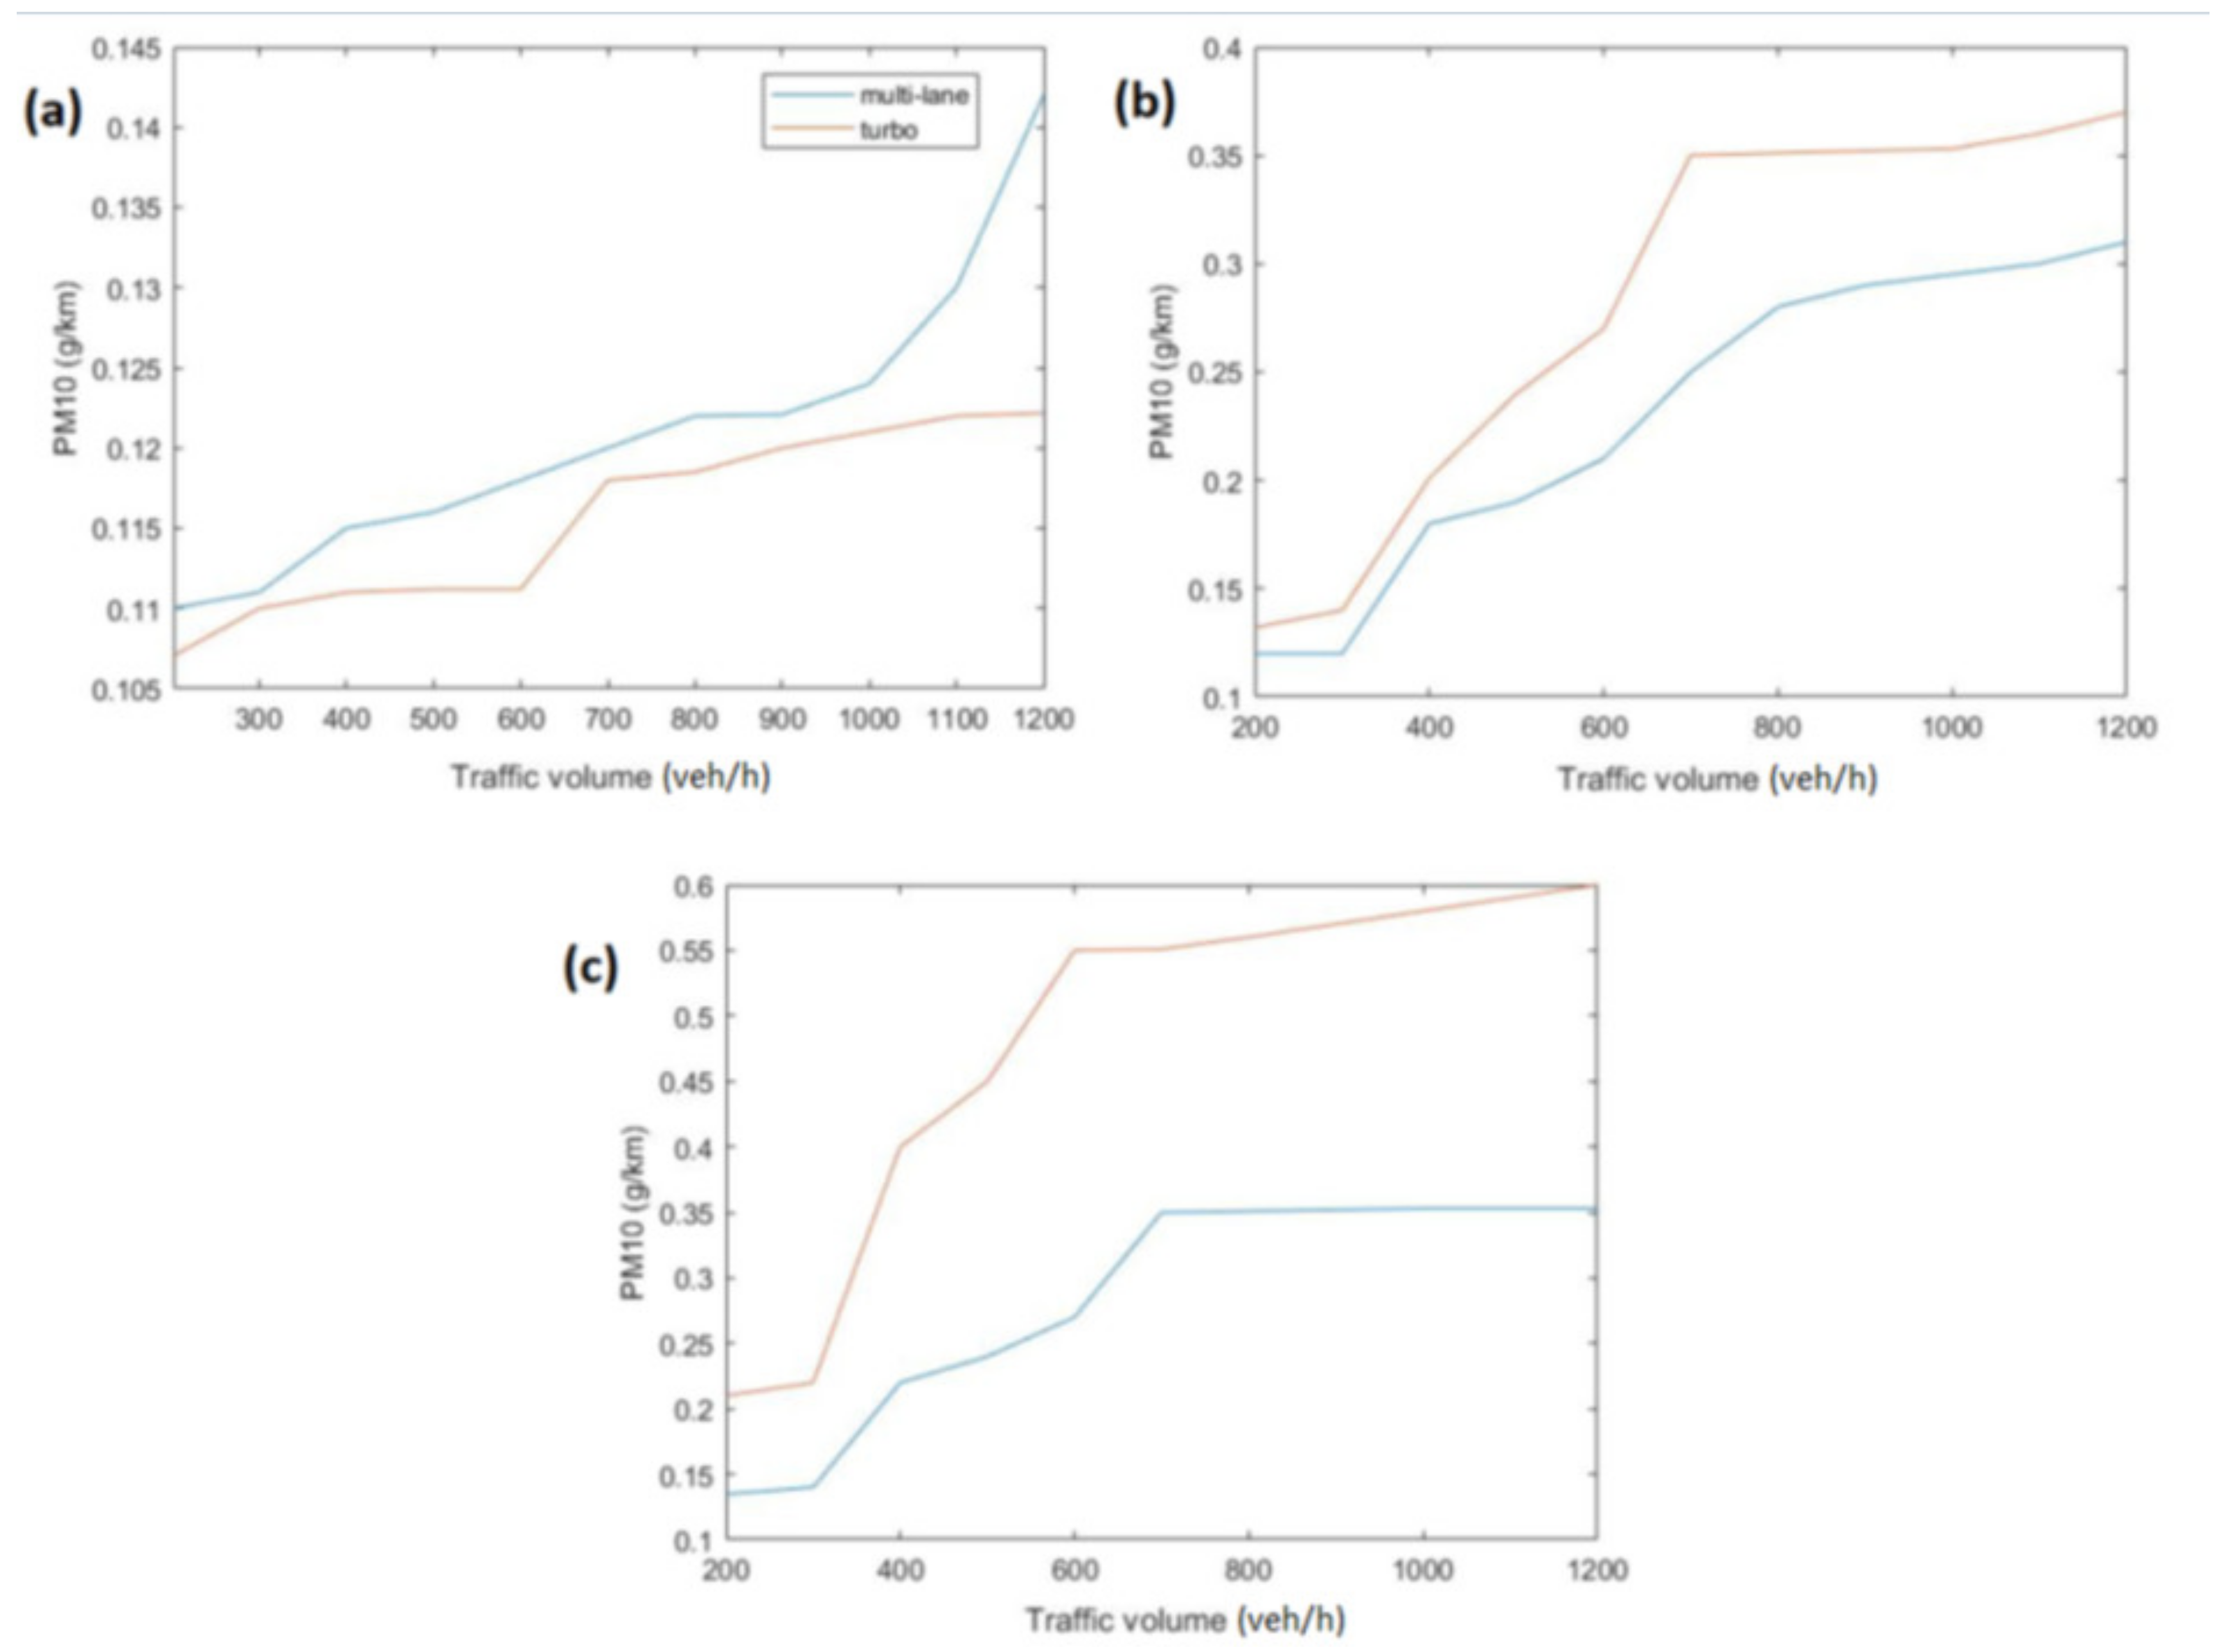
To determine the amount of exhaust pollutant emissions depending on the vehicle traffic volume parameter, 36 simulations were carried out. The scenarios were developed according to the traffic flow data of the conflict stream (vehicles moving along the roundabout circle) and the traffic flow at the selected inlet. The simulations were carried out for two roundabout inlet options: a multilane roundabout inlet and a turbo roundabout inlet (traffic relations: north-south). For both roundabouts, the following scenarios for the traffic flow of the conflict flow for individual lanes were adopted (in the case of a multilane roundabout, the traffic volume was distributed symmetrically over the lanes): 600—corresponds to low traffic intensity, 1400—corresponds to increased traffic intensity and 2000—corresponds to high traffic intensity. The number of vehicles at the inlets was taken from 100/100 (right/left lane) to 600/600. The variation in CO
2, NOx and PM10 emissions, depending on the described traffic flows, is shown in
Figure 15,
Figure 16 and
Figure 17.
Based on
Figure 15 it can be seen that for the circular flow in the roundabout, 600 and 1400 vehicles/h, both for the multilane and turbo roundabout, CO
2 emissions recorded a gradual increase in the value for the whole range of inlet volume, while for the volume of 2000 veh/h for the inlet vehicle volume of 700 veh/h (multilane roundabout) and 600 veh/h (turbo roundabout), the emission is set at a certain level and its changes are insignificant, which results from the super saturation of the model; comparing the CO
2 emission values from the multilane to turbo roundabout model, it can be noticed that for the roundabout circular flow, 600 veh/h, for the entire cross section of the inlet intensity, both the values and CO
2 are lower for the turbo roundabout.
Based on
Figure 16 it can be seen that for the circular flow in the roundabout of 600 vehicles/h, it can be noticed that from the value of 900 veh/h there is a visible increase in NOx emissions for a multilane roundabout. The same relationships can also be seen for the turbo roundabout in terms of circular flow in the roundabout of 1400 and 2000 veh/h for the traffic inlet volume of 300 and 500 veh/h, respectively. In general, NOx emissions across the entire studied range also show an upward trend with increasing inlet vehicle loads; comparing the emissions from a multilane roundabout to a turbo roundabout, it can be noticed that for the traffic flow of the conflict stream of circular flow in the roundabout 600, there is lower NOx emission for the turbo roundabout model, while for the remaining volumes, 1400 and 2000 veh/h, the multilane roundabout is characterized by lower NOx emissions. This state of affairs is due to the fact that in the case of a multilane roundabout, traffic on both roundabouts is divided into two lanes, while on a turbo roundabout it accumulates on one lane.
Based on
Figure 17 it can be seen that in terms of PM10 emissions for the scenario of circular flow in the roundabout of 600 veh/h for a multilane roundabout, a sharp increase in emissions from 1000 vehicles can be noticed, while for a turbo roundabout this can be observed from 600 vehicles. The values of PM10 emissions for the circular flow in the roundabout of 1400 to 500 veh/h for the traffic volume at the inlet are similar for both analyzed roundabout solutions. The case of circular flow in the roundabout of 2000 veh/h shows that for all the analyzed volumes at the roundabout inlet, the PM10 emission is higher for the turbo roundabout.
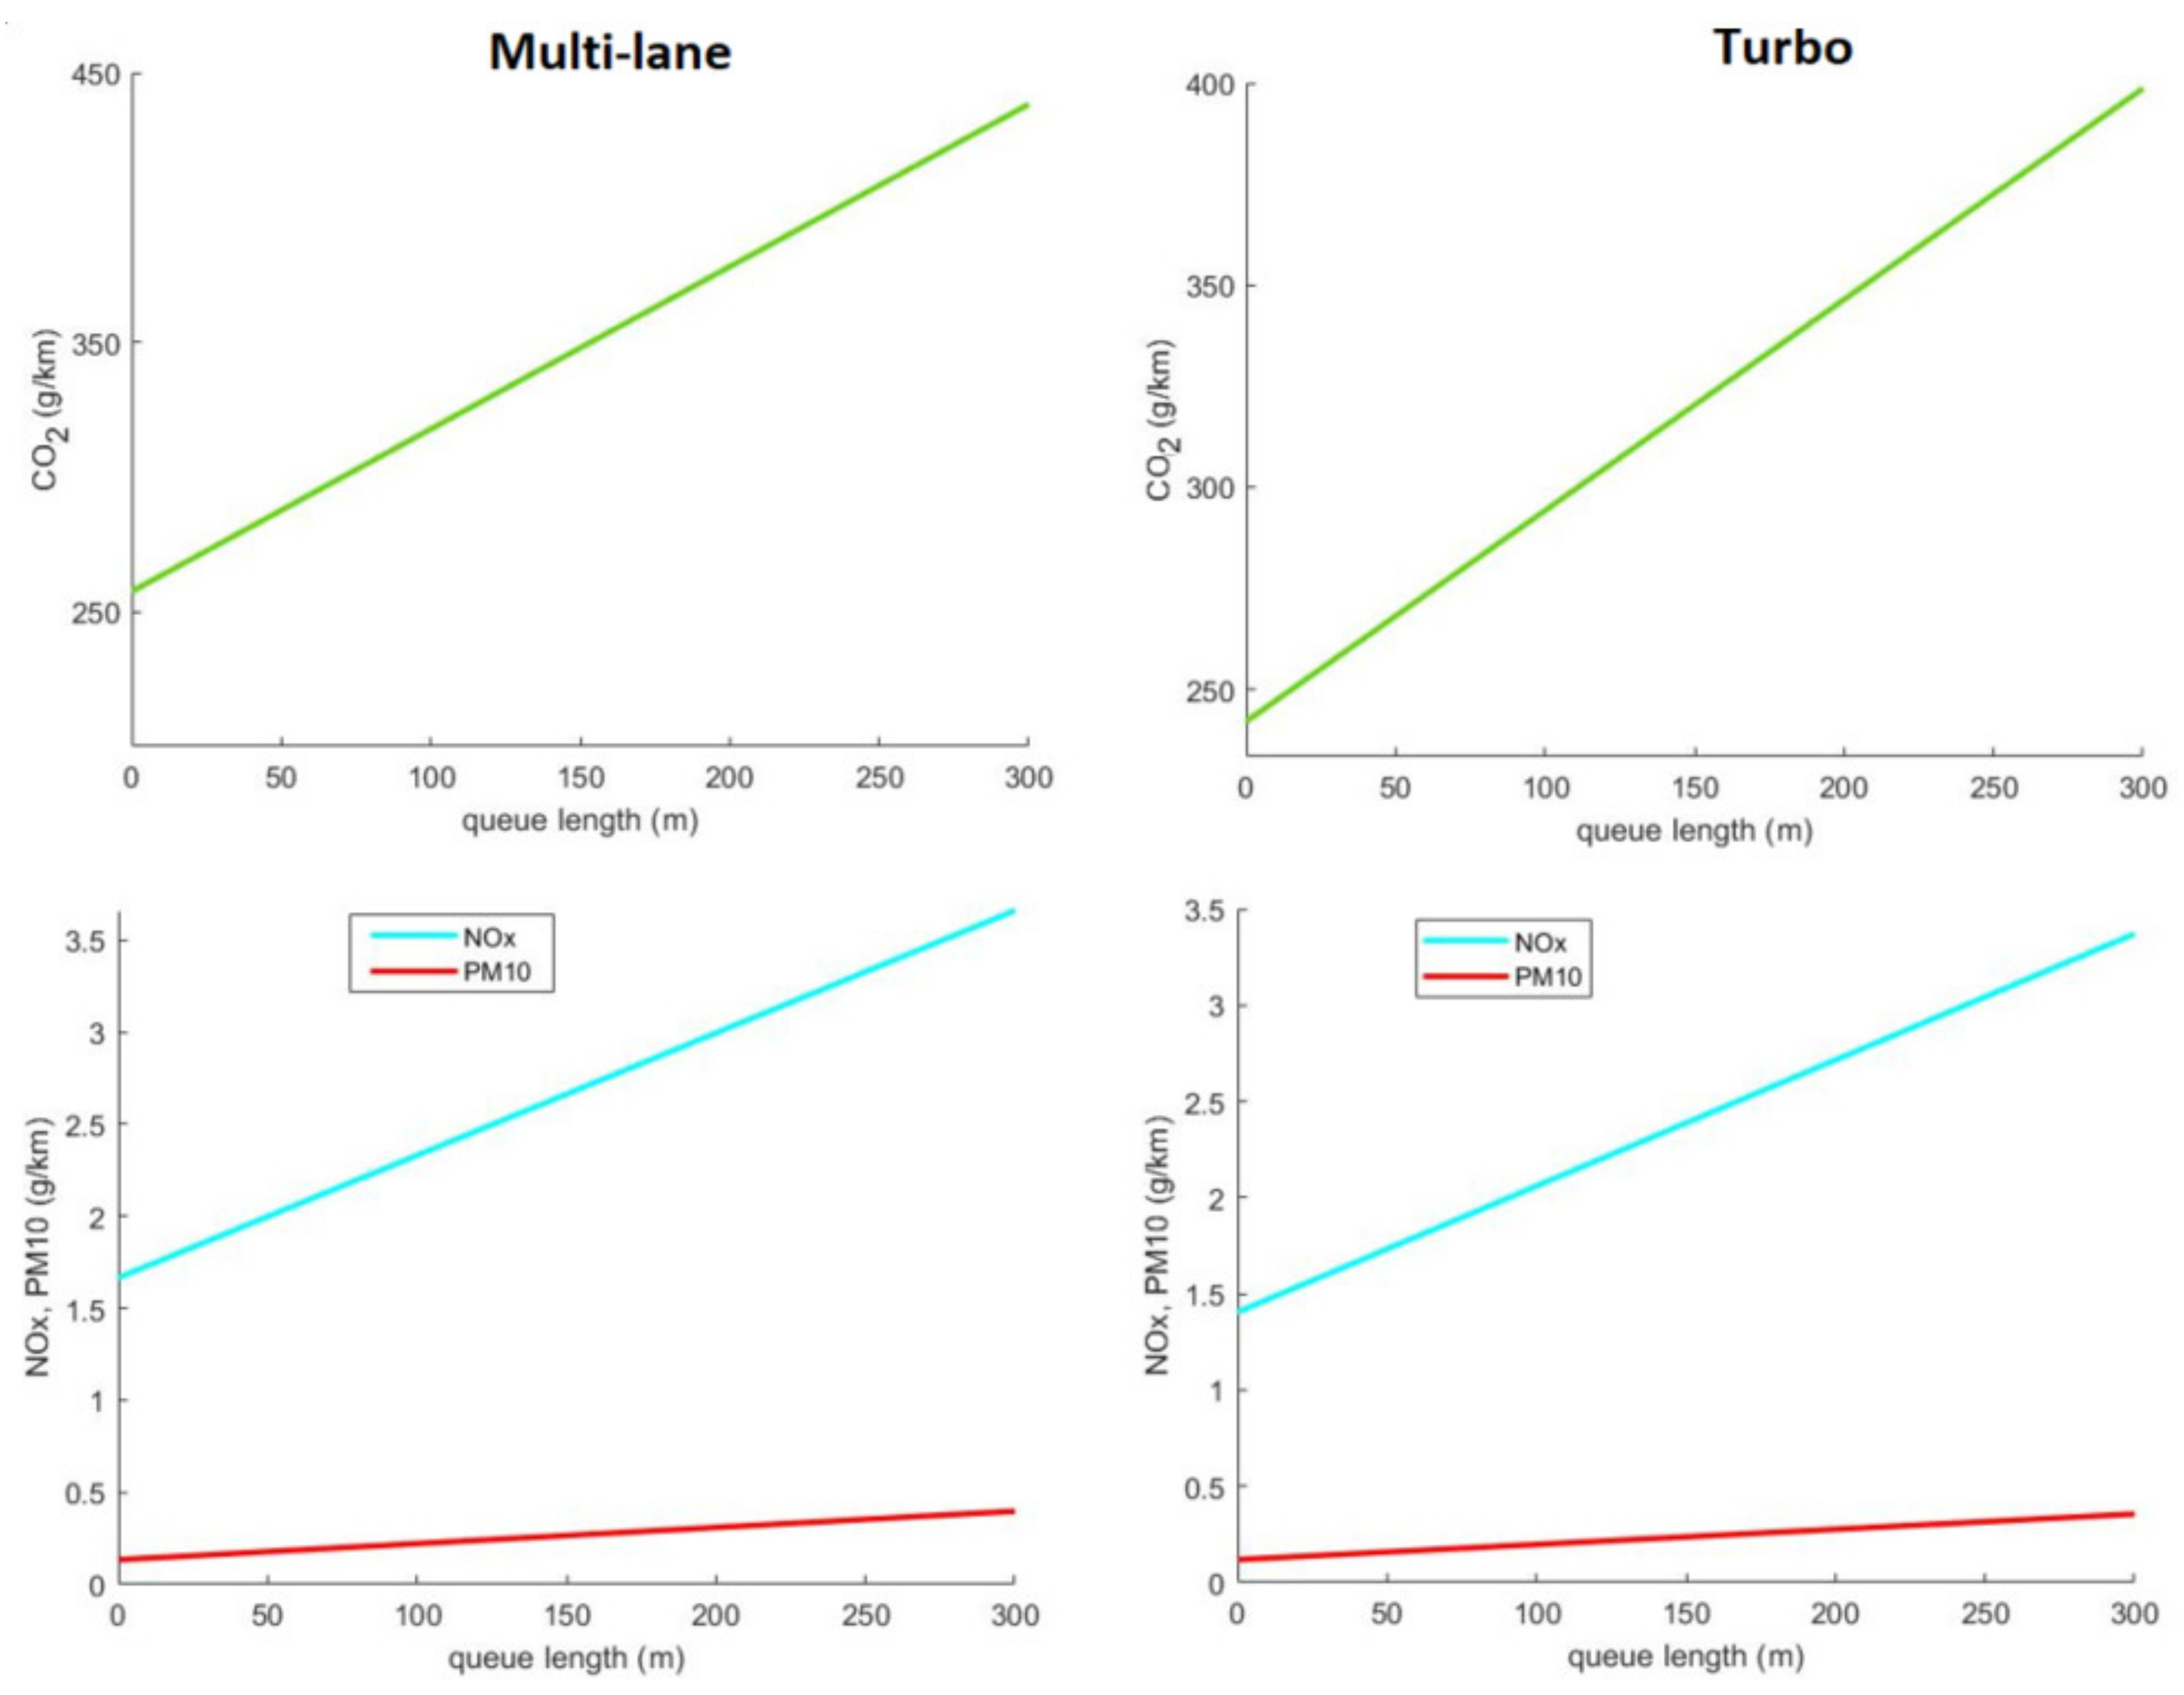
Another parameter of the vehicle traffic examined in relation to the emission of harmful exhaust components was the position in the queue of vehicles waiting to enter the roundabout.
The results presented in
Figure 18 present the average emission values depending on the length of the queue of vehicles to enter the roundabout. Value 0 represents a situation where road conditions can be defined as free flow traffic.
The results of exhaust pollutant emissions presented in relation to the positions of vehicles in queues at the access to the roundabout refer to the average values obtained from all tested inlets from the simulation models. The emission of exhaust pollutants at the access roads to the roundabout depends on the number and length of vehicle stops. The presented results are a linear regression of all individual vehicle data from the beginning of the analyzed section of the inlet to the roundabout entrance. Based on them, it can be concluded that:
along with the increase in the length of the queue of vehicles from 0 to 300 m, CO2 emissions from the initial value increases by approximately 180% for a multilane roundabout, and by approximately 160% for the turbo roundabout,
the increase in NOx and PM10 emissions for the queue length from 0 to 300 m, both for the multilane and turbo roundabout, is similar and amounts to approximately 220% for NOx and approximately 300% for PM10.
4. Conclusions
The research provides some interesting and potentially useful results in outlining the influence of roundabout design on CO2 and air pollutant emissions from car traffic under different traffic flows. This methodology can be applied to other urban and non-urban contexts. This first step of research has shown how traffic conditions can influence the function of roundabout intersections as an eco-friendly intervention in the urban environment for the enhancement of sustainable mobility planning. The stop-and-go phenomena, especially at multilane roundabouts, result in significant emissions of harmful gases and significantly higher fuel consumption than would be the case under conditions of smooth traffic flow. Therefore, it is possible to state that roundabouts are intrinsically eco-compatible only when the values of the transport parameters testify to that “continuous” operation that is at the basis of the very concept of a roundabout; this corresponds to values of the capacity/capacity ratio lower than unity and to average delays of stops in the branches that can be traced back to service levels far from the limit situation. The methodological approach adopted, i.e., the simulative-experimental one, is well suited for a rational characterization of one of the problems that afflict modern urban and metropolitan areas, i.e., air pollution.
The main driving force behind greenhouse gas emissions from transport is fleet size, fleet composition, modal share of car traffic and kilometers travelled. Traffic flow may have some impact, as shown in the article, but the authors do not discuss how relevant it is to these other factors. The optimization of interventions at urban scale has to consider a preventive and comparative evaluation of several scenarios concerning both traffic composition and possible new geometric-functional scenarios.
The comparative study is performed to understand which variations of pollutant concentrations could be present in the analyzed city and which could be potential risks for human health deriving from air pollution in the vicinity of the roundabout (e.g., pedestrians, motorists, residents). The results contribute to a small-scale view, i.e., on a limited area, and may only partially contribute to larger-scale emission levels in the city or country. Furthermore, the limitations for the simulation studies, particularly in the emission aspect, are some real-world parameters that are not analyzed in detail. Among others we can distinguish weight of the vehicle which is particularly related with the number of passengers and in the emission models it is not that clear to set up. However, despite the many disadvantages of the simulation, which is a generalization of what takes place in reality, it is possible to accurately reproduce the driving trajectory itself, for which the calibration methodology is presented in the paper. The simulated vehicle traffic input data in combination with accurate emission models are the only option for micro-scale emissions calculations, as it is impossible to equip every vehicle that crosses the researched road section in real life situations. As mentioned above, small-scale view emission analysis might be very relevant for human health risks from air pollution in the vicinity of the roundabout (e.g., pedestrians, motorists, residents), but for emission levels in the city or country, they are probably insignificant. Therefore, the illustrated methodology and comparison can be useful in the planning phase and the results can help urban planners to better balance traffic planning and air quality. These assessments will need to be correlated with more in-depth studies of the infrastructure construction phases in order to be able to analyses the emissions produced during the construction cycle and understand whether the benefits of construction are optimal in environmental terms.


 ,
, 


