Article

Harmonic Detection for Shunt Active Power Filter Using ADALINE Neural Network

Power Electronics, Energy, Machines and Control Research Group, School of Electrical Engineering, Suranaree University of Technology, Nakhon Ratchasima 30000, Thailand
*
Author to whom correspondence should be addressed.
Energies 2021, 14(14), 4351; https://doi.org/10.3390/en14144351
Submission received: 25 May 2021 / Revised: 13 July 2021 / Accepted: 14 July 2021 / Published: 19 July 2021
(This article belongs to the Section F: Electrical Engineering)

Abstract

:
This paper presents an efficient harmonic detection for real-time generation of the reference current fed to a shunt active power filter using the ADALINE neural network. This proposed method is a single layer with 101 nodes generating the coefficients referred to as weights of the reference current model. It effectively overcomes the drawback of the current technology, which is instantaneous power theory (PQ). The proposed method was implemented on the TMS320F28335 DSP board and tested against MATLAB with Simulink as a hardware-in-loop (HIL) structure. This method gives a good performance by producing a precise reference current in a short period with uncomplicated calculation. It also efficiently can eliminate individual harmonic current. The achieved percentage of total harmonic distortion (%THD) in the current is reduced following the IEEE standard, while the power factor can be maintained to unity.

1. Introduction

Today’s electrical technology employs a great number of power converters, which impose a stringent demand on power quality. It has been known that two major factors curtailing the power quality are current and voltage harmonics, and reactive power. To maintain the power quality up to industrial standards, one may choose to compensate either of the two or both. As non-linear loads are common in industry, they introduce a large amount of current distortion drawn from the source. In effect, the source voltages distort to a certain extent. Such current harmonic distortion further increases reactive power, hence decreases power factor [1]. A good practical approach to mitigate this problem is to use a shunt active power filter (SAPF) with a voltage source inverter (VSI). A strong point of this type of filter is that it does not cause a resonant problem, and has a low power loss [2,3]. SAPF is a tool for injecting the compensated current into the point of common coupling (PCC) to reduce the total harmonic distortion (THD) under the standard of IEEE std. 519-1992 [4].
For an APF to effectively operate, the detailed harmonics to be compensated must be known. The process to obtain this is referred to as harmonic detection. Many harmonic detection methods have been proposed such as Kalman filter [5], discrete Fourier transform (DFT) [6], instantaneous power theory (PQ) [7], sliding window Fourier analysis (SWFA) [8], the a-b-c reference frame [9], the synchronous detection (SD) [10], the synchronous reference frame (SRF) theory or the d-q axis (DQ) [11], the synchronous detection with Fourier (SDF) method [12], and the d-q axis with Fourier (DQF) method [13]. References [13,14,15,16,17,18,19] studied the advantages and drawbacks of various harmonic current detection methods. It has been found that the methods of PQ, DQ, SD, the a-b-c reference frame, and SRF are not accurate enough for harmonic detection when the power system is not ideal. This is because it uses a filter for separating the harmonic quantity from the fundamental quantity. It is also extremely difficult to apply for detecting the individual harmonic currents in combination with hybrid power filters. The SD method poorly identifies the harmonic and reactive quantities when the system is unbalanced. The a-b-c reference frame and SWFA methods give poor reactive quantification, both balanced and unbalanced systems. The SWFA and DQF methods, although accurate, are very complicated for harmonic current components calculations. In addition, there are some electric power loads that generate the DC quantity in the power system [20,21]. Also, nowadays, the renewable energy systems are connected to the main power grid distribution system, resulting in the DC quantity being generated in the power system. This causes problems for transformer and circuit breaker operations [22,23,24,25]. Therefore, SAPF is also essential to have the ability to reduce the DC quantity generated in the power system as well. The method mentioned above for detecting harmonic currents cannot work with good performance under an electrical system with a DC quantity occurs. A neural network (NN) has a learning and training property that can quickly and accurately estimate the harmonic current components [26,27,28,29,30,31,32,33,34,35,36]. The NN can be designed to counteract the drawback of the traditional detection methods with good performance. It can detect the individual harmonic current, the DC quantity, and the reactive quantity using a simple equation. It is also very flexible in its application. The NN can be designed to counteract the drawback of the traditional identification methods with good performance. Hence, this paper selects NN as a methodology to detect harmonic current components.
This paper proposes the use of the ADALINE neural network to generate 101 weighting factors of the reference current model. The computed reference current is fed to an APF, which in turn generates compensated currents injected into the three-phase system. Doing it this way, the reference current obtained is highly accurate. Hence, this current harmonic compensation is effective. The advantage of ADALINE is that it can cope with a quickly changing state of the system. As a result, it quickly and accurately separates the individual harmonic. It can be used as an efficient tool to detect the some harmonic for hybrid power filter (HPF) and a DC component as well. Figure 1 represents the proposed filtering system that is connected to a three-phase power system. The PI controller is applied for the current loop and DC bus voltage loop controls.
This paper has the following parts: Section 2 presents the analysis and the calculation to find the reference current which consists of the harmonic current and the reactive component using the learning and training weight from the ADALINE neural network, then presents the individual harmonic detection method. Section 3 presents the simulation with the hardware-in-loop (HIL) technique, while the simulation results with the discussion are presented in Section 4. The last section concludes and analyzes the simulation results presented in the previous section.

2. Harmonic Detection and Power Factor Improvement

Non-linear electrical load causes serious current distortion. Such distortion is represented by harmonic components of the current expressed by the term i h ( t ) in Equation (1). Fourier series expansion has been effectively used as its representation as indicated by Equation (2) in which the current i(t) composed of its DC, fundamental, and harmonic components.
i ( t ) = I 0 + i 1 ( t ) + i h ( t )
i ( t ) =             I 0       DC   component +       [ A 1 cos ( ω 0 t ) + B 1 sin ( ω 0 t ) ] fundamental   component                         + h = 2 50 [ A h cos ( h ω 0 t ) + B h sin ( h ω 0 t ) ] harmonic   component
Equation (3) can be rewritten in a matrix form as described by Equations (4)–(6).
i   ( t ) = b + [ w 1 x 1 + w 2 x 2 ] + [ w 3 x 3 + w 4 x 4 ] + + [ w 99 x 99 + w 100 x 100 ]
i ( t ) = b + W X
W = [ A 1 B 1 A 2 B 2 A 50 B 50 ] = [ w 1 w 2 w 3 w 4 w 99 w 100 ]
X = [ cos ( ω 0 t ) sin ( ω 0 t ) cos ( 2 ω 0 t ) sin ( 2 ω 0 t ) cos ( 50 ω 0 t ) sin ( 50 ω 0 t ) ] T       = [ x 1 x 2 x 3 x 4 x 99 x 100 ] T

2.1. Instantaneous Reactive Power Theory

The instantaneous reactive power theory (PQ) is a well-known and widely used method of harmonic detection and can detect the harmonic current components, such as identifying harmonic currents, reactive power compensation, and the calculation process better than other methods as mentioned above. Therefore, the researcher has chosen the PQ method to compare with the proposed method. A calculated procedure for a 3-phase 3-wire electrical system is shown in Figure 2. It begins by converting the supply voltage ( v S a , v S b , v S c ) and the load current in 3-phase form ( i L a , i L b , i L c ) to the electrical quantity on the α β axis without zero-sequence using Clarke transform, then calculates to find the instantaneous active power ( p L ) and the instantaneous reactive power ( q L ). Hence, a high-pass filter is used to separate the harmonic active power from the instantaneous active power for calculating the reference current on the α β axis ( i C α * , i C β * ), then convert this reference current from the α β quantity to the 3-phase quantity ( i C a * , i C b * , i C c * ). From the process of the PQ harmonic detection mentioned above. It can be seen that both the source voltage and the load current were used in the calculation. They are also used in conjunction with high-pass filtering to separate the active power of the fundamental quantity and the harmonic quantity for calculating the reference current which contains both the amount of harmonic current and the reactive power.

2.2. ADALINE Neural Network

The form of Equation (4) is similar to the output equation of a neural network, where b is bias, W is the weight matrix, and X is the input matrix. Therefore, adopting the ADALINE neural network is conceptually straightforward. This method applies the least mean square (LMS) learning technique which this proposed ADALINE neural network is capable of training and learning in real time [31]. The diagram in Figure 3 represents the structure of the proposed ADALINE neural network for harmonic current detection. This proposed real-time harmonic extraction has the target for learning and training is the load current i L ( t ) of each phase, the input X is the sine and cosine term of the 50 harmonic orders with the 100-weight updating are the coefficient of the sine and cosine terms. Besides, the DC component of the Fourier series as in Equation (2) comes from a bias updating. The update of weight and bias is based on NN supervised training which is used in this learning and training to keep the error value to a minimum. This means that the output i ( t ) as in Equation (4) is closest to the target i L ( t ) .
Consider a sinusoidal voltage supply represented by:
v S ( t ) = V m sin ( ω 0 t + θ v )
When the supply feeds a non-linear load such as a power converter, the current contains harmonic components expressed by:
i S ( t ) = I 0 + [ w 1 cos ( ω 0 t ) + w 2 sin ( ω 0 t ) ] + h = 2 50 [ w ( 2 h 1 ) cos ( h ω 0 t ) + w ( 2 h ) sin ( h ω 0 t ) ]
The instantaneous power can simply derive as shown by Equations (9) and (10).
p ( t ) = v S ( t ) × i S ( t )
p ( t ) = I 0 V m sin ( ω 0 t + θ v ) + w 1 V m 2 [ sin ( θ v ) + sin ( 2 ω 0 t + θ v ) ] + w 2 V m 2 [ cos ( θ v ) cos ( 2 ω 0 t + θ v ) ] + V m 2 h = 2 50 w ( 2 h 1 ) [ sin ( ( h 1 ) ω 0 t + θ v ) + sin ( ( h + 1 ) ω 0 t + θ v ) ] + V m 2 h = 2 50 w ( 2 h ) [ cos ( ( h 1 ) ω 0 t + θ v ) cos ( ( h + 1 ) ω 0 t + θ v ) ]
As a result, the average power and the fundamental active current are expressed by Equations (11)–(13), respectively.
P = w 1 V m 2 sin ( θ v ) + w 2 V m 2 cos ( θ v ) = ( w 1 2 sin ( θ v ) + w 2 2 cos ( θ v ) ) ( V m 2 )
I 1 P = 2 P V m = w 1 sin ( θ v ) + w 2 cos ( θ v )
i 1 p ( t ) = I 1 P sin ( ω 0 t + θ v ) = [ w 1 sin ( θ v ) + w 2 cos ( θ v ) ] sin ( ω 0 t + θ v )
For a balanced three-phase system, the instantaneous fundamental active currents can be expressed by Equations (14)–(16) for phases a, b, and c, respectively.
i 1 p a ( t ) = w 2 a sin ( ω 0 t )
i 1 p b ( t ) = [ 0.866 w 1 b 0.5 w 2 b ] sin ( ω 0 t 2 π 3 )
i 1 p c ( t ) = [ 0.866 w 1 c 0.5 w 2 c ] sin ( ω 0 t + 2 π 3 )
When the voltage source supplies the current to a non-linear load, the DC component of some load, the active current and reactive current will occur in each harmonic order as shown in Equation (17), where, i 1 p , i 1 q , i h p and i h q are the fundamental active current, the fundamental reactive current, the harmonic active current, and the harmonic reactive current in each order, respectively.
i L ( t ) = I 0 + i 1 ( t ) + i h ( t ) = I 0 + ( i 1 p + i 1 q ) + h = 2 50 ( i h p + i h q )
The purpose of SAPF is to compensate for harmonic currents and reactive power into PCC of electrical power systems. This is so that the source current has a shape close to the sinusoidal waveform and the phase angle is in phase with the voltage phase angle of each phase. Hence, it is necessary to find a reference current composed of a DC component, harmonic currents, and reactive currents at fundamental frequencies. These components are used as the reference quantity for the current control for switching VSI to inject the compensated current into the system at the PCC. The source current is shown in Equation (18) with a shape close to the sinusoidal waveform and the phase angle in phase with the phase angle of the source voltage in each phase. The source current is an active current at fundamental frequency calculated from Equation (19), so the required reference current will be obtained from Equation (20). The calculated process is shown in Figure 4.
i S = i L i C
i 1 p = i L [ I 0 + i 1 q + h = 2 50 ( i h p + i h q ) ]
i C * = I 0 + i 1 q + h = 2 50 ( i h p + i h q )
Figure 5a shows the whole reference current calculation as proposed previously. It also shows that the amplitude of the active current ( I P k ) in each phase is the combination of the amplitude of the fundamental active current ( I 1 P k ) and the amplitude of the DC bus active current ( I C d c ). This active current occurs from the process of controlling the DC bus voltage equal to the reference voltage.
The elimination of the individual harmonic (IH) which is detected by the ADALINE neural network can be easily achieved as shown in Figure 3 The individual harmonic component of each order can be separated by the learning and training process of the network as represented by Equation (3). Each harmonic is separated from the load current which is used as a target in a real-time learning and training process with the maximum harmonic at order 50. The separation can be achieved by Equation (21).
For example, the reference current of the individual harmonic current detection process, i C I H * , is achieved by the compensation of the fundamental reactive current i 1 q and the harmonic current order 2nd ( i h 2 ) to order 5th ( i h 5 ) as shown in Equation (22). Figure 5b shows the reference current calculation for the individual harmonic elimination process.
i L ( t ) = I 0 + i 1 p ( t ) + i 1 q ( t ) + i h 2 ( t ) + i h 3 ( t ) + i h 49 ( t ) + i h 50 ( t )
i C I H * = i 1 q + i h 2 + i h 3 + i h 4 + i h 5

3. Active Power Filter System

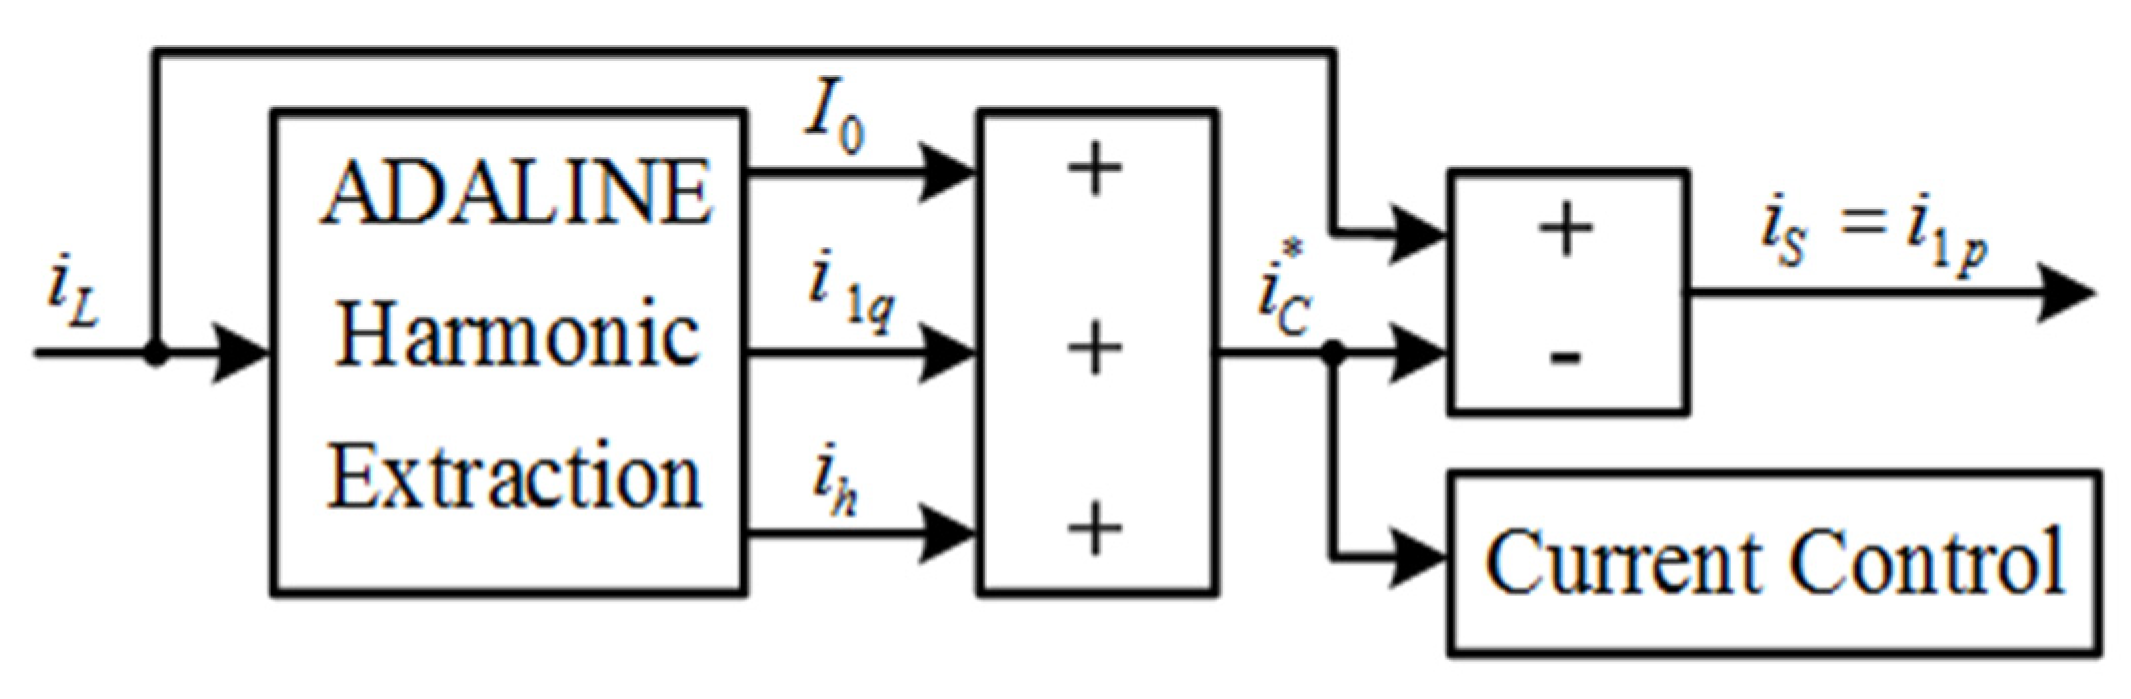
3.1. System Parameter and Controller Design

The design of the voltage source inverter is crucial to the performance of the current injection into the PCC in various processes, such as the selection of the reference DC bus voltage ( V d c * ), the inductance design process, L f [37], and the capacitor design process, C d c [38]. Following the references, this simulation used V d c * = 360 V, L f = 18 mH, and C d c = 2350   μ F. There are two PI controllers required for controlling the current and the DC bus voltage. The controllers design of this article is followed the reference [39]. Table 1 summarizes the controller parameters thus obtained.

3.2. System Simulation

The simulation to evaluate the performance of the APF system using the proposed method will use the hardware-in-loop (HIL) simulation which is the combination between MATLAB with Simulink of The MathWorks, Natick, MA, USA, and eZdsp TMS320F28335 board of Spectrum Digital Incorporated, Stafford, TX, USA. The eZdsp board will serve all calculation parts, while Simulink will simulate and illustrate the results. The configuration of HIL is shown in Figure 6 and the device configuration of the HIL is shown in Figure 7.

4. Results and Discussion

This section presents the simulation results of the purposed method, ADALINE harmonic detection, for the balanced three-phase power system with all harmonic order elimination and and individual harmonic elimination. The result will be compared with the result received from PQ harmonic detection theory with a second-order butter-worth LP filter having its cutoff frequency at 30 Hz. These parameters of the LP filter give the best performance for the considered load.

4.1. All Harmonic Orders Elimination

4.1.1. Case 1: Odd and Even Harmonic Load

The simulation of the balanced three-phase power system with non-linear load is presented in this case. Within simulated duration between 0 Time < 0.25 s, the load current ( i L ) in each phase consists of the fundamental frequency and harmonics in the 5th order as shown in Equations (23)–(25). Equations (26)–(28) show the increase of the harmonic current load in even order (4th, 8th) and odd order (7th, 11th, 13th) in the duration 0.25 Time < 0.5   s . Such a load has the phase angle lagging the voltage phase angle equal to π / 6 .
At 0 Time < 0.25 s.
i L a , t 1 ( t ) = 5 sin ( ω 0 t π 6 ) + 1.2 sin ( 5 ω 0 t π 6 )
i L b , t 1 ( t ) = 5 sin ( ω 0 t 2 π 3 π 6 ) + 1.2 sin ( 5 ω 0 t 10 π 3 π 6 )
i L c , t 1 ( t ) = 5 sin ( ω 0 t + 2 π 3 π 6 ) + 1.2 sin ( 5 ω 0 t + 10 π 3 π 6 )
At 0.25 Time < 0.5 s.
i L a , t 2 ( t ) = i L a , t 1 ( t ) + 0.6 sin ( 4 ω 0 t π 6 ) + 0.9 sin ( 7 ω 0 t π 6 )                                     + 0.3 sin ( 8 ω 0 t π 6 ) + 0.4 sin ( 11 ω 0 t π 6 ) + 0.3 sin ( 13 ω 0 t π 6 )
i L b , t 2 ( t ) = i L b , t 1 ( t ) + 0.6 sin ( 4 ω 0 t 8 π 3 π 6 ) + 0.9 sin ( 7 ω 0 t 14 π 3 π 6 )                         + 0.3 sin ( 8 ω 0 t 16 π 3 π 6 ) + 0.4 sin ( 11 ω 0 t 22 π 3 π 6 )                         + 0.3 sin ( 13 ω 0 t 26 π 3 π 6 )
i L c , t 2 ( t ) = i L c , t 1 ( t ) + 0.6 sin ( 4 ω 0 t + 8 π 3 π 6 ) + 0.9 sin ( 7 ω 0 t + 14 π 3 π 6 )                         + 0.3 sin ( 8 ω 0 t + 16 π 3 π 6 ) + 0.4 sin ( 11 ω 0 t + 22 π 3 π 6 )                         + 0.3 sin ( 13 ω 0 t + 26 π 3 π 6 )
Figure 8 shows the simulation results of the signal of all three-phase for case 1. The PI controller that has K P V = 0.312 and K I V = 6.96 is used to control the DC bus voltage of VSI. This voltage should equal the reference DC voltage (360 volts). It changed a little bit at a time every 0.25 s that the load changed. After injecting the compensated current ( i C ) with SAPF using that proposed method, the source current ( i S ) of each phase is close to sinusoidal and in-phase with the source voltage make the power factor unity. When the load changed at 0.25 s, the compensated current could adjust according to the change in the load current ( i L ). The source current of all three-phase remained near to a sinusoidal waveform and in-phase with the source voltage in a balanced system. All three-phase operate at a 120-degree difference phase angle and the same magnitude. The performance of the proposed method was slightly better than the PQ method.
The source current spectrum of the system before and after the load changing at a time of 0.25 s is shown in Figure 9. The first interval, 0 Time < 0.25 s, the spectrum of phase A, B, and C before compensation has fundamental quantity and the harmonic order 5th. After compensation, the spectrum has only a fundamental quantity, as shown in Figure 9a. The second interval, 0.25 Time < 0.5 s, the source current spectrum of phase A, B, and C before compensation composed of the fundamental quantity and the harmonic quantity at various order (4th, 5th, 7th, 8th, 11th, and 13th), which corresponds to Equations (26)–(28). After compensation, there is only the fundamental component spectrum, as shown in Figure 9b.
Table 2 shows the average performance value of both %THD and power factor (PF) of SAPF operation using ADALINE harmonic detection compared with the PQ method. The ADALINE method gives a slightly better value than the PQ method. In terms of PF improving, both methods yield the same value, PF = 1.

4.1.2. Case 2: Harmonic Load with DC Component

Case 2 presents the simulation with a non-linear load in a balanced three-phase power system. In theory, the power converters which has the non-linear load can create the DC component. The example of power converters mentioned above is a transformerless grid-connected system for renewable energy and DC/AC drives, etc. In this case, the load current of each phase consists of the harmonic component and is shown in Equations (29)–(31) at a time between 0 to 0.5 s. At between 0.5 to 1 s, the DC component from the load currents is increasing, as shown in Equations (32)–(34) and the phase angle is lagging with the voltage phase angle equal to π / 6 .
At 0 Time < 0.5 s.
i L a , t 1 ( t ) = 5 sin ( ω 0 t π 6 ) + 1.2 sin ( 5 ω 0 t π 6 ) + 0.9 sin ( 7 ω 0 t π 6 )
i L b , t 1 ( t ) = 5 sin ( ω 0 t 2 π 3 π 6 ) + 1.2 sin ( 5 ω 0 t 10 π 3 π 6 ) + 0.9 sin ( 7 ω 0 t 14 π 3 π 6 )
i L c , t 1 ( t ) = 5 sin ( ω 0 t + 2 π 3 π 6 ) + 1.2 sin ( 5 ω 0 t + 10 π 3 π 6 ) + 0.9 sin ( 7 ω 0 t + 14 π 3 π 6 )
At 0.5 Time < 1 s.
i L a , t 2 ( t ) = i L a , t 1 ( t ) + 2
i L b , t 2 ( t ) = i L b , t 1 ( t )
i L c , t 2 ( t ) = i L c , t 1 ( t ) 2
The simulation results in this case for ADALINE harmonic detection are shown in Figure 10 which starts with the first interval, 0 ≤ Time < 0.5 s, the balanced load current and has the harmonic current order 5th and 7th. The waveform that occurred in the system where the DC bus voltage control ( V d c ) can be controlled by the PI controller with K P V = 0.104 and K I V = 2.32 is equal to the referenced voltage 360 volts since Time ≥ 0.2 s. At the interval 0.5 ≤ Time < 1 s, the DC component is added into the current load in phase A and phase C. It affects the DC bus voltage. The voltage is fluctuating between the range of V d c * = ± 2 volts, but still maintains an average of 360 volts. At phase A, the load current ( i L a ) has a DC component increase of 2 amperes at 0.5 s, the compensated current ( i C a ) of phase A which is injected into the PCC has the average equal to 2 amperes as well. At phase C, the load current ( i L c ) has a DC component decrease of 2 amperes at 0.5 s, the compensated current ( i C c ) of phase C has an average value equal to −2 amperes. In phase B, the load current ( i L b ) is not changed at all. Even though the load current at phase A and phase C change at time 0.5 s, the waveform of the source current in all three phases remains close to sinusoidal and balanced. The %THDav is decreasing from 30 to 2.93 and all three-phase have a unity power factor. The PQ harmonic detection method cannot make balanced the source current.
Figure 11 shows the spectrum of the source current before and after the compensation of all three phases for the first interval, 0 ≤ Time < 0.5 s. Both ADALINE and PQ for the harmonic detection method, before the compensated current injection, there is the harmonic current at the 5th and 7th order. After injecting the compensated current into PCC, there is only the fundamental component spectrum.
The second interval at 0.5 Time < 1 s, in case the DC component occurs in the transmission line, after compensation, the ADALINE harmonic detection method can maintain a good performance, it has only the fundamental component. While the PQ method has the magnitude of the fundamental component, the DC component and the 2nd harmonic current equal to 4.35, 0.4, and 0.48 amperes, consecutively at phase A and B, where at phase C has the magnitude of the fundamental component and the 2nd harmonic current equal to 4.35 and 0.48 ampere, respectively, as shown in Figure 12. Therefore, the %THD of the PQ harmonic detection method is worse than the proposed method, which the comparison result of the average performance value in case 2 as shown in Table 3. Both methods have a good performance for improving PF. The proposed method mitigates the harmonic current better than the PQ method.

4.1.3. Case 3: Bridge Rectifier Load

This case is the performance evaluation using a bridge rectifier with series RL load as a non-linear load connected to the system. In the first interval, 0 Time < 0.25 s, the resistance is equal to 90 Ω and the inductance is equal to 0.5 H. In the second interval, 0.25 Time < 0.5 s, the load change by decrease the resistance to 45 Ω , and the inductance remain the same.
Figure 13 shows the simulation result of case 3. The PI controller can perform both the DC bus voltage control and the current control as well as the previous cases. In this case, the PI controller of the DC-Bus voltage Controller uses K P V = 0.312 and K I V = 6.96 . At a time of 0.25 s, the DC bus voltage is changed a little bit because of the changing of the current load but it is still able to be controlled as equal to the reference voltage 360 volts. Based on the simulation for the signal in all three-phase as shown in Figure 13, when the load current ( i L ) changes in a balanced system, the harmonic detection will recalculate for the reference current ( i C * ). Therefore the source current ( i S ) also changes when the compensated current ( i C ) is injected into the system at PCC but still has close to sinusoidal and in-phase with the source voltage ( v S ) of each phase in a balanced system.
After compensation, the harmonic spectrums of all three-phase are eliminated from the source current, only the fundamental component is left, as shown in Figure 14. The performances of both the ADALINE method and PQ method for harmonic detection, in this case, are similarly good. The source current of all three-phase nearly sinusoidal with a balanced system and unity PF, as shown in the average performance value in Table 4.
The performance of the system from the simulation with three different loads using PQ theory and the ADALINE neural network are as shown in Table 2, Table 3 and Table 4. Those results show that the %THD of cases 1 and 3 is slightly less than the %THD from PQ theory. In case 2, the ADALINE neural network gives a better result, when the DC component occurs in the transmission line. In terms of the power factor improvement, both methods give a similar performance. They can improve PF to unity.

4.2. Some Harmonic Orders Elimination

This topic has presented the methodology for the compensation of some order of harmonic current components and fundamental reactive component in a balanced three-phase power system, which this compensation must implement in a hybrid power filter (HPF). It aims to test the accuracy and the performance of harmonic detection for an individual harmonic current and fundamental reactive component. This processed calculation is shown in Figure 5b. The three-phase bridge rectifier with the 45 Ω resistor in series with the 0.5 H inductor for interval 0 Time < 0.25 s. Another interval is 0.25 Time < 0.5 s, the resistor change to 90   Ω at a time of 0.25 s. This non-linear load is used to test the SAPF performance. These non-linear loads have various orders of harmonics current. This case uses the PI controller for DC bus voltage control with K P V = 0.312 and K I V = 6.96 .

4.2.1. Case 1: 5th Order Elimination

The signal in Figure 15 shows the simulation result of eliminating the 5th order harmonic current and the fundamental reactive component of all three-phase. The average of %THD is equal to 26.66 for a time between 0 to 0.25 s and 24.92 for a time between 0.25 to 0.5 s. This case tests the performance of the elimination of individual harmonics order, by choosing to eliminate the harmonics current order 5th. Throughout the simulation, the PI controller can control the DC bus voltage ( V d c ) equal to the reference voltage ( V d c * ) 360 volts. Although the load current will change at a time of 0.25 s. The compensated current ( i C ) and the source current ( i S ) will adapt to the load changing. After injecting the compensated current ( i C ) which consist of the harmonic order 5th and the fundamental reactive component into the system at PCC of each phase, the source current in each phase is closer to sinusoidal with a balanced system and in-phase with the source voltage ( v S ). This means that all three phases can improve to unity PF.
The spectrum in Figure 16 shows that the spectrum of the source current ( i S ) in all three-phase. Before compensation, the source current or the load current of both intervals have several harmonic orders and the average %THD is 26.66 and 24.92, respectively. After injecting the compensated current ( i C a , i C b , i C c ) which consists of the harmonic order 5th, and the fundamental reactive component into the system at PCC of each phase, the harmonic current order 5th of the source current of each phase is eliminated. The source current of both intervals has the average %THD decreases to 18.13 and 16.17, respectively. It also makes the power factor of all three phases to unity, as shown in Table 5.

4.2.2. Case 2: 5th and 7th Orders Elimination

This case presents the SAPF performance of eliminating the harmonic current order 5, 7, and the fundamental reactive component of the source current. The PI controller still controls the DC bus voltage ( V d c ) equal to the reference voltage 360 volts in both intervals. After injecting the compensated current ( i C ) into the PCC in each phase, the source current ( i S ) is closer to sinusoidal with a balanced system and in-phase with the source voltage ( v S ). Although the load current ( i L ) of all three phases have changed at a time of 0.25 s, the SAPF still has a good performance, as shown in Figure 17.
Before compensation, the source current spectrum of all three phases has various order as shown in Figure 18a,b. After injecting the compensated current into the system, the source current spectrum orders 5 and 7 are eliminated. This result occurs at both intervals.
The performance value in Table 6 shows that the source current has an average of %THD decrease from 26.66 to 12.43 and the power factor is unity in the first interval. In the second interval, the source current has an average of %THD decreasing from 24.92 to 10.00 and the power factor is unity.
The individual harmonic detection using the PQ method does not simulate in this case, because it is very complicated to design the bandwidth of the filter for each harmonic order. The filter has an inaccurate calculation and is sensitive when the system changes.

5. Conclusions

The article has presented the new approach on harmonic current detection that employs a real-time ADALINE neural network. It starts with the comparison studies between the existing technologies that include the PQ methods by HIL. The results indicated that the PQ method is superior in harmonic current detection. However, it was found that the harmonic current detection results contain a considerable number of errors due to the PQ harmonic components calculation needing to use a filter process for the required filtering of the signal for further calculations. Therefore, the limitations of the filter cannot be designed to filter the signal precisely. As a result, the PQ computation process is inaccurate as well. It is necessary to specify the exact operating frequency for designing a filter. Therefore, the PQ method is susceptible to changes in computation frequency. Therefore, when the operating frequency of the system changes, it affects the performance of this method. In the case of the DC component in the system, the PQ method cannot provide a good quality power system. Moreover, it is very difficult for designing band-pass filter for the individual harmonic detection using the PQ method. This paper proposes the ADALINE method to mitigate this drawback. It focuses on both the precise calculations and insensitivity of changing the calculated frequency of the system. The simulation results with HIL indicated that the ADALINE harmonic identifier rendered superior results in both harmonic detection and elimination. Also, the calculation gives a precise calculation value of each harmonic current, DC component quantity, and the fundamental reactive current. The SAPF is used for improving the power quality of the system. The SAPF using this proposed method has a good performance to eliminate the harmonic in the system. The source current of all three phases is nearly sinusoidal and in phase with the source voltage. The average %THD of the source current is decreased and has a unity power factor. In addition, for individual harmonic detection, the ADALINE harmonic detection can be precisely identified and the calculations are simple. This property makes the individual harmonic current detection of the ADALINE method stand out. The ADALINE method of harmonic current detection validates with a hardware-in-loop simulation. It confirms the correctness of the implemented algorithms and the possibility of using the proposed approach. However, there is a limitation in this research. This research presents the technique for increasing the power quality in the three-phase, three-wire balanced system. This system is not as common as a three-phase, four-wire unbalanced system. Therefore, the direction for future research is to break this limitation by adopting this methodology and applying it with the three-phase, four-wire unbalanced system.

Author Contributions

S.J. and K.A. (Kongpol Areerak) proposed the methodology analysis, check the validation, writing, and editing; S.J. analyzed data and performed the simulation; S.J., K.A. (Kongpol Areerak) and K.A. (Kongpan Areerak) participated in the conceptualization, methodology, and review. All authors have read and agreed to the published version of the manuscript.

Funding

This research received no external funding.

Institutional Review Board Statement

The authors choose to exclude this statement because the study did not involve humans or animals.

Informed Consent Statement

Authors choose to exclude this statement because the study did not involve humans or animals.

Data Availability Statement

Authors choose to exclude this statement because the study did not report any data.

Conflicts of Interest

The authors declare no conflict of interest.

References

  1. Jawad Ghorbani, M.; Mokhtari, H. Impact of Harmonics on Power Quality and Losses in Impact of Harmonics on Power Quality and Losses in. Int. J. Electr. Comput. Eng. 2015, 5, 166–174. [Google Scholar]
  2. Benchaita, L.; Saadate, S.; Salemnia, A. A Comparison of Voltage Source and Current Source Shunt Active Filter by Simulation and Experimentation. IEEE Trans. Power Syst. 1999, 14, 642–647. [Google Scholar] [CrossRef]
  3. Zouidi, A.; Fnaiech, F.; Al-Haddad, K. Voltage source Inverter Based three-phase shunt active Power Filter: Topology, Modeling and Control Strategies. In Proceedings of the 2006 IEEE International Symposium on Industrial Electronics, Montreal, QC, Canada, 9–12 July 2006; pp. 785–790. [Google Scholar]
  4. IEEE Power and Energy Society. IEEE Std 519™-2014: IEEE Recommended Practice and Requirements for Harmonic Control in Electric Power Systems. 27 March 2014. Available online: https://ieeexplore.ieee.org/servlet/opac?punumber=6826457 (accessed on 1 April 2021).
  5. Desai, V.A.; Rathore, S. Harmonic detection using Kalman filter. In Proceedings of the 2016 International Conference on Electrical, Electronics, and Optimization Techniques (ICEEOT), Chennai, India, 3–5 March 2016; pp. 858–863. [Google Scholar]
  6. Solomon, O.M. The Use of DFT Windows in Signal-to-Noise Ratio and Harmonic Distortion Computations. IEEE Trans. Instrum. Meas. 1994, 43, 194–199. [Google Scholar] [CrossRef]
  7. Tiyarachakun, S.; Areerak, K.-L.; Areerak, K.-N. Instantaneous Power Theory with Fourier and Optimal Predictive Controller Design for Shunt Active Power Filter. Model. Simul. Eng. 2014, 1–20. [Google Scholar] [CrossRef] [Green Version]
  8. El-Habrouk, M.; Darwish, M.K. Design and implementation of a modified Fourier analysis harmonic current computation technique for power active filters using DSPs. IEE Proc. Electr. Power Appl. 2001, 148, 21–28. [Google Scholar] [CrossRef] [Green Version]
  9. Chang, G.W.; Chen, S.K. An a-b-c Reference Frame-Based Control Strategy for the Three-phase Four-Wire Shunt Active Power Filter. In Proceedings of the IEEE Proceedings: 9th International Conference on Harmonics and Quality of Power, Orlando, FL, USA, 1–4 October 2000; pp. 26–29. [Google Scholar]
  10. Karimi, H.; Karimi-Ghartemani, M.; Reza Iravani, M.; Bakhshai, A.R. An adaptive filter for synchronous extraction of harmonics and distortions. IEEE Trans. Power Deliv. 2003, 18, 1350–1356. [Google Scholar] [CrossRef]
  11. Musa, S.; Mohd Radzi, M.A.; Hoon, Y. Modified Synchronous Reference Frame Based Shunt Active Power Filter with Fuzzy Logic Control Pulse Width Modulation Inverter. Energies 2017, 10, 758. [Google Scholar] [CrossRef]
  12. Narongrit, T.; Areerak, K.-L.; Areerak, K.-N. A New Design Approach of Fuzzy Controller for Shunt Active Power Filter. Electr. Power Compon. Syst. 2015, 43, 685–694. [Google Scholar] [CrossRef]
  13. Sujitjorn, S.; Areerak, K.-L.; Kulworawanichpong, T. The DQ Axis with Fourier (DQF) Method for Harmonic Identification. IEEE Trans. Power Deliv. 2007, 22, 737–739. [Google Scholar] [CrossRef]
  14. Jiying, S.; Sha, W. Specific Harmonic Current Detection based on DC Component. In Proceedings of the 2011 International Conference on Electronics, Communications and Control (ICECC), Ningbo, China, 9–11 September 2011; pp. 2294–2297. [Google Scholar]
  15. Chang, G.W.; Shee, T.-C. A Comparative Study of Active Power Filter Reference Compensation Approaches. In Proceedings of the IEEE Conference on Power Engineering Society Summer Meeting, Chicago, IL, USA, 21–25 July 2002; pp. 1021–1027. [Google Scholar]
  16. Chen, D.; Xie, S. Review of the control strategies applied to active power filters. In Proceedings of the 2004 IEEE International Conference on Electric Utility Deregulation Restructuring and Power Technologies, Hong Kong, China, 5–8 April 2004; pp. 666–670. [Google Scholar]
  17. Chang, G.W.; Shee, T.-C. A Novel Reference Compensation Current Strategy for Shunt Active Power Filter Control. IEEE Trans. Power Deliv. 2004, 19, 1751–1758. [Google Scholar] [CrossRef]
  18. Montero, M.I.M.; Cadaval, E.R.; González, F.B. Comparison of Control Strategies for Shunt Active Power Filters in Three-Phase Four-Wire Systems. IEEE Trans. Power Electron. 2007, 22, 229–236. [Google Scholar] [CrossRef]
  19. Abdelkhalek, O.; Benachaiba, C. Sensitivity Assessment of PQ Theory and Synchronous Detection Identification Methods of Current Harmonics Under Non-Sinnusoidal Condition for Shunt Active Power Filter. J. Electr. Electron. Eng. 2009, 9, 801–807. [Google Scholar]
  20. Kullarkar, V.T.; Chandrakar, V.K. Power Quality Analysis in Power System with Non Linear Load. Int. J. Electr. Eng. 2017, 10, 33–45. [Google Scholar]
  21. Stošović, M.A.; Dimitrijević, M.; Bojanić, S.; Nieto-Taladriz, O.; Litovski, V. Characterization of Nonlinear Loads in Power Distribution Grid. Facta Univ. Ser. Electron. Energy 2016, 29, 159–175. [Google Scholar] [CrossRef]
  22. Moschakis, M.N.; Dafopoulos, V.V.; Karapidakis, E.S.; Tsikalakis, A.G. An analytical Assessment of DC Components Generated by Renewable Energy Resources with Inverter-Based Interconnection System due to Even Harmonics. Int. Sch. Res. Netw. ISRN Renew. Energy 2012, 1–12. [Google Scholar] [CrossRef] [Green Version]
  23. Buticchi, G.; Lorenzani, E.; Fratta, A. A New Proposal to Eliminate the DC Current Component at the Point of Common Coupling for Grid Connected Systems. In Proceedings of the IECON 2010—36th Annual Conference on IEEE Industrial Electronics Society, Glendale, AZ, USA, 7–10 November 2010; pp. 3244–3249. [Google Scholar]
  24. Jadeja1, P.; Shrivastava, A. Effects of DC Components on Circuit Breaker. Int. J. Sci. Res. 2015, 4, 724–728. [Google Scholar]
  25. Buticchi, G.; Lorenzani, E. Detection Method of the DC Bias in Distribution Power Transformers. IEEE Trans. Ind. Electron. 2013, 60, 3539–3549. [Google Scholar] [CrossRef]
  26. El Shatshat, R.; Kazerani, M.; Salama, M.M.A. Modular Active Power-Line Conditioner. IEEE Trans. Power Deliv. 2001, 16, 700–709. [Google Scholar] [CrossRef]
  27. Dehini, R.; Bassou, A.; Ferdi, B. The harmonics detection method based on neural network applied to harmonics compensation. Int. J. Eng. Sci. Technol. 2010, 2, 258–267. [Google Scholar] [CrossRef]
  28. Nguyen, N.K.; Wira, P.; Flieller, D.; Abdeslam, D.O.; Merckle, J. Harmonics Identification with Artificial Neural Networks: Application to Active Power Filtering. Int. J. Emerg. Electr. Power Syst. 2011, 12, 1–27. [Google Scholar] [CrossRef]
  29. Valtierra-Rodriguez, M.; Romero-Troncoso, R.D.J.; Osornio-Rios, R.A.; Garcia-Perez, A. Detection and Classification of Single and Combined Power Quality Disturbances Using Neural Networks. IEEE Trans. Ind. Electron. 2014, 61, 2473–2482. [Google Scholar] [CrossRef]
  30. Sekaran, E.C.; Anbalagan, P. Comparison of Neural Network and Fast Fourier Transform Based Selective Harmonic Extraction and Total Harmonic Reduction for Power Electronic Converters. Asian Power Electron. J. 2008, 2, 1–9. [Google Scholar]
  31. Hagan, M.T.; Demuth, H.B.; Beale, M.H.; De Jesús, O. Widrow-Hoff Learning. In Neural Network Design, 2nd ed.; Available online: https://hagan.okstate.edu/nnd.html (accessed on 15 March 2019).
  32. Zhang, M.; Wang, Y.; Cheng, C.; Xu, J.; He, S.; Hu, Y. Research on Harmonic Detection Method Based on Wavelet Neural Network with a New Structure. In Proceedings of the 2021 3rd Asia Energy and Electrical Engineering Symposium (AEEES), Chengdu, China, 26–29 March 2021; pp. 316–319. [Google Scholar]
  33. Severoglu, N.; Salor, O. Amplitude and phase estimations of power system harmonics using deep learning framework. IET Gener. Transm. Distrib. 2020, 14, 4089–4096. [Google Scholar] [CrossRef]
  34. Sahoo, B.; Panda, A.K.; Mangaraj, M.; Sahoo, G.M. Real-Time Implementation of ALMS-NN Controlled UPQC. In Proceedings of the 2020 IEEE International Conference on Computational Intelligence for Smart Power System and Sustainable Energy (CISPSSE-2020), Keonjhar, India, 29–31 July 2020; pp. 1–6. [Google Scholar]
  35. Uddin, M.N.; Amin, T. Design and Simulation of Active Power Filter Based on Feed Forward Neural Network for Harmonic Detection and Elimination. In Proceedings of the 2020 International Conference on Computer, Electrical & Communication Engineering (ICCECE), Kolkata, India, 17–18 January 2020; pp. 1–6. [Google Scholar]
  36. Garcia, C.I.; Grasso, F.; Luchetta, A.; Piccirilli, M.C.; Paolucci, L.; Talluri, G. A Comparison of Power Quality Disturbance Detection and Classification Methods Using CNN, LSTM and CNN-LSTM. Appl. Sci. 2020, 10, 6755. [Google Scholar] [CrossRef]
  37. Ingram, D.M.E.; Round, S.D. A Novel Digital Hysteresis Current Controller for an Active Power Filter. In Proceedings of the Second International Conference on Power Electronics and Drive Systems, Singapore, 26–29 May 1997; pp. 744–749. [Google Scholar]
  38. Thomas, T.; Haddad, K.; Joos, G.; Jaafari, A. Design and Performance of Active Power Filters. IEEE Ind. Appl. Mag. 1998, 4, 38–46. [Google Scholar] [CrossRef]
  39. Rahmani, S.; Mendalek, N.; Al-Haddad, K. Experimental Design of a Nonlinear Control Technique for Three-Phase Shunt Active Power Filter. IEEE Trans. Ind. Electron. 2010, 57, 3364–3375. [Google Scholar] [CrossRef]
Figure 1. Block diagram of shunt active power filter control system.
Energies 14 04351 g001
Figure 2. A computational process for harmonic detection using instantaneous power theory (Had. PQ) method.
Energies 14 04351 g002
Figure 3. ADALINE harmonic extraction.
Energies 14 04351 g003
Figure 4. The fundamental active current computational process.
Energies 14 04351 g004
Figure 5. ADALINE harmonic detection and power factor (PF) improvement: (a) The harmonic detection process for harmonic current elimination; (b) The harmonic detection process for the individual harmonic components.
Energies 14 04351 g005
Figure 6. The diagram of shunt active power filter (SAPF) implementation using hardware-in-loop (HIL).
Energies 14 04351 g006
Figure 7. The HIL simulation.
Energies 14 04351 g007
Figure 8. The DC bus voltage, the load current, the compensated current, and the source current for Case 1.
Energies 14 04351 g008
Figure 9. Spectrums of the source current for Case 1: (A) Spectrums at intervals 0 Time < 0.25 s; (B) Spectrums at intervals 0.25 Time < 0.5 s.
Energies 14 04351 g009aEnergies 14 04351 g009b
Figure 10. The DC bus voltage, the load current, the compensated current, and the source current using ADALINE method for Case 2.
Energies 14 04351 g010
Figure 11. Spectrums of the source current using ADALINE and PQ at intervals 0 Time < 0.5 s: (a) Before compensation; (b) After compensation with ADALINE method; (c) After compensation with PQ method.
Energies 14 04351 g011
Figure 12. Spectrums of the source current at intervals 0.5 Time < 1 s for Case 2.; (a) Before compensation; (b) After compensation with ADALINE method; (c) After compensation with PQ method.
Energies 14 04351 g012
Figure 13. The DC bus voltage, the load current, the compensated current, and the source current for Case 3.
Energies 14 04351 g013
Figure 14. Spectrums of the source current for Case 3: (A) Signals at intervals 0 Time < 0.25 s; (B) Signals at intervals 0.25 Time < 0.5 s.
Energies 14 04351 g014aEnergies 14 04351 g014b
Figure 15. The DC bus voltage, the load current, the compensated current, and the source current.
Energies 14 04351 g015
Figure 16. Spectrums of the source current using ADALINE for compensating the harmonic current order 5: (a) Spectrums at intervals 0 Time < 0.25 s; (b) Spectrums at intervals 0.25 Time < 0.5 s.
Energies 14 04351 g016aEnergies 14 04351 g016b
Figure 17. The DC bus voltage, the load current, the compensated current, and the source current.
Energies 14 04351 g017
Figure 18. Spectrums of the source current using ADALINE for compensating the harmonic current order 5 and 7: (a) Spectrums at intervals 0 Time < 0.25 s; (b) Spectrums at intervals 0.25 Time < 0.5 s.
Energies 14 04351 g018
Table 1. The system parameter and the PI controller parameter.
Power SourcePhase voltage = 100 Vrms
Fundamental frequency = 50 Hz
Source   inductance   ( L s ) = 10   μ H
Active Power Filter DC   capacitor   ( C d c ) = 2350   μ F
Reference   DC   voltage   ( V d c * ) = 360 V
Filter   inductance   ( L f ) = 18 mH
Sampling Time T S = 10   μ s
Current Loop Controller K P i = 400 , K I i = 4.44 × 10 6
Table 2. The average performance value for Case 1.
Performance 0 Time < 0.25 s 0.25 Time < 0.5 s
Before
Compensation
After
Compensation
Before
Compensation
After
Compensation
PQADALINEPQADALINE
%THD242.121.9934.252.212.16
Power Angle
(Degree)
30003000
PF0.87110.8711
Table 3. The average performance value for Case 2.
Performance 0 Time < 0.5 s 0.5 Time < 1 s
Before
Compensation
After
Compensation
Before
Compensation
After
Compensation
PQADALINEPQADALINE
%THD301.711.563011.272.93
Power Angle
(Degree)
30003000
PF0.87110.8711
Table 4. The average performance value for Case 3.
Performance 0 Time < 0.25 s 0.25 Time < 0.5 s
Before
Compensation
After
Compensation
Before
Compensation
After
Compensation
PQADALINEPQADALINE
%THD26.672.62.4924.932.011.95
Power Angle
(Degree)
7.630010.7100
PF0.99110.9811
Table 5. The average performance value of ADALINE individual harmonic detection.
Performance 0 Time < 0.25 s 0.25 Time < 0.5 s
Before
Compensation
After
Compensation
Before
Compensation
After
Compensation
%THD26.6618.1324.9216.17
Power Angle (Degree)7.64010.710
PF0.9910.981
Table 6. The average performance value of ADALINE individual harmonic detection.
Performance 0 Time < 0.25 s 0.25 Time < 0.5 s
Before
Compensation
After
Compensation
Before
Compensation
After
Compensation
%THD26.6612.4324.9210.00
Power Angle (Degree)7.64010.710
PF0.9910.981
Publisher’s Note: MDPI stays neutral with regard to jurisdictional claims in published maps and institutional affiliations.

