Article

Microwave Torrefaction of Oat Hull: Effect of Temperature and Residence Time

1
Department of Chemical and Biological Engineering, University of Saskatchewan, 57 Campus Drive, Saskatoon, SK S7N 5A9, Canada
2
Saskatoon Research and Development Centre, Agriculture and Agri-Food Canada, 107 Science Place, Saskatoon, SK S7N 0X2, Canada
3
Department of Mechanical Engineering, University of Saskatchewan, 57 Campus Drive, Saskatoon, SK S7N 5A9, Canada
*
Author to whom correspondence should be addressed.
Energies 2021, 14(14), 4298; https://doi.org/10.3390/en14144298
Submission received: 31 May 2021 / Revised: 9 July 2021 / Accepted: 12 July 2021 / Published: 16 July 2021
(This article belongs to the Section A4: Bio-Energy)

Abstract

:
Microwave torrefaction of oat hull was conducted to enhance its physicochemical properties. A bench-top reactor with an internal stirrer was used for oat hull pretreatment at temperatures of 225 °C, 255 °C, and 285 °C, and residence times of 3, 6, and 9 min, respectively. Results showed that a high temperature level at 3 min residence time or severe torrefaction increased calorific values by up to 35% of its original value, while decreasing mass yield down to 60.77%. Severe torrefaction further decreased moisture absorption, moisture content, and grinding energy consumption but decreased energy yield and bulk density. Residence time had no significant effect on biomass physicochemical changes; however, production cost may be significantly increased by longer residence times. It was also concluded that increased microwave power levels from 400 to 650 W decreased energy consumption by shortening processing times, resulting in a positive economic impact of the process. Moderate and severe torrefaction significantly enhanced biomass fuel properties, and short residence times are recommended in order to decrease electricity consumption. In addition, microwave pretreatment enhances biomass in a similar way to conventional torrefaction, but at a faster processing time. Moreover, the liquid fraction as a by-product may represent a valuable product for the food industry.

Graphical Abstract

1. Introduction

Oat hull, a by-product of the milling process, represents up to 25% of the total weight of the grain [1]. Due to its high fiber content and low-quality nutritive value for animals, this by-product is of low economic value in the region. Instead, agricultural by-products could be utilized as a source of renewable energy, which are also considered carbon neutral [2]. However, some of the major problems associated with the use of biomass for energy production are high moisture content, hydrophilic nature, and low heating values [3,4]. One of the possible solutions to this problem could be the use of torrefaction, which is a thermochemical process that improves the fuel characteristics of biomass [5]. As described by Basu [6], temperature is the most important parameter within the torrefaction process. Therefore, the intensity of torrefaction treatment based on temperature level may be divided into: (a) light (230 °C); (b) moderate (260 °C); or (c) severe (290 °C) torrefaction [7].
Torrefaction reduces the hydroxyl (OH) groups, inhibits hydrogen bonds, and results in hydrophobicity of the biomass [8]. Nonpolar unsaturated structures are formed through chemical reaction rearrangements, which will avoid biological degradation [3]. Tumuluru et al. [3] pointed out that torrefied pellets allow up to 40% cofiring in coal power plants, without modifications in the existing equipment due to matching fuel properties of treated biomass. Previous studies have explored the effect of microwave torrefaction on biomass. For example, Iroba et al. [9] analyzed the effect of microwave torrefaction on municipal waste, reporting significant biomass improvements such as lower grinding energy consumption, increased heating values, and reduced moisture contents. Abubakar et al. [10] developed a microwave torrefaction unit with an inner stirrer to treat oil palm shell. The authors concluded that a homogeneous biomass heating can be achieved using a microwave torrefaction process that resulted in positive effects on biomass fuel properties. Microwave torrefaction studies improved the heating value and energy density of biomass and decreased its grinding energy [11,12,13]. The torrefied liquid fraction was determined to possess a high economic potential due to phenolic compounds content.
This work was conducted to determine the physicochemical changes produced by microwave torrefaction of oat hull, a by-product in abundance in the prairie provinces of Canada. The effects of temperature level and residence time during torrefaction were investigated. The impact of microwave power level on biomass yield was also examined. Furthermore, analysis and comparison of liquid yield fraction was examined for potential commercial utilization in the food industry. The work embodied in this paper is part of a project to determine the potential application of oat hull for heat and power production which included torrefaction treatment, pelleting, and techno-economic assessment [14].

2. Materials and Methods

2.1. Sample Collection and Storage

Richardson Milling Ltd. (Martensville, SK, Canada) supplied the raw oat hull in April 2019. The initial moisture content of as-received samples was determined using ASABE standard ASAE S358.3 replicated three times and expressed in percent wet basis (% wb) [15]. The samples were kept in sealed containers under cold storage at 4 °C, until the day of the experiment. Oat hull particles smaller than 0.589 mm were removed from the feedstock prior to the microwave torrefaction process via ASAE S319.3 sieving method [16].

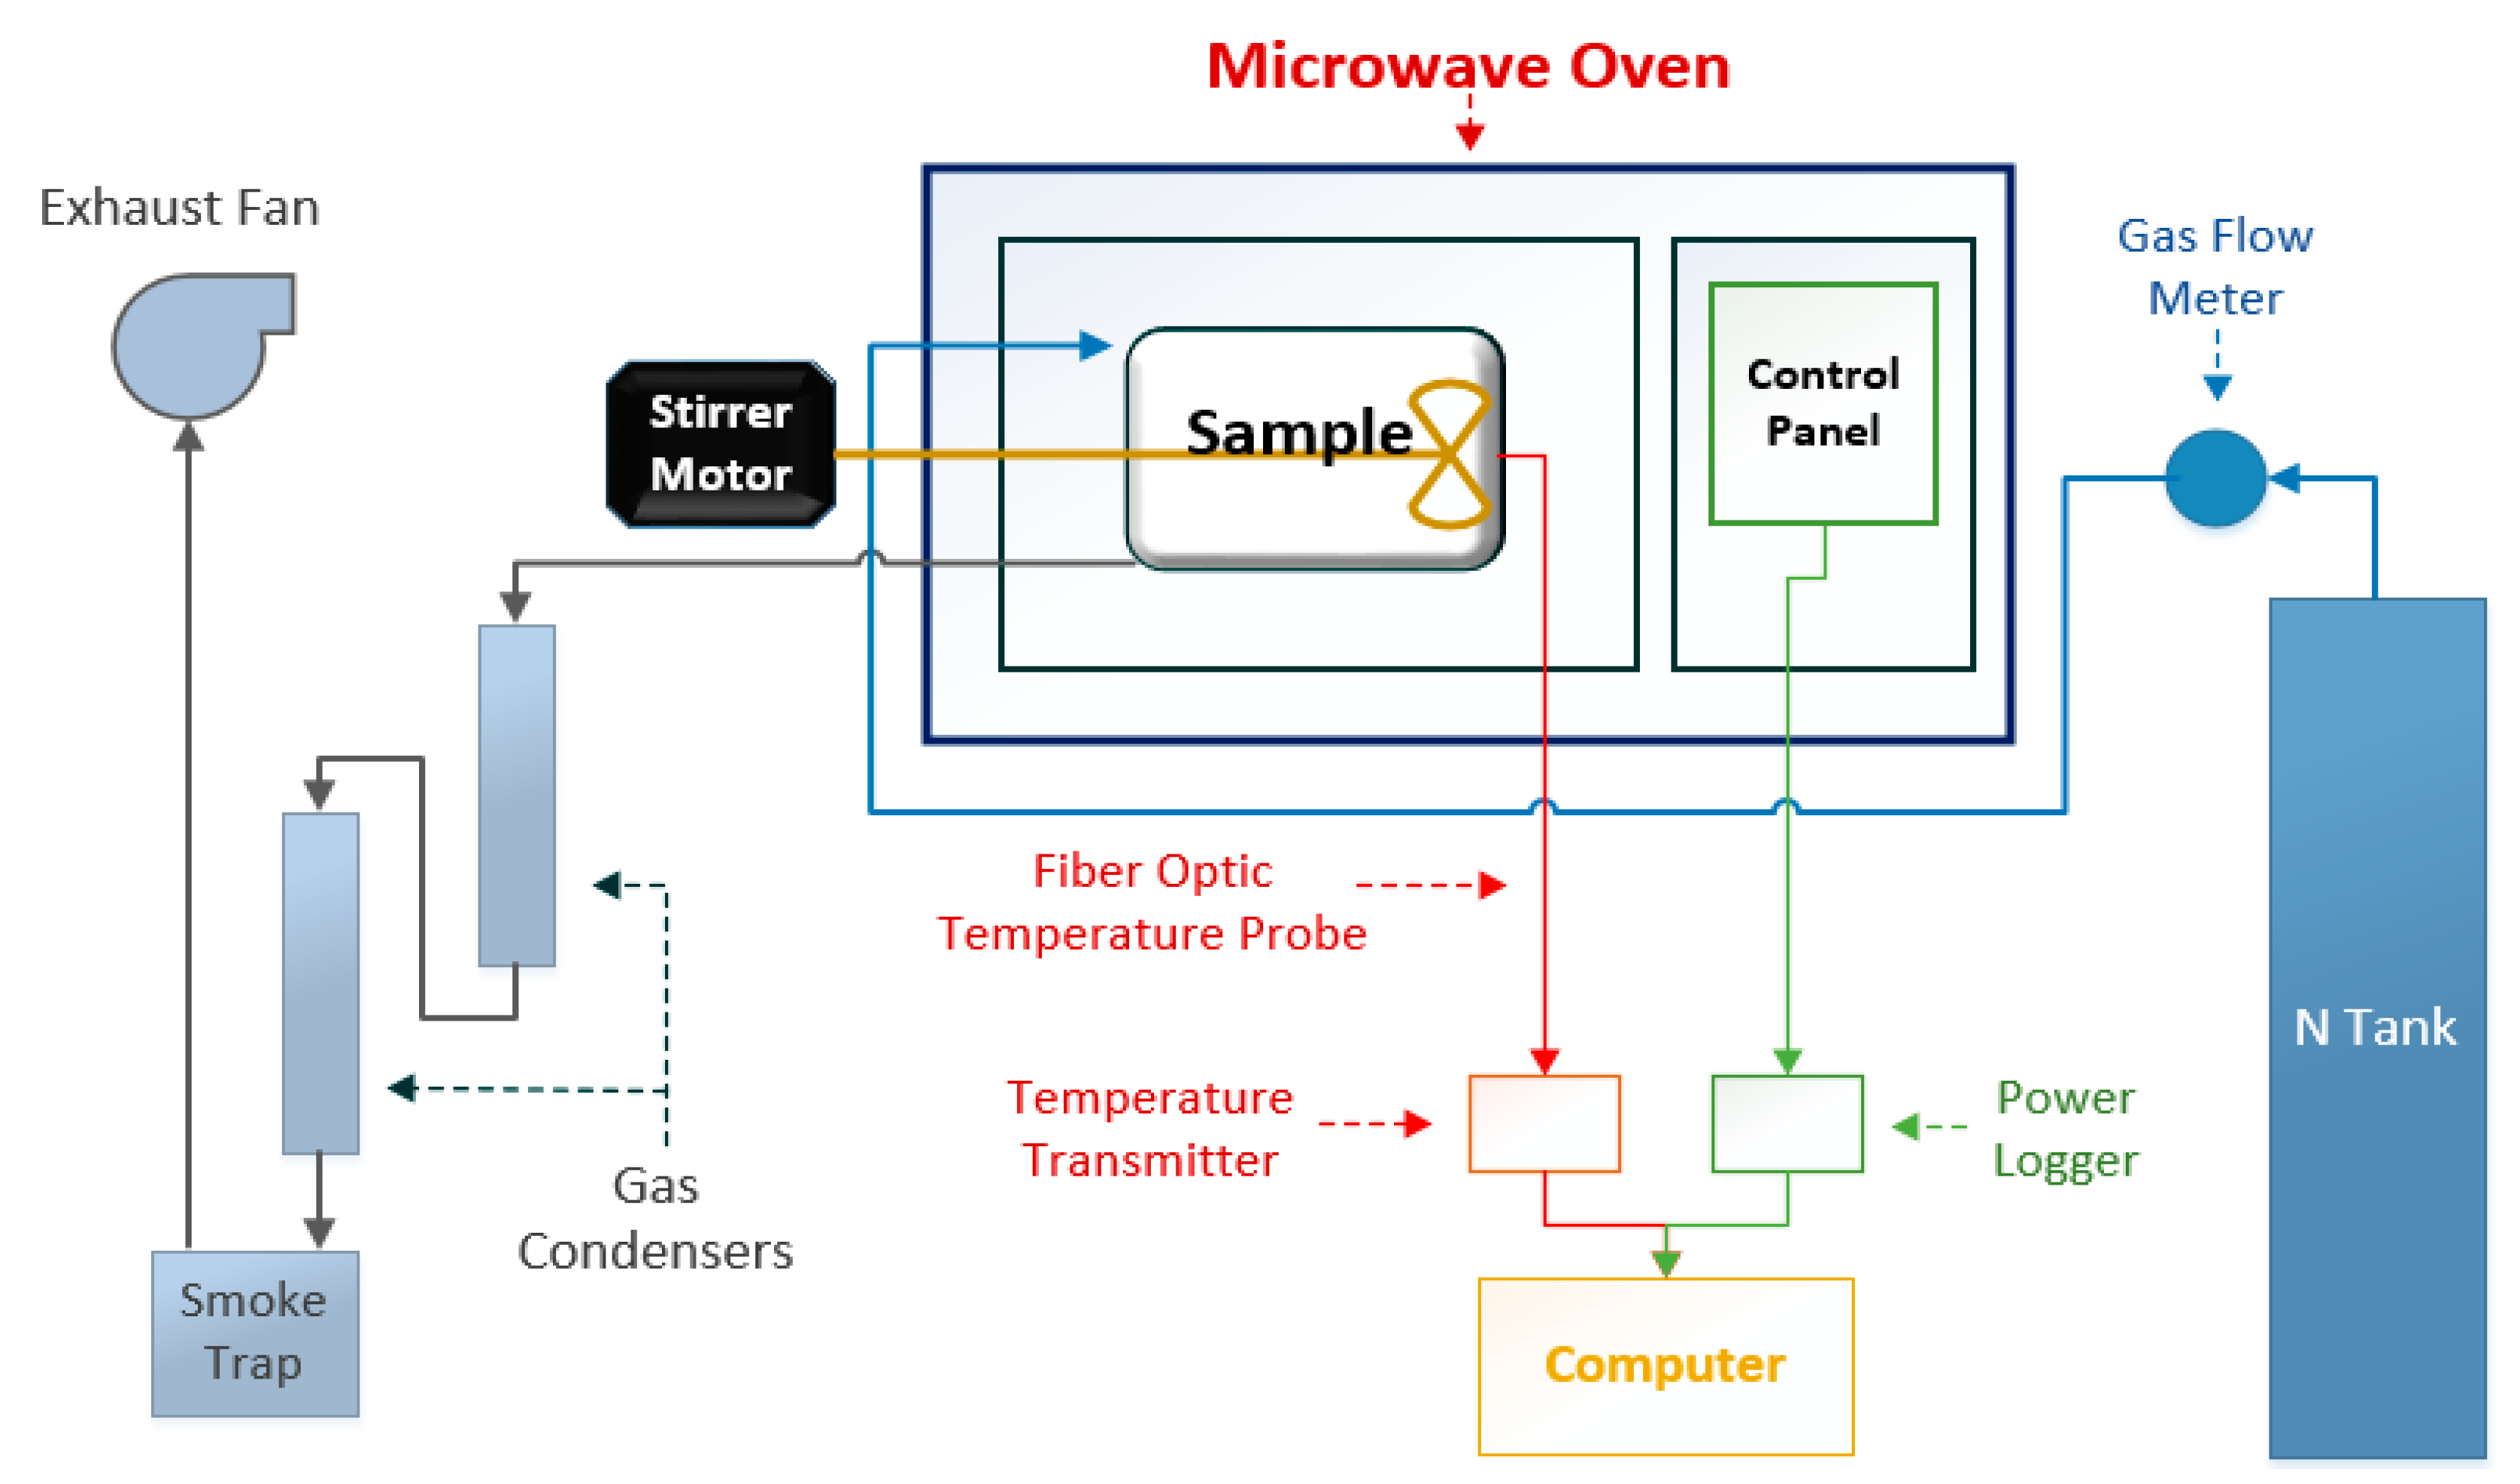
2.2. Microwave Torrefaction

A lab-scale microwave Cober LBM 1.2A/7296, 2.54 GHz (Cober Electronics, Inc., Norwalk, CT, USA) oven was used to perform the biomass torrefaction. This research used a 500 mL borosilicate vessel with removable three-neck outlet lid as the microwave torrefaction reactor. The bottom outlet serves as outlet for condensable and non-condensable gases, the top outlet is used as an inlet for the nitrogen (N) at a flow rate of 100 mL min−1, and the middle outlet is used to insert a stirrer. Figure 1 shows the schematic diagram of the lab scale system. The LabVIEW 6i (National Instruments, Austin, TX, USA) software recorded the energy consumption and temperature data in real time at 1 s interval. To avoid electromagnetic interference with the microwave, a high temperature fiber optic probe PRB-G20 (Osensa Innovations, Burnaby, BC, Canada) was used to record temperature inside the microwave torrefaction reactor.
During this experiment, approximately 100 g of oat hull were placed inside the reactor vessel for all tests conducted and were repeated in triplicates. The microwave oven was set to a determined power level before turning the equipment on, and once the biomass reached the desired reaction temperature (225, 255, or 285 °C) representing light, moderate, and severe torrefaction [7], the residence time of 3, 6, or 9 min began. During each torrefaction residence time, the microwave power level had to be regulated in order to hold a constant reaction temperature for the total residence time.

2.3. Physical Properties

The particle size was determined by ASAE S319.3 sieving method [16] using a Ro-Tap sieve shaker (W.S. Taylor Inc., Mentor, OH, USA). Approximately 100 g of treated and untreated (unground) oat hull were analyzed in triplicate for size distribution using U.S sieve numbers: 8, 12, 14, 16, 20, and 30 with corresponding opening sizes of 2.38, 1.68, 1.41, 1.19, 0.841, and 0.595 mm, respectively. The bulk density was calculated using mass and volume of a standard cylindrical container of 0.5 L volume (SWA951, Superior Scale Co. Ltd., Winnipeg, MB, Canada) and expressed in kg m−3. The oat hull passed through a funnel fixed on the top of the cylinder and filled the 0.5 L volume container [17,18]. Five replicates were performed.
The moisture absorption test was conducted in a controlled environment chamber (Espec SH-641 Benchtop chamber, ESPEC Corp., Osaka, Japan) by measuring the total moisture uptake of different oat hull samples (untorrefied and torrefied) under 90% relative humidity at a temperature of 25 °C for 72 h. These conditions were tested to resemble the “worst case scenario” for storage conditions from rainy and humid days in Canada. Before the moisture uptake test, oat hull samples were dried in a THELCO laboratory PRECISION oven at 105 °C for 24 h [9,12,19,20]. Glass containers, stored inside the humidity chamber, held about 2 g of dried samples. After 72 h, the glass containers were covered with airtight lids to avoid moisture loss and weighed for moisture absorption.
The higher heating value (HHV) was measured by an oxygen bomb calorimeter (Parr Instruments Co., model 6400, Moline, IL, USA). Approximately 500 mg of ground sample burned inside an oxygen filled bomb calorimeter, submerged in a measured quantity of water which promoted a temperature rise in water. The amount of heat units released was calculated in calories per gram (cal g−1) and further converted into megajoules per kilogram (MJ kg−1).

2.4. Yields after Microwave Torrefaction

The mass and liquid yields of the torrefaction process were weighed and stored in sealed containers at the end of each experiment. The difference of the total sample used, minus liquid and solid yields determined the gas yield. Equation (1) was used to calculate the mass yield of the microwave torrefaction of samples.
Y M = ( T M U T M ) × 100
where YM is the percent mass yield of the microwave torrefaction; TM is the mass of torrefied sample (g); and UTM is the mass of the initial sample (g).
As described by Bridgeman et al. [21,22], energy yield can be calculated from the mass yield when the total biomass energy decreases by a reduction of the mass yield during the torrefaction process. Equation (2) calculated the remaining energy in the biomass after the microwave torrefaction process (yield of energy).
Y E = Y M ( T C V U T C V )
where YE is the yield of energy (percent); YM is the yield of the mass (percent); TCV is the calorific value of the torrefied sample; and UTCV is the calorific value of the initial (untorrefied) sample.
The liquid yield fractions collected from the torrefaction process were kept in sealed glass bottles for 20 days for further analysis. During the storage period, the tar or insoluble organic fraction settled to the bottom [23]. According to Ramakrishnan and Moeller [23], the tar fraction contains polycyclic aromatic hydrocarbons (PAH) compounds which have toxic or carcinogenic properties [24] with adverse human health effects; they must be removed during processing for liquid smoke. After the storage period, the liquid fraction was decanted and passed through a Whatman No. 2 filter paper, removing the tar condensate. For total acids (percentage acetic acid), 6 mL of the liquid sample was diluted in 250 mL of distilled water and titrated to a pH of 7 using 1.0 N NaOH where the amount in mL of NaOH added is determined [25]. The pH of liquid smoke was measured using a model PSH-3C pH meter (MRM Precision Instruments Inc., Brampton, ON, Canada). All measurements were conducted in triplicates.

2.5. Grinding Energy Consumption

To investigate the effect of microwave torrefaction on grinding energy consumption, torrefied and untorrefied (dry and 10% moisture) oat hull were ground using a disc mill (Glen Mills Inc., Clifton, NJ, USA). A power meter model ELITEpro XC (Dent Instruments, Bend, OR, USA) measured and logged the energy consumption. After 5 s of turning the equipment on, 37 g of biomass entered the grinder, and the test was stopped when no material came out through the collecting vessel. The test was replicated three times. The untorrefied sample was dried by oven method at 105 °C for 24 h, and subsequently the samples were stored in hermetic containers until the grinding process to avoid moisture absorption. Equation (3) calculated the energy reduction rate.
E R = e 2 e 1 e 1 × 100
where ER is the energy reduction in percent; e2 is the total energy used by the microwave torrefaction treatment in kJ kg−1; and e1 is the total energy used by the reference treatment (untorrefied oat hull with 10% moisture) in kJ kg−1.

2.6. Cost Per Tonne of Torrefied Material

The production cost (CAD$) of 1 tonne of processed biomass (using 100 g lab reactor), was estimated by integrating the area under the curve of the microwave power consumption in kWh. This analysis was developed to obtain a general idea of how power level influenced energy use. Equations (4) and (5) calculated the cost per tonne of torrefied oat hull. The energy fee rate was obtained from SaskPower Customer-Owned Transformation Rate code *E-12 [26].
C o s t t o n n e = ( E ( E C + F C C ) × 10 , 000 ) + D C
where E is the electrical energy used during the microwave torrefaction process (kWh); EC is the electricity charge per kWh ($); FCC is the Federal Carbon Charge per kWh ($); 10,000 is a constant to scale to 1 tonne of product (100 g used during the lab × 10,000 = 1,000,000 g which is 1 t); and DC is the demand charge ($) as given by Equation (5).
D C = ( T t 10 , 000 W h ) M D C
where Tt is the total time of the process (h); Wh is the working hours of the equipment (h); and MDC is the monthly demand charge per kilovolt amperes ($).

2.7. Organic Composition

The ANKOM methods for neutral detergent fiber (NDF), acid detergent fiber (ADF), and acid detergent lignin (ADL) were used in estimating the cellulose, hemicellulose, and lignin contents of treated and untreated biomass. ANKOM Method 5 determined ADF, which was the residue remaining (cellulose and lignin) after digestion with sulfuric acid (H2SO4) and cetyl trimethyl ammonium (CTAB) [27]. ANKOM Method 6 determined NDF, which was the residue remaining (cellulose, hemicellulose, and lignin) after digestion in a detergent solution [28]. ANKOM Method 8 determined ADL, which was the residue remaining (lignin) after digestion with 72% by weight of H2SO4 [29].
The amounts of carbon, nitrogen, hydrogen, and sulfur in the different samples were determined using a Vario EL III CHNS elemental analyzer (Elemental Americas, Inc., Ronkonkoma, NY, USA). Through quantitative high temperature decomposition, samples underwent combustion in an oxygenated atmosphere in a combustion quartz tube filled with tungsten oxide powder of ~1 mm. The gases from the samples were reduced in a reduction tube filled with Cu chips prior to feeding into a series of separation tubes for measuring SO2, H2O, and CO2. The desired elemental composition of the samples was separated from the others with the help of specific absorption columns and quantified in succession using a thermal conductivity detector with helium (He) gas acting as a flushing and carrier gas at a flow rate of 30 mL m−1.
The ash content was determined based on National Renewable Energy laboratory standard [30]. About 2.0 ± 0.2 g of oven dried oat hull samples were weighed into tared dried crucibles and placed into a muffle furnace (Model F-A1T30, Thermolyne Sybron Corp., Dubuque, IA, USA) at 575 ± 25 °C for 24 ± 6 h. The sample was removed and placed inside an oven 105 °C for 20–30 min before being placed in a desiccator to cool. Ash content was calculated by oven dry weight (reported on dry basis, db.) and replicated three times.

3. Results and Discussion

3.1. Microwave Torrefaction

Power levels from low to high were used in this work in order to determine the optimal and cost-effective power setting. Treatments with low to medium power usage (400 to 550 W) presented higher energy consumption due to prolonged time to reach desired temperature. At medium power levels (550 to 700 W), the time to reach the desired temperature was drastically reduced and the oat hull sample had a uniform torrefaction color. Under high power level (>750 W), the energy consumption slightly increased with no significant decrease in processing time, but it tended to damage the reactor vessel and components. Therefore, in order to avoid thermal shock and damage to the reactor, a reactor heating time of 8 to 12 min was set as a maximum recommended time to reach microwave torrefaction temperatures of 225 to 285 °C from room temperature (25 °C).
Table 1 shows the effect of microwave power on the process variable, where an increase in power level from 400 to 700 W decreased the total processing time, cost per tonne, and total kilowatt hour (kWh). A power level of 700 W may have been the most appropriate from an economic point of view. However, 650 W power level was set as the most appropriate based on safety of the reactor, processing time, and cost per tonne.
Another relevant result was the findings of constant mass yield and higher heating value (HHV) of the oat hull at different microwave power levels, in contrast to previous studies where it was mentioned that higher power levels would lead to a lower mass and an increase in the HHV. For example, Iroba et al. [9] reported that municipal solid waste mass yield was mainly dependent on the microwave power level. In another study, Satpathy et al. [12] mentioned that energy and mass yields decreased with an increase in microwave power and reaction time for wheat and barley straw. Lin [31] stated that higher microwave power level decreased mass and energy yields and increased HHV of waste straw. Huang et al. [13] described that the HHV of the rice straw and Pennisetum would increase with higher microwave power levels. Moreover, Wang et al. [32] reported that high microwave power levels would result in a loss of the torrefied rice husk and sugar cane mass yield.
A trend in previous studies implied that the mass yield decreased with increase in microwave power for various biomass types. However, this is only a simplistic view and a better explanation could be offered by understanding how microwave power influences the biomass temperature level, which leads to an increase in mass loss and heating value. From Figure 2a, it can be observed that a higher microwave power level would result in a reduced processing time to reach the torrefaction temperature (220 °C for this example), with coefficient of determination (R2) of 0.99. This suggests that a second-order polynomial regression has a predictive capability on the time required for torrefaction as a function of microwave power operation condition. From Figure 2b, the effect of increased microwave power produced a faster rise or increase in temperature level, with R2 of 0.99, suggesting that there is a high positive linear association between variables.
The results showed that mass yield and HHV of torrefied biomass remained constant through different microwave power levels which is dissimilar to previous microwave torrefaction studies reported. An accurate control of the microwave torrefaction temperature by fiber optic temperature sensor would explain this dissimilarity. As mentioned by Basu [6], reaction temperature is one of the most important factors in torrefaction. For example, the targeted microwave torrefaction was set to 255 °C and 6 min residence time. Once the biomass reached torrefaction temperature, the microwave power had to be manually regulated (decreased and increased) during the residence time, in order to hold the desired torrefaction temperature at 225 °C. Without microwave power regulation during residence time, the biomass temperature would continue to increase leading to a mass yield decrease and HHV increase. Based on temperature profiles of the different microwave power levels (Figure 3), it was observed that higher power levels required less time to reach torrefaction temperature. When power levels were increased from 400 to 785 W, the time to reach torrefaction temperature decreased from 20 to 6.5 min, while the average heating rate simultaneously increased from 9.8 to 28.6 °C min−1.

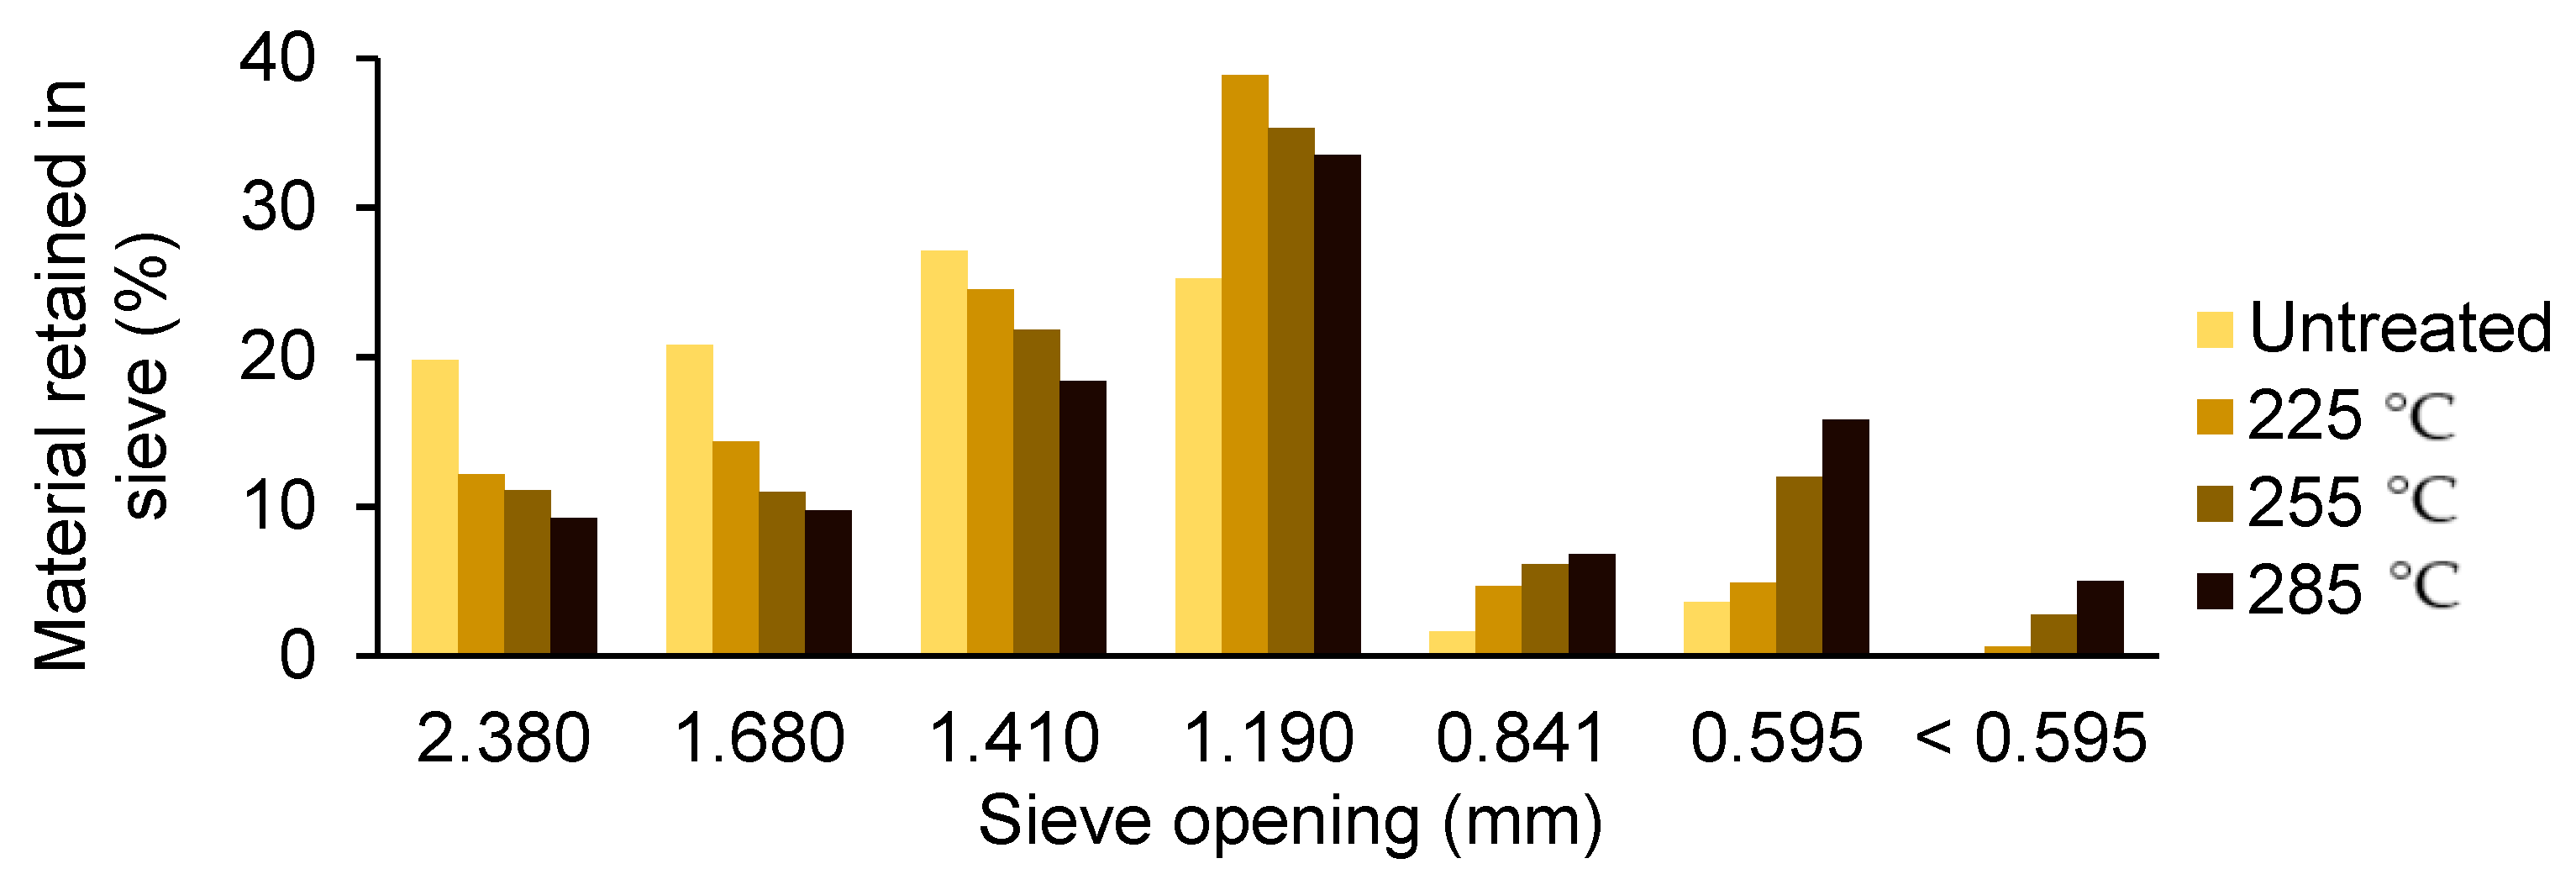
3.2. Physical Properties of the Samples

Table 2 presents the moisture content, particle size, and bulk density of torrefied and untorrefied oat hull, where increased microwave torrefaction temperatures decreased the geometric mean particle diameter (dgw) and the standard deviation of particle diameter (Sgw). This could be explained by material shrinkage due to removal of moisture and volatiles through thermal treatment. For instance, Tumuluru et al. [3] attributed the shrinkage to loss of volatiles leading to a reduction in weight, while Bergman and Kiel [33] explained that biomass shrinkage was caused by a volumetric change due to torrefaction deep drying. Figure 4 shows how the particle size distribution decreased with the increment in torrefaction level, where higher temperatures produced smaller particle sizes.
The ash content increased with an increasing torrefaction temperature, while moisture content of torrefied samples drastically decreased from 10.4 to its lowest 0.78% wb at high microwave torrefaction temperature. The bulk density did not present any significant changes at light microwave torrefaction temperature (225 °C). However, as the microwave torrefaction temperature increased to moderate (255 °C) and severe (285 °C), the bulk density decreased due to loss of mass specifically from hemicellulose. Rodrigues and Rousset [34] reported similar results, as they indicated that low torrefaction temperatures (220 °C) did not cause any significant change in biomass density. The authors also determined that increased residence time did not cause any significant changes to bulk density or particle size between microwave torrefaction treatments.
Moisture absorption of microwave torrefied samples was found to be lower than that of untorrefied samples. After full saturation (72 h at 25 °C and 90% RH), the microwave torrefied oat hull samples at temperatures of 225, 255, and 285 °C had respective moisture contents of 15.37, 9.25, and 8.08% wt. vs. 17.96% wt. for the untreated. This difference of moisture absorption capability of oat hull could be explained by a depolymerization of polymers and removal of oxygen groups from the cell wall, replacing hydrophilic for hydrophobic groups resulting from torrefaction [35]. Peng et al. [20] attributed the decrease in moisture uptake of torrefied wood pellets to a decreased hydrophilic OH group and increased hydrophobic carbon content.

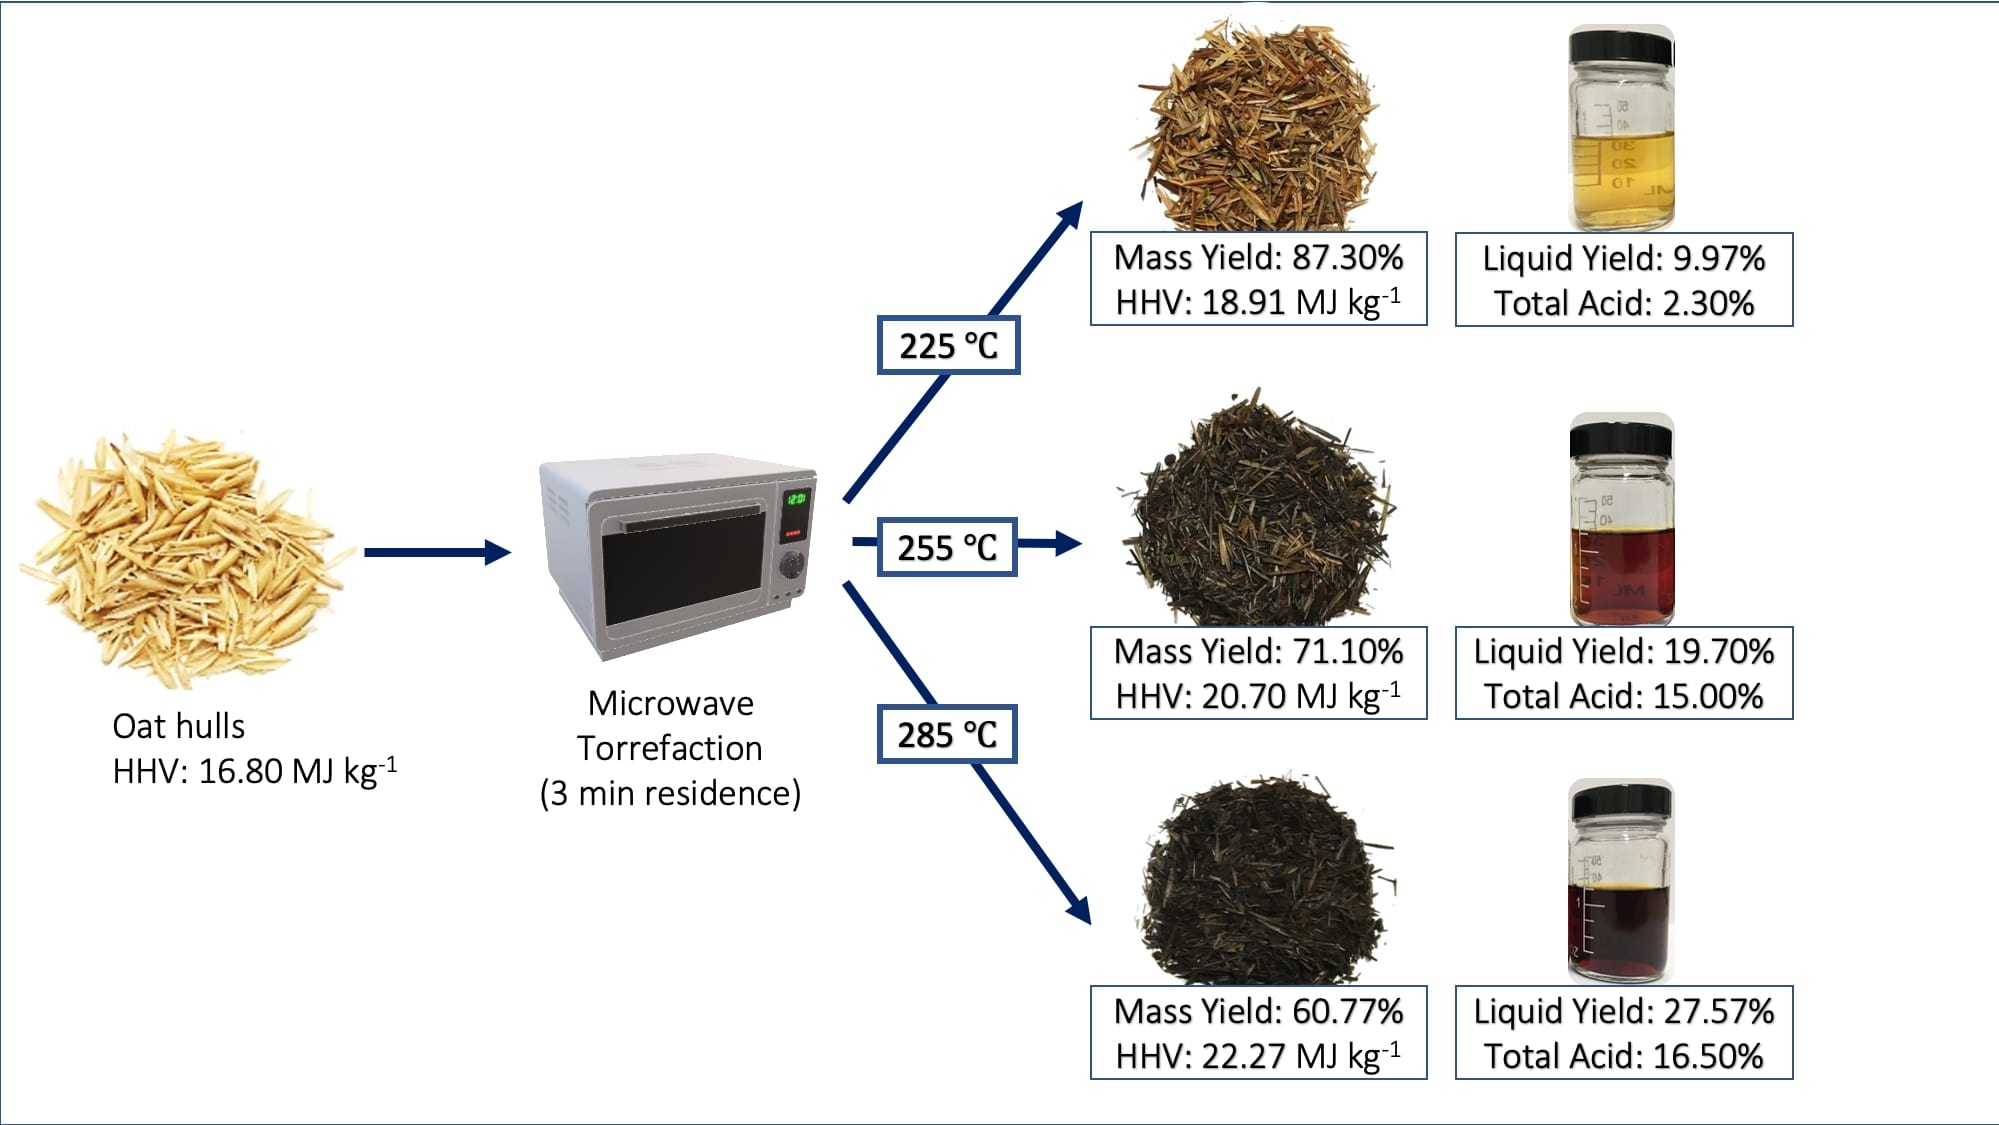
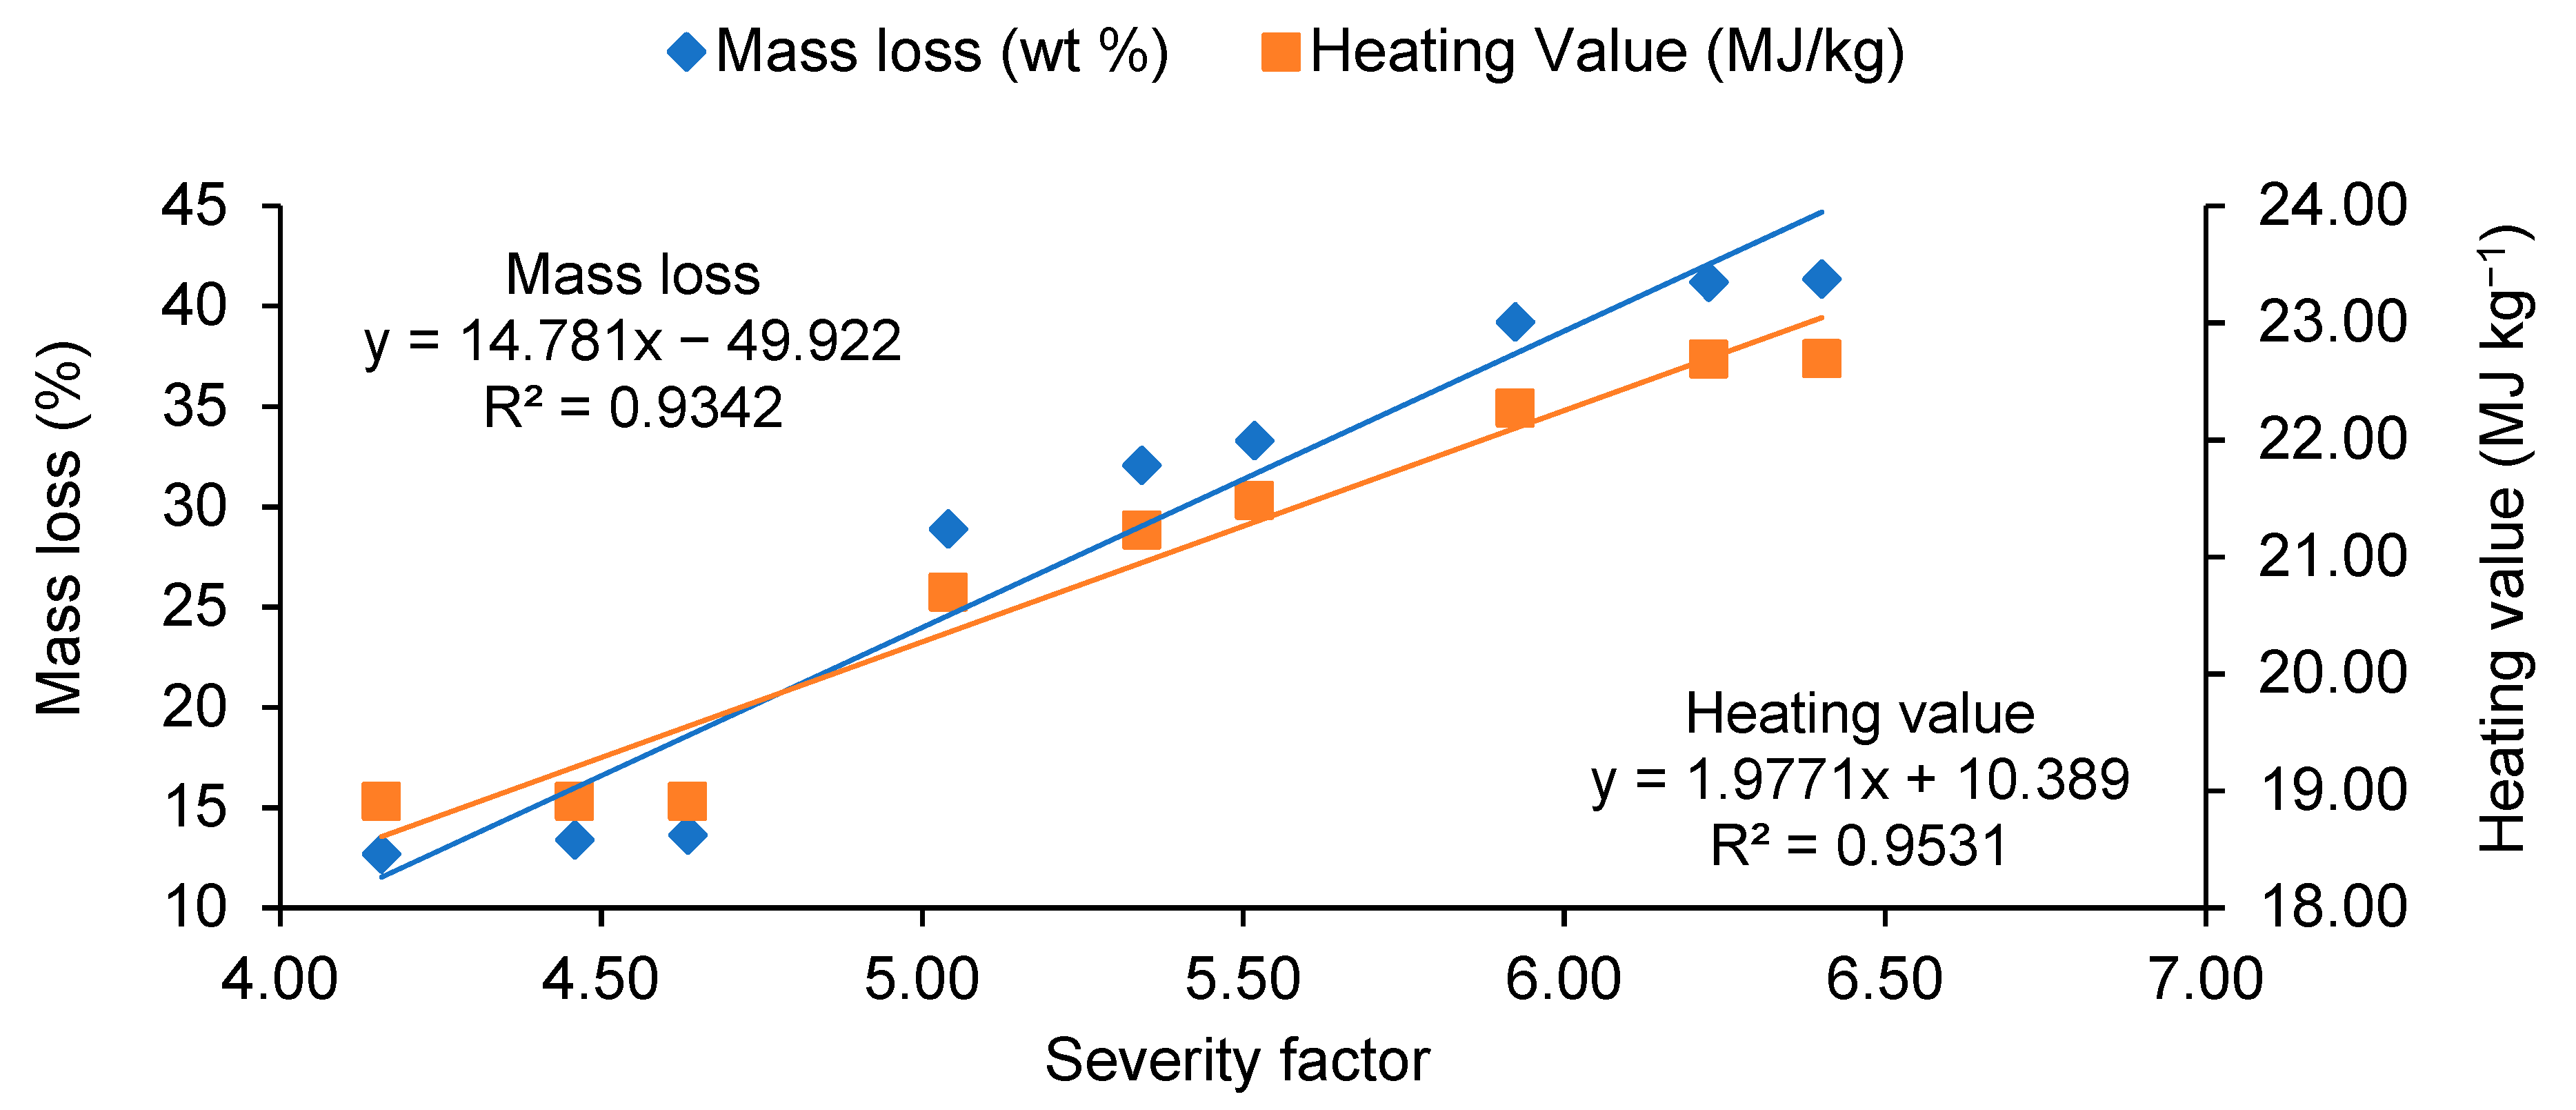
3.3. Torrefaction Performance

Figure 5 shows an increase in mass loss due to torrefaction temperature. The mass loss generally included part or all of the extractives of hemicellulose and cellulose contents depending on microwave torrefaction level (Table 3). The maximum mass loss was recorded at 285 °C and 9 min residence time to be 41.3% wt. Moreover, increasing the torrefaction residence time did not significantly influence the mass loss as compared to increasing the temperature level. The average HHV of as-received oat hull was 16.8 MJ kg−1, and the highest value of 22.70 MJ kg−1 was obtained by severe microwave torrefaction and 9 min residence time (35.12% higher). The average energy density of light (97%), moderate (87%), and severe (79%) torrefaction gradually decreased by a reduction of the mass yield. Generally, a higher microwave power level contributed to the increase of HHV of torrefied oat hull. However, it was observed that similar to mass loss, HHV was not significantly increased as a result of a longer residence time. Almeida et al. [36] and Huang et al. [13] used mass loss and heating values as indicators of torrefaction severity. For the microwave torrefaction of oat hull, a severity factor (SF) was used to integrate temperature and residence time [37]. Equation (6) defines the SF used in this study as:
S F = l o g [ t e x p ( T H T R 14.75 ) ]
where t is the reaction time of microwave torrefaction in min; TH is the reaction temperature in °C; and TR is the reference temperature (100 °C).
Figure 5 presents a correlation between heating value and mass loss of oat hull after microwave torrefaction, where a decrease in the mass loss generally increased the HHV. Moreover, a severe decrease in the mass loss tended to reduce the energy yields by up to 58.63%. Mass loss and heating value presented a R2 of 0.93 and 0.95, respectively, suggesting that the regression equations can fairly predict these variables with a high positive linear association between variables and SF.
As observed in Table 3, high temperatures resulted in higher liquid and gas yields. During torrefaction, water and acids are produced from hemicellulose and cellulose degradation [6,38]. As described by Basu [6], large structures of hemicellulose, cellulose, and lignin will degrade into smaller ones and can be classified as gas (CH4, CO, H, CO2, and steam), liquid (water, tar, phenols, acids, and carbonyls), and mass (char).

3.4. Energy Consumption during Grinding

For as-received untreated oat hull, the grinding process was shown to consume a lot of energy (121.54 KJ kg−1). However, by reducing the sample moisture content, the energy consumption decreased by 44% (68.54 KJ kg−1). Through the use of light (225 °C), moderate (255 °C), and severe (285 °C) torrefaction, the grinding energy reduced by 64, 80, and 86%, respectively, with corresponding energy consumptions of 43.70, 23.88, and 17.30 KJ kg−1, respectively. The decrease in grinding energy of oat hull after microwave torrefaction was comparable with results obtained in other similar studies for biomass [39,40,41]. For example, according to Repellin et al. [41], dehydration decreased grinding energy by the breakdown of the fibrous structure of wood. Moreover, microwave torrefaction tended to degrade the lignocellulosic structure of the oat hull. Therefore, the higher torrefaction treatment level resulted in a greater lignocellulosic structure degradation with an improved grindability and a reduced energy consumption.

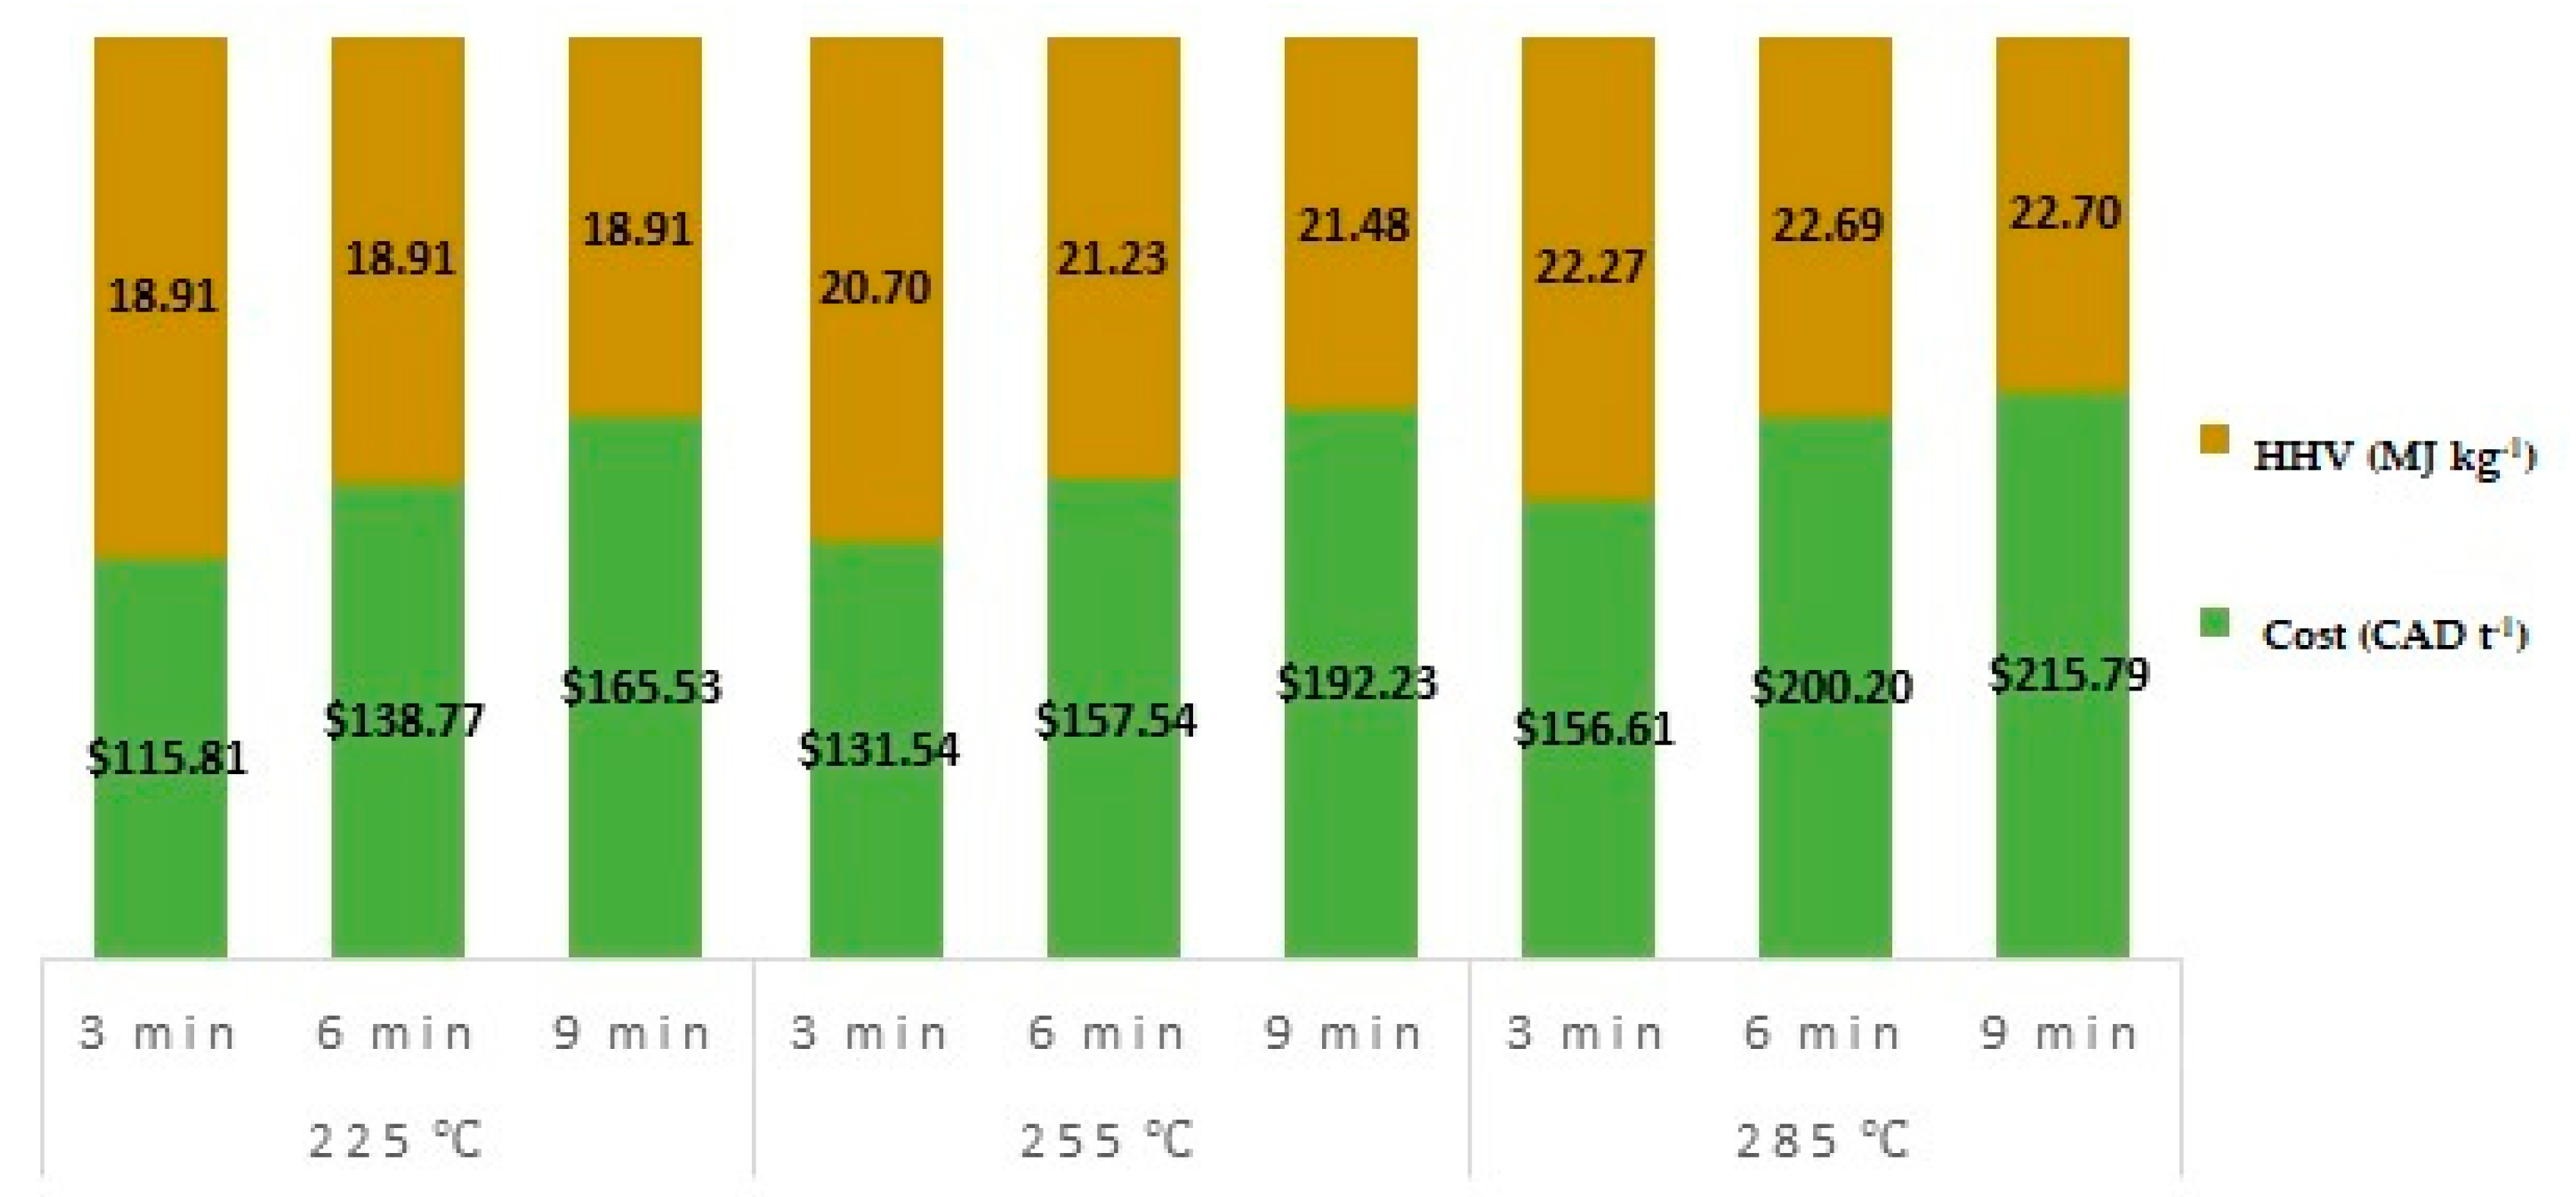
3.5. Cost Per Tonne of Torrefied Material

Data from test results indicated that during the light microwave torrefaction treatment there was no significant increment in HHV with residence time; however, there was a significant increment in cost from $116 to $166 per tonne (Figure 6). Moreover, HHV increased with residence time for moderate and severe microwave torrefaction; however, the production cost was significantly increased. These results reflected that prolonged residence time substantially increased the production cost. Therefore, in order to increase the biomass HHV at low processing cost, the residence time has to be minimum at a high temperature level. For example, biomass processed at 285 °C and 3 min residence time would have a higher HHV and lower cost than treatments with 6 or 9 min residence time at 255 °C.

3.6. Organic Composition of Samples

This work also investigated the effect of microwave torrefaction level on lignocellulosic structure of oat hull. As observed in Table 4, there was a significant degradation of hemicellulose by microwave torrefaction treatment from an initial content of 37.54 to 0.72% db through severe microwave torrefaction. Moreover, cellulose, and lignin contents increased, except for the severe microwave torrefaction treatment, where cellulose also decreased due to the higher thermal treatment. According to Nhuchhen et al. [8], hemicellulose presents a lower degree of polymerization when compared to cellulose, resulting in higher thermal degradation, with severe mass yield reduction. Lignin increased from an initial content of 11.46 to 45.65% db through severe microwave torrefaction, suggesting that there was a much lower degradation when compared to hemicellulose and cellulose. This reduced degradation could be explained due to its large sterically hindered complex structure and lack of hydroxyl groups [42]. The heating values increased with microwave torrefaction temperature level which can be explained by the removal of hemicelluloses. For example, hemicelluloses presented a much lower heating value (13.6 MJ kg−1), when compared to lignin (27 MJ kg−1) which was reported to increase [40,43]. According to Basu [6] cellulose is composed of condensable vapors, while hemicellulose produces more non-condensable gases, less tar, and acetic acid.
Table 5 shows that microwave torrefaction resulted in significant elemental composition changes, making oat hull more suitable for fuel applications since percentage of carbon increased and oxygen contents reduced. For severe microwave torrefaction, the carbon content increased by 30.16%, while hydrogen and oxygen contents decreased by 8.10, and 19.40%, respectively thus lowering the C-H and C-O ratios. According to Phanphanich and Mani [40] reduction of C-H and C-O bonds enhances the properties of a fuel by increasing heating values and reducing smoke and water vapors during combustion.

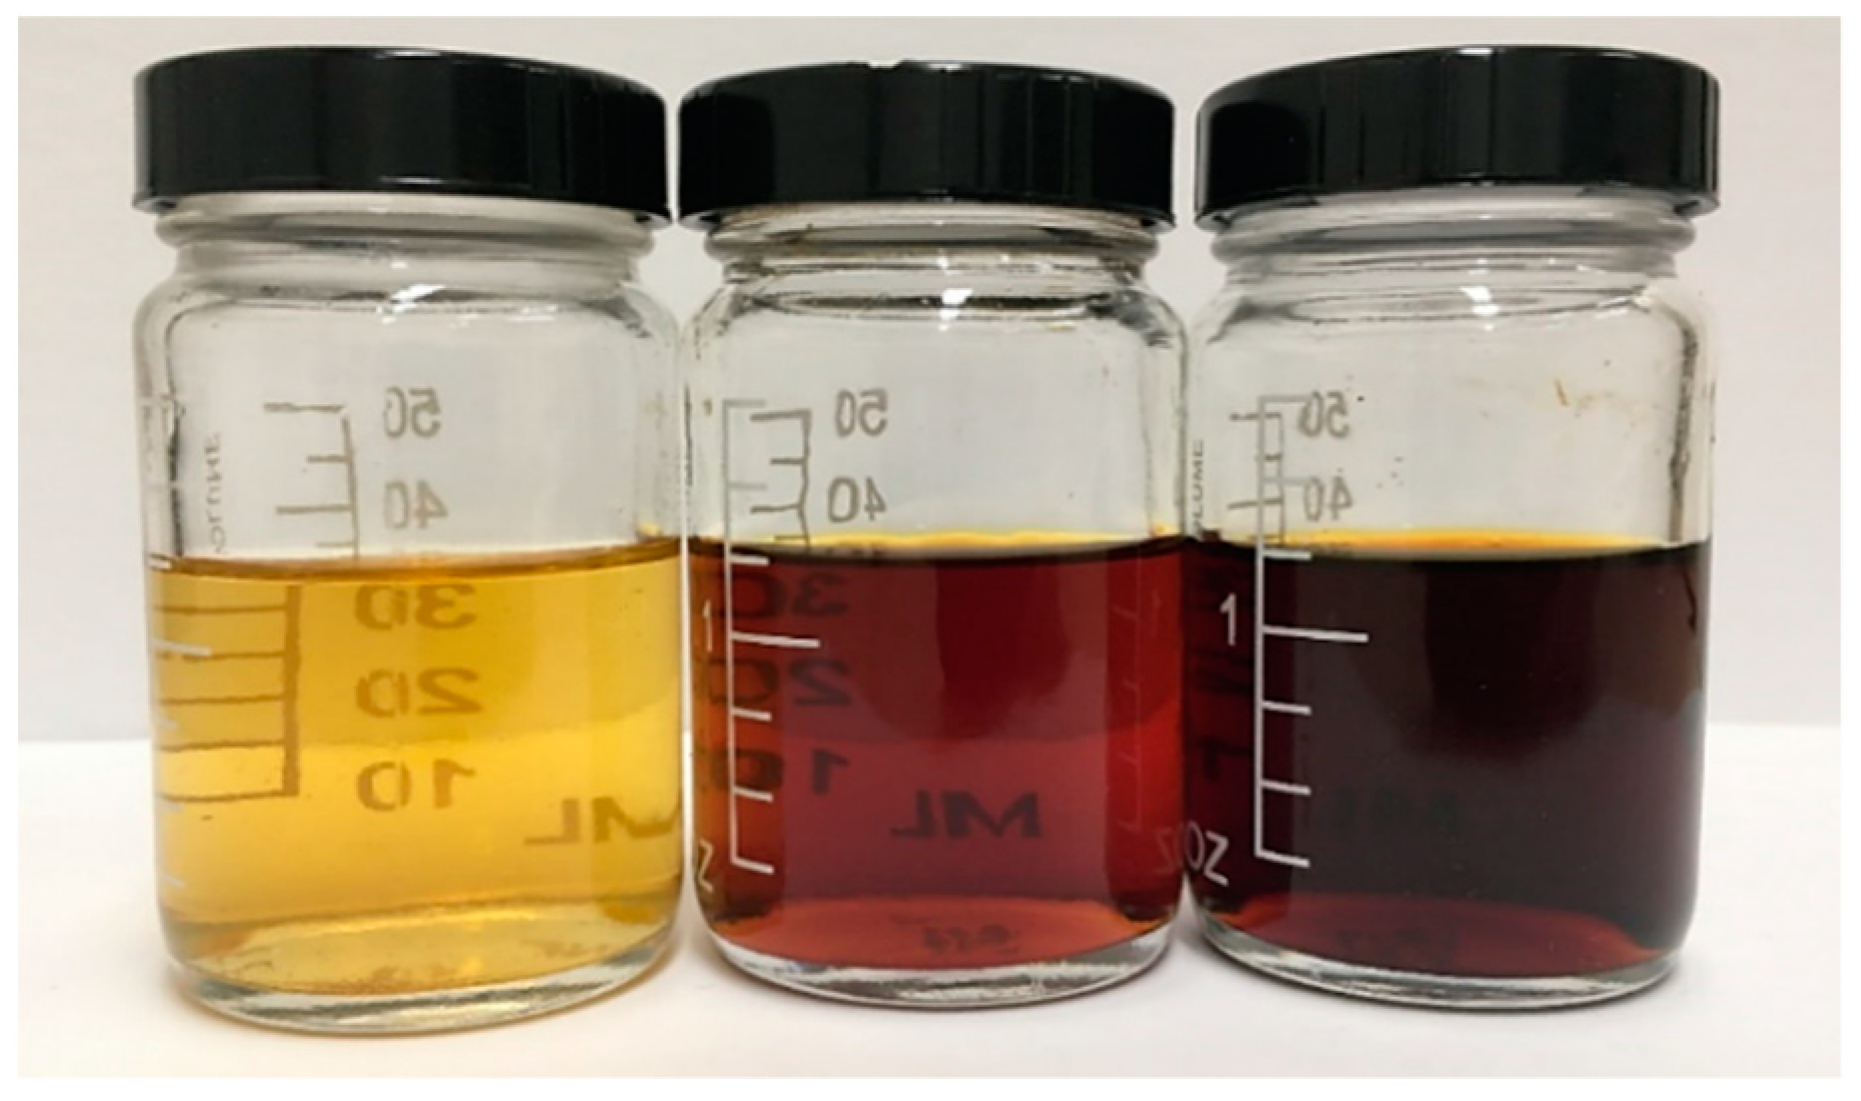
3.7. By-Products of Torrefaction

Component degradation of cellulose, hemicellulose, and lignin by pyrolysis of hardwood constitutes liquid formation, also referred as liquid smoke [6,23]. Commercial liquid smokes are widely used in the food industry to provide flavor, color, texture, and sometimes extend the product shelf life [23]. Other advantages of liquid smoke over traditional direct smoke contact are higher homogeneity, reduced environmental pollution, better storability, lower processing time, and superior control of PAH groups [44].
The main product of torrefaction is clearly the bio-char [6]. However, another important factor that many previous studies did not take into account was the utilization of torrefaction by-products such as the liquid and gas yields [9,31,40,45,46]. Figure 7 shows the liquid yield collected from different torrefaction temperatures. As observed, the higher the microwave torrefaction level, the darker the color of liquid yield (smoke) product. As microwave torrefaction temperature increased from 255 to 285 °C, the degree of cellulose polymerization decreased from 38.92 to 33.52% (Table 4). According to Rama
Krishnan and Moeller [23] and Budaraga et al. [47], degradation of cellulose and hemicellulose leads to formation of carbonyl groups, which are responsible for the darker brown color of liquid smoke compositions. Therefore, a higher carbonyl concentration would lead to a darker color.
Table 6 presents the three microwave torrefaction levels and commercial liquid smoke properties. The results show that high microwave torrefaction levels decrease pH, while increasing total acids (acetic acid) and tar contents. It was reported that acetic acids were formed from thermal decomposition of cellulose and hemicellulose but mainly from degradation of the acetyl groups of hemicelluloses during torrefaction [48]. The heat during torrefaction degraded hemicellulose almost completely when light (27.34%) to moderate (0.81%) microwave torrefaction was applied, explaining the drastic increase in total acids from 2.3% to 15% for the corresponding treatments. Furthermore, cellulose degradation produces water vapor, CO2, CO, and condensable gases, while thermal degradation of lignin produces around 20% liquid yield and 15% tar [6].
Liquid smoke is widely used in the food industry, having an average price of USD 10 per L and a minimum selling price of USD 2 per L [14]. However, price may vary depending on the type of extraction, raw material, and flavour profile (e.g., sweet or woody flavor). These new types of liquid smoke could be of great value to the food industry, which despite having a low quality, can be used in low-end food products such as hot dogs and sausages which have a market size of USD 7.8 billion in 2019 [49].

4. Conclusions

Microwave torrefaction was found to enhance fuel properties and physicochemical characteristics of oat hull. Based on this research the following conclusions are drawn:
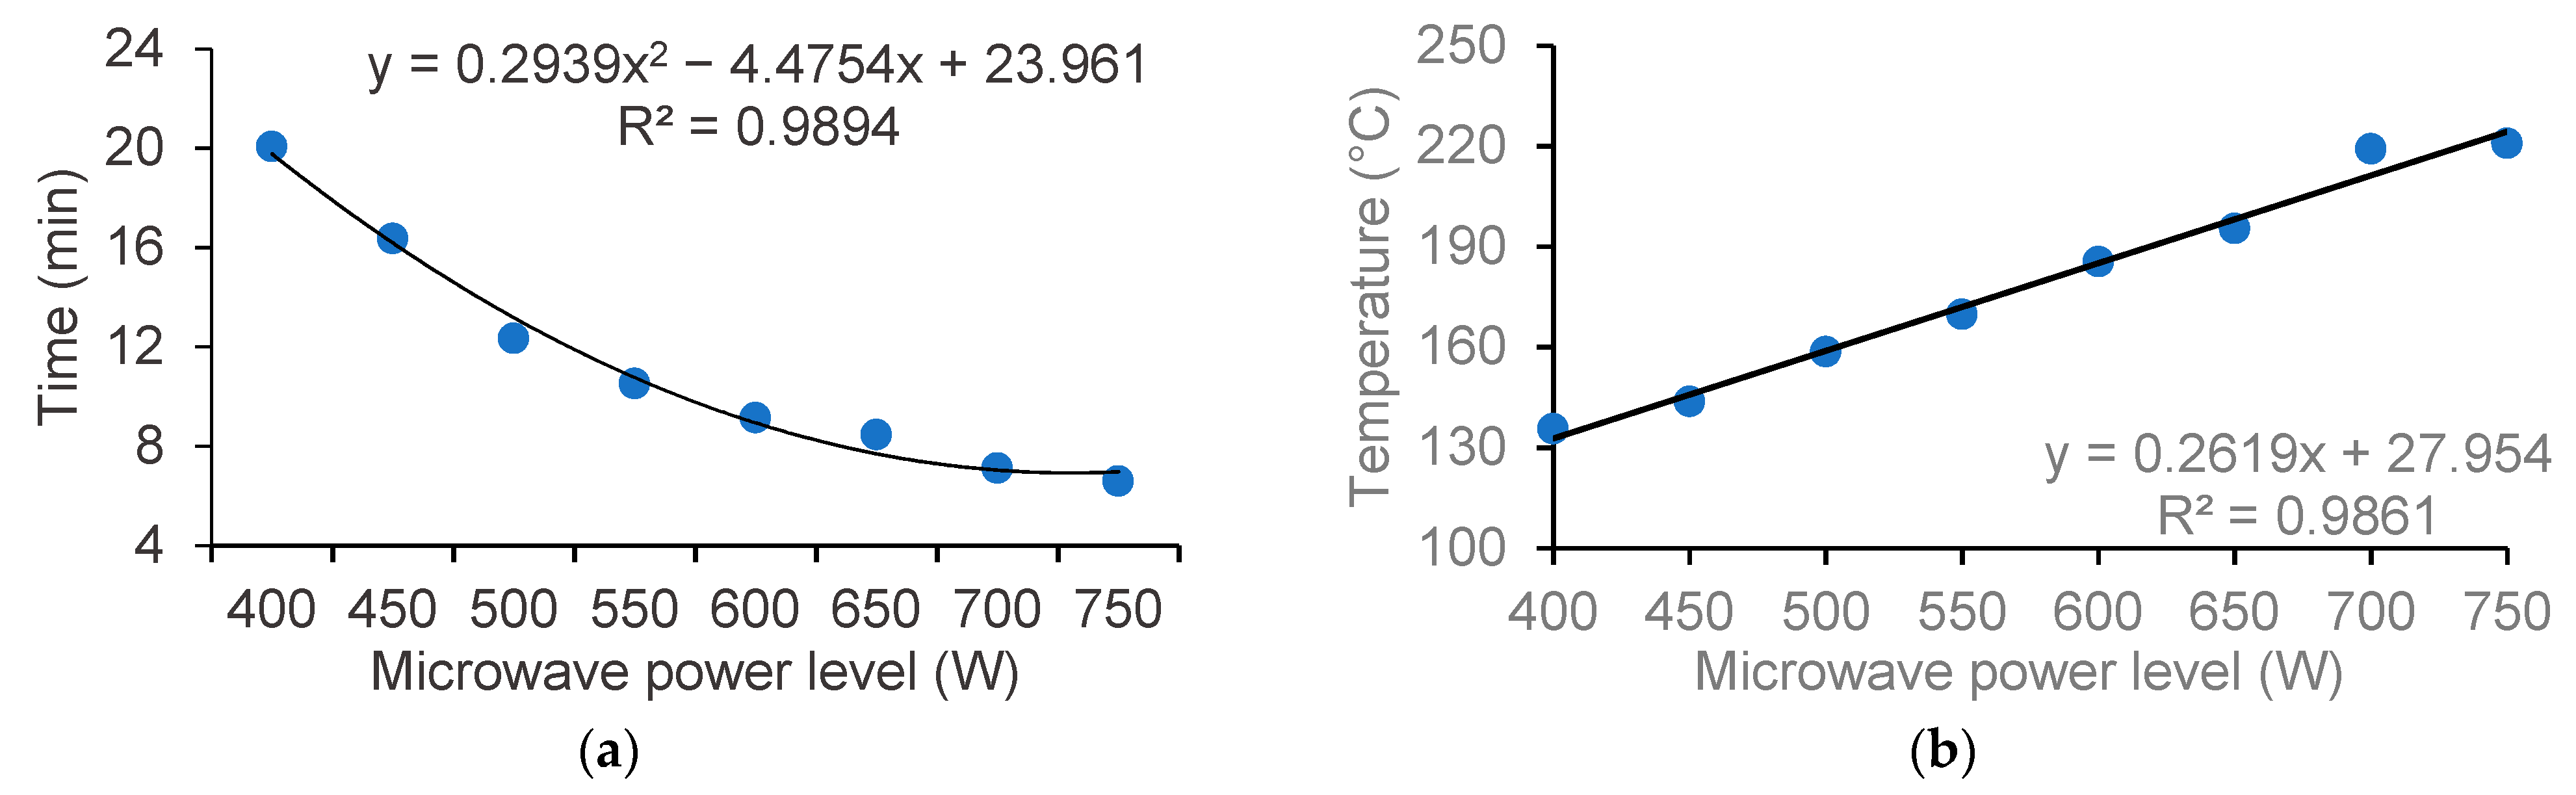
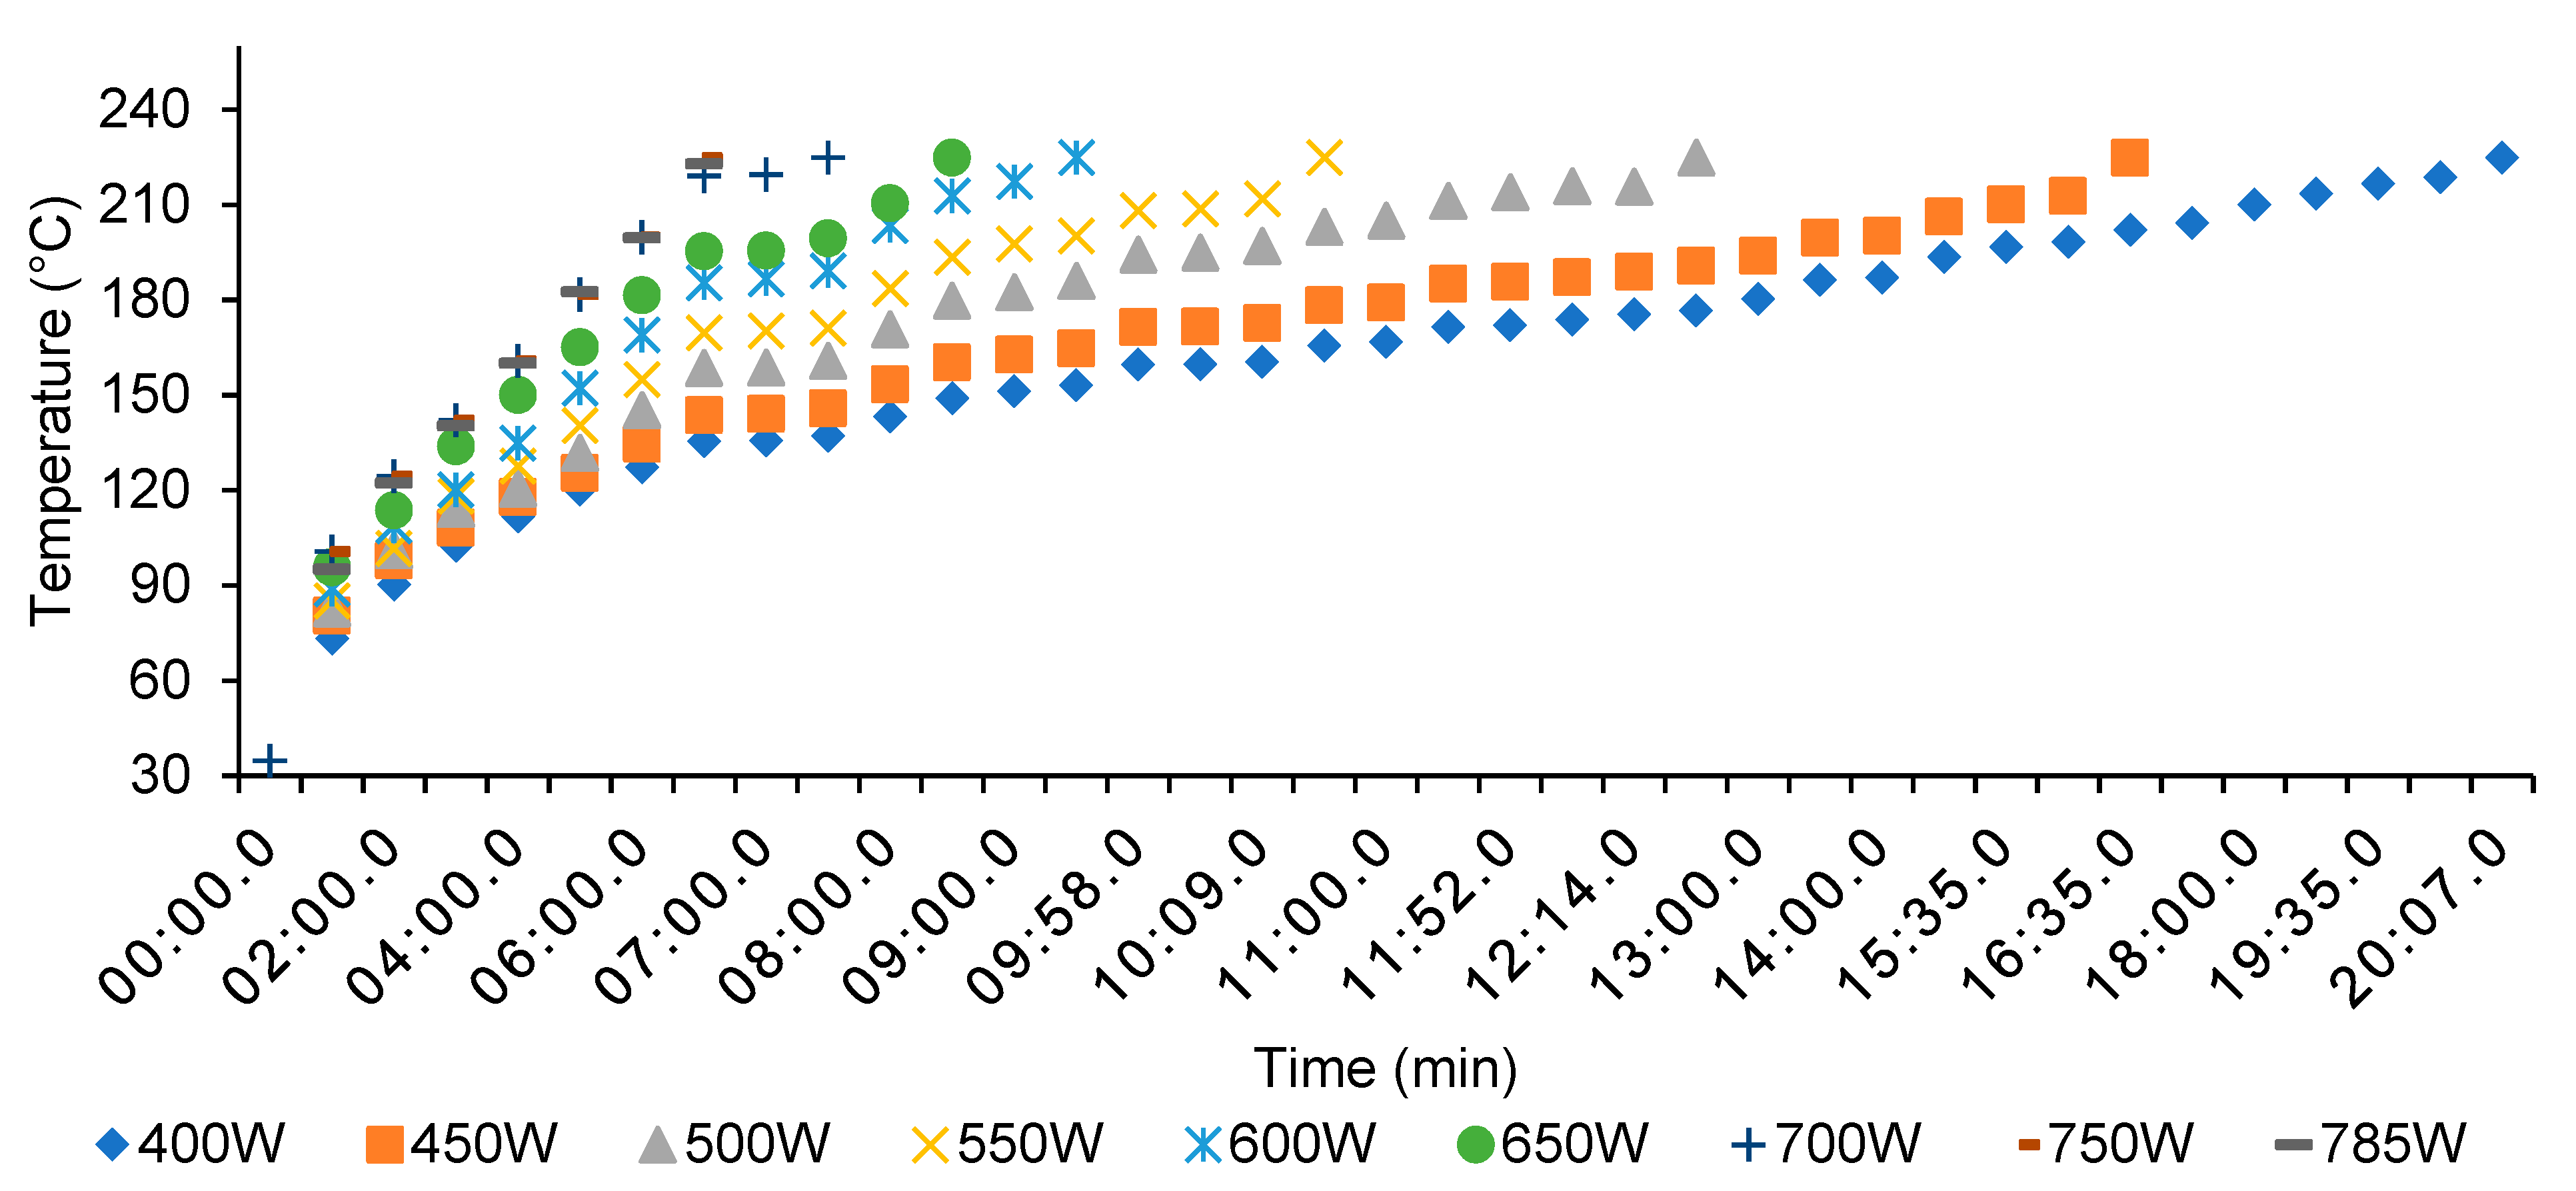
  • A higher microwave power level drastically decreased processing time, without modifying the final torrefied biomass energy and mass yields.
  • Physical properties such as moisture content, particle size, moisture absorption, mass yield, ash content, and bulk density decreased with an increase in microwave torrefaction temperature.
  • Increase in microwave torrefaction residence time from 3 to 9 min did not significantly modify the heating values, mass, or energy yields. However, the cost of torrefied material significantly increased by an average of 42% from 3 to 9 min.
  • There was a drastic decrease in grinding energy consumption of 44 to 86% by water removal and degradation of biomass lignocellulosic structure through microwave torrefaction.
  • At 285 °C, carbon content increased 130.16%, while oxygen and hydrogen contents decreased by 19.40% and 8.09%, whereas the hemicellulose decreased by 98.08% and lignin increased 398.34%.
  • The changes in heating values were attributed to devolatilization of hemicellulose and incremented lignin content. These reactions resulted in color change, formation of carbon monoxide, carbon dioxide, water, acids, phenols, and carbonyls.
  • Through an increased microwave power level from 400 to 700 W, the total processing time and energy consumption decreased from 23.07 to 10.10 min and from 158.79 to CAD $109.38 ton−1.
The liquid by-product of microwave torrefaction of oat hull can be potentially used as liquid smoke for the food industry. Detailed technical and economic studies of the liquid by-product may be conducted to utilize and add value to the microwave torrefaction process of oat hull.

Author Contributions

E.V.: Data curation, Formal analysis, Software, Investigation, Methodology, Writing—original draft. L.G.T.: Conceptualization, Data curation, Funding acquisition, Methodology, Project administration, Resources, Supervision, Validation, Writing—review and editing. E.M.: Conceptualization, Funding acquisition, Resources, Software, Supervision, Visualization, Writing—review and editing. D.C.: Methodology, Funding acquisition, Writing—review and editing. H.M.: Investigation, Visualization, Writing—review and editing. All authors have read and agreed to the published version of the manuscript.

Funding

The authors acknowledge the funding support from Natural Sciences and Engineering Research Council of Canada (NSERC) (RGPIN-2017-05287) and BioFuelNet Canada (ASC-16).

Institutional Review Board Statement

Not applicable.

Informed Consent Statement

Not applicable.

Data Availability Statement

The data presented in this study are available on request from the corresponding author. The data are not publicly available due to privacy.

Acknowledgments

We also acknowledge the support of Tim Dumonceaux and our industry partners, particularly Richardson Milling.

Conflicts of Interest

The authors declare no conflict of interest.

References

  1. Fraser, J.; McCartney, D. Chapter III—Fodder oats in North America. In Fodder Oats: A World Overview; Suttie, J.M., Reynolds, S.G., Eds.; Food and Agriculture Organization of the United Nations: Rome, Italy, 2004. [Google Scholar]
  2. Arias, B.; Pevida, C.; Fermoso, J.; Plaza, M.G.; Rubiera, F.; Pis, J.J. Influence of torrefaction on the grindability and reactivity of woody biomass. Fuel Process. Technol. 2008, 89, 169–175. [Google Scholar] [CrossRef] [Green Version]
  3. Tumuluru, J.; Sokhansanj, S.; Wright, C.T.; Hess, J.R.; Boardman, R.D. A review on biomass torrefaction process and product properties. Symposium on thermochemical conversion. Ind. Biotechnol. 2011, 7, 384–401. [Google Scholar] [CrossRef] [Green Version]
  4. Vassilev, S.V.; Vassileva, C.G.; Vassilev, V.S. Advantages and disadvantages of composition and properties of biomass in comparison with coal: An overview. Fuel 2015, 158, 330–350. [Google Scholar] [CrossRef]
  5. Basu, P. (Ed.) Chapter 4—Torrefaction. In Biomass Gasification, Pyrolysis and Torrefaction, 2nd ed.; Academic Press: Boston, MA, USA, 2013; pp. 87–145. [Google Scholar]
  6. Basu, P. (Ed.) Chapter 4—Torrefaction. In Biomass Gasification, Pyrolysis and Torrefaction, 3rd ed.; Academic Press: Cambridge, MA, USA, 2018; pp. 93–154. [Google Scholar]
  7. Chen, W.-H.; Kuo, P.-C. Torrefaction and co-torrefaction characterization of hemicellulose, cellulose and lignin as well as torrefaction of some basic constituents in biomass. Energy 2011, 36, 803–811. [Google Scholar] [CrossRef]
  8. Nhuchhen, D.; Basu, P.; Acharya, B. A comprehensive review on biomass torrefaction. Int. J. Renew. Energy Biofuels 2014, 1–56. [Google Scholar] [CrossRef]
  9. Iroba, K.L.; Baik, O.-D.; Tabil, L.G. Torrefaction of biomass from municipal solid waste fractions II: Grindability characteristics, higher heating value, pelletability and moisture adsorption. Biomass Bioenergy 2017, 106, 8–20. [Google Scholar] [CrossRef]
  10. Abubakar, Z.; Salema, A.A.; Ani, F.N. A new technique to pyrolyse biomass in a microwave system: Effect of stirrer speed. Bioresour. Technol. 2013, 128, 578–585. [Google Scholar] [CrossRef]
  11. Abedi, A.; Dalai, A.K. Study on the quality of oat hull fuel pellets using bio-additives. Biomass Bioenergy 2017, 106, 166–175. [Google Scholar] [CrossRef]
  12. Satpathy, S.K.; Tabil, L.G.; Meda, M.; Narayana, S.; Rajendra, P. Torrefaction and grinding performance of wheat and barley straw after microwave heating. In Proceedings of the CSBE/SCGAB Annual Conference, Saskatoon, SK, Canada, 10–13 July 2013; p. 17. Available online: http://www.csbe-scgab.ca/docs/meetings/2013/CSBE13065.pdf (accessed on 6 December 2019).
  13. Huang, Y.F.; Chen, W.R.; Chiueh, P.T.; Kuan, W.H.; Lo, S.L. Microwave torrefaction of rice straw and pennisetum. Bioresour. Technol. 2012, 123, 1–7. [Google Scholar] [CrossRef] [PubMed]
  14. Valdez, E. Microwave Torrefaction and Densification of oat Hulls for Heat and Power Production. Master’s Thesis, University of Saskatchewan, Saskatoon, SK, Canada, 2021. [Google Scholar]
  15. ASAE S358.3. Moisture Measurement-Forages; American Society of Agricultural and Biological Engineers Standards: St. Joseph, MI, USA, 2012; Available online: https://webstore.ansi.org/standards/asabe/ansiasaes358may2012r2017 (accessed on 9 December 2019).
  16. ANSI/ASAE S319.3. Method of Determining and Expressing Fineness of Feed Materials by Sieving; American Society of Agricultural and Biological Engineers Standard: St. Joseph, MI, USA, 2003; Available online: https://webstore.ansi.org/standards/asabe/ansiasaes319feb2008r2017 (accessed on 9 December 2019).
  17. Adapa, P.; Tabil, L.; Schoenau, G. Grinding performance and physical properties of non-treated and steam exploded barley, canola, oat and wheat straw. Biomass Bioenergy 2011, 35, 549–561. [Google Scholar] [CrossRef]
  18. Lu, Q.; Tang, L.; Wang, S.; Chen, Y.; Chen, X.; Huang, B. Preparation and characterization of cellulose nanocrystals via ultrasonication-assisted FeCl3-catalyzed hydrolysis. Cellulose 2014, 21, 3497–3506. [Google Scholar] [CrossRef]
  19. Acharjee, T.C.; Coronella, C.J.; Vasquez, V.R. Effect of thermal pretreatment on equilibrium moisture content of lignocellulosic biomass. Bioresour. Technol. 2011, 102, 4849–4854. [Google Scholar] [CrossRef]
  20. Peng, J.; Bi, H.T.; Lim, C.J.; Sokhansanj, S. Study on density, hardness, and moisture uptake of torrefied wood pellets. Energy Fuels 2013, 27, 967–974. [Google Scholar] [CrossRef]
  21. Bridgeman, T.G.; Jones, J.M.; Shield, I.; Williams, P.T. Torrefaction of reed canary grass, wheat straw and willow to enhance solid fuel qualities and combustion properties. Fuel 2008, 87, 844–856. [Google Scholar] [CrossRef]
  22. Bridgeman, T.G.; Jones, J.M.; Williams, A.; Waldron, D.J. An investigation of the grindability of two torrefied energy crops. Fuel 2010, 89, 3911–3918. [Google Scholar] [CrossRef] [Green Version]
  23. Ramakrishnan, S.; Moeller, P.J. Liquid smoke: Product of hardwood pyrolysis. Fuel Chem. Div. Prepr. 2002, 47, 366–367. [Google Scholar]
  24. Abdel-Shafy, H.I.; Mansour, M.S.M. A review on polycyclic aromatic hydrocarbons: Source, environmental impact, effect on human health and remediation. Egypt. J. Pet. 2016, 25, 107–123. [Google Scholar] [CrossRef] [Green Version]
  25. Moeller, P.W.; Ramakrishnan, S. Process for Making Liquid Smoke Brownin Agent Solution. WO 2001/028361, 11 April 2007. Available online: https://patentimages.storage.googleapis.com/bc/b7/e2/68375b2283834a/EP1221866B1.pdf (accessed on 10 August 2020).
  26. Saskpower. Power Supply Rates. Power Company. 2019. Available online: https://www.saskpower.com/Accounts-and-Services/Billing/Power-Rates/Power-Supply-Rates (accessed on 9 December 2019).
  27. ANKOM Technology. Method 5: Acid Detergent Fiber in Feeds—Filter Bag Technique (for A200 and A200I). Available online: https://www.ankom.com/sites/default/files/document-files/Method_5_ADF_A200.pdf (accessed on 1 April 2020).
  28. ANKOM Technology. Method 6: Neutral Detergent Fiber in Feeds—Filter Bag Technique (for A200 and A200I). Available online: https://www.ankom.com/sites/default/files/document-files/Method_6_NDF_A200.pdf (accessed on 1 April 2020).
  29. ANKOM Technology. Method 8: Determining Acid Detergent Lignin in Beakers. Available online: https://www.ankom.com/sites/default/files/document-files/Method_8_Lignin_in_beakers_0.pdf (accessed on 1 April 2020).
  30. Sluiter, A.; Hames, B.; Ruiz, R.; Scarlata, C.; Sluiter, J.; Templeton, D. Determination of Ash in Biomass; Technical Report NREL/TP-510-42622; Office of Energy Efficiency and Renewable Energy, National Renewable Energy Laboratory: Golden, CO, USA, 2008; Available online: https://www.researchgate.net/publication/309108211_Determination_of_Ash_in_Biomass/citations (accessed on 1 April 2020).
  31. Lin, Y.-L. Effects of microwave-induced torrefaction on waste straw upgrading. Int. J. Chem. Eng. Appl. 2015, 6, 401–404. [Google Scholar] [CrossRef] [Green Version]
  32. Wang, M.J.; Huang, Y.F.; Chiueh, P.T.; Kuan, W.H.; Lo, S.L. Microwave-induced torrefaction of rice husk and sugarcane residues. Energy 2012, 37, 177–184. [Google Scholar] [CrossRef]
  33. Bergman, P.; Kiel, J. Torrefaction for biomass upgrading. In Proceedings of the 14th European Biomass Conference & Exhibition, Paris, France, 17–21 October 2005; p. 8. [Google Scholar]
  34. Rodrigues, T.; Rousset, P. Effects of Torrefaction on Energy Properties of Eucalyptus Grandis Wood. Cerne 2009, 15, 446–452. Available online: https://www.researchgate.net/publication/41392935_Effects_of_Torrefaction_on_Energy_Properties_of_Eucalyptus_grandis_Wood (accessed on 15 December 2019).
  35. Verhoeff, F.; Adell I Arnuelos, A.; Boersma, A.R.; Pels, J.R.; Lenselink, J.; Kiel, J.H.A.; Schukken, H. TorTech: Torrefaction Technology for the Production of Solid Bioenergy Carriers from Biomass and Waste|ECN Report, ECN-E--11-039. 2011. Available online: https://library.wur.nl/WebQuery/titel/2012815 (accessed on 11 April 2021).
  36. Almeida, G.; Brito, J.O.; Perré, P. Alterations in energy properties of eucalyptus wood and bark subjected to torrefaction: The potential of mass loss as a synthetic indicator. Bioresour. Technol. 2010, 101, 9778–9784. [Google Scholar] [CrossRef] [PubMed]
  37. Lee, J.-W.; Kim, Y.-H.; Lee, S.-M.; Lee, H.-W. Optimizing the torrefaction of mixed softwood by response surface methodology for biomass upgrading to high energy density. Bioresour. Technol. 2012, 116, 471–476. [Google Scholar] [CrossRef] [PubMed]
  38. Schniewind, A.P. Concise Encyclopedia of Wood & Wood-Based Materials, 1st ed.; MIT Press: Elmsford, NY, USA, 1989. [Google Scholar]
  39. Repellin, V.; Govin, A.; Rolland, M.; Guyonnet, R. Energy requirement for fine grinding of torrefied wood. Biomass Bioenergy 2010, 34, 923–930. [Google Scholar] [CrossRef] [Green Version]
  40. Phanphanich, M.; Mani, S. Impact of torrefaction on the grindability and fuel characteristics of forest biomass. Bioresour. Technol. 2011, 102, 1246–1253. [Google Scholar] [CrossRef]
  41. Govin, A.; Repellin, V.; Rolland, M.; Duplan, J.-L. Effect of Torrefaction on Grinding Energy Requirement for Thin Wood Particle Production. In Proceedings of the XII° Congrès de la Société Française de Génie des Procédés Pour relever les défis Industriels du XXI° Siècle A la Croisée des Sciences et des Cultures, Marseille, France; 2009; p. 7. Available online: https://www.researchgate.net/publication/41817373_Effect_of_torrefaction_on_grinding_energy_requirement_for_thin_wood_particle_production (accessed on 28 March 2020).
  42. Lanigan, B.A. Microwave Processing of Lignocellulosic Biomass for Production of Fuels. Ph.D. Thesis, University of York, York, UK, 2010. [Google Scholar]
  43. Van Heiningen, A. Converting a Kraft pulp mill into an integrated forest biorefinery. Pulp Paper Can. 2006, 107, 38–43. [Google Scholar]
  44. Montazeri, N.; Oliveira, A.C.; Himelbloom, B.H.; Leigh, M.B.; Crapo, C.A. Chemical characterization of commercial liquid smoke products. Food Sci. Nutr. 2013, 1, 102–115. [Google Scholar] [CrossRef] [Green Version]
  45. Ren, S.; Lei, H.; Wang, L.; Bu, Q.; Wei, Y.; Liang, J.; Liu, Y.; Julson, J.; Chen, S.; Wu, J.; et al. Microwave torrefaction of douglas fir sawdust pellets. Energy Fuels 2012, 26, 5936–5943. [Google Scholar] [CrossRef]
  46. Bartocci, P.; Barbanera, M.; Skreiberg, Ø.; Wang, L.; Bidini, G.; Fantozzi, F. Biocarbon pellet production: Optimization of pelletizing process. Chem. Eng. Trans. 2018, 65, 6. [Google Scholar]
  47. Budaraga, K.; Arnim, A.; Marlida, Y.; Bulanin, U. Liquid smoke production quality from raw materials variation and different pyrolysis temperature. Int. J. Adv. Sci. Eng. Inf. Technol. 2016, 6, 306–315. [Google Scholar] [CrossRef]
  48. Güllü, D.; Demirbaş, A. Biomass to methanol via pyrolysis process. Energy Convers. Manag. 2001, 42, 1349–1356. [Google Scholar] [CrossRef]
  49. Wood, L. Global Hot Dogs and Sausages Markets, 2020–2025: Market Is Expected to Grow at a CAGR of 4.08%. Research and Markets. 21 December 2020. Available online: https://www.globenewswire.com/news-release/2020/12/21/2148457/28124/en/Global-Hot-Dogs-and-Sausages-Markets-2020-2025-Market-is-Expected-to-Grow-at-a-CAGR-of-4-08.html (accessed on 7 April 2021).
Figure 1. Schematic diagram of microwave torrefaction system.
Energies 14 04298 g001
Figure 2. Effect of microwave power level on residence time and temperature: (a) microwave power level and time to reach 220 °C, (b) temperature rise based on microwave power level with a 7 min processing time.
Energies 14 04298 g002
Figure 3. Temperature profiles at different microwave power levels.
Energies 14 04298 g003
Figure 4. Particle size distribution by microwave torrefaction level.
Energies 14 04298 g004
Figure 5. Correlation of mass loss and heating values with severity factor. The lines represent the least-squares linear fit to the data.
Energies 14 04298 g005
Figure 6. Effect of microwave torrefaction treatment on heating value and equivalent cost in CAD per tonne.
Energies 14 04298 g006
Figure 7. Filtered liquid smokes from light to severe microwave torrefaction (left to right).
Energies 14 04298 g007
Table 1. Effect of microwave power level on torrefaction variables at target temperature of 225 °C at 3 min residence time.
Power (Watts)Total Processing Time (min)Estimated Cost Per Tonne (CAD t−1)Total kWhkilo Volt Ampere (kVA)Torrefaction Mass Yield (% t−1)
40023.07$158.79 0.14831.387988
45019.35$148.65 0.13861.537786
50015.35$129.05 0.12621.582087
55013.50$121.60 0.12101.633685
60012.14$117.34 0.11361.852288
62511.55$116.31 0.11351.861685
65011.44$115.81 0.11341.875487
67510.47$110.53 0.10871.968086
70010.10$109.38 0.10432.117587
7509.59$110.95 0.10952.089487
7859.48$112.05 0.11112.194385
Table 2. Physical properties of oat hull before and after microwave torrefaction.
Temperature Moisture Content (% wb)dgw (mm)Sgw (mm)Ash Content (% db) Bulk Density (kg m−3)
Untorrefied10.401.6640.7175.30166.34
225 °C0.931.5090.6505.51164.60
255 °C0.811.3780.5936.59152.87
285 °C0.781.2870.5547.59145.67
Note: mean diameter (dgw), and standard deviation of particle diameter (Sgw).
Table 3. Oat hull yields, higher heating value, and severity factor during and after microwave torrefaction.
Temperature (°C)Residence Time (min) Higher Heating Value (MJ kg−1)Mass Yield (%)Liquid Yield (%)Gas Yield (%)Energy Yield (%)Severity Factor
Raw material-16.80100.00--100-
225318.9187.309.972.7398.284.16
618.9186.6010.972.4397.504.46
918.9186.3710.672.9697.244.63
255320.7071.1019.709.2087.615.04
621.2367.9322.379.7085.855.34
921.4866.7022.2311.0785.305.52
285322.2760.7727.5711.6680.565.92
622.6958.8029.0012.2079.426.23
922.7058.6328.7312.6479.216.40
Table 4. Hemicellulose, cellulose, and lignin contents and higher heating values of oat hull before and after microwave torrefaction treatments.
SampleHemicellulose (%, db)Cellulose (%, db)Lignin (%, db)HHV (MJ kg−1, wt)HHV (MJ kg−1, db)
Raw 37.5434.2211.4616.8018.76
225 °C27.3434.4015.4018.9119.09
255 °C0.8138.9235.1820.7020.87
285 °C0.7233.5245.6522.2722.45
Note: Higher heating value (HHV).
Table 5. Chemical composition of oat hull before and after microwave torrefaction treatments.
SampleC (%, db)H (%, db)N (%, db)S (%, db)O (%, db)
Raw 43.164.600.390.4951.36
225 °C47.054.680.430.3047.55
255 °C51.984.550.460.1242.89
285 °C55.714.150.570.2539.32
Table 6. Properties of liquid yields vs. commercial liquid smoke.
SamplepHTotal Acid (%)Tar (%)
Commercial2.354.00ND *
Liquid at 225 °C2.732.30ND *
Liquid at 255 °C2.5015.002.99
Liquid at 285 °C2.4816.504.76
* ND; Not detected.
Publisher’s Note: MDPI stays neutral with regard to jurisdictional claims in published maps and institutional affiliations.

