1. Introduction
To address global climate change, efforts to reduce carbon emissions have been undertaken by increasing the energy supply and energy efficiency through renewable energy. Some countries have launched several initiatives to reduce greenhouse gas emissions, and some energy transition scenarios have been published [
1,
2,
3,
4,
5].
France has been engaged in the energy and environmental policy transformation for the Green Growth Act since 2012 and tried to develop the tool for realizing the energy transition [
1]. To realize the successful energy transition, the socio-technical changes with stakeholders are important [
2]. However, the actors of energy transitions received limited attention, and there are many gaps between stakeholders and actors [
3]. Even in the transportation sector in the EU, the share of renewable energy is not adequate for reaching the energy transition target [
4]. From this point of view, many energy transition scenarios under the consideration of multiple stakeholder opinions have to be considered [
5].
In the case of South Korea, efforts have also been made in the building sector to reduce carbon emissions from buildings by 18.1% by 2030, through the proliferation of zero energy buildings [
6]. In recent years, efforts have been made to increase the number of zero energy buildings at the district and city levels, as well as increasing the number of single buildings [
7]. In addition, the target proportion of renewable energy power generation by 2040 has been set in the 30–35% range through the third national master plan for energy [
8], and recently, the target for carbon emissions by 2050 has been set at carbon neutral. Therefore, various efforts have been made to increase the energy supply through renewable energy.
With the increase in the proportion of renewable energy power generation as one of the distributed generators (DGs), electric energy consumers are becoming prosumers. They are motivated by financial and environmental concerns, and residential-scale photovoltaic (PV) systems, community-owned small wind farms, and combined heat and power (CHP) have been leading the response to this [
9].
However, some problems have emerged, including the flexibility and uncertainty of PV power generation, voltage fluctuations for grid-connected operations, and grid instability due to frequency fluctuations [
9]. To overcome these problems, various quantitative indicators with respect to load matching and grid interaction (LMGI) for the evaluation of grid interactions, such as the efficiency and stability of grid-connected operations, have been proposed [
10].
Low-carbon energy-sharing communities are one plan for spreading and disseminating zero energy communities. They aim to improve energy efficiency in new buildings, as well as in existing buildings and communities, through remodeling, and to achieve zero energy in these community units through energy sharing and trading between buildings or communities. This model reduces energy consumption and maximizes profits in buildings and communities based on peer-to-peer (P2P), peer-to-business (P2B), and business-to-business (B2B) energy sharing and trade of the energy produced through renewable energy facilities in the community, and the energy saved through energy-efficiency improvement. Peer-to-peer (P2P) energy sharing is an effective method to manage the distributed energy resources (DERs) in community microgrids. P2P energy sharing describes energy trading between prosumers, or between prosumers and consumers, where the excess electricity from prosumers is shared among neighbors [
11,
12,
13,
14,
15].
In addition, these communities are operated with the aim of increasing the self-sufficiency of energy through renewable energy by efficiently responding to problems, such as the intermittency of the energy produced from renewable energy sources, within the community. To overcome these problems, the interest in energy storage technologies, such as power and thermal energy or power-to-heat (P2H) conversion technology, has increased. These technologies take advantage of the fact that the energy produced from renewable energy sources can be consumed in real time and reduce the grid burden created by fluctuating renewable energy sources. This can contribute to increasing the energy supply from renewable energy at the national level, activating zero energy buildings and communities, and minimizing the grid burden due to an increase in renewable energy sources.
Various domestic and overseas studies have been conducted on these matters. Prasanna et al. [
16] conducted research on the utilization of low-temperature heat networks and ways to improve the self-sufficiency of energy produced by PV systems, to increase the effectiveness of prosumer buildings in local energy supply systems. They found that the method of using two 1000 L heat storage tanks achieved a grid stabilization effect at the same level as the method of using batteries of 1383 kWh. Facchinetti et al. [
17] derived an optimization method that can decrease grid utilization, reduce the peak load, and minimize operating costs through a local energy sharing system. In South Korea, Kim et al. [
18] analyzed the supply cover factor (SCF) and load cover factor (LCF) for load matching, based on the measurement data of a demonstration house, as a study on load matching for net zero energy housing.
It is difficult to apply ground source and various unused energy sources to the cooling and heating systems of individual houses for efficient energy usage. Therefore, for zero energy at the community level, it is necessary to apply district cooling and heating systems that can improve efficiency through various unused energy sources. Previous research [
19] carried out a comparison of the renewable thermal energy systems in terms the operating energy savings when supplying domestic hot water (DHW). In this study, energy saving, sharing, and efficiency improvement were evaluated by applying various renewable energy systems based on a ground source heat pump (GSHP) integrated with thermal energy storage (TES) for the supply of cooling, heating, and DHW to a residential community, through a detailed simulation. In addition, the reduction in the grid usage caused by the intermittent production of renewable energy was analyzed by calculating load matching, based on the application of renewable energy systems. Based on this, the effect of reducing carbon emissions and enhancing the economic benefits under integration of various renewable thermal energy systems was analyzed.
2. Hybrid Energy System Overview
This section describes the general idea of energy sharing and the structure of electricity and thermal energy-integrated energy sharing. We present a case study of the smart village in the Busan Eco-Delta smart city, which is composed of residential houses and a community center, which uses renewable energy systems such as PV, and we calculate the thermal and electric load of the village. The applicability of a photovoltaic solar thermal (PVT) system was compared. Then, to supply cooling, heating, and DHW, based on the facility for GSHP, we reviewed the applicability of PVT and solar thermal (ST) systems, and we reviewed the existing air-source heat pump. The energy savings compared to the heat pump systems were analyzed.
2.1. Hybrid Energy System for an Energy-Sharing Community
In existing residential buildings, energy trading through the peer-to-grid (P2G) was basically used. Each residential building was supplied cooling, heating, and DHW through an air-source heat pump, and electricity produced by PV was used in the residential houses, while excess electricity was supplied to the grid. At this time, a PV was used to increase self-consumption to maximize each customer’s own generation. However, due to the capacity limitation of the batteries, the surplus energy from the energy produced by PV was supplied back to the grid. When the power stored in the battery was insufficient, power was purchased from the grid.
In an energy-sharing community, surplus generated power from a PV installed in the roof of single building is shared or traded in the neighborhood [
18]. Previously, various studies related to energy sharing for the use of electricity in such buildings have been conducted [
19,
20,
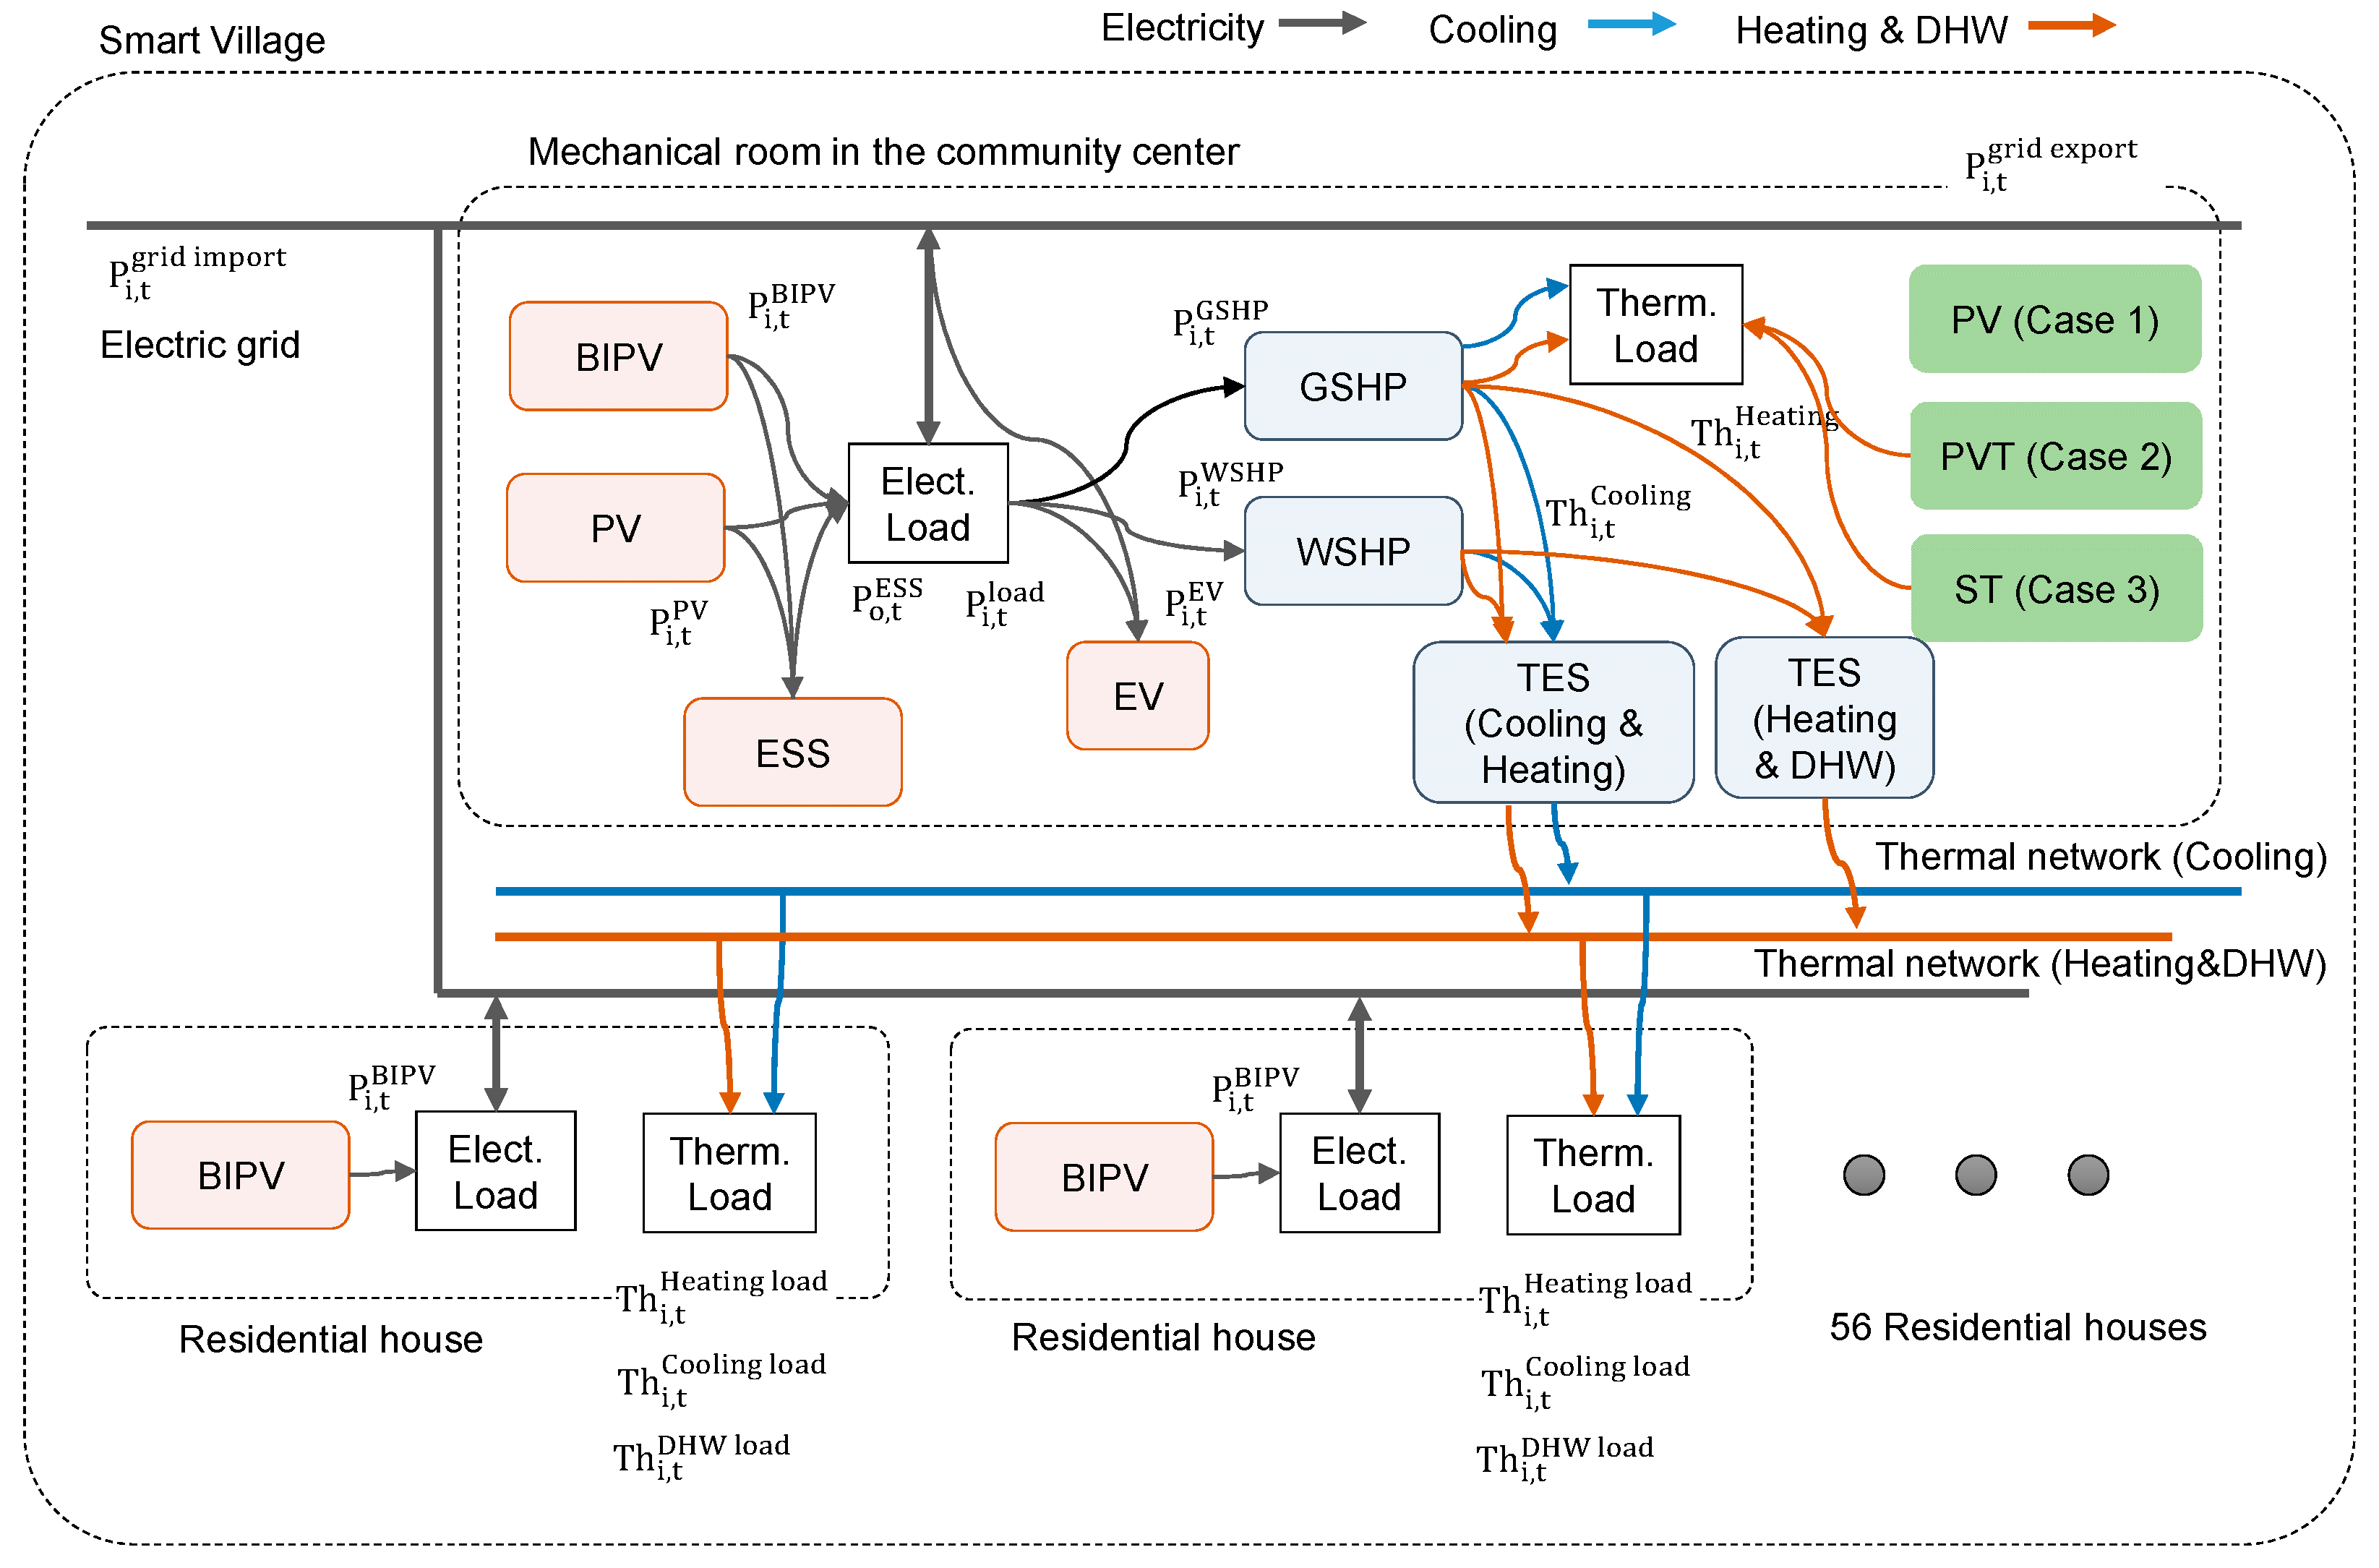
21]. However, the proposed energy-sharing community shares not only power, but also energy consumed for cooling, heating, and DHW supply, using the centralized mechanical systems of power-to-heat (P2H). The P2H stores excess power as heat using electric heaters or heat pumps, as well as batteries (
Figure 1).
The hybrid energy sharing system for the power and heat supply proposed in this study consists of a PV for generating power, the battery energy storage system (BESS) for electric energy storage, GSHP, a water treatment source (WSHP) heat pump, and TES facilities for storing heat. Power is produced through a PV installed on the roof of each house, and sharing energy is produced through a sharing PV installed in the common area. In addition, the BESS is installed in the common area, and the produced surplus power is stored in the BESS. The centralized heat for cooling, heating, and hot water supply of the building is produced through a centralized ground source heat pump. Instead of sending energy to the grid, it is used as operating power for the heat pump.
2.2. Overview of the Case Study Community: Smart Village
The target smart village was in the waterfront area of the Busan Eco Delta City, and it was composed of 56 single-family houses and a community center (
Figure 2) [
22]. The village had a site area of 7202 m
2, a building area of 2200 m
2, and a total floor area of 3620 m
2. For the construction scale, the single-family houses were two-story, whereas the community center was one-story and two-story. While the houses were lightweight steel structures combined with reinforced concrete structures, the community center was made up of reinforced concrete structures. The community center had a building area of 266 m
2 and a total floor area of 1192 m
2. The single-family houses had a building area of 1636 m
2 and a total floor area of 2374 m
2, based on 56 houses. For the single-family houses, the thermal transmittance values (U-values) of the outer walls, roofs, floors, and windows were designed to be 0.27, 0.103, 0.175, and 0.963 W/(m
2·K), respectively. For the community center, they were designed to be 0.147, 0.107, 0.212, and 0.997 W/(m
2·K), respectively.
Among these residential houses, 88 kWp of the building-integrated photovoltaic systems (BIPV) were located on the roof in 19 houses, while 10.8 kWp and 34.9 kWp of PVs were installed in the garages and corridors, respectively. For the community center, various renewable energy systems were applied to the roofs and walls. On the southern wall, building integrated photovoltaic (BIPV) systems were installed, and the area was 194 m
2. The available installation area on the roofs was 108 m
2. Building-attached photovoltaic (BAPV) systems and the application of solar thermal (ST) systems and photovoltaic and solar thermal (PVT) systems were possible (
Figure 2) [
19]. In this study, the case of installing BAPV systems on roofs was set as Case 1, the case of installing PVT systems was set as Case 2, and the case of installing ST systems was set as Case 3. Additionally, in this research, conventional air-source heat pumps without TES (Case 4) were considered to compare the energy performance of the proposed system.
2.3. Centralized Thermal Energy System
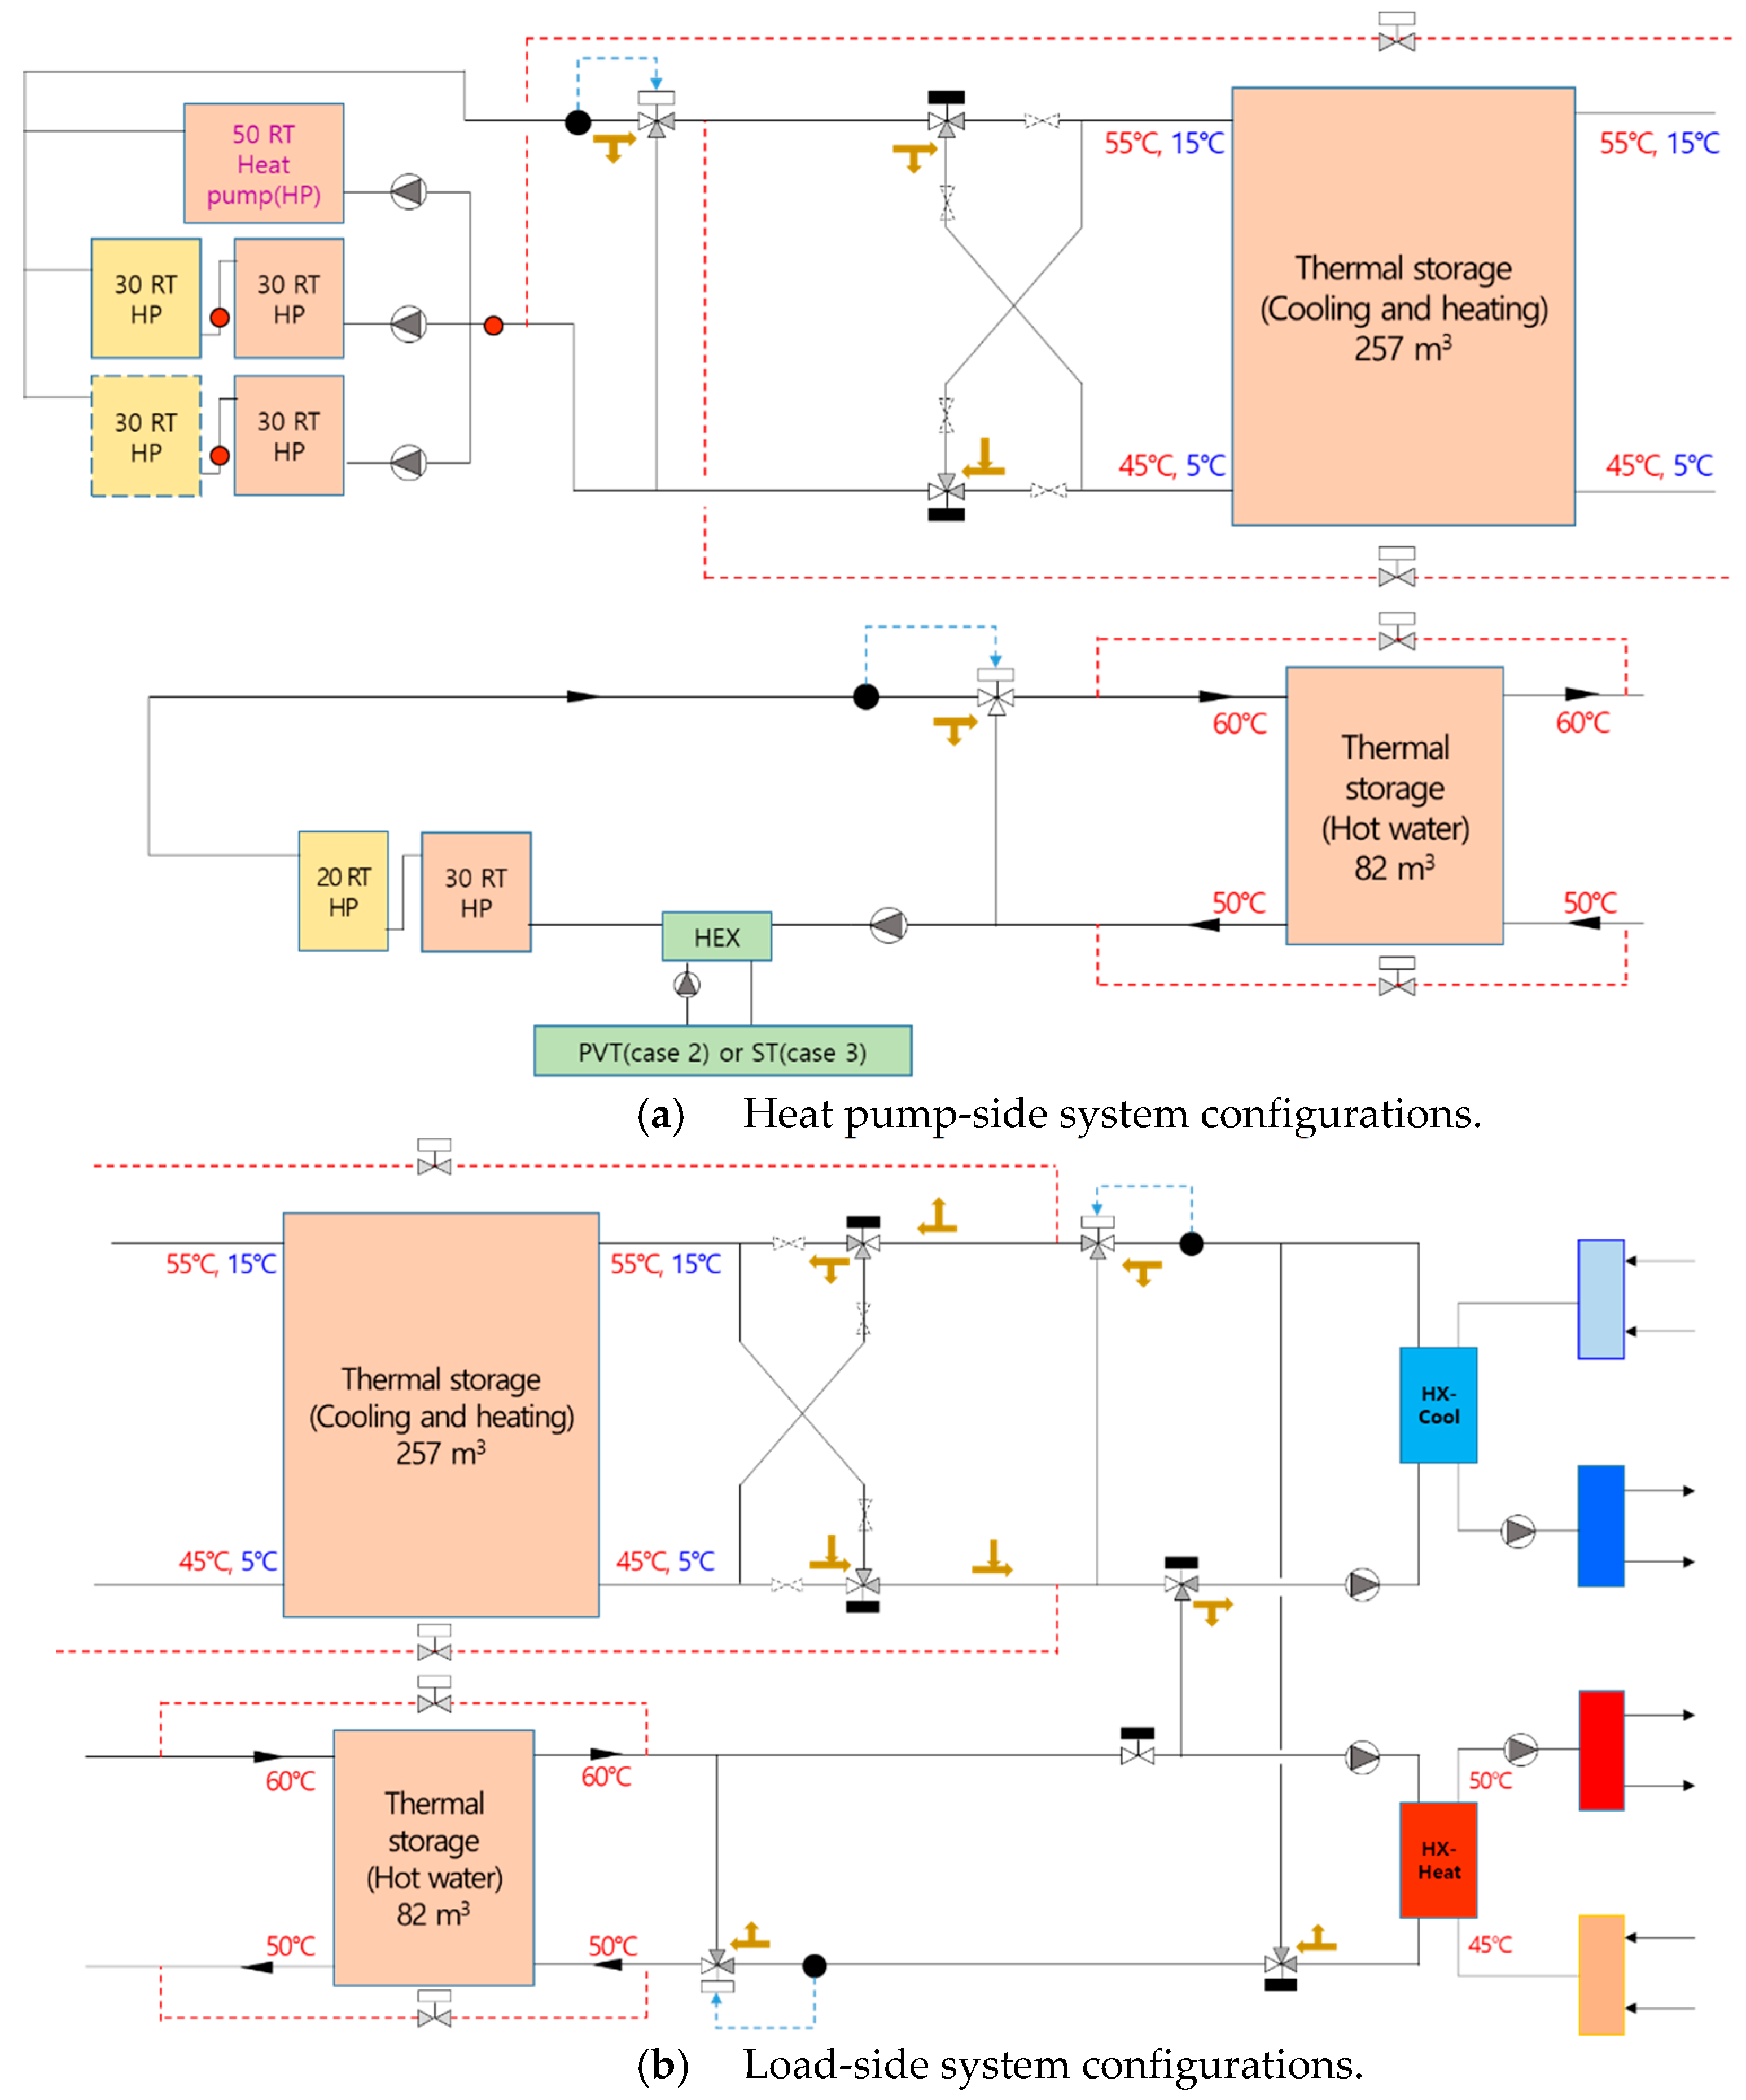
In the smart village of this case study, the mechanical room is located in the basement of the community center, and it supplies cooling, heating, and DHW to the single-family houses and community center through central supply control. When central supply systems are used, heat loss may occur in the network piping supplied to single-family houses, but energy efficiency can be improved by utilizing various renewable energy sources, such as water treatment or ground sources. In addition, it is possible to reduce the heat pump installation capacity compared to the existing GSHP installation method for individual buildings by installing TESs. In the target smart village, heat pumps and TESs for supplying the cooling and heating were separated from those for the supply of DHW (
Figure 3). The cooling and heating heat pumps, as well as the DHW heat pumps, were designed to support a capacity of 600 kW (170 RT) and 176 kW (50 RT), respectively, and the TESs were designed to be 257 m
3 and 82 m
3, respectively. These values are the TES capacities required for a heat pump operation time of 12 h, based on the days with the annual maximum cooling/heating and DHW loads. In this study, the effect of the application of various renewable energy sources on the heat pumps and TESs for DHW in terms of energy saving was analyzed.
3. Simulation Method
In this study, the cooling, heating, and DHW demand of the 56 single-family houses in the smart village was analyzed through the detailed simulation, and the cooling, heating, and DHW energy consumption were calculated based on the operation of the GSHP.
Then, the applicability of various solar energy-based renewable energy systems was analyzed through a simulation. As shown in
Figure 1 and
Figure 2, the operating energy savings and self-sufficiency were compared with three different solar energy-based renewable energy systems: the building-attached photovoltaic (BAPV) systems as Case 1, the application of solar thermal (ST) systems as Case 2, and photovoltaic and solar thermal (PVT) systems as Case 3. In addition, conventional air-source heat pumps without TES were considered as Case 4 to compare the energy performance of the proposed renewable energy systems.
For the simulation, the TRNSYS 18 software, which specialized in modeling solar energy-based systems, was utilized (
Figure 4). The meteorological data for the simulation analysis were derived for the location of the demonstration complex, through Meteonorm 7.3, and TMY2 was applied as the meteorological data format. For the target analysis area, the annual average outdoor temperature was found to be 14.6 °C, and the annual horizontal global solar radiation was 1345 kWh/m
2.
3.1. Cooling, Heating, and Domestic Hot Water Demand
TRNSYS 18 was used to analyze the cooling and heating load of the smart village. To calculate the heat load of the smart village, the setpoint temperatures for indoor air during the heating and cooling season were 20 °C and 26 °C, respectively. The infiltration level of the residential house was set to 0.3 ACH at 5 pa differences of indoor and outdoor. The lighting load was set to 9.15 W/m2. As a result, the heating and cooling loads for the 56 households were analyzed as 196 MWh/year and 120 MWh/year, respectively. This can be converted into the heating and cooling load per unit area at 31 kWh/m2year and 19 kWh/m2year. The maximum heating and cooling loads were 25 W/m2 and 25 W/m2, respectively. In the case of the community center, the heating and cooling loads were analyzed as 19 MWh/year and 35 MWh/year, respectively. This was calculated as 68 kWh/m2a and 122 kWh/m2a when converted into the basic unit of the heating and cooling load. In addition, the maximum load per unit area was analyzed as 163 W/m2 and 181 W/m2 for the heating and cooling loads, respectively.
For the analysis of the DHW load of the smart village, the DHW load of a previously analyzed house was applied. This load was analyzed based on the measurement data of a single-family house [
19,
23]. The analysis results showed that the annual DHW demand was 2839 kWh. This value was determined to be appropriate because it exhibited a 4.8% difference from 2702 kWh, which was derived based on the use of 36 L/day per person through the ISO 13790.
3.2. Thermal Energy-Sharing System Operation
The operation of the thermal energy sharing system used for supplying DHW in this study was as follows. To supply hot water to the village, the GSHP and WSHP operated and stored the hot water in the heat storage, to maintain the set temperature of 55 °C. At this time, the thermal energy generation rates in terms of the PVT (Case 2) and ST (Case 3) were predicted 24 h ahead, and the corresponding thermal load was also predicted. After that, during the time when electricity was generated by PV in terms of PV on the south wall and roof of a PV or PVT, the heat pumps were operated to take charge of heat to match the DHW load. When the power generation of the PV was insufficient, the DHW load was matched with operation of the heat pumps during the off-peak time and stored in the TES.
It was set that the heat pumps were operated at full load operation during the simulation. To make the most of the electricity produced by the PV or PVT and consumed by the heat pump operations simultaneously, the heat pump control was set to respond to the PV generation fluctuations, maximizing the self-consumption of the PV generation.
In this study, the simulation was conducted under the assumption that the PV generation rates, solar heat production, and DHW can be accurately predicted. To increase the amount of energy produced through the renewable energy sources, various subsidies, such as the REC and feed-in tariff (FIT), have been adopted to offset the economic cost of PV or wind power generation. However, as solar and wind power generation increases, and inexpensive power generation sources such as coal and nuclear power plants are stopped due to environmental problems, the electricity retail price is expected to increase, and surplus electricity feed-in prices through renewable energy are expected to be lower than the retail purchase prices. However, in China and Europe, the selling price has already been lowered to 1/3 of the purchase price. Therefore, in this study, a simulation was conducted on the assumption that the retail purchase price of electricity is 200 Won/kWh, and the surplus solar power feed-in price is 60 Won/kWh [
23,
24,
25,
26]. The total carbon emission rate (
) can be calculated by Equation (1). The total electric energy consumption (
) contains the operating energy of the heat pumps and pumps. The carbon emissions per power (
) were assumed to be 0.495 tCO
2/MWh, which was taken from the national life cycle inventory database [
27,
28].
3.3. Heat Pump System Model
There are various models for predicting the performance of the GSHP [
29]. As the inlet and outlet temperatures are the same due to the TES and the ground source used in this study, the simulation was performed under the assumption that a stable ground source at 15 °C was produced throughout the year. In this instance, the simulation was performed by assuming a reference system COP of 3.5, considering that the operation of the heat pump and the operating power of the circulation pump were based on the operation results of the GSHP during the heating period [
30]. Four heat pumps were divided based on their design capacity. The reference COP of the ASHP was set at 3.0 [
31].
Each of them was analyzed when operating number control was performed in response to the increase or decrease in load, and the amount of PV power generated. To this end, the amount of PV power generated was predicted, and the production of DHW heat in the TES and the heat storage process were analyzed according to the power generated.
3.4. Renewable Thermal Energy Systems
In this study, a flat-plate collector was selected as the solar collector. The ST and PVT systems were analyzed using the solar collector test data provided by a domestic manufacturer [
32], as shown in Equations (2) and (3). The total area of the collector was 2.0 m
2. In the case of TYPE 560, a module that can simulate a building-integrated PVT system in the TRNSYS 18 software, it is difficult to predict the thermal energy performance by applying a detailed model for the solar collector. As such, the collected solar heat was analyzed using a solar collector module (TYPE 301) based on the same solar radiation, and the result of operating the DHW heat in connection with the TES was simulated. Then, the amount of PV power generated was simulated by applying the inlet temperature and flow rate of the solar collector to the PVT module. The BIPV system was analyzed using TYPE 566. The number of panels of the PV system in the south wall and roof were 97 and 54, respectively. The module sizes of the PV system, PVT system, and ST system were 1994 × 1000 × 35 [mm], 2024 × 1024 × 40 [mm], and 2024 × 1024 × 40 [mm], respectively. The reference module efficiency was 19.1% and 15.9% of the PV and PVT system, respectively. The PV system capacities of the wall and roof of the community center were 36.9 kWp and 20.5 kWp, respectively. The PV system capacity of the roof in the residential houses was 397.6 kWp (7.1 kWp per single residential house).
Based on the validated TRNSYS model compared with the experimental data [
32], the simulation models were modified. The detailed simulation model for integrating solar thermal and TES with the ground source heat pump was validated with experimental data, and the model showed 1.7% and 0.7% differences in the solar thermal system and TES, respectively [
30].
3.5. Self-Sufficiency Analysis
The self-sufficiency rates from the renewable energy generation for community energy consumption can be estimated by the index of load cover factor (LCF) and supply cover factor (SCF). As shown in
Figure 1, the LCF and SCF were used to analyze the self-sufficiency of the PV, PVT, and ST systems in the community unit. LCF represents the proportion of PV power generated in the power consumption (Equation (4)), and SCF represents the proportion of PV power generated supplied to the load (Equation (5)).
6. Conclusions
In this study, a thermal energy-sharing system for serving the cooling, heating, and DHW needs with various renewable thermal energy systems was proposed to save energy and improve efficiency for the implementation of a low-carbon energy-sharing community, and the energy-saving effect for the proposed system was analyzed. When the proposed system was installed on the roof of the community center, the energy efficiency and self-sufficiency for the application in the same area were analyzed. We found that the solar thermal (ST) system could cover 27% of the total annual cooling, heating, and DHW energy demand, and the PVT system could cover 9%. The proposed system can also be operated as an energy storage system, and the grid interaction rates and self-sufficiency can be improved by increasing the capacity and size of the TES by controlling the number of heat pumps. The PVT system exhibited a 19.1% lower power generation rate than the PV system. This is because the efficiency of the PVT system power generation module was low, and relatively low temperatures persisted in winter. However, the ST system could reduce the operating energy by 3.6% and 6.6% compared to the PV and PVT systems, due to the reduction in the DHW and heating energy demand. On the other hand, for electricity self-sufficiency in the community unit, the ST system was excellent at decreasing the size of the TES, and the PV system exhibited the highest self-sufficiency as the size increased. This was because the PV system consumed the largest amount of operating energy for the heat pumps compared with the other systems. The proposed system was also expected to reduce carbon emissions by more than 50% compared to the conventional ASHP with PV system.
The analysis results for the energy-sharing community show that policy, decision makers, and stakeholders can pursue the ambitious policy objectives considering the PV, ST, and PVT systems. The policy objectives that involve those systems can reform the community energy transition, achieving both operating energy and cost saving. The consideration of those systems and energy planning with a renewable energy system could accelerate the achievement of global energy transition strategies.


