Article

Design of a Low-Cost Multiplexer for the Study of the Impact of Soiling on PV Panel Performance

1
Departamento de Ingeniería Eléctrica y Térmica, de Diseño y Proyectos, Universidad de Huelva, 21007 Huelva, Spain
2
Department of Chemistry and Physics, University of Almería, 04120 Almería, Spain
3
Photovoltaic Solar Energy Unit, Renewable Energy Division, CIEMAT, Av. Complutense 40, 28040 Madrid, Spain
4
Centro de Desarrollo Energético Antofagasta, Universidad de Antofagasta, Av. Angamos 601, Antofagasta 1270300, Chile
*
Author to whom correspondence should be addressed.
Energies 2021, 14(14), 4186; https://doi.org/10.3390/en14144186
Submission received: 17 May 2021 / Revised: 2 July 2021 / Accepted: 7 July 2021 / Published: 11 July 2021

Abstract

:
Atmospheric factors, such as clouds, wind, dust, or aerosols, play an important role in the power generation of photovoltaic (PV) plants. Among these factors, soiling has been revealed as one of the most relevant causes diminishing the PV yield, mainly in arid zones or deserts. The effect of soiling on the PV performance can be analyzed by means of I–V curves measured simultaneously on two PV panels: one soiled and the other clean. To this end, two I–V tracers, or one I–V tracer along with a multiplexer, are needed. Unfortunately, these options are usually expensive, and only one I–V tracer is typically available at the site of interest. In this work, the design of a low-cost multiplexer is described. The multiplexer is controlled by a low-cost single-board microcontroller manufactured by ArduinoTM, and is capable of managing several pairs of PV panels almost simultaneously. The multiplexer can be installed outdoors, in contrast to many commercial I–V tracers or multiplexers. This advantage allows the soiling effect to be monitored on two PV panels, by means of I–V indoor tracers. I–V curves measured by the low-cost multiplexer are also presented, and preliminary results are analyzed.

1. Introduction

Solar photovoltaic (PV) power is the fastest growing energy source in the world. At present, almost every country is producing solar energy. A high percentage of the total cumulative installed PV capacity in 2020 corresponds to Asia (around 57%), with China leading the market. Europe represents 22%, while the Americas represent 15%, thanks to the USA and some Latin American countries (e.g., Brazil). The remaining 6% come from the Middle East, Africa, and the rest of the world. The PV contributions in 2020 amounted to close to 3.7% of the electricity demand worldwide, a significant increase with respect to the 2.2% in 2017 [1]. In the last few decades, PV technology has experienced fast market development due to the associated price reduction and improvement of efficiency. However, despite this favorable trend, the PV sector must be further improved to meet the developing worldwide power request. To this end, PV modules need to be properly characterized under real working conditions, in order to evaluate the discrepancies regarding the information provided by manufacturers and, thus, to allow for the optimization of PV plants.
Current–voltage (I–V) curve analysis is one of the most effective methodologies to analyze the performance of a PV module or array [2]. The I–V curve represents all of the possible operating points (current and voltage) of a PV module (or string of modules) under the existing conditions of solar irradiance and temperature. In this regard, I–V curves also allow for atmospheric or geometric factors diminishing the PV yield (i.e., clouds, temperature, wind, shading, and so on) to be properly evaluated [3,4,5,6,7,8]. Among these factors, soiling has a significant impact on the production and performance of the PV plants [9,10,11]. Soiling can be defined as the accumulation of dirt on the surface of PV modules. This phenomenon is mainly related to the tilt angle of the module and to atmospheric conditions, such as aerosol loading in the atmosphere, relative humidity and moisture content, wind speed, and precipitation. Soil particles and anthropogenic compounds (e.g., ash from fossil fuel or biomass combustion) are also important sources of soiling at certain locations [12,13].
To date, most studies considering the impact of soiling on solar systems have focused on the economic trade-off of production losses versus the cost of cleaning [14]. López-García et al. [15] have reported an average yearly soiling rate of 0.31% in the maximum power output Pmax after almost 30 years of outdoor exposure. However, soiling can also lead to system degradation and failure, which can eventually lead to total system failure. Several factors resulting from soiling may contribute to additional essentially irreversible damage to the PV panel surface or even significant shortening of the lifetime of components in the PV system. Some of these factors are hot-spots, abrasive effects on the PV cover by harder sand particles, and even improper cleaning methods [16,17]. Unfortunately, studies dealing with this subject are still non-existent or scarce.
As PV panels cool down at night and attract morning dew, dust can go through a process called cementation, wherein the soiling is literally cemented onto the panel. Olivares et al. [18] analyzed the formation process of cementation, finding dense films after several weeks, depending on the aerosol concentration, humidity, and temperature, which diminished the solar energy transmitted through the cover up to values of about 40%. Although this study was carried out in the Atacama Desert (Chile), many other emplacements for the installation of PV plants which are suitable from the point of view of insolation levels can present similar atmospheric conditions. This is the case at coastal sites, such as those in Mediterranean regions or North African countries, for instance, where the humidity and hygroscopic aerosols can stimulate the formation of thick soiling layers, causing the PV cover to become almost opaque [19,20,21,22].
Although studies analyzing the impact of dust deposition on PV module performance began several decades ago [23,24], the use of I–V curves for that purpose has not been observed until recently. Rao et al. [25] examined the phenomenon of dust affecting the I–V characteristics of modules under both indoor and outdoor conditions in India. In that work, several I–V curve testers manufactured by MECO were used to record, at the same time, the electrical outputs of dusty and cleaned PV panels. The results showed a significant decrease of the short-circuit current Isc with increasing dust density, while the open circuit voltage Voc was not affected. Tanesab et al. [26] used only one I–V curve tester, manufactured by PROVA, in order to investigate the performance degradation and the effect of soiling of seven PV modules over eight years in Perth, Australia. The I–V curves were initially recorded for the dusty modules, then for the clean ones. The results confirmed those of previous studies, in which the Isc and Pmax outputs of the PV modules significantly decreased due to dust deposition exposure, while the change in the Voc and fill factor F F values of the modules were negligible. Alquthami and Menoufi [27] placed two panels in two different Egyptian cities over three weeks without cleaning. The electrical parameters of both modules were obtained indoors and under controlled temperature and illumination conditions using an I–V source meter. That procedure allowed a Photovoltaic Dust Coefficient to be defined, by removing the effects of other (i.e., non-soiling) factors from the I–V curves.
In addition to the above-mentioned methodologies, analysis of the soiling effect on the PV modules is being usually conducted by means of two PV modules and recording the corresponding I–V curves for each one sequentially [28,29,30]. In certain cases, these measures are typically carried out only for some instants of some days, due to the difficulty of the process. Two alternatives could be selected to record I–V curves simultaneously several times in a day: (a) Connecting each PV module to independent testers; or (b) connecting every PV module to one I–V tracer by means of a multiplexer. The first option presents a main problem relating to the cost of commercial I–V tracers. The device may be even more expensive if additional requirements are needed, such as working outdoors, using a wi-fi connection, or allowing specific electrical voltages and intensities. Some devices have been developed in an attempt to satisfy these demands at low cost [31]. The second option is probably the easiest to implement, due to the simplicity of the experimental configuration. Unfortunately, the cost of commercial kits or ensemble equipment could be higher than 10,000 €. One alternative is to find separate, cheaper devices and then to try to couple them with each other. In this regard, a large number of different solutions are available on the market, in order to trace the I–V curve of a module, including capacitive loads, electronic loads, bipolar power amplifiers, four-quadrant power supplies, and direct current/direct current (DC/DC) converters, some of which correspond to low-cost research prototypes [32,33,34].
Unfortunately, although few devices are able to trace several PV modules at the same time, that option is not commonly added to the testers. Commercial multiplexers may be expensive, and may cost even more if additional commercial software needs to be bought. In the literature, only one work was found in which a low-cost multiplexer was coupled to a commercial tester to acquire the I–V curves of two PV cells at a time [35]. The relay module used therein was limited to low electrical currents. Indeed, new alternatives are needed to allow higher currents and power to be monitored. The development of cheaper solutions is, thus, becoming an urgent demand. In this work, a new low-cost multiplexer prototype, developed at the Universidad de Huelva (UHU), Spain, is presented. The need for the protoype initially arose in the framework of the Spanish Research Project named ‘PVCastSoil’, where one of the team participants, from the Universidad de Almería (Spain), needed to monitor the electrical parameters of several PV modules (one clean and the other naturally soiled) simultaneously and automatically, with one-minute frequency and using only one tester. The device presented herein can work in outdoor conditions and far from the tester. Examples of it performing are presented in the results section.

2. Materials

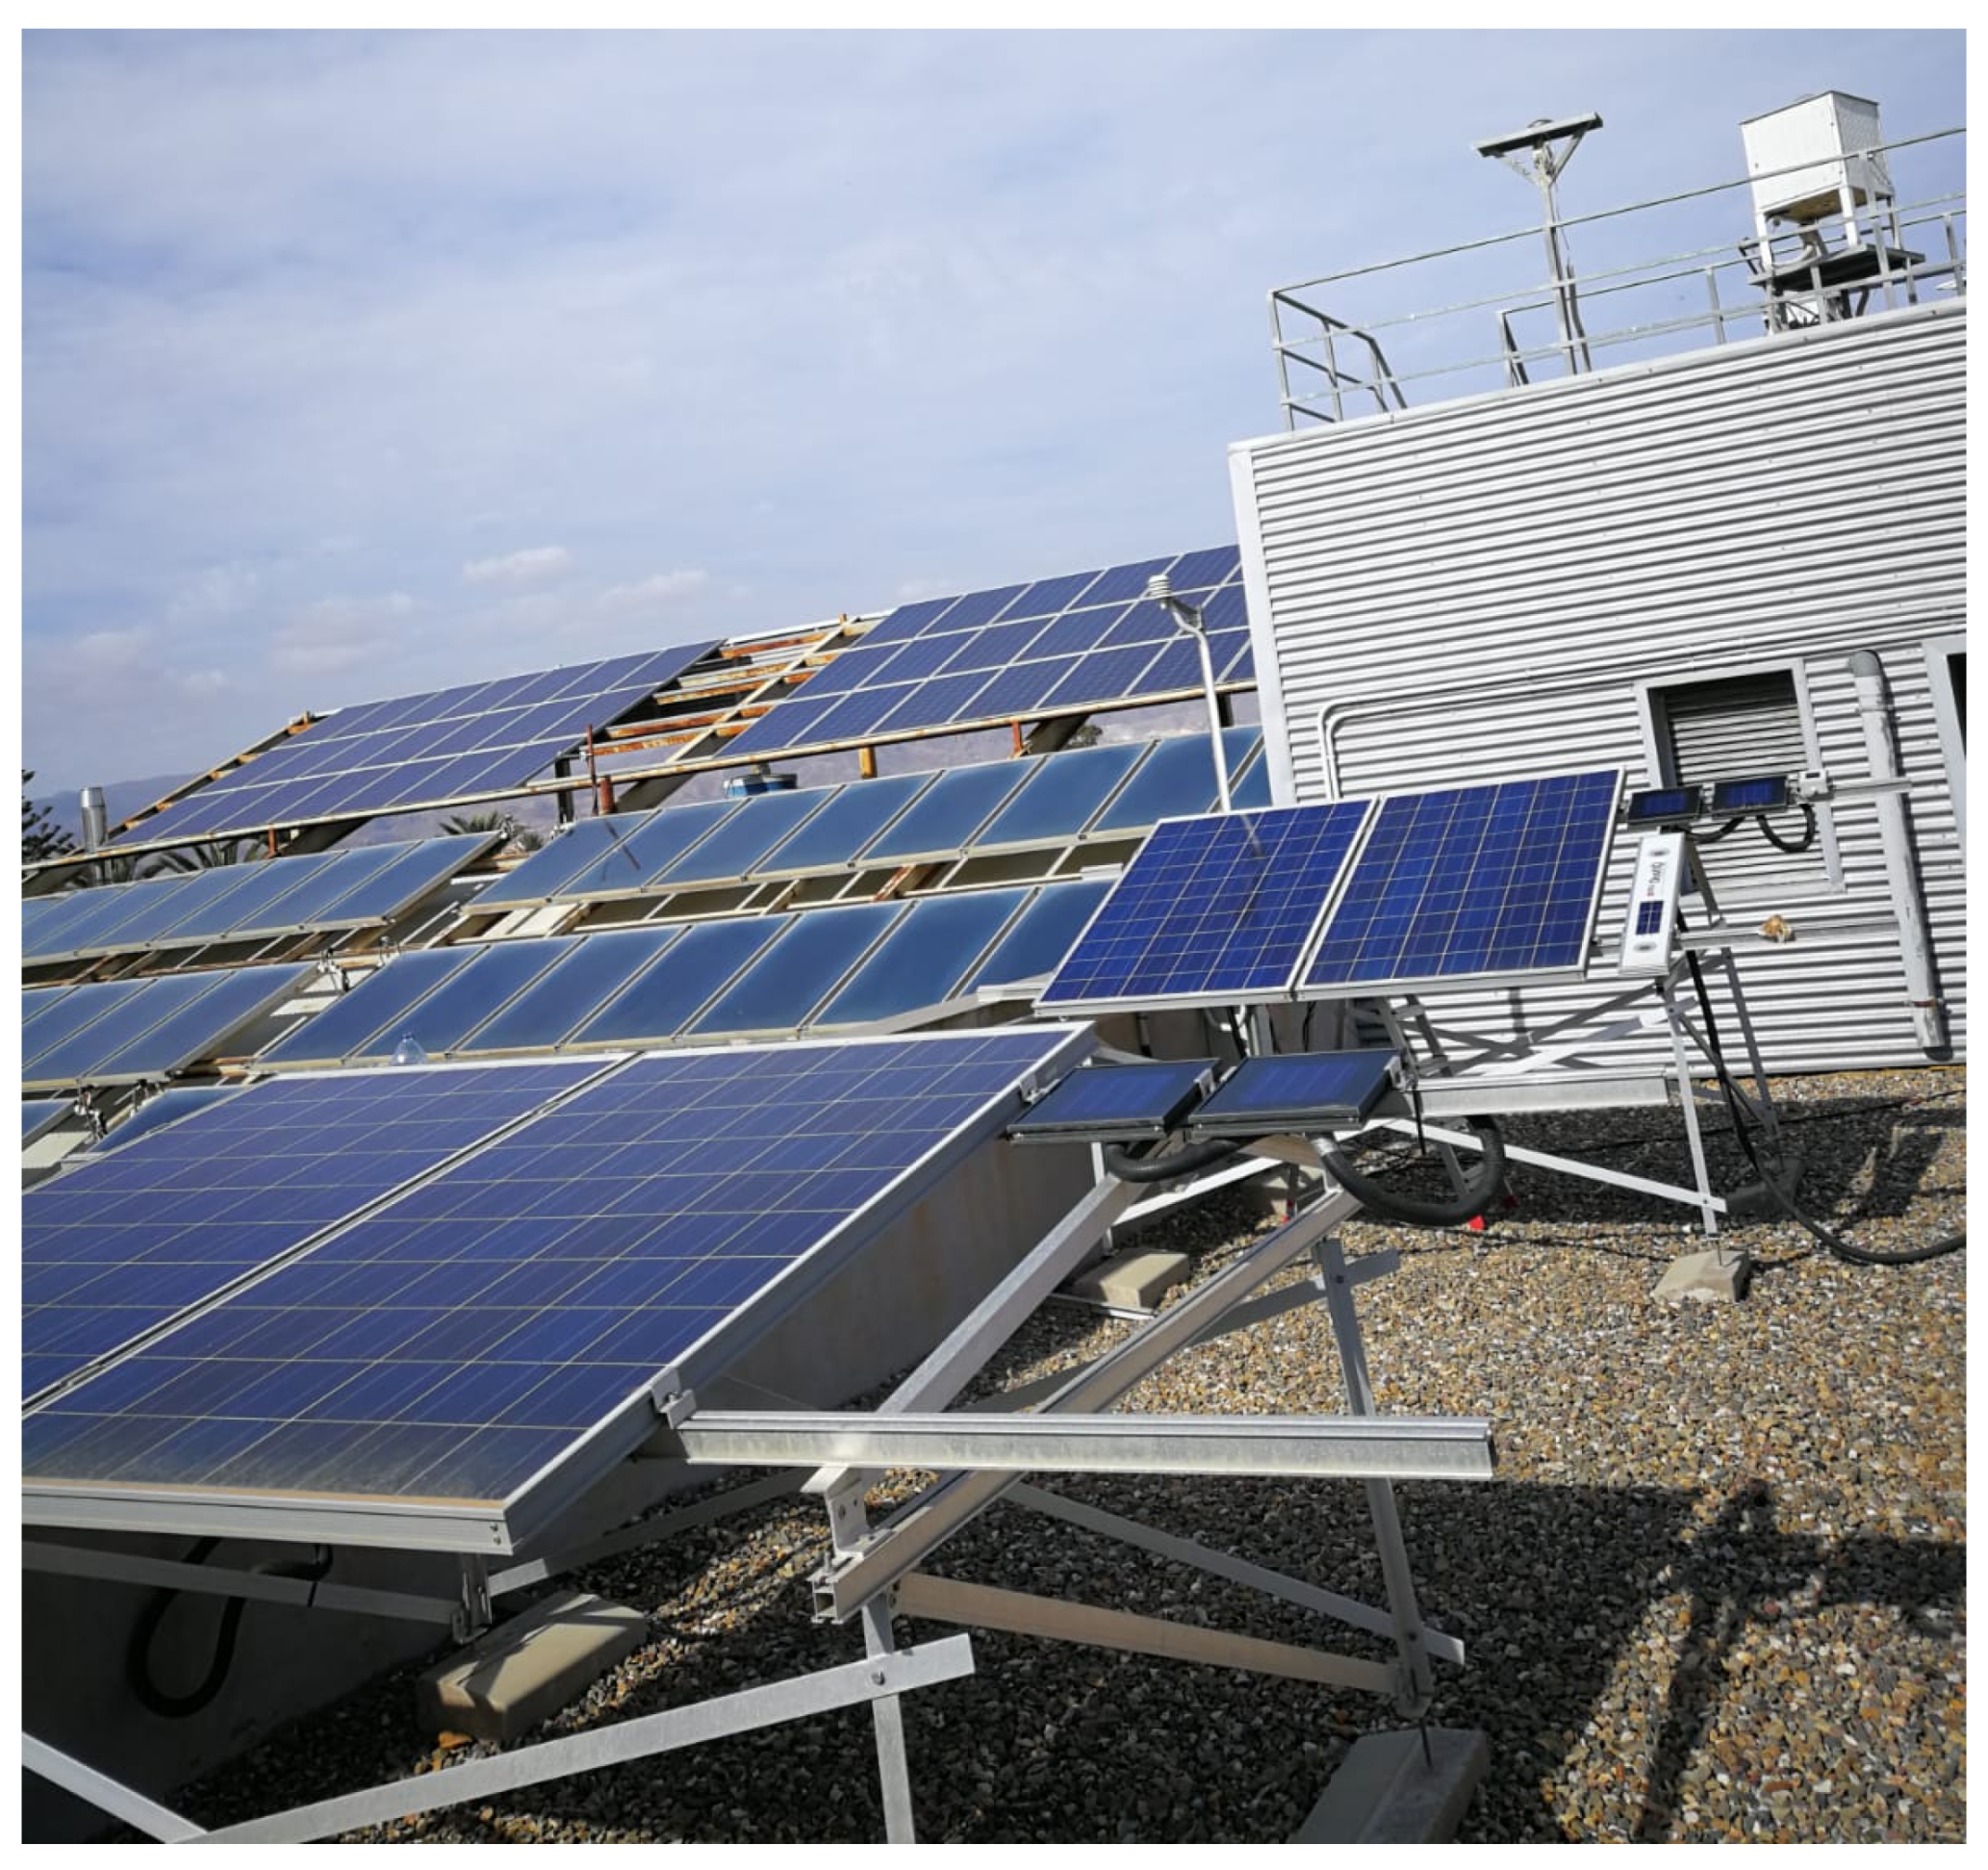
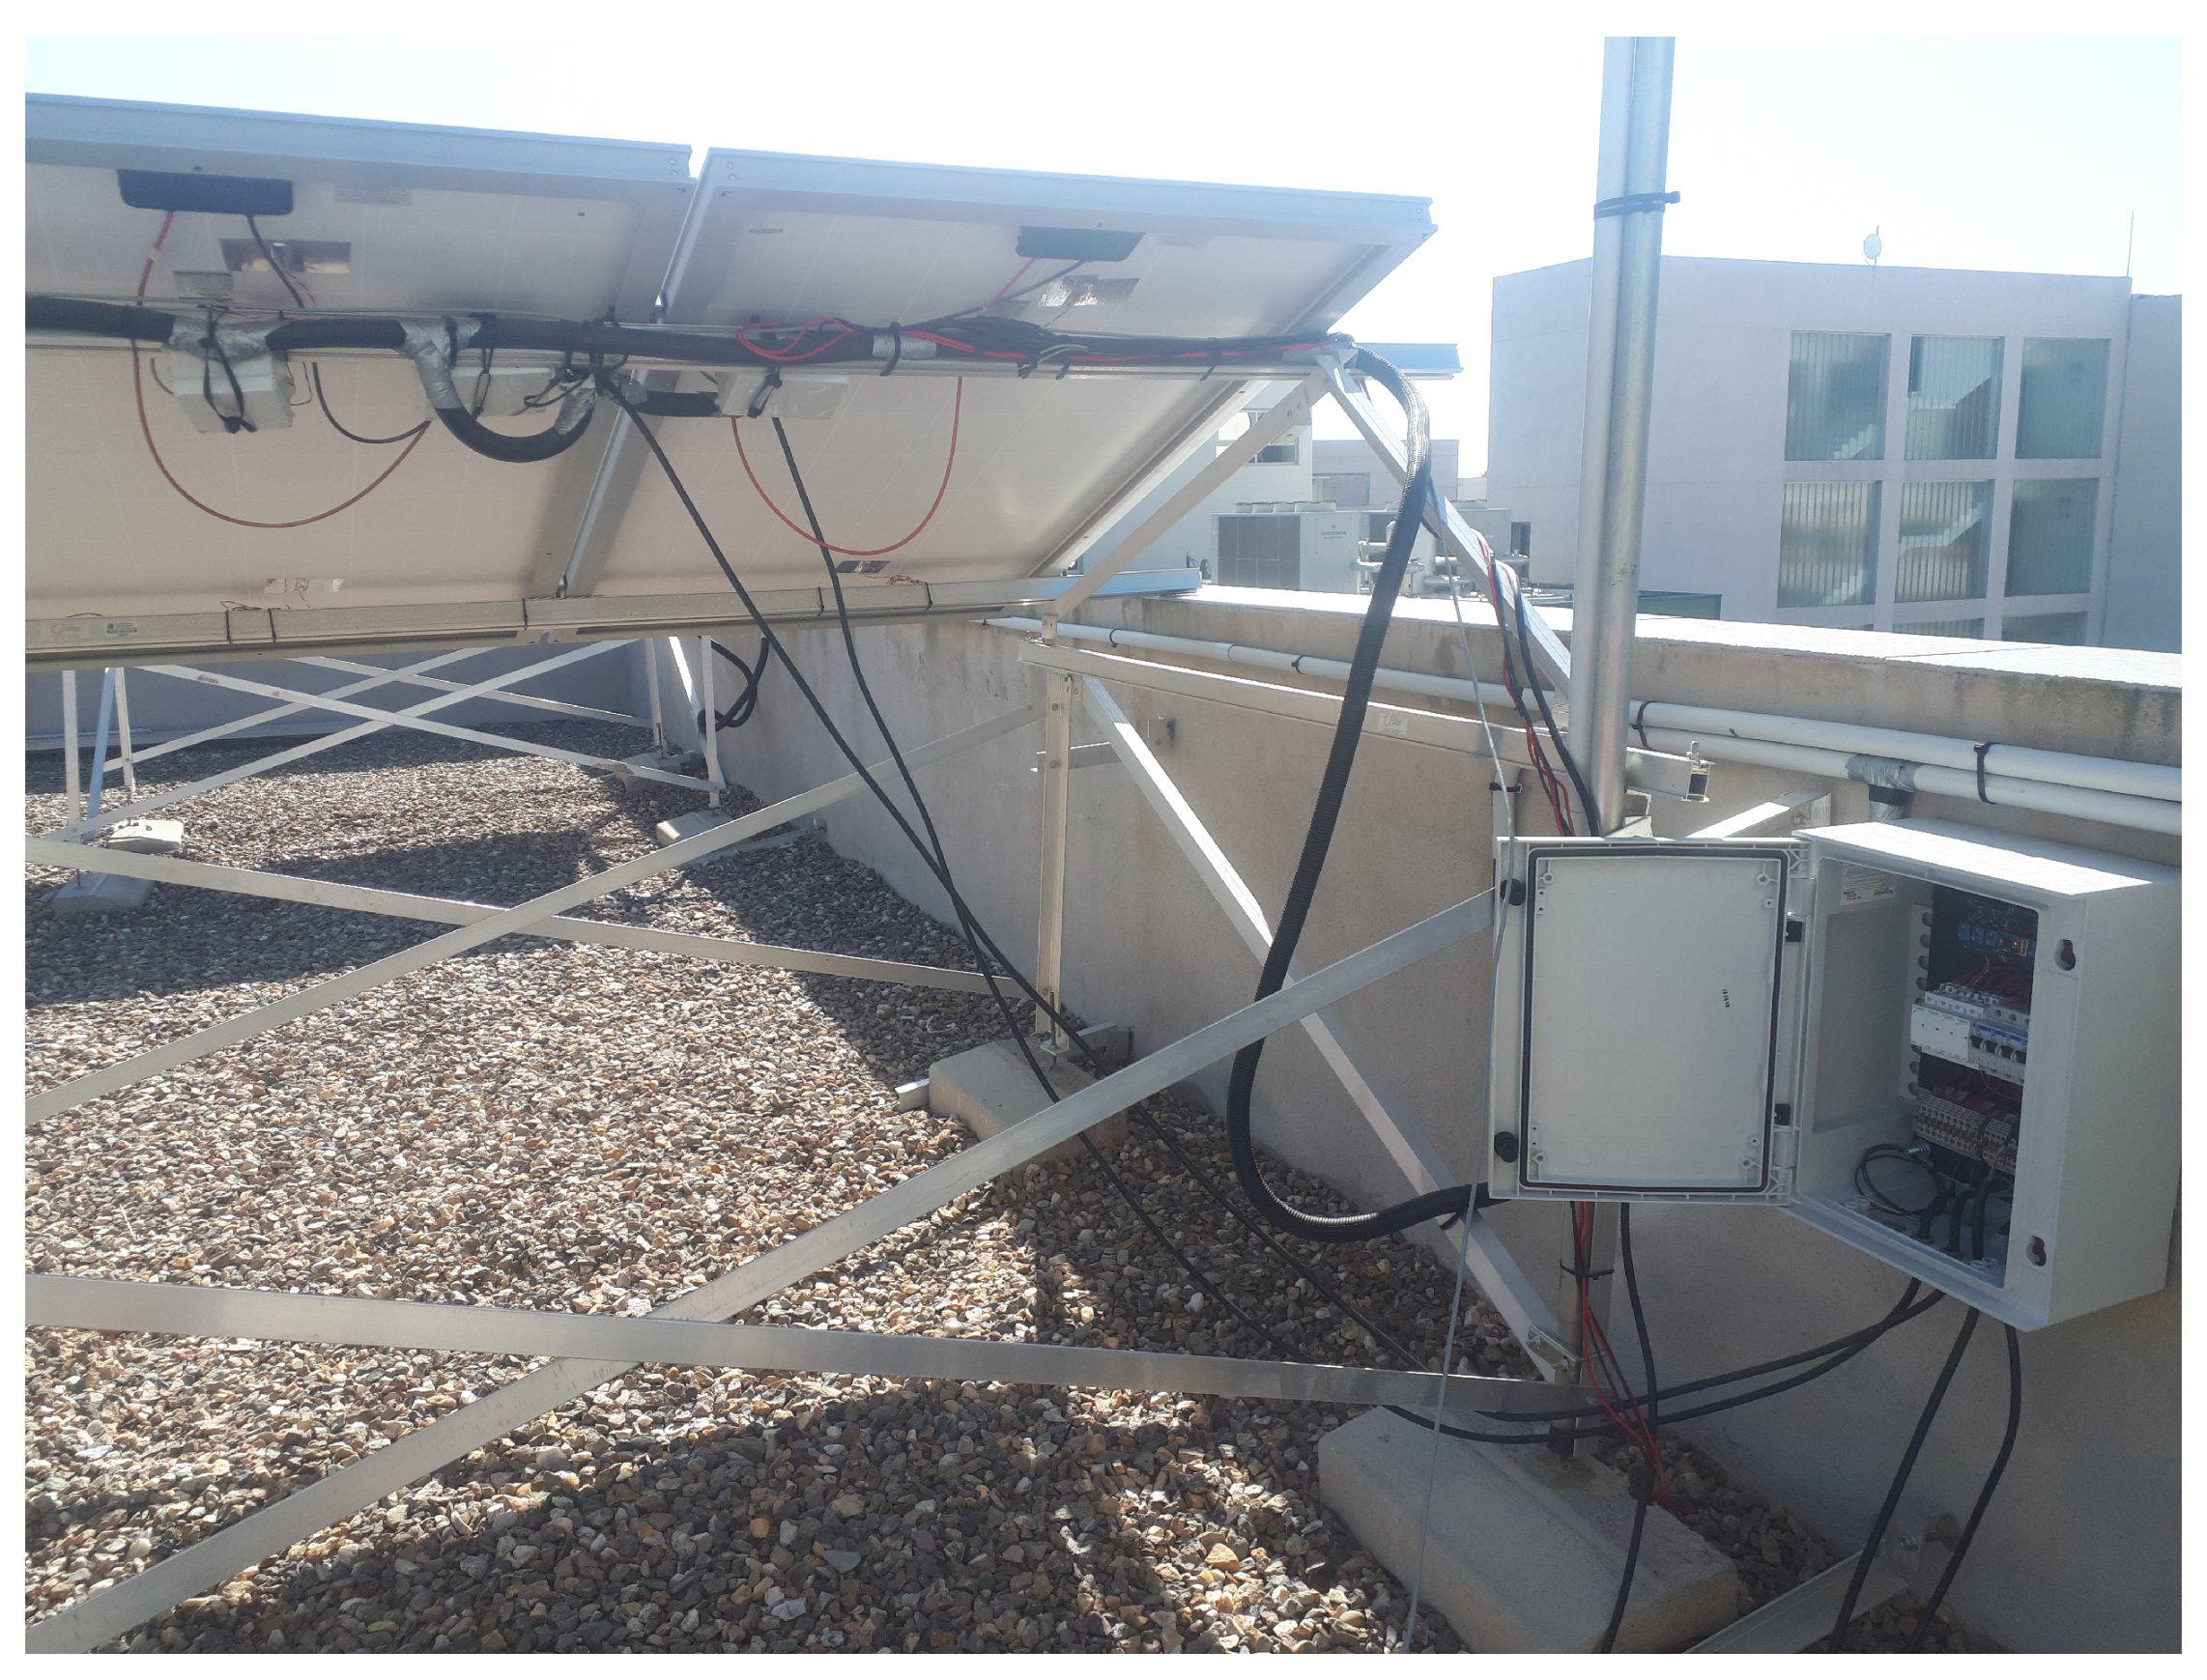
2.1. Experimental Facility

The Spanish research project PVCastSoil (2018–2021) aims to study the effect of soiling in the power production of PV plants, and involves three Spanish research institutions: The Universidad de Almería, the Centro de Investigaciones Energéticas, Medioambientales y Tecnológicas (CIEMAT), and the Universidad de Huelva. To this end, the facility at the Universidad de Almería consists of four south-oriented PV modules manufactured by Atersa (model A-222P) with power of 222 W, a short-circuit current of 8.17 A, tilt of 22 , four calibrated PV cells manufactured by the Spanish company Atersa, several four-wire Pt100 resistive temperature probes, two pyranometers (Kipp&Zonen model CM11) for the measurement of global and diffuse solar irradiances, and one pyrheliometer (Kipp&Zonen) for direct solar irradiance (Figure 1).
Electrical parameter monitoring was carried out by means of a commercial I–V curve tracer (PVPM-6020C, manufactured by PV-Engineering GmbH, Iserlohn, Germany; Figure 2). It is a portable device but, due to the limited operating temperature range and the protection IP40, it is inadequate for permanent outdoor operations. The PVPM-6020C is able to register electrical currents up to 40 A and voltages up to 600 V coming from only one electrical line. The PV module back surface temperature signal and solar irradiance are additional inputs to the tracer. With the purpose of allowing several PV modules to be monitored by one single tracer, a multiplexer was developed by the research team of the Universidad de Huelva.

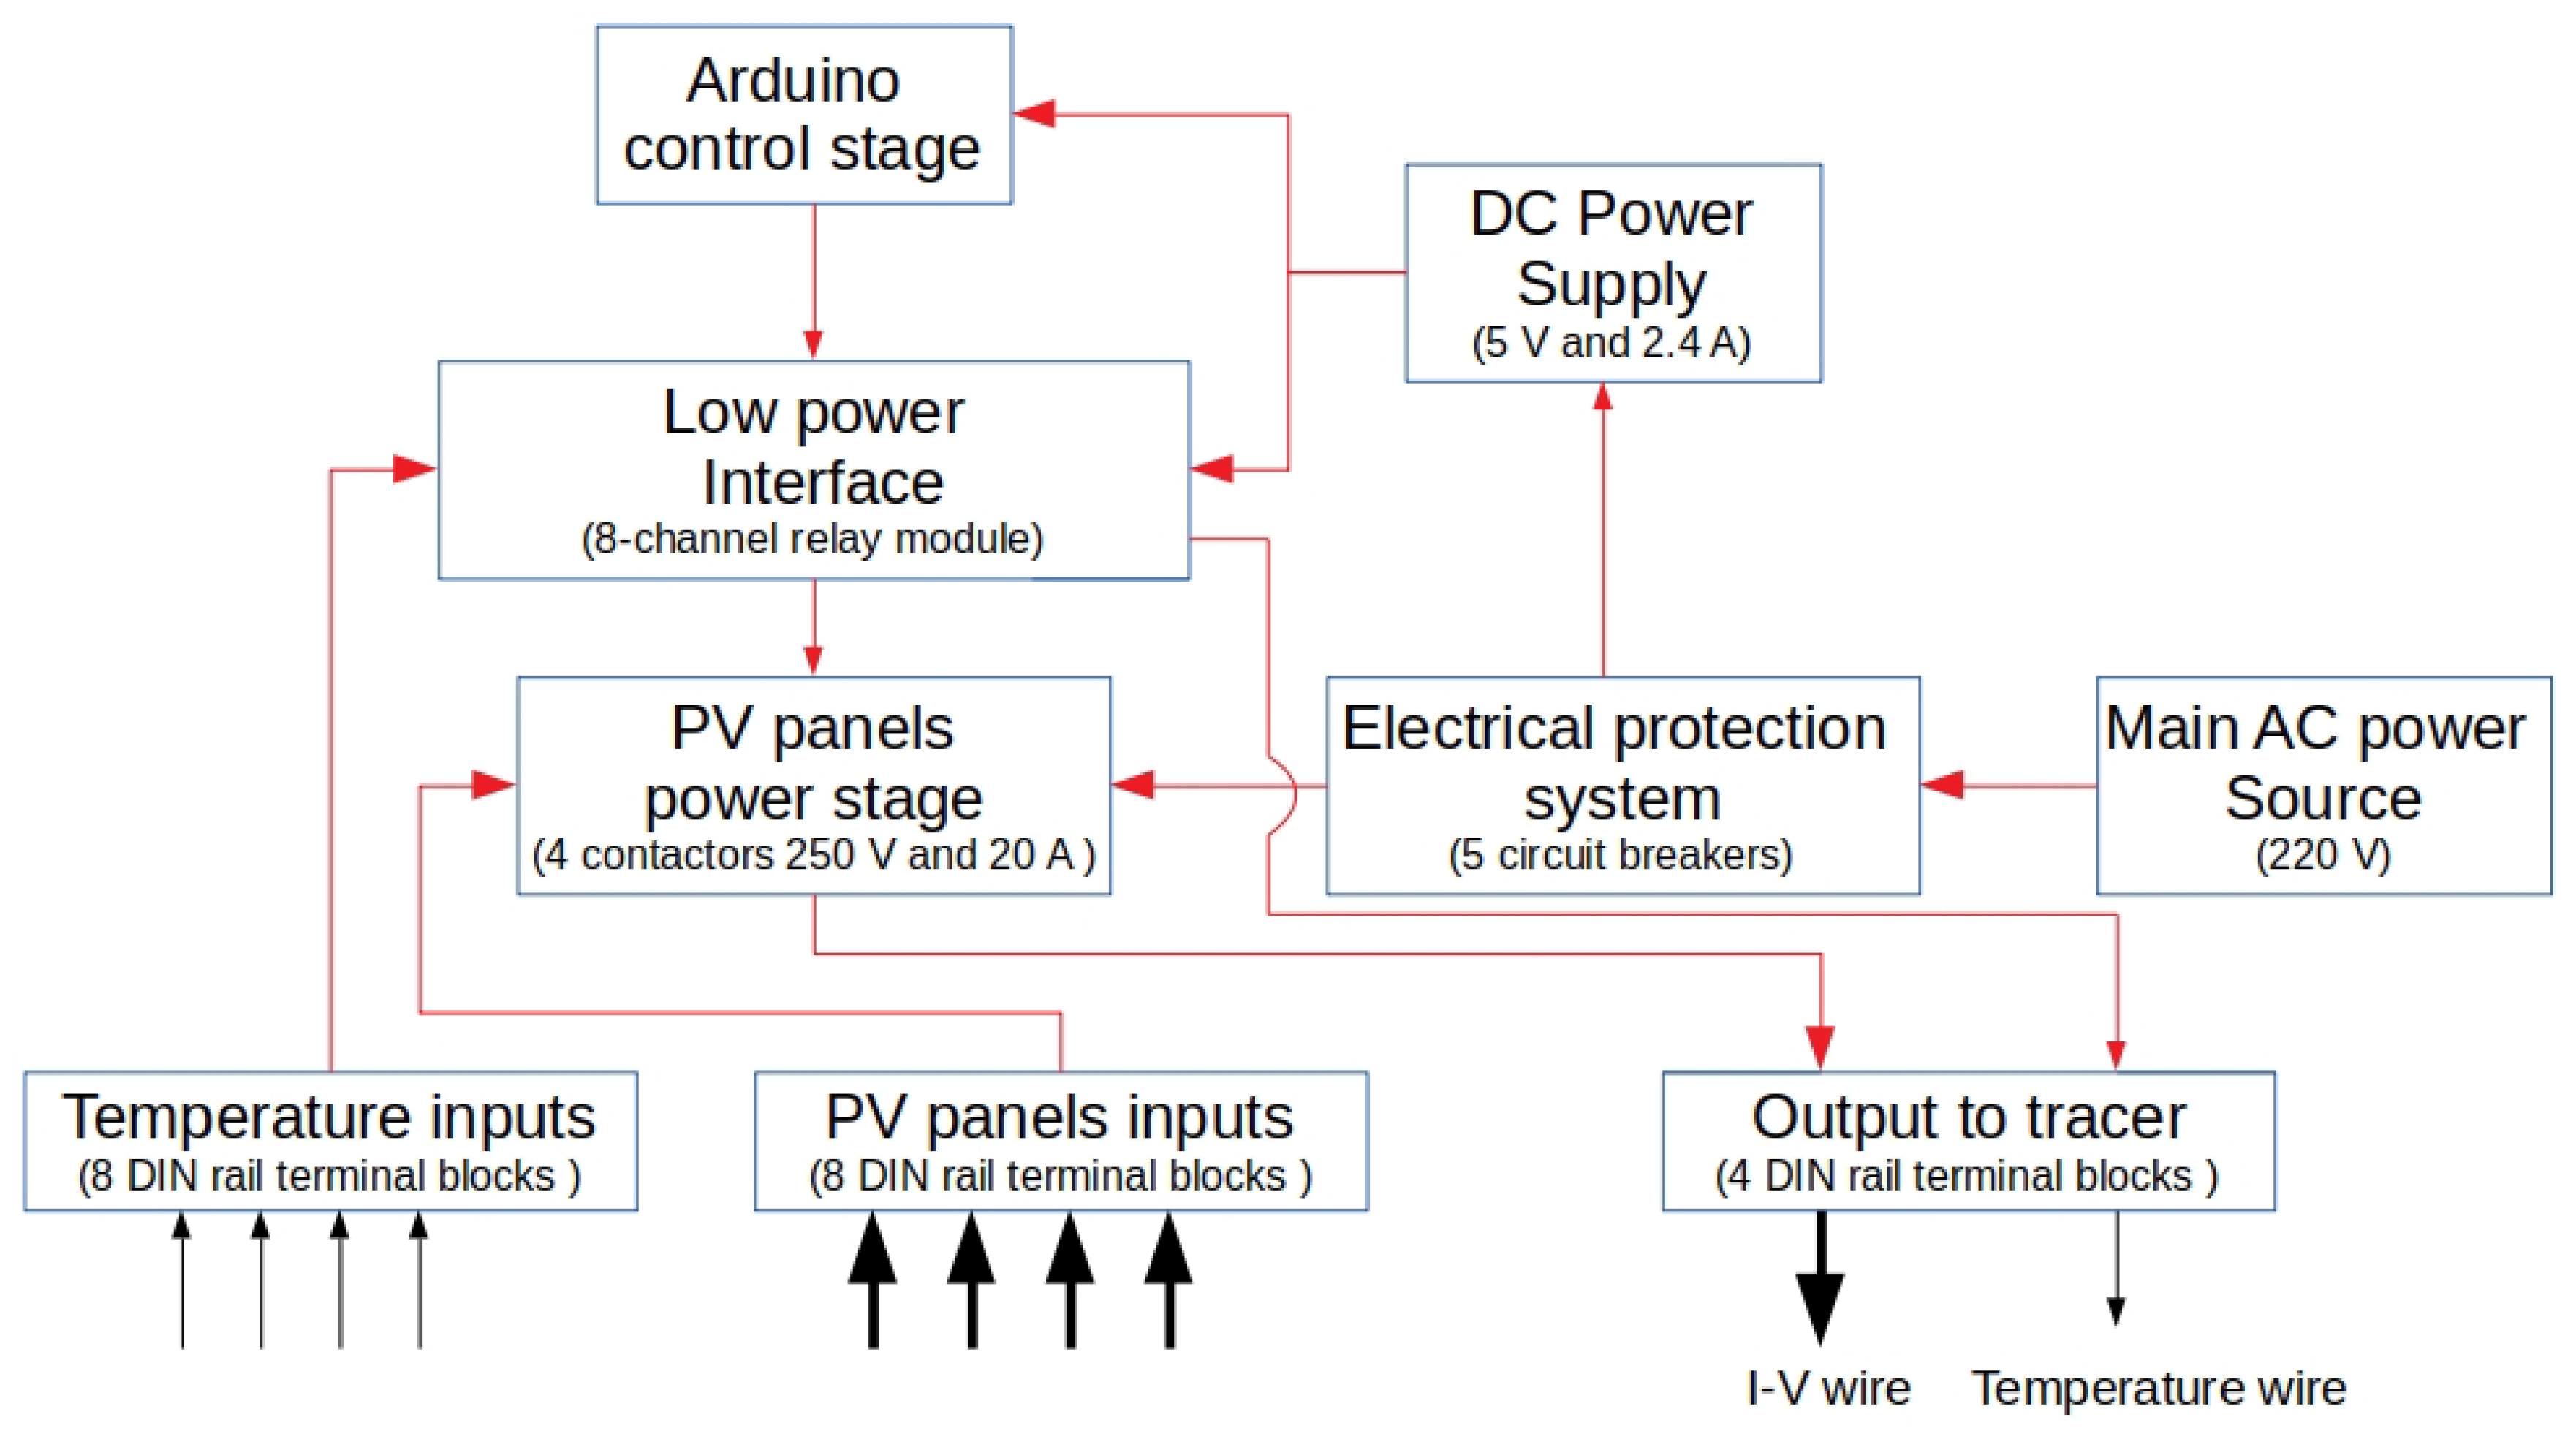
2.2. Design of the UHU-MUX Multiplexer

The device designed herein, named UHU-MUX, is a multiplexer that allows several PV modules to be analyzed independently. The system performs similarly to an automatic switch, which connects each PV module to the tracer over 10 s. Once every PV module has been monitored, the next measurement sequence will begin after 10 min, repeating the cycle as many times as the user determines. In addition, the multiplexer is expected to meet the following research requirements:
  • To obtain both electrical and temperature signals coming from the four PV modules;
  • to handle the load currents available in the tracer unit;
  • to be fast enough as the tracer demand;
  • to work under outdoor conditions.
This first prototype was intended to manage up to four PV modules and supported currents up to 20 A. Figure 3 shows the block diagram of this design, detailing the different components used. The several stages of the measurement process are explained below.

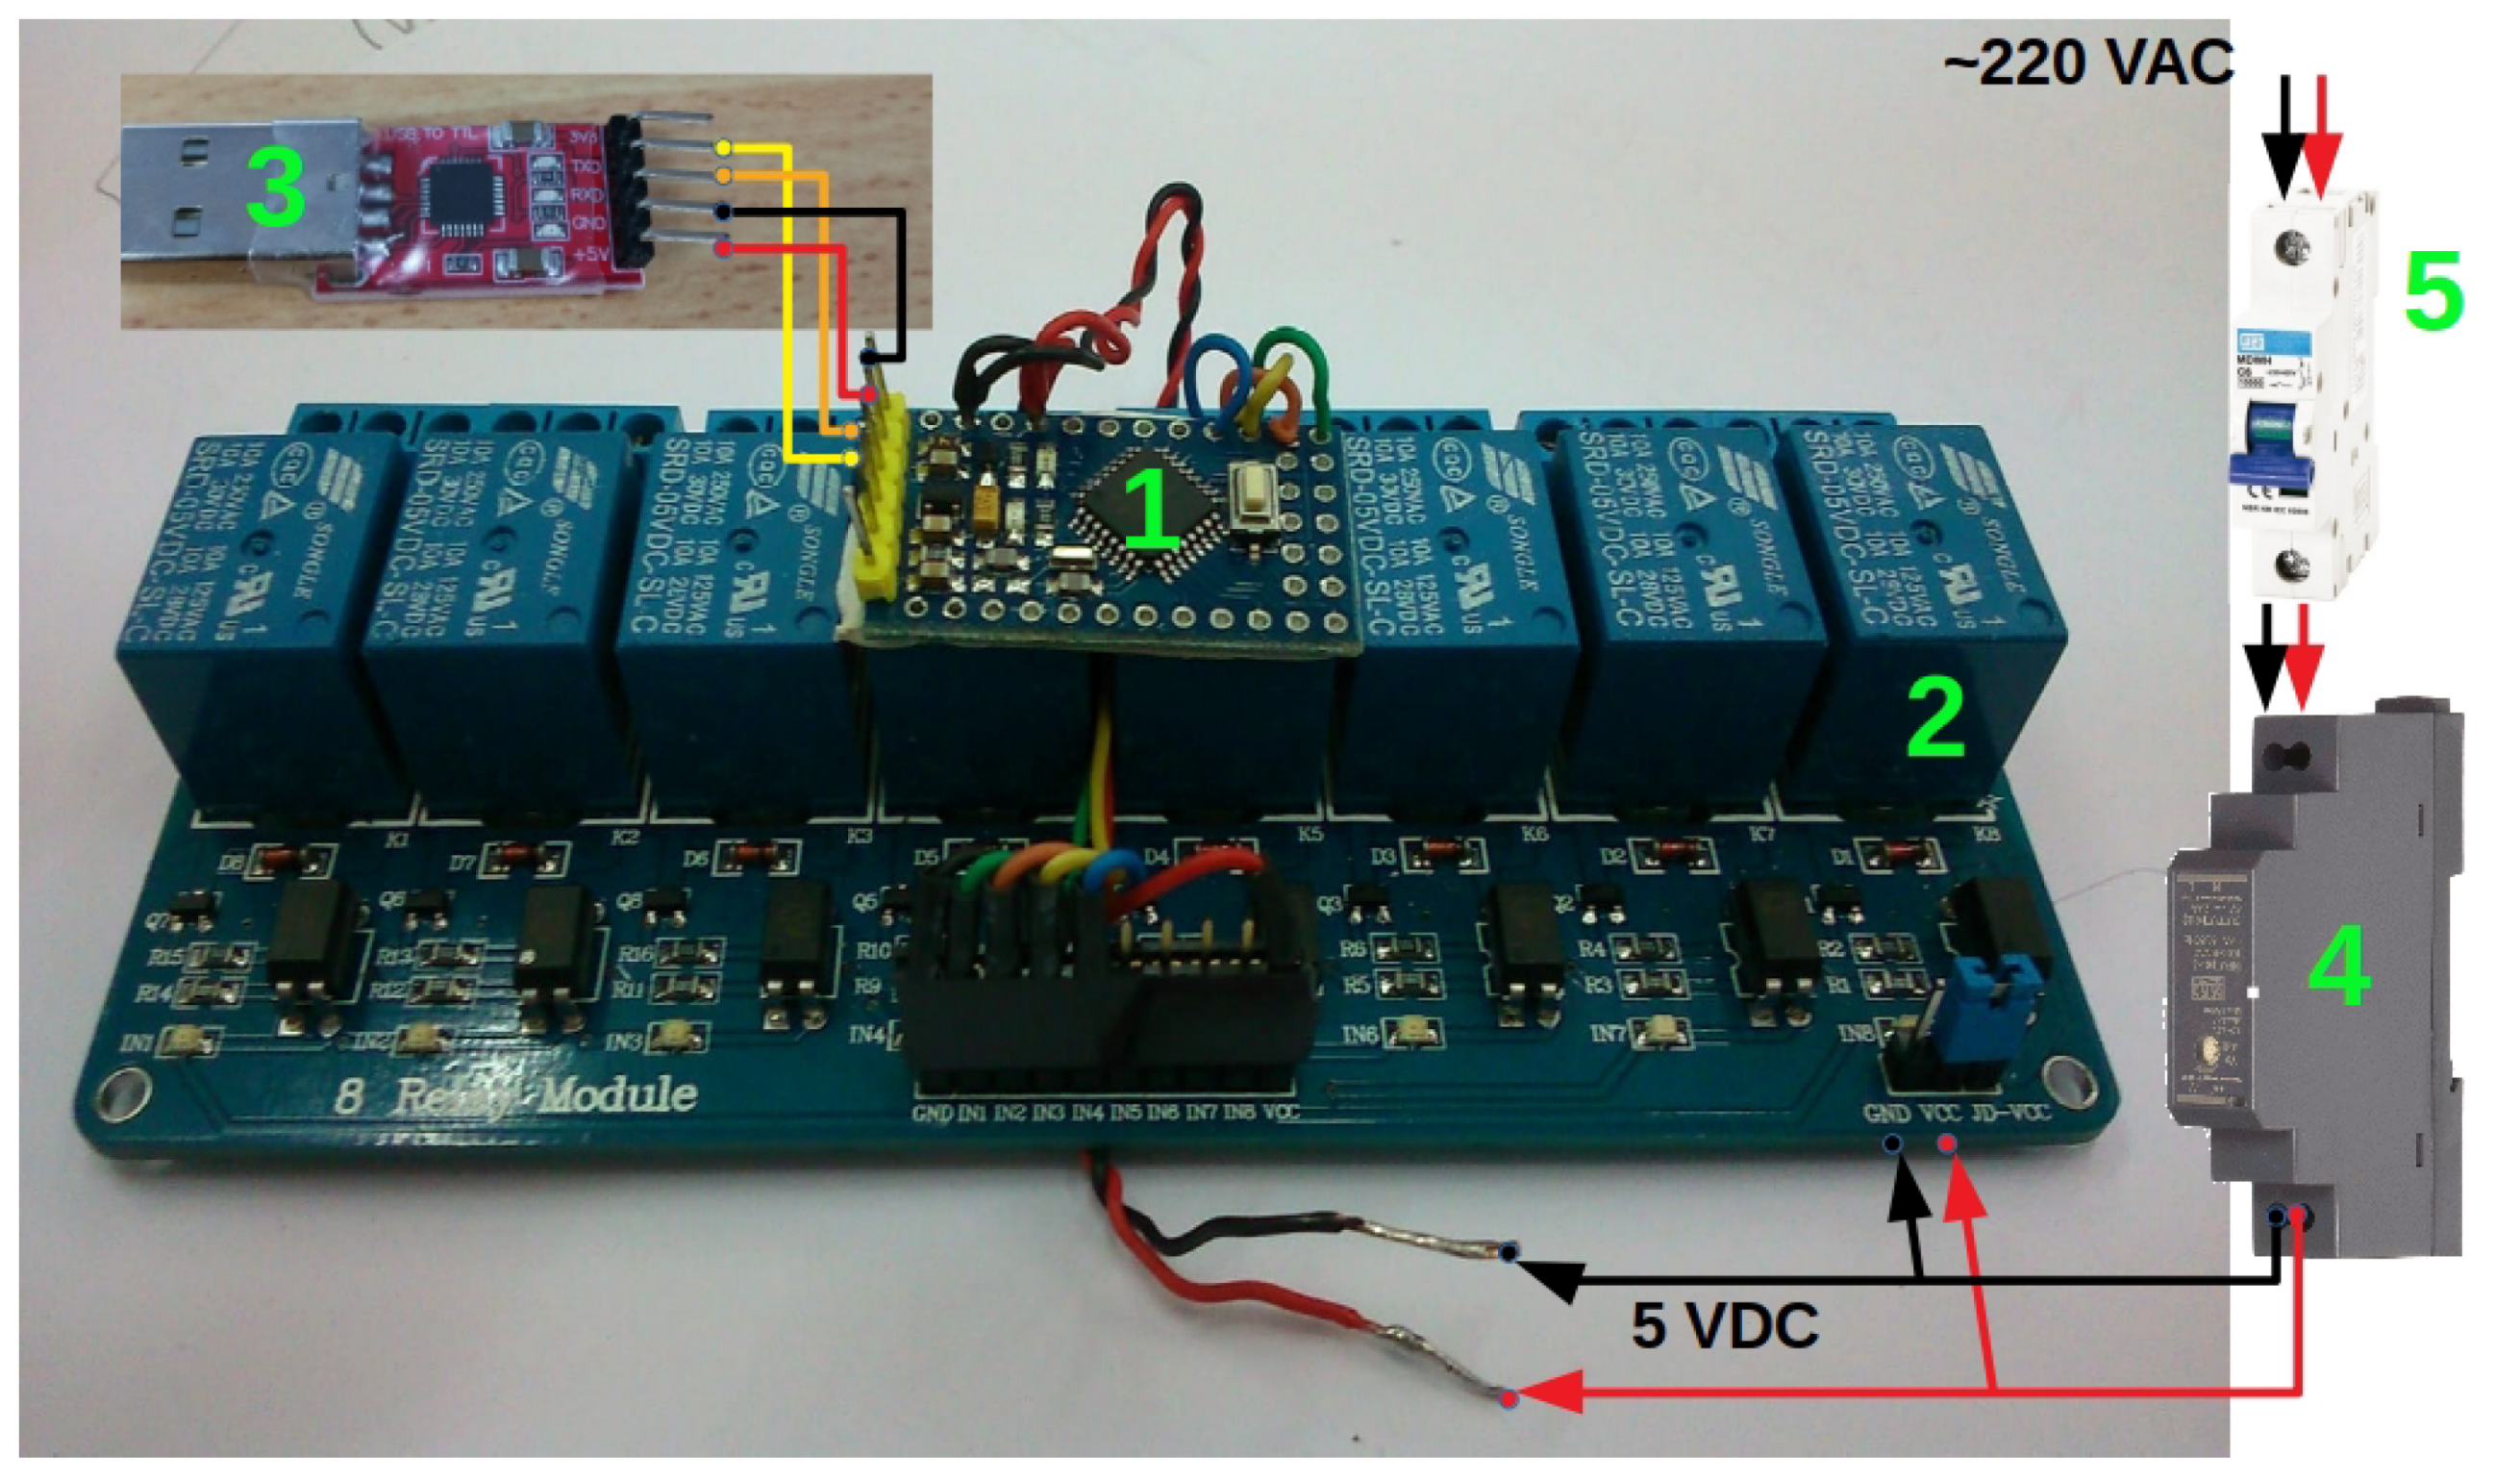
2.2.1. Control Stage

The control stage is driven by an Arduino ProMini microcontroller board. The power source is provided by an alternating current/direct current (AC/DC) DIN rail power supply (model HDR-15-5, manufactured by MeanWell). The AC input ranges from 85 VAC to 264 VAC and generates 5 VDC and a rated current of 2.4 A. It is designed with plastic housing and can operate at ambient temperatures between −30 °C and 70 °C under air convection and with relative humidity ranging from 20% to 90%. To upload code onto the Arduino, a USB-TTL adapter with a CH340G chip and 5 pins is used. The code is described in Appendix A. Figure 4 shows the abovementioned elements.

2.2.2. Low Power Interface

This interface consists of a 8-channel relay module (Figure 4) managed by Arduino. The main characteristics of this module are:
  • Supply voltage: 3.75–6 V;
  • Trigger current: 5 mA;
  • Current when relay is active: ~70 mA (single), ~600 mA (all eight);
  • Relay maximum contact voltage: 250 VAC and 30 VDC;
  • Relay maximum current: 10 A.
Four relays turn the signals coming from each of the four surface temperature probes corresponding to each PV module on and off. The remaining four relays turn four contactors that manage the electrical current coming from the PV panels on and off. The reason to avoid coupling the PV signal with these relays is to allow the UHU-MUX to be used with PV currents higher than 10 A.

2.2.3. PV Power Stage

This stage is comprised of four contactors (model Acti 9 iCT A9C22722, manufactured by Schneider) used to turn the electrical currents coming from the PV panels on and off. The rated operational current is 20 A AC and is powered with AC voltages of 230–240 V. These contactors are added to avoid damage to the 8-relay module due to currents higher than 10 A.

2.2.4. Protection Stage

This stage consists of one monopolar circuit breaker (model MDW-C10) and four monopolar circuit breakers (model MDW-C20), both manufactured by WEG. The former is intended to protect the control stage against overloading and short circuits. The remaining four are coupled with the PV modules, providing both electrical protection and the possibility of turning a PV module on and off.

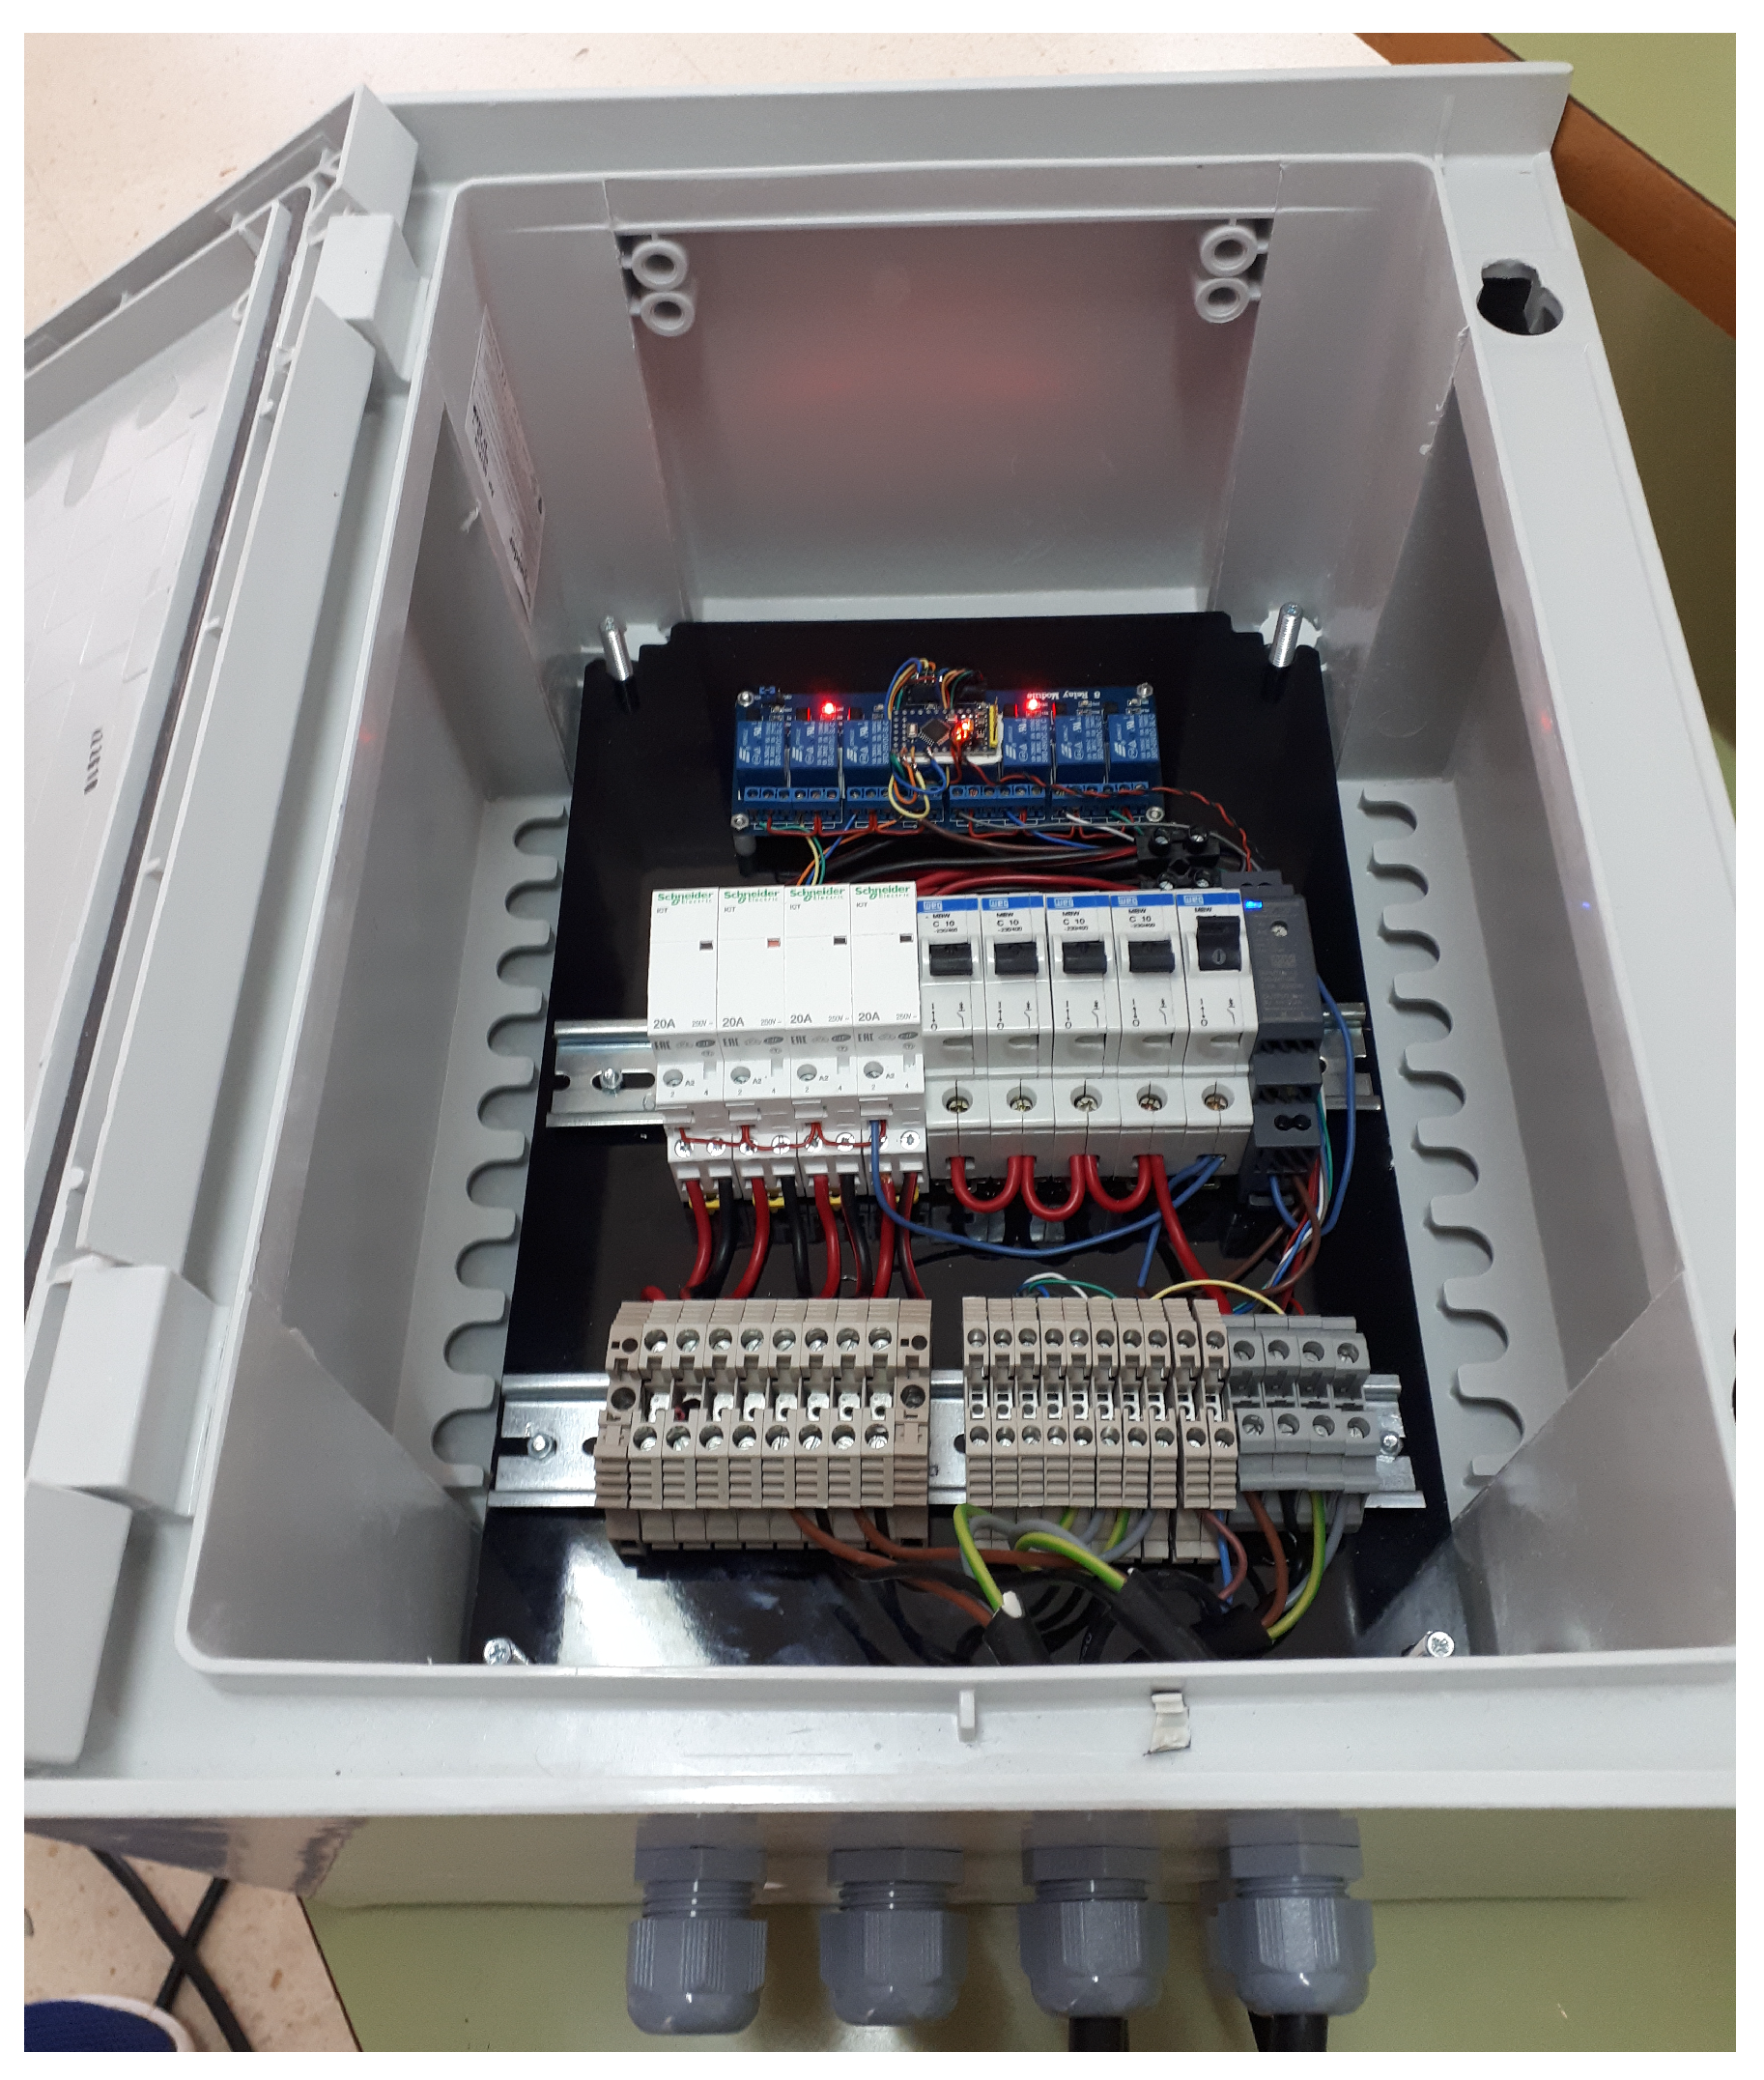
2.2.5. Terminal Block Stage

Every input/output wire is connected to the UHU-MUX by means of common DIN rail terminal blocks (screw termination).
Finally, all elements were assembled within an outdoor electrical plastic cabinet of dimensions 40 × 25 cm with IP68 protection. Ten holes were drilled on the bottom of the cabinet for the wiring entry, which were sealed with the corresponding ten cable glands. Figure 5 shows the finished UHU-MUX multiplexer.

2.3. Cost of the UHU-MUX Multiplexer
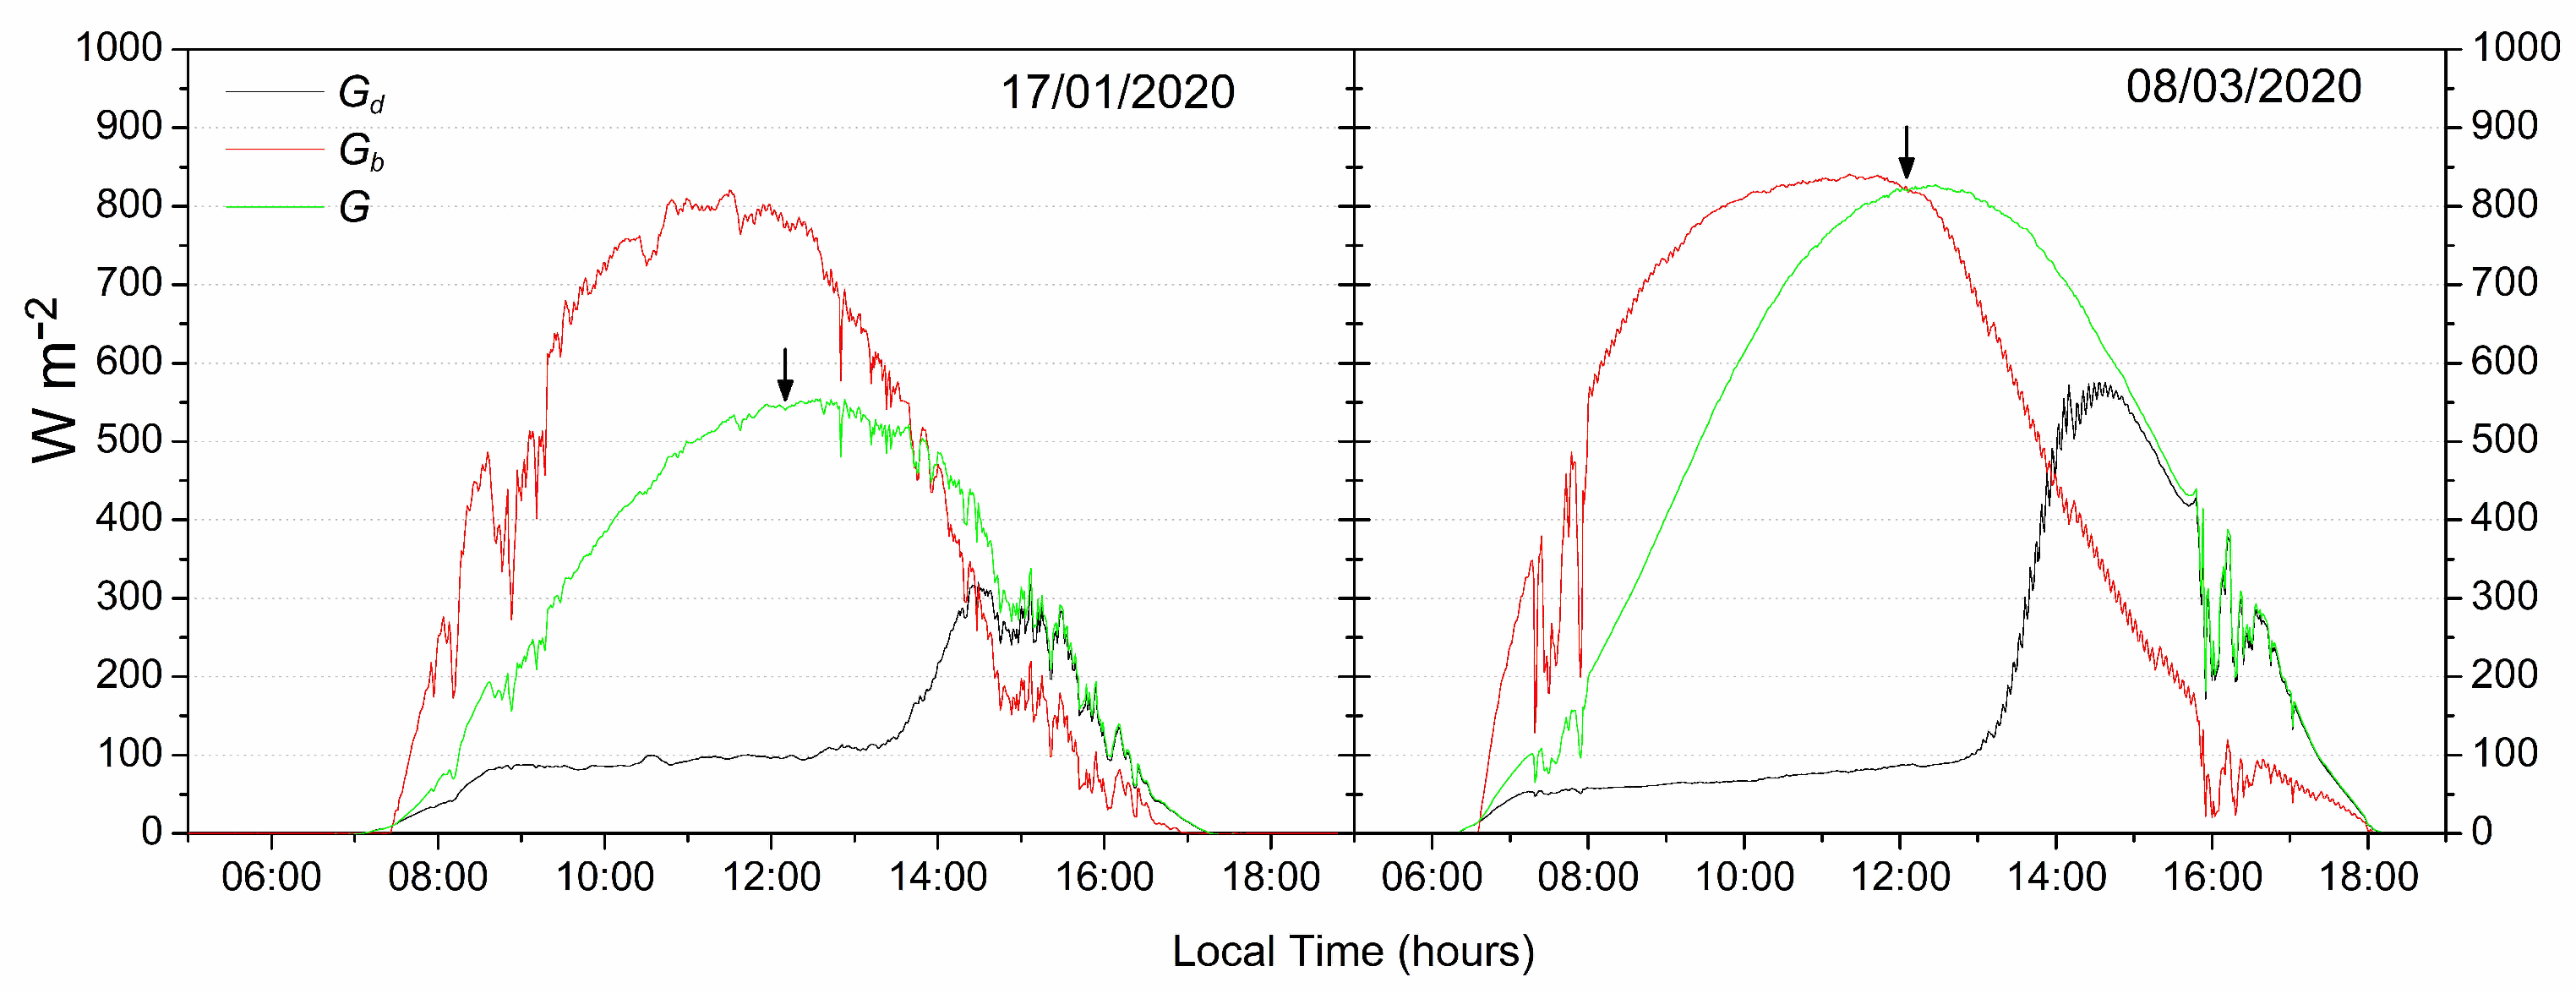
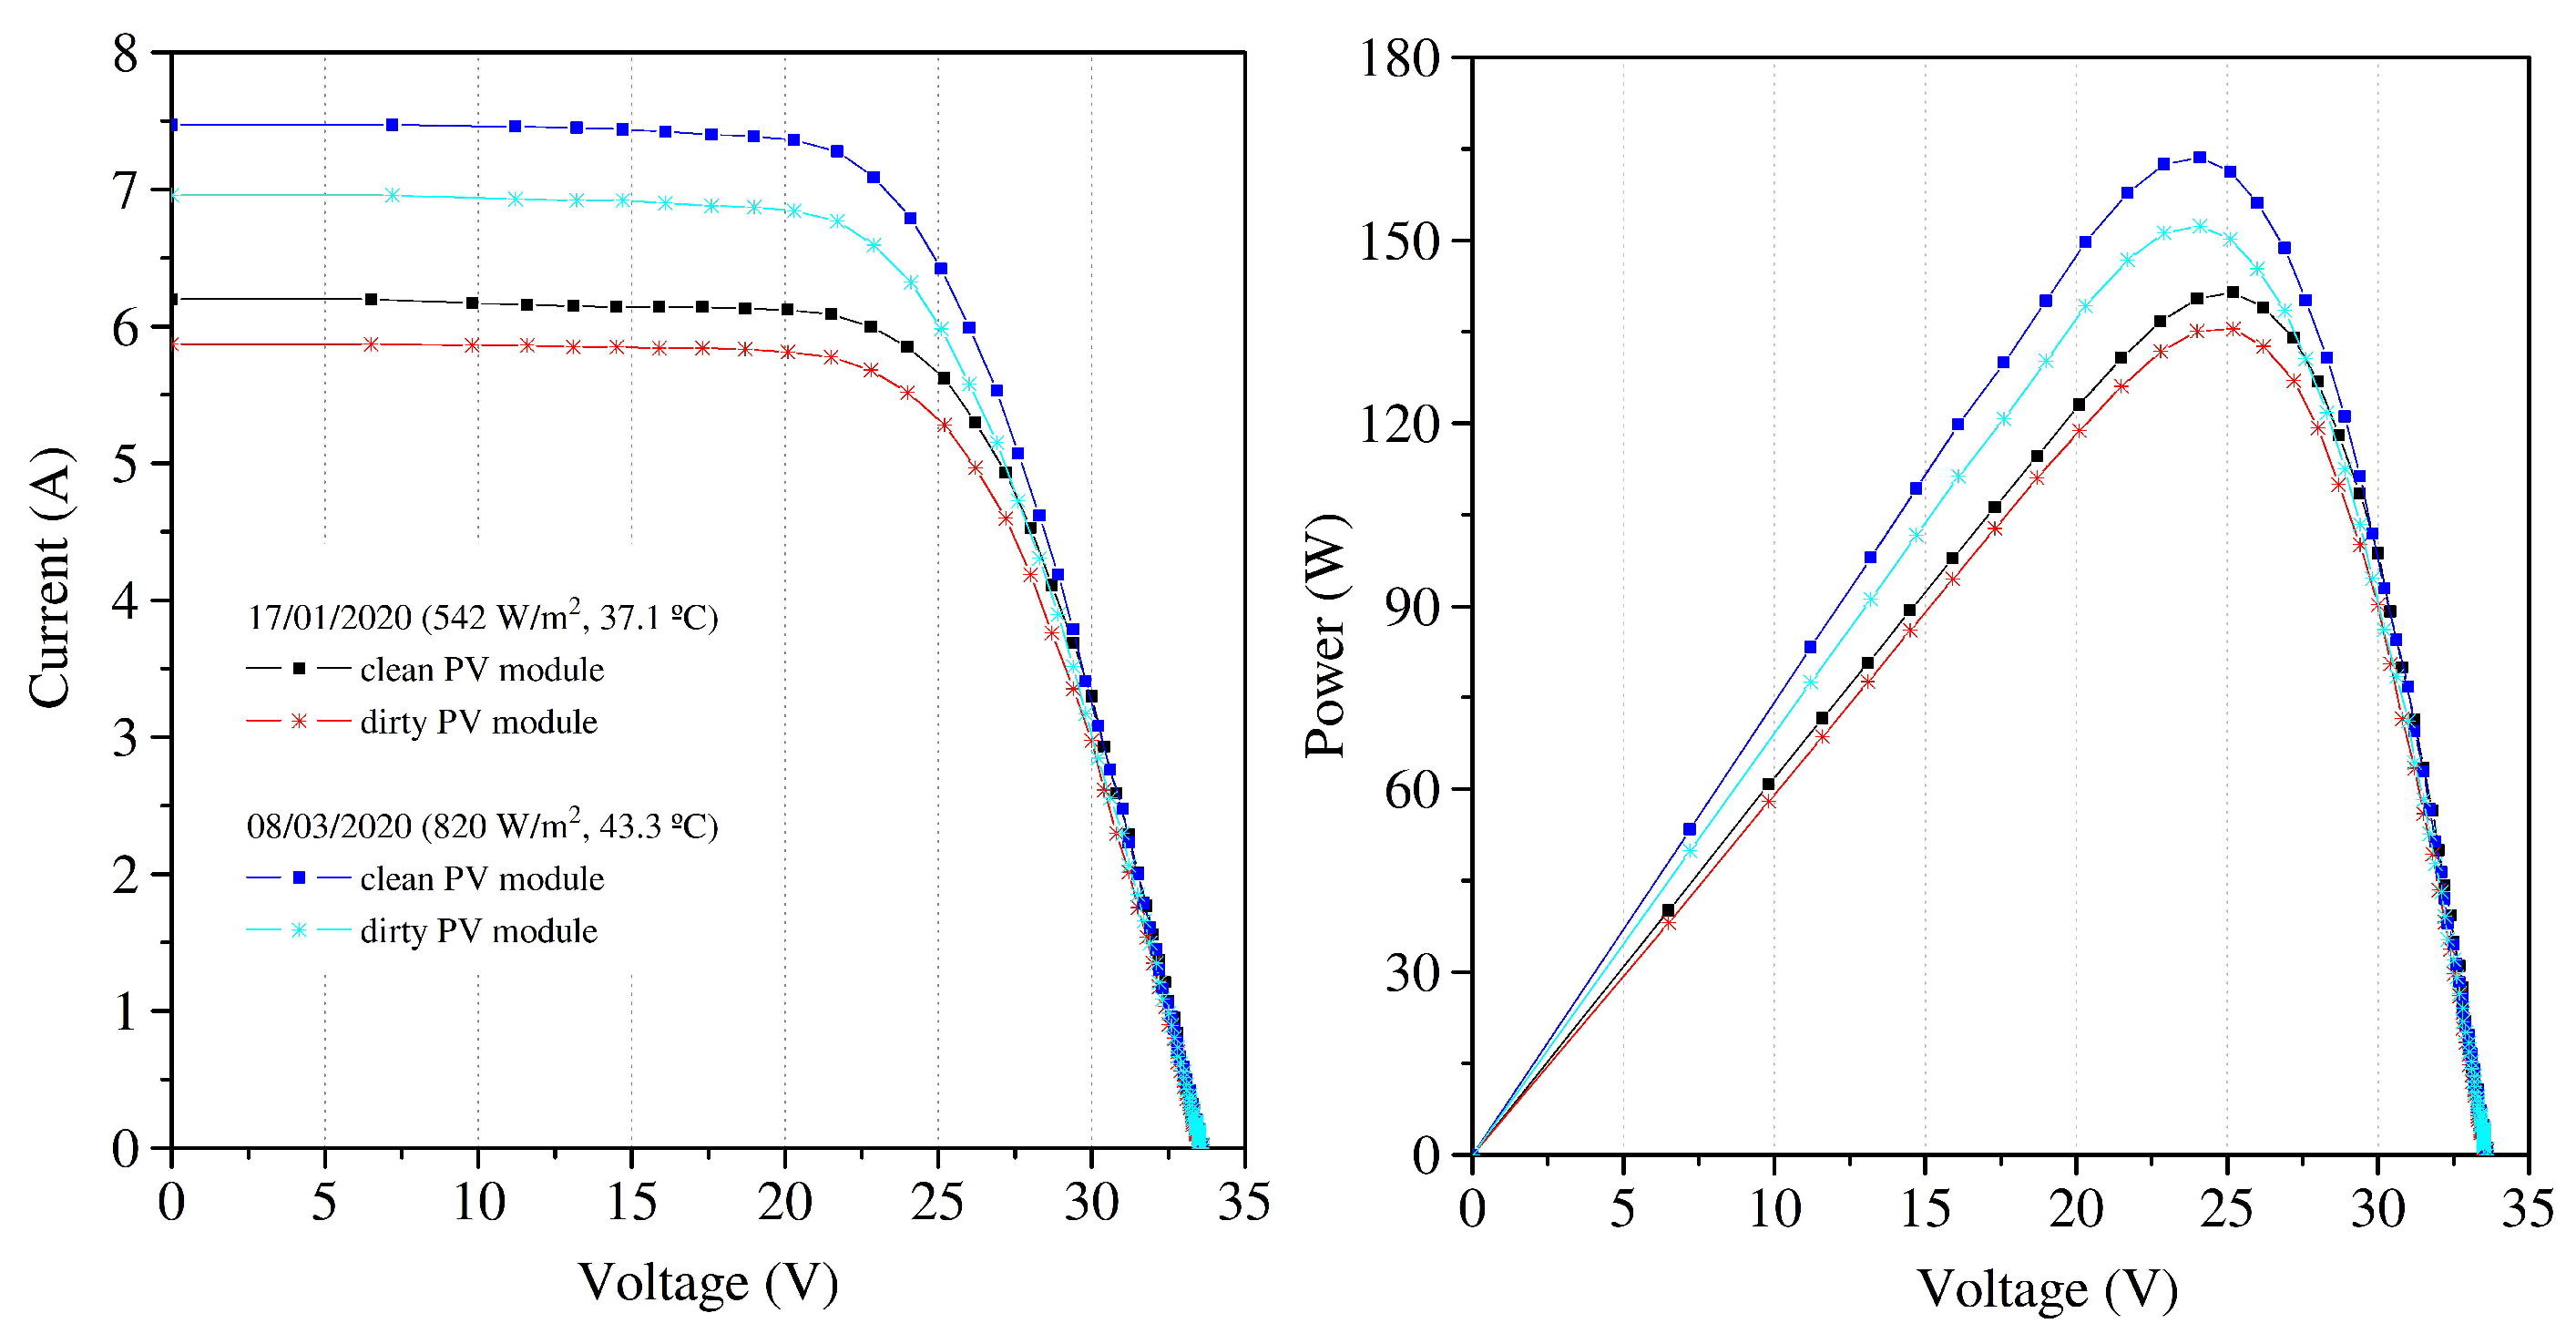
Table 1 lists the rounded-off prices of every component used to make the UHU-MUX multiplexer. A value-added tax (VAT) of 21% must be added to the total price in Spain. In summary, the final cost was about 380 €. This is a cheap price, compared to commercial multiplexer.

3. Results

This section is not intended to present results regarding the soiling effect on the PV power loss for long periods, but to show some particular study cases proving the utility of the UHU-MUX multiplexer presented herein. A complete study analyzing both the power loss and the economical consequences due to soiling, through use of the UHU-MUX multiplexer, can be found in [36].
The UHU-MUX multiplexer was installed at the Universidad de Almería in January 2020. Figure 6 shows the multiplexer and the wiring with the PV modules. In order to analyze the effect of soiling on the power production of the PV modules, both the I–V tracer and the UHU-MUX multiplexer were fitted to perform measurements of two PV modules, with a frequency of two minutes from 0830 to 1830 Local Time. The time lapse between each I–V measurement was 1 min. Thus, 30 curves per hour were registered for each module.
To account for the effects of soiling on the PV performance, the PV modules were cleaned at the beginning of the monitoring. After that, only one of the two PV modules was cleaned daily. Nevertheless, the presence of a few rainy days led to the simultaneous cleaning of both PV modules. These days made it possible to verify that both modules were still performing similarly as at the beginning of the test period. Two different instants, corresponding to cloudless conditions of two different days, were selected: 17 January 2020 at 12:00 local time and 8 March 2020 at 12:00 local time. The daily evolutions of the global, diffuse, and direct irradiances are shown in Figure 7. It was observed that the solar radiation conditions were almost constant over the selected 2-min periods. This was an important requirement for properly comparing the power production of both PV modules. Fast cloud transients, such as those observed during the afternoon in the two days, could lead to PV module performances not being comparable, due to different solar insolations at each instant. Furthermore, the different horizontal global solar irradiation for each day is clear.
Figure 8 shows the I–V and P–V curves for the two instants considered. The effect of soiling can be clearly observed in the reduction of the short-circuit current Isc. This reduction was automatically propagated to the P–V curve, as a result of the direct relationship between the electrical parameters: P = V ·I. Moreover, these I–V and P–V curves matched with the pattern of uniform soiling. This finding was corroborated by visual inspection of the PV modules every day, and was due to the low tilt angle of the PV modules. In the future, we plan to increase the tilt angle of the PV modules, in order to allow the dirt to settle on the bottom side of the PV module and, thus, to analyze the effect of non-uniform soling.
Table 2 presents the numerical values of the electrical data derived from the I–V curve tracing. From these values, the power loss percentages due to soiling could be calculated. A power reduction of around 5% was found for the day 17 January 2020. This power loss was slightly increased, up to about 7%, two months later. The almost null number of rainy days during the selected period led to increased soiling on the PV surface, with a consequent power reduction. Similar results can be obtained using the Isc, as long as the soiling distribution is uniform [9]. Furthermore, it can be noted, from the I–V curves, that dust deposition did not have a sizable effect on the open circuit voltage Voc of the modules. This result is in agreement with the findings of other studies [29].
The possibility of using a multiplexer makes it possible to determine the electrical losses at a given location, such as the case studied herein (a coastal site on the Mediterranean Sea), where the photovoltaic electricity production decreased by about 10% in a few months. For commercial PV plants, this information can be useful in deciding whether and how often to clean the panels. For residential systems, the insignificant economic impact of cleaning, however, may not be appropriate, as it could increase system costs over and above whatever savings could be gained in performance. Nevertheless, cleaning PV panels is recommended whenever possible, as it improves their efficiency and also prevents hot-spot phenomena, thus extending the useful life of PV modules [37,38].

4. Conclusions

Determining the effect of soiling on PV module performance is an urgent need worldwide, in order to evaluate the cleaning frequency of PV modules, to select more suitable emplacements, or even to decide the more convenient PV technology for a place, depending on the atmospheric conditions. Studies conducted to analyze the soiling effect are commonly carried out by comparing the electrical parameters of a clean PV module or array against its dirty counterpart. These electrical parameters are derived from current–voltage (I–V) curves. Although many commercial devices are available, they are often expensive or not suitable for use in outdoor conditions. In this work, the design of a new low-cost multiplexer that can operate outdoors was presented. The electrical components can be easily found on the internet or in electrical shops at very low prices. This multiplexer prototype can manage up to four PV panels, but that number can be increased while keeping almost the same price. The programming of the multiplexer is easy, avoiding the requirement of skilled staff. The multiplexer has worked continuously at the Universidad de Almería (Spain) for at least several months, thus proving its robustness. Thanks to this, it is possible to carry out studies analyzing the soiling effect on PV plant performance. This design aims to allow other research teams or businesses with low economical resources to be able to access low-cost multiplexers.

Author Contributions

Design and fabrication of multiplexer, G.L., J.S., and D.R.; software, D.R.; measurements, J.A.-M. and F.J.B.; data analysis, G.L., J.P., N.M.-C, A.M., and P.F.; writing—original draft preparation, G.L.; writing—review and editing, all authors. All authors have read and agreed to the published version of the manuscript.

Funding

This research was funded by the Spanish Ministry of Economy, Industry, and Competitiveness “PVCastSOIL” project No ENE2017-83790-C3-1-2-3-R, in collaboration with the European Regional Development Fund.

Conflicts of Interest

The authors declare no conflict of interest.

Appendix A

Algorithm 1: The Arduino code is detailed below
Energies 14 04186 i001

References

  1. International Energy Agency (IEA). Snapshot of Global PV Markets (Report IEA-PVPS T1-39:2021); International Energy Agency (IEA): Paris, France, 2021. [Google Scholar]
  2. Spataru, S.; Sera, D.; Kerekes, T.; Teodorescu, R. Diagnostic method for photovoltaic systems based on light I–V measurements. Sol. Energy 2015, 119, 29–44. [Google Scholar] [CrossRef]
  3. Álvarez-Tey, G.; Clavijo-Blanco, J.A.; Gil-García, A.; Jiménez-Castañeda, R.; García-López, C. Electrical and Thermal Behaviour of Crystalline Photovoltaic Solar Modules in Shading Conditions. Appl. Sci. 2019, 9, 3038. [Google Scholar] [CrossRef] [Green Version]
  4. Zdanowicz, T.; Prorok, M.; Kolodenny, W.; Roguszczak, H. Outdoor data acquisition system with advanced database for PV modules characterization. In Proceedings of the 3rd World Conferenceon Photovoltaic Energy Conversion, Osaka, Japan, 11–18 May 2003. [Google Scholar]
  5. Zdanowicz, T.; Rodziewicz, T.; Zabkowska-Waclawek, M. Effect of Air Mass Factor on the Performance of Different type of PV Modules. In Proceedings of the 3rd World Conferenceon Photovoltaic Energy Conversion, Osaka, Japan, 11–18 May 2003. [Google Scholar]
  6. Drouiche, I.; Harrouni, S.; Hadj-Arab, A. A new approach for modelling the aging PV module upon experimental I–V curves by combining translation method and five-parameters model. Electr. Power Syst. Res. 2018, 163, 231–241. [Google Scholar] [CrossRef]
  7. Kazem, H.A.; Chaichan, M.T. Effect of Humidity on Photovoltaic Performance Based on Experimental Study. Int. J. Appl. Eng. Res. 2015, 10, 43572–43577. [Google Scholar]
  8. Velilla, E.; Cano, J.B.; Jaramillo, F. Monitoring system to evaluate the outdoor performance of solar devices considering the power rating conditions. Sol. Energy 2019, 194, 79–85. [Google Scholar] [CrossRef]
  9. Martín-Chivelet, N.; Polo, J.; Alonso, M.; Sanz, C.; Batlles, F.J.; López, G.; Alonso-Montesinos, J.; Bosch, J.L.; Barbero, J. Characterization and modeling of the soiling effect on the PV generation under urban mediterranean conditions. In Proceedings of the 36th European Photovoltaic Solar Energy Conference and Exhibition, Marseille, France, 9–13 September 2019; pp. 1618–1620. [Google Scholar]
  10. Martín-Chivelet, N.; Chenlo, F.; Alonso-García, M.C.; Ariza, M.A.; Mejuto, E.; Angulo, M.; Nositschka, W.A.; Neumann, D.; Prast, M.O.; Mazón, P. Surface soiling losses measurement in pv modules under real operation. In Proceedings of the 26th European Photovoltaic Solar Energy Conference and Exhibition, Hamburg, Germany, 5–9 September 2011; WIP: München, Germany, 2011; pp. 3597–3599. [Google Scholar]
  11. Mani, M.; Pillai, R. Impact of dust on solar photovoltaic (PV) performance: Research status, challenges and recommendations. Renew. Sustain. Energy Rev. 2010, 14, 3124–3131. [Google Scholar] [CrossRef]
  12. Figgis, B.; Ennaoui, A.; Ahzi, S.; Rémond, Y. Review of PV soiling particle mechanics in desert environments. Renew. Sustain. Energy Rev. 2017, 76, 872–881. [Google Scholar] [CrossRef]
  13. Ferrada, P.; Olivares, D.; Campo, V.; Marzo, A.; Araya, F.; Cabrera, E.; Llanos, J.; Correa-Puerta, J.; Portillo, C.; Román-Silva, D.; et al. Physicochemical characterization of soiling from photovoltaic facilities in arid locations in the Atacama Desert. Sol. Energy 2019, 187, 47–56. [Google Scholar] [CrossRef]
  14. Zaihidee, F.M.; Mekhilef, S.; Seyedmahmoudian, M.; Horan, B. Dust as an unalterable deteriorative factor affecting PV panel’s efficiency: Why and how. Renew. Sustain. Energy Rev. 2016, 65, 1267–1278. [Google Scholar] [CrossRef]
  15. López-García, J.; Pozza, A.; Sample, T. Long-term soiling of silicon PV modules in a moderate subtropical climate. Sol. Energy 2016, 130, 174–183. [Google Scholar] [CrossRef]
  16. Simon, M.; Meyer, E. Detection and analysis of hot-spot formation in solar cells. Sol. Energy Mater. Sol. Cells 2016, 94, 106–113. [Google Scholar] [CrossRef]
  17. Yilbas, B.S.; Ali, H.; Khaled, M.; Al-Aqeeli, N.; Dheir, N.A.; Varanas, K.K. Influence of dust and mud on the optical, chemical, and mechanical properties of a PV protective glass. Sci. Rep. 2015, 5, 15833. [Google Scholar] [CrossRef] [PubMed]
  18. Olivares, D.; Trigo-González, M.; Marzo, A.; Ferrada, P.; Llanos, J.; Araya, F.; López, G.; Polo, J.; Alonso-Montesinos, J.; Gueymard, C. Analysis of the local factors that influence the cementation of soil and effects on pv generation at the plataforma solar del desierto de Atacama, Chile. In Proceedings of the ISES Solar World Congress 2019, Santiago, Chile, 4–7 November 2019; International Solar Energy Society: Freiburg, Germany, 2019; pp. 1021–1030. [Google Scholar]
  19. Elminir, H.K.; Ghitas, A.E.; Hamid, R.H.; El-Hussainy, F.; Beheary, M.M.; Abdel-Moneim, K.M. Effect of dust on the transparent cover of solar collectors. Energy Convers. Manag. 2006, 47, 3192–3203. [Google Scholar] [CrossRef]
  20. Kaldellis, J. K; Kokala, A. Quantifying the decrease of the photovoltaic panels’ energy yield due to phenomena of natural air pollution disposal. Energy 2010, 35, 4862–4869. [Google Scholar] [CrossRef]
  21. Laarabi, B.; El Baqqal, Y.; Dahrouch, A.; Barhdahi, A. Deep analysis of soiling effect on glass transmittance of PV modules in seven sites in Morocco. Energy 2020, 213, 118811. [Google Scholar] [CrossRef]
  22. Cordero, R.R.; Damiani, A.; Laroze, D.; MacDonell, S.; Jorquera, J.; Sepúlveda, E.; Feron, S.; Llanillo, P.; Labbe, F.; Carrasco, J.; et al. Effects of soiling on photovoltaic (PV) modules in the Atacama Desert. Sci. Rep. 2018, 8, 13943. [Google Scholar] [CrossRef] [Green Version]
  23. Mekhilef, S.; Saidur, R.; Kamalisarvestani, M. Effect of dust, humidity and air velocity on efficiency of photovoltaic cells. Renew. Sustain. Energy Rev. 2012, 16, 2920–2925. [Google Scholar] [CrossRef]
  24. Ghazi, S.; Sayigh, A.; Ip, K. Dust effect on flat surfaces—A review paper. Renew. Sustain. Energy Rev. 2014, 33, 742–751. [Google Scholar] [CrossRef]
  25. Rao, A.; Pillai, R.; Mani, M.; Ramamurthy, P. Influence of dust deposition on photovoltaic panel performance. Energy Procedia 2014, 54, 690–700. [Google Scholar] [CrossRef] [Green Version]
  26. Tanesab, J.; Parlevliet, D.; Whale, J.; Urmee, T.; Pryor, T. The contribution of dust to performance degradation of PV modules in a temperate climate zone. Sol. Energy 2015, 120, 147–157. [Google Scholar] [CrossRef] [Green Version]
  27. Alquthami, T.; Menoufi, K. Soiling of Photovoltaic Modules: Comparing between Two Distinct Locations within the Framework of Developing the Photovoltaic Soiling Index (PVSI). Sustainability 2019, 11, 4697. [Google Scholar] [CrossRef] [Green Version]
  28. Conceição, R.; Silva, H.G.; Mirão, J.; Gostein, M.; Fialho, L.; Narvarte, L.; Collares-Pereira, M. Saharan dust transport to Europe and its impact on photovoltaic performance: A case study of soiling in Portugal. Sol. Energy 2018, 160, 94–102. [Google Scholar] [CrossRef]
  29. Montes-Romero, J.; Micheli, L.; Theristis, M.; Fernández-Solas, A.; de la Casa, J.; Georghiou, G.E.; Almonacid, F.; Fernández, E.F. Impact of Soiling on the Outdoor Performance of CPV Modules in Spain. AIP Conf. Proc. 2019, 2149, 60004. [Google Scholar]
  30. Olivares, D.; Ferrada, P.; Bijman, J.; Rodríguez, S.; Trigo-González, M.; Marzo, A.; Rabanal-Arabach, J.; Alonso-Montesinos, J.; Batlles, F.J.; Fuentealba, E. Determination of the Soiling Impact on Photovoltaic Modules at the Coastal Area of the Atacama Desert. Energies 2020, 13, 3819. [Google Scholar] [CrossRef]
  31. Quiroz, J.E.; Stein, J.S.; Carmignani, C.K.; Gillispie, K. In-situ module-level I–V tracers for novel PV monitoring. In Proceedings of the IEEE 42nd Photovoltaic Specialist Conference (PVSC), New Orleans, LA, USA, 14–19 June 2015; pp. 1–6. [Google Scholar]
  32. Amiry, H.; Benhmida, M.; Bendaoud, R.; Hajjaj, C.; Bounouar, S.; Yadir, S.; Raïs, K.; Sidki, M. Design and implementation of a photovoltaic I–V curve tracer: Solar modules characterization under real operating conditions. Energy Convers. Manag. 2018, 169, 206–216. [Google Scholar] [CrossRef]
  33. Willoughby, A. A; Osinowo, M.O. Development of an electronic load I–V curve tracer to investigate the impact of Harmattan aerosol loading on PV module pern2tkformance in southwest Nigeria. Sol. Energy 2018, 166, 171–180. [Google Scholar] [CrossRef]
  34. Morales-Aragonés, J.I.; Gallardo-Saavedra, S.; Alonso-Gómez, V.; Sánchez-Pacheco, F.J.; González, M.A.; Martínez, O.; Muñoz-García, M.A.; Alonso-García, M.d.C.; Hernández-Callejo, L. Low-Cost Electronics for Online I–V Tracing at Photovoltaic Module Level: Development of Two Strategies and Comparison between Them. Electronics 2021, 10, 671. [Google Scholar] [CrossRef]
  35. Ameen, R.S.; Balog, R.S. Flexible and Scalable Photovoltaic Curve Tracer. In Proceedings of the 2018 International Conference on Photovoltaic Science and Technologies (PVCon), Ankara, Turkey, 4–6 July 2018; pp. 1–4. [Google Scholar]
  36. Alonso-Montesinos, J.; Rodríguez-Martínez, F.; Polo, J.; Martín-Chivelet, N.; Batlles, F.J. Economic Effect of Dust Particles on Photovoltaic Plant Production. Energies 2020, 13, 6376. [Google Scholar] [CrossRef]
  37. Maghami, M.R.; Hizam, H.; Gomes, C.; Radzi, M.A.; Rezadad, M.I.; Hajighorbani, S. Power loss due to soiling on solar panel: A review. Renew. Sustain. Energy Rev. 2016, 59, 1307–1316. [Google Scholar] [CrossRef] [Green Version]
  38. Tanesab, J.; Parlevliet, D.; Whale, J.; Urmee, T. Energy and economic losses caused by dust on residential photovoltaic (PV) systems deployed in different climate areas. Renew. Energy 2018, 120, 401–412. [Google Scholar] [CrossRef]
Figure 1. Experimental facility at the Universidad de Almería.
Energies 14 04186 g001
Figure 2. I–V curve tracer, including the PV-Engineering model PVPM-6020C used in the Universidad de Almería. Connection elements: (1) Two four-wire measuring connectors for voltage and current, respectively; (2) input for external Pt100 (module back surface temperature measurement); (3) irradiation input; and (4) RS-232 serial interface to the computer.
Energies 14 04186 g002
Figure 3. Block diagram for the UHU-MUX multiplexer.
Energies 14 04186 g003
Figure 4. Arduino Pro Mini (1) attached to the 8-Channel Relay Module (2) and the USB-TTL converter (3) for connection to the computer. The power supply (4) delivers current to both the Arduino and the relay module. A circuit breaker (5) is also added, in order to protect the above electrical components from an overload or short-circuit.
Energies 14 04186 g004
Figure 5. UHU-MUX multiplexer developed at the Universidad de Huelva.
Energies 14 04186 g005
Figure 6. UHU-MUX multiplexer installed at the experimental PV facility of the Universidad de Almería.
Energies 14 04186 g006
Figure 7. Diurnal evolution of global (G), diffuse (Gd), and direct (Gb) irradiances for the two days selected to analyze the soiling effect on the PV power production. The arrows mark the selected instants.
Energies 14 04186 g007
Figure 8. I–V curves (left) and power–voltage curves (right) for both of the PV modules measured at 12:00 local time on two different days. Horizontal global irradiance and back PV surface temperature are also provided.
Energies 14 04186 g008
Table 1. Prices of the components used to make the UHU-MUX multiplexer.
ComponentsUnit Price (€)Total Price (€)
One Arduino Pro Mini + USB to TTL conversor1313
One 8-channel relay module77
One power supply1414
Five contactors1785
Five circuit breakers840
One outdoor IP68 electrical cabinet145145
Ten cable glands110
Total 314
Table 2. Electrical data derived from the I–V curves corresponding to the PV modules for the two instants considered.
17 January 20208 March 2020
ParametersPV Module CleanPV Module DirtyPV Module CleanPV Module Dirty
I sc 6.20 A5.90 A7.47 A6.96 A
V oc 33.6 V33.6 V33.6 V33.6 V
P mpp 141.5 W134.6 W163.6 W152.3 W
Publisher’s Note: MDPI stays neutral with regard to jurisdictional claims in published maps and institutional affiliations.

