1. Introduction
In the energy sector, renewable energy sources have played an increasingly important role in recent years, including solar collectors. Since 1980, the price of solar collectors has fallen and has become more affordable. Moreover, the efficiency has increased significantly due to an improved control system, the availability of more energy-efficient pumps, and improvements to other components [
1]. All district heating systems aim to have less impact on the environment as possible.
According to the latest data, in Europe, 70% of solar collector systems use flat collectors [
2]. Improving the efficiency of solar collector systems requires laboratory and on-site testing. Several experimental case studies have examined the influencing factors for flat solar collectors’ efficiency, namely solar radiation, temperature difference, and angle of the collector position. Maximum efficiency may be achieved under several fulfilled conditions, but it can also fall sharply after reaching it. Studies have also analyzed wind speed as another such influencing factor: The efficiency of a flat solar collector is reduced when wind velocity increases because the collector surface is cooled [
3,
4,
5].
There are two types of solar district heating systems: standalone systems with storage and combined systems [
6,
7]. Before integrating a solar collector system into district heating (DH), it is crucial to consider the influencing factors to determine whether they are appropriate for the integration. For example, low return temperatures are essential when considering the 4th generation DH system [
8]. The usual temperature regime in district heating networks is 90/60 °C, but typical low-temperature DH operates with heat supply temperatures of 40 to 60 °C [
9].
The accumulation system is a crucial element in the solar collector system to produce more heat during peak hour when solar irradiation is highest [
10]. An adjusted thermal storage tank allows the solar system to work effectively and can integrate the solar field into the overall DH systems.
2. Literature Review
Solar thermal technologies are becoming more and more popular solutions for DH. This observation is based on the fact that the maintenance costs are comparably low, loans for implementing such technologies are beneficial, and the technologies allow climate goals to be achieved and are sustainable [
11]. The only costs incurred during operation are the electricity costs for circulation pumps that circulate the heat carrier. Other maintenance costs are related to the following:
Glycol filler: Glycol impurity ensures that the heat carrier does not freeze during the low ambient air temperature. In most cases, the outdoor temperature at which the heat carrier can still work properly is −10 °C.
Replacement of damaged equipment, for example, the temperature sensors or solar collector glass covers.
The abovementioned categories are the main reasons that can raise the annual maintenance costs, but those costs are still comparably low when considering other alternatives, for example, fossil fuel or biomass boilers. Moreover, the effectiveness of solar collectors is decreasing very slowly, i.e., only by a few percent per decade, and so the technology is sustainable and can be used for a long time.
There are few designs of the collectors which are chosen that demand temperature level requirements. For example, the most commonly used design in DH is flat plate collectors (FPC), but those are mainly used to produce heat with temperatures up to 80 °C. However, heat production with higher temperatures reduces the collectors’ efficiency due to increased thermal losses [
12]. Therefore, when higher temperatures are required, evacuated tube collectors (ETC) are mainly installed, but parabolic trough collectors (PTC) are used to reach even higher temperatures (70 to 150 °C) [
11]. Recent publications have also explored how to use nanofluids to improve the field efficiency of solar collectors [
13]. However, such solutions are not yet extensively used.
The latest trends show that large-scale solar collector fields have been installed during the last decade [
11]. For example, the solar collector field installed in Silkeborg, Denmark, reaches 156,694 m
2. This tendency is becoming more popular because of the need to ensure renewable energy throughout the year. At the same time, it makes it necessary to integrate effective heat storage systems to store a significant amount of energy throughout the summer season, which can later be used in the autumn. Therefore, it is possible to avoid using other technologies, such as biomass or natural gas boilers. As a result, the higher solar fraction and share of emission-free technologies can be reached.
Most of the studies related to solar heating system optimization are simulation-based studies seeking optimal system design [
12,
13]. Several studies use technological design and operational data from one of the first large-scale solar DH systems at the Drake Landing Solar Community in Okotoks, Canada [
14,
15]. One such study was conducted by Saloux and Candanedo [
16], who analyzed the potential improvements of this system and used model-based simulation to optimize the operation of circulation pumps and increase storage system efficiency.
Bava et al. [
17] developed a simulation model to calculate flow distribution in a solar collector field. The obtained results were compared with the data from the solar collector field near Høje Taastrup, Denmark. The authors simulated the main hydraulic parameters (the pressure drop, flow rate, inlet, and outlet temperatures) to confirm whether uniform flow distribution in the solar field can be achieved. A further study from Bava and Furbo [
18] investigated the effect of different improvement measures on the thermal performance of the Høje Taastrup solar DH field based on a TRNSYS–MATLAB simulation. The authors concluded that accurate inputs to the control strategy can increase the yearly solar yield by 3%. It is necessary to perform more accurate solar irradiance measures, while taking into consideration the temperature drop in heat exchangers and the efficiency drop due to the incidence angle modifications to improve the control strategy.
Tschopp et al. [
19] presented an in-depth overview of large-scale solar DH systems in four countries (Denmark, China, Germany, and Austria), focusing on the DH market and different technological solutions. The authors investigated the operation of each country’s best practice solar DH systems by analyzing monthly produced solar heat and efficiency. The study’s main aim was to investigate the most appropriate business models and support policies, without focusing on the actual performance of the large-scale solar systems.
However, several researchers have investigated the actual operation of large-scale solar DH systems. Noussan et al. [
20] performed the hourly data analyses of the performance of eight different solar fields in Denmark. The authors investigated the solar field efficiency on a monthly and hourly basis and found the linear relation between solar field efficiency and solar radiation. The authors concluded that further investigation is necessary to analyze different affecting parameters of solar field performance.
Furbo et al. [
21] compared the measured and calculated performance of different solar fields in Denmark based on diverse weather conditions in six different regions. The authors investigated the solar fields’ actual annual solar yield and calculated different efficiency rates (kWh/m
2) by assuming different mean solar collector fluid temperatures.
However, there is still a lack of studies that analyze the actual performance of large-scale solar fields integrated into the DH by considering the various conditions of the heating network.
3. Aim and Scope of the Study
The main aim of this particular article is to find the factors influencing a large-scale solar collector field and to find ways to improve its efficiency. The research focuses on the evaluation under Baltic climate conditions, which have not been analyzed previously. In addition, there is a lack of research based on actual operating conditions of solar fields, as most studies investigate the experimental systems. Therefore, the monitoring data analyses bring an added value to the evaluation of solar DH system performance. Previous studies have analyzed factors that influence the productivity of the solar collector field—for instance, solar radiation, heat carrier supply, return temperatures, and the ambient air temperature was examined in [
19]. Since it is impossible to influence solar radiation, the main goal here is to approach which factors can be managed by the solar collector field operators and how this can be done, with the intention to optimize the solar heat production.
The data analyses show the main bottlenecks that should be considered in the solar DH system operational strategy. Furthermore, the obtained multi-regression equation allows for forecasting the solar field efficiency in a simplified manner, which is crucial in the preliminary investigation of the solar system integration. The multi-regression analysis has not been previously applied in the case of a large-scale solar DH system investigation.
The article consists of four main sections, i.e., literature review, methodology, results, and conclusions. First,
Section 2 with the literature review presents the state-of-the-art for solar energy use and the main aspects of solar DH systems. It is followed by the methodology in
Section 4, which describes the main steps of the research and has several subsections: case study, weather conditions in Latvia, data processing, and multiple regression analyses. Next,
Section 5 shows the main results regarding booth data analyses and multiple regression analyses, and finally, the main findings are summarized in the Conclusions section in
Section 6.
4. Methodology
This study examines and analyzes the influencing factors of the large-scale solar collector field in the Baltic region, Latvia. Different research methods have been used in previous evaluations related to the use of solar energy, for example, transient system simulations [
12], multi-criteria analyses for decision-making [
14], and system dynamics modeling [
15]. However, the statistical analyses and regression analyses method was chosen here because accurate data on solar field operation are available. The use of regression analyses clearly shows the influencing factors that should be optimized in order to reach higher efficiency of the solar field.
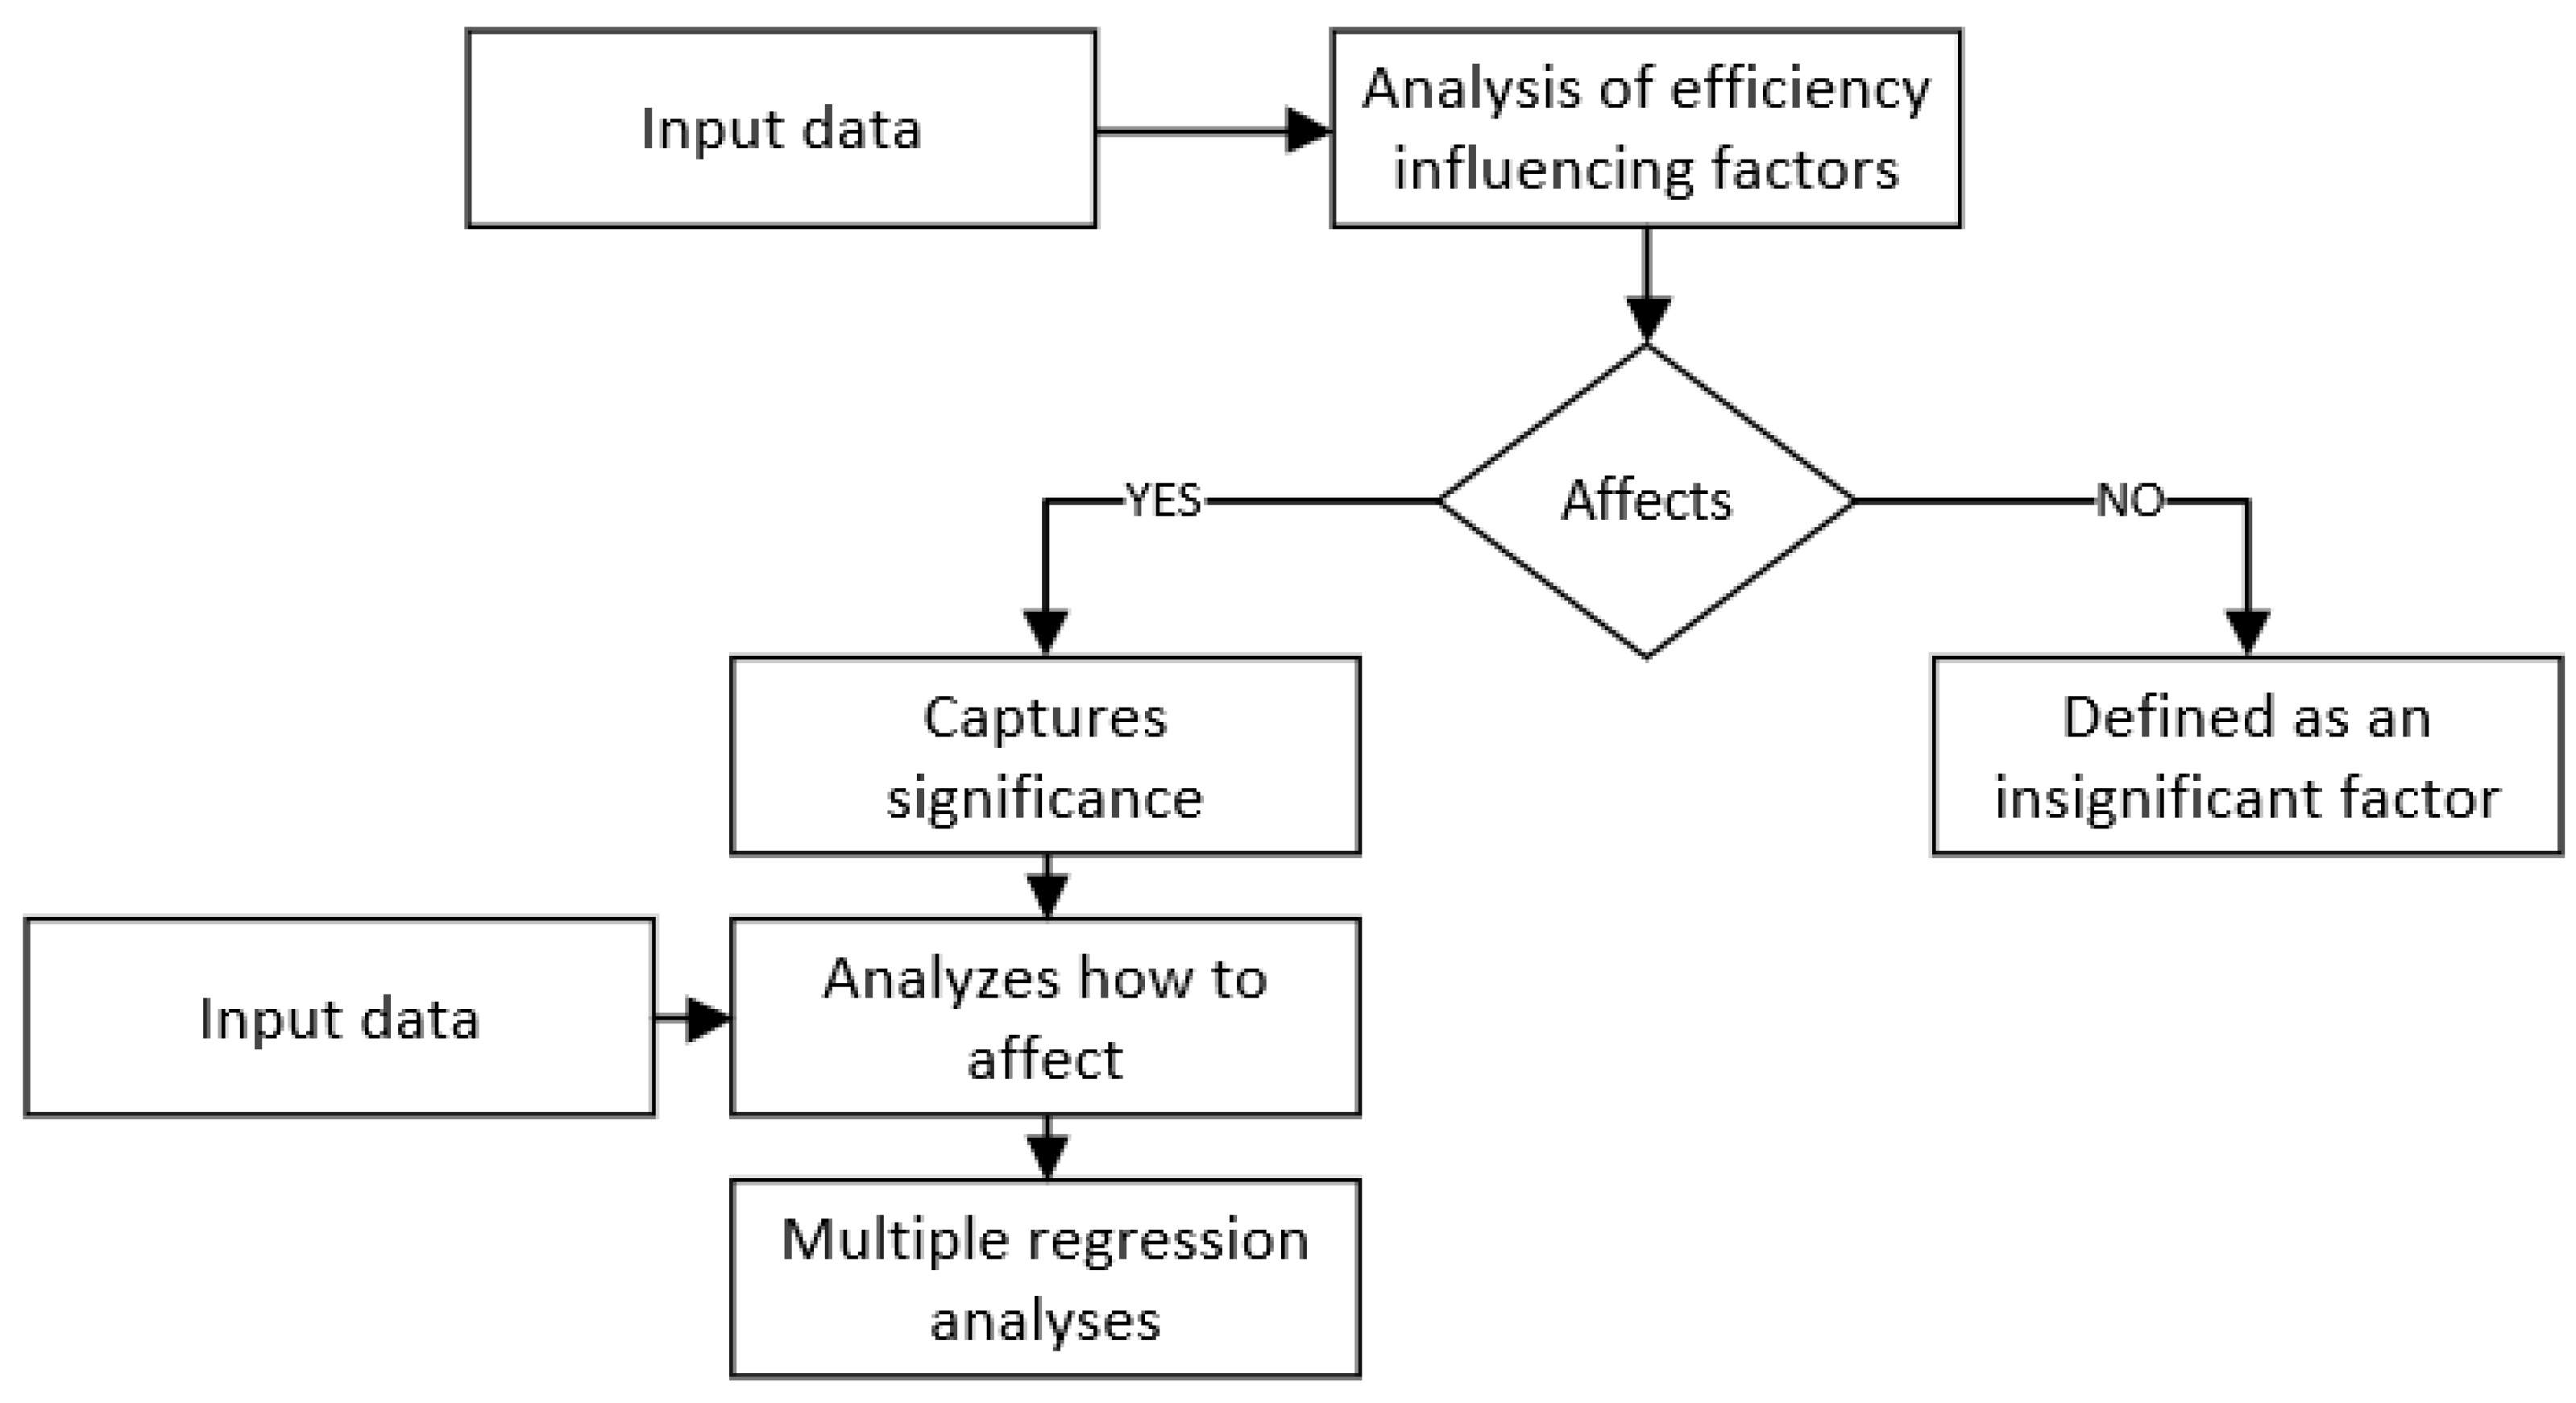
The study is divided into 3 parts: the first part is data collection and compilation, the second part is the analysis of influencing factors, and the third part is multi-regression analyses. The statistical data analysis was performed by using Statgraphics 19-X64 software. The steps are summarized in the diagram (
Figure 1).
In this research, three efficiency influencing factors of solar collectors were evaluated, apart from solar radiation as a direct influencing factor. These include the DH system’s return and supply temperature, the return flow temperature difference, and flow rate. These factors were chosen based on the analyzed results from previous studies of laboratory experiments and simulations. Other factors such as wind speed and the effect of solar collector angle were not included in the detailed assessment because these factors cannot be directly influenced by the DH company, as the system is already operating. Furthermore, the solar collector field is stationary, not equipped with a tracking system, and the placing angle is fixed, since it was calculated according to the geographical location of Latvia. These last two mentioned factors should be considered if the solar collector field were at the design stage.
4.1. Case Study
The study analyzed the solar collector field in a DH company in Salaspils, Latvia. The solar collector field with a storage tank was integrated into the existing system in the autumn of 2019. Therefore, the study analyzed the summer period of 2020.
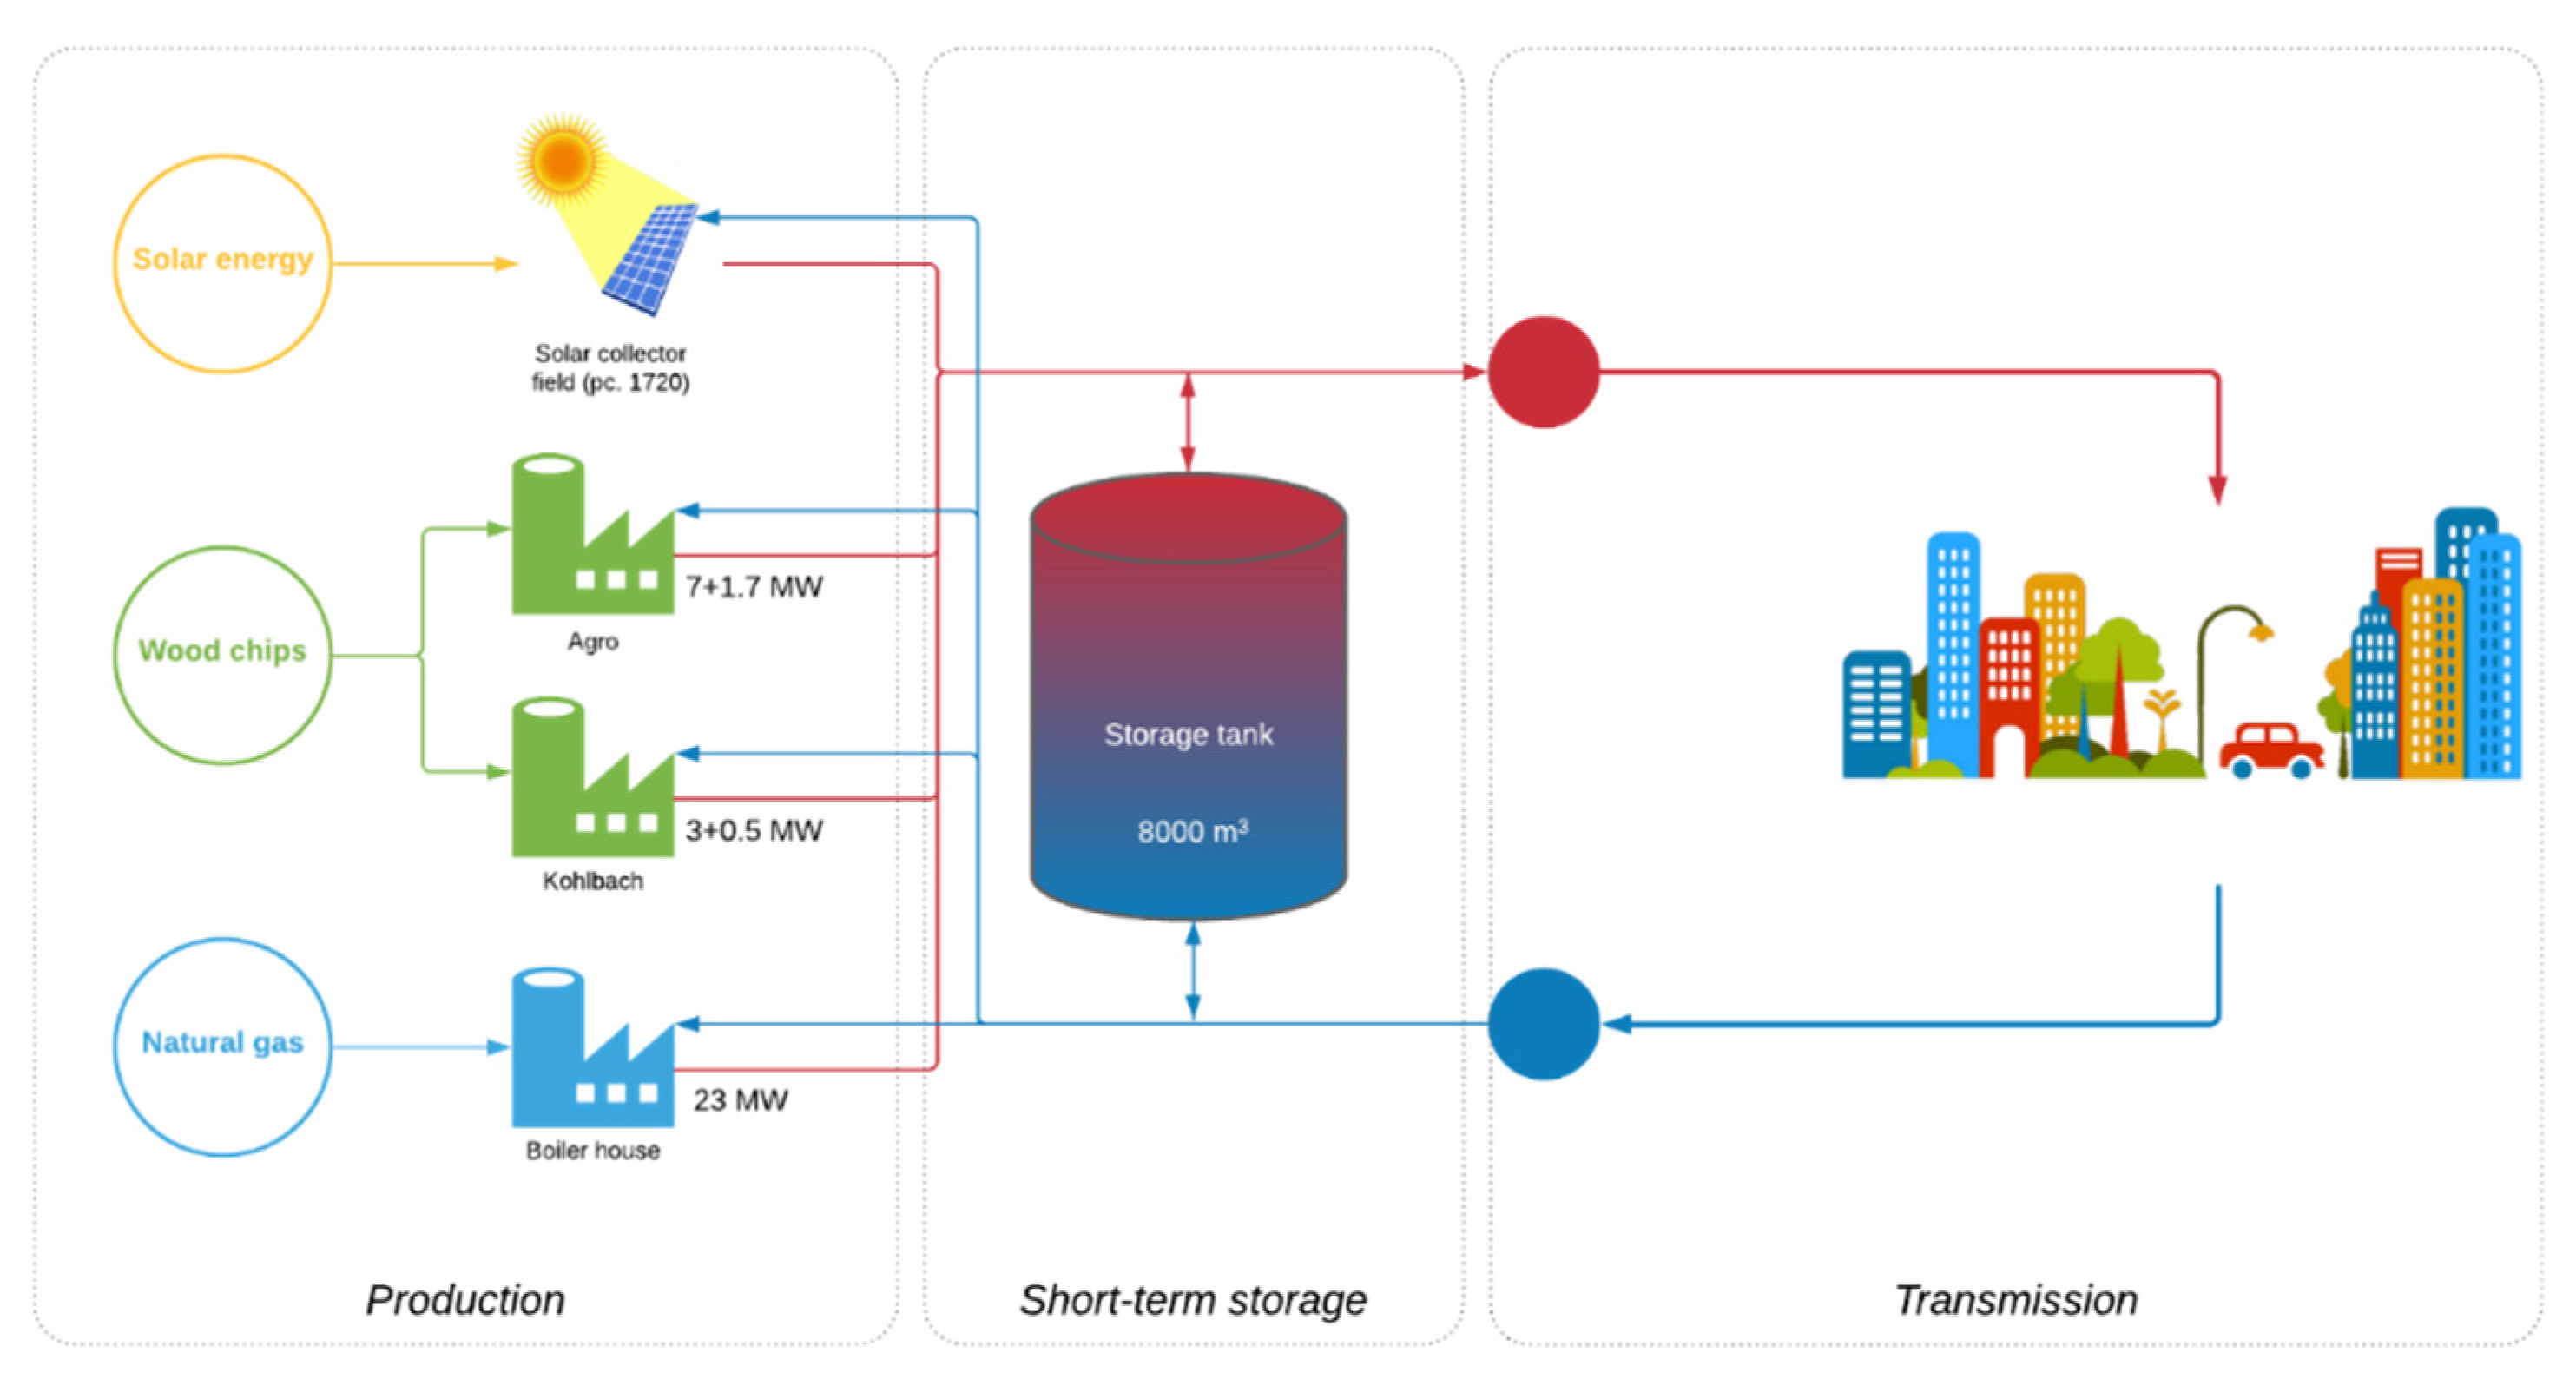
The heating plant consists of two wood chip boiler houses (7 MW + 1.68 MW flue gas condenser and 3 MW + 0.5 MW flue gas condenser) and 3 gas boilers (capacity of 10, 10, and 3 MW) for peak load coverage. The active area of the solar collector field is 21,672 m
2, and the total volume of the thermal energy storage tank is 8000 m
3. The overall heat production scheme is shown in
Figure 2. The main technical parameters of the solar field and DH system is summarized in
Table 1.
4.2. Weather Conditions in Latvia
The Baltic Sea surrounds Latvia; the border of Latvia is 1878 km long, with approximately 26.5% of which is a sea border. Consequently, there is a sea climate in a large part of Latvia, meaning the region experiences a smaller temperature amplitude throughout the year and more humid air. Based on information on the national meteorological database [
22], the following climatic conditions were observed in Latvia:
Average ambient air temperature: 8.2 °C in 2019 and 8.8 °C in 2020;
Highest ambient air temperature: 33 °C in 2019 and 30.8 °C in 2020;
Lowest ambient air temperature: −23 °C in 2019 and −10.3 °C in 2020;
Approximately 120 days with rainfall annually.
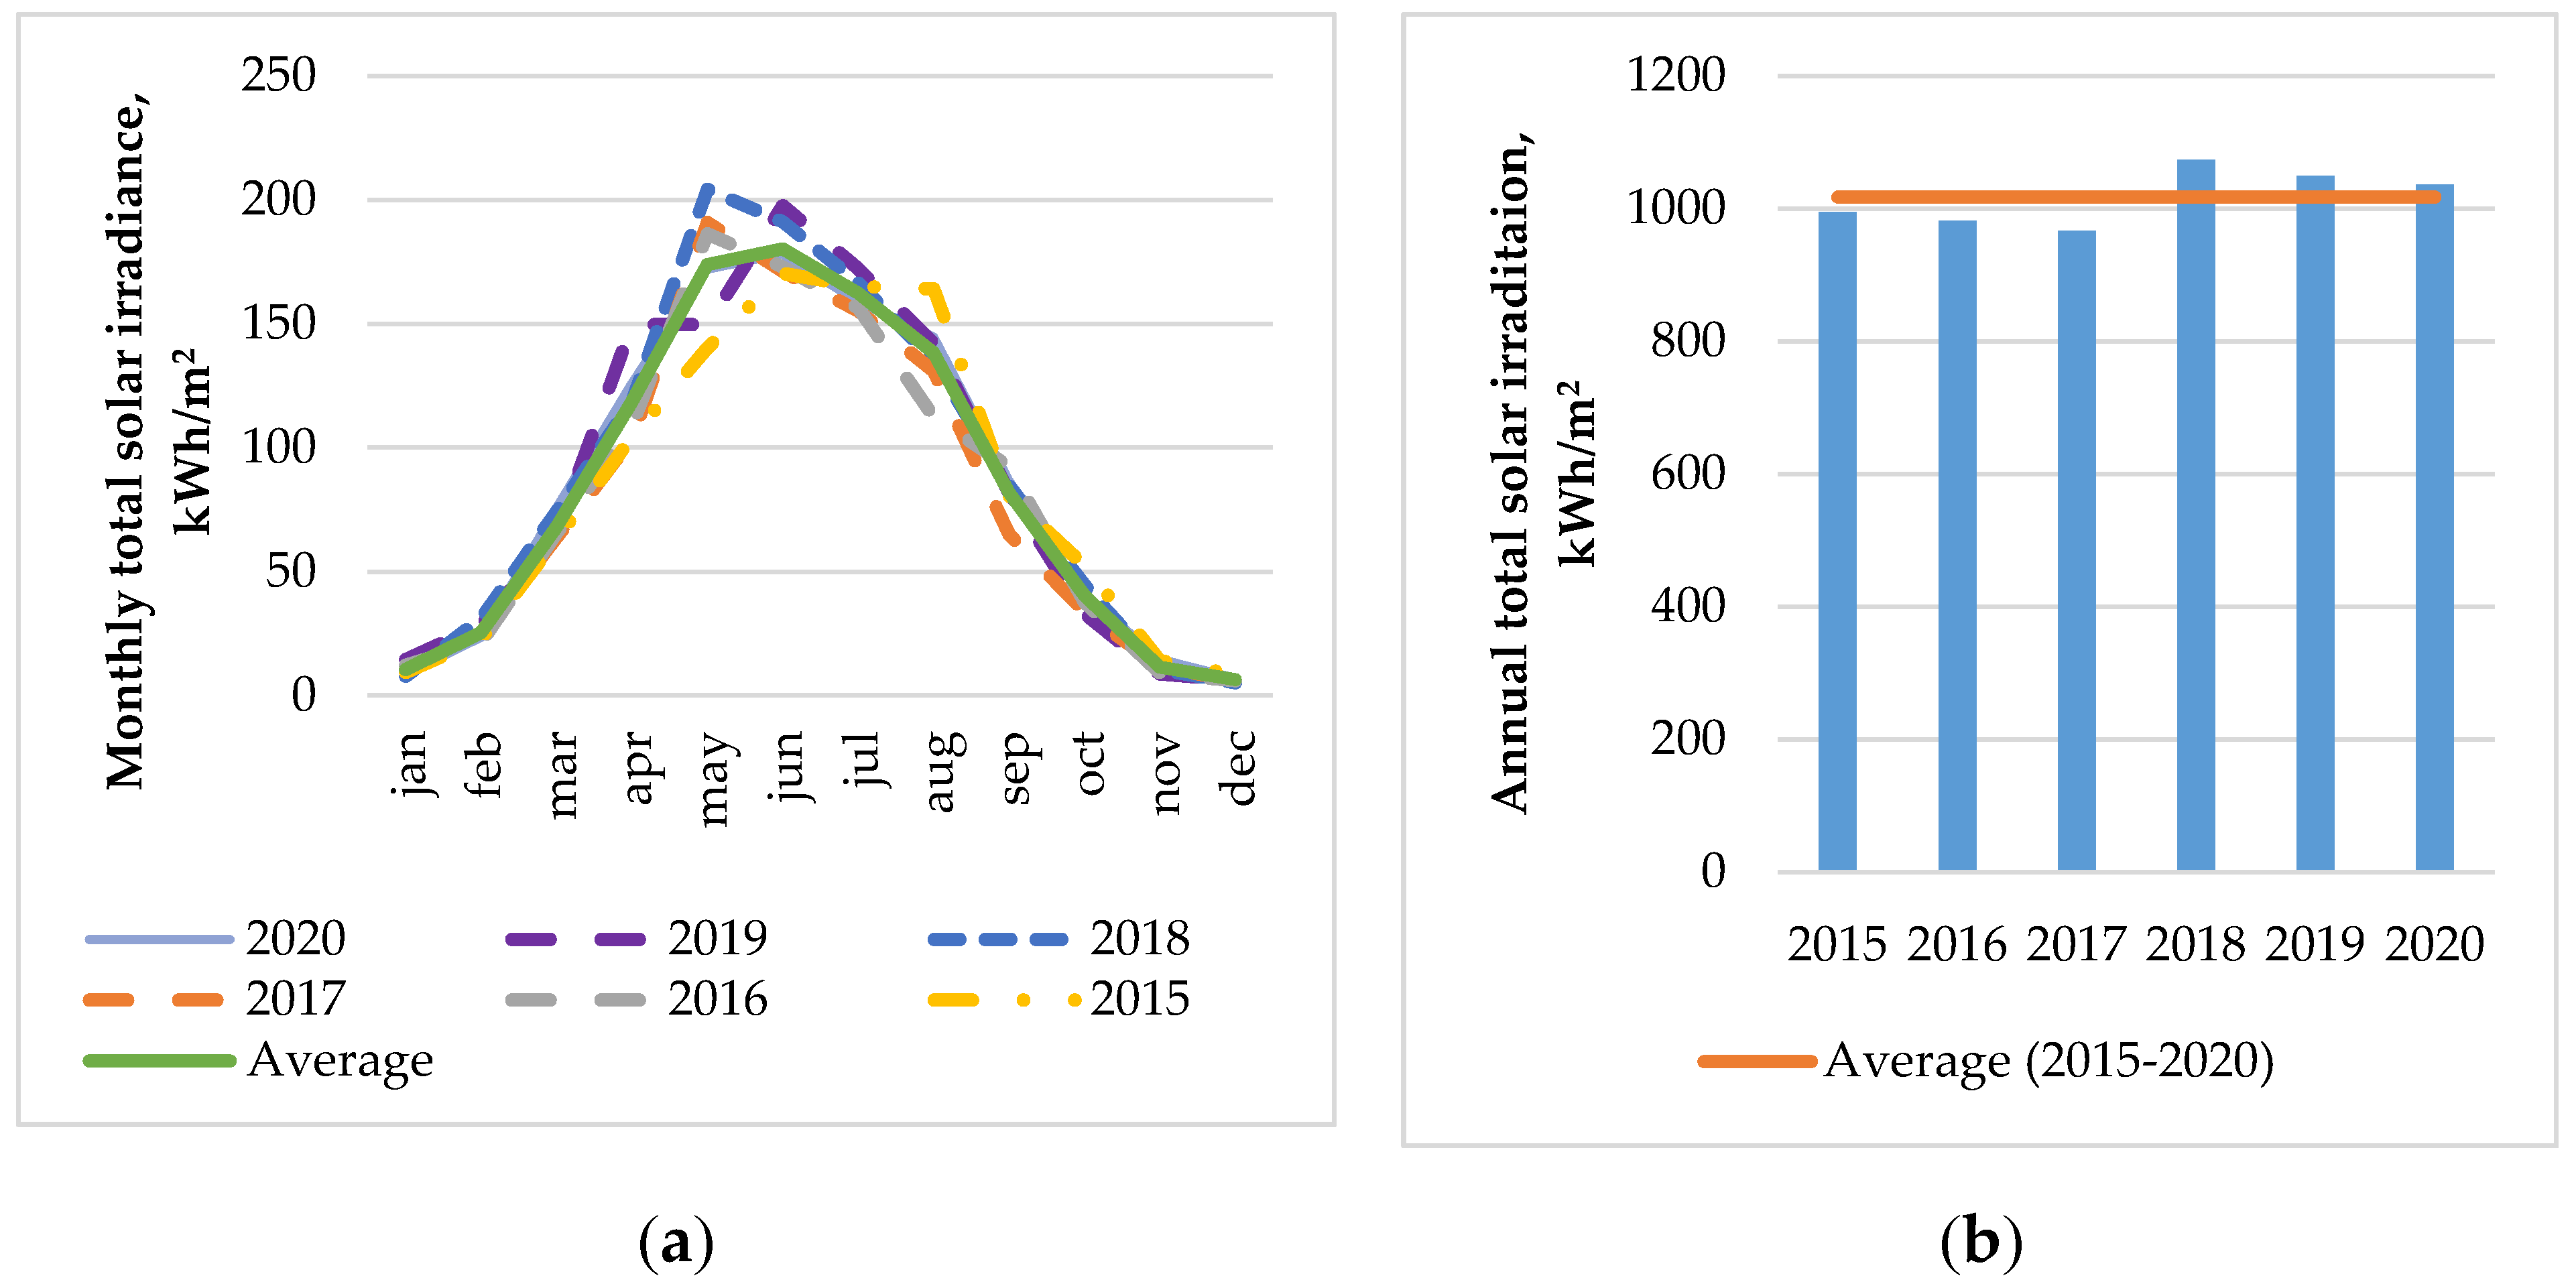
Several weather characteristics influence solar collector performance, such as solar radiation, the time when the sun shines, and the wind speed. Solar radiation intensity in Latvia is equal throughout the entire territory. However, it is most intense in the southern part of the country. The average annual solar radiation in Latvia is around 1000–1100 kWh/m
2 per year, which means that the sun shines approximately 1700 to 1900 h per year.
Figure 3a shows the monthly total solar radiation distribution during the year. On average, the maximal solar monthly radiation is reached in May (173 kWh/m
2) and is minimal in December, i.e., only 7 kWh/m
2.
The annual total solar radiance (
Figure 3b) is an average of 1017 kWh/m
2 in Riga. However, it differs from the yearly conditions. For example, the maximal annual total solar radiance was reached in 2018 (1074 kWh/m
2), but the lowest value was in 2017 (966 kWh/m
2).
The weather characteristics in Latvia cause considerable difficulties in planning the energy production rates and heat demand. The tendency of last few years shows that weather in Latvia is unpredictable. For example, in 2020, the highest ambient air temperature was 30.8 °C, but in 2021 the temperature has already reached 37 °C in some locations in Latvia; in 2020 the lowest ambient air temperature was −10.3 °C, but in 2021 it reached −31 °C. Therefore, the DH operators and heat producers should be ready for the different scenarios so that they can plan the necessary heat capacities, adapt to these temperature differences without putting equipment at risk, and prevent the damage caused by weather.
4.3. Data Processing
In this study, the efficiency of solar collectors was analyzed during the active production season, i.e., April, May, June, July, and August in 2020. In this particular system, the solar field starts to produce a valuable amount of thermal energy when solar radiation reaches at least 300 W/m
2. Consequently, to determine more precisely the effectiveness of solar collectors, the values from this mark were taken into account when calculating daily average solar radiation. When solar radiation is lower, the field of collectors is in the pre-heating phase, which is not considered. The time when solar radiation reaches 300 W/m
2 is variable during the season. For example, on sunny days in April, it can be up to 9 h, while up to 11 h in July. The solar collector field is equipped with several heat meters. The data are transformed according to Equation (1) to make it possible to compare the data with observed solar radiation:
where P
prod is the produced thermal energy by 1 m
2 solar collectors of the specific day (in W/m
2); Q
prod is the total produced thermal energy with solar collectors of the specific day (in MWh); S is the total active area of the solar collectors (in m
2); and t is the time when solar radiation has reached at least 300 W/m
2 (in h).
In this study, solar collector field efficiency is calculated according to Equation (2).
where E is the efficiency of solar collectors (in %) and P
rad is the average solar radiation to 1 m
2 of the surface of the specific day (in W/m
2).
Annual solar radiation is an absolute value that can be converted into thermal energy. Solar collector efficiency varies from approximately 17 to 77%. It is clear that solar collector efficiency and heat production depend on solar radiation, but solar radiation cannot be controlled, and thus this study further looks at how other DH operational parameters influence solar collector efficiency.
In the particular solar DH system, thermal energy production from solar energy is separated into two sides—primary and secondary. On the primary side, the heat carrier is circulated through solar collectors, from which it removes thermal energy. The primary and secondary side is connected through the heat exchanger. On the secondary side, heat is transferred to the accumulation tank, where thermal energy is stored until it is demanded.
The first analyzed parameter is the heat carrier flow in the primary side (primary flow). Specifically, we analyzed how the changes in primary flow impact solar collectors’ efficiency. An increased flow rate reduces the amount of produced thermal energy, and vice versa. This parameter is increased under several conditions:
Solar energy production needs to be reduced due to thermal energy storage limitations. This mainly occurs when there is a significant amount of thermal energy in the accumulation tank and when weather forecasts expect high solar irradiation in the following days.
In early spring and late autumn, solar collectors cannot reach a temperature equal to the heating network supply temperature in the DH system. However, to remove the load from the other heat sources and not to use other energy resources unnecessarily, heat energy is removed from the solar collectors, and the heat carrier is heated as high as possible.
The flow has been reversed in two cases, namely (a) if the accumulation tank has to be cooled down in periods of high solar irradiation and low heat demand, and (b) when the ambient air temperature is low in the winter, and the solar collector field must be heated to prevent the system from freezing.
Another related parameter is the temperature difference between the return and supply temperatures on the primary side. Boilerhouse operators can manage the temperature of the heat carrier and can remove thermal energy from the primary side. One possibility of reducing or improving those parameters is by managing how much flow reaches the heat exchanger. The regulation strategy of the heat carrier’s return temperature on the primary side is similar to the primary flow regulation described above.
The third analyzed parameter is the ambient air temperature. In Latvia, the daily average ambient air temperature can change even two or more times from day to day, so we considered this parameter important for further study.
4.4. Multiple Regression Analyses
To perform a statistical analysis of the data, we used the software Statgraphics Version 19.2.01. The software program for data analysis and visualization includes more than 230 data analysis functions. Multiple variable analyses and multiple regression analyses were used to determine the influence of variable factors on the solar collector field efficiency.
5. Results
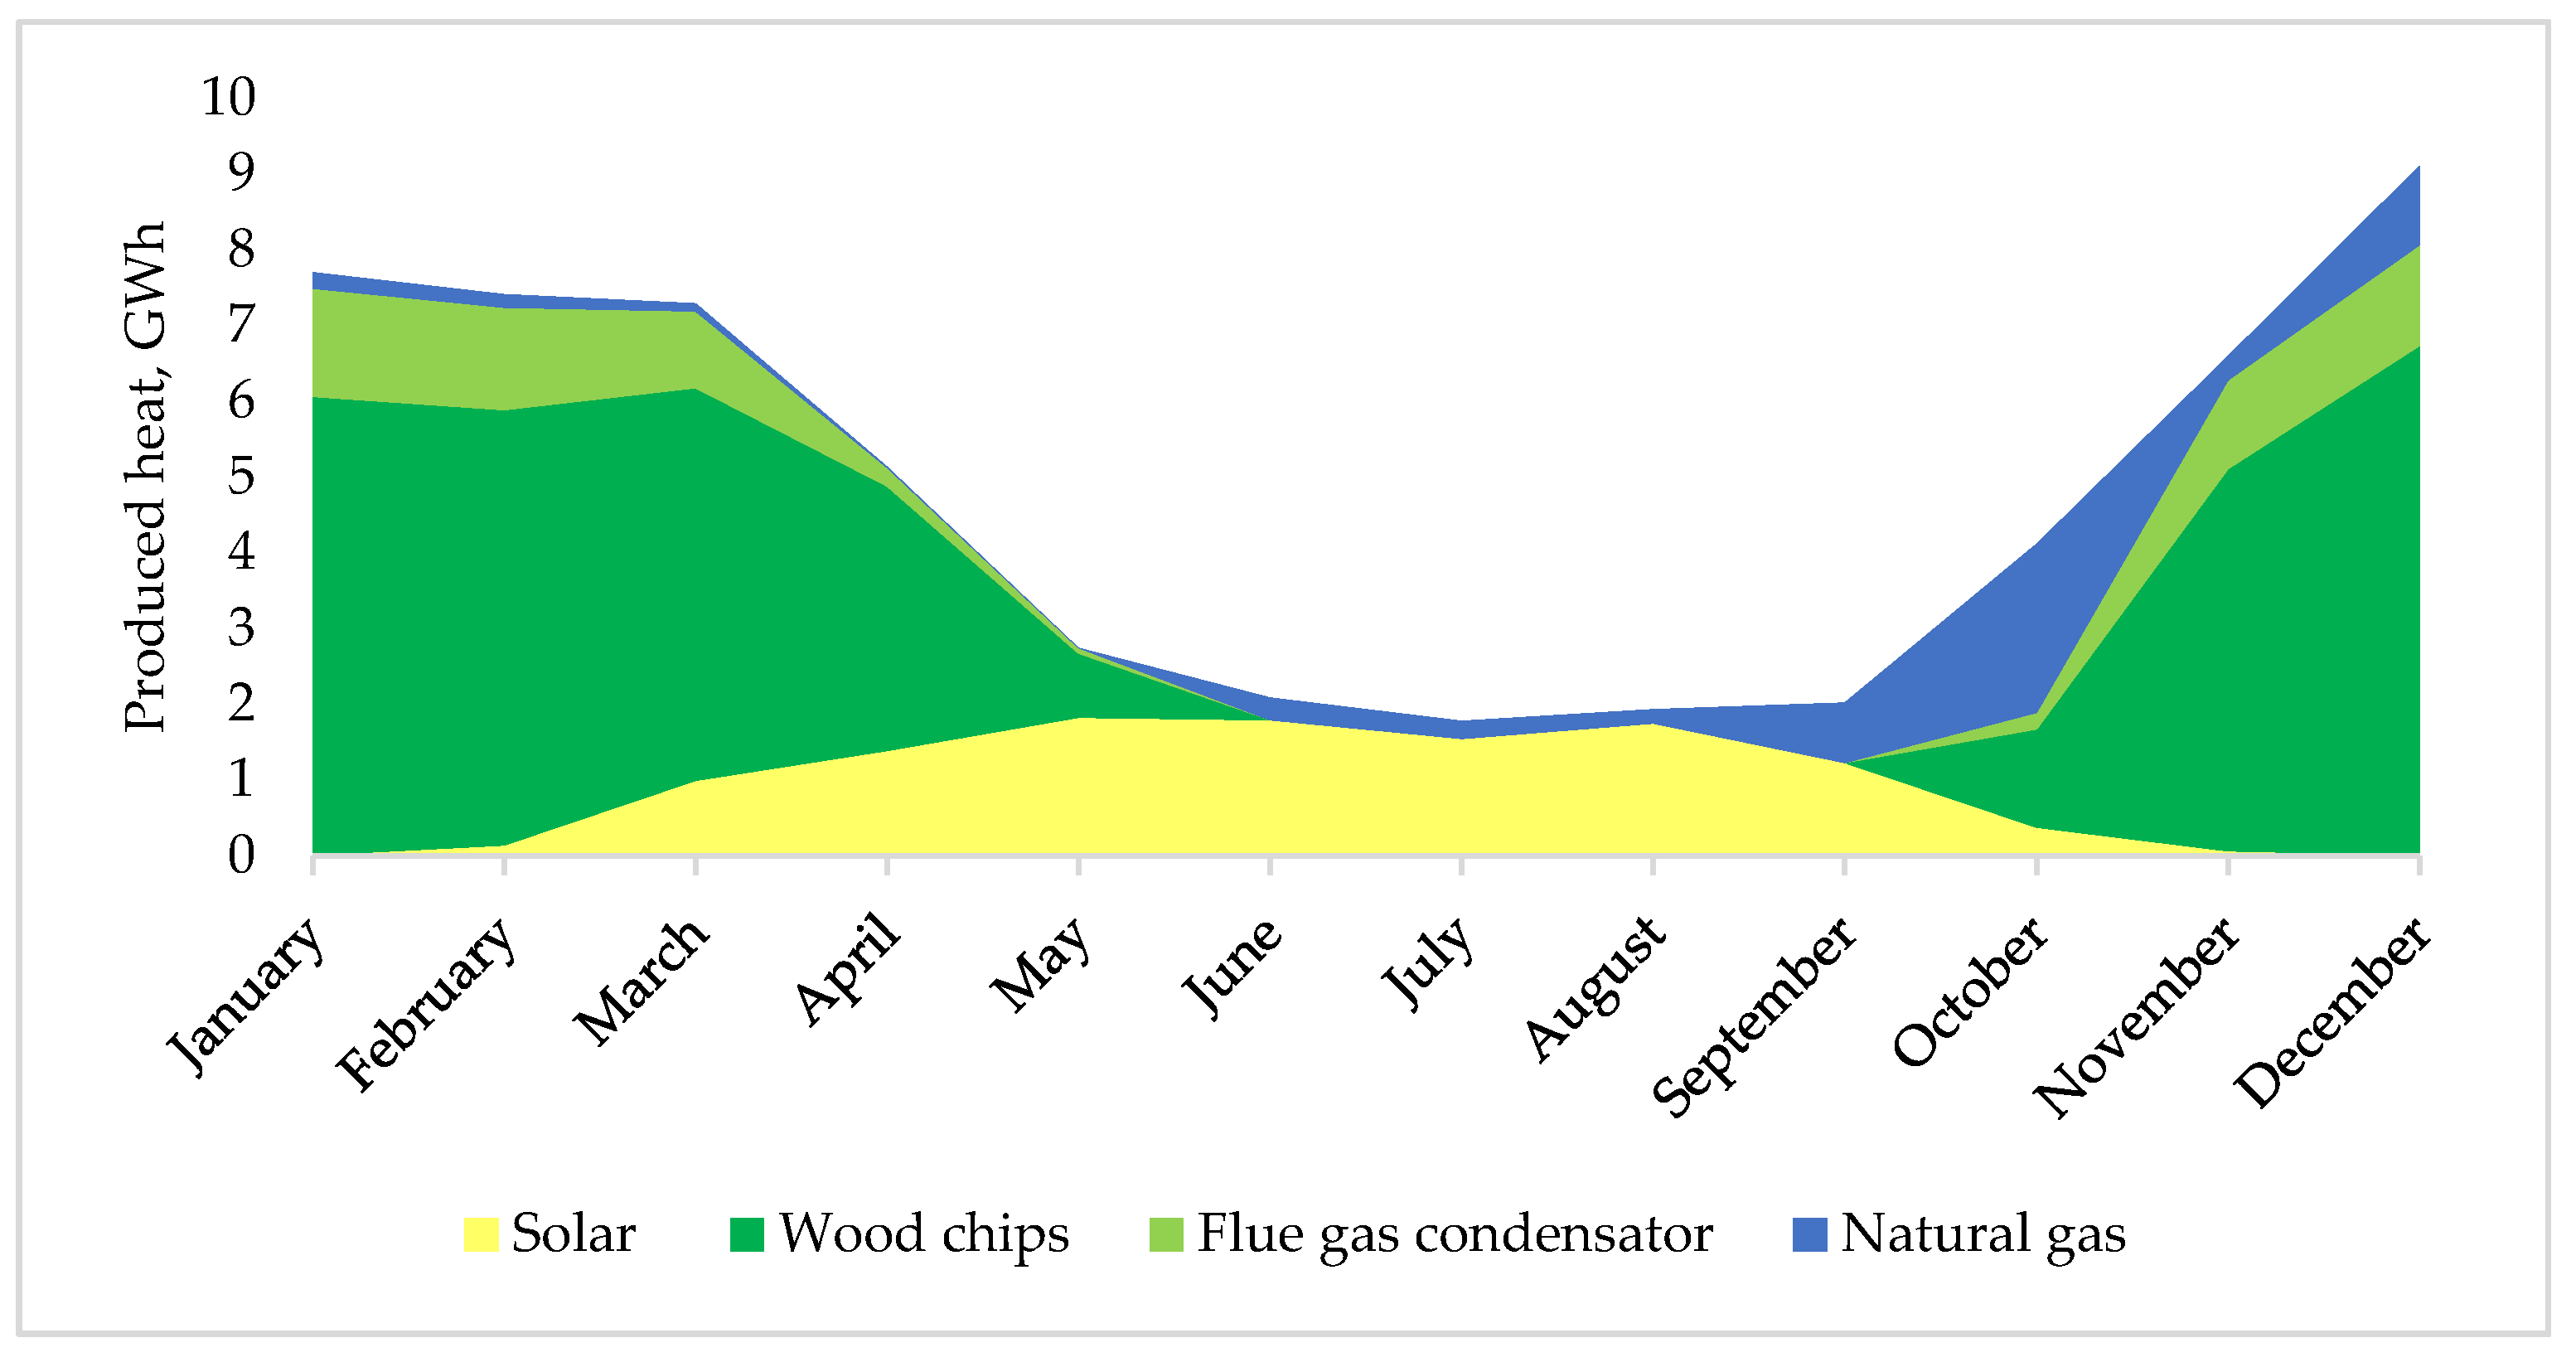
When installing the system, it was planned to cover 100% of the demand with solar collectors in the summer months. However, in the summer months of 2020, it covered 90% of the demand, while the rest was produced by using a natural gas boiler. The overview of actual heat production by primary energy source in 2020 can be seen in
Figure 4. It is therefore essential to investigate whether there is room for improvement.
The data on solar heat production was processed in two steps. In the first step, the four influencing factors on the efficiency of the solar collector are evaluated separately. The considered factors were return temperature, flow rate, supply, and return temperature difference, and ambient temperature.
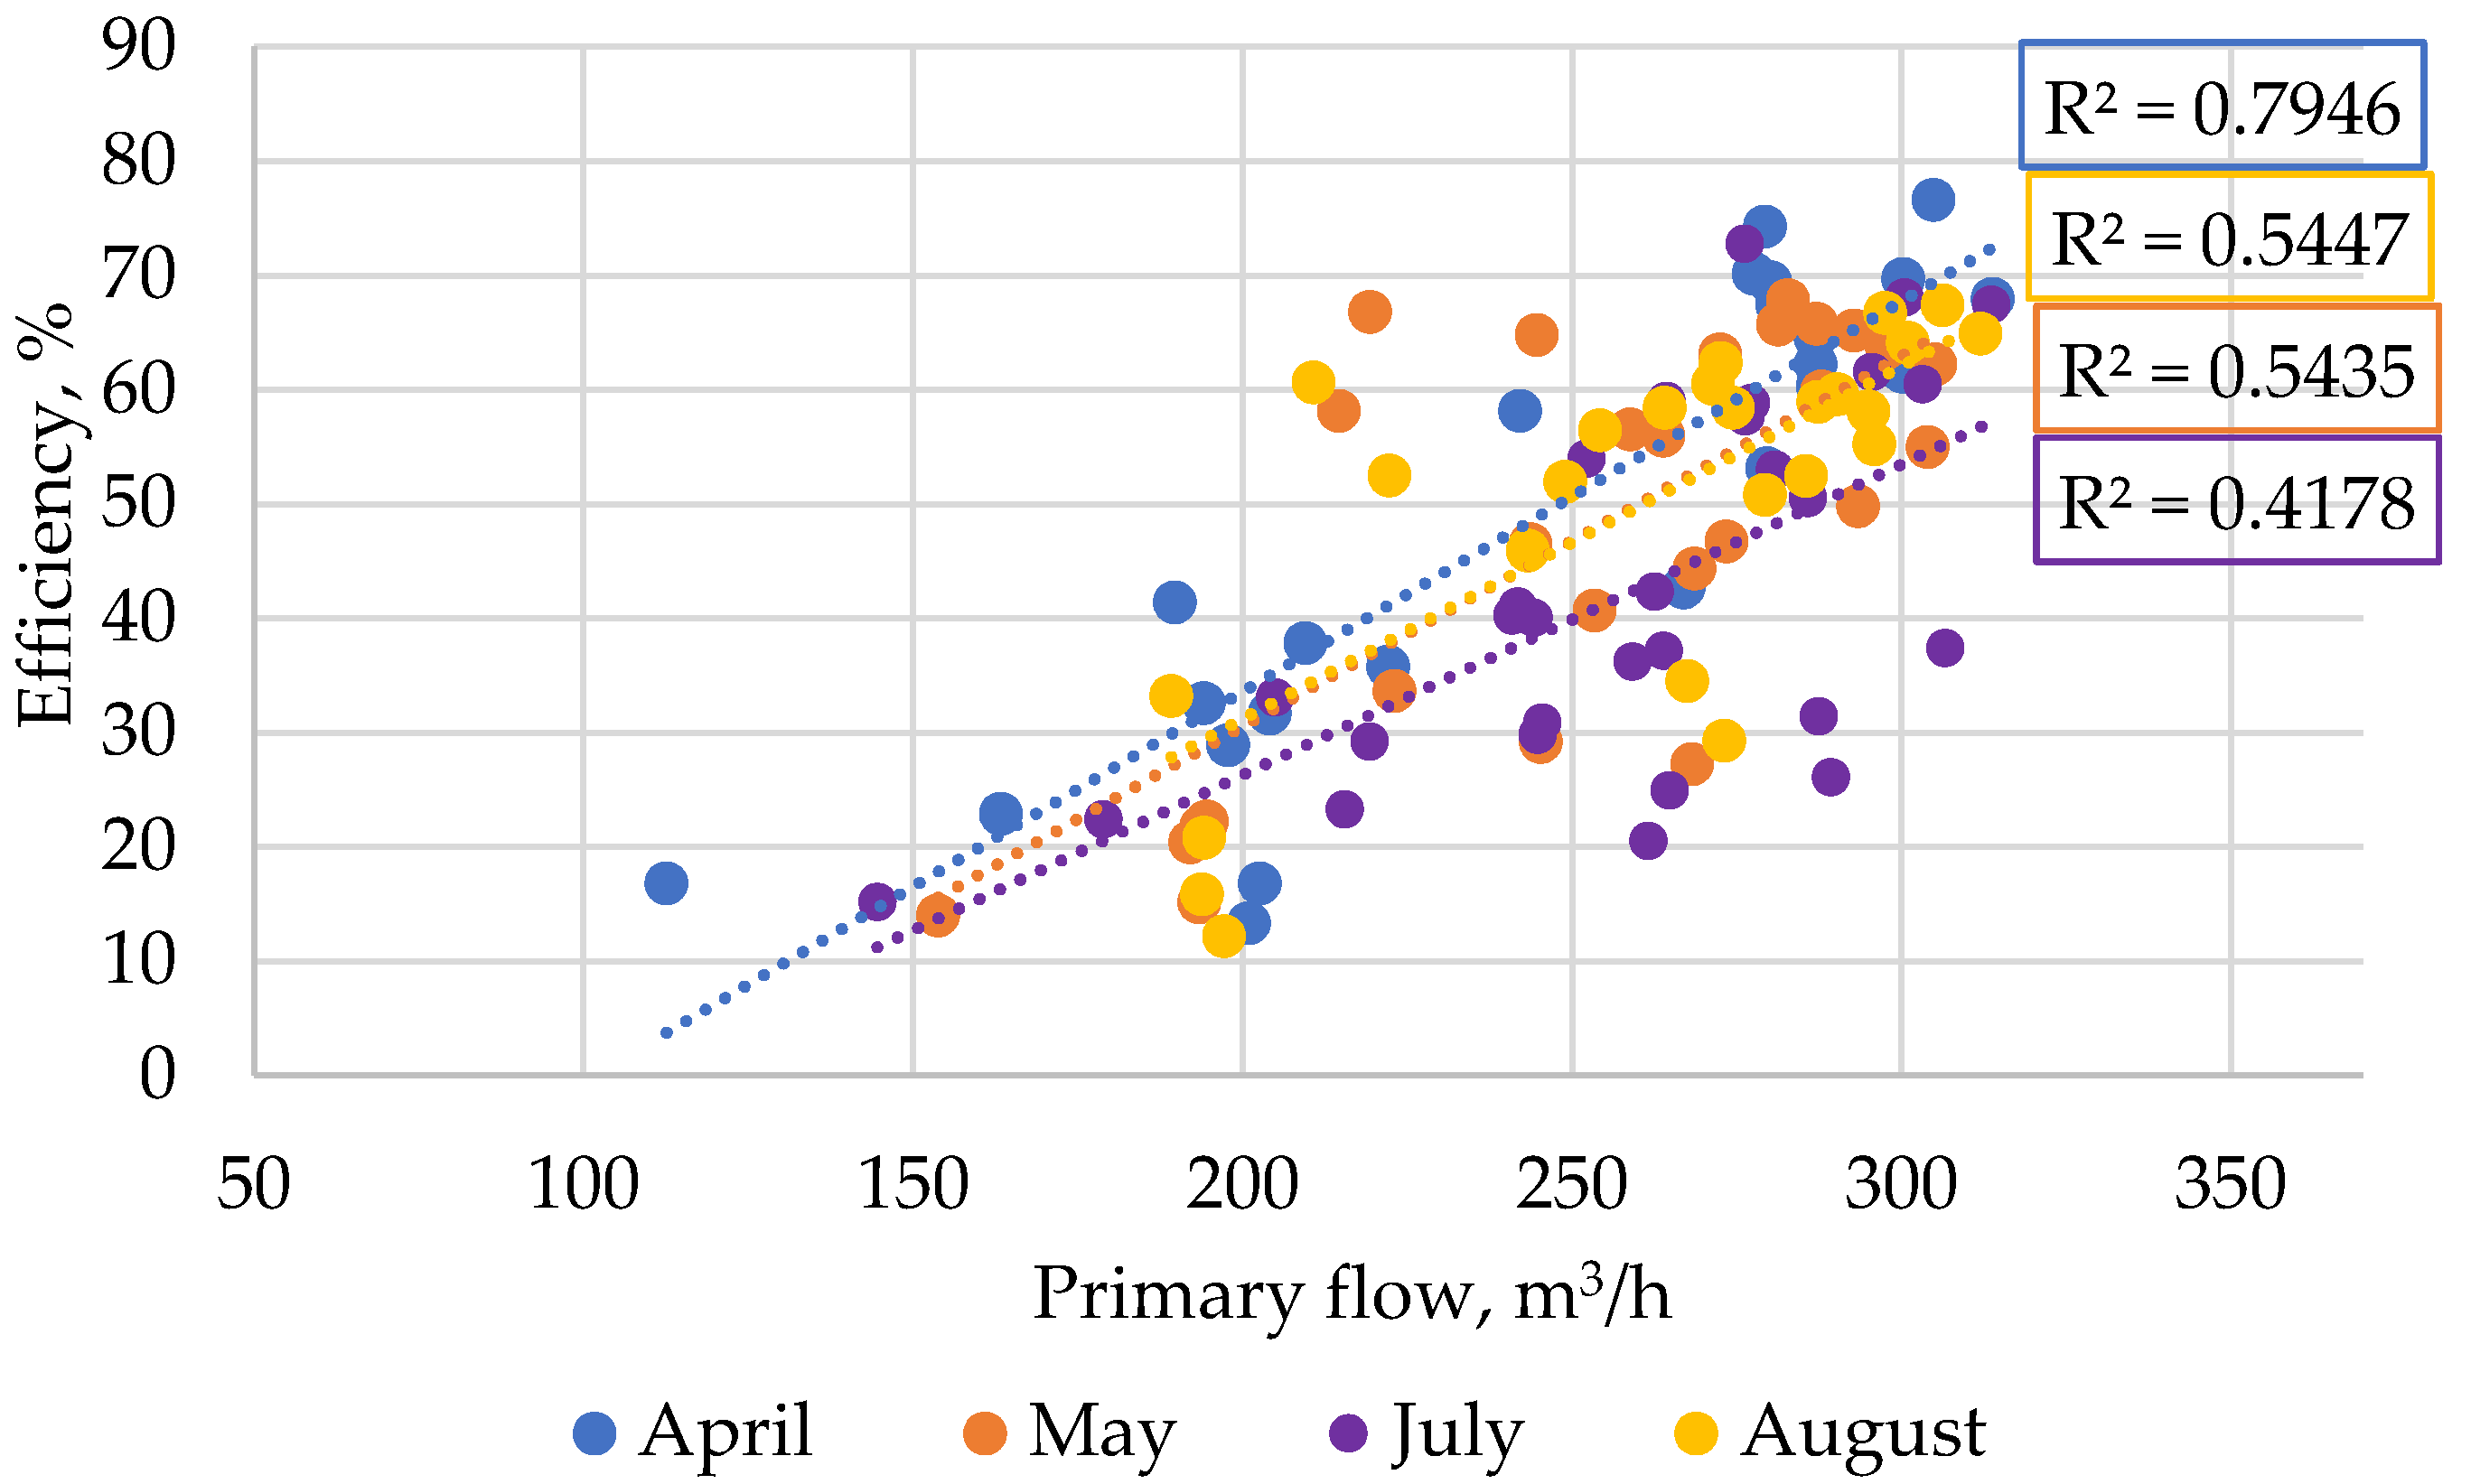
We first assessed how the primary flow changes the efficiency of the solar collector field. The obtained results show that the higher the flow, the higher the efficiency. The obtained results of the regression analyses are summarized in
Figure 5.
The flow depends on the solar radiation, and it is adjusted to reach the required supply temperature. If the solar field produces more thermal energy than the actual heat demand, the excess heat is stored in the accumulation tank.
When comparing the data of four analyzed months, the highest efficiency dependence on the flow rate can be observed in April (correlation coefficient = 0.7946). Due to a higher heat demand in April than in the summer period, there is still space heating necessary. The efficiency is reduced when there are many sunny days and no demand is forecasted, and the storage tank is full. Efficiency reduction is ensured by increasing the inlet temperature of the solar collector, and as a result, the secondary side of the water in the inlet mixes with the flow of warm water. Accordingly, in July, the regression coefficient is about 0.41. As can be seen from the dotted points in the graph, the efficiency was reduced at these points and therefore was less dependent on the primary flow rate. By optimizing the system, it is possible to increase efficiency and obtain more solar energy. The optimization of the primary flow rate is also necessary due to the high power consumption of circulation pumps. The obtained data analyses show that it was possible to reach higher solar efficiency with a lower flow rate in some days. Therefore, further investigation could focus on the specific days with higher solar field efficiency and lower primary flow rates.
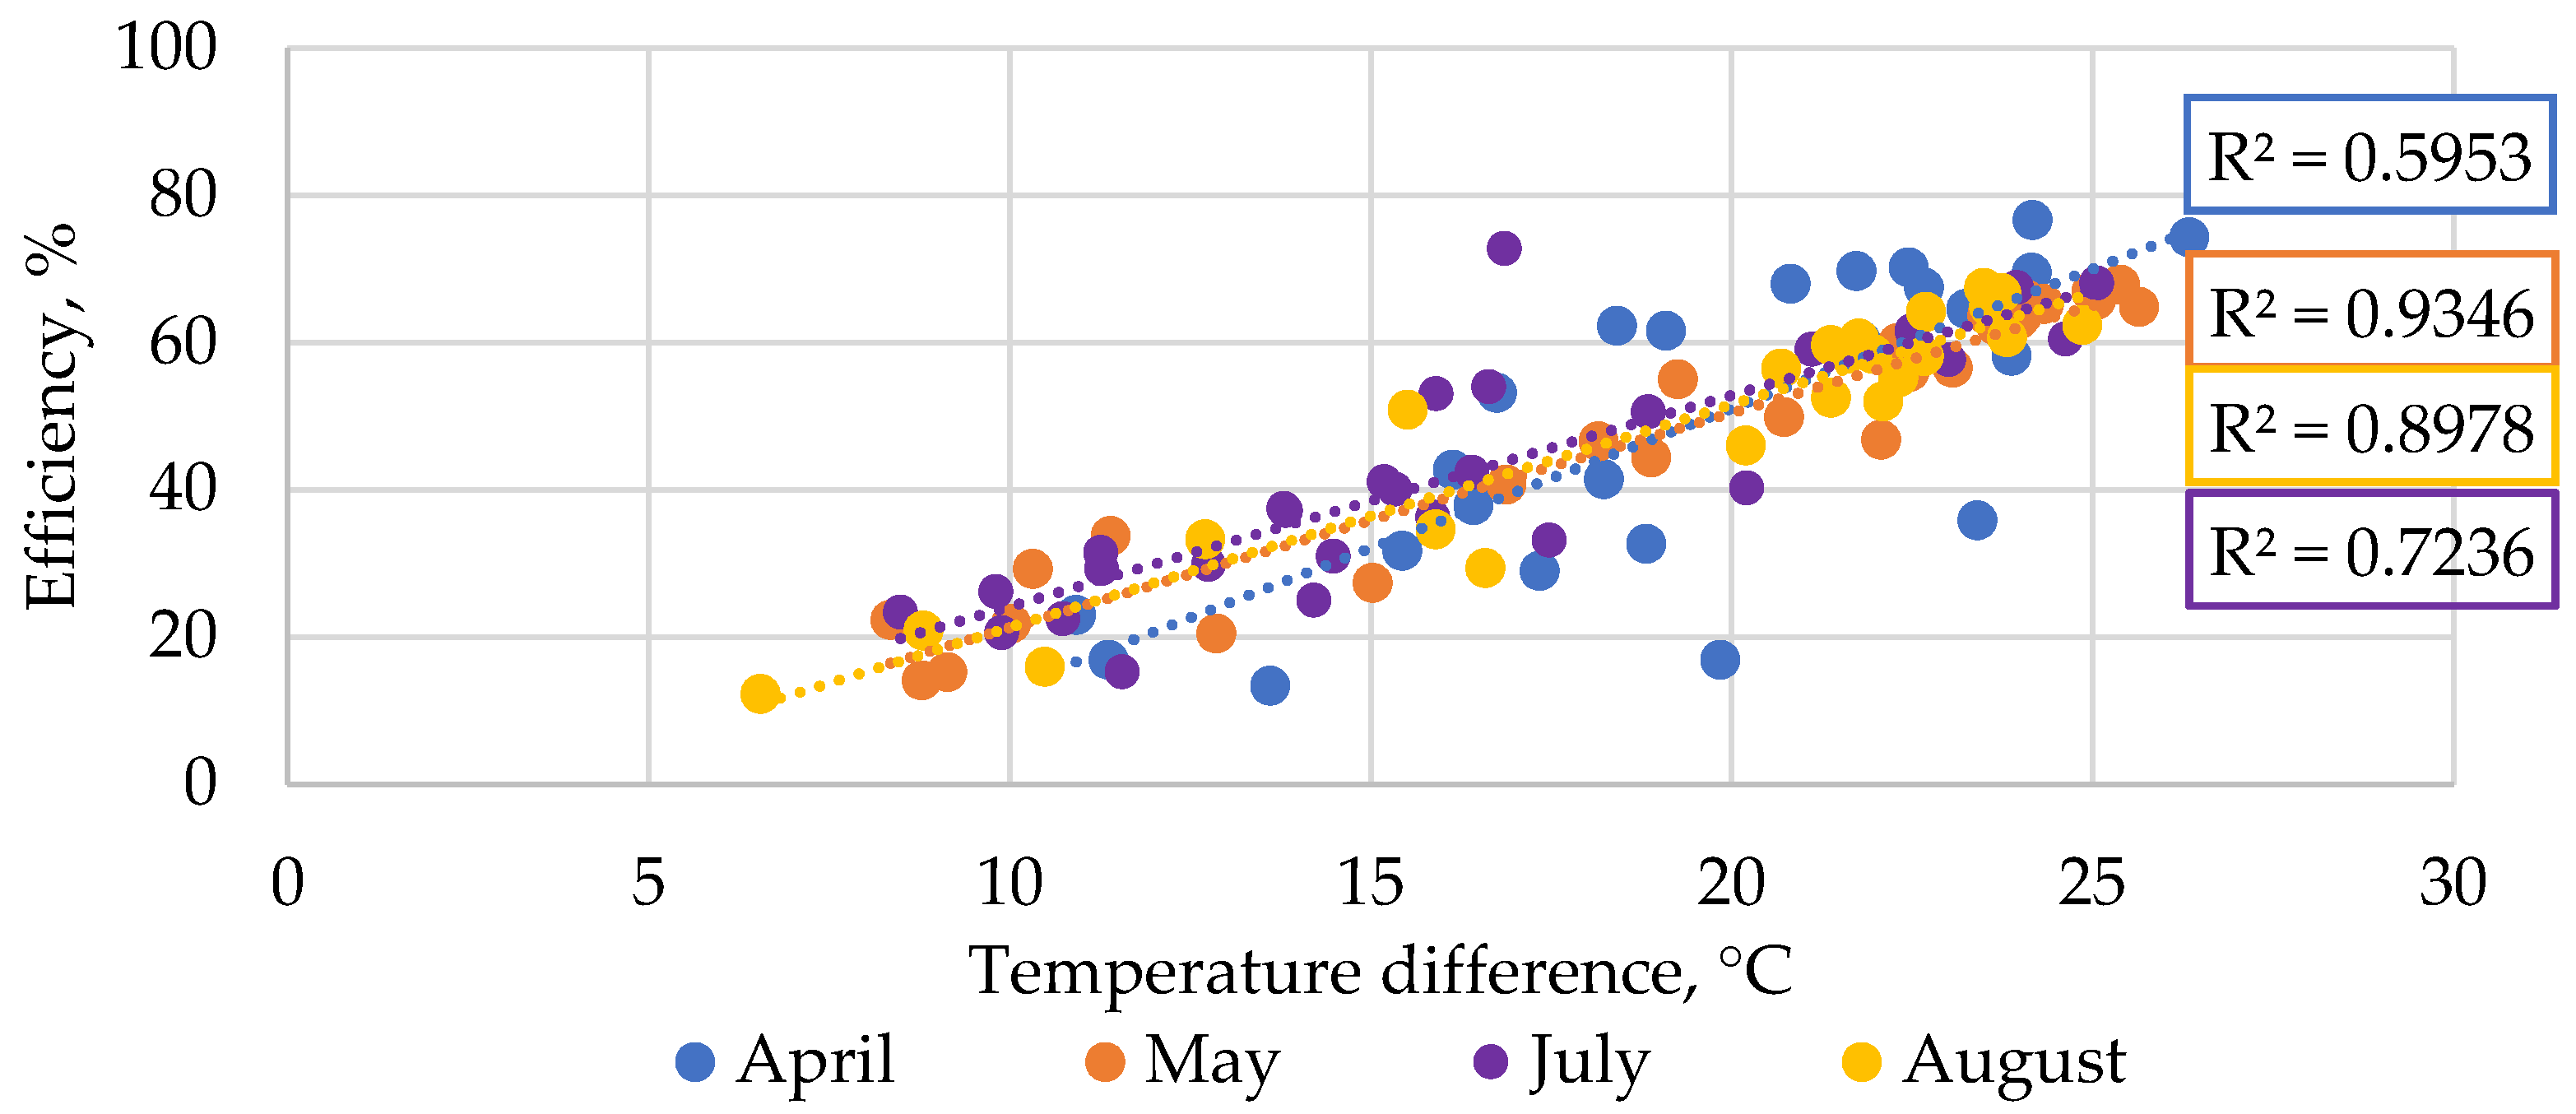
The second influencing factor in this case study is the supply and return temperature difference. The obtained regression analysis data are shown in
Figure 6.
Results show that the higher the temperature difference, the higher the efficiency of the solar collector. The inlet temperature depends on the return temperature of the heating network, but the set point regulates the outlet temperature from the solar field. The highest efficiency regression coefficient with the flow rate is in April, but at the same time, a lower dependence on the temperature difference was identified. This clearly shows that quantitative heating network regulation occurs in the spring, while qualitative regulation occurs in the summer. Results show that further optimization could be performed to choose the suitable heating network regulation mechanism by seeking the equilibrium between pumping costs, heat losses, and solar field efficiency.
The literature states that outdoor air temperature is an influencing factor [
4] because it affects the flow rates and heat carrier temperatures. The average daily outdoor air temperature fluctuations were from +1.7 to +12.1 °C. From the
Figure 6. it can be seen that in April, there are days with the highest solar field efficiency because the temperature differences can be maintained higher. Moreover, in July, some points could be optimized. The set temperature (the temperature of the heat carrier before the heat exchanger) was changed based on weather forecasts for the coming days. When days with higher solar irradiation were upcoming, this set point was increased, thus decreasing solar collector efficiency. Future studies should consider the impact of accurate weather forecasts on the overall solar field performance. It can be seen from the data analysis that the changing set temperature causes fluctuating conditions of solar energy production. The highest correlation coefficient is in May (R
2 = 0.93) because the solar radiation was stable, and the settings of the solar field were not changed.
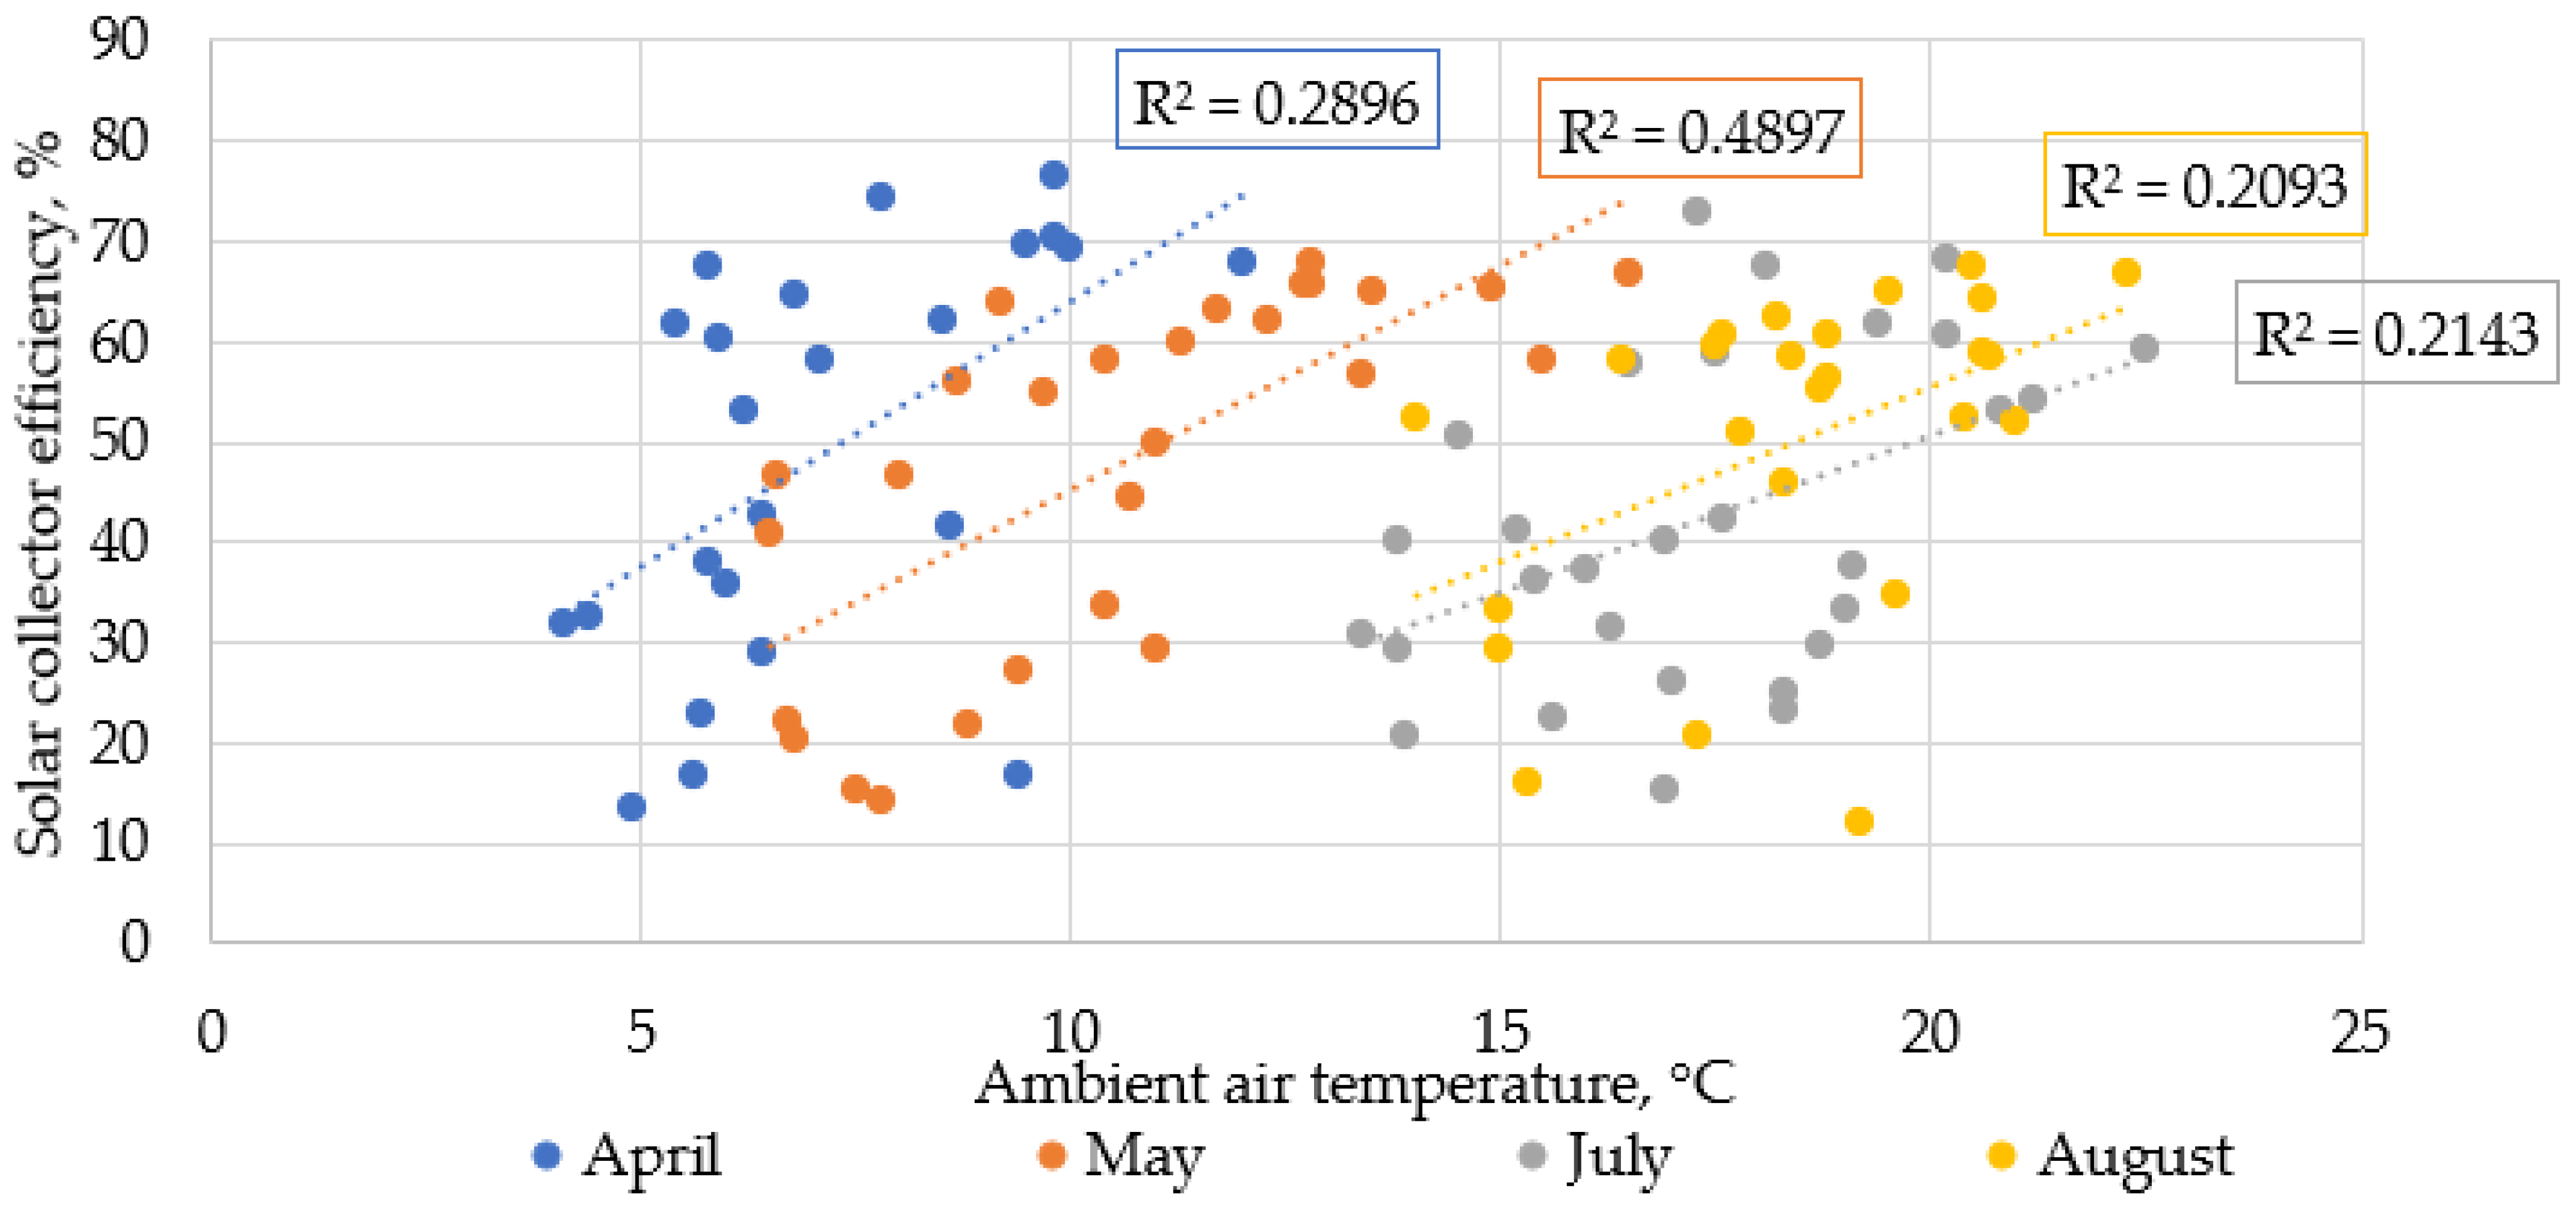
The third factor analyzed is the effect of ambient air temperature changes on the solar field efficiency (
Figure 7).
It can be clearly seen that the average daily outdoor air temperature in Latvia from April to August is in the range from + 1.7 to + 22.3 °C. Compared to other influencing factors defined as significant, the ambient air temperature is an ancillary factor that may explain the deviation of the significant factors. However, comparing all the months, the highest outdoor temperature and solar field efficiency correlation was observed in May (R2 = 0.4897). Therefore, the outdoor air temperature is not a significant factor. However, it influences the return temperature from the consumers and thus the temperature difference.
Multiple regression analyses using Statgraphics functions were carried out to determine the relationship between the analyzed variables. The output shows the results of fitting a multiple linear regression model to describe the relationship between efficiency and three independent variables. The equation of the fitted model is:
where
w1 is primary flows, ∆t is the temperature difference, and t
a is the ambient air temperature.
According to the obtained equation, by changing the influencing factors, the efficiency of the solar collector can be calculated. Therefore, this equation can be used to plan solar field performance and forecast heat production. When planning the system’s operation, the main task is to reach the highest possible efficiency during periods when there is a higher demand and maintain the efficiency when there is no more reserve in the storage tank.
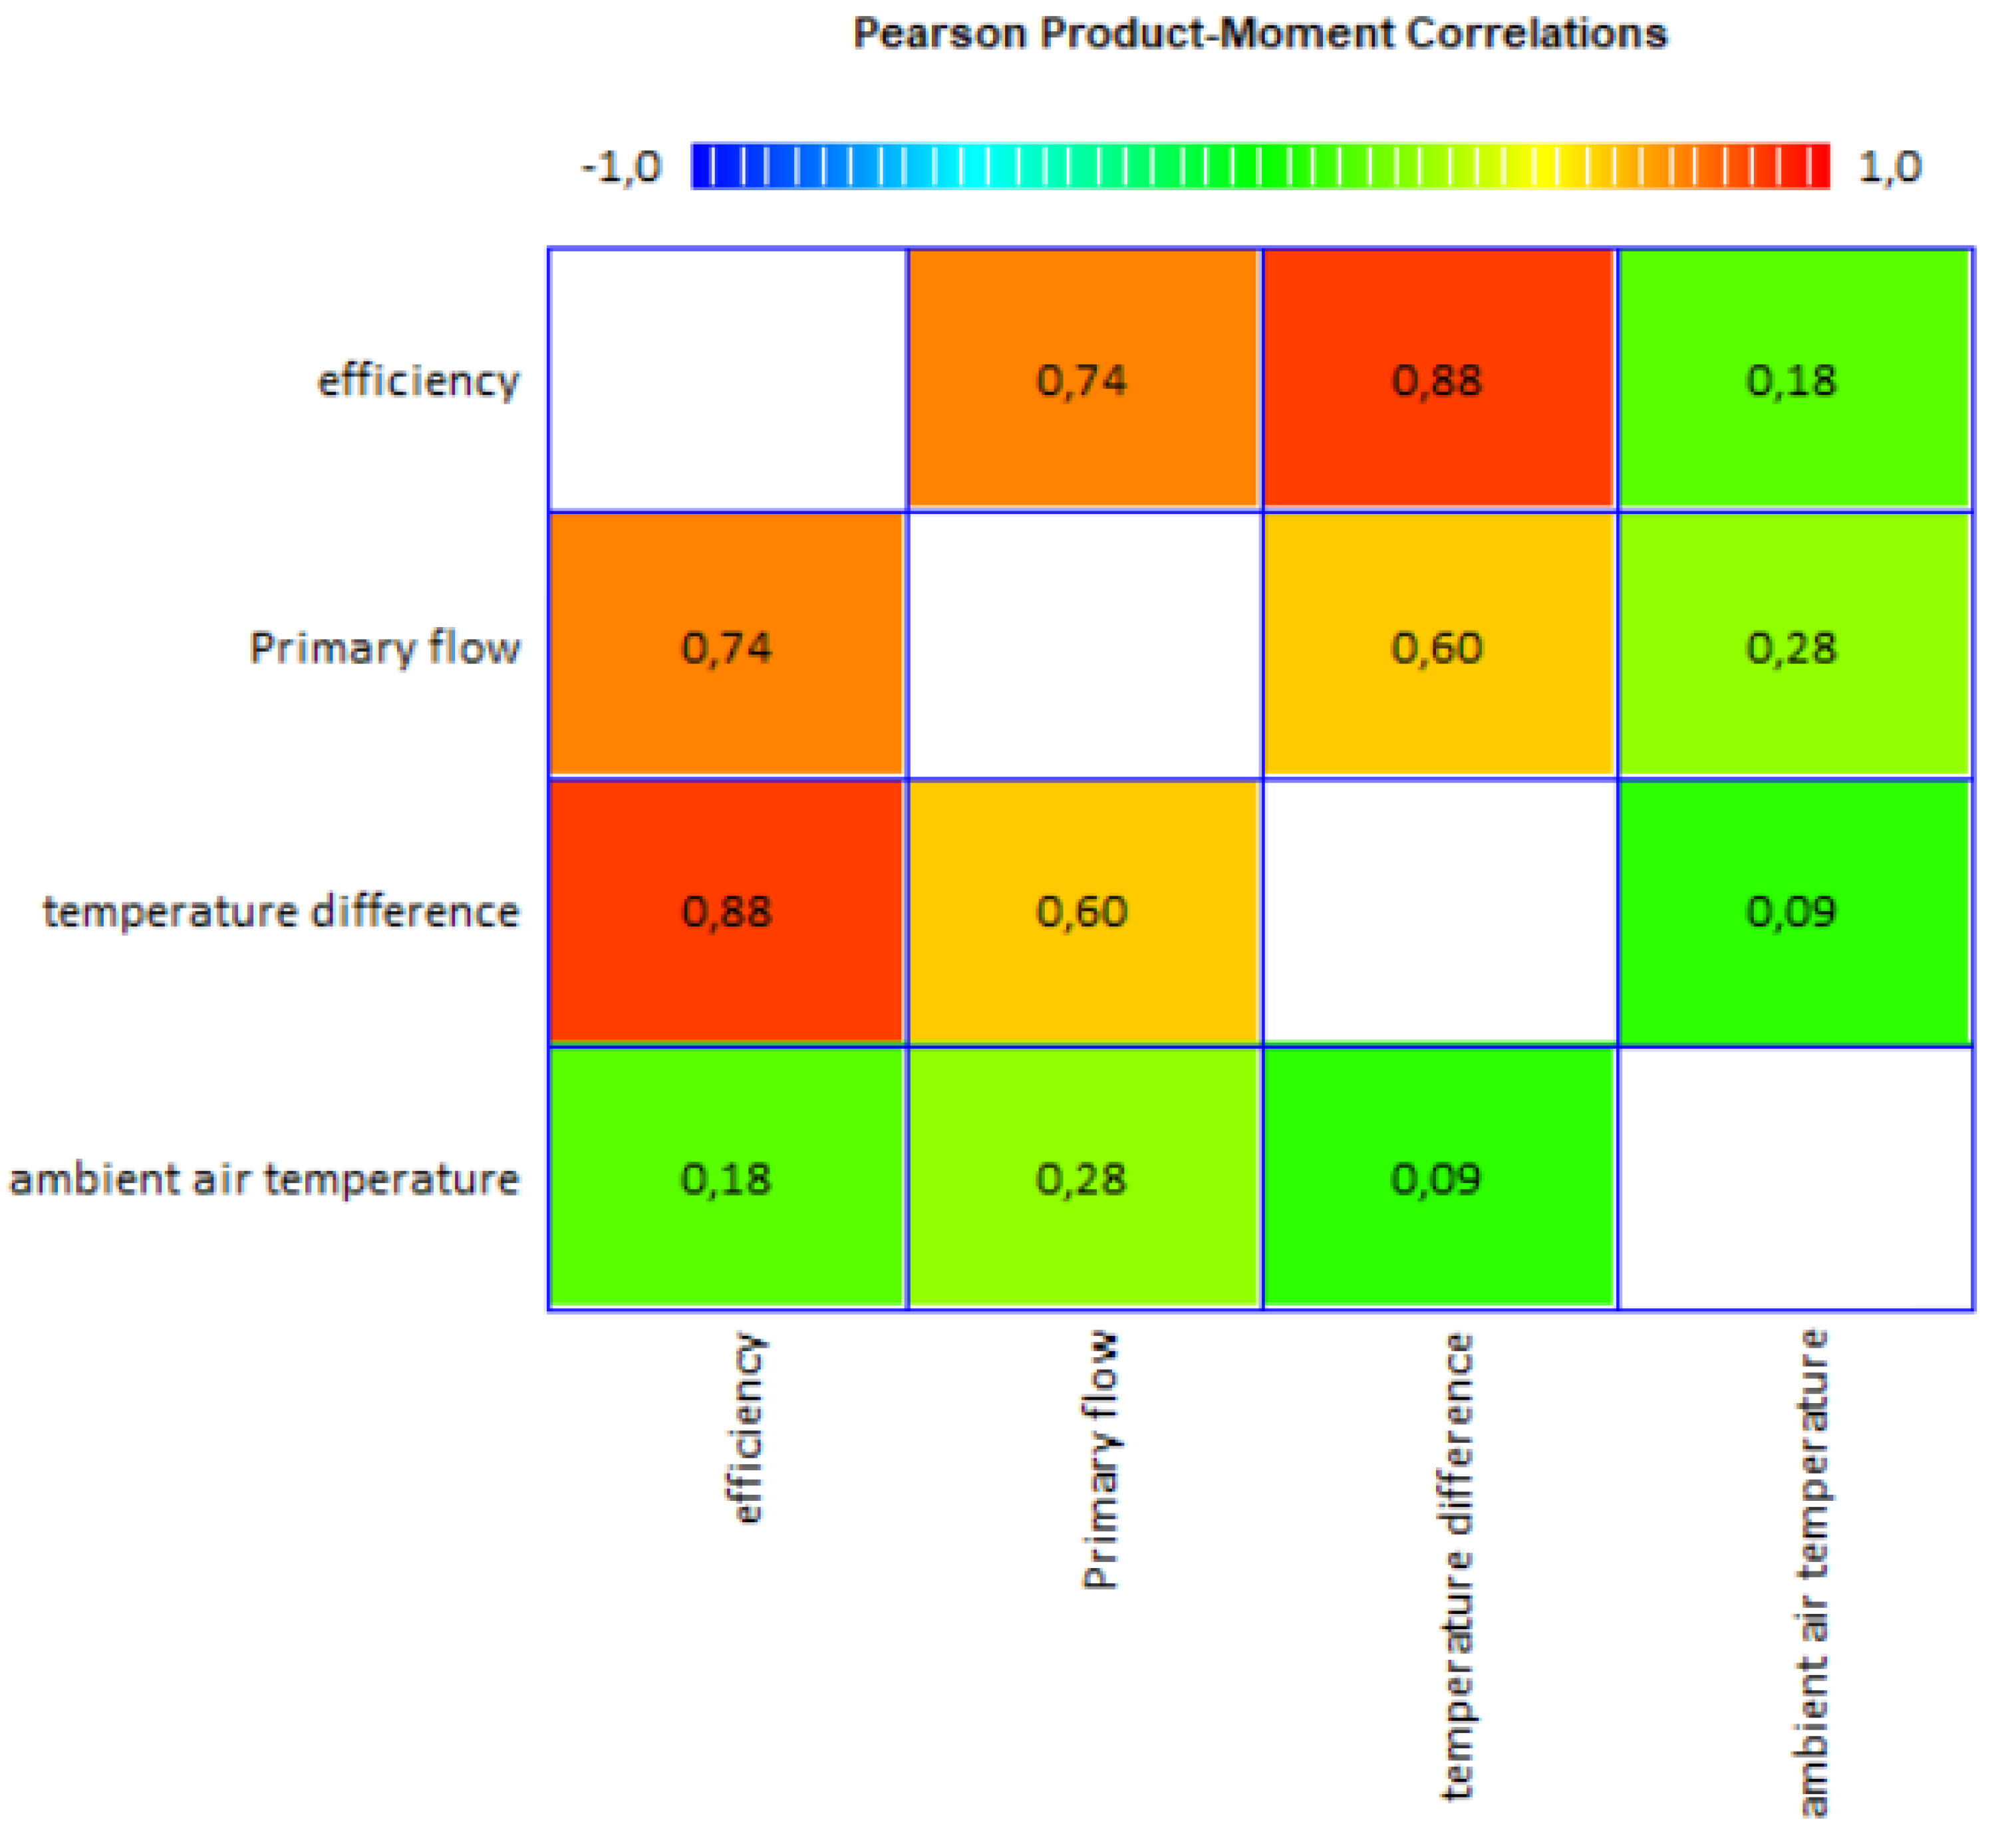
Correlations and matrix plot functions were used to estimate the correlation between variables and to then visualize this correlation. The data are summarized in
Figure 8.
This table shows Pearson product–moment correlations between each pair of variables. These correlation coefficients range between −1 and + 1 and measures the strength of the linear relationship between the variables. The number of pairs of data values used to compute each coefficient is also shown in parentheses. The third number in each cell location is a p-value that tests the statistical significance of the estimated correlations; p-values below 0.05 indicate statistically significant non-zero correlations at the 95.0% confidence level. The following pairs of variables have p-values below 0.05:
Efficiency and primary flow;
Efficiency and temperature difference;
The primary flow and temperature difference;
The primary flow and ambient air temperature.
The strongest correlation is between efficiency and temperature difference, with a correlation coefficient of 0.88. The weakest correlation is between efficiency and ambient air temperature. However, ambient air temperature also affects the flow.
6. Conclusions
The article presented an in-depth investigation of the operational data of the first large-scale solar collector field installed in the Baltic states. The solar collector efficiency dependence on primary heat carrier flow, the temperature difference between return and flow heat carrier temperatures, and the ambient air temperature were all analyzed.
The strongest correlation of solar collector efficiency was observed for the temperature difference between the return and flow temperatures of the heat carrier on the primary side. In addition, a significantly high regression coefficient was observed in May (R2 = 0.9346). Therefore, the obtained data analyses show that it was possible to reach higher solar efficiency with a lower flow rate in some days, and further investigation could focus on optimizing primary flow to reduce the power consumption of the circulation pumps.
The obtained multi-regression equation shows the relationship between solar field efficiency and main DH operational parameters. Therefore, the obtained equation could be used in the simplified investigations to determine solar field efficiency by considering the affecting parameters of specific DH systems. It can also be used as an input in different optimization models in order to increase the solar field output under different conditions.
Given that the collector field was set up over 6.5 hectares, the solar radiation is not equal for every collector. This particular field has 4 solar radiation meters, which is sufficient for managing the collector field optimally. However, to increase efficiency, it would be necessary to equip the solar collector field with even more solar radiation meters to increase the average radiation value more appropriately to the situation. Thus, the flow rates would be better adjusted, and this would further increase the efficiency of the solar field.
The results show that a solar collector’s field efficiency is significantly affected by the heat load due to operational parameters. The efficiency increases in the heating season but decreases if the DH system only provides hot water in the summer period. We found that there was a period in the summer when the overall efficiency could be increased by increasing thermal storage capacity. In the summer, demand was low, and the thermal energy storage tank was overloaded, which led to the need to cool the storage tank down by reversing the flows of the heat carrier at night. As follow up, there can be studies to further investigate the economic optimization of solar heat accumulation systems. Future studies can focus on the in-depth simulation of the thermal storage system to evaluate the possible improvements and the economic justification of the solar DH system.
Author Contributions
Conceptualization, I.P. (Ieva Pakere) and D.B.; methodology, I.P. (Ilze Polikarpova), I.P. (Ieva Pakere), R.K. and D.B.; validation, I.P. (Ilze Polikarpova), I.P. (Ieva Pakere), R.K. and D.B.; formal analysis, I.P. (Ilze Polikarpova) and R.K.; investigation, I.P. (Ilze Polikarpova), I.P. (Ieva Pakere) and R.K.; resources, D.B.; data curation, I.P. (Ilze Polikarpova) and R.K.; writing—original draft preparation, I.P. (Ilze Polikarpova), I.P. (Ieva Pakere) and R.K.; writing—review and editing, I.P. (Ilze Polikarpova), I.P. (Ieva Pakere) and R.K; visualization, I.P. (Ilze Polikarpova), I.P. (Ieva Pakere) and R.K.; supervision, I.P. (Ieva Pakere) and D.B.; project administration, I.P. (Ieva Pakere) and D.B.; funding acquisition, D.B. All authors have read and agreed to the published version of the manuscript.
Funding
The research is funded by the Ministry of Economics of the Republic of Latvia, project “Assessment of Latvia’s renewable energy supply-demand economic potential and policy recommendations”, project No. VPP-EM2018/AER_1_0001.
Institutional Review Board Statement
Not applicable.
Informed Consent Statement
Not applicable.
Data Availability Statement
The data presented in this study are provided by Ltd. Salaspils Siltums and are not publicly available.
Conflicts of Interest
The authors declare no conflict of interest.
References
- Schweiger, H.; Farinha Mendes, J.; Carvalho Ma, J.; Hennecke, K.; Krüger, D. Solar Heat for Industrial Processes. In Advances in Solar Energy; Routledge: London, UK, 2007; Volume 17, p. 45. [Google Scholar]
- Weiss, W. Spörk-D Global market development and trends in 2019. Sci. Technol. Built Environ. 2019, 24, 819. [Google Scholar]
- Singh, S.; Kumar, A.; Yadav, A. Experimental Investigation of Thermal Performance Evaluation of Solar Flat Plate Collector. Mater. Today Proc. 2020, 24, 1533–1540. [Google Scholar] [CrossRef]
- Zhou, L.; Wanga, Y.; Huang, Q. Parametric analysis on the performance of flat plate collector with transparent insulation material. Energy 2019, 174, 534–542. [Google Scholar] [CrossRef]
- Wojcicki, D.J. The application of the Typical Day Concept in flat plate solar collector models. Renew. Sustain. Energy Rev. 2015, 49, 968–974. [Google Scholar] [CrossRef]
- Lund, H.; Werner, S.; Wiltshire, R.; Svendsen, S.; Thorsen, J.E.; Hvelplund, F.; Mathiesen, B.V. 4th Generation District Heating (4GDH). Integrating smart thermal grids into future sustainable energy systems. Energy 2014, 68, 1–11. [Google Scholar] [CrossRef]
- Pauschingers, T. Solar Thermal Energy for District Heating, Advanced District Heating and Cooling (DHC) Systems; Woodhead Publishing Series in Energy: Amsterdam, The Netherlands, 2019. [Google Scholar]
- Li, H.; Nord, N. Transition to the 4th generation district heating—Possibilities, bottlenecks, and challenges. Energy Procedia 2018, 149, 483–498. [Google Scholar] [CrossRef]
- Schmidt, D.; Kallert, A. Future Low Temperature District Heating Design Guidebook. Final report of IEA DHC Annex TS1 Low Temperature District Heating for Future Energy Systems; International Energy Agency: Paris, France, 2017. [Google Scholar]
- Soloha, R.; Pakere, I.; Blumberga, D. Solar energy use in district heating systems A case study in Latvia. Energy 2017, 137, 586–594. [Google Scholar] [CrossRef]
- Said, Z.; Hachicha, A.A.; Aberoumand, S.; Yousef, B.A.A.; Sayed, E.T.; Bellos, E. Recent advances on nanofluids for low to medium temperature solar collectors: Energy, exergy, economic analysis and environmental impact. Prog. Energy Combust. Sci. 2021, 84, 100898. [Google Scholar] [CrossRef]
- Maximov, S.A.; Mehmood, S.; Friedrich, D. Multi-objective optimisation of a solar district heating network with seasonal storage for conditions in cities of southern Chile. Sustain. Cities Soc. 2021, 73, 103087. [Google Scholar] [CrossRef]
- Mäki, E.; Kannari, L.; Hannula, I.; Shemeikka, J. Decarbonization of a district heating system with a combination of solar heat and bioenergy: A techno-economic case study in the Northern European context. Renew. Energy 2021, 175, 1174–1199. [Google Scholar] [CrossRef]
- Renaldi, R.; Friedrich, D. Techno-economic analysis of a solar district heating system with seasonal thermal storage in the UK. Appl. Energy 2019, 236, 388–400. [Google Scholar] [CrossRef] [Green Version]
- Sibbitt, B.; McClenahan, D.; Djebbar, R.; Thornton, J.; Wong, B.; Carriere, J.; Kokko, J. The Performance of a High Solar Fraction Seasonal Storage District Heating System—Five Years of Operation. Energy Procedia 2012, 30, 856–865. [Google Scholar] [CrossRef] [Green Version]
- Saloux, E.; Candanedo, J.A. Model-based predictive control to minimize primary energy use in a solar district heating system with seasonal thermal energy storage. Appl. Energy 2021, 291, 116840. [Google Scholar] [CrossRef]
- Bava, F.; Dragsted, J.; Furbo, S. A numerical model to evaluate the flow distribution in a large solar collector field. Sol. Energy 2017, 143, 31–42. [Google Scholar] [CrossRef] [Green Version]
- Bava, F.; Furbo, S. Impact of different improvement measures on the thermal performance of a solar collector field for district heating. Energy 2018, 144, 816–825. [Google Scholar] [CrossRef] [Green Version]
- Tschopp, D.; Tian, Z.; Berberich, M.; Fan, J.; Perers, B.; Furbo, S. Large-scale solar thermal systems in leading countries: A review and comparative study of Denmark, China, Germany and Austria. Appl. Energy 2020, 270. [Google Scholar] [CrossRef]
- Noussan, M.; Jarre, M.; Degiorgis, L.; Poggio, A. Data Analysis of the Energy Performance of Large Scale Solar Collectors for District Heating. Energy Procedia 2017, 134, 61–68. [Google Scholar] [CrossRef] [Green Version]
- Furbo, S.; Dragsted, J.; Perers, B.; Andersen, E.; Bava, F.; Nielsenb, K.P. Yearly thermal performances of solar heating plants in Denmark—Measured and calculated. Solar Energy 2018, 159, 186–196. [Google Scholar] [CrossRef] [Green Version]
- Latvian Environmental Geology and Meteorology Center. Meteorological database 2021. Available online: https://www.meteo.lv/ (accessed on 21 June 2021).
| Publisher’s Note: MDPI stays neutral with regard to jurisdictional claims in published maps and institutional affiliations. |
© 2021 by the authors. Licensee MDPI, Basel, Switzerland. This article is an open access article distributed under the terms and conditions of the Creative Commons Attribution (CC BY) license (https://creativecommons.org/licenses/by/4.0/).


