Article

Thermal Insulation of Excavations and Its Effect on Climate Conditions

Faculty of Civil Engineering and Resource Management, AGH University of Science and Technology Kraków, 30-059 Kraków, Poland
*
Author to whom correspondence should be addressed.
Energies 2021, 14(14), 4170; https://doi.org/10.3390/en14144170
Submission received: 18 May 2021 / Revised: 28 June 2021 / Accepted: 6 July 2021 / Published: 10 July 2021

Abstract

:
The article compares the climate conditions in an excavation with thermally insulated roof and sidewalls to the conditions when such insulation is absent. The analysis of the temperatures presented in the article consisted of limiting the heat transfer from the rock mass to the heading in one of the Polish coal mines. It is widely believed that the thermal insulation of heading sidewalls, through which fresh air is supplied, can substantially improve climate conditions. The article’s objective is to evaluate the impact of thermal insulation on the surface of the roof and sidewalls on the reduction in heat transfer from the strata with a high virgin temperature to mine air. Preventing the existing climate hazard involves higher costs of coal extraction, whereas the consequences of inadequate prevention threaten the health or life of the miners.

1. Introduction

Working conditions in underground mines have their own specificity compared to those found in plants above ground. They are characterized, first, by the dispersion of activities over a large area and an unfriendly working environment for humans. Due to the depletion of resources at higher depths, mines are forced to descend to lower levels. It is associated mainly with an increase in temperature and deterioration of climatic conditions [1,2].
The parameters of the mine air determine the climatic conditions in underground workings. Its physical parameters and composition change during the flow due to the inflow of heat from natural and technological heat sources [3,4].
The movement of heat through the surface of rocks exposed in the excavation occurs by convection, evaporation of moisture, and radiation. It is assumed that the rocks are a continuous, layered homogeneous, and isotropic medium. Thermal conduction in rocks and their formations results from thermal energy flow from the higher to lower energy levels (temperature fields). The uneven distribution of temperature in a rock is caused by the fact that the rock conducts heat. The temperature distribution depends on thermal conductivity, the average density of heat flux, and the thickness of rock layers. Temperature changes become noticeable on adjoining surfaces. Thermal conduction follows Fourier’s law for isotropic bodies and is perpendicular to isothermic surfaces, while the average density of heat flux is proportional to the derivative in this direction.
The thermal conductivity coefficient defines the ability to conduct heat and refers to the total heat flux transferred in stable conditions through a unit of rock surface in a unit of time, given the average thickness and the average delta of energy levels (temperatures) between adjoining rock layers. The thermal conductivity coefficient λ (W/(m·K)) has an established value for a given thermal state of the rock and constitutes one of its physical characteristics. The balancing of energy levels (temperatures) is determined by the heat diffusion coefficient a (m2/s), sometimes referred to as the cooling or heating coefficient. This coefficient is defined by dividing the thermal conductivity coefficient λ by the product of volumetric density ρ (kg/m3) and the specific heat capacity c (J/(kgK4).
The range of values of the coefficients λ and a of the rocks, defined through laboratory tests (given the unsteady or steady flow of the heat flux) or through field research in boreholes or mining excavations, is found in the literature on the subject [4].
The transfer of heat from the rocks to the mine air is linked to convective heat transfer. The heat transfer process is described using the coefficients of diffusion and penetration (absorption) of the heat [5,6].
When a considerable difference in temperatures exists between the sidewalls and the mine air, a large amount of heat flux is transferred through thermal radiation. Thermal radiation has a specific impact on the temperature of mine air. The transfer of radiated heat can occur in two ways:
  • emission of radiation and its absorption by the air as a gas containing water vapor and carbon dioxide
  • heat transfer to the air by convection from heated surfaces affected by thermal radiation from warmer surfaces.
In the context of the deterioration of thermal working conditions in underground mines, the use of thermal insulation of the sidewalls of excavations is considered [7,8]. Since the 1960s, theoretical and experimental research on thermal insulation of mining workings has been carried out in the world of mining. The most frequently exposed rock surfaces were thermally insulated to:
  • verification of theoretical predictions and calculations of the reduction in heat flow due to thermal insulation,
  • assessment of the possibility and effectiveness of using various types of insulation materials in mining conditions,
  • assessment of the effectiveness of thermal insulation in the event of leaving an uninsulated floor,
  • gaining experience and knowledge about the practical problems of isolating workpieces.
The use of thermal insulation of the excavation surface is widely discussed, especially in the publications of Western authors [6,9,10,11,12,13,14,15]. Among others, R.O. Hughes [11] concluded, based on the results of computer simulations, that the application of thermal insulation in a South African mine, where the primary rock temperature at a depth of 2500 m is about 47 °C, will reduce the heat input from the rock mass by 25%. On the other hand, in [12], it was theoretically shown that the use of thermal insulation could reduce the heat flux from the rock mass by about 15%, 30%, and even 80% if an insulation layer of a 100 mm thickness is used, made of concrete, shotcrete, or polyurethane foam. Works on thermal insulation of ventilation and air conditioning devices were also carried out [6,16,17].
Usage of thermal insulation is not a standard solution in Polish underground mining and the global mining industry. This article presents experimental research conducted in Pilot Roadway 7, a preparatory excavation for longwall panel 7 in mine X. It aims to deliver the measurement results of air temperature and the insulating surface temperature of the heading sides.

2. Installing Thermal Insulation in the Heading under Analysis

2.1. Research Objectives

In mine X in “Field P”, Pilot heading 7 was drilled in seam 409 in preparation for the extraction at new longwall 7. Coal mine X is placed in the southwestern part of Upper Silesia in Poland. The fragment of the seam 409 map is shown in Figure 1. The length of the excavation was 1286 m. Problematic climatic conditions in this area occurred already when the research heading 5 for longwall 5 and 3a for longwall 3 was built, and it often exceeded the value of 32 °C. The virgin rock mass temperature, ranging from 40 to 42 °C, meant that, in these workings, despite the air-cooling using cooling units, the air temperature according to the dry-bulb thermometer often exceeded the value of 32 °C. This was the main reason for conducting the experimental research in question.

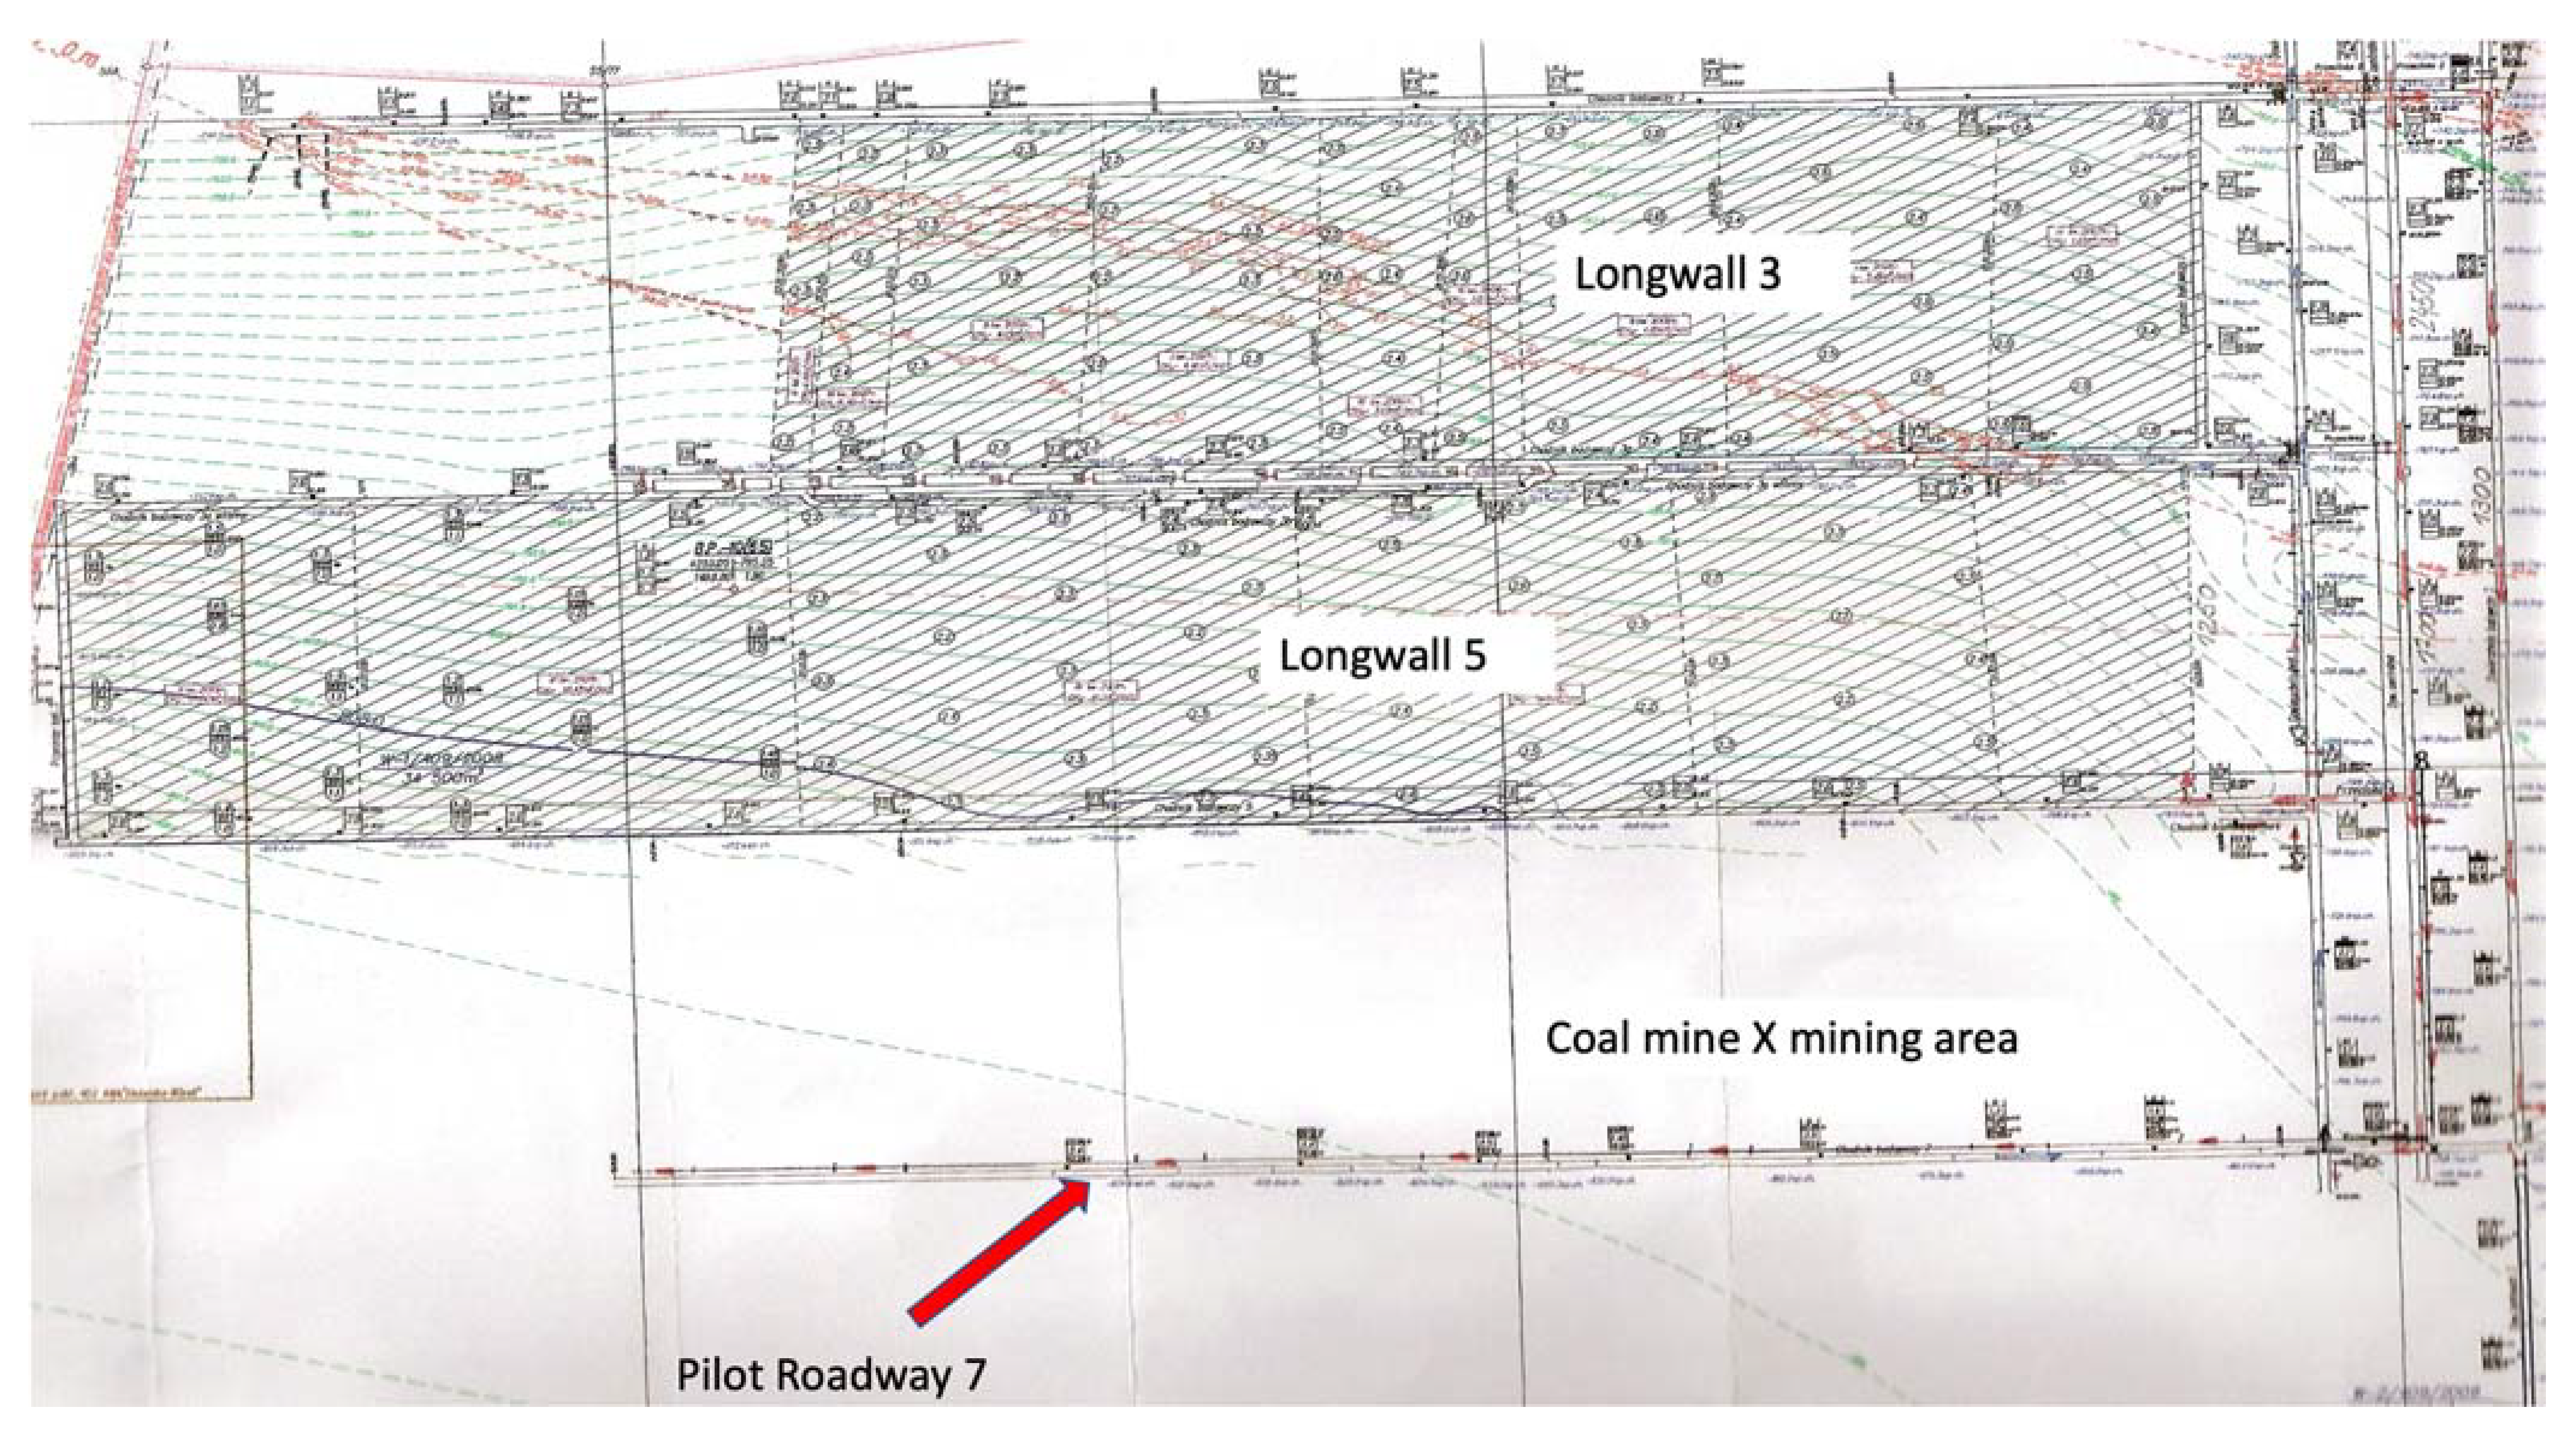
2.2. Geological and Mining Conditions around Seam 409

Coal seam 409 in this mining area lies at a depth of about 890.0 m (−630.0 m above sea level) in the northern part and about 1160.0 m (−900.0 m above sea level) in the south-west, part with an average slope of approximately 3–8° to the south and south-west. The thickness of coal seam 409 in this area ranges from 1.9 to 2.8 m, decreasing towards the west.
The roof and floor conditions of coal seam 409 are determined in the eastern part based on the P-9 test borehole, while the western part was based on the P-10 borehole. According to the P-10 borehole (western part), a layer of clay shale with a thickness of 4.7 m is deposited in the seam roof, and above it, there is a light gray multi-grained sandstone with a thickness of 24.1 m with sand slate inserts. The research works showed the variability of rocks directly in the coal seam roof. The nature of facies varies from clay shales to sandy shales to fine-grained sandstones. There are clay shales on the floor of seam 409 and, locally, a layer of coal shale on the bottom, with a thickness of up to 0.5 m. According to the P-9 test borehole (eastern part), in the roof of seam 409, there is a layer of fine-grained sandstone with a thickness of 5.4 m, with sand slate inserts on its floor. Above, a layer of clay shale is 5.8 m thick and fine-grained sandstone is 14.0 m thick with clay shale inserts. At the bottom of seam 409, there are clay shales and alternating sandstone layers and sandy shale. There is a local layer of coal shale in the direct floor with a thickness of up to about 0.5 m.
The coal deposit of the X mine—Field P is in the southern part of the leading saddle, in the dropped wing of the Kłodnicki Fault, which is the major tectonic dislocation with a latitudinal course, dropping layers to the south from about 200 to 365 m. Test boreholes confirmed the existence of two faults creating a tectonic ditch with a path close to the meridian:
  • fault IV, which constitutes the natural eastern border of the area. This fault, along the NNE-SSW course, drops layers from 60 to 70 m to the west. Fault IV reaches the Kłodnica fault and is continued in the “Śląsk” coal mine field as fault VII (Kalina);
  • fault VIa, which runs parallel to fault IV and drops the layers to the east by about 50 m. In the northern part, this fault crosses the Kłodnica fault and runs meridians in the home field of the “Śląsk” coal mine.
During the mining works performed so far in the mining area in question, several faults with a course, such as latitudinal and drops ranging from 0.2 to 30.0 m, were found. In the western part, in the research fissure 4, a NE-SW fault and a discharge of about 70.0 m to the east were found.
Based on the geological profiles made in the road gates of the longwall face 5, it can be concluded that:
  • along the Research Roadway 5 (main gate), the seam deposition was regular. Its thickness ranged from 2.5 to 2.7 m. The roadway was made with a slope of about 4 degrees to the east, i.e., towards the longwall.
  • along the secondary Research Roadway 3a (tail gate), the deposition of the seam was less regular due to faults. Its thickness ranged from 2.4 to 2.7 m, and the roadway was also made with a rise of about 4 degrees to the east, i.e., in the direction of longwalls. At approximately 45 m behind the longwall face, there was a normal fault dropping by approximately 1.3 m to the east. Additionally, at 105 to 120 m behind the longwall face, three normal faults were dropping 0.2 ÷ 0.3 m to the east.
  • the retention of the seam 409 in the longwall 5 was also regular except for the upper section, where there were two reverse faults (11 and 26 m from the secondary research heading 3a) with discharges of 0.3 and 1.2 m, respectively. Below the larger fault, the floor was trimmed up to 1.2 m in clay shale. The thickness of coal seam 409 in longwall face 5 ranged from 2.1 to 2.6 m. There was clay slate along the entire length of the longwall in the ceiling and floor. The mean slope of the longwall towards the south was about 4 degrees.
The thermal conductivity coefficient of the coal seam was determined at λw = 0.48 W/(m·K), and for the shale layers at λw = 1.89 W/(m·K). The weighted average (per perimeter) coefficient of thermal conductivity of the layer was λavg = 1.60 W/(m·K). The weighted average coefficient of thermal diffusivity in the excavation perimeter, considering the share of coal and rocks in the perimeter, was equal to a = 0.6 × 10⁻⁶ m2/s.
Below the longwall face 5, Pilot Roadway 7 was designed to prepare another longwall panel (Figure 1). The target length of the heading to achieve a break with Research Roadway 5 was 1286 m. Problematic climatic conditions in this area were the reason for installing the insulation of the sidewalls and the roof of a driven heading.
One of the main hazards presented in the coal seam 409 mining area was the methane hazard. For the longwall fields 3, 5, and 7 of seam 409, the methane content determined during road gates driven ranged from 0.753 to 7.694 m3/Mgdaf. Moreover, in the cut-off point 5 (extension of the Research Roadway 7), it reached 8.034 m3/Mgdaf, and in the central plateau above the drift it reached 5–8.695 m3/Mgdaf. These results were the basis for classifying the part of coal seam 409 to the IV category of methane hazard (classification of methane hazard in Polish coal mines). Therefore, the Research Roadway 7 was equipped with real-time monitoring of methane concertation required by Polish mining regulations to determine methane concentration in coal seam 409.

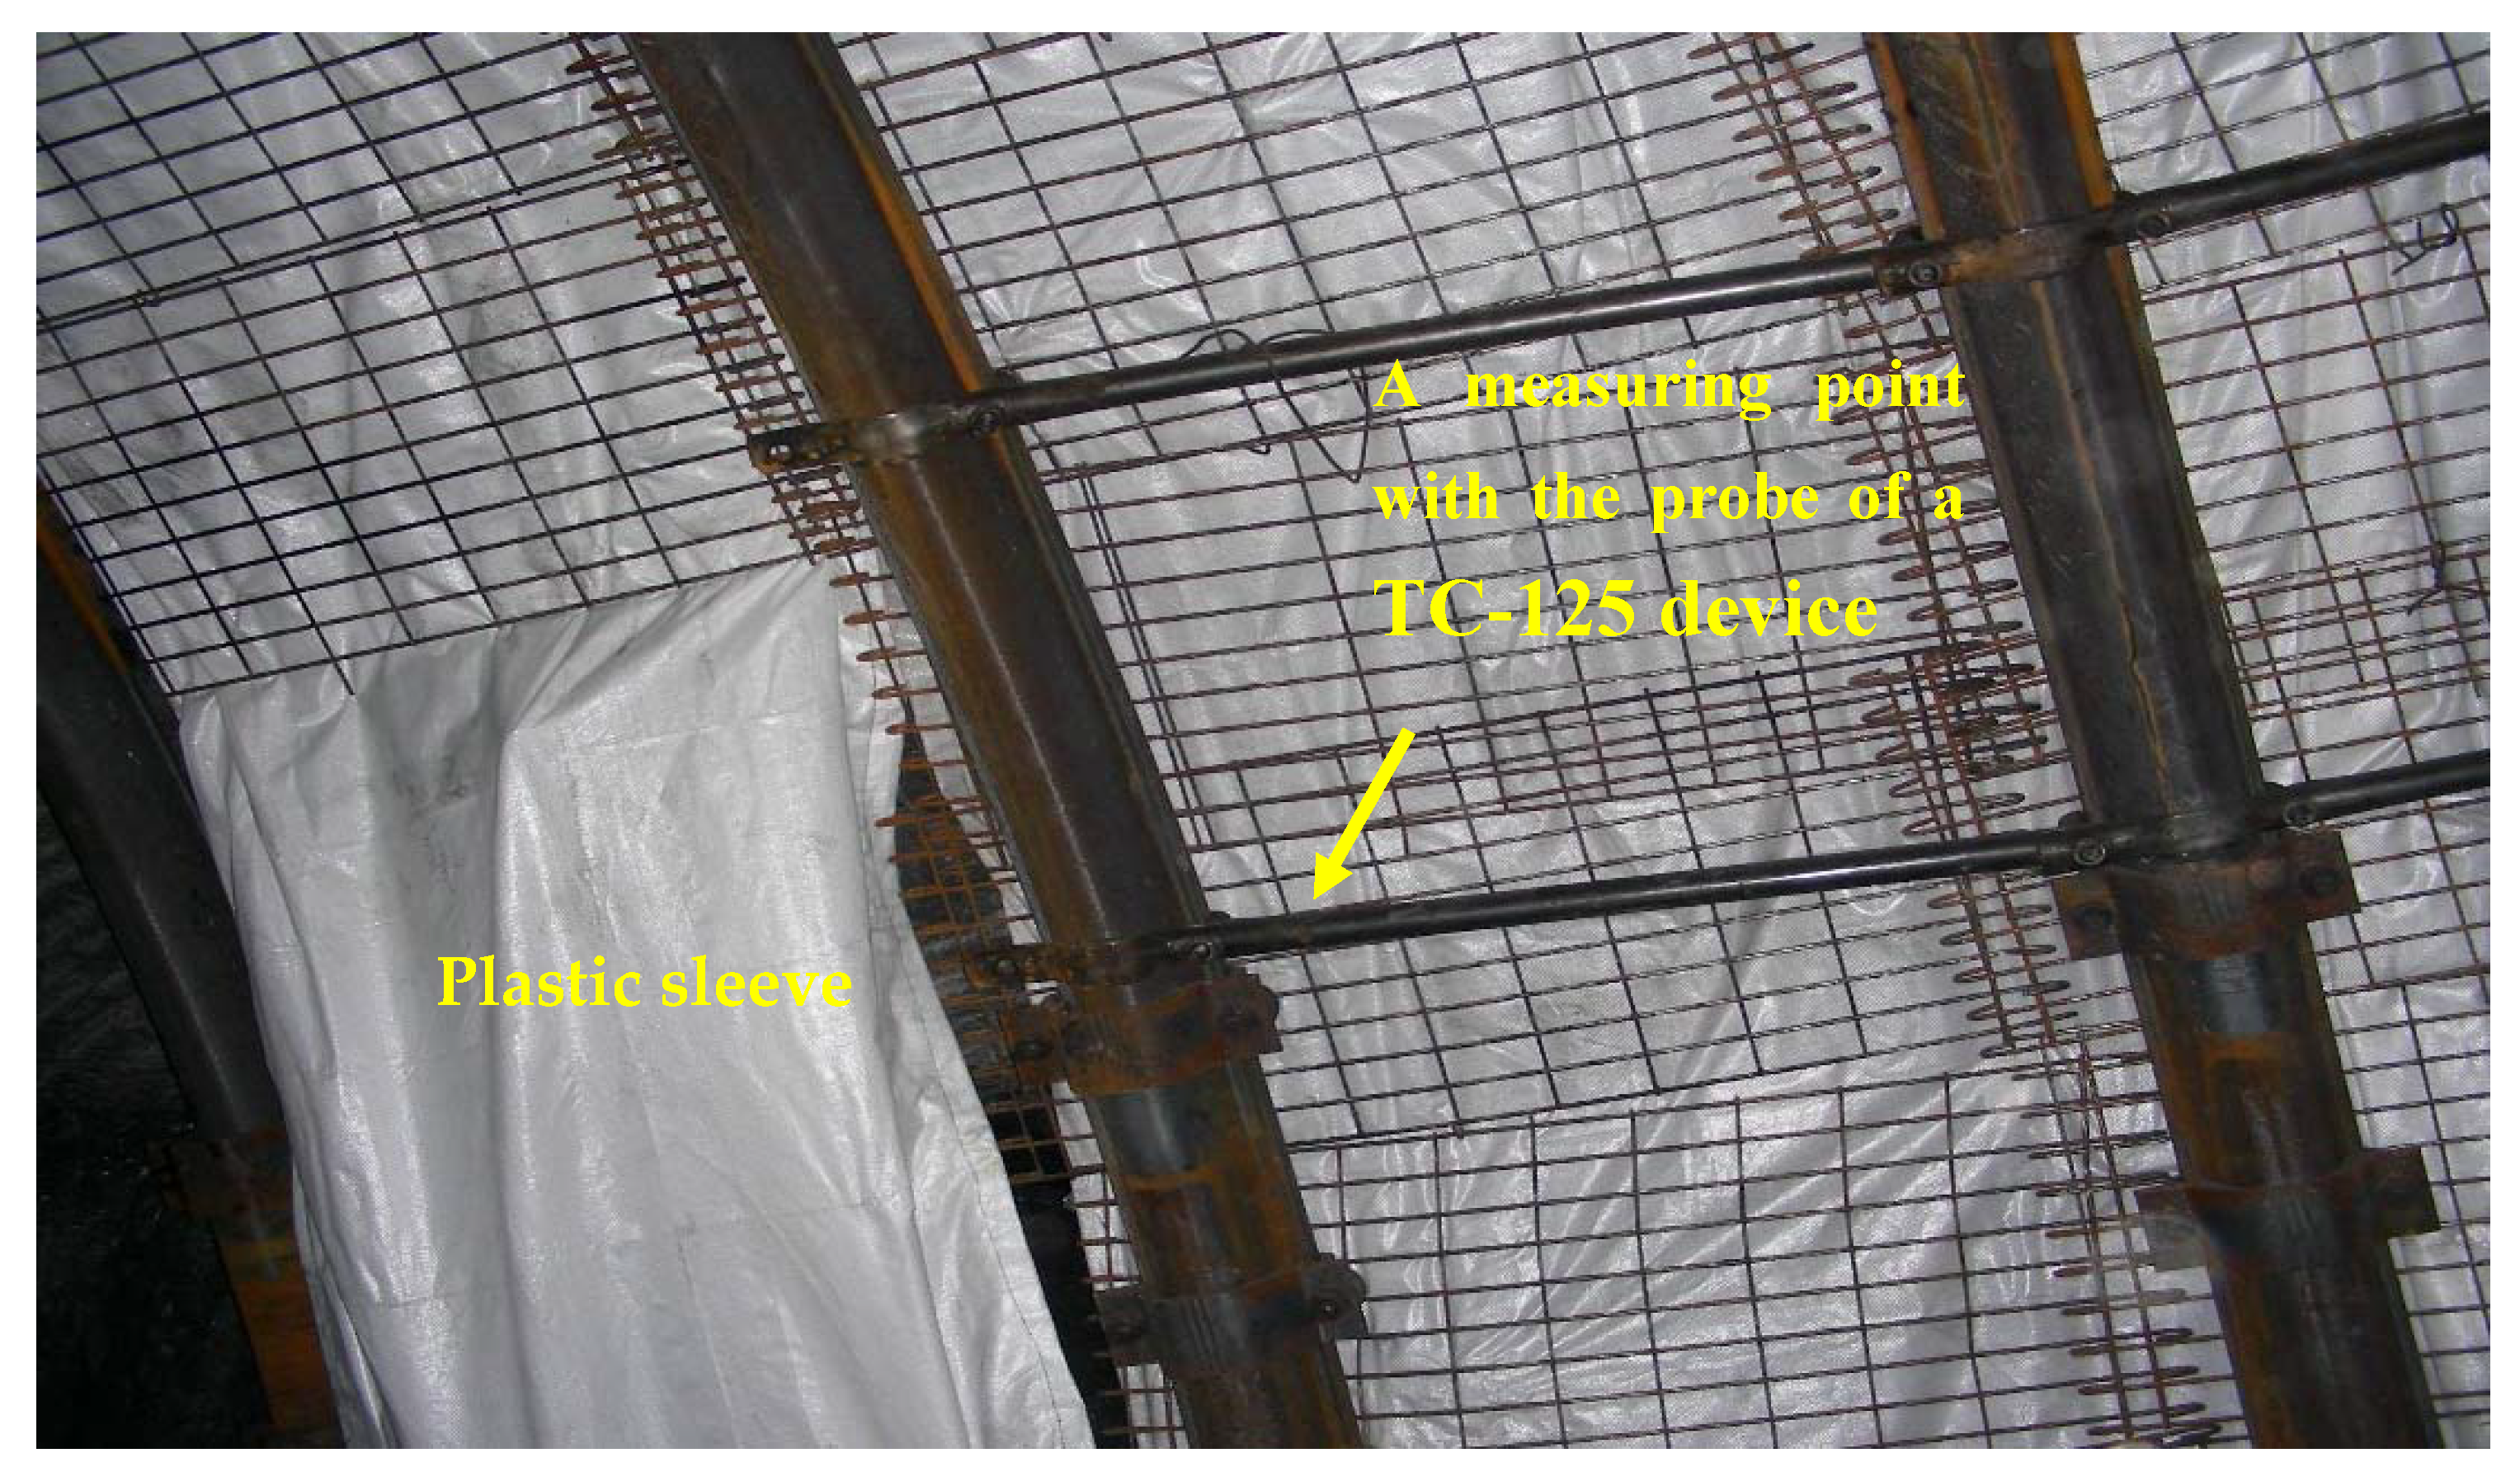
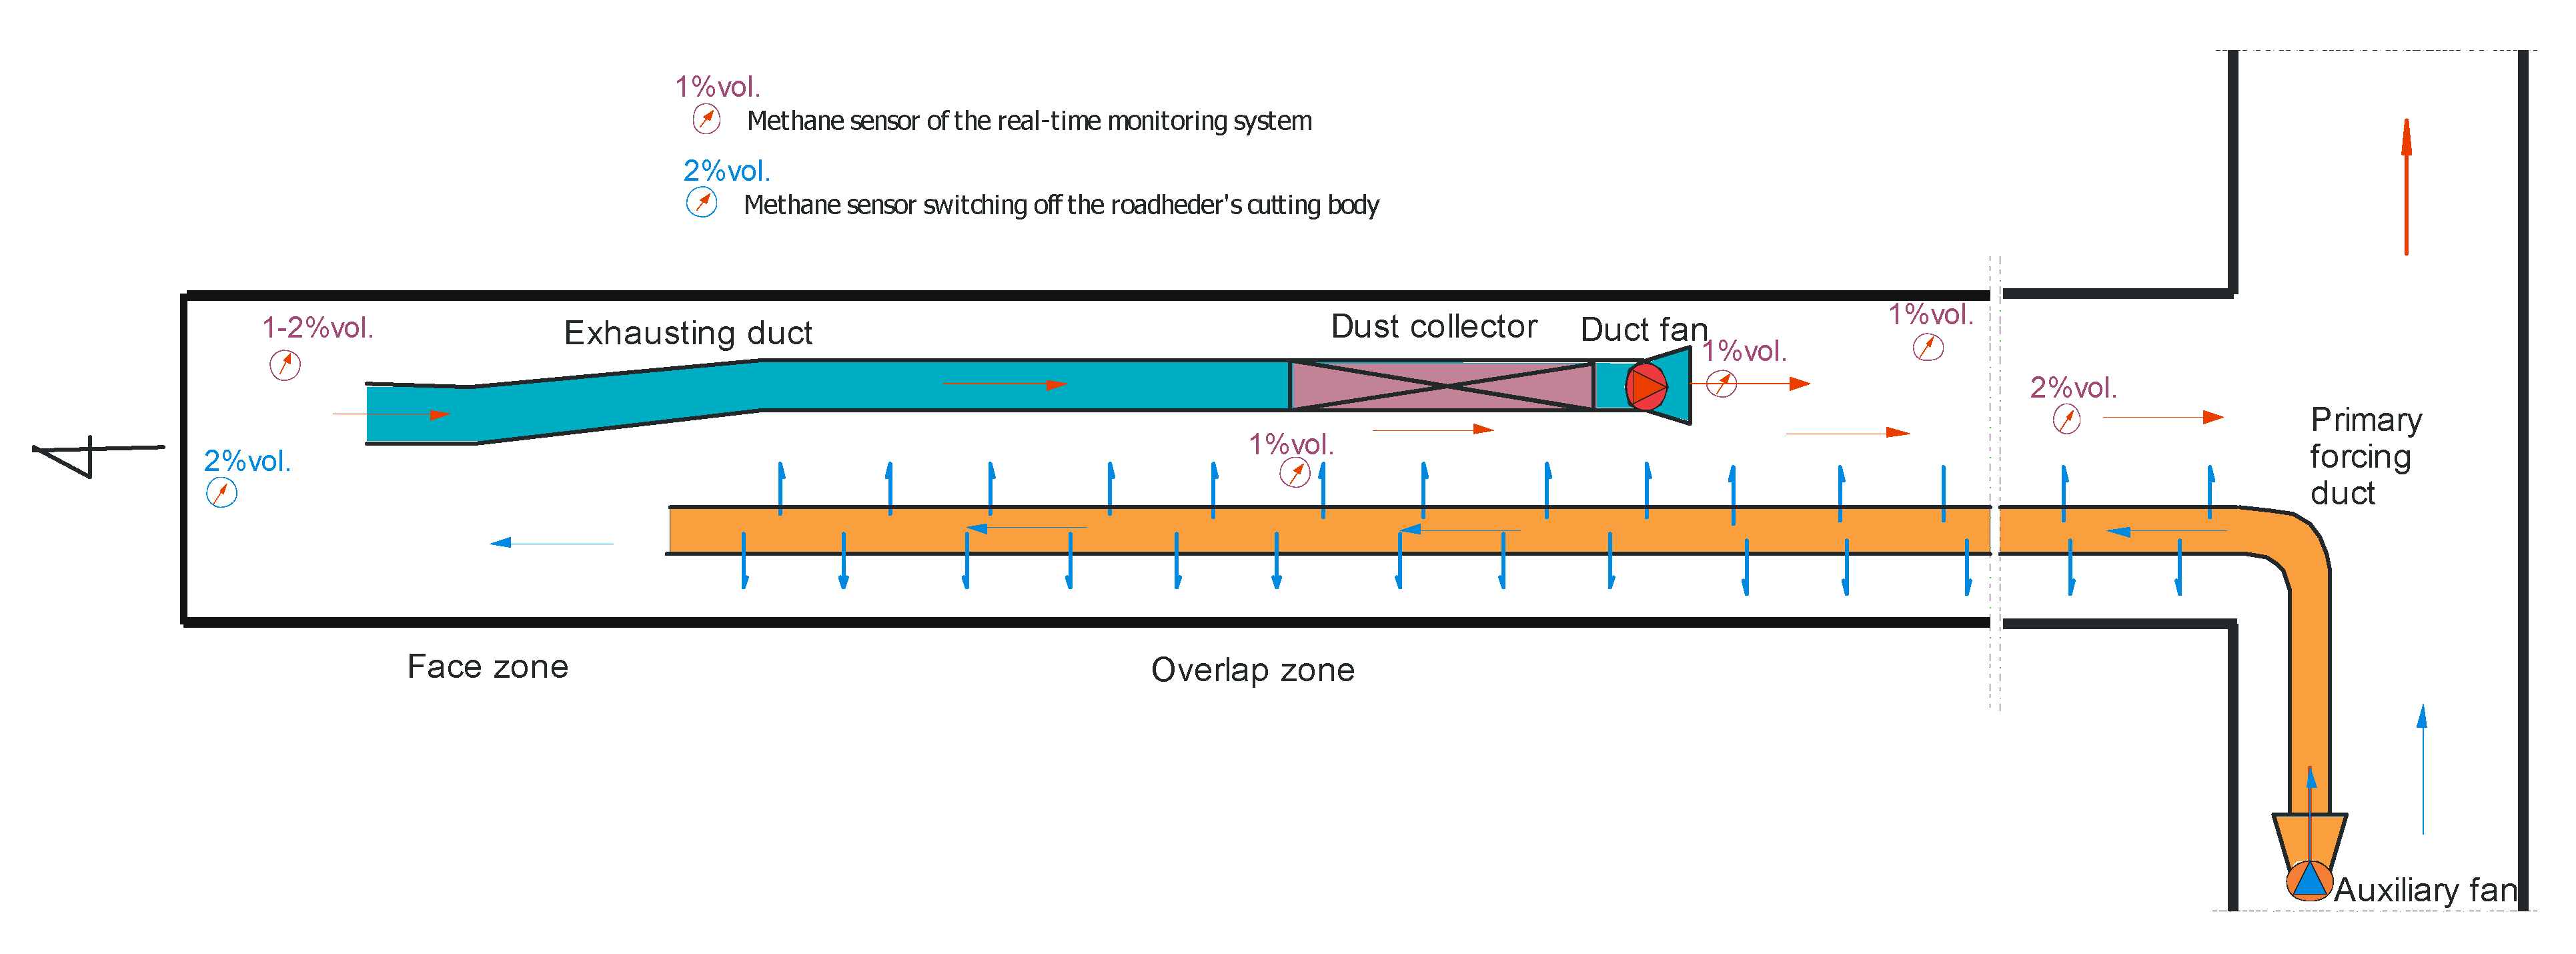
2.3. Auxiliary Ventilation System and Thermal Insulation Execution

The cooling of mine air was provided by air coolers CP-300 (www.termospec.pl, Żory, Poland) and CP-200 (www.termospec.pl, Żory, Poland). However, despite this, air temperature often exceeded 32 °C in the previously performed Research Roadway 5. Therefore, to ensure safe thermal condition—to limit the influence of the rock mass temperature on the air temperature—it was decided to insulate Pilot Roadway 7 by using the insulation foam ISOSCHAUM supplied by Schaum-Chemie Mikołów Sp. z o.o [18]. Its thermal conductivity coefficient was determined at the level of λins = 0.10 W/(m·K) for insulation technology adopted to Pilot Roadway 7. The insulation was constructed by forcing the foam into plastic sleeves that were 1.5 m wide and 13 m long, which were arranged behind the supports with an overlap equal to half of the support unit. A pump with a mixer was used to force the foam into the sleeves. The thickness of the resulting insulating cover ranged from 0.1 m to 0.4 m (0.15 m on average).
The heading supported by arch support ŁP9V29 was driven using a roadheader and ventilated by an overlap ventilation system with a primary forcing duct. In the forcing duct, an air cooler (an evaporator) of the cooling device DV-290 (Warme-Austausch-Technik (WAT) GmbH, Germany) was integrated and systematically rebuilt as the heading face progressed. The evaporator of the cooling device was kept no more than 200 m from the face of the heading.
The amount of air supplied to the heading face was between 340 to 500 m3/min depending on the progressing length of the heading. Figure 2 presents the way that insulation on the sidewalls and the roof was made.
As a result of thermal insulation, the emission of methane into the heading was limited. Figure 3 shows a schematic of combined duct ventilation with zones for measuring methane concentration in the heading. Later in the article, the distribution of methane concentration will not be analyzed because this paper aims to assess the improvement of climatic conditions by thermal insulation of heading.

3. Research Methodology

To determine the effectiveness of improving climatic conditions in the hollow heading, air temperature measurements were carried out according to a dry- and wet-bulb thermometer at the inlet to the heading and in the heading face zone. Figure 4 presents the values of temperature measured at the working face (Figure 4a) and at the entrance of the heading (Figure 4b) according to the wet- and dry-bulb thermometer. Temperature measurements carried out according to a dry- and wet-bulb thermometer in the heading were necessary to determine the state of climatic hazard in accordance with the applicable mining regulations. Except for the period during which air was not cooled (from March to June), the air temperature at the face did not exceed 28 °C. The exception was three months from March–June, where the air temperature on the dry-bulb thermometer exceeds 29 °C due to the failure of the cooling device. According to the dry-bulb thermometer, the temperature measured in the face was lower than the temperature at the entrance of the heading (Figure 4a,b). During the driving of heading for the previous longwall face 5, such climatic conditions were not achieved.
To determine the heat flux flow from the rock mass to the heading with a heat-insulating layer made, measurements were carried out to install temperature sensors. As the driving of the heading face advanced, measuring points were set up at 50 m intervals to record the temperature of the insulating layer at the roof, at the sidewalls, and on the floor. Measurements were made with a pyrometer and periodically checked with a Dräger UCF 8000 thermal imaging camera. Additionally, holes were made in the measurement sections in the insulation for mounting the temperature sensor. Temperature measurements behind the insulating foam were performed using a mining thermometer (TC-125 m with a TD-type resistance sensor, a transmitter system, and a correcting measurement line resistance).
The principle of operation of TC-125 was based on measuring the sensor’s resistance at the end of the measuring line. T.C. thermometer-125 cooperates with a PT-type resistance sensor equipped with a transmitter system and a correcting measurement line resistance. The temperature measuring range was 0–125 °C. The accuracy of the P.T. soda measurement is ±1 °C, and the resolution was 0.1 °C. The TC-125 thermometer was additionally equipped with a recording barometric pressure sensor with an accuracy of ±2 hPa and a resolution of 0.1 hPa. The frequency of measurements was three times a month. Figure 2 shows the location of selected measurement points.
Figure 5 presents the measurements of the temperature of the outer and inner surfaces of the insulating foam in a graphical manner on 16 October, before breaking the excavation and obtaining through-flow ventilation. The temperature values were mean values obtained from the three measuring points at the cross-section of the heading (at the left-hand sidewall, the roof, and the right-hand sidewall). As the driving advanced, the temperature of the rock mass behind the insulation was rising. At the same time, after the foam had become stable, the air temperature in the heading remained at the level approximately 1.5 °C below the temperature of the surrounding rocks.

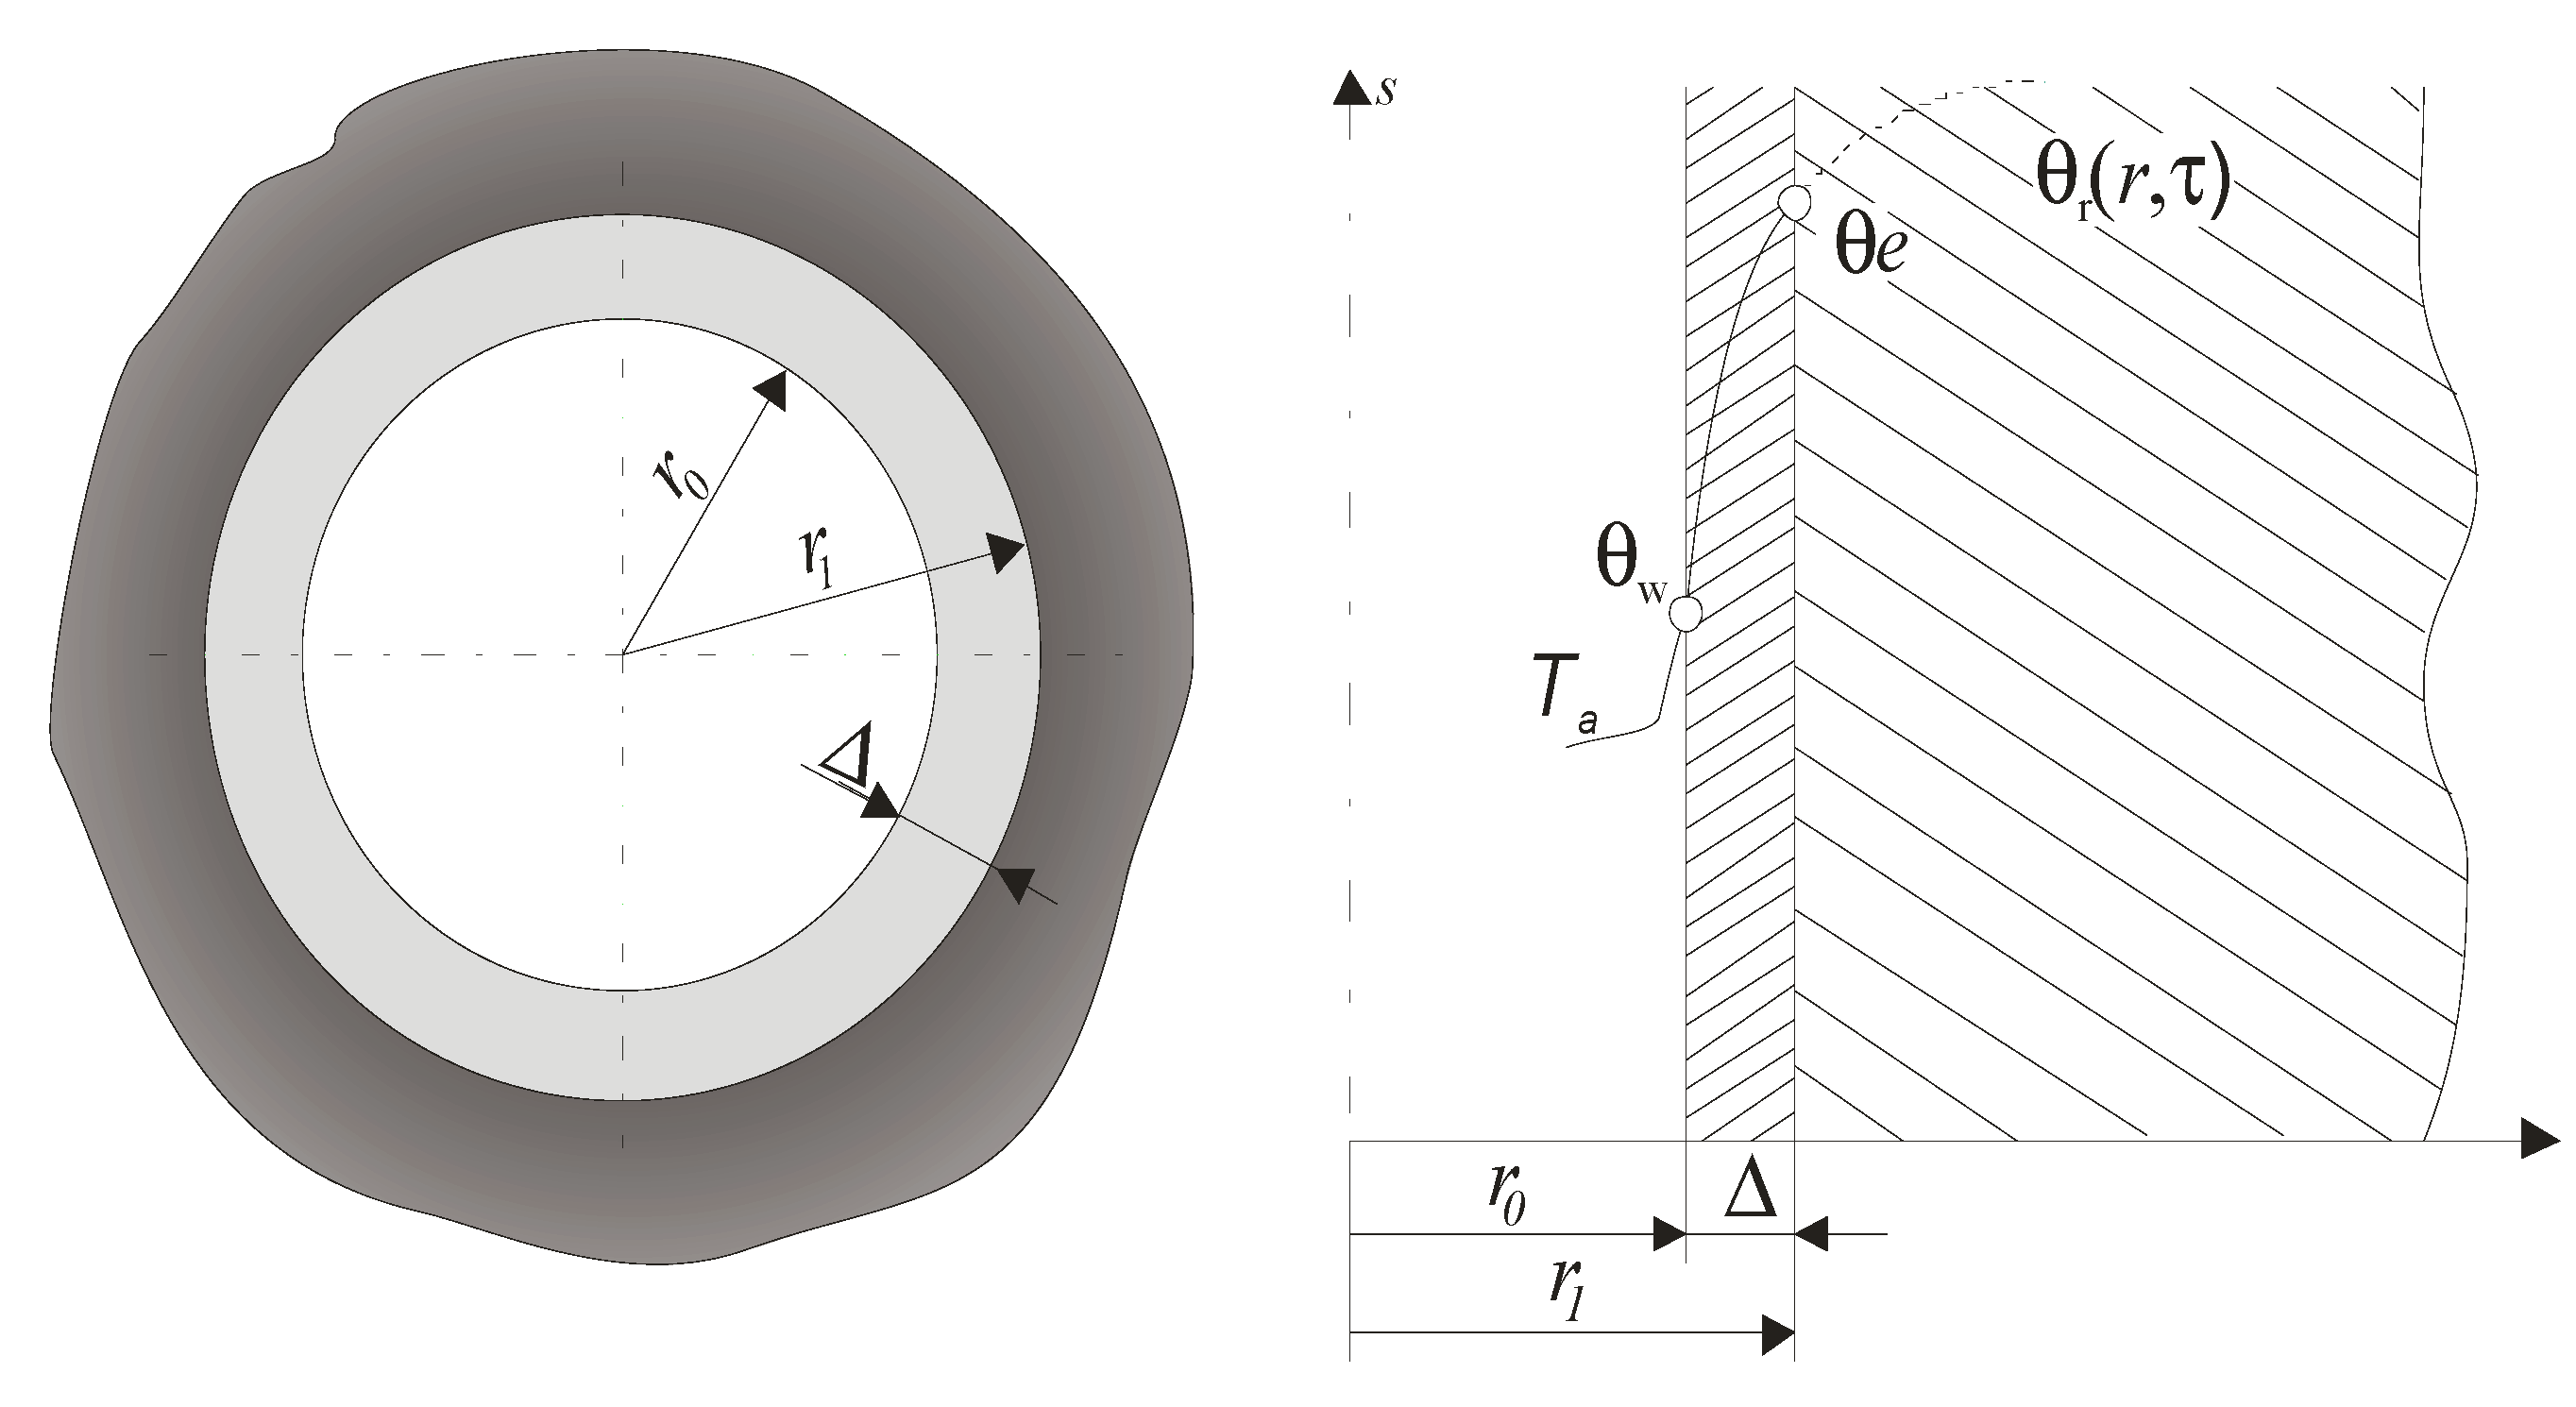
Calculating the Heat Flow Rate Permeating through the Insulating Layer

Pilot Roadway 7 was successfully drilled, which means that the time of existence of individual measurement sections was different. The amount of heat flux from the rocks was affected by the thermal conductivity coefficient of the insulating material λins, (W/(m·K)) and its thickness ∆, (m). The cross-sectional area of mine excavation with an insulating layer can be expressed with the equivalent diameter z, (m) with a radius r0, (m) and without an insulating layer with a radius of r1, (m). Figure 6 presents made assumptions.
The conductivity in the insulating layer was assumed to be a quasi-steady process. In the case of insulation, the temperature between the rocks and the insulation layer was different. The solution of the quasi-steady problem was derived, assuming that the surface temperatures of the insulating layer on the airside and the rock side change so slowly that in the area r0 ≤ r ≤ r1 at any time τ, (s), the temperature function ϑ ( r ) can be approximated by solving the stationary problem, given by [19]. The assumption had no practical impact on the quantitative description of the heat flow and enabled an effective solution.
The equations of thermal conductivity of rocks and energy of the flowing air in a mine excavation were solved for the initial conditions at τ = 0 when the air temperature at the inlet to the excavation Ta0, the virgin rock temperature θvr, and the surface rock temperature were known θw.
The heat balance equation determines the relationship between rock and air temperatures at the sidewall surface, which, supplemented with the effect of thermal radiation and moisture transfer from rocks, takes the form (1):
λ θ r | r = r i = α ( θ w T a ) + R ( θ w θ w r ) + f L ε ( p w s p w a )
where θ—temperature of the rock, °C; θw—average effective sidewall temperature, °C; Ta—air temperature in the excavation, °C; θwr—surface temperature, to which the sidewall with temperature θw emits radiation, °C; ε—mass transfer factor (moisture), kg/(m2sPa); L—latent heat of water vaporization, J/kg; pws—water vapor pressure in the saturated state at the rock surface temperature, Pa; pwa—water vapor pressure of the air in the excavation, Pa; α—coefficient of convection heat transfer, W/(m2·K); f—the degree of moisture in the perimeter of the excavation (averaged); and R—heat transfer coefficient by radiation, W/(m2·K).
For the case under consideration, it was assumed that the virgin rock temperature was known and that there was no water seeping or premating through the rock. Additionally, thermal radiation was ignored, and no other sources of heat supply were assumed. For such assumptions, the boundary condition for solving the heat flux F (W/m2) from a semi-infinitive solid of the strata to air in mine excavation is given by:
F = λ θ r | r = r 1 = α [ θ w T a ]
The problem was related to dealing with varying surface temperatures θw in time. Depending on the method of determining the rock surface temperature variable and thus the surface heat transfer coefficient, various simplified ways of solving the system of equations of thermal conductivity of rocks and energy of the flowing air were known [15,19]. A popular solution using the Laplace transform and giving a series of Bessel functions can be found in Carslaw and Jaeger (1956). More accurate solutions are obtained by numerical calculations [15,20,21]. For the case study, the solution presented by R. Nottrot and C. Sadee [21] was used to give the dimensionless heat flow rate K. K, also known as the dimensionless coefficient of heat transfer [22]. Such a solution made it possible to replace the explored temperature θw with the temperature θvr. The approximation of the tabulated in [21] values of a function K(Bi, Fo) in terms of the two independent variables, Biot Bi number and Fourier Fo number can be represented by the relationship:
K = ( 1 + ( 1.6 F o ) ) ( 1.77 F o ) + ( 1 B i ) ( 1 + ( 1.6 F o ) )
The strata heat flow was generally quoted for radial heat conduction because the natural geothermic gradient was small compared to the radial variation in temperature around the incremental length of the roadway. Therefore, it is assumed that the heat conduction was radial along the full length. Due to the changing sidewall temperature along the excavation length, the heat flow rate through the cylindrical shape of mine excavation is considered. The heat flow rate from the rock mass per unit length of the cylinder qc, (W/m) was equal to heat flow rate transferring through an isolation layer qins, (W/m) and equal to heat flow rate transferring to air by convection qa, (W/m).
q c = q i n s = q a
According to the solution of the heat equation and the Fourier heat conduction law, the heat balance Equation (4) per unit length of the cylinder is obtained:
2 π λ ( θ v r T a ) K = 2 π ( θ e θ w ) 1 λ i ln r 1 r 0 = 2 π r 1 k z ( θ e T a )
where qc, qi, qa—heat flow rate per unit length of the heading, W/m; kz—effective surface heat transfer coefficient, taking into account the processes of heat transfer from the air and thermal conductivity in the thermal insulation material, W/(m2·K); θe—temperature of the contact surface between the insulating layer and rocks, °C; Ta—air temperature in the heading, °C; and K—dimensionless heat flow rate as a function of Biot number and Fourier number.
Equations (4) and (5) present heat balance. The effective surface heat transfer coefficient kz considers the heat transfer processes from the airside and the thermal conductivity in the thermal insulation material with the coefficient λins, (W/(m·K)), and it is given by:
k z = 1 r 1 α 0 r 0 + r 1 λ i n s ln r 1 r 0
The heat transfer coefficient of external surface α0 is related primarily to the transfer of heat by convection from the insulated walls of the heading. The turbulent air flow depends on the equivalent diameter of the heading D0, the air velocity v, and the relative roughness. For insulated walls of the heading, the coefficient α0 is determined according to the formula:
α 0 = 3.336 ε w ( v ) 0.8 ( D 0 ) 0.2
where α0—convective heat transfer coefficient of the external surface, W/(m2 K); εw—coefficient considering the roughness of the heading sidewalls, assumed εw = 2 for walls covered with a layer of insulation, and v—mean air velocity in the heading, m/s.
As for the partially insulated heading (with the uninsulated floor), it was assumed that the heat flow rate reaching the air is a sum of heat flow rates from the fraction i of the heading perimeter:
q = i = 1 n q i b i
where bi is the share of the relevant part of the perimeter.
Heat flow rates were interpreted as cylindrical flows through the insulated and uninsulated perimeters. In the case under analysis, the following assumption was made:
q = q i n s b i n s + q f b f
The meaning of the subscripts is as follows: ins—refers to the heat supplied through the insulation; and f—refers to the heat supplied from the floor of the heading.
In calculations of the unit heat flowing through the insulated sidewall, the share of insulation in the perimeter of the heading bins = 0.69 was considered. The share of the floor in the circumference of the heading was bf = 0.31.
The heat flow rate penetrating the air from the uninsulated part of the heading was calculated according to the relationship:
q f = 2 π λ ( θ v r T a ) K f
where dimensionless heat flow rate Kf for the floor was determined according to the formula (3) for Biot Bi-f number and Fourier Fo-f number determined from the share of the uninsulated part of the heading circumference. In these calculations, it was assumed that the heading sidewalls were covered with thermal insulation with a thickness of 0.15 m and a coefficient of heat transfer of λins = 0.1 W/(m·K).
The following parameters of the heading were used for the calculations:
  • cross-section—14.8 m2,
  • time of drilling a section of 1256 m—16 months,
  • average thermal conductivity of rock, λ = 1.6 W/(m·K),
  • average thermal diffusivity of rock a = 0.6 × 10⁻⁶ m2/s,
  • virgin rock temperature, θvr = 39 − 42 °C.

4. Results and Discussion

Table 1 and Table 2 present the obtained results. The calculations were made for both uninsulated and fully insulated (floor included) excavation. Based on the share of the floor in the perimeter, an approximate share of heat flow rate permeating through the floor was established. The differences in the unit heat flow rates in columns 13, 14 and 15 of Table 1 result from the influence of several factors disturbing the heat balance equation. First, the air temperature resulted not only from the heat inflow from the rock mass but also from the operation of air conditioning. The results of temperature measurements θe could be affected by an error, as it is possible that there was an air gap between the rock and the insulating layer. Additionally, the rock distressed after it was rebuilt, so it was not a monolith. This meant that the heat flow rate in the column 13 was much greater than the rates from columns 14 and 15 determined, according to Newton’s law. Therefore, column 16 presents the average arithmetical result of heat transferring qav to the air through the insulation layer per unit of heading length.
Table 2 shows the results of calculations of the heat transfer to air from the floor according to the Equation (10). For such simplifying assumptions, it can be assumed that the share of the heat flow rate penetrating through the floor of the heading in the estimated share of the heat flow rate penetrating through the floor and sides is from 60% to 76% for the analyzed heading.
Figure 7 shows the results of calculations of heat flow rate per unit of heading length. Total heat flow rate is presented in Figure 1 as the sum of heat transferring through insulation layer qav and through the floor qf to the air.
To determine the influence of insulation on the heat inflow, theoretical calculations of the heat flow rate from the entire perimeter of the uninsulated heading were carried out with the assumption that the sidewall and air temperatures were equal to θe and Ta, respectively. The calculation results are shown in Figure 8.
Bearing in mind the awareness of the accuracy of the calculations and the influence of the simplifying assumptions as well as the accuracy of the measurement results, it can be stated that the insulation limits the heat inflow from 55% with a longer life of the heading to 75% with a short time of the rock exposure in the heading face.

5. Conclusions

The parameters of the insulating layer, such as the thermal conductivity coefficient and the insulation thickness, affect the heat flow rate from the strata.
Based on the measurement results of temperature in driven Pilot Roadway 7, it was possible to balance heat inflow from the strata. The roof and sidewalls of Pilot Roadway 7 were successively covered with an insulation layer to the advance of face heading. Pilot Roadway 7 was successively driven, which means that the time of existence of particular measurement sections was different.
The calculations were made for the heading separately for the share of circuits, respectively, for the insulated and uninsulated parts. The heat flow penetrating through the floor of the heading was calculated for the uninsulated part. The differences in the heat flow rates per unit of heading length result from several factors disturbing the heat balance equation. First, the air temperature results from the strata heat inflow and air conditioning operation. Secondly, the anisotropy of the strata, the technology of making insulation, and the metrological conditions of measuring the external surface temperature cause the balance of heat inflow to be approximated.
The calculation results with the simplifying assumptions show that the heat flow rate from the uninsulated floor of the insulated heading constitutes from 60% to 76% of the total heat flow depending on the distance from the heading face. The heat flow rates from the insulated and uninsulated heading show that the insolation reduces the heat inflow by 75% in the face zone and about 55% in the heading entrance zone.
The presented results have provided evidence that the thermal insulation of heading driven in rocks with a high virgin temperature is essential if it follows the advance of the heading face. It is possible to improve the thermal comfort in the face zone of heading ventilated with an auxiliary ventilation system in such conditions.
The obtained results of heat flow rate show that the airflow rate and the lifetime of a heading influence the air temperature. These parameters crucially affect the degree to which the sidewalls of the heading cool down. On the other hand, the characteristics of the insulating material are of secondary importance.

Author Contributions

N.S. developed a concept and methodology for the presentation of research results. D.O. contributed analysis tools, analyzed data. J.S. contributed analysis tools, analyzed data, and wrote the paper. All authors have read and agreed to the published version of the manuscript.

Funding

The article was prepared as part of the Subsidy for the Maintenance and Development of Research Potential at Faculty of Mining and Geoengineering AGH University of Science and Technology No. 16.16.100.215.

Institutional Review Board Statement

Not applicable.

Informed Consent Statement

Informed consent was obtained from all subjects involved in the study.

Data Availability Statement

Upon authors’ request.

Conflicts of Interest

The authors declare no conflict of interest.

References

  1. Szlązak, N.; Obracaj, D.; Borowski, M. Methods for controlling temperature hazard in Polish coal mines. Arch. Min. Sci. 2008, 53, 497–510. [Google Scholar]
  2. Szlązak, N.; Obracaj, D.; Borowski, M. Prognozowanie temperatury i wilgotności powietrza w wyrobiskach z wentylacją odrębną i urządzeniami chłodniczymi bezpośredniego działania za pomocą programu komputerowego. Wiadomości Górnicze 2008, 59, 86–96. (In Polish) [Google Scholar]
  3. Szlązak, N.; Obracaj, D.; Swolkień, J. Ocena i Możliwości Poprawy Stanu Zagrożenia Klimatycznego w Polskich Kopalniach Podziemnych; Agencja Wydawniczo-Poligraficzna ART-TEKST: Kraków, Poland, 2018. (In Polish) [Google Scholar]
  4. Chmura, K.; Chudek, M. Geotermomechanika Górnicza; Wydawnictwo Politechniki Śląskiej: Gliwice, Poland, 1992. (In Polish) [Google Scholar]
  5. Arkle, K.; Collins, L.; Blackwood-Murray, T.J. Use of thermal insulation materials in mines. J. Mine Vent. Soc. South Afr. 1985, 38, 43–45. [Google Scholar]
  6. Wacławik, J. Wpływ Izolacji Termicznej Skał na Intensywność Wymiany Ciepła w Wyrobiskach. Cuprum 2005, 2, 71–85. [Google Scholar]
  7. Szlązak, N.; Obracaj, D. Możliwości Wykorzystywania Termoizolacji Wyrobisk Udostępniających do Poprawy Warunków Klimatycznych; Nowe Spojrzenie na Wybrane Zagrożenia Naturalne w Kopalniach, Główny Instytut Górnictwa: Katowice, Poland, 2012; pp. 164–174. ISBN 978-83-61126-50-8. (In Polish) [Google Scholar]
  8. Szlązak, N.; Obracaj, D. Wpływ termoizolacji wyrobisk chodnikowych na warunki klimatyczne. In Proceedings of the Materiały Szkoły Eksploatacji Podziemnej, Kraków, Poland, 20–24 February 2012; Instytut Gospodarki Surowcami Mineralnymi i Energią Polskiej Akademii Nauk: Kraków, Poland, 2012. (In Polish). [Google Scholar]
  9. Bottomley, P. The Reduction in Heat Flow due to the Insulation of Rock Surfaces in Mine Air Ways, 2nd ed.; US Mine Ventilation Symposium: Reno, NV, USA, 1985. [Google Scholar]
  10. Bottomley, P.; van Rensburg, B. The insulation of rock surfaces—An empirical study. J. Mine Vent. Soc. South Afr. 1987, 40, 41–45. [Google Scholar]
  11. Hughes, R.O. A few thoughts on heat loads in intake haulages. J. Mine Vent. Soc. South Afr. 1978, 31, 50–53. [Google Scholar]
  12. Kollu SRao Sastry, B.S.; Misra, B. The insulation of Mine Roadway Rock Surfaces—An Altemative for Reduction of Strata Heat Flow. In Proceedings of the 16 World Mining Congress, Sofia, Bulgaria, 12–16 September 1994. [Google Scholar]
  13. Strumiński, A.; Nędza, Z.; Turkiewicz, W. Wykorzystanie Termoizolacji Wyrobisk Górniczych do Poprawy Warunków Klimatycznych w Kopalniach LGOM; Politechnika Śląska: Gliwice, Poland, 1994. (In Polish) [Google Scholar]
  14. Liu, W.V.; Apel, D.B.; Bindiganavile, V. Thermal characterisation of a lightweight mortar containing expanded perlite for underground insulation. Int. J. Min. Miner. Eng. 2011, 3, 55–71. [Google Scholar] [CrossRef]
  15. Yao, W.; Pang, J.; Ma, Q.; Lyimo, H. Influence and sensitivity analysis of thermal parameters on temperature field distribution of active thermal insulated roadway in high temperature mine. Int. J. Coal Sci. Technol. 2021, 8, 47–63. [Google Scholar] [CrossRef]
  16. Knechtel, J. Wpływ rodzaju termoizolacji na poprawę trudnych warunków klimatycznych w gorących wyrobiskach górniczych. In Materiały III Konferencji Wybieranie Złóż na Dużych Głębokościach Oraz w Trudnych Warunkach Geotermicznych; Lądek Zdrój: Wrocław, Poland, 2000; pp. 26–29. (In Polish) [Google Scholar]
  17. Soroko, K.; Kowalik MGola SNieśpiałowski, T. Schładzanie powietrza zespolonym układem: Urządzenie chłodnicze–termoizolacja. Cuprum 2006, 1, 53–72. (In Polish) [Google Scholar]
  18. Piany – Isoschaum. Available online: https://www.dsi-schaumchemie.pl/produkty/piany/isoschaum (accessed on 1 July 2021).
  19. Carslaw, H.S.; Jaeger, J.C. Conduction of Heat in Solids, 2nd ed.; Oxford University Press: Oxford, UK, 1959; reprint in 2000; Volume 310. [Google Scholar]
  20. Wang, J.; Wan, Z.; Zhang, H.; Wu, D.; Zhang, Y.; Wang, Y.; Xiong, L.; Wang, G. Application of Thermal Insulation Gunite Material to the High Geo-Temperature Roadway. Adv. Civ. Eng. 2020, 2020, 8853870. [Google Scholar] [CrossRef]
  21. Nottrot RSadée, C. Abkühlung homogenen isotropen Gesteins um eine zylindrische Strecke durch Wetter von konstanter Temperatur. Glückauf Forschungsh. 1966, 27, 193–200. [Google Scholar]
  22. Wang, Y.; Zhou, G.; Wu, L.; Yang, Z.; Lu, Y. An analytical study of unsteady heat transfer in the rock surrounding a deep airway. Int. J. Min. Sci. Technol. 2012, 22, 411–415. [Google Scholar] [CrossRef]
Figure 1. The map of the seam 409 with marking the analyzed Pilot Roadway 7.
Energies 14 04170 g001
Figure 2. Installation of plastic sleeves behind the yielding arch of the heading.
Energies 14 04170 g002
Figure 3. Scheme of the overlap auxiliary ventilation system with methane concentration measurement zones.
Energies 14 04170 g003
Figure 4. Changes in air temperature in the heading under analysis; (a) at the working face, (b) entrance of the heading.
Energies 14 04170 g004
Figure 5. Temperature distribution around the perimeter of the excavation and behind the insulating foam layer in the driven Pilot Roadway 7 in coal seam 409—measurement series on 16 October (before breaking the heading and obtaining a through-flow ventilation).
Energies 14 04170 g005
Figure 6. Schematic diagram of the heat flow model through the thermal insulation layer of a mining excavation.
Energies 14 04170 g006
Figure 7. The results of calculations of the heat flow rate per unit of the heading length for the results of the measurement series on 16 October (Table 1 and Table 2).
Energies 14 04170 g007
Figure 8. Comparison of the calculation results of heat flow rate in an insulated heading with the theoretical heat flow rate without insulation.
Energies 14 04170 g008
Table 1. Results of measurements and calculations of heat transfer through the insulation layer of the heading.
Data and ResultsHeat Flow Rate acc to (5)
12345678910111213141516
sTaθwθevθvrτα0kzFoBiKqcqinsqaqav
m°C°C°Cm/s°CdaysW/(m2·K)W/(m2·K)---W/mW/mW/mW/m
627.828.331.00.939.03725.0840.55011.8350.4390.21424.113.411.816.4
5628.028.731.00.9390.03475.0840.55011.0400.4390.21623.911.810.315.3
10628.229.331.00.939.03325.0840.55010.5620.4390.21823.78.47.413.2
15628.330.332.00.939.53175.0840.55010.0850.4390.21923.68.47.413.1
20628.330.332.00.940.03005.0840.5509.5440.4390.22126.08.47.413.9
25628.231.032.00.940.02905.0840.5509.2260.4390.22226.45.04.412.0
30628.231.333.00.840.02734.6270.5438.6850.4330.22326.48.47.314.0
35628.131.734.00.840.02584.6270.5438.2080.4330.22526.911.810.216.3
40628.132.034.00.840.02404.6270.5437.6350.4330.22727.110.18.715.3
45628.131.733.00.840.02304.6270.5437.3170.4330.22827.36.75.813.3
50628.032.334.00.740.02154.1580.5356.8400.4270.22927.68.47.214.4
55628.032.334.00.740.02004.1580.5356.3630.4270.23127.98.47.214.5
60628.032.734.00.741.01854.1580.5355.8860.4270.23330.56.75.714.3
65627.932.334.00.741.01704.1580.5355.4080.4270.23631.18.47.215.6
70627.932.033.00.641.01553.6760.5254.9310.4190.23631.15.04.213.5
75627.831.334.00.641.01413.6760.5254.4860.4190.23931.813.411.318.8
80627.831.735.00.641.01253.6760.5253.9770.4190.24332.316.814.121.1
85627.832.035.00.641.01123.6760.5253.5630.4190.24732.715.112.720.2
90627.732.335.00.541.0973.1770.5123.0860.4090.24833.113.411.019.2
95627.732.336.00.541.0823.1770.5122.6090.4090.25333.818.515.122.5
100627.632.035.00.542.0653.1770.5122.0680.4090.26037.615.112.421.7
105627.632.036.00.542.0513.1770.5121.6230.4090.26738.720.216.525.1
110627.532.336.00.542.0353.1770.5121.1140.4090.27940.618.515.124.7
115627.432.336.00.442.0222.6580.4950.7000.3950.28541.918.514.625.0
120627.333.036.00.442.052.6580.4950.1590.3950.32447.915.111.925.0
125627.232.736.00.442.032.6580.4950.0950.3950.33549.916.813.326.7
Table 2. Results of measurements and calculations of heat transfer from the rock mass through the floor of the heading.
Data and ResultsHeat Flow Rate acc. to (10)
124567891011
sTavθvrτα0-fBi-fFo-fKfqf
m °Cm/s °CDaysW/(m2·K)---W/m
627.80.940.03725.9672.13958.6330.23926.9
5628.00.940.03475.9672.13954.6920.24326.8
10628.20.940.03325.9672.13952.3280.24526.6
15628.30.940.03175.9142.12049.9640.24827.9
20628.30.940.03005.8072.08147.2850.25029.5
25628.20.940.02905.7002.04345.7080.25229.9
30628.20.840.02735.5922.00543.0290.25530.2
35628.10.840.02585.4301.94640.6650.25730.8
40628.10.840.02405.3211.90737.8280.26131.2
45628.10.840.02305.1571.84836.2520.26331.4
50628.00.740.02155.0471.80933.8870.26632.1
55628.00.740.02004.8801.74931.5230.26932.5
60628.00.741.01854.7681.70929.1590.27335.7
65627.90.741.01704.5991.64826.7950.27736.4
70627.90.641.01554.4861.60824.4300.28137.1
75627.80.641.01414.3141.54622.2240.28637.9
80627.80.641.01254.1981.50519.7020.29238.7
85627.80.641.01124.0821.46317.6530.29839.5
90627.70.541.0973.9061.40015.2890.30540.7
95627.70.541.0823.7881.35812.9240.31442.0
100627.60.542.0653.6691.31510.2450.32847.5
105627.60.542.0513.5481.2728.0380.34349.6
110627.50.542.0353.4271.2285.5170.36853.6
115627.40.442.0223.3051.1843.4680.40158.8
120627.30.442.053.2431.1620.7880.53579.0
125627.20.442.033.1191.1180.4730.57785.8
Publisher’s Note: MDPI stays neutral with regard to jurisdictional claims in published maps and institutional affiliations.

