Article

Secondary Energy Sources and Their Optimization in the Context of the Tax Gap on Petrol and Diesel

1
Department of Information Science and Management, Academy of the Police Force in Bratislava, 835 17 Bratislava, Slovakia
2
Department of Management, Faculty of Management, University of Prešov, 080 01 Prešov, Slovakia
3
Department of Natural Sciences and Humanities, Faculty of Manufacturing, Technologies of the Technical University of Košice, 080 01 Prešov, Slovakia
*
Authors to whom correspondence should be addressed.
Energies 2021, 14(14), 4121; https://doi.org/10.3390/en14144121
Submission received: 17 May 2021 / Revised: 25 June 2021 / Accepted: 29 June 2021 / Published: 8 July 2021
(This article belongs to the Special Issue Energy Management: Economic, Social, and Ecological Aspects)

Abstract

:
This paper presents an energy management strategy for secondary energy sources and their optimization in the context of the tax gap on mineral oils represented by the tax gap on petrol and diesel. Energy companies face drastic economic and environmental challenges; therefore, this area necessarily requires the setting up of transparent economic instruments and, of course, production. The tax gap in VAT collection represents the gap between how much the state could potentially collect from VAT in accordance with the law and how much VAT really comes into the state coffers. The loss of tax revenues is caused by unpaid and undeclared tax liability. The Estimation of the Gap on Corporate Tax in Slovakia is a pilot project of the International Monetary Fund (IMF) in cooperation with the Institute for Financial Policy (IFP). The results present the estimation of the tax gap within a two-year delay. It is necessary to consider the estimation of the tax gap in the last two years as preliminary due to possible revisions of the national accounts data. Estimations of the tax gap from 2010 to 2017 indicate a decreasing trend. The significant part of the tax gap decrease can be observed from 2014. The main factor, which determines this decrease, is the improving condition of the Slovak economy. From the point of view of the tax gap, the volume of losses is decreasing and the volume of profit, from which the tax is paid, is increasing.

1. Introduction

In the context of ongoing global warming, with environmental concerns regarding greenhouse gas emissions due to our increasing energy consumption, smart energy management solutions have gained popularity as they have the potential to reduce our impact on the environment and also on our budgets [1]. To face economic and environmental challenges, future ground vehicles must consume less energy and cause less pollution [2].
The role of management practices in the success of energy organizations is not negligible because management practices are the backbone of any organization [3,4,5,6,7]. Energy organizations are facing drastic economic and environmental issues; therefore, the sector inevitably requires transparent tools and production to be set up, which is only possible through the deployment of concurrent management practices, because sluggish management practices lead to dormancy and inadequate performance [8,9]. In this context, it is necessary to draw attention to research that has been carried out. Ionescu, L. [10] has performed analyses and presented estimates regarding the relationship between environmental performance, sustainable energy, and green financial behavior. Data collected from 5200 respondents were tested against a research model using structural equation modeling. K. Harrower [11] presented an empirical study conducted to evaluate and analyze networked and integrated urban technologies in sustainable intelligent energy systems. Based on its own arguments and drawing on data collected from Energy B2B, McKinsey, PwC, Schneider Electric, Statista and U.S. Pat., the Energy Information Administration performed analyses and presented estimates of organizations promoting renewable energy sources and using green energy technologies and investment strategies. Data for this research were collected through an online questionnaire and analyzed using structural equation modeling on a sample of 3800 respondents. G. Eysenck [12] drew on a substantial part of theoretical and empirical research on intelligent energy management systems. The data used in this study were obtained and replicated from previous research conducted by Energy B2B, Eurostat, PwC, Schneider Electric, and Statista. Analyses were completed and estimates were presented concerning the rate of adoption of energy efficiency and resource efficiency, renewable energy, and other technologies and strategies. Data collected from 3400 respondents were tested against a research model using structural equation modeling.
The issue of the effective collection of tax revenues is today one of the most significant problems faced by individual states, as public levies are the primary source of budget revenues [13]. At the same time, almost every state is obliged, to a greater or lesser degree, to pursue an overriding fiscal goal through shrinking excessive general government deficits in a manner that does not hamper the growth outlook for the state, and simultaneously supports business activities [14].
A lack of adequate levels of budget revenues hinders, and at times prevents the state from functioning effectively. Meanwhile, business entities always optimize their operations so as to make them profitable and one of the common methods is tax optimization.
This is increasingly carried out in an aggressive form by combining legal tax avoidance with illegal tax evasion. Therefore, a demonstration of the economic growth in a specific country does not necessarily suggest an increase in the level of budget revenues despite companies’ heftier revenues and profits [15,16]. The reasons behind this situation should be traced to the occurring and widespread tax gap, which is likely to increase when the state becomes incapable of opposing illegal tax activities conducted by the entities that commit tax crimes without being punished, because either the act was not disclosed, insufficiently penalized, or not penalized at all on the grounds that the perpetrator could not be identified [17,18].
The tax gap may be defined from the institutional perspective of tax authorities as “the difference between tax collected and the tax that should be collected” [19]. This definition is compatible with the conception embraced by the US fiscal authorities (IRS) as “the difference between the tax that taxpayers should pay and what they actually pay on a timely basis” [20] or otherwise “the difference between the true tax liability in any year and the amount of tax that is paid voluntarily and on time” [21]. It was the IRS in the US which was the first authority worldwide to implement the Taxpayer Compliance Measurement Program (TCMP) in 1963 with the goal of periodically (every few years) estimating the number of taxpayers that discharge tax obligations, and to assess potentially lost tax revenues [22]. The research from TCMP was applied to the Discriminant Inventory Function (DIF) and the surveys covered around 50,000 individual taxpayers. The program was suspended in 1998 and then replaced (as a specific continuation) by the National Research Program (NRP) which is currently running [23].
Value Added Tax (VAT) is the most significant source of the state budget revenue and is the second most important source of the public administration budget revenue. The way the VAT system works is quite disposed to tax evasion, which ranks VAT in combination with a high volume of domestic and international transactions among the high-risk taxes. The presented methodology is based on the tax gap first estimation, which was processed in 2012. Subsequently, the methodology was moderately revised. In 2014 a more detailed estimation of the sector gap was included in the portfolio of the tax gap estimation in cooperation with the International Monetary Fund.
According to a preliminary estimation, the VAT tax gap in 2018 reached 26.9% from potential VAT in Slovakia. Compared to 2012, when the VAT tax gap reached its peak, it was reduced by more than one third. In a nominal representation, the gap between potential and real VAT revenues was EUR 2.3 billion (2.6% of VAT) last year.
The VAT tax gap is estimated by the mean of two approaches. In both cases, it is the so-called top-down method, which arises from macroeconomic aggregates. The first approach is based on final consumption and serves to estimate the overall tax gap. Its main advantage is its relatively simple estimation, the possibility of actualization in time, and its limited need for input data. On the other hand, its disadvantage is that it does not provide more specific information about the composition of the tax gap. The second approach simulates the customer-supplier relationship among the sectors and the principle of VAT application. The advantage of this approach is the view of the composition of the tax gap (the sector decomposition). The disadvantage is its demand for input data and a marked time delay in the availability of necessary input tables of supplies and use.
The VAT tax gap is the gap between potential tax revenues, which should be collected if all economic subjects acted in accordance with the law, and actual collected tax. The VAT tax gap in Slovakia is estimated in aggregate and sector ways, with a top-down approach. The estimation is based on different approaches using various data and suppositions. Both approaches are the part of the material. The tax gap is subsequently divided into non-identified VAT and the tax collection gap (Figure 1).
Potential VAT revenues are calculated as the difference between the theoretical basis of VAT and actual paid VAT, which is multiplied by the average VAT estimable rate. The theoretical basis is the sum of all the macroeconomic aggregates liable to VAT. Non-identified VAT is a part of the gap, which tax subjects willfully or unwilfully did not return and at the same time was not identified by the Financial Administration of the Slovak Republic within the frame of inspection. It is calculated as the gap between potential and imposed tax. The tax collection gap is the gap between imposed tax and actual paid tax. It also includes added imposed tax duty after tax control, which was not paid. Imposed tax includes the tax returned by VAT taxpayers in declaration of taxes and added imposed tax within the frame of the Financial Administration inspection (under the term of added imposed tax it is understood as added individual tax duty, but also as a reduced value of claimed excessive deduction). Imposed tax is calculated as an aggregate of the individual tax duty from all tax reports and the VAT value paid at the customs office, which is reduced by the sum of excessive deductions in the tax period. The calculation takes into consideration the recent valid tax return. Actual paid tax arises from the transactions between the Financial Administration of the Slovak Republic and the taxpayers. Transactions are added into appropriate tax periods, which enables the exact amount of accrual tax (amount of tax duty corresponding with the tax period, in which the activity (from which the tax is imposed) to be calculated.

2. Literature Review

Opinions of top and middle-level managers working in the energy organizations sector the energy economy managers postulate that the implementation of knowledge management practices and policy changes are the key influencing factors to achieve sustainable organizational performance in transparent areas. [24,25] Combining accountability and transparency also has the potential to influence and navigate the organizational performance of energy companies [26] and to minimize loss of tax revenues and their optimization in context of tax gap on mineral oils represented by tax gap on petrol and diesel. The findings advocate innovative practices for the energy sector that influence organizational performance also in HR area [27,28]. In this context, it is important to avoid tax differences in the collection of VAT, which means the difference between how much the state could potentially collect from VAT in accordance with the law and how much VAT it will actually collect.
In this context, an in-depth literature review of the carbon tax was carried out and used to make estimates of the environmental efficiency of carbon pricing. Data were analyzed by modeling structural equations [29]. Carbon emissions tax is an adequate market-based approach to reduce carbon emissions, influencing participants in the supply chain to reconsider their appropriate operational decisions [30]. Carbon tax on energy production sector escalates energy supply expenses, while carbon emission trading exacerbates energy demand expenses [31]. Both a carbon tax and environmental subsidies constitute coherent strategies to curb greenhouse gas emission [32]. The clout of carbon tax develops on consumers ’feedback to price changes [33]. Various emission regulation approaches impact the companies in recon-figuring their supply chain [34] in the direction of sustainable management [35] and due to exonerations to industrial carbon taxes, or by emissions trading schemes [36].
The tax gap can be defined as the difference between the amount of tax imposed by the tax law and the amount that is reported and paid together with the timely return [37]. Tax debt, which is connected with tax noncompliance, can be measured. On the contrary, the amount of the tax gap, as an accounting category, we are only able to estimate [38]. The absence of a common tax gap definition results in different methodologies for estimating it [39]. The two main methodologies are top-down and bottom-up [40]. As the estimating of VAT gaps indicates the magnitude of potential VAT evasion, it is gaining in importance in order to fight against the growing tax fraud within EU. Although it also includes no fraudulent non-payments as the insolvency. The VAT gap arises not only due to fraudulent or defaulted taxpayers, but also from inefficiency of the tax authorities [41,42]. It is very important to know factors affecting the VAT gaps in der to change the VAT policy in a way that would reduce the gap size [43]. There is extensive amount of literature about different methods of tax gap estimation [44,45,46,47,48] but only a few studies, that empirically evaluate the tax gap dependence are accessible [43].
In 2013 the Centre for Social and Economic Research (CASE) and The Netherlands Bureau for Economic Policy Analysis (CPB) have conducted broad studies on tax gaps [46], where the VAT gap estimations for EU member states for the 2001–2011 period are published. The top-down method was applied on the national accounts data and estimations were obtained. In 2016 the VAT gap estimates for the period 2010–2014 was published in a final report [47]. A method is known for data from random audits with a generalization to the entire taxpayer population [48]. Swedish National Tax Agency [49], and Danish Tax and Customs Administration [50]. An overview of different methods for assessing the VAT gaps applied by member states is given in the study by the Tax Gap Project Group [51].
In principle, there are two types of methodologies, depending on the data used and the degree of detail required in the calculation [52,53]. These emphasize that the tax gap can be estimated on the basis of data from the underground economy and the application of the effective tax rate, respectively using macroeconomic indicators (gross domestic product or national consumption).
Taxpayers ‘compliance is a voluntary activity and is influenced by taxpayers’ knowledge that their moral and legal responsibility is to pay taxes [22].
An approach based on internal data from the tax administration provides information by wealth or income group, which is important when estimating the ad persona tax gap [54,55].
Within the European Union, the Commission also supported a study on the VAT gap, a harmonized tax at European level (initially for the period 2000–2006) [56]. From 2013 to the present, estimates have been published annually using a good methodology [57]. Potential revenues from indirect taxes (VAT) are obtained through corresponding tax rates [58].

3. Materials and Methods

3.1. Theoretical Input to Experimental Analysis

Even though the modern tax system depends on an unforced observance of the rules, there are often many tools to measure and monitor the observance of taxes. The analysis of the tax gap provides information to the administrators and creators of the policies and their participating sides about the amount and rate of loss of tax revenues that are lost due to the non-observance of the rules, avoiding tax duties and the influence of political decisions.
For each tax, the gap (as defined in MMF RA-GAP) is the difference between the potential revenue of the elementary economic tax basis and the actual revenue. Defined in general terms, the tax gap can be divided into two main parts: the discordance range (the gap in observing legal measures) and the influence of political decisions (political gap). This relationship is described in Figure 2.
Defining the tax gap this way allows the relative sizes of the gap in observing the rules to be compared with the gap in politics, which provides a view of their relative sum. Two factors contribute to the tax gap. This enables the tax administrators and the creators of the policy to judge the potential directions of the steps needed to improve the efficiency of revenues and find a solution to any component of the gap.

3.2. Tax Gap on Corporate Income Tax

The Estimation of the Gap on Corporate Tax in Slovakia is a pilot project of the International Monetary Fund (IMF) in cooperation with the Institute for Financial Policy (IFP). The results present the estimation of the tax gap within a two-year delay. It is necessary to consider the estimation of the tax gap in the last two years as preliminary due to possible revisions of the national accounts data.
The estimations of the tax gap from 2010 to 2017 indicated a decreasing trend. The significant part of the tax gap decrease can be observed from 2014. The main factor, which determines this decrease, is the improving condition of the Slovak economy. From the point of view of the tax gap, the volume of losses is decreasing and the volume of profit, from which the tax is paid, is increasing. The decrease in the tax gap related to corporate tax, mainly from 2015 to 2017, may be distorted by shortcomings on the side of the input data. It mainly indicates a comparison of the developing tax gap on corporate tax with the tax gap on VAT.
The tax gap is the gap between potential revenues from particular activity and actual tax collection. The source of the tax gap is the non-observance of tax measures (compliance gap) and the legislative gap (policy gap) in the form of tax incentives or exemptions compared with the hypothetical tax structure in the form of the broadest tax base. This relationship is described in Figure 3.
The tax gap due to the non-observance of tax measures can be caused by several factors:
  • Unintended mistakes on the side of the taxpayer (e.g., because of insufficient knowledge or misinterpretation of tax legislation);
  • Non-payment of tax at firms in bankruptcy proceedings;
  • Intended activities of the taxpayer focused on a reduction in the tax duty.
Intended activities focused on the reduction in tax duty can be further divided into the optimization of tax duty (tax avoidance) and tax fraud (tax evasion). Optimization is in accordance with the law but is not necessarily the intention of the lawmakers. One example is the practice of the transfer of profits, which was primarily formed in order to reduce the tax duty. On the other side, tax fraud is represented by illegal activities such as undeclared income or overestimating costs. Potential tax revenues are derived from the macroeconomic basis in the national accounts. The gross operating surplus is the basis for the estimation of the tax gap in the national accounts. It is represented by the corporate index EBITDA (profit of the corporation before the adjustment of interests. Taxes, deductions and amortization). The tax gap on corporate income tax is estimated only for the sector of non-financial corporations classified as S.11 in the national accounts. The financial corporation’s S.12 sector was not included in the estimation due to limited data in relation to the cleaning of the gaps in forming the added value of the financial sector at the level of the national accounts compared to accountancy. One example is changes in the prices of assets, changes in the value of reserves, or an amortization of debts, which significantly influence the economic results of financial corporations, but do not directly enter into the gross operating surplus in the national accounts.
The tax gap was also not estimated for the subjects belonging to the public administration sector (S.13) and the non-profit sector (S.15). For these sectors, no direct relationship between the gross operating surplus and the tax basis is prescribed, as is the case for non-financial corporations. The limitation in the case of the public sector (S.13) is non-market production recorded in the national accounts in the form of consumption of the fixed capital, which does not enter into the tax basis for corporate income tax. The elimination of financial corporations and the subjects of non-profit or public sectors does not reduce the quality of the tax gap estimation. From the point of view of paid corporate tax, non-financial corporations create approximately 85% of the volume of paid tax while financial operations contribute 12%. The public and non-profit sectors create 3% together.
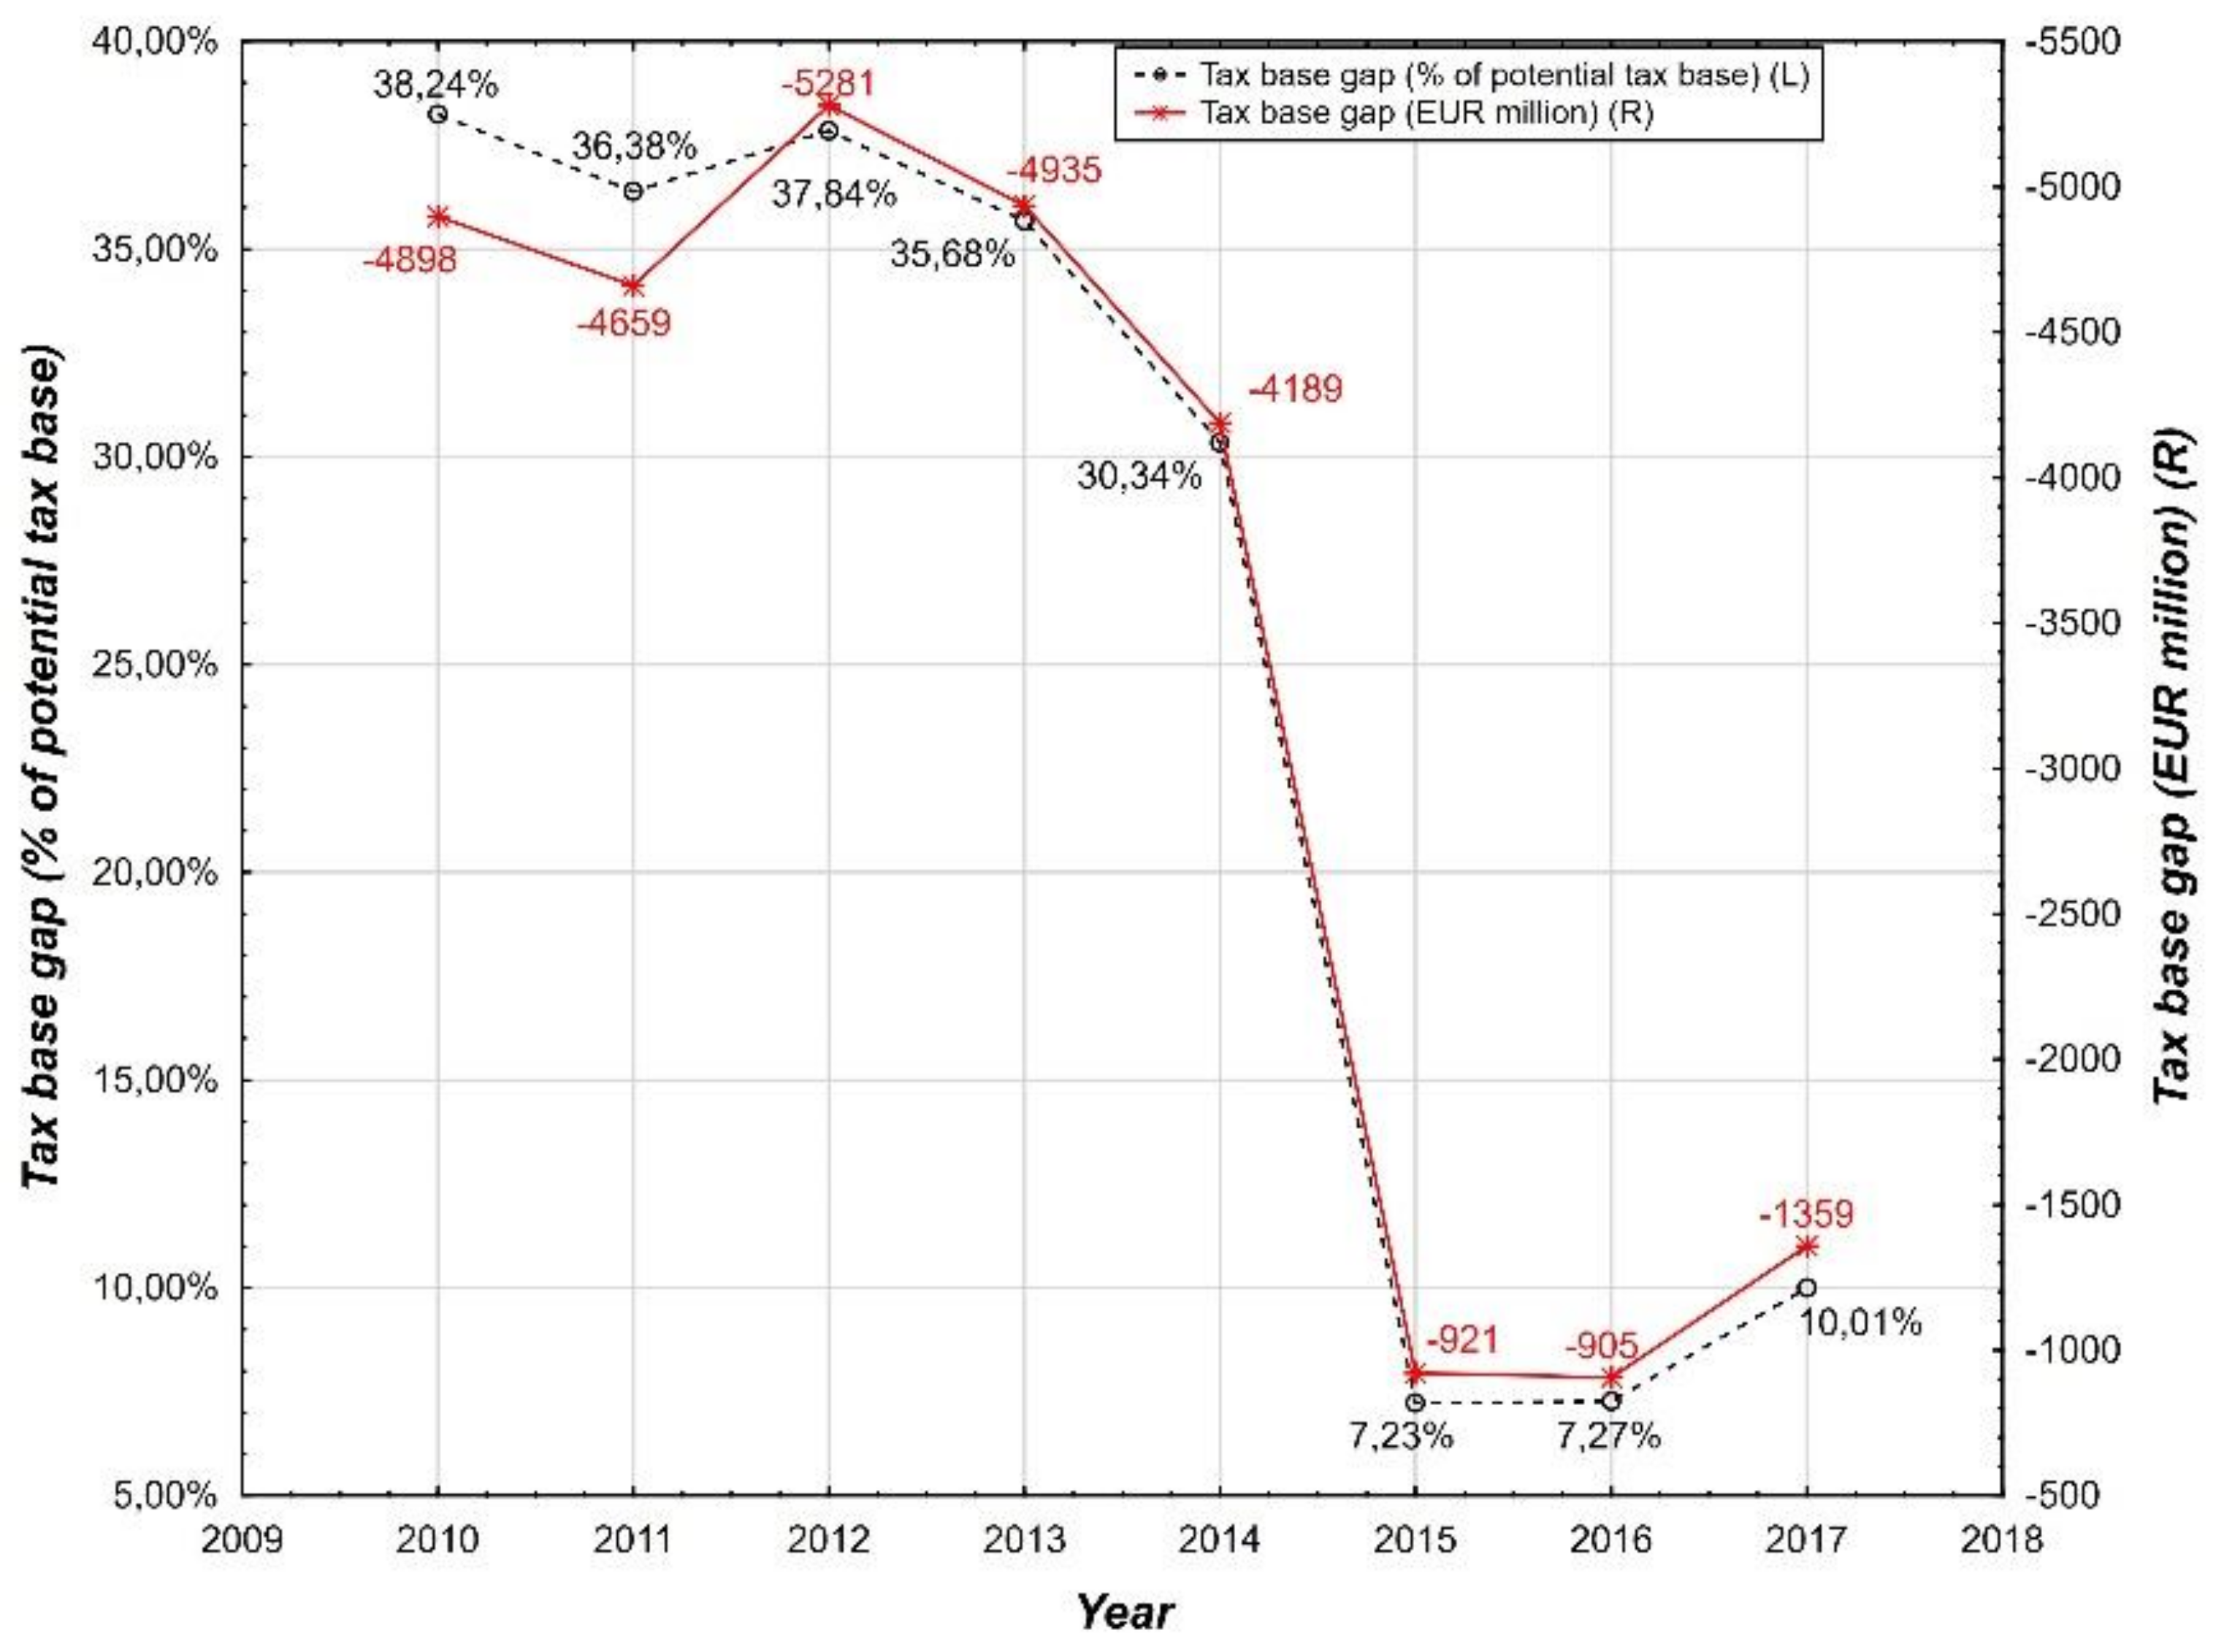
The results of the estimation of the tax gap are presented by the indicators of the tax base gap (Figure 4) and the tax gap (Figure 5). The tax base gap provides a more accurate estimation of the gap development between declared and potential bases. The tax base was not yet influenced by the deduction (redemption) of tax losses from the previous years and tax credits, which entered into the calculation of the final tax and tax gap. Due to these factors, which are not connected with tax evasion, the observed development of the tax gap can be more volatile compared to the tax base gap.
The results of the tax base gap (Figure 4) and the tax gap (Figure 5) indicate a long-term decreasing trend. The exception was the slight increase in the last year. The significant part of the gap decrease has been observed since 2014. The main factor, which determines this decrease, is the improving condition of the Slovak economy. From the point of view of the tax gap, the volume of losses is decreasing and volume of profit, from which the tax is paid, is increasing. Above and beyond the economic fundamentals, the decrease in losses can also be attributed to legislative measures, such as introduction of the tax license and the Register of Financial Statements. The tax license reduced the motivations of the subjects to optimize their activities with the goal to achieve economic loss or a zero-tax base, which is not a reason not to pay the tax. Increased motivation to present real information about the economic situation could be brought by the Register of Financial Statements, which enables public control of the financial statements of the corporation.
Above and beyond economic fundamentals, it is necessary to interpret the significant decrease in the tax gap from 2015 to 2017 cautiously. The derivation of the potential tax base from the gross operating surplus requires numerous adjustments, which can deform the results due to shortcomings on the side of data. This is also indicated by the comparison of the development of the gaps (Figure 6) on corporate tax and value added tax (VAT). In practice, most of the corporations that pay corporate income tax also pay VAT.
At the same time, the estimation of the tax gap on VAT is more accurate compared to the corporate income tax. The reason for this is the direct relationship between the macro base for VAT derived from the national accounts, and VAT collection in practice, which does not require such broad cleaning by means of additional data inputs.
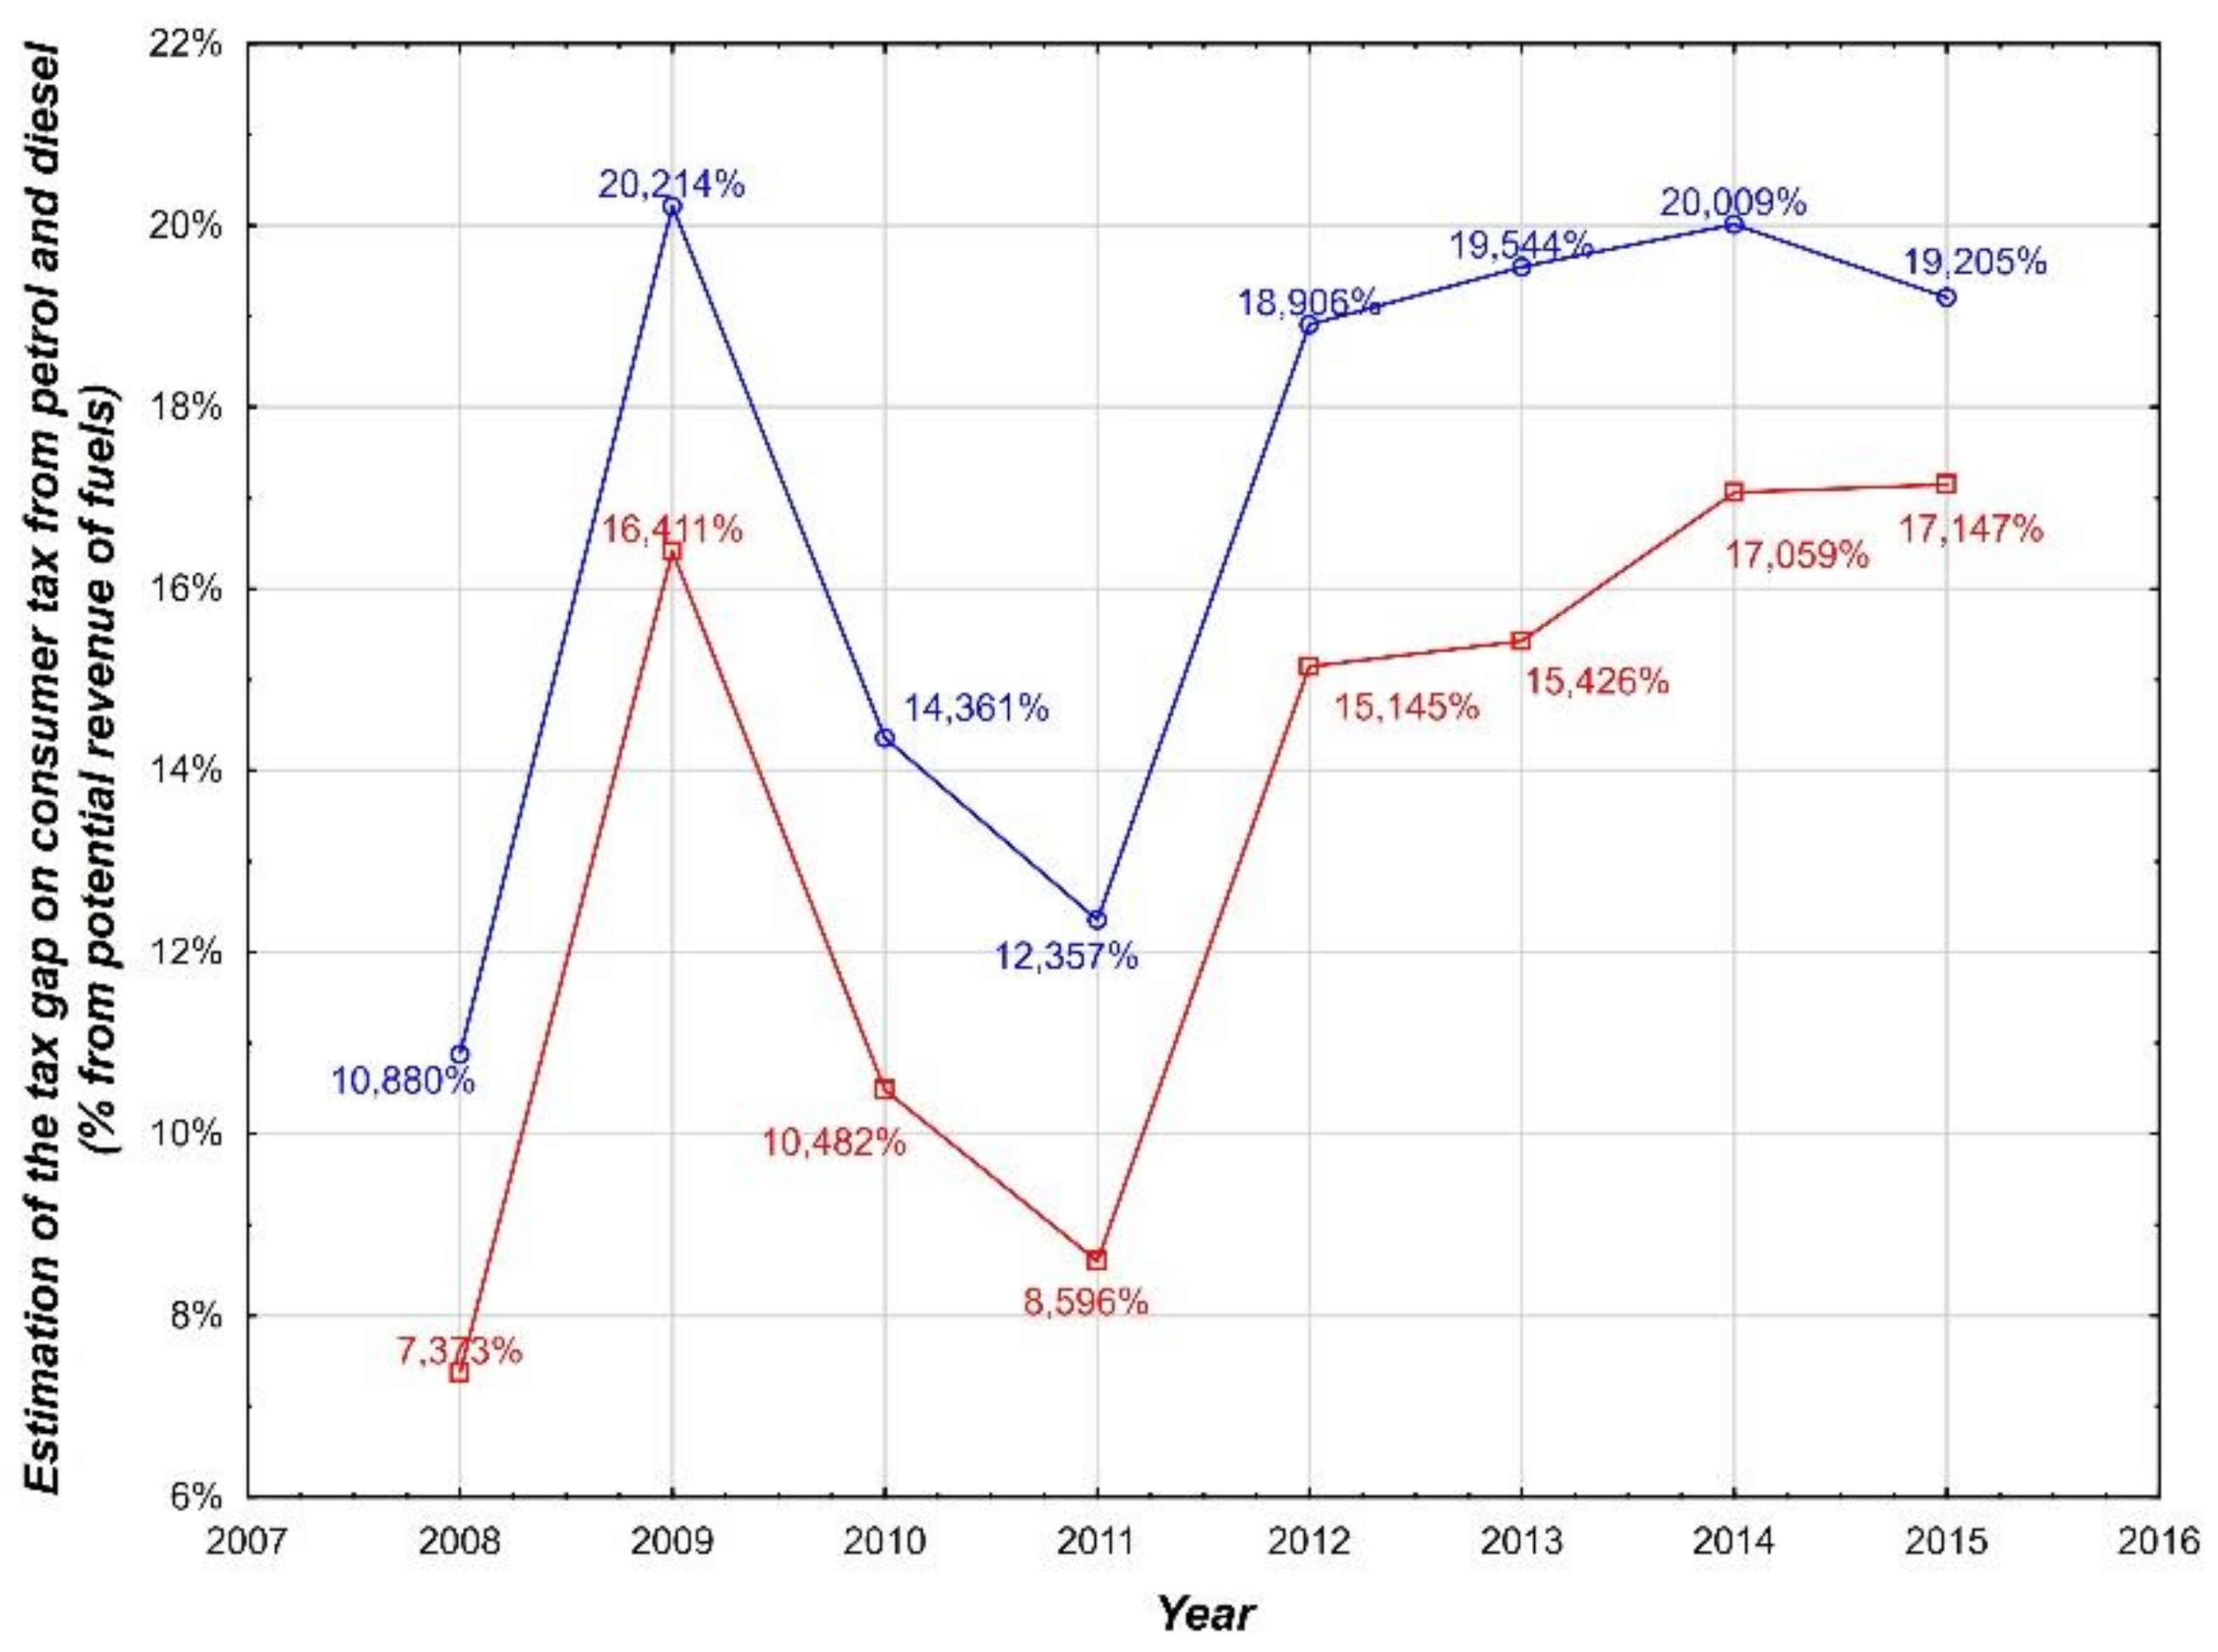
The research hypothesis concerns the tax gap on consumer tax from mineral oils. This is considered to be the second tax on which significant tax evasions occur, as it is also obvious from medialized cases from recent years. Available data after actualization from 2020 involve the years from 2008 to 2015. The trend of development of the tax gap on the tax from mineral oils stabilized according to the recent data actualization. In 2015, the penultimate available year, the tax gap on the tax from mineral oils slightly decreased and the value of dispersion reached values from 17.1% to 19.2% from the potential revenue of the tax. If measured financially, this represents EUR 234 to 269 million. Within the frame of the methodology, the tax gap was identified by means of the top-down approach as the difference of the overall (potential) consumption of petrol and diesel and the real tax revenue collected by the Financial Administration of the Slovak Republic. Under the terms of overall consumption, this was understood as the consumption of fuels, which corresponds with the number of kilometers driven by all vehicles in the Slovak Republic and their average consumption. The source of the data was the technical and emission controls of vehicles registered in the Slovak Republic, data from the toll system, and data from the register of vehicles.
The tax gap on the tax from mineral oils was defined as the difference between the revenue from petrol and diesel collected by the Financial Administration of the Slovak Republic and the estimated potential revenue from petrol and diesel, which corresponds with the number of kilometers driven by cars, lorries, trucks and buses registered in the Slovak Republic and lorries, trucks and buses registered abroad which drove across the territory of the Slovak Republic covered by the toll system. The overall tax gap on the tax from mineral oils is an aggregate of the gap estimates on the revenue from the consumer tax from petrol and the revenue from the consumer tax from diesel.
The goal of determining the tax gap was to know its structure in detail (Figure 7). The tax gap can be divided into a non-identified gap, imposed tax, and cross-border shopping. At the present time, however, the detailed structure of the tax gap cannot be determined.
The source of the data for the kilometers driven was the data from the technical and emission controls of vehicles (further only “data from controls”). The data from the controls were provided by the Ministry of Transport, Construction and Regional Development. This data has been collected since 2007. It contains the number of kilometers driven to the day of the control and identification data about the vehicle—Vehicle Registration Number. Information about the type of fuel which a vehicle uses is available from emission controls. Another source of data was the data provided from the National Motorway Company or Skytoll about the number of kilometers driven in the territory of the Slovak Republic by the Slovak lorries and buses, but also foreign lorries and buses that are registered in another country. This data has been available since 2011. It contains the kilometers driven on the motorways and 1st class roads. For the years 2008–2010 the data were approximated by the average of the kilometers driven in 2011–2013, when the comparable activity of foreign carriers in Slovakia was assumed. From this database, only the data on foreign vehicles, which drove across the territory of the Slovak Republic, were used. The consumer tax revenue from petrol and diesel came from the reports of the Financial Administration of the Slovak Republic and the tax returns of the consumer tax from mineral oils.
The non-identified gap (compliance gap) is a part of the tax gap, which tax subjects intentionally or unintentionally did not declare, and was also not identified by the Financial Administration of the Slovak Republic. It can be simply said that it is the difference between the overall (potential) tax and the imposed tax. The imposed tax includes deliberately returned tax by the payers of the consumer tax in tax returns, tax imposed in terms of customs regulations and added imposed tax within the frame of the control activity of the Financial Administration of the Slovak Republic, (added imposed paid tax). Added imposed unpaid tax (or the tax collection gap) is the difference between imposed tax and real collected tax. Cross-border shopping represents lost tax revenue due to the purchase of fuels abroad. This arises as a consequence of not only the higher price of fuels, but also the higher price level in Slovakia compared to the neighboring countries. Cross-border shopping includes the purchases of the carriers abroad, but also the consumption of fuels by the vehicles registered in Slovakia but driving outside of the Slovak Republic.
The gap in consumer tax from petrol and diesel can be calculated by the top-down approach or the bottom-up approach. To calculate the overall tax gap on the consumer tax from petrol and diesel, the top-down approach was used, which is based particularly on the estimation of the overall consumption of petrol and diesel and the subsequent deduction of the real declared amount of fuels. This approach was selected due to the relatively simple estimation of the tax gap in the past and actual year and the lower demand for input data. Most of the input data were available; however, in several cases it was necessary to use simplified suppositions.
The estimation of the tax gap included:
  • An estimation of the overall consumption of petrol and diesel according to the number of kilometers driven in the territory of the Slovak Republic and the average consumption;
  • The declared consumption of petrol and diesel by the Financial Administration of the Slovak Republic and the tax revenue from fuels;
  • A single calculation of the tax gap.
Within the top-down approach, the overall (potential) consumption was estimated through the data, which were independent of the Financial Administration of the Slovak Republic (in this case it was the estimation of the number of kilometers driven and the average consumption through data from the Ministry of Transport, Construction and Regional Development, Skytoll and the Police Force of the Slovak Republic. Subsequently, the tax gap was determined as the difference between the overall consumption and paid tax (the source of this data was tax returns or statements from the Financial Administration of the Slovak Republic. This method was used to estimate the tax gaps for indirect taxes such as VAT and consumer taxes.
Within the bottom-up approach, it is not possible to uniquely determine the overall (potential) income and property (tax revenue). That is why the estimation was based on the internal data of the Financial Administration of the Slovak Republic for individual groups of payers and types of property. The following factors were used for this purpose:
  • Incidental findings—results from incidentally selected controls;
  • Risk Register—analysis of potential losses from selected corporations and entities;
  • Data connection—identification of undeclared income/property by means of data connection from various sources.
This method is predominantly used to estimate the tax gaps for direct taxes. The overall consumption of petrol and diesel was calculated as the total number of kilometers driven by a particular type of vehicle in a particular year and it was multiplied by the average consumption of liters of fuel per one kilometer for a particular type of vehicle in a particular year. The overall consumption was calculated individually for petrol vehicles and individually for diesel vehicles.
The tax gap on the tax from mineral oil amounted from EUR 234 million to EUR 269 million (Figure 8) in 2015. In percentage expression, the tax gap was in the interval of 17.1–19.2% from the potential revenue. It is valid that even though a vehicle had a negative number of kilometers driven between two controls, these kilometers were counted as actual kilometers driven in the risk variant. Despite stagnation or slight decrease in 2015, the tax gap still had a slightly increasing linear trend.
The gap in consumer tax was estimated individually for petrol and individually for diesel. It was firstly estimated in liters, which were converted into EUR according to the appropriate tax rates (in the case of two tax rates, according to a percentage amount consumed and declared by the Financial Administration of the Slovak Republic. Stable revenue can be observed for petrol. However, the overall potential consumption of petrol is decreasing, which is caused by a reduction in the number of petrol vehicles (compared to diesel vehicles), a decreasing average consumption and number of kilometers driven. The gap in diesel is mainly influenced by the consumption of lorries, which is constantly increasing at a much faster rate than the increase in tax revenues. From the point of view of tax evasion, diesel can be more easily smuggled or exchanged for other mineral oils. This represents a serious problem if the consumption of diesel increases faster than the revenues from diesel. Table 1 and Table 2 present the individual tax gaps together with the overall gaps which are expressed as percentages of potential revenue in EUR millions, particularly for a low-risk rate (lower interval) and a high-risk rate (upper interval).
The established research hypothesis H1 directly concerned the tax gap of the tax from petrol and diesel. The research hypothesis H1 determined that the tax gap of petrol and diesel at a mediate risk rate will be higher than 15% in the observed period from 2008 to 2015.
The basic analysis of the research hypothesis H1 by means of an individual t-test is presented in Table 3 and a graphic description is presented in Figure 9.
Based on the available data from 2008 to 2015, the basis for a prediction of the future development of the examined variables was created. The prediction itself was performed by a time series analysis. Due to the small amount of available data, neural networks or a comprehensive time series analysis could not be used, e.g., SARIMA models. Due to the above facts, only a trend component of the time series and its subsequent analysis [59] was chosen.

4. Results

From the analysis of the research hypothesis based on the level of t-test significance (p = 0.446), the research hypothesis H1 can be denied. The level of significance α = 5% of the tax gap on mineral oils, which was represented by the tax gap on petrol and diesel at a medium risk rate, was lower than 15%. Even though the arithmetic mean or the medium value of the tax gap on mineral oils was 15.19%, considering the standard error of the arithmetic mean, defined by SE Mean = 0.0137 at a 95% interval of reliability, the medium value of the tax gap on mineral oils in the observed period from 2008 to 2015 was 15.19 ± 2.685%. From an in-depth data analysis of the amount of the tax gap on the consumer tax from mineral oils (petrol and diesel) in the observed period from 2008 to 2015 it can be seen that after a maximum value in 2009, there was a rapid decrease in the value of the amount of the tax gap, which was 10.428% at a low-risk rate and 14.361% at a high-risk rate, and 14.361% in 2010. After, it subsequently reached the minimum value in the observed period in 2011 with the amount of the tax gap at a medium risk rate of 8.596%, which represents EUR 125.013 million. There was an increase in 2012. Despite 50 planned measures in 2012, which were implemented in three phases, a gradual increase in the amount of the tax gap was observed from 2012 to 2015. It is necessary to say that despite a certain decrease in the amount of the tax gap on mineral oils in 2015, which at a medium risk rate was 17.14% (EUR 251.195 million), the analyzed tax gap had a slightly growing linear trend. It can be assumed that despite the fact that the government passed various measures in the area of the fight against tax evasion, these measures were not effective. Considering the fact that the official data on the amount and structure of the tax gap on mineral oils were missing from 2016 to 2020, it is not possible to confirm or deny the claims about the prediction of increase and the efficiency of the passed measures by government in the area of the fight against tax evasion.
The calculated value of the magnitude of the effect of the arithmetic mean difference in terms of the Cohen coefficient d represents the value −0.795816. The amount of the tax gap on the excise duty on mineral oils, petrol, and diesel in the observed period from 2008 to 2015 can be seen as time series. The time series in all three cases form values that were recorded sequentially over time (i.e., arranged chronologically over time). The interval between the individual observations may not generally be the same. However, we assumed that the time interval between the individual observations was constant, i.e., we considered a discrete time series with an equidistant time step. For the needs of the analysis and the estimation of the trend of the development of the amount of the tax gap with a high degree of risk in accordance with Table 2 in the observed period 2008–2015, we considered four basic types of models: linear model–model one, quadratic model–model two, exponential growth model–model three and S-Curve growth model–model four.
Y t = a + b t
Y t = a + b t + c t 2
Y t = a b t
Y t = 10 n a + b c t
where Yt—dependent variable, a, b, c—constant, t—time value, n = 0, 1, 2…
For the years 2016 to 2023, we focused on individually monitored indicators: the total amount of the tax gap on the excise duty on mineral oils expressed in %, the amount of the tax gap on the excise duty on petrol expressed in %, and the amount of the tax gap on the excise duty on diesel in %. All models were used to analyze the development of these indicators over time, in order to select the most suitable one based on a statistical analysis of the residuals of the data available in a given period. The first variable to be monitored, i.e., the total amount of the tax gap on the excise duty on mineral oils, expressed in % (TAX GAP), showed a residual level of −3.301% with a standard deviation of 19.411% with a linear trend (model). The residue in this sense expresses the average value of the deviation of the value found from the value calculated by model one. The minimum value of the deviation was −33.184% and the maximum value of the residues was 27.893%. The range of residues was expressed by the value of 61.077% and in regard to the achieved value of p = 0.855 of the Shapiro-Wilks test, we can state that the residues had a normal Gaussian distribution. The average absolute percentage error (MAPE) was characterized by a value of 14.6781. For the quadratic model—model two, the average value of residues was at the level of −3.260% with a standard deviation of 19.331%. The minimum value of residues was −34.935% and the maximum value was 28.108% in the observed period 2008–2015. The average absolute percentage error (MAPE) was characterized by a value of 14.2924. For the applied model three, the mean deviation of the observed value from the model calculated value was expressed as 1.634 ± 1.215%. The minimum residue value for the exponential growth model was −1.674% and the maximum value was 3.125%. The range of the residue values in the observed period 2008–2015 for model three was 4.799%. The residues had a normal Gaussian distribution with respect to the achieved value p = 0.0881 of the Shapiro-Wilks test. The average absolute percentage error (MAPE) was characterized by a value of 14.2218. For the applied model four, the average deviation of the value found and calculated by the model was 19.721% with a standard deviation of 1.754%. The minimum residue value for the exponential growth model was −36.365% and the maximum value was 90.675%. The range of residue values in the observed period 2008–2015 for model four was 127.040%. Due to the achieved value of the Shapiro-Wilks test p = 0.114, the residues had a normal Gaussian distribution. The average absolute percentage error (MAPE) was characterized by a value of 29.4220. A graphical representation of the residues of the individual models for the first simulated variable TAX GAP is shown in Figure 9.
Based on the minimum average value of the residue level, the smallest residue range as well as the minimum MAPE value, we used the third prediction model to predict the future development of the total amount of the tax gap on the excise duty on mineral oils expressed in % (3). A graphical representation of the prediction by the individual models is shown in Figure 10.
Based on the past development of the values of the variable “total amount of the tax gap on the excise duty on mineral oils in %” the choice of model three for the given values creates a model five, which describes the development trend of the examined variable in 2016–2023 in the form of:
Y t = 0.125 1.0648 t
Model five points out that the total amount of the tax gap will increase in the estimated period of 2016–2023, from 21.9118% in 2016 to 34.0097% in 2023. In the current year 2021, the observed variable should reach a value of 29.9953%, which should represent a total amount of EUR 448,051 mil. However, due to the absence of relevant data from the financial administration, it is not possible to compare this estimate with the reality, which also applies to the other monitored variables.
The second monitored variable, namely the total amount of the tax gap on the excise duty on gasoline expressed in % (TAX GAP petrol) shows the average value of the deviation found by the linear trend (model) and the value calculated by model one, i.e., the residual level of −7.180% with a standard deviation of 30.122%. The minimum deviation value was −68.06% and the maximum residue value was 26.938%. The residue range was expressed as 91.144% and in regard to the achieved value of the Shapiro-Wilks test, p = 0.243, the residues had a normal Gaussian distribution. The average absolute percentage error (MAPE) was characterized by a value of 20.9893.
For model two, the quadratic model had a mean residue value of −0.706% with a standard deviation of 12.863%. The minimum value of the residues in the observed period 2008–2015 was −24.76% and the maximum value was 13.068%. The residue range represented a value of 37.945% and with respect to the achieved value of the Shapiro-Wilks test, p = 0.511, the residues had a normal Gaussian distribution. The average absolute percentage error (MAPE) was characterized by a value of 9.65673.
For the applied model three, the average value of the deviation found, and the value calculated by the model was 3.566% with a standard deviation of 6.603%. The minimum residue value for the exponential growth model was −8.850% and the maximum value was 9.292%. The range of the residue values in the reference period 2008–2015 for model three was 18.142%. With regard to the achieved value of the Shapiro-Wilks test, p = 0.107, the residues had a normal Gaussian distribution. The average absolute percentage error (MAPE) was characterized by a value of 6.8572. A graphical representation of the residues of the individual models for the first simulated variable TAX GAP petrol is shown in Figure 11.
Based in particular on the smallest residue margin as well as the minimum MAPE value, we used the third prediction model to predict the future development of the overall amount of the tax gap on excise duty on petrol, expressed in %, (3). A graphical representation of the prediction by individual models is shown in Figure 12.
Based on the past development of the values of the variable “total amount of the tax gap on the excise duty on mineral oils in %” the choice of model three for the given values creates a model six that describes the development trend of the examined variable in the period 2016–2023 in the form of:
Y t = 0.077 1.1429 t
Model six points to the fact that the total amount of the tax gap will increase in the estimated period of 2016–2023 from 25.5209% in 2016 to almost 64.9932% in 2023. In the current year 2021, the monitored variable should reach a value of 49.7595%. The last monitored variable, namely the total amount of the tax gap on the excise duty on diesel expressed in % (TAX GAP_diesel) shows the average value of the deviation found and calculated by model one, i.e., the residual level of −6.111% with a standard deviation of 29.802%. The minimum deviation value was −71.209% and the maximum residue value was 32.741%. The residue range was expressed as 103.951% and with respect to the achieved value of the Shapiro-Wilks test, p = 0.0785, the residues had a normal Gaussian distribution. The average absolute percentage error (MAPE) was characterized by a value of 18.2673.
For model two, the quadratic model had an average residue value of −5.436% with a standard deviation of 26.767%. The minimum value of the residues in the observed period 2008–2015 was −57.975% and the maximum value was 31.645%. The residue range represented a value of 89.620% and with respect to the achieved value of the Shapiro-Wilks test, p = 0.311, the residues had a normal Gaussian distribution. The average absolute percentage error (MAPE) was characterized by a value of 17.2693.
For the applied model three, the mean value of the deviation found and calculated by the model value was 2795 ± 0.248%. The minimum residue value for the exponential growth model was −0.617% and the maximum value was 4.507%. The range of the residue values in the observed period 2008–2015 for model three represented the value of 3.890% and with respect to the achieved value of the Shapiro-Wilks test, p = 0.814, the residues had a normal Gaussian distribution. The average absolute percentage error (MAPE) was characterized by a value of 16.9092.
For the applied model four, the mean value of the deviation found and calculated by the model was 84.454% with a standard deviation of 37.041%. The minimum residue value for the exponential growth model was 31.376% and the maximum value was 140.368%. The range of the residue values in the reference period 2008–2015 for model four was 108.992%. with respect to the achieved value of the Shapiro-Wilks test, p = 0.225, the residues had a normal Gaussian distribution. The average absolute percentage error (MAPE) was characterized by a value of 26.1857. A graphical representation of the residues of the individual models for the first simulated variable TAX GAP_diesel is shown in Figure 13.
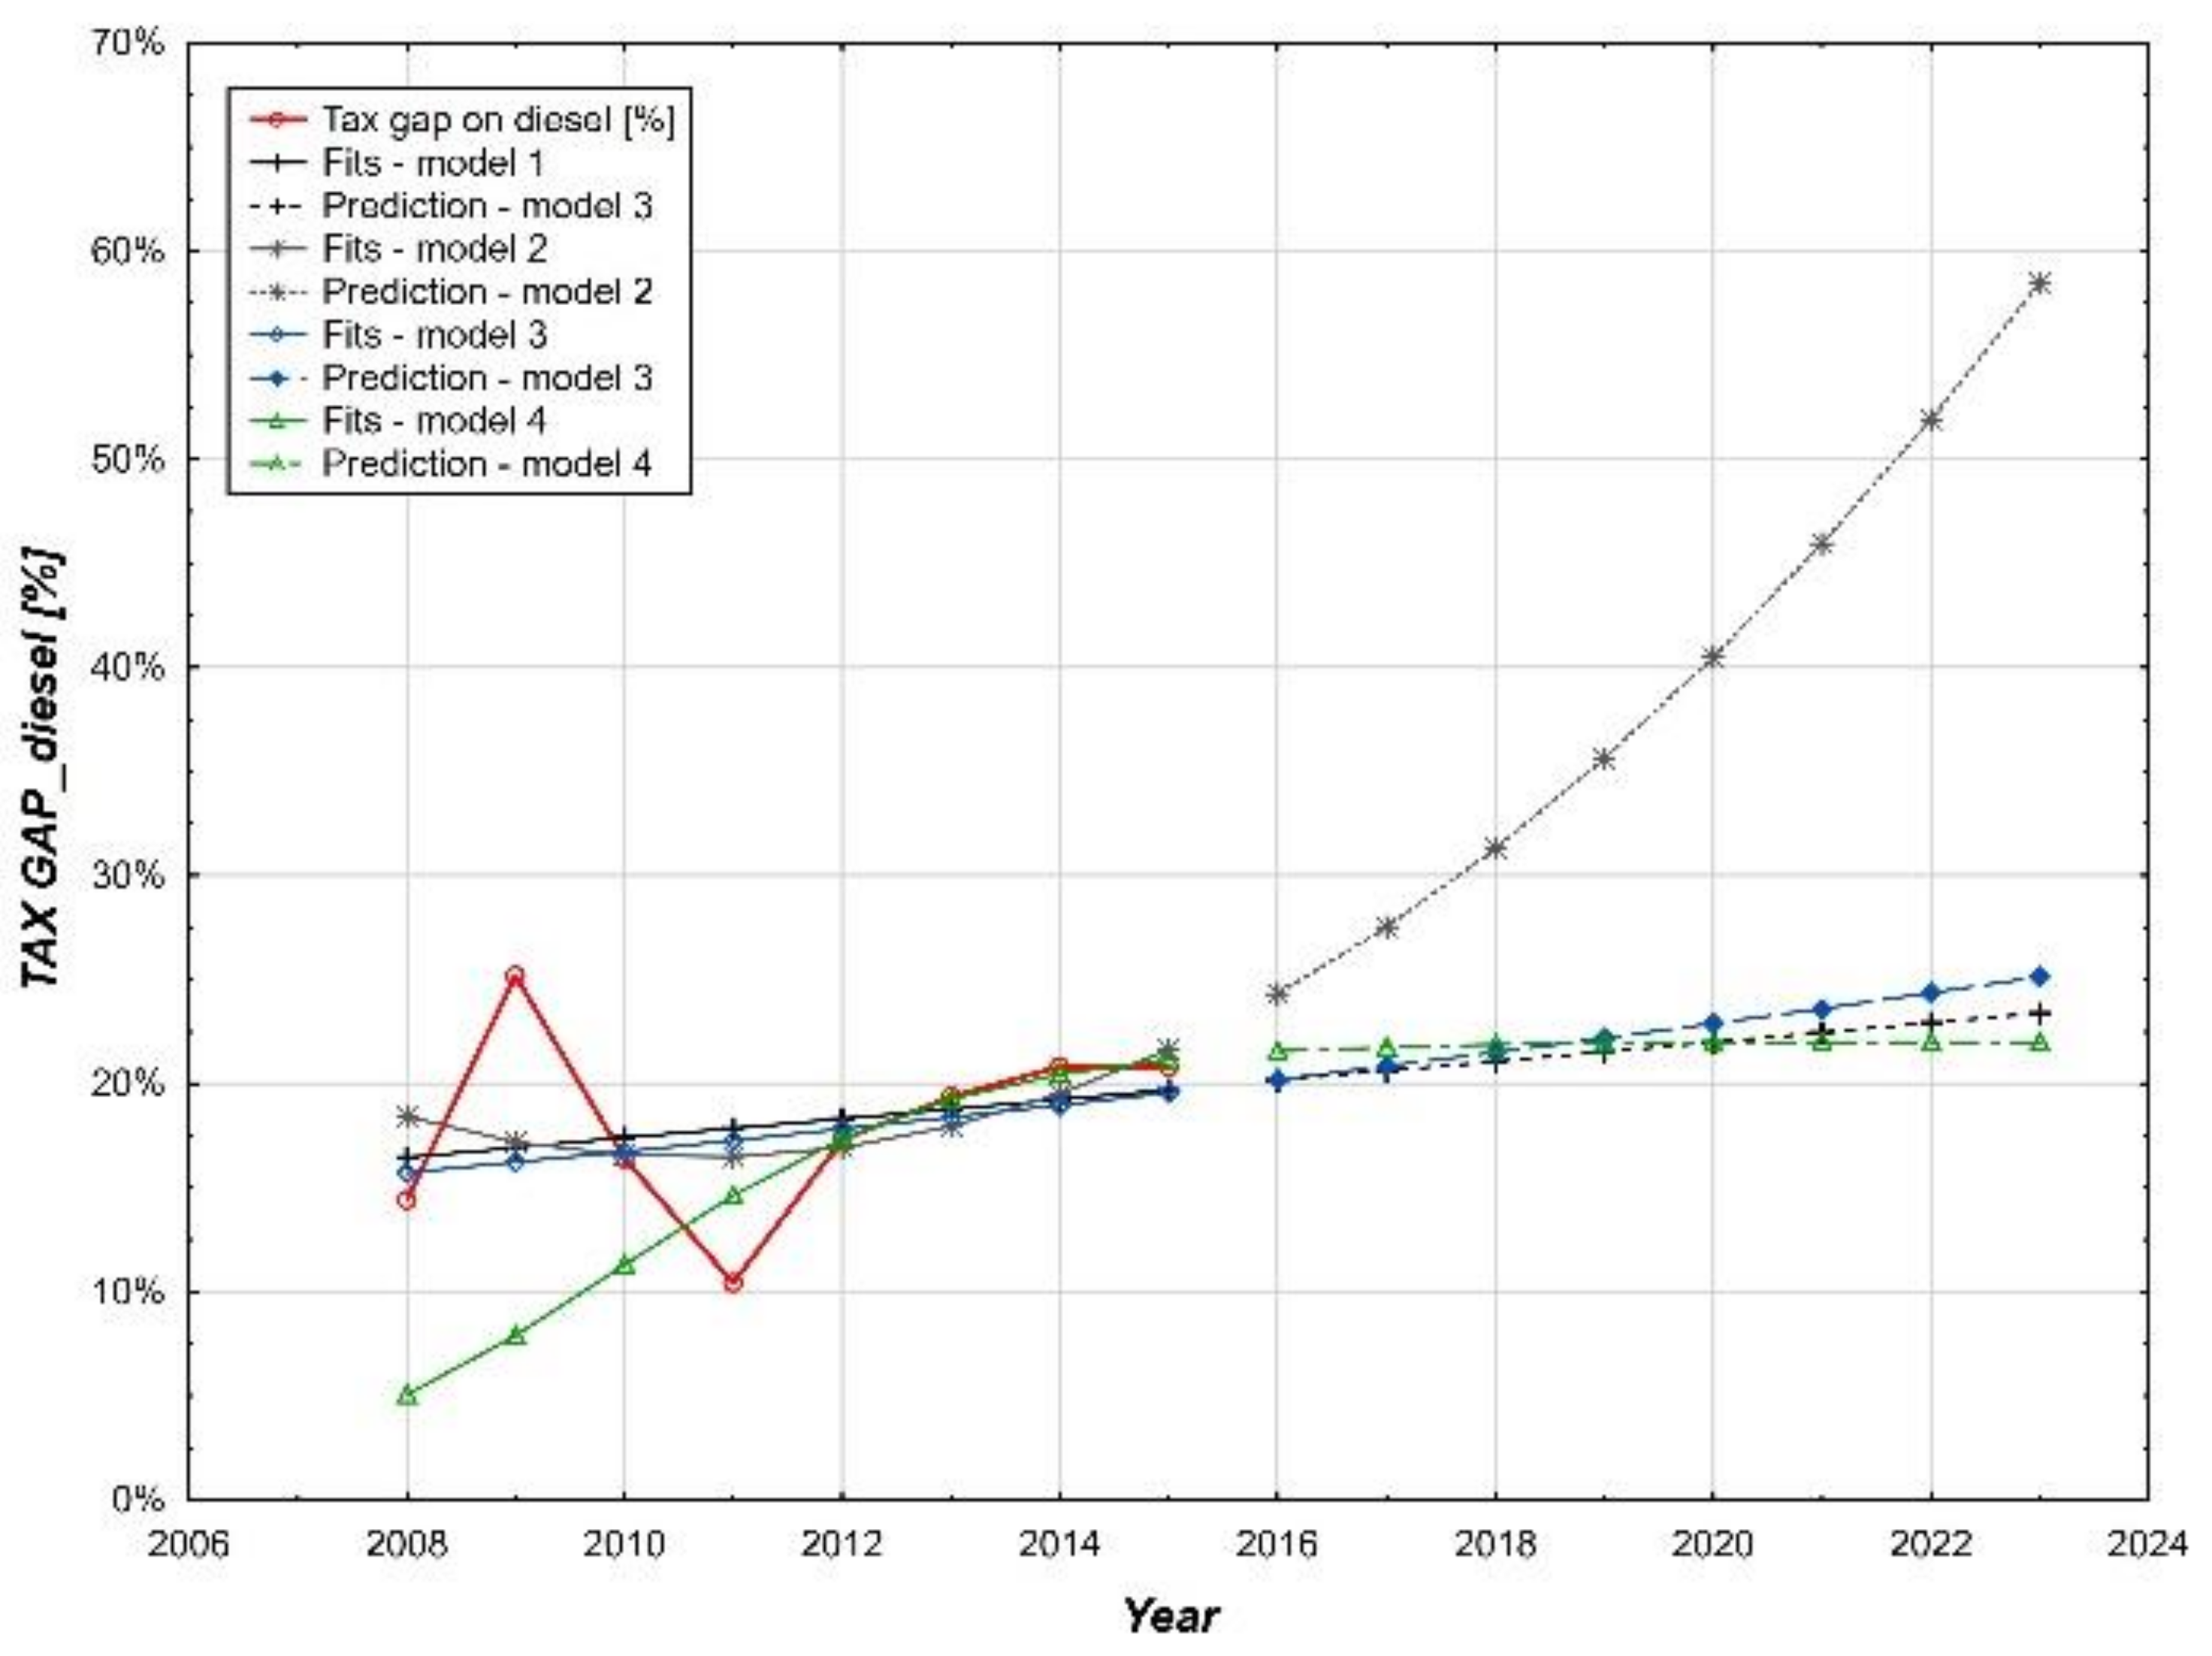
Based on the minimum value of the average amount of residues, the smallest margin of residues as well as the minimum value of MAPE, we used the third prediction model to predict the future development of the total amount of the tax gap on the excise duty on diesel expressed in % (3). A graphical representation of the prediction by individual models is shown in Figure 14.
Based on the past development of the values of the variable, “the total amount of the tax gap on the excise duty on mineral oils in%”, the choice of model three for given values creates a model seven, which describes the development trend of the examined variable in the period 2016–2023 in the form of:
Y t = 0.152 1.0317 t
Model seven points to the fact that the total amount of the tax gap will increase in the estimated period of 2016–2023 from 20.1998% in 2016 to 25.1378% in 2023. In the current year 2021, the monitored variable should reach the value 23.651%.
The basic statistical characteristics of the suitability of the selected models (5), (6), (7) that define the amount of tax gaps on excise duty on mineral oil, diesel, and petrol are presented in Table 4.
All three of the monitored variables follow the same prediction model, model three, but each with a different dynamic of development. It can be stated that in the period from 2016 to 2023, the sharpest increase in the amount of the tax gap on the excise tax on petrol is expected, up to the level of 64.9932%. On the contrary, the slowest development of the tax gap in diesel is expected, with an estimated level of 25,1378 in 2023. Such a dynamic of development is assumed despite the fact that the difference in the arithmetic averages of these two variables is not significantly different from zero at the selected level of significance. α = 5% in the observed period from 2008 to 2015.

5. Conclusions

The European Union together with its member states has been forced to assume a resolute attitude to the rising trend of tax fraud, tax evasion and the avoidance of tax duty in the last few years. Single legislative and non-legislative acts of the EU in this area were the result of political attitudes, economic interests, proposals and compromises of individual member states on one side and the EU on the other side concerning the fight against fraud in the area of taxation [59].
As quoted by Pistone [60], the fight against fraud in the area of taxation, no matter if it is tax fraud, tax evasion or the avoidance of tax duty, has become a real global challenge not only for the EU and its member states, but for the entire world. Basically, it comprises of various forms and ways of misusing tax systems inside the EU, but also abroad.
The reference literature principally features the definitions of the tax gap concept [40,61] though as proved by the research by the authors of [62] such a perspective of the tax gap that is widely adopted in research is faulty, because it fails to incorporate the taxpayers’ behavioral reactions.
Basically, this may lead to an overestimation of the magnitude of the tax gap in the traditional concept of the calculation methodology, because a large portion of the so-called potential lost revenues under the tax gap do not exist, are not subject to tax refunds and are unlikely to be collected [18].
Currently, the fight against the misuse of the tax system is an extremely demanding [63] and sensitive topic from the point of view of EU law. It concerns not only indirect taxes (mainly VAT), but also direct taxation.
Tax fraud was, is and will be an essential and principled problem for the EU. It is especially related to VAT, which deforms the law and the legally operating internal market of EU. It cannot be stated that EU institutions have failed to observe their duties in the fight against tax fraud. The causes and the prevention of tax fraud were preferentially not solved; only the consequences were. Adequate measures to prevent the rise of tax fraud were not passed preferentially, but the focus was put on the consequences and the solution of the problems resulting from it. It is necessary to emphasize that tax evasion of VAT presents an extremely significant problem at the level tax administration (as for their size, form, ways or advancement), which has to be solved by the organs of tax administration in individual EU member states.

Author Contributions

Conceptualization. M.G. and A.K.; methodology. M.G. and A.K.; validation. F.Č., S.Š. and A.V.; formal analysis. M.G. and A.V.; resources. A.V.; data curation. M.G., S.Š. and A.V.; writing—original draft preparation. A.K., F.Č., and M.G.; writing—review and editing. A.K. and M.G.; visualization. A.V.; supervision. A.K.; project administration. M.G.; funding acquisition. M.G. All authors have read and agreed to the published version of the manuscript.

Funding

This research is funded by the “VEGA 1/0194/19—Research on process-oriented management of financial management focusing on detection of tax evasion in terms of international business”.

Institutional Review Board Statement

Not applicable.

Informed Consent Statement

Not applicable.

Data Availability Statement

Not applicable.

Conflicts of Interest

The authors declare no conflict of interest.

References

  1. Chioran, D.; Valean, H. Design and Performance Evaluation of a Home Energy Management System for Power Saving. Energies 2021, 14, 1668. [Google Scholar] [CrossRef]
  2. Castaings, A.; Lhomme, W.; Trigui, R.; Bouscayrol, A. Energy Management of a Multi-Source Vehicle by λ-Control. Appl. Sci. 2020, 10, 6541. [Google Scholar] [CrossRef]
  3. Straková, J.; Rajiani, I.; Pártlová, P.; Váchal, J.; Dobrovič, J. Use of the Value Chain in the Process of Generating a Sustainable Business Strategy on the Example of Manufacturing and Industrial Enterprises in the Czech Republic. Sustainability 2020, 12, 1520. [Google Scholar] [CrossRef] [Green Version]
  4. Kot, S.; Štefko, R.; Dobrovič, J.; Rajnoha, R.; Váchal, J. The Main Performance and Effectiveness Factors of Sustainable Financial Administration Reform Using Multidimensional Statistical Tools. Sustainability 2019, 11, 3609. [Google Scholar] [CrossRef] [Green Version]
  5. Nikonorova, A.V.; Stroev, P.V.; Morkovkin, D.E.; Bykova, O.N.; Isaichikova, N.I.; Kvak, A.A.; Skryabin, O.O. Development of Innovations Monitoring System and Its Implementation in Practice of Commercial Companies. AD ALTA J. Interdiscip. Res. 2019, 9, 233–236. [Google Scholar]
  6. Wulandari, D.; Utomo, S.H.; Narmaditya, B.S.; Kamaludin, M. Nexus between Inflation and Unemployment: Evidence from Indonesia. J. Asian Finance Econ. Bus. 2019, 6, 269–275. [Google Scholar] [CrossRef]
  7. Gódány, Z.; Machová, R.; Mura, L.; Zsigmond, T. Entrepreneurship Motivation in the 21st Century in Terms of Pull and Push Factors. TEM J. 2021, 10, 334–342. [Google Scholar] [CrossRef]
  8. Repnikova, V.M.; Bykova, O.N.; Skryabin, O.O.; Morkovkin, D.E.; Novak, L.V. Strategic Aspects of Innovative Development of Entrepreneurial Entities in Modern Conditions. Int. J. Eng. Adv. Technol. 2019, 8, 32–35. [Google Scholar]
  9. Varyash, I.; Mikhaylov, A.; Moiseev, N.; Aleshin, K. Triple Bottom Line and Corporate Social Responsibility Performance Indicators for Russian Companies. Entrep. Sustain. Issues 2020, 8, 313–329. [Google Scholar] [CrossRef]
  10. Ionescu, L. The Economics of the Carbon Tax: Environmental Performance, Sustainable Energy, and Green Financial Behavior. Geopolit. Hist. Int. Relat. 2020, 12, 101–107. [Google Scholar] [CrossRef]
  11. Harrower, K. Networked and Integrated Urban Technologies in Sustainable Smart Energy Systems. Geopolit. Hist. Int. Relat. 2020, 12, 45–51. [Google Scholar] [CrossRef]
  12. Eysenck, G. Sensor-based Big Data Applications and Computationally Networked Urbanism in Smart Energy Management Systems. Geopolit. Hist. Int. Relat. 2020, 12, 52–58. [Google Scholar] [CrossRef]
  13. Prokopenko, O.; Kornatowski, R. Features of Modern Strategic Market-Oriented Activity of Enterprises. Mark. Manag. Innov. 2018, 14, 295–303. [Google Scholar] [CrossRef] [Green Version]
  14. Igaliyeva, L.; Niyazbekova, S.; Serikova, M.; Kenzhegaliyeva, Z.; Mussirov, G.; Zueva, A.; Tyurina, Y.G.; Maisigova, L.A. Towards Environmental Security Via Energy Efficiency: A Case Study. Entrep. Sustain. Issues 2020, 7, 3488–3499. [Google Scholar] [CrossRef]
  15. Orgonáš, J. Franchising in v 4 Countries; Akademie Krizového Řízení a Managementu: Uherské Hradiště, Czech Republic, 2020; p. 244. ISBN 978-80-906993-8-0. [Google Scholar]
  16. Orgonáš, J.; Paholková, B.; Drábik, P. Franchising Modern Form of Business for Small and Medium Sized Enterprises in the 21 st. century. Manag. Stud. 2020, 8, 69–73. [Google Scholar]
  17. Ivančík, R.; Nečas, P. Towards Enhanced Security: Defence Expenditures in the Member States of the European Union. J. Secur. Sustain. Issues 2017, 6, 373–382. Available online: https://jssidoi.org/jssi/papers/papers/view/215 (accessed on 12 May 2021). [CrossRef]
  18. Raczkowski, K. Measuring the Tax Gap in the European Economy. J. Econ. Manag. 2015, 21, 58–72. [Google Scholar]
  19. Revenue, H.M.; Customs, H.M. Revenue and Customs 98 Measuring Tax gaps. 2020. Available online: https://assets.publishing.service.gov.uk/government/uploads/system/uploads/attachment_data/file/907122/Measuring_tax_gaps_2020_edition.pdf (accessed on 2 May 2021).
  20. US. Internal Revenue Service Press Release. IR-2005-38; 29 March 2005. Available online: https://www.irs.gov/pub/irs-prior/p17--2005.pdf (accessed on 2 May 2021).
  21. Holmgren, R.D. The Internal Revenue Service Needs to Improve the Comprehensiveness, Accuracy, Reliability, and Timeliness of the Tax Gap Estimate; U.S. Department of the Treasury: Washington, DC, USA, 2015; p. 1. Available online: https://www.treasury.gov/tigta/iereports/2013reports/2013IER008fr.pdf (accessed on 2 April 2021).
  22. Rotz, W.; Murlow, J.; Falk, E. The 1995 Taxpayer Compliance Measurement Program (TCMP). Sample Redesign: A Case History. In Turning Administrative System into Information System; Jamerson, B., Alwey, W., Eds.; Internal Revenue Service: Washington, DC, USA, 1994; Available online: http://www.asasrms.org/Proceedings/papers/1994_119.pdf (accessed on 20 April 2021).
  23. Dubin, J.A. The Causes and Consequences of Income Tax Noncompliance; Springer: Berlin/Heidelberg, Germany, 2012; ISBN 978-1-4419-0907-7. [Google Scholar] [CrossRef]
  24. Nurzhanova, G.; Mussirov, G.; Niyazbekova, S.; Ilyas, A.; Tyurina, Y.G.; Maisigova, L.A.; Troyanskaya, M.; Kunanbayeva, K. Demographic and migration processes of labor potential: A Case Study the Agricultural Sector of the Republic of Kazakhstan. Entrep. Sustain. Issues 2020, 8, 656–671. [Google Scholar] [CrossRef]
  25. Prokopenko, O.; Omelyanenko, V. Intellectualization of the Phased Assessment and Use of the Potential for Internationalizing the Activity of Clusters of Cultural and Creative Industries of the Baltic Sea Regions. TEM J. 2020, 9, 1068–1075. [Google Scholar] [CrossRef]
  26. Moiseev, N.; Mikhaylov, A.; Varyash, I.; Saqib, A. Investigating the Relation of GDP Per Capita and Corruption Index. Entrep. Sustain. Issues 2020, 8, 780–794. [Google Scholar] [CrossRef]
  27. Davydenko, V.; Kaźmierczyk, J.; Romashkina, G.F.; Żelichowska, E. Diversity of Employee Incentives from the Perspective of Banks Employees in Poland-Empirical Approach. Entrep. Sustain. Issues 2017, 5, 116–126. [Google Scholar] [CrossRef] [Green Version]
  28. Kaźmierczyk, J.; Chinalska, A. Flexible Forms of Employment, an Opportunity or a Curse for the Modern Economy? Case Study: Banks in Poland. Entrep. Sustain. Issues 2018, 6, 782–798. [Google Scholar] [CrossRef]
  29. Ionescu, L. Pricing Carbon Pollution: Reducing Emissions or GDP Growth? Econ. Manag. Financial Mark. 2020, 15, 37. [Google Scholar] [CrossRef]
  30. Zhao, H.; Wang, H.; Liu, W.; Song, S.; Liao, Y. Supply Chain Coordination with a Risk-Averse Retailer and the Call Option Contract in the Presence of a Service Requirement. Mathematics 2021, 9, 787. [Google Scholar] [CrossRef]
  31. Jia, Z.; Lin, B. Rethinking the choice of carbon tax and carbon trading in China. Technol. Forecast. Soc. Chang. 2020, 159, 120187. [Google Scholar] [CrossRef]
  32. Xu, C.; Wang, C.; Huang, R. Impacts of Horizontal Integration on Social Welfare under the Interaction of Carbon Tax and Green Subsidies. Int. J. Prod. Econ. 2020, 222, 107506. [Google Scholar] [CrossRef]
  33. Tirkaso, W.T.; Gren, I.-M. Road Fuel Demand and Regional Effects of Carbon Taxes in Sweden. Energy Policy 2020, 144, 111648. [Google Scholar] [CrossRef]
  34. Lăzăroiu, G.; Ionescu, L.; Uță, C.; Hurloiu, I.; Andronie, M.; Dijmărescu, I. Environmentally Responsible Behavior and Sustainability Policy Adoption in Green Public Procurement. Sustainability 2020, 12, 2110. [Google Scholar] [CrossRef] [Green Version]
  35. Rout, C.; Paul, A.; Kumar, R.S.; Chakraborty, D.; Goswami, A. Cooperative sustainable supply chain for deteriorating item and imperfect production under different carbon emission regulations. J. Clean. Prod. 2020, 272, 122170. [Google Scholar] [CrossRef]
  36. Venmans, F.; Ellis, J.; Nachtigall, D. Carbon Pricing and Competitiveness: Are They at Odds? Clim. Policy 2020, 20, 1070–1091. [Google Scholar] [CrossRef]
  37. Bulinska-Stangrecka, H.; Bagieńska, A. Investigating the Links of Interpersonal Trust in Telecommunications Companies. Sustainability 2018, 10, 2555. [Google Scholar] [CrossRef] [Green Version]
  38. Sopiah, S.; Kurniawa, D.T.; Nora, E.; Narmaditya, B.S. Does Talent Management Affect Employee Performance? The Moderating Role of Work Engagement. J. Asian Finance Econ. Bus. 2020, 7, 335–341. [Google Scholar] [CrossRef]
  39. Bulinska-Stangrecka, H.; Bagieńska, A. HR Practices for Supporting Interpersonal Trust and Its Consequences for Team Collaboration and Innovation. Sustainability 2019, 11, 4423. [Google Scholar] [CrossRef] [Green Version]
  40. Mazur, M.J.; Plumley, A.H.; Plumpley, A.H. Understanding the Tax Gap. Natl. Tax J. 2007, 60, 569–576. [Google Scholar] [CrossRef]
  41. Lešnik, T.; Jagrič, T.; Jagrič, V. VAT Gap Dependence and Fiscal Administration Measures. Naše Gospodarstvo Our Economy 2018, 64, 43–51. [Google Scholar] [CrossRef] [Green Version]
  42. OECD. Consumption Tax Trends. 2015. Available online: http://www.oecd.org/tax/consumption/consumption-tax-trends-19990979.htm (accessed on 7 April 2021).
  43. OECD. Tax Administration 2017: Comparative Information on OECD and Other Advanced and Emerging Economies; OECD: Paris, France, 2017; Available online: https://books.google.sk/books?id=v9U3DwAAQBAJ&pg=PA116&lpg=PA116&dq=32.%09OECD+ (accessed on 22 April 2021).
  44. Zidkova, H. Determinants of VAT gap in EU, Prague Economic Papers. Prague Econ. Pap. 2014, 23, 514–530. [Google Scholar] [CrossRef]
  45. International Monetary Fund. United Kingdom: Technical Assistance Report-Assessment HMRCs Tax Gap Analysis. 2013. Available online: https://www.imf.org/external/pubs/ft/scr/2013/cr13314.pdf (accessed on 2 May 2021).
  46. International Monetary Fund. Republic of Estonia: Revenue Administration Gap Analysis Program-The Value Added-Tax Gap. 2014. Available online: https://www.imf.org/external/pubs/ft/scr/2014/cr14133.pdf (accessed on 2 May 2021).
  47. Center for Social and Economic Research (CASE); Netherlands Bureau for Economic Policy and Analysis. Study to Quantify and Analyse the VAT Gap in the EU-27 Member States. 2013. Available online: https://ec.europa.eu/taxation_customs/sites/taxation/files/docs/body/vat-gap.pdf (accessed on 4 May 2021).
  48. Center for Social and Economic Research (CASE); Institute for Advanced Studies. Study and Reports on the VAT Gap in the EU-28. 2016. Available online: https://ec.europa.eu/taxation_customs/sites/taxation/files/2016-09_vat-gap-report_final.pdf (accessed on 4 May 2021).
  49. HM Revenue and Customs. Methodological Annex for Measuring Tax Gaps. 2013. Available online: https://www.gov.uk/government/uploads/system/uploads/attachment_data/file/249541/131009_MTG_2013_Annex.pdf (accessed on 4 May 2021).
  50. Swedish National Tax Agency. Tax GAP MAP for Sweden. How Was It Created and How Can It Be Used? 2018. Available online: http://www.skatteverket.se/download/18.225c96e811ae46c823f800014872/Report_2008_1B.pdf (accessed on 5 May 2021).
  51. The Danish Customs and Tax Administration-SKAT. Business Sector Analysis. Compliance with Tax and VAT Rules by Businesses in Denmark. Tax Year 2006. Available online: https://skat.dk/skat.aspx?oid=2274194&lang=en&cid=ps-udenlandske-arbejdstagere-q2-go-gen-engelsk-260421&gclid=CjwKCAjw7diEBhB-EiwAskVi16wkCXKJ0DHeLUh718di_H0JQMwRs7KH8RICIS1ypOSe_Tz4e5P5IRoCEtwQAvD_BwE (accessed on 5 May 2021).
  52. Tax Gap Project Group. The Concept of Tax Gaps, Report on VAT Gap Estimations. European Commission: Fiscalis Tax Gap Project Group (FPG/041). 2016. Available online: https://ec.europa.eu/taxation_customs/sites/taxation/files/docs/body/tgpg_report_en.pdf (accessed on 11 May 2021).
  53. Gemmell, N.; Hasseldine, J. The Tax Gap: A Methodological Review. Adv. Tax. 2012, 203–231. [Google Scholar] [CrossRef]
  54. Gruenbichler, R.; Klucka, J.; Haviernikova, K.; Strelcova, S. Business Performance Management in Small and Medium-Sized Enterprises in the Slovak Republic: An Integrated Three- Phase-Framework for Implementation. J. Compet. 2021, 13, 42–58. [Google Scholar]
  55. Durán-Cabré, J.M.; Moré, A.E.; Mas-Montserrat, M.; Salvadori, L. The Tax Gap as a Public Management Instrument: Application to wealth taxes. Appl. Econ. Anal. 2019, 27, 207–225. [Google Scholar] [CrossRef]
  56. Reckon. Study to Quantify and Analyse the VAT Gap in the EU-25 Member States. 2009. Available online: http://ec.europa.eu/taxation_customs/resources/documents/taxation/tax_cooperation/combating_tax_fraud/reckon_report_sep2009.pdf (accessed on 11 April 2021).
  57. Poniatowski, G.; Bonch-Osmolovskiy, M.; Durán-Cabré, J.M.; Esteller-Moré, A.; Śmietanka, A. Study and Reports on the VAT Gap in the EU-28 Member States; 2018 Final Report; European Union: Maastricht, The Netherlands, 2018; ISBN 978-92-76-19429-3. [Google Scholar] [CrossRef]
  58. Keen, M. Targeting, Cascading, and Indirect Tax Design, International Monetary Fund. 2013. Working Paper; WP/13/57. Available online: https://www.imf.org/external/pubs/ft/wp/2013/wp1357.pdf (accessed on 11 May 2021).
  59. Babčák, V. Právo Európskej únie a boj proti podvodom v oblasti DPH. In Daňové Právo vs. Daňové Podvody a Daňové Úniky (Tax Law vs. Tax Frauds and Tax Evasion); Univerzita Pavla Jozefa Šafárika: Košice, Slovak, 2015; pp. 9–36. ISBN 978-80-8152-304-5. [Google Scholar]
  60. Pistone, P. The Meaning of Tax Avoidance and Aggressive Tax Planning in the European Union Tax Law: Some thoughts in connection with the reaction to such practices by the European Union. In Tax Avoidance Revisited in the EU BEPS Context; IBFD; Amsterdam, The Netherlands, 2017; pp. 73–100. ISBN 978-90-8722-422-6. [Google Scholar]
  61. Toder, E. What is the Tax Gap? Tax Notes 2007, 117, 367–378. Available online: https://www.urban.org/sites/default/files/publication/46126/1001112-What-is-the-Tax-Gap-.PDF (accessed on 11 May 2021).
  62. Gemmell, N.; Hasselidne, J. Taxpayers’ Behavioural Responses and Measures of Tax Compliance ‘Gaps’: A Critique and a New Measure. Fisc. Stud. 2014, 35, 275–296. [Google Scholar] [CrossRef]
  63. Velvizhi, V.; Billewar, S.R.; Londhe, G.; Kshirsagar, P.; Kumar, N. Big Data for Time Series and Trend Analysis of Poly Waste Management in India. Mater. Today Proc. 2021, 37, 2607–2611. [Google Scholar] [CrossRef]
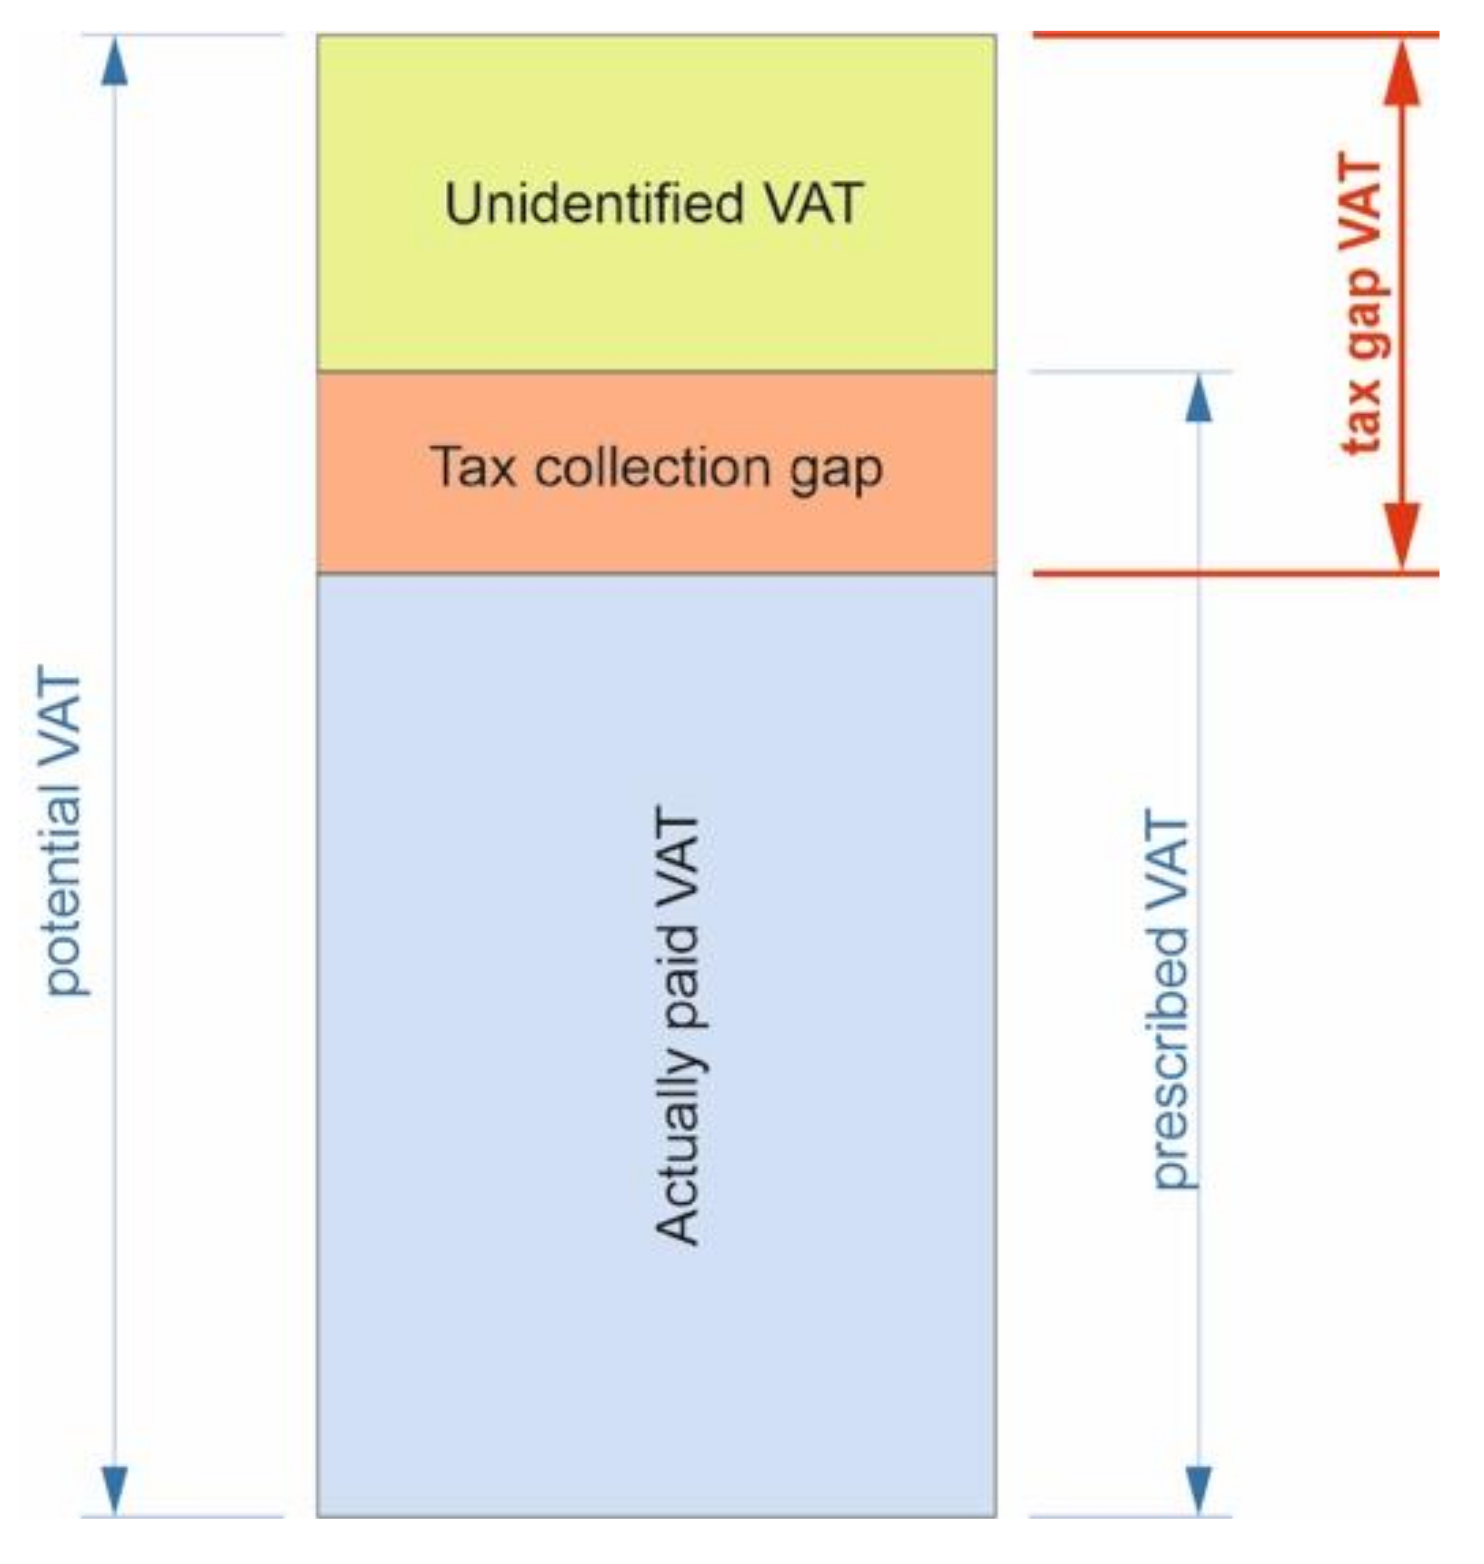
Figure 1. Structure of VAT potential revenue.
Energies 14 04121 g001
Figure 2. Illustration of the tax gap components.
Energies 14 04121 g002
Figure 3. Concept of the tax gap used in the analysis.
Energies 14 04121 g003
Figure 4. The tax gap from the tax base of legal entities.
Energies 14 04121 g004
Figure 5. The tax gap of legal entities.
Energies 14 04121 g005
Figure 6. The tax gap on corporate income tax and VAT of legal entities.
Energies 14 04121 g006
Figure 7. Scheme of the tax gap calculation.
Energies 14 04121 g007
Figure 8. Estimation of the tax gap on the consumer tax from petrol and diesel from 2008 to 2015 (% from potential revenue of fuels).
Energies 14 04121 g008
Figure 9. Residues of the prediction models of TAX GAP in the years 2008–2015.
Energies 14 04121 g009
Figure 10. Predictive values of TAX GAP (%) in the years 2016–2023.
Energies 14 04121 g010
Figure 11. Residues of the prediction models TAX GAP_petrol (%) in the years 2008–2015.
Energies 14 04121 g011
Figure 12. Prediction of the value of TAX GAP_petrol (%) in the years 2016–2023.
Energies 14 04121 g012
Figure 13. Residues of prediction models TAX GAP diesel (%) in the years 2008–2015.
Energies 14 04121 g013
Figure 14. Prediction of the value of TAX GAP diesel (%) in the years 2016–2023.
Energies 14 04121 g014
Table 1. The tax gap in % of the overall consumption and in EUR million classified into diesel and petrol—low risk rate.
In Millions EUR20082009201020112012201320142015
Overall consumption1217.51204.31067.61163.81210.71225.31289.61363.7
Tax revenue1127.71006.7955.71063.81027.31036.31069.61129.8
Tax gap89.8197.6111.9100.0183.4189.0220.0233.8
Tax gap in %7.37%16.41%10.48%8.60%15.14%15.43%17.06%17.15%
Overall consumption of petrol484.1445.2446.0445.4444.2419.4414.6410.5
Tax revenue of petrol479.4417.7416.3397.2370.3356.6353.8359.3
Tax gap on petrol4.727.629.748.273.962.860.951.2
Tax gap in %0.98%6.19%6.66%10.81%16.63%14.97%14.68%12.48%
Overall consumption of diesel 733.4759.1621.7718.4766.4806.0874.9953.2
Tax revenue of diesel648.3589.0539.5666.5657.0679.7715.8770.5
Tax gap on diesel85.0170.182.251.9109.5126.2159.1182.6
Tax gap in %11.59%22.41%13.22%7.22%14.28%15.66%18.19%19.16%
Table 2. The tax gap in % of the overall consumption and in EUR million classified into diesel and petrol—high risk level rate.
In Millions Eur20082009201020112012201320142015
Overall consumption1265.41261.71116.01213.81266.81288.11337.11398.4
Tax revenue1127.71006.7955.71063.81027.31036.31069.61129.8
Tax gap137.7255.0160.3150.0239.5251.7267.5268.6
Tax gap in v %10.88%20.21%14.36%12.36%18.91%19.54%20.01%19.20%
Overall consumption of petrol508.0474.5470.6469.6472.4445.1433.0425.6
Tax revenue of petrol479.4417.7416.3397.2370.3356.6353.8359.3
Tax gap on petrol28.656.854.472.3102.088.679.366.3
Tax gap in v %5.63%11.97%11.55%15.41%21.60%19.90%18.30%15.58%
Overall consumption of diesel757.4787.2645.4744.2794.4842.9904.1972.8
Tax revenue of diesel648.3589.0539.5666.5657.0679.7715.8770.5
Tax gap on diesel109.1198.2105.977.6137.5163.2188.3202.2
Tax gap in v %14.40%25.18%16.41%10.43%17.30%19.36%20.83%20.79%
Table 3. The tax gap in % of the overall consumption and in EUR million classified into diesel and petrol—high risk level rate.
NMeanStDevStandard Error Mean95% Lower Bound
for μ
t-Valuep-Value
80.15190.03880.01370.12600.140.446
Table 4. Basic characteristics of the suitability of selected models.
VariableModel (5)Model (6)Model (7)
Mean1.634%3.566%2.795%
Median2.397%6.308%2.961%
Minimum−1.674%−8.850%0.617%
Maximum3.125%9.292%4.507%
25% Quartil0.469%−0.832%1.712%
75% Quartil2.943%8.567%3.945%
Range4.799%18.142%3.890%
Std.Dev.1.754%6.603%1.373%
St.Er. Mean0.620%2.334%0.486%
Shapiro-Wilk W0.8466510.8550530.960412
Shapiro-Wilk p0.0880940.1071370.814016
MAPE14.22186.857216.9092
Publisher’s Note: MDPI stays neutral with regard to jurisdictional claims in published maps and institutional affiliations.