
Tracing Ancient Carbon Dioxide Emission in the Larderello Area by Means of Historical Boric Acid Production Data


Abstract
:1. Introduction
1.1. CO2 Emissions in Geothermally Developed Areas
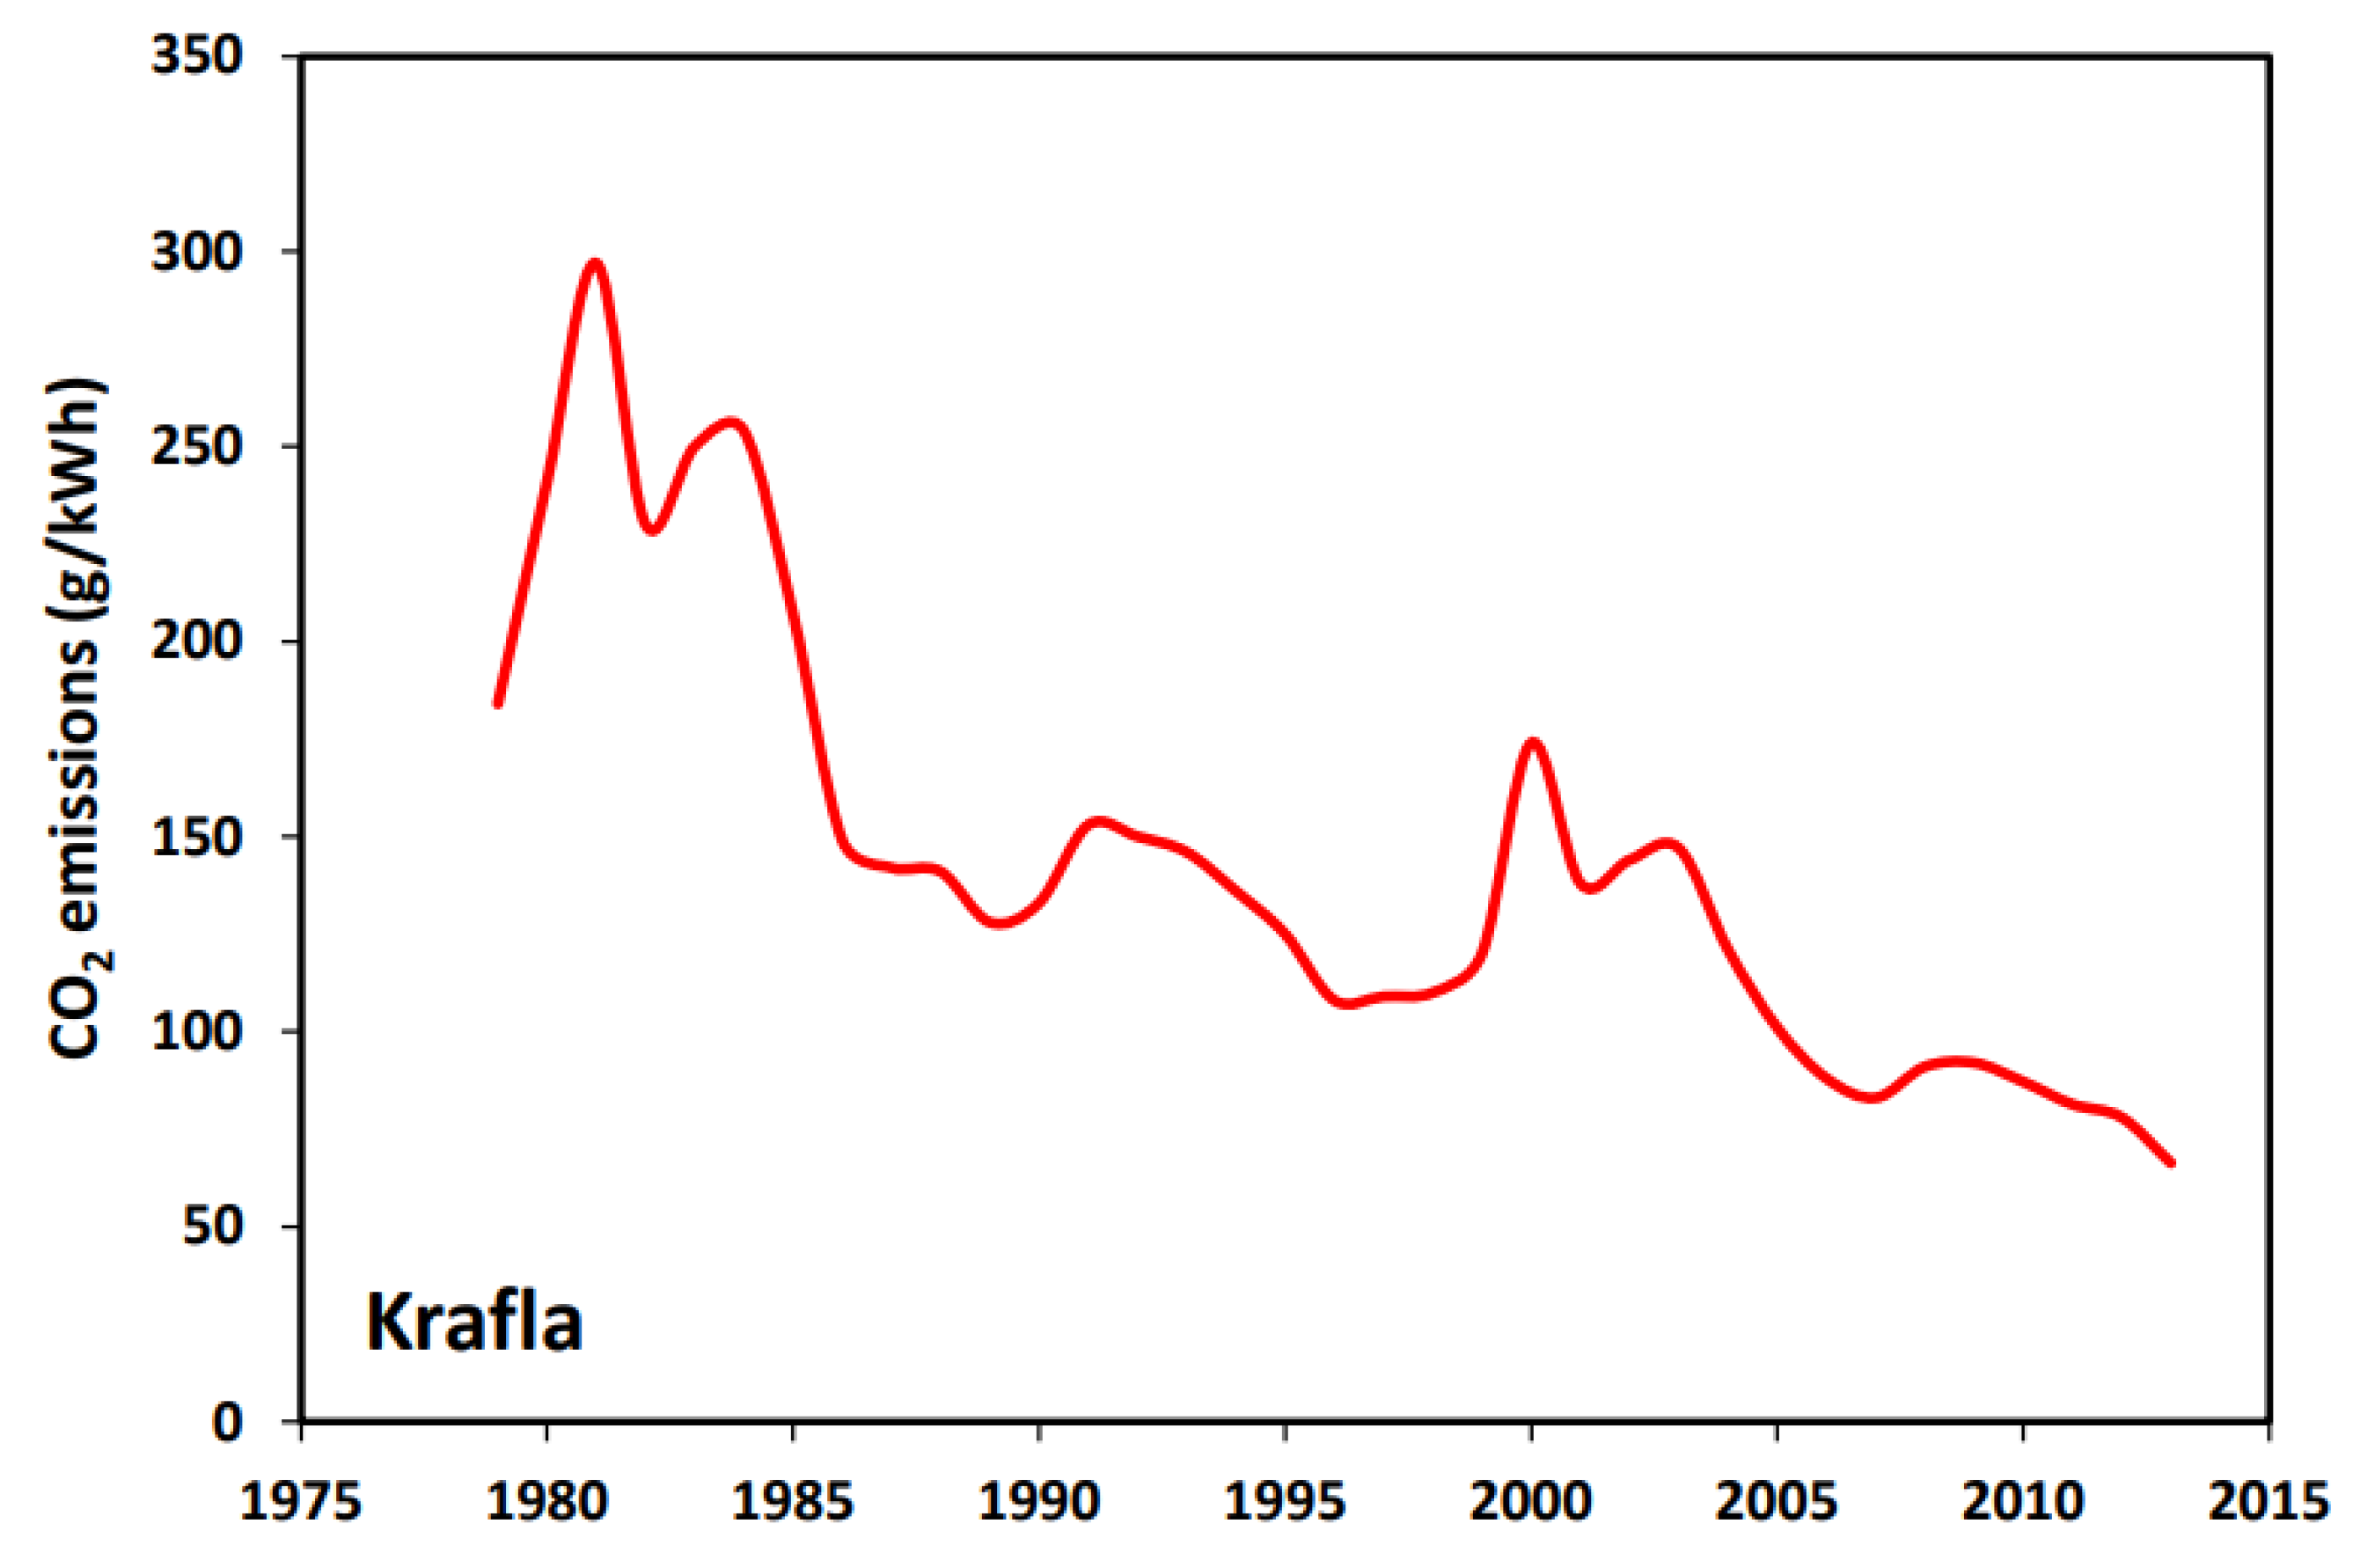
1.2. Iceland Case
1.3. New Zealand Case
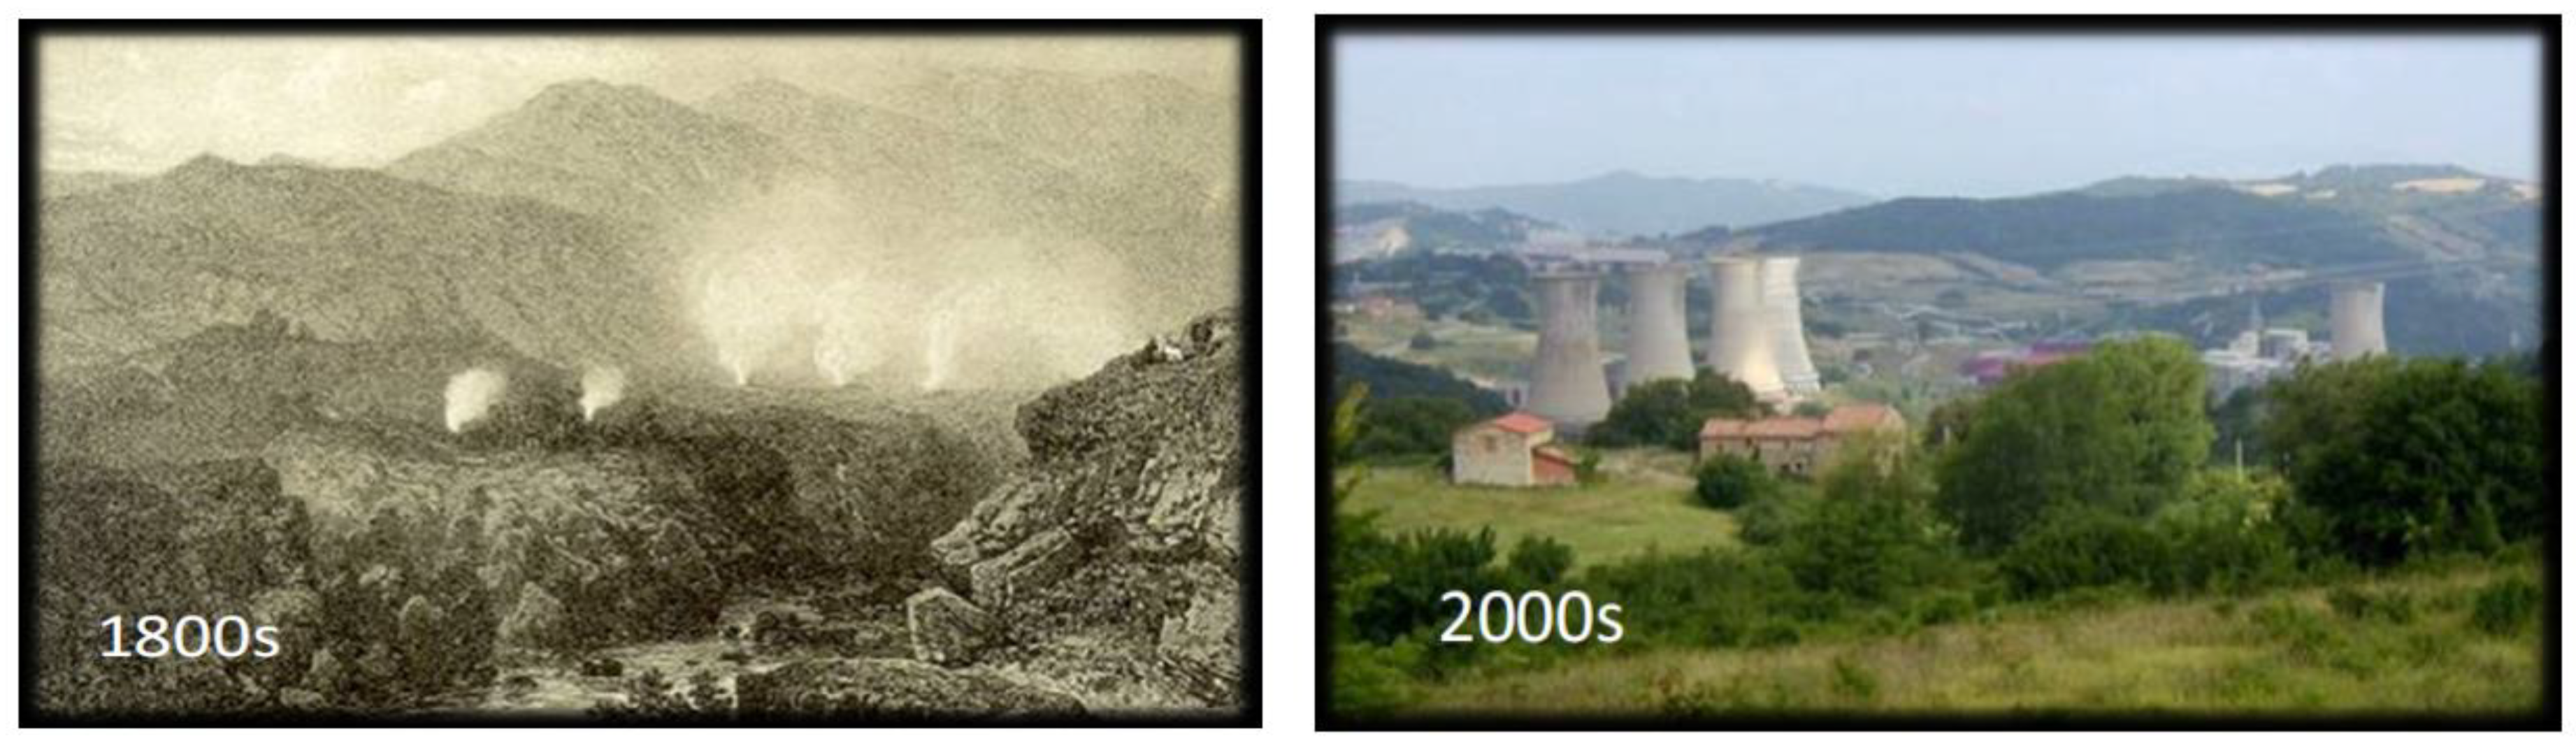
1.4. Italian Case
1.5. Depletion and Substitutive Emission
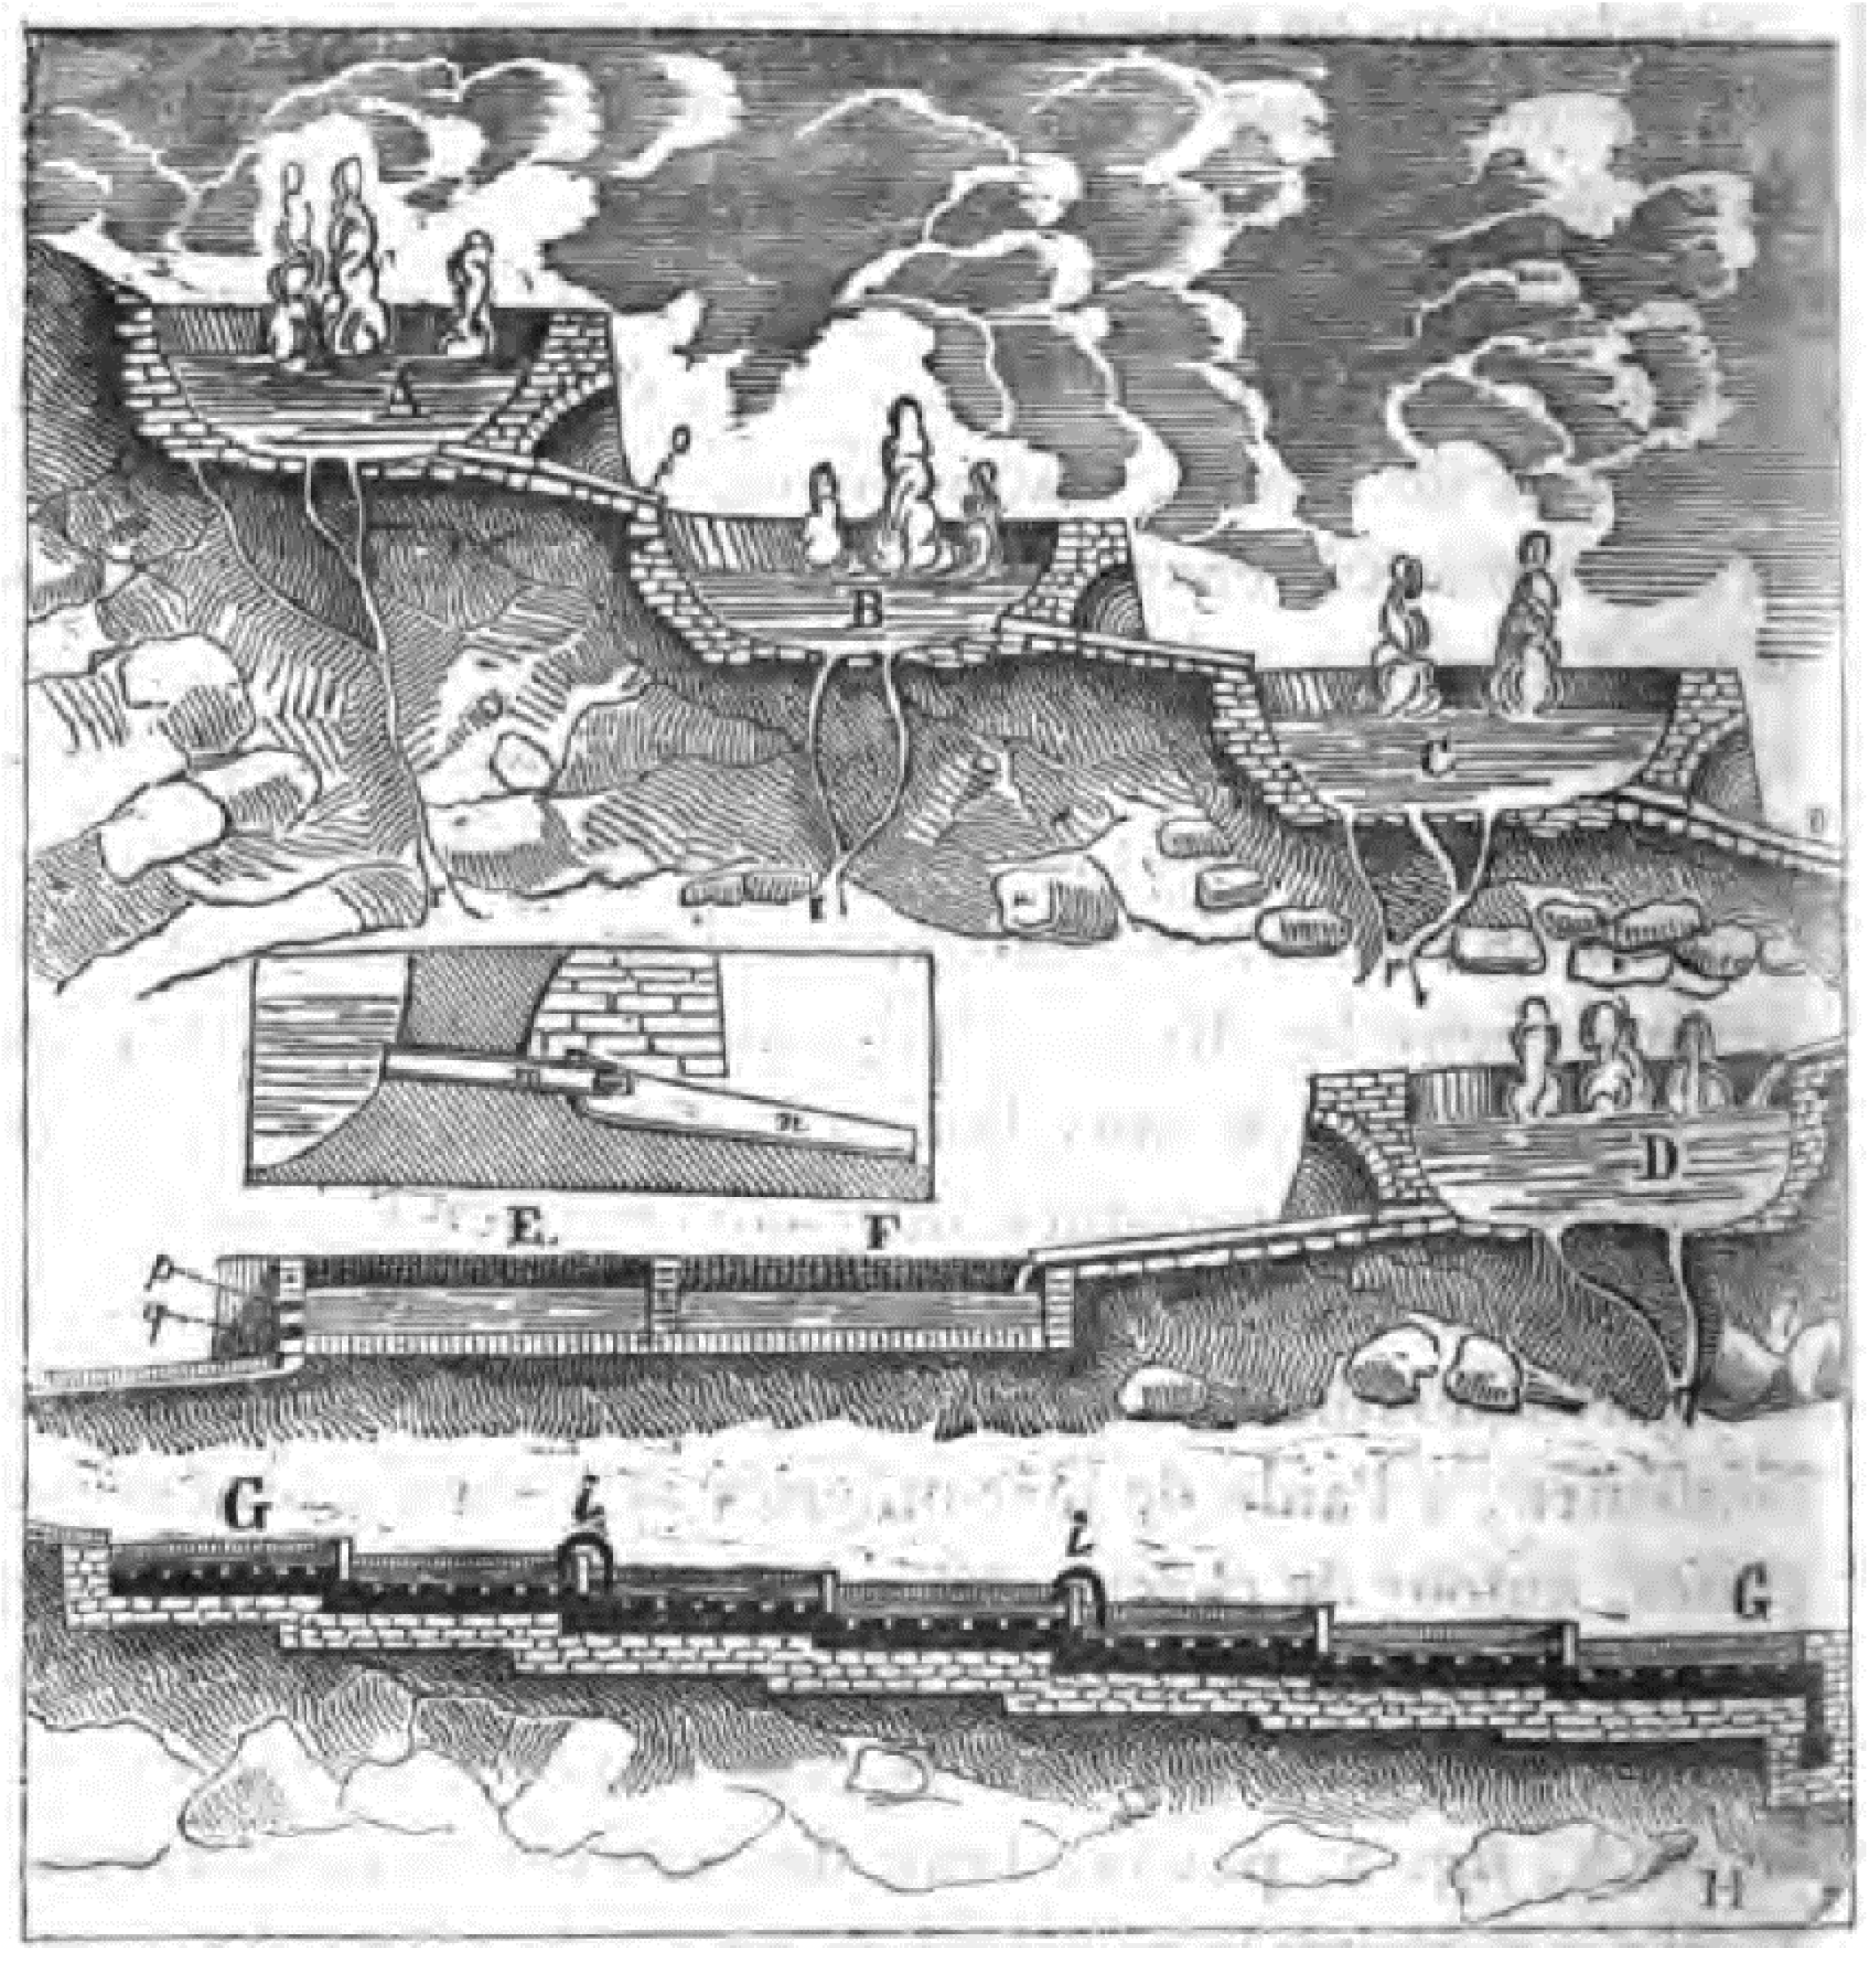
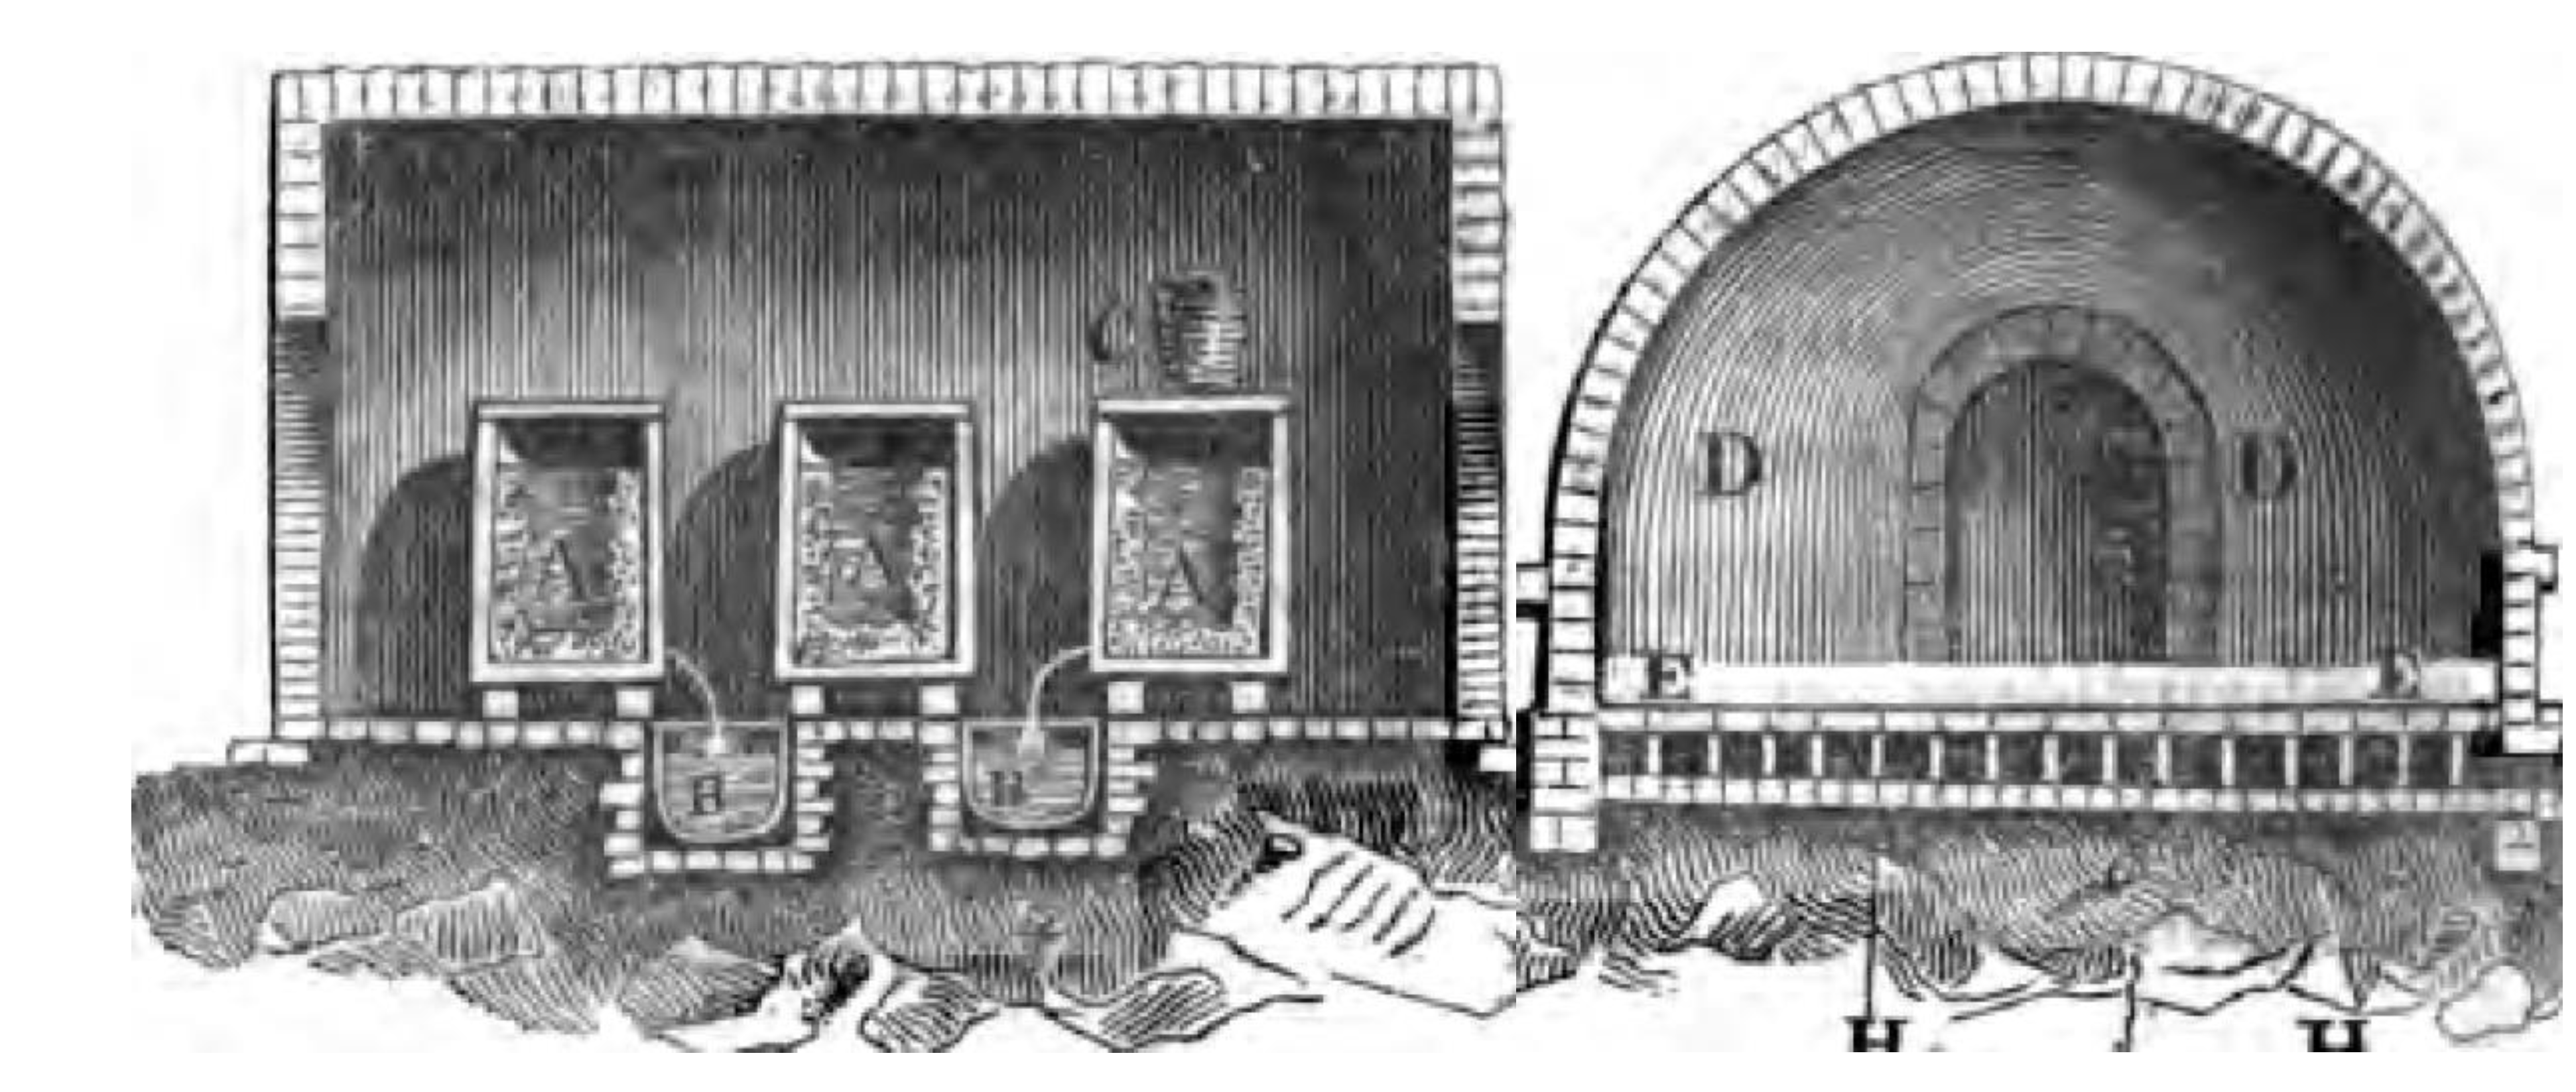
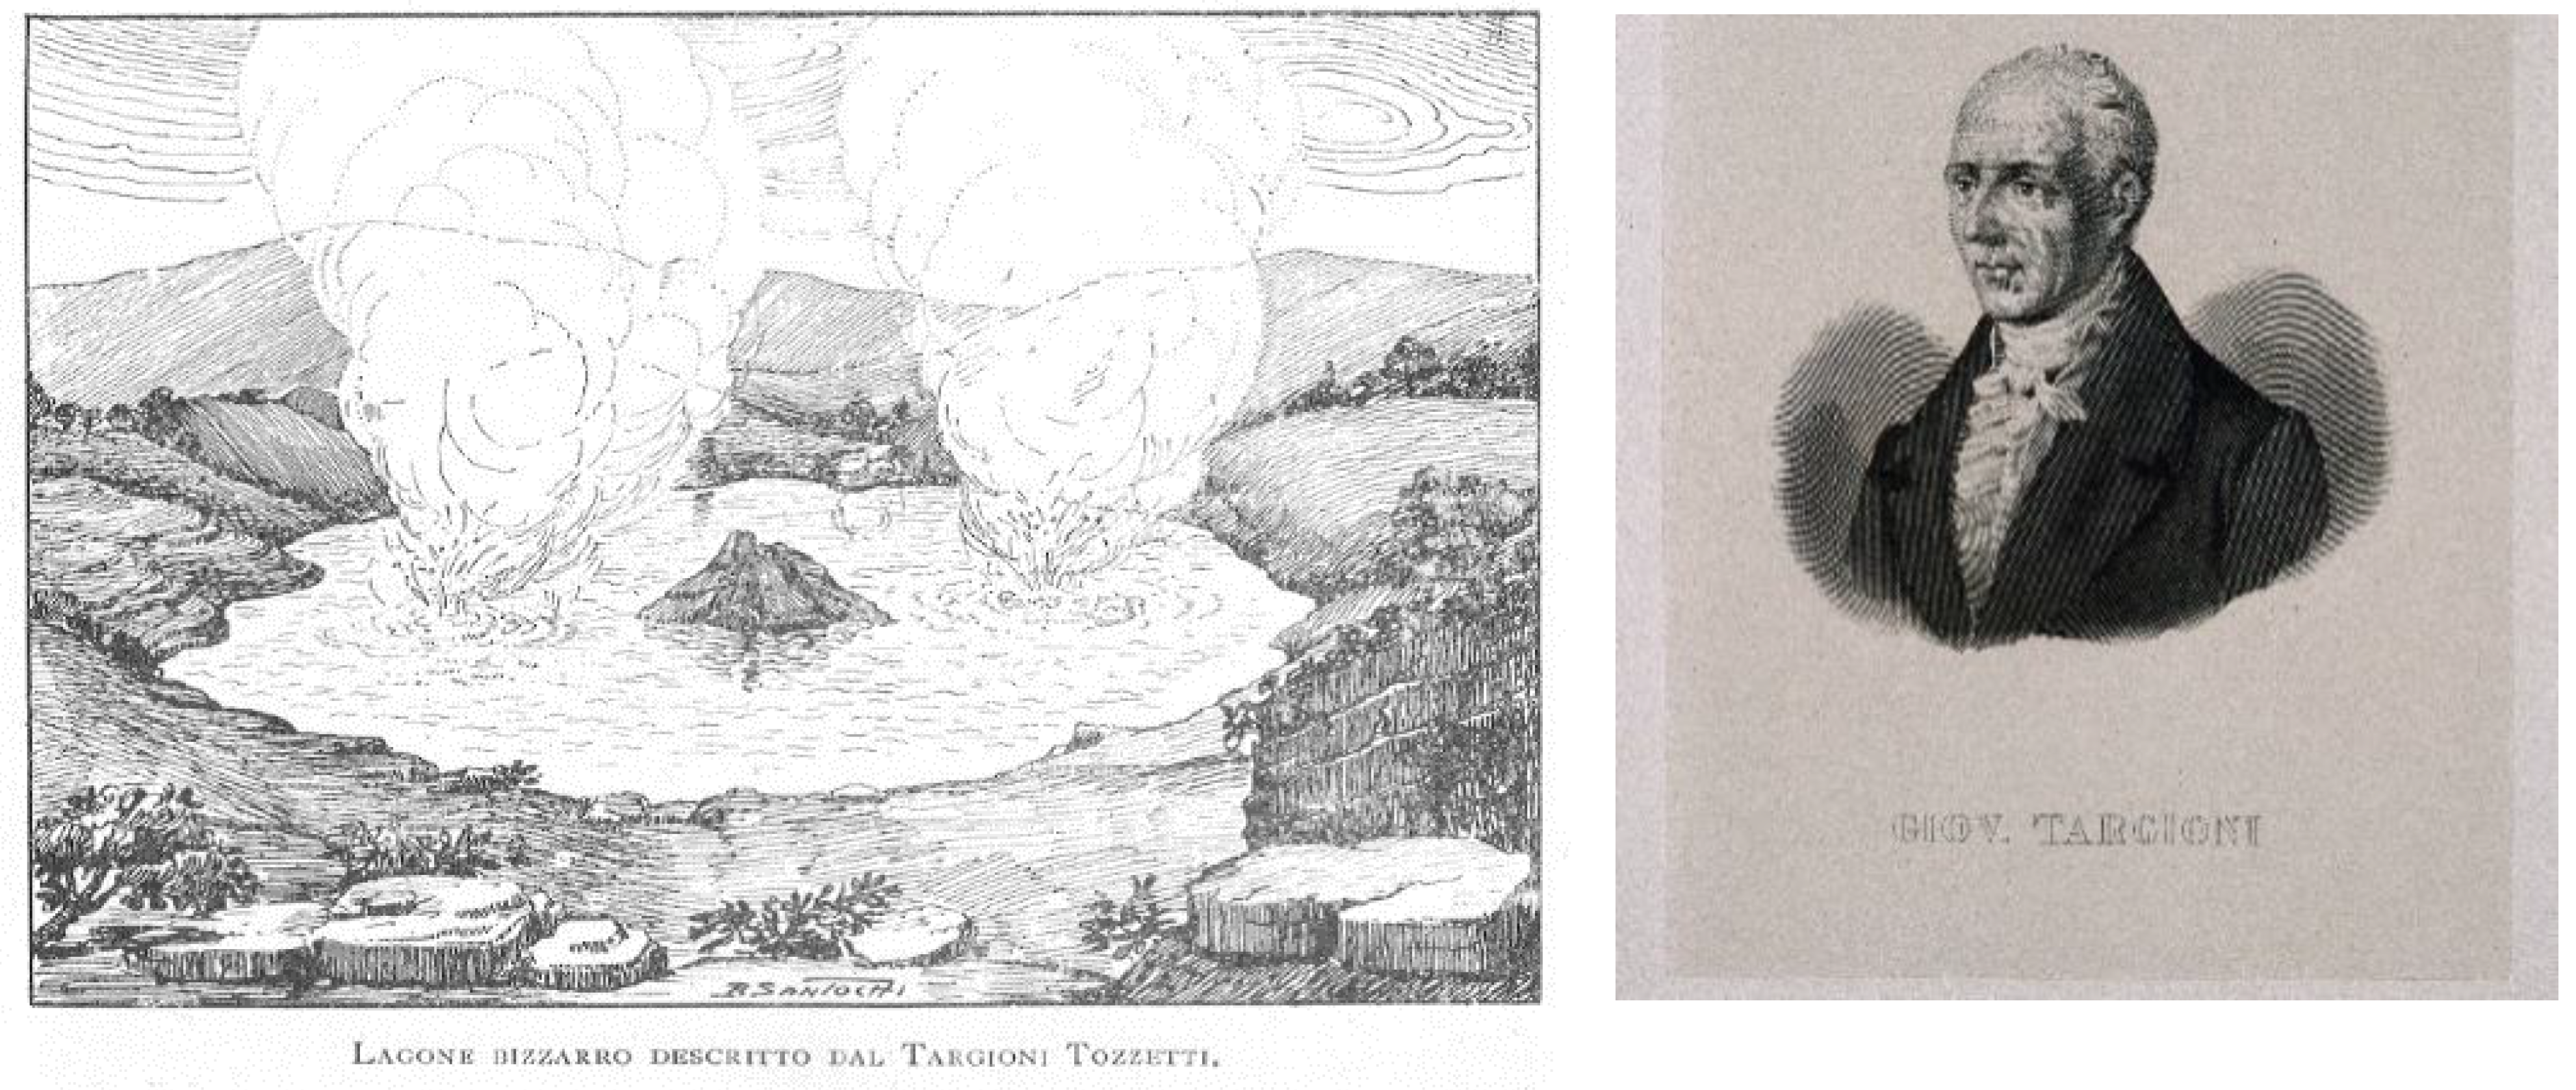
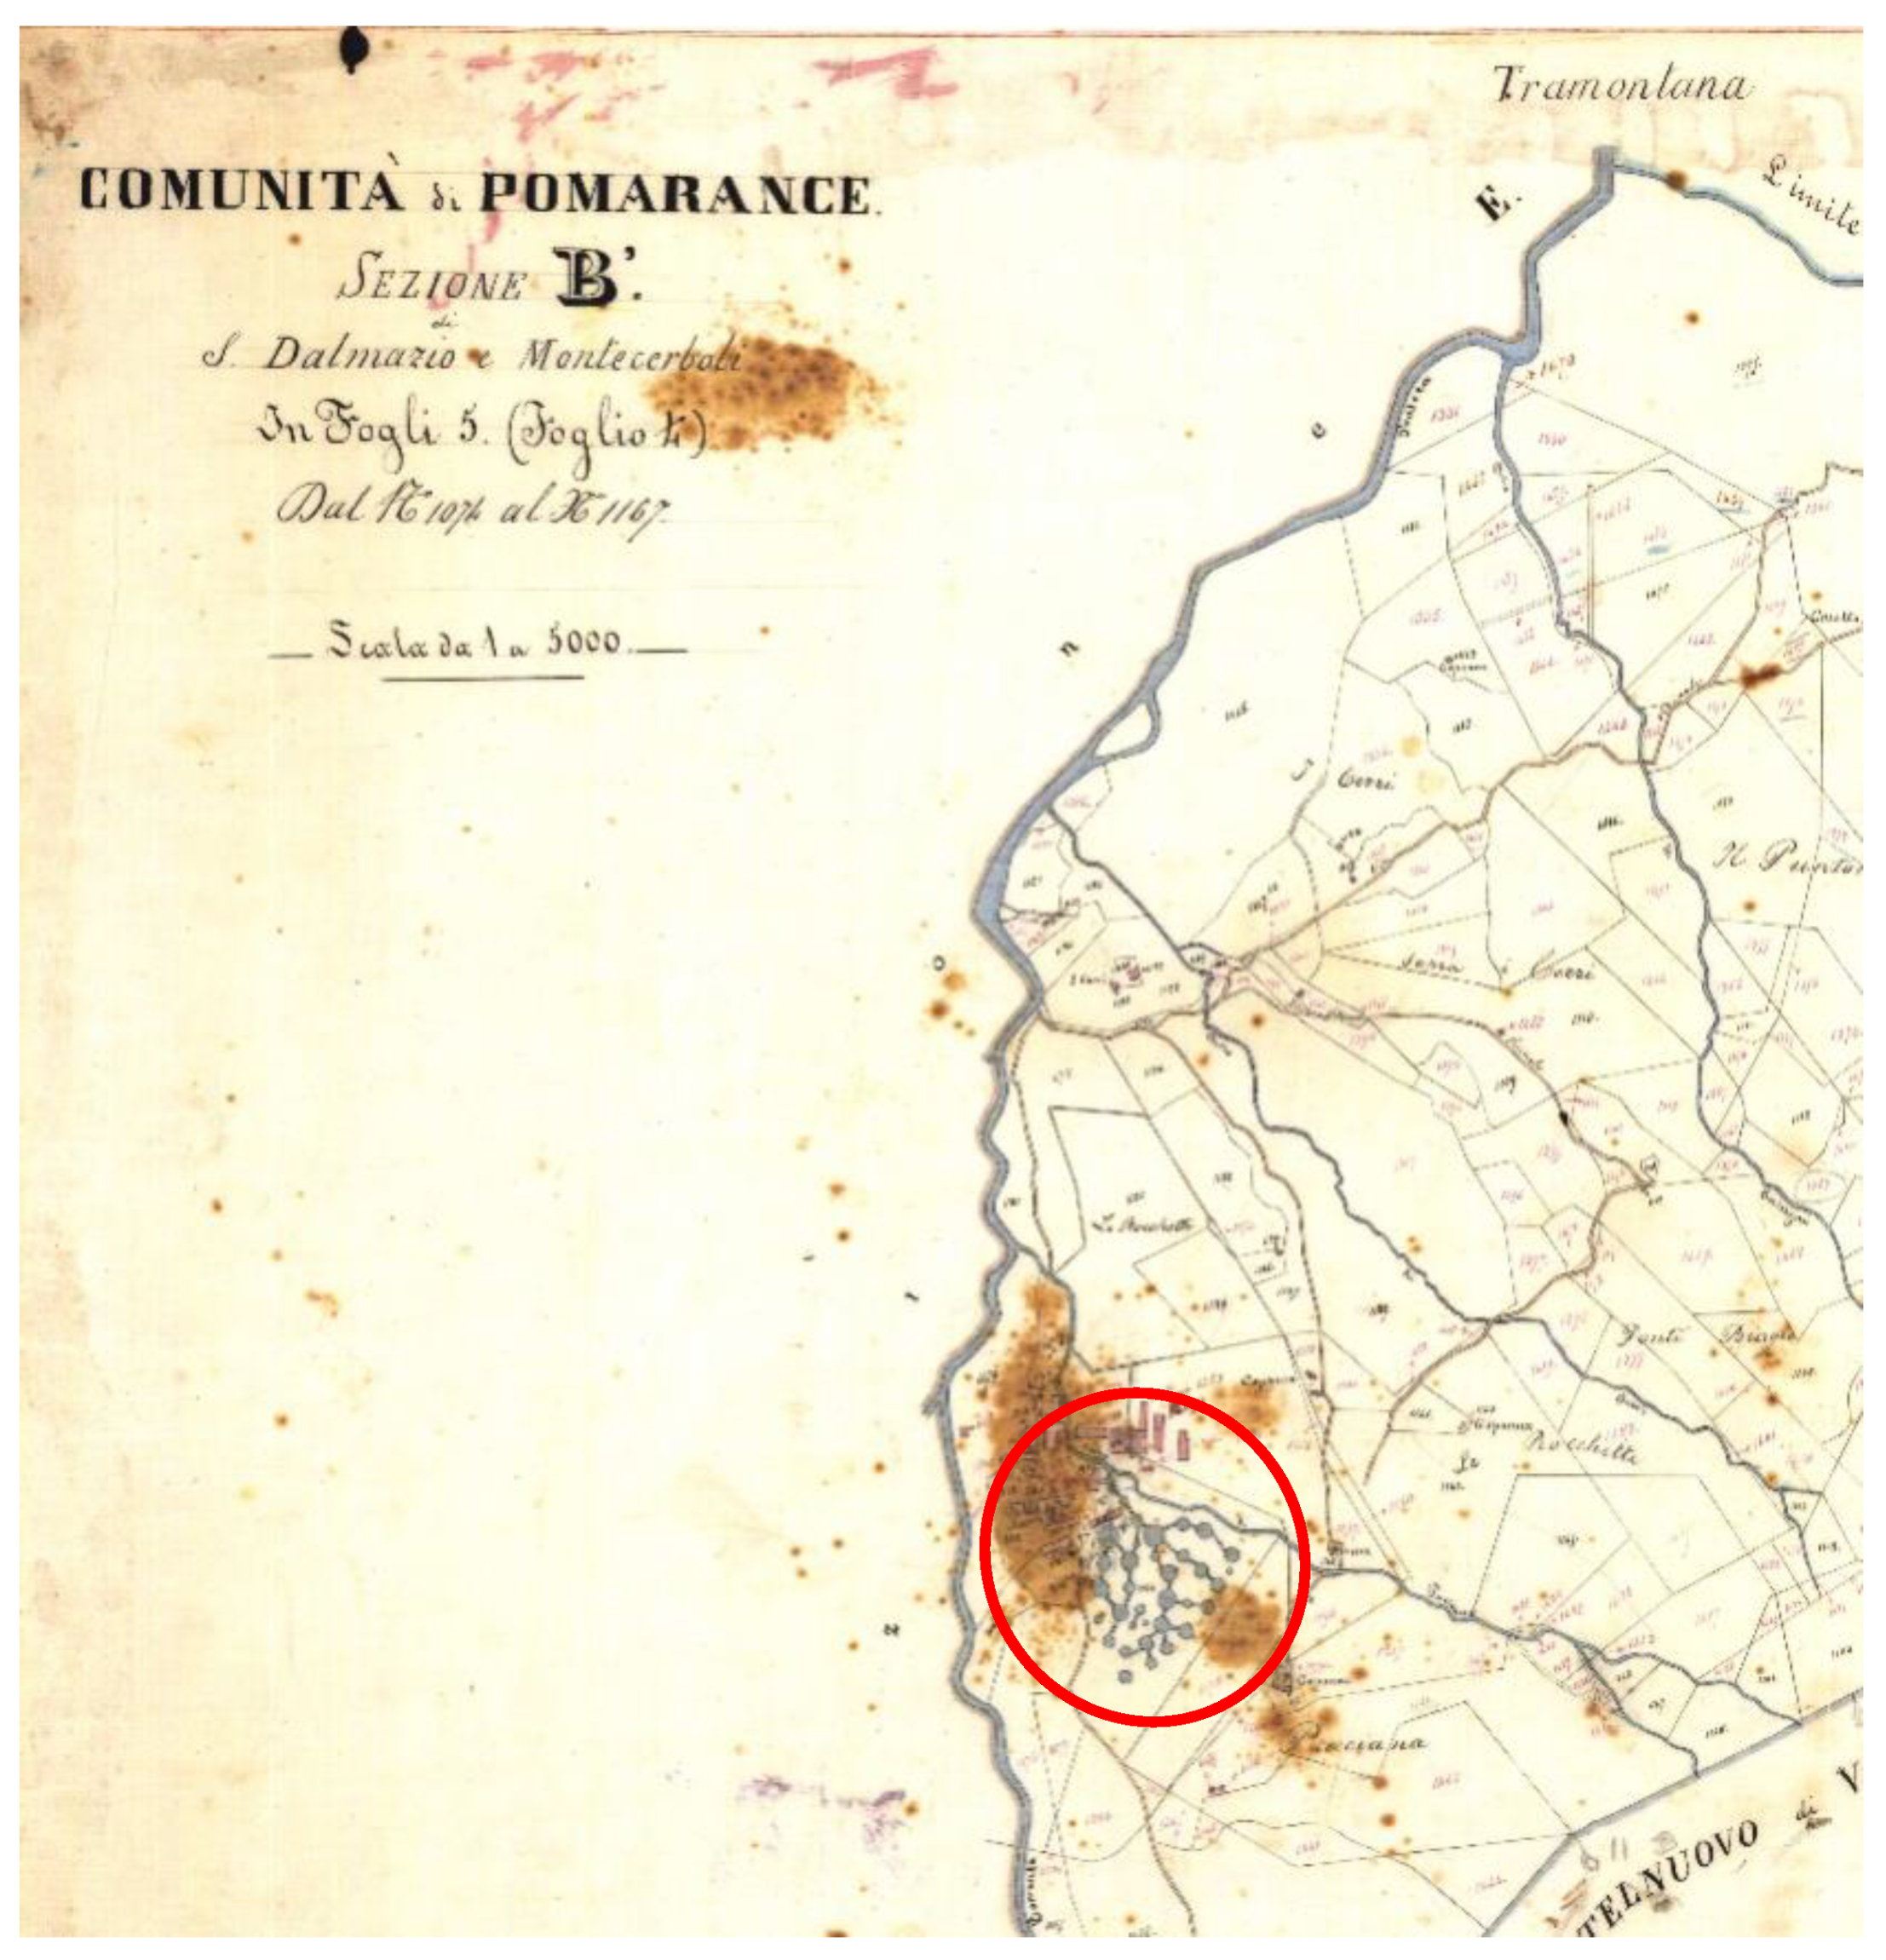
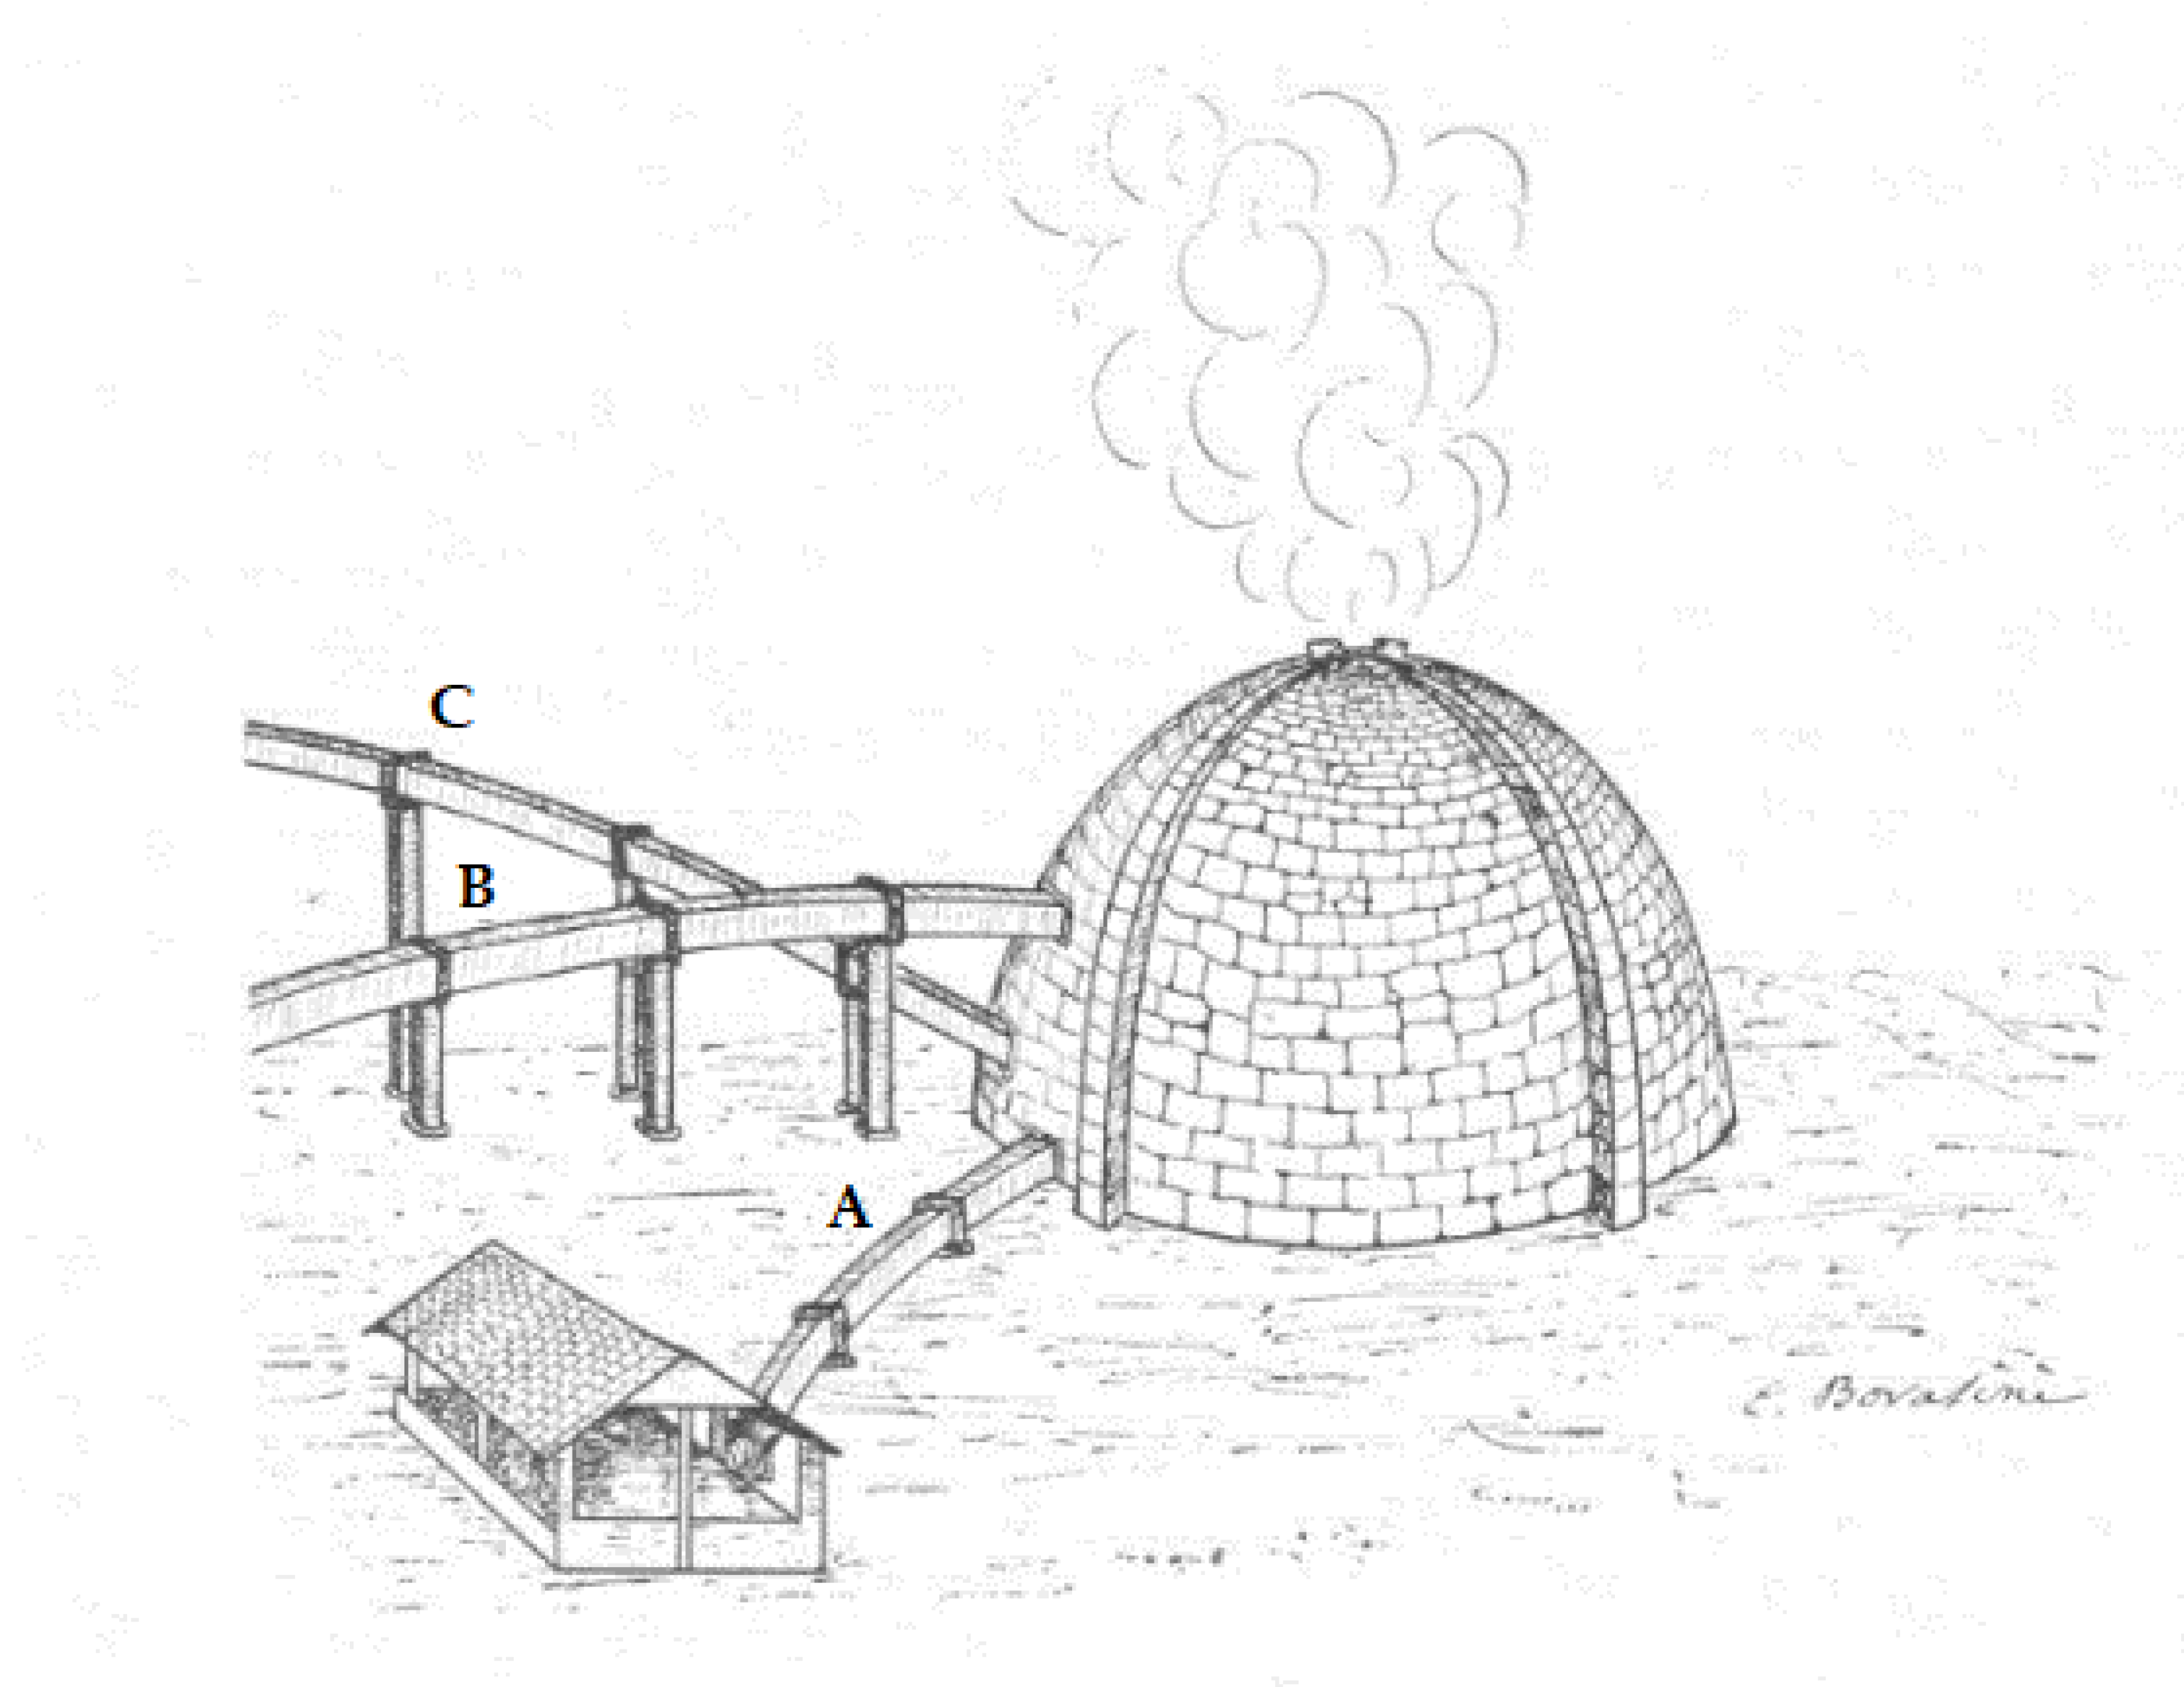
1.6. Historical Background on the Larderello Area
2. Material and Methods
3. Results and Discussion
4. Conclusions
Author Contributions
Funding
Acknowledgments
Conflicts of Interest
References
- Gianelli, G.; Ruggieri, G.; Mussi, M. Isotopic and fluid inclusion study of hydrothermal and metamorphic carbonates in the Larderello geothermal field and surrounding areas, Italy. Geothermics 1997, 26, 393–417. [Google Scholar] [CrossRef]
- Bertain and Thain, IGA News 49. 2002, pp. 1–3. Available online: https://www.geothermal-energy.org/iganews/ (accessed on 12 May 2021).
- Fridriksson, T.; Merino, A.M.; Orucu, A.Y.; Audinet, P. Greenhouse Gas Emissions from Geothermal Power Production. In Proceedings of the 42nd Workshop on Geothermal Reservoir Engineering—Stanford University, Stanford, CA, USA, 13–15 February 2017. [Google Scholar]
- Ármannsson, H. CO2 Emission from Geothermal Plants. In Proceedings of the International Geothermal Conference, Reykjavík, Iceland, 14–17 September 2003. Available online: https://citeseerx.ist.psu.edu/viewdoc/download?doi=10.1.1.463.525&rep=rep1&type=pdf (accessed on 12 May 2021).
- Ármannsson, H.; Fridriksson, T.; Kr*istjánsson, B.R. CO2 emissions from geothermal power plants and natural geothermal activity in Iceland. Geothermics 2005, 34, 286–296. [Google Scholar] [CrossRef]
- Chiodini, G.; Frondini, F.; Kerrick, D.; Rogie, J.; Parello, F.; Peruzzi, L.; Zanzari, A. Quantification of deep CO2 fluxes from Central Italy. Examples of carbon balance for regional aquifers and of soil diffuse degassing. Chem. Geol. 1999, 159, 205–222. [Google Scholar] [CrossRef]
- Rogie, J.D.; Kerrick, D.M.; Chiodini, G.; Frondini, F. Flux measurements of nonvolcanic CO2 emission from some vents in central Italy. J. Geophys. Res. Space Phys. 2000, 105, 8435–8445. [Google Scholar] [CrossRef]
- Kerrick, D.M. Present and past nonanthropogenic CO2 degassing from the solid earth. Rev. Geophys. 2001, 39, 565–585. [Google Scholar] [CrossRef]
- Carapezza, M.L.; Barberi, F.; Ranaldi, M.; Ricci, T.; Tarchini, L.; Barrancos, J.; Fischer, C.; Perez, N.; Weber, K.; di Piazza, A.; et al. Diffuse CO2 soil degassing and CO2 and H2S concentrations in air and related hazards at Vulcano Island. J. Volcanol. Geotherm. Res. 2011, 207, 130–144. [Google Scholar] [CrossRef]
- Sbrana, A.; Marianelli, P.; Belgiorno, M.; Sbrana, M.; Ciani, V. Natural CO2 degassing in the Mount Amiata volcanic–geothermal area. J. Volcanol. Geotherm. Res. 2020, 397, 106852. [Google Scholar] [CrossRef]
- Lenzi, A.; Caprai, A. Emissioni Naturali di Idrogeno Solforato Nell’area Amiantina Parte II: Misure, Proceedings of CODICE ARMONICO Congress: ETS, Editor; Pisa, Italy, 2016; pp. 210–217, ISBN 978-884674638-2. Available online: https://www.researchgate.net/profile/Alessandro-Lenzi-3/publication/310385772_Emissioni_naturali_di_idrogeno_solforato_nell’area_amiantina_parte_II_misure/links/582c579608ae102f0726c6d6/Emissioni-naturali-di-idrogeno-solforato-nellarea-amiantina-parte-II-misure.pdf (accessed on 12 May 2021).
- Chiodini, G.; Cardellini, C.; Caliro, S.; Avino, R.; Donnini, M.; Granieri, D.; Morgantini, N.; Sorrenti, D.; Frondini, F. The hydrothermal system of Bagni San Filippo (Italy): Fluids circulation and CO2 degassing. Ital. J. Geosci. 2020, 139, 383–397. [Google Scholar]
- Chiodini, G.; Cardellini, C.; Amato, A.; Boschi, E.; Caliro, S.; Frondini, F.; Ventura, G. Carbon dioxide Earth degassing and seismogenesis in central and southern Italy. Geophys. Res. Lett. 2004, 31. [Google Scholar] [CrossRef]
- Gambardella, B.; Cardellini, C.; Chiodini, G.; Frondini, F.; Marini, L.; Ottonello, G.; Zuccolini, M.V. Fluxes of deep CO2 in the volcanic areas of central-southern Italy. J. Volcanol. Geotherm. Res. 2004, 136, 31–52. [Google Scholar] [CrossRef]
- Frondini, F.; Caliro, S.; Cardellini, C.; Chiodini, G. Carbon dioxide degassing from tuscany and northern lithium. Glob. Planet. Chang. 2008, 61, 89–102. [Google Scholar] [CrossRef]
- Werner, C.; Cardellini, C. Comparison of carbon dioxide emissions with fluid upflow, chemistry, and geologic structures at the Rotorua geothermal system, New Zealand. Geothermics 2006, 35, 221–238. [Google Scholar] [CrossRef]
- Frondini, F.; Caliro, S.; Cardellini, C.; Chiodini, G.; Morgantini, N. Carbon dioxide degassing and thermal energy release in the Monte Amiata volcanic-geothermal area (Italy). Appl. Geochem. 2009, 24, 860–875. [Google Scholar] [CrossRef]
- Holm, A.; Jennejohn, D.; Blodgett, L. Geothermal Energy and Greenhouse Gas Emissions; Geothermal Energy Association: Washington, DC, USA, 2012; pp. 1–14. [Google Scholar]
- Ármannsson, H. Carbon Dioxide Emissions from Icelandic Geothermal Areas. An Overview; Iceland GeoSurvey (ÍSOR): Landsvirkjun, Iceland, 2016. [Google Scholar]
- Fridriksson, T.; Mateos, A.; Audinet, P.; Orucu, Y. Greenhouse Gas Emission from Geothermal Power Production; The World Bank: Washington, DC, USA, 2016. [Google Scholar]
- Bertani, R. Geothermal power generation in the world 2010–2014 update report. Geothermics 2016, 60, 31–43. [Google Scholar] [CrossRef]
- Fridriksson, T.; Oladottir, A.A.; Jonsson, P.; Eyjolfsdottir, E.I. The Response of the Reykjanes Geothermal System to 100 MWe Power Production: Fluid Chemistry and Surface Activity. In Proceedings World Geothermal Congress; Iceland GeoSurvey: Bali, Indonesia, 2010; pp. 1–7. [Google Scholar]
- Fridriksson, T.; Mateos, A.; Audinet, P.; Orucu, Y. Greenhouse Gases from Geothermal Power Production. In Energy Sector Management Assistance Program (ESMAP) Technical Report 09/16; World Bank: Washington, DC, USA, 2016; Available online: https://openknowledge.worldbank.org/handle/10986/24691 (accessed on 12 May 2021).
- Sheppard, D.; Mroczek, E. Greenhouse gas emissions from the exploitation geothermal systems. IGA News 2004, 55, 11–13. Available online: https://www.geothermal-energy.org/ (accessed on 12 May 2021).
- Giovanni Ginori Conti “I progressi scientifico tecnici realizzati a Larderello”; Tipografia Editrice Italiana: Rome, Italy, 1933; p. 48.
- Homberg, W. Mémoire de l’Academie Royale des Sciences; Paris, France. 1702, p. 51. Available online: https://www.biodiversitylibrary.org/bibliography/4000 (accessed on 12 May 2021).
- Uberto Francesco Hoefer, Memoria Sopra il Sale Sedativo Naturale Della Toscana e del Borace che con Quello si Compone Scoperto da Uberto Francesco Hoefer; Gaetano Cambiagi Stamperia Granducale: Florence, Italy, 1778.
- Berzelius, J.J. ‘Traité de Chimie’; Firmin Didot frères Libraires Éditeurs: Parsi, France, 1830. [Google Scholar]
- Giovanni Targioni Tozzetti. Viaggi Fatti in Diverse Parti Della Toscana per Osservare le Produzioni Naturali e gli Antichi Monumenti di Essa; Gaetano Cambiagi Stamperia Granducale: Florence, Italy, 1768. [Google Scholar]
- Larderello Spa Report. Brevi Note sui Soffioni Boraciferi Toscani e Sulla Loro Utilizzazione Industriale; Arti Grafiche S.p.A.: Bologna, Italy, 1952; p. 10. [Google Scholar]
- Burgassi, P.D.; Cataldi, R.; Donati, C. Scientific investigation and technological development in the Larderello region from XVI through XIX centuries. In Proceedings of the World Geothermal Congress, Florence, Italy, 18–31 May 1995. [Google Scholar]
- Vannoli, P.; Martinelli, G.; Valensise, G. The Seismotectonic Significance of Geofluids in Italy. Front. Earth Sci. 2021, 9, 25. [Google Scholar] [CrossRef]
- Gherardi, F.; Panichi, C.; Gonfiantini, R.; Magro, G.; Scandiffio, G. Isotope systematics of C-bearing gas compounds in the geothermal fluids of Larderello, Italy. Geothermics 2005, 34, 442–470. [Google Scholar] [CrossRef]
- De Larderel, F. Notice sur la Production de L‘acide Borique en Toscane par le Comte de Larderel; Typhographie de Jule Sardi: Livorno, Italy, 1858. [Google Scholar]
- Nasini, R. I Soffioni Boraficeri e la Industria Dell’acido Borico in Toscana Nota Sulla Produzione dell’acido Borico in Toscana; De Larderel, d.F., Ed.; VI Congresso Internazionale di Chimica Applicata: Roma, Italy, 1906. [Google Scholar]
- Repetti, E. Dizionario Geografico Fisico Storico Della Toscana Contenente la Descrizione di Tutti i Luoghi del Granducato, Ducato di Lucca, Garfagnana e Lunigiana; Tofani: Firenze, Italy, 1835. [Google Scholar]
- Meneghini, G. Sulla Produzione Dell’acido Borico dei Conti De Lardarel; Tipografia Nistri: Pisa, Italy, 1867. [Google Scholar]
- Ginori Conti, P. La Forza Motrice dei Soffioni Boraciferi Della Toscana, sua Utilizzazione ed Applicazione; Stab. Tipografico G. Ramella & C.: Florence, Italy, 1906. [Google Scholar]
- Nasini, R. I Soffioni e i Lagoni Della Toscana e la Industria Boracifera, Storia Studi e Ricerche Chimiche e Chimico Fisiche Eseguite Principalmente Nell’ultimo Venticinquennio; Tipografia Editrice Italia: Roma, Italy, 1930. [Google Scholar]
- Payen, F.A. Annales de Chimie et de Physique, III; Fortin Massonet Libraires: Paris, France, 1841; pp. 247–257. [Google Scholar]


| Reference | Area of Study | Data as Reported in the Original Paper | Data Expressed in t/h |
|---|---|---|---|
| Bertani and Thain 2002 [2] | Global ranges for CO2 emission (GPP) | 4–740 gCO2/KWh | |
| Fridriksson 2017 [3] | Turkish geothermal fields | 400–1300 gCO2/KWh | |
| Emissions of CO2 from fossil fuels | 350–1100 gCO2/KWh | ||
| Armansson 2003 [4] | Natural emissions from Krafla, Iceland | 200 gCO2/d m2 | |
| Armansson 2005 [5] | Estimated CO2 annual emissions from several geothermal and volcanic systems around the world | 0.01–1000 Mt/y | 1.14–144,077 |
| Pantellleria Island | 0.39 Mt/y | 44.5 | |
| Mid-Ocean Volcanic system | 30–1000 Mt/y | 3422–144,077 | |
| New Zealand | 0.44–0.95 Mt/y | 50.2–108.4 | |
| Total estimated emission ranges | 200–1000 Mt/y | 22,815–144,077 | |
| Frondini et al. 1999 [6] | CO2 fluxes from central Italy | ||
| Stifone | 30 | ||
| Clitunno | 0.15 | ||
| Rasiglia | 0.11 | ||
| Canino | 0.7 | ||
| Rogie, Kerrick, Chiodini and Frondini 2000 [7] | Selvena | 0.7 | |
| Central Italy acquifers | 1–3 × 10¹¹ mol/y | 502–1506 | |
| Kerrick 2001 [8] | Discharge from focused emission, Central Italy | 1 × 10¹⁰ mol/y | 50 |
| Carapezza 2011 [9] | Volcano Island | 1350 t/d | 56.3 |
| Sbrana 2020 [10] | Amiata Area (225 km2) emission shallow biogenic + deep origin carbon | 13,350 t/d | 556.3 |
| Lenzi Caprai 2016 [11] | Emission CO2 from sharp soil venters in Amiata area | 6.8 | |
| Chiodini 2020 [12] | Bagni San Filippo area (1.7 km2), combined soil emission end springs emission | 910 t/d | 37.9 |
| Chiodini 2004 [13] | Emission deep CO2 in Tuscan Roman Degassing Structure (TRDS) | 703 | |
| Emission deep CO2 in Campanian Degassing Structure (CDS) | 351 | ||
| Gambardella 2004 [14] | Flux of CO2 is released into the atmosphere in the entire anomalous area of Central Italy | 9.7–17 Mt/y | 1107–1940 |
| Frondini et al. 2008 [15] | Indirect estimation of CO2 flux from regional aquifers (tuscany and northen Latium) | 0.9 × 10¹¹ mol/y | 452 |
| Armansson 2005 [5] | Maximum possible CO2 flux from geothermal and volcanic systems in Iceland | 1.3 × 10⁹ kg/y | 148 |
| Werner et al. 2006 [16] | CO2 fluxes from the Rotorua system in New Zealand (8.9 km2) | 69.66 t/d km2 | 26 |
| STEAM FROM WELLS | G/V (%wt/wt) (a) | [H3BO3] (‰) (b) | [H3BO3] (mg/L) (c) |
|---|---|---|---|
| Foro forte (del Capanno) | 5.00 | 0.58 | 580 |
| Foro dei Visconti (Piazza Anna) | 5.00 | 0.50 | 500 |
| Foro forte di Piazza Anna | 11.80 | 0.53 | 530 |
| Foro di S.Arturo in Piazza Anna | 10.30 | 0.47 | 470 |
| Foro Venella | 6.70 | 0.52 | 520 |
| Foro del Cancello | 6.00 | 0.16 | 160 |
| Foro dei lagoni | 6.00 | 0.42 | 420 |
| II° foro lagoni | 10.50 | 0.65 | 650 |
| Foro dell’ammoniaca | 5.80 | 0.35 | 350 |
| Foro dei tini | 6.00 | 0.48 | 480 |
| Foro del Terrazzo | 6.30 | 0.42 | 420 |
| Foro della turbine | 5.80 | 0.60 | 600 |
| Foro umido, debole, tra i lagoni | 0.82 | 2.80 | 2800 |
| Foro umido di Piazza Anna | 14.60 | 4.60 | 4600 |
| Average | 7.19 | 0.934 | 934 |
| Year | Boric Acid Production (Kg/y) | Boric Acid Production (t/y) | Steam Calculated from Rf (t/y) | NCG Emission Calculated from RNCG (t/y) | Average Steam Flow rate (t/h) | Average NCG Flow Rate (t/h) |
|---|---|---|---|---|---|---|
| 1818–1828 | 50,000 | 50 | 57,661 | 4144 | 6,6 | 0.47 |
| 1829–1838 | 466,666 | 467 | 538,169 | 38,679 | 62 | 4.4 |
| 1839 | 717,333 | 717 | 827,243 | 59,455 | 95 | 6.8 |
| 1840 | 841,584 | 842 | 970,531 | 69,753 | 111 | 8.0 |
| 1841 | 849,268 | 849 | 979,393 | 70,390 | 112 | 8.0 |
| 1842 | 885,046 | 885 | 1,020,653 | 73,356 | 117 | 8.4 |
| 1843 | 885,067 | 885 | 1,020,677 | 73,358 | 117 | 8.4 |
| 1844 | 885,000 | 885 | 1,020,600 | 73,352 | 117 | 8.4 |
| 1845 | 885,066 | 885 | 1,020,676 | 73,357 | 117 | 8.4 |
| 1846 | 1,000,000 | 1000 | 1,153,220 | 82,884 | 132 | 9.5 |
| 1847 | 1,000,000 | 1000 | 1,153,220 | 82,884 | 132 | 9.5 |
| 1848 | 1,000,000 | 1000 | 1,153,220 | 82,884 | 132 | 9.5 |
| 1849 | 1,000,000 | 1000 | 1,153,220 | 82,884 | 132 | 9.5 |
| 1850 | 1,000,000 | 1000 | 1,153,220 | 82,884 | 132 | 9.5 |
| 1851 | 1,166,666 | 1167 | 1,345,423 | 96,697 | 154 | 11.0 |
| 1855 | 1,333,333 | 1333 | 1,537,626 | 110,511 | 176 | 12.6 |
| 1857 | 1,633,333 | 1633 | 1,883,592 | 135,376 | 215 | 15.4 |
| Year | Tuscan Libbra/y | Boric Acid Production (Kg/y) | Boric Acid Production (t/y) | Steam Calculated from Rf (t/y) | NCG Emission Calculated from RNCG (t/y) | Average Steam Flow Rate (t/h) | Average NCG Flow Rate (t/h) |
|---|---|---|---|---|---|---|---|
| 1826 | 149,000 | 50,591 | 51 | 58,343 | 4193 | 6.7 | 0.48 |
| 1827 | 66,000 | 22,410 | 22 | 25,843 | 1857 | 3.0 | 0.21 |
| 1828 | 197,000 | 66,889 | 67 | 77,138 | 5544 | 8.8 | 0.63 |
| 1829 | 376,000 | 127,667 | 128 | 147,228 | 10,581 | 16.8 | 1.21 |
| 1830 | 602,000 | 204,403 | 204 | 235,722 | 16,942 | 26.9 | 1.93 |
| 1831 | 789,000 | 267,897 | 268 | 308,944 | 22,204 | 35.3 | 2.53 |
| 1832 | 1,103,000 | 374,513 | 375 | 431,895 | 31,041 | 49.3 | 3.54 |
| 1833 | 1,347,000 | 457,360 | 457 | 527,437 | 37,908 | 60.2 | 4.33 |
| 1834 | 1,725,000 | 585,707 | 586 | 675,448 | 48,545 | 77.1 | 5.54 |
| 1835 | 1,841,000 | 625,093 | 625 | 720,870 | 51,810 | 82.3 | 5.91 |
| Plant Name | Boric acid Daily Production (kg/d) | Boric Acid Production (Kg/y) | Boric Acid Production (t/y) | Steam Calculated from Rf (t/y) | NCG Emission Calculated from RNCG (t/y) | Average Steam Flow Rate (t/h) | Average NCG Flow Rate (t/h) |
|---|---|---|---|---|---|---|---|
| Larderello | 1740 | 634,841 | 635 | 732,111 | 52,618 | 83.6 | 6.0 |
| Castelnuovo | 304 | 111,235 | 111 | 128,278 | 9220 | 14.6 | 1.1 |
| Sasso | 710 | 259,267 | 259 | 298,992 | 21,489 | 34.1 | 2.5 |
| Monterotondo | 317 | 115,524 | 116 | 133,225 | 9575 | 15.2 | 1.1 |
| Lago-Collacchia, S. Edoardo, S. Federigo | 1180 | 430,931 | 431 | 496,958 | 35,717 | 56.7 | 4.1 |
| Lustignano | 310 | 113,067 | 113 | 130,391 | 9371 | 14.9 | 1.1 |
| Serrazzano | 348 | 127,389 | 127 | 146,908 | 10,558 | 16.8 | 1.2 |
| Total | 4909 | 1,792,254 | 1792 | 2,066,863 | 148,548 | 236 | 17.0 |
Publisher’s Note: MDPI stays neutral with regard to jurisdictional claims in published maps and institutional affiliations. |
© 2021 by the authors. Licensee MDPI, Basel, Switzerland. This article is an open access article distributed under the terms and conditions of the Creative Commons Attribution (CC BY) license (https://creativecommons.org/licenses/by/4.0/).
Share and Cite
Lenzi, A.; Paci, M.; Giudetti, G.; Gambini, R. Tracing Ancient Carbon Dioxide Emission in the Larderello Area by Means of Historical Boric Acid Production Data. Energies 2021, 14, 4101. https://doi.org/10.3390/en14144101
Lenzi A, Paci M, Giudetti G, Gambini R. Tracing Ancient Carbon Dioxide Emission in the Larderello Area by Means of Historical Boric Acid Production Data. Energies. 2021; 14(14):4101. https://doi.org/10.3390/en14144101
Chicago/Turabian StyleLenzi, Alessandro, Marco Paci, Geoffrey Giudetti, and Roberto Gambini. 2021. "Tracing Ancient Carbon Dioxide Emission in the Larderello Area by Means of Historical Boric Acid Production Data" Energies 14, no. 14: 4101. https://doi.org/10.3390/en14144101
APA StyleLenzi, A., Paci, M., Giudetti, G., & Gambini, R. (2021). Tracing Ancient Carbon Dioxide Emission in the Larderello Area by Means of Historical Boric Acid Production Data. Energies, 14(14), 4101. https://doi.org/10.3390/en14144101