
Joint Optimal Planning of Electricity and Modern Energy Cooking Services Access in Nyagatare

 ,
,
Abstract
1. Introduction
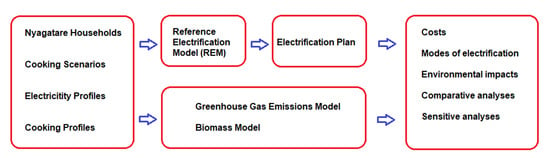
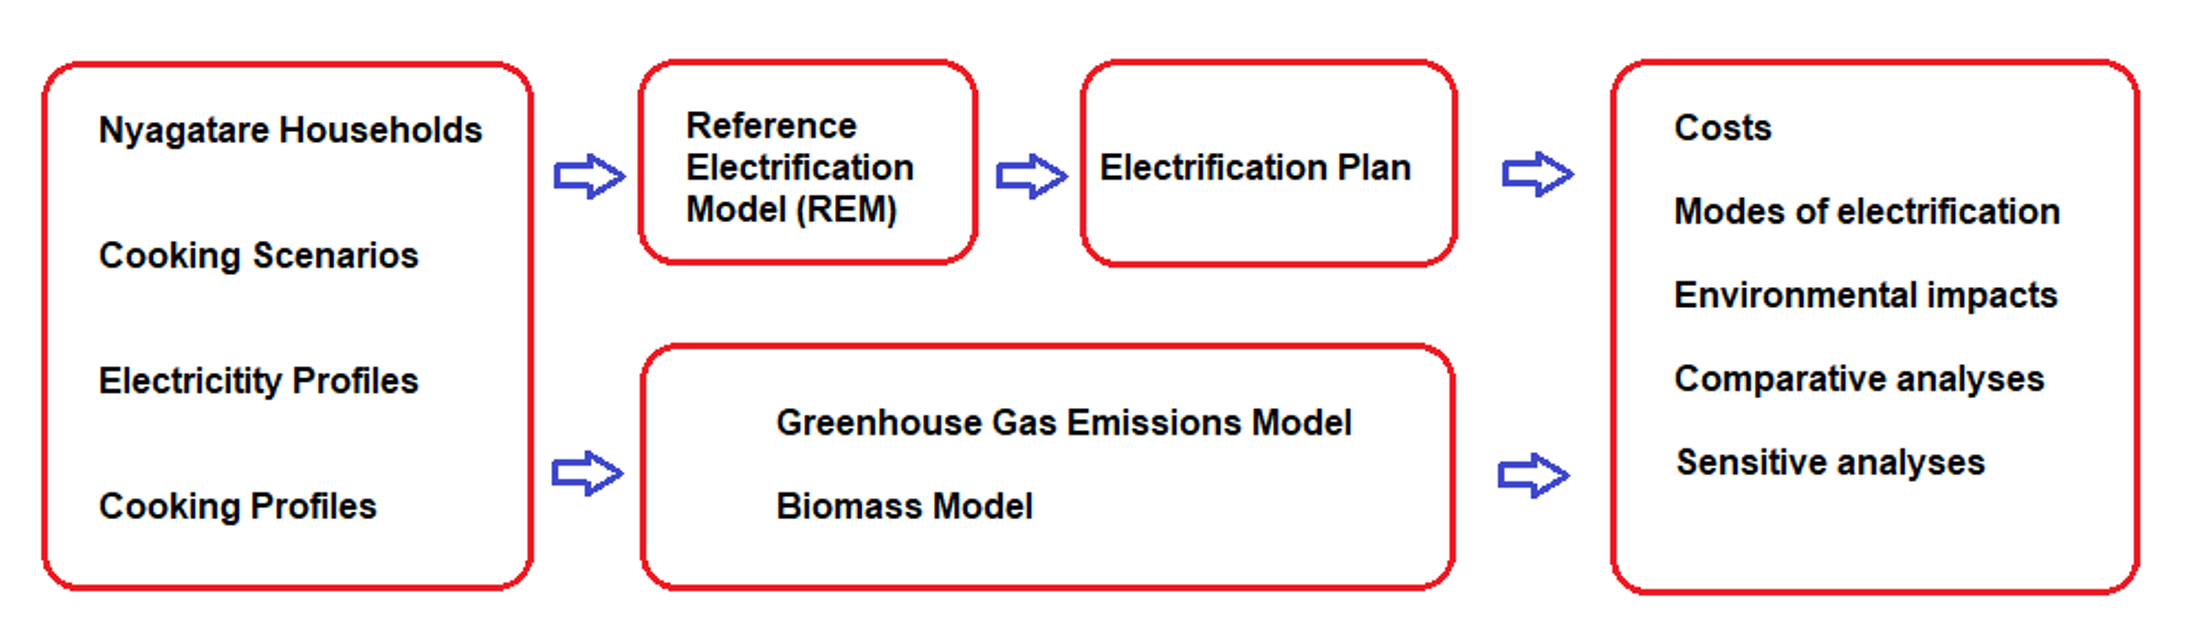
2. Case Study
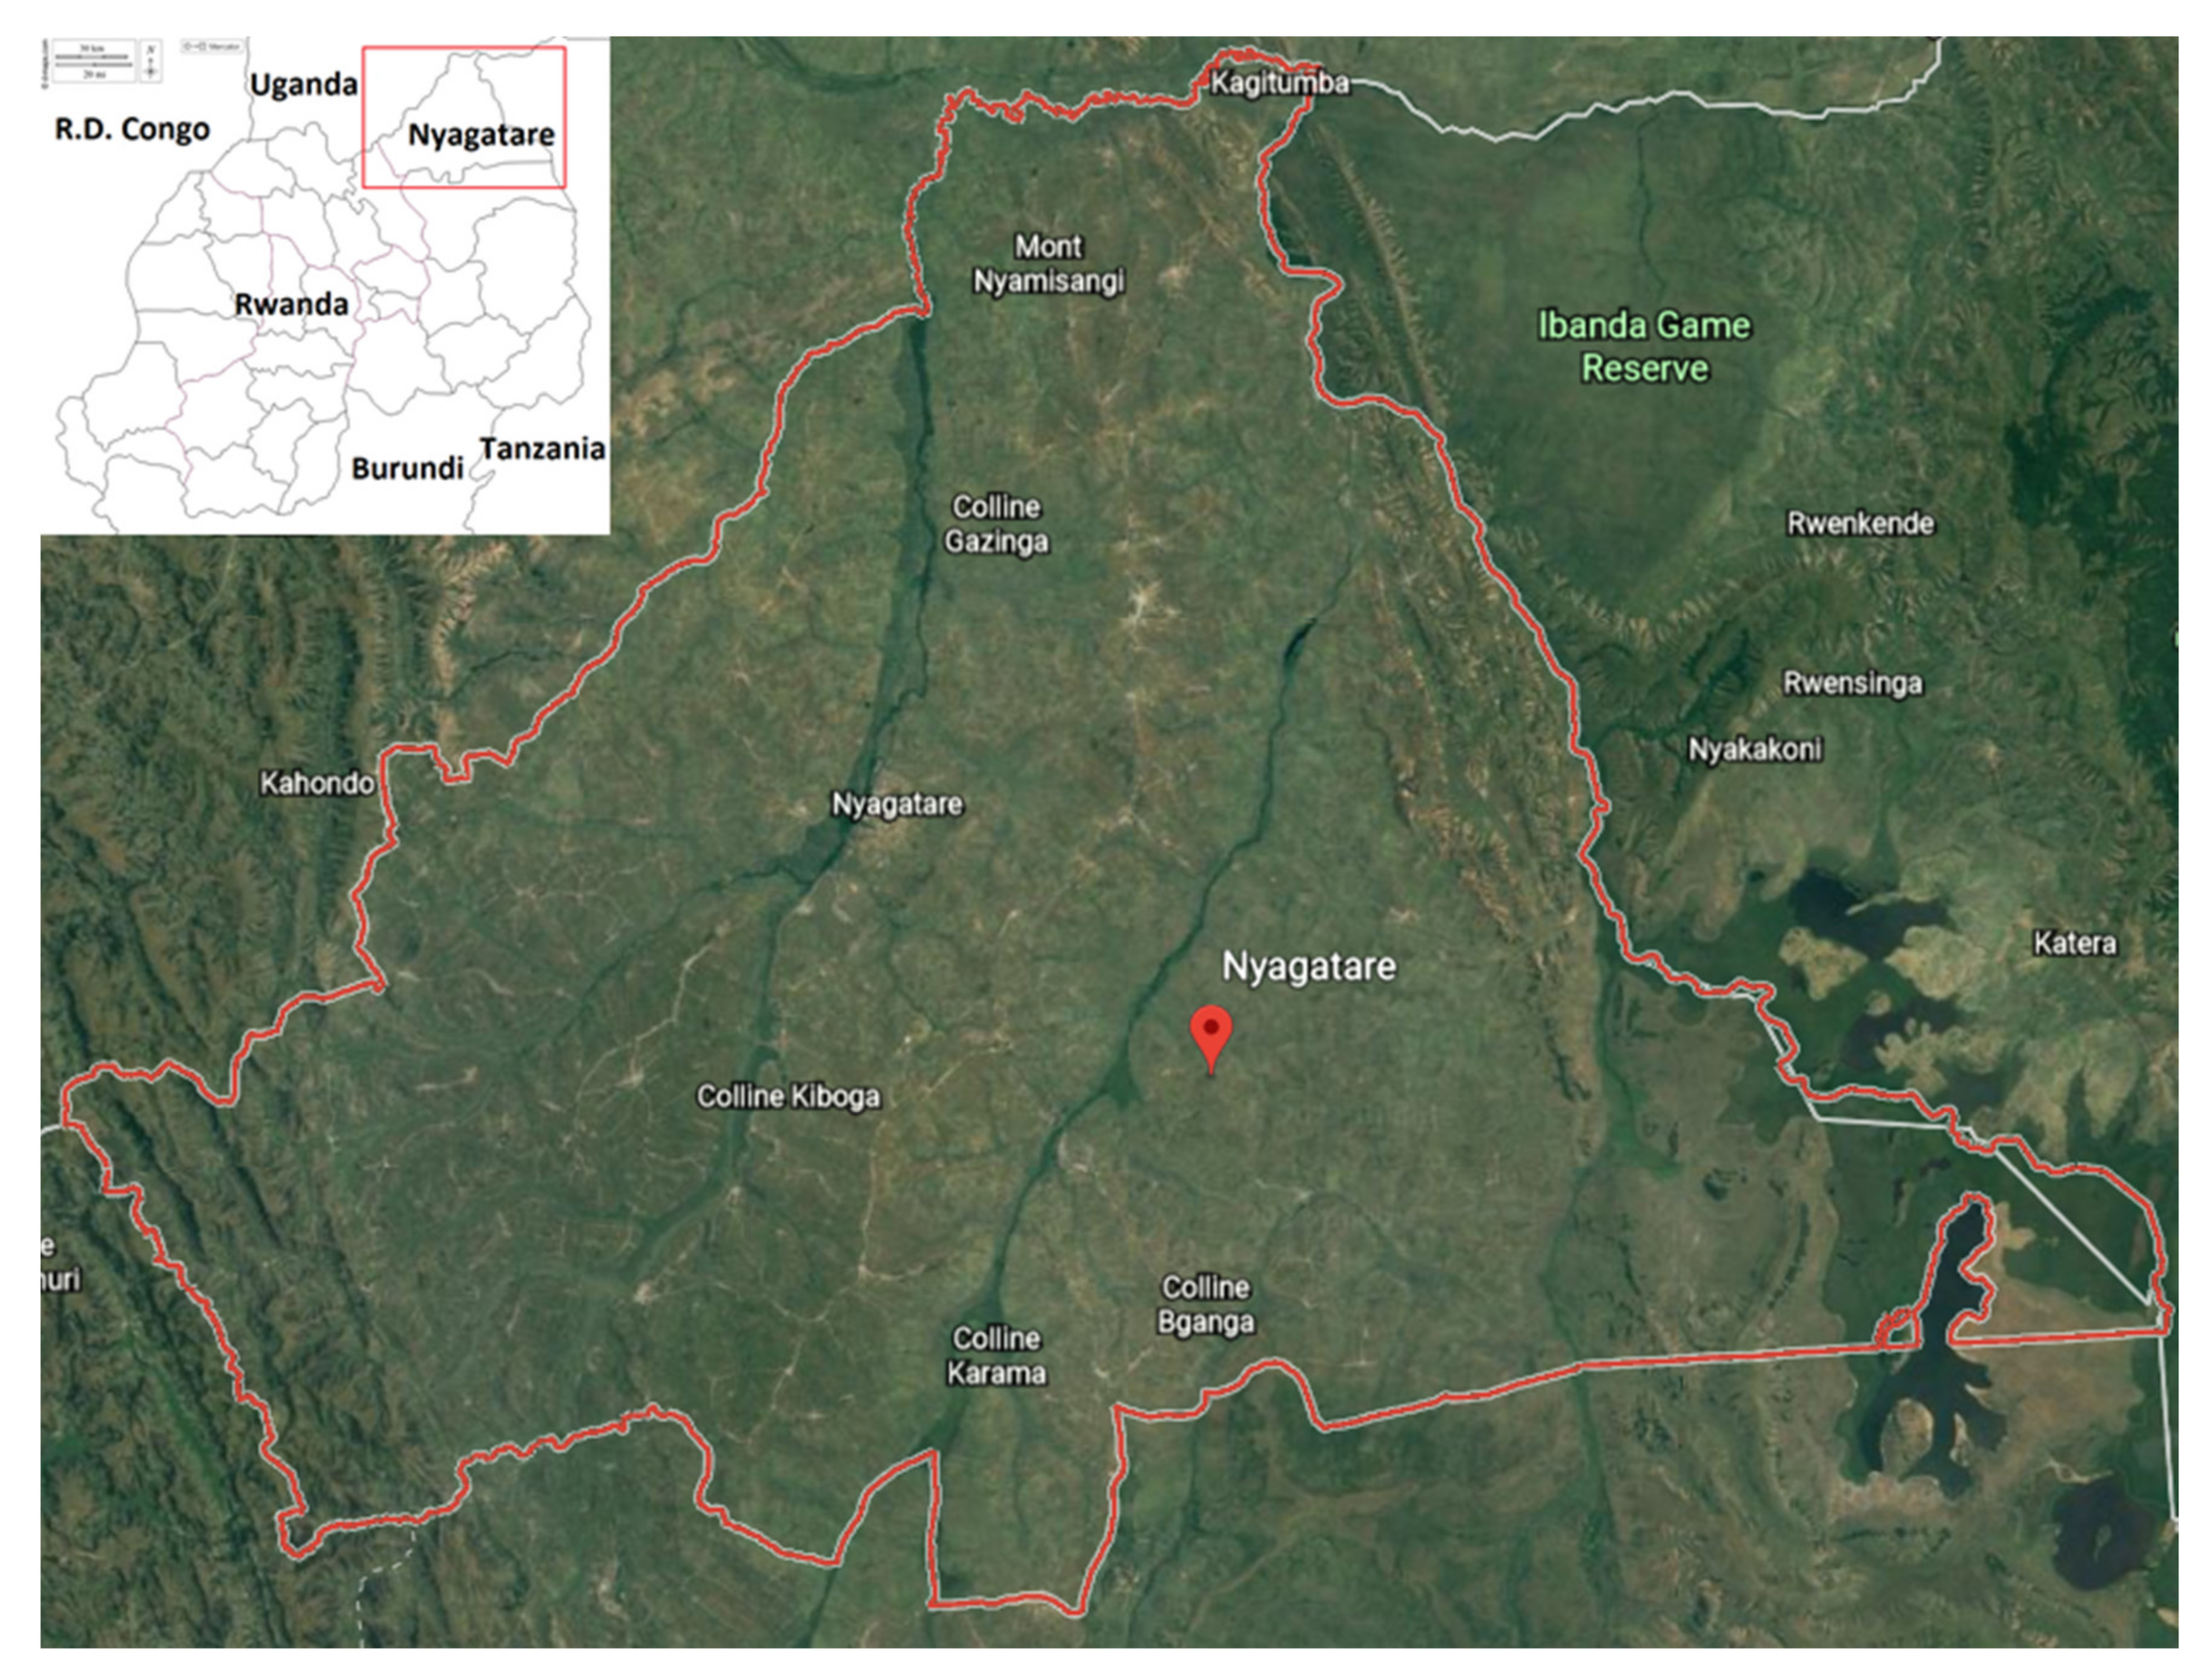
2.1. Nyagatare District
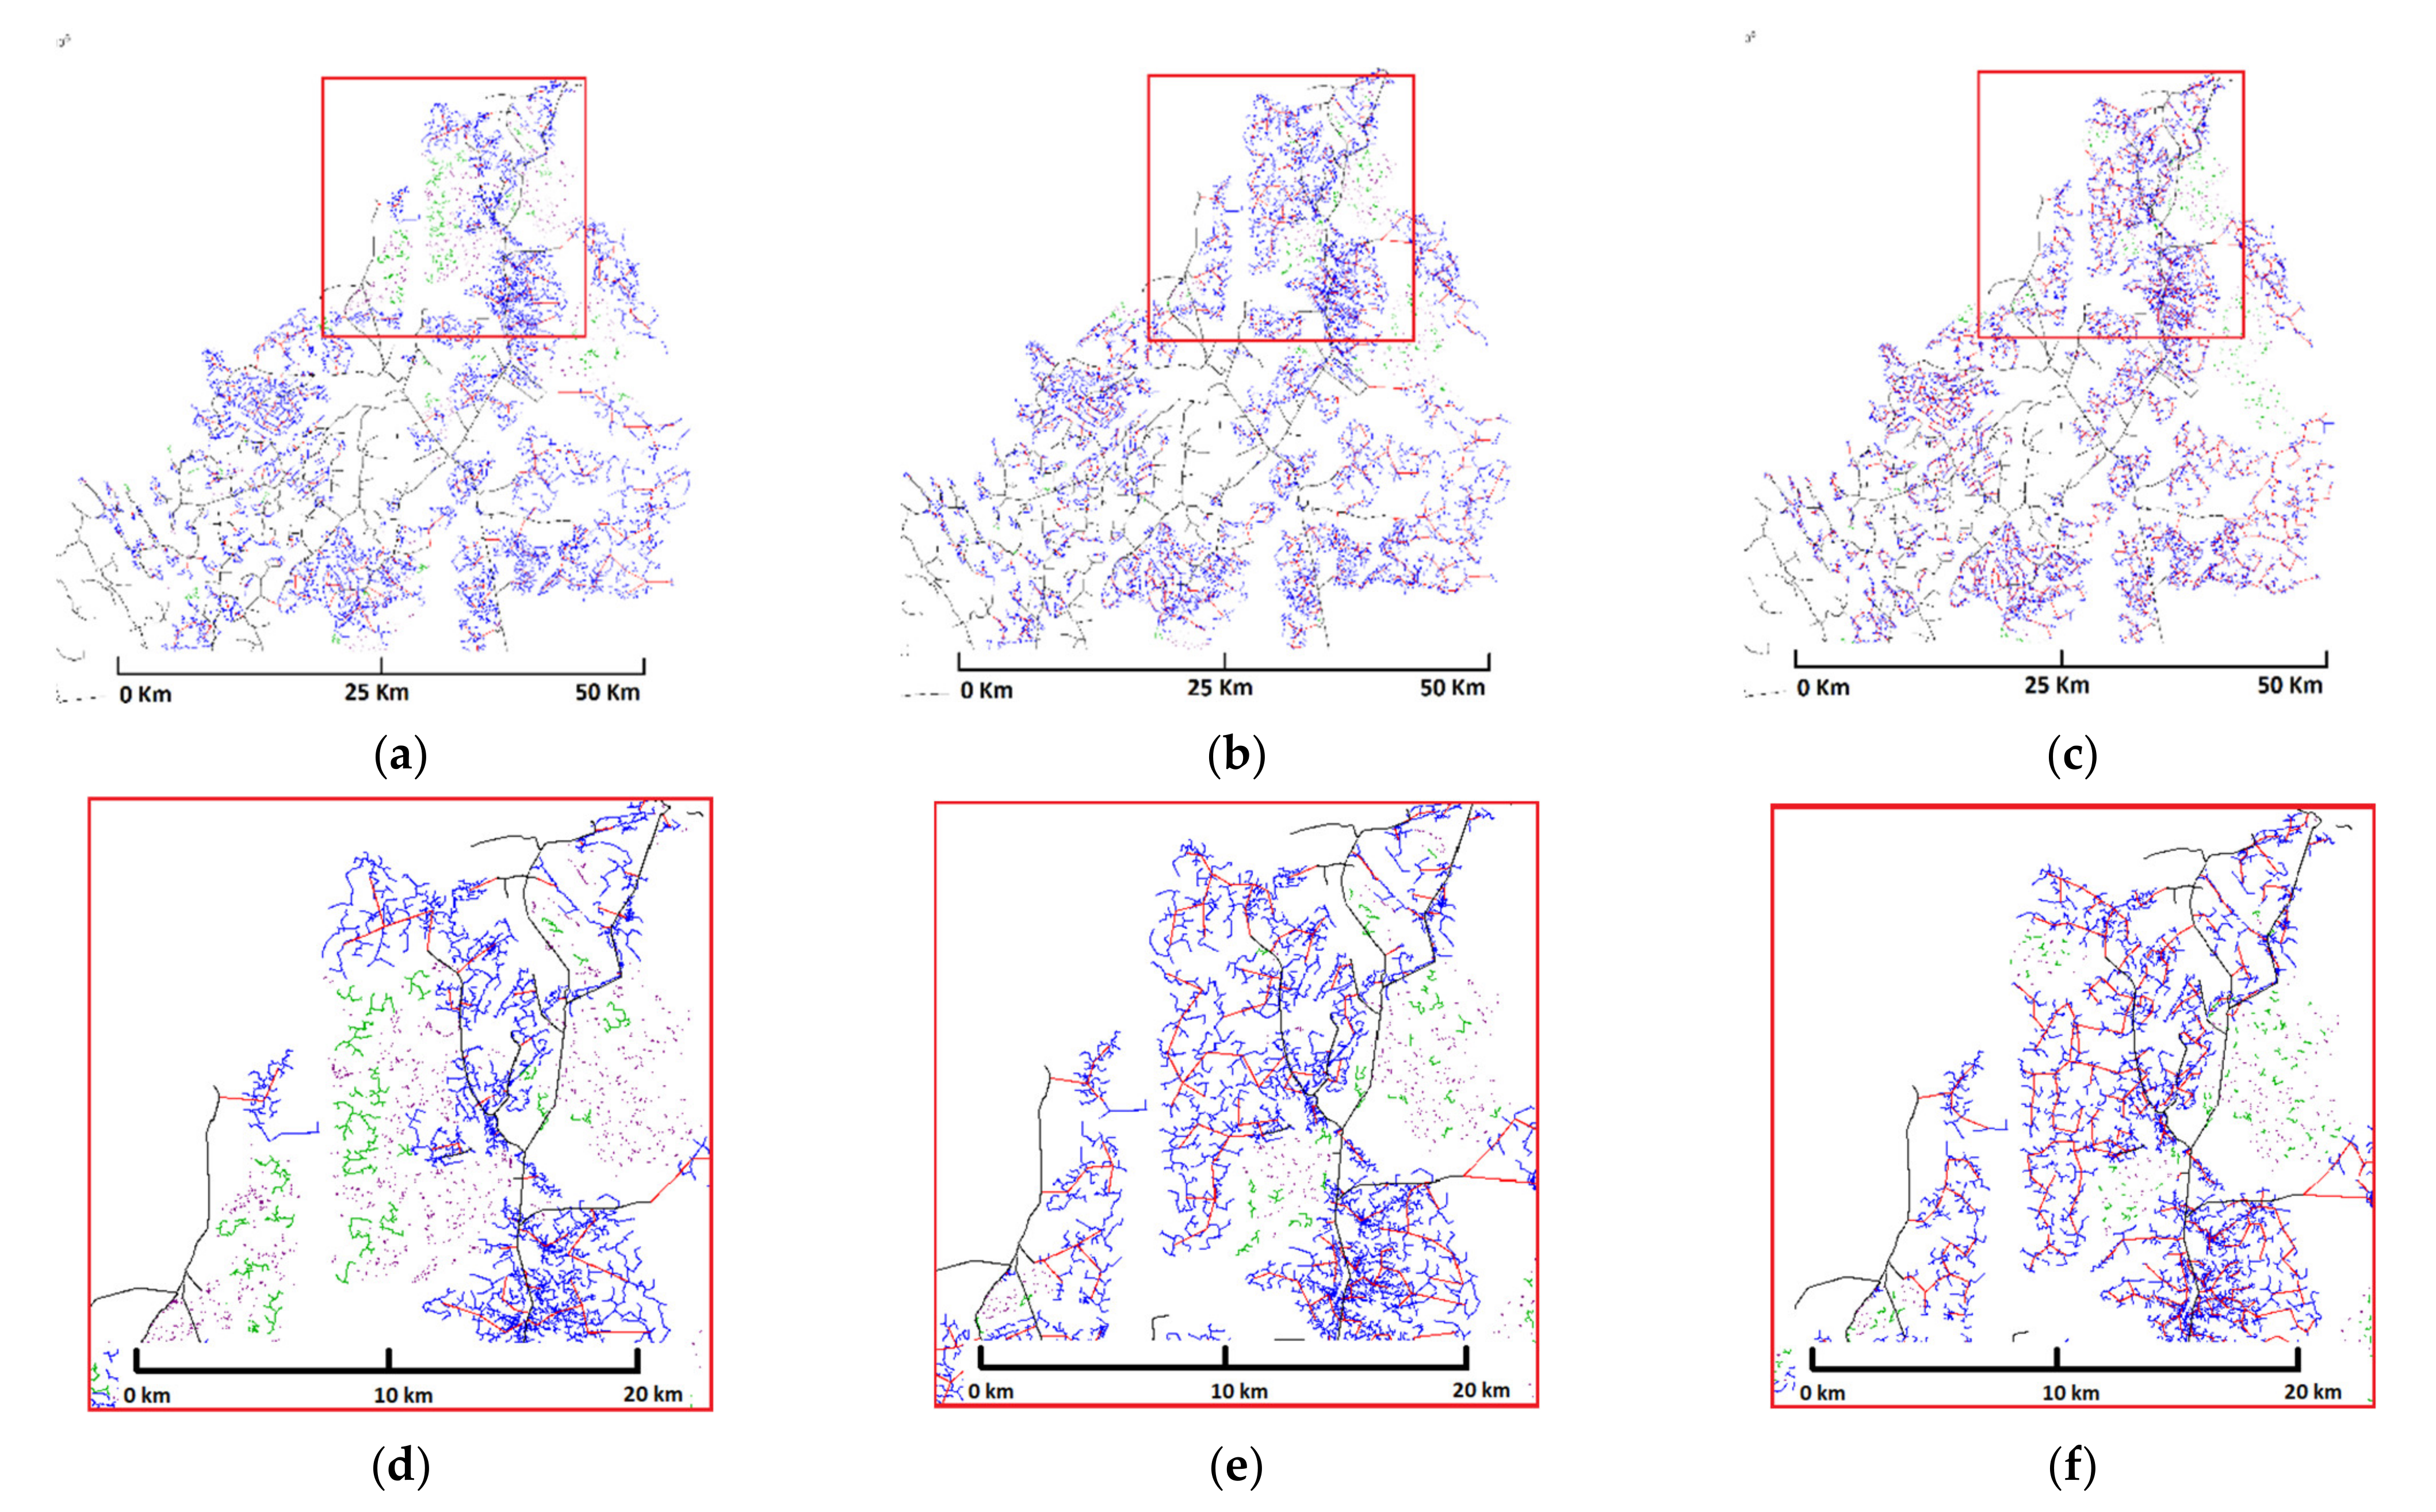
2.2. Scenarios
- Basic Scenario—electricity supplies the basic services in every household in Nyagatare District.
- Complete Scenario—in addition to covering basic services, the entire daily cooking load is carried out with electricity in every household in Nyagatare District.
- Stacking Scenario—in addition to covering basic services, half the daily cooking load is carried out using energy efficient electric appliances and the other half with other cookstoves in every household in Nyagatare District.
2.3. Electrification Planning
- Cost of energy from the central grid: 0.9 USD/kWh
- Reliability of the central grid: 100%
- Catalogue of components and network standards: equal for grid extension and grid-compatible microgrids: National
- Catalogue of components for off-grid generation: International
- Discount rate: 8%
- Smallest microgrid must have at least 10 customers or 5 kW
- Administrative charges per grid-connected customer: 9 USD/year
- Administrative charges per microgrid customers: Medium size microgrid (100 customers): 16 USD/year. Large size microgrid: Asymptote at 9 USD/year
- Administrative charges per isolated customers: 60 USD/year
- Average cost of diesel: 1.2 USD/L
- Average cost of labor: 1.6 USD/hour
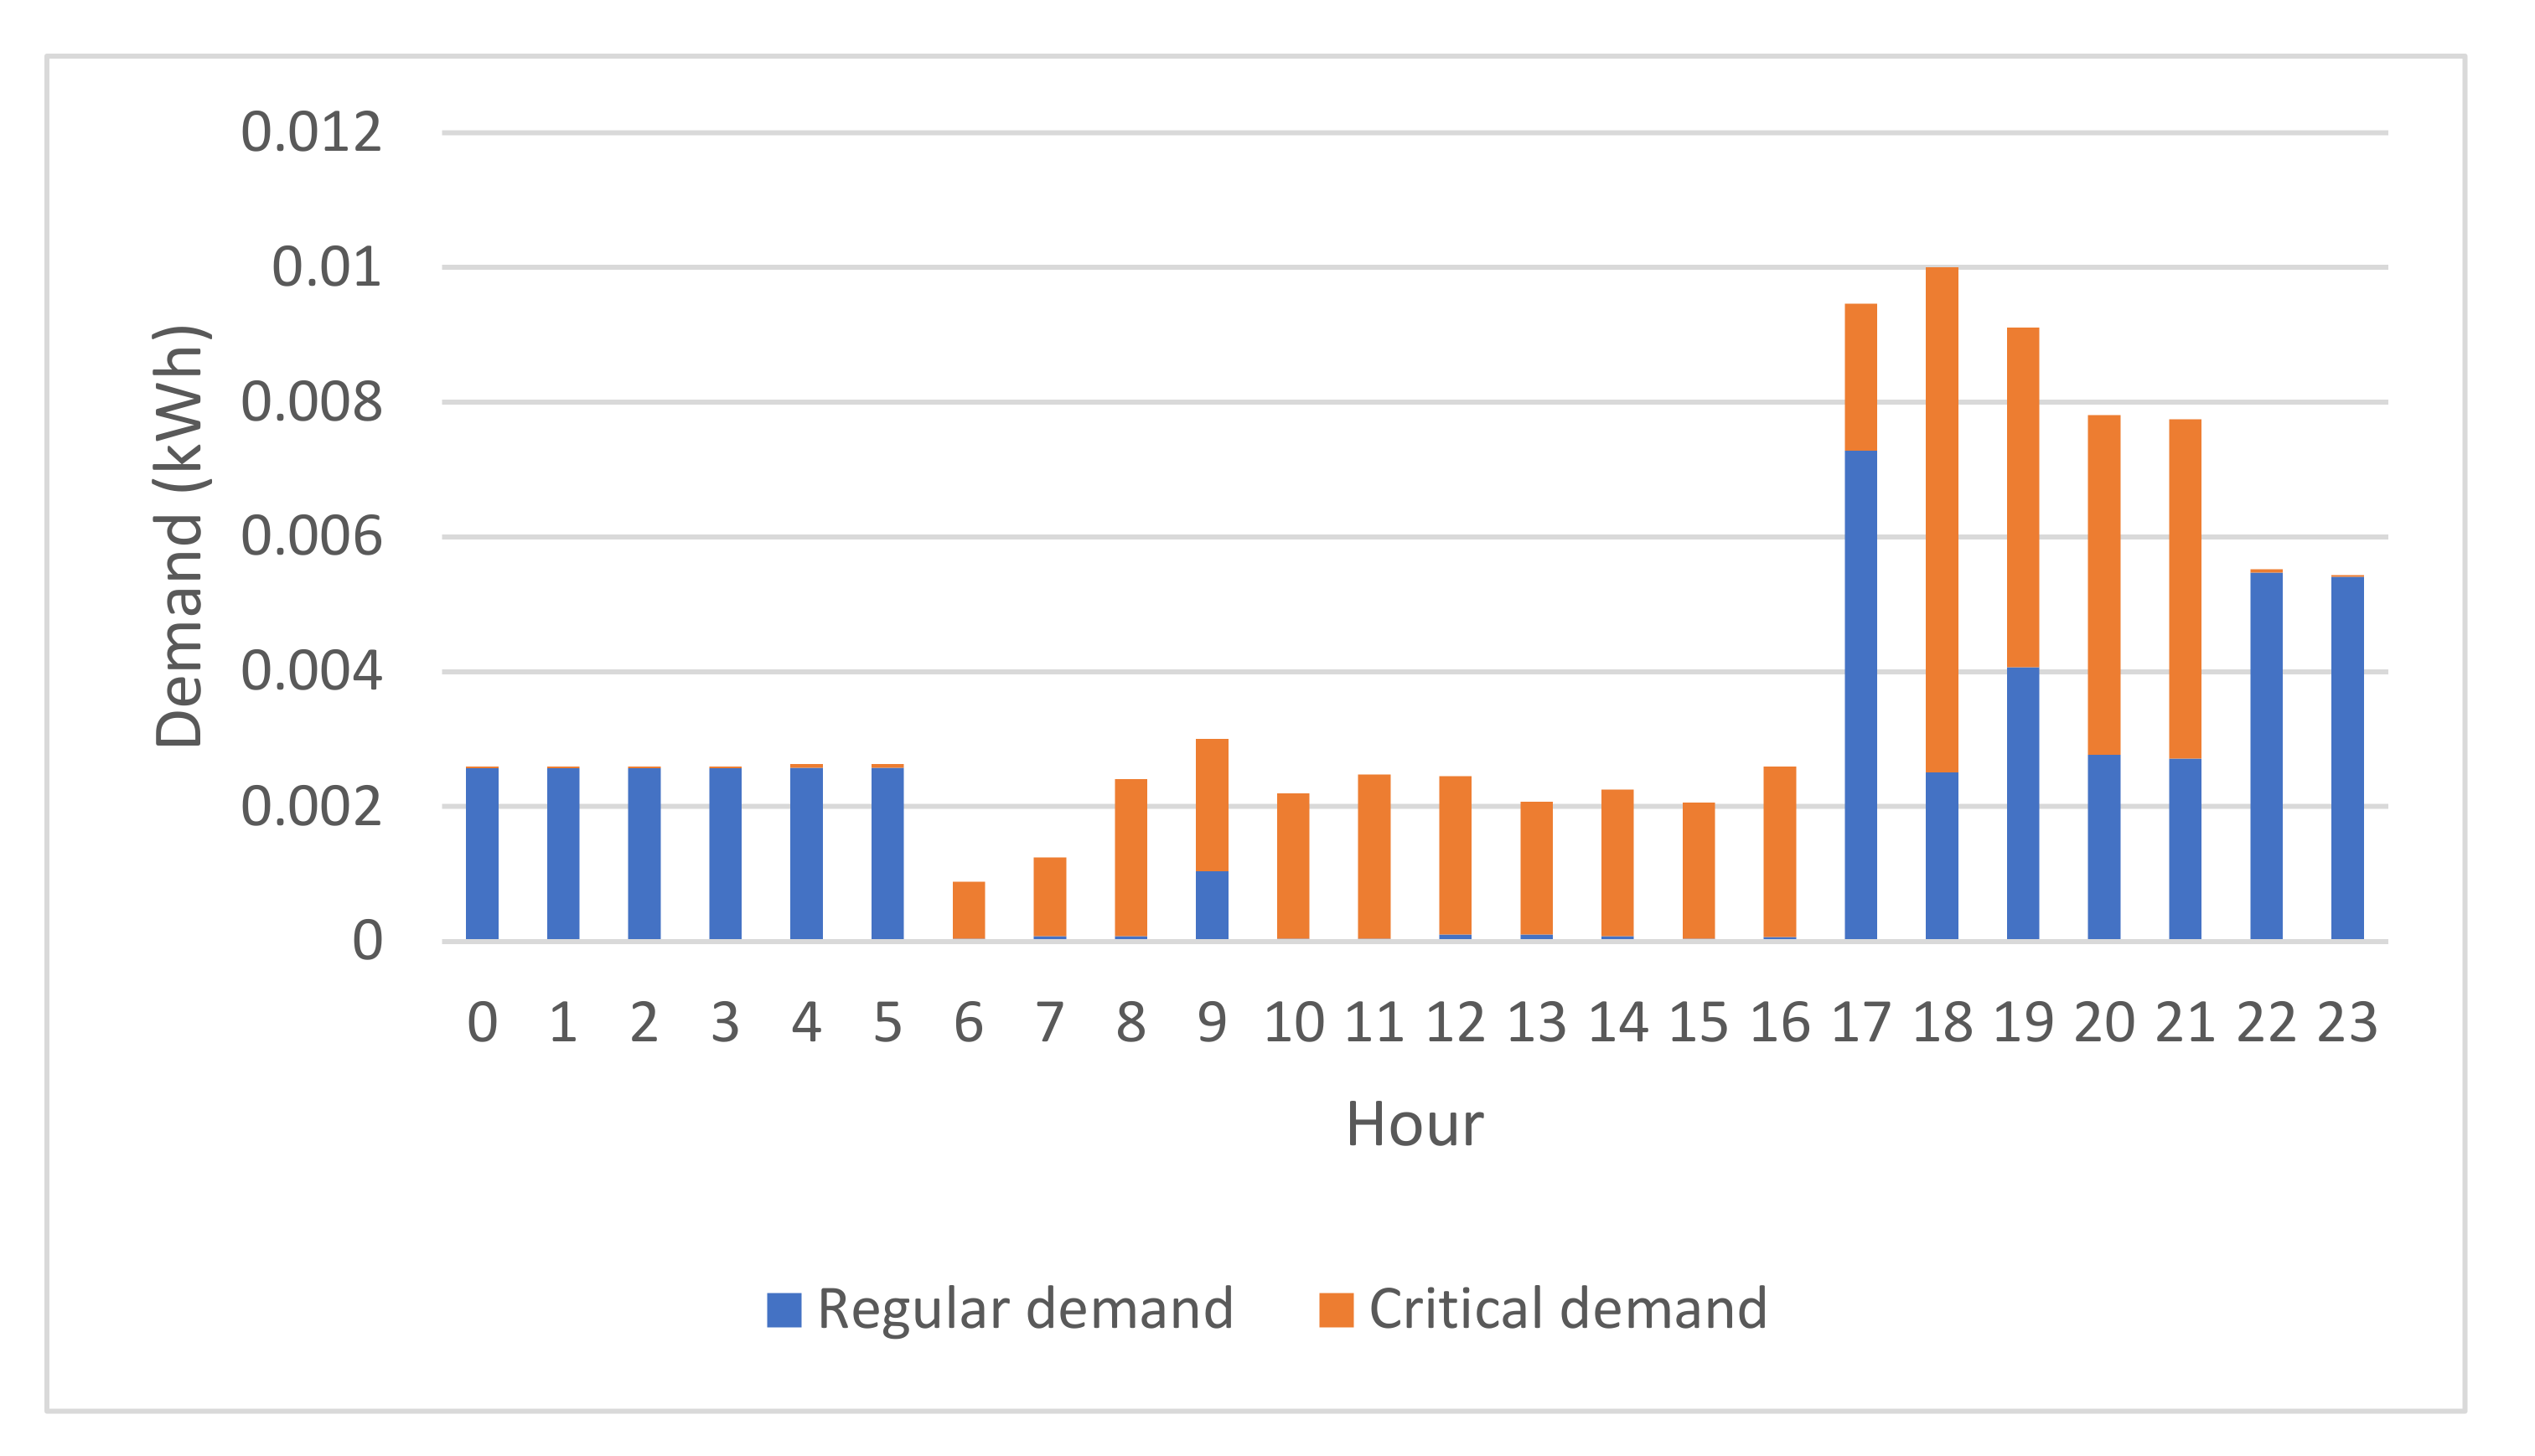
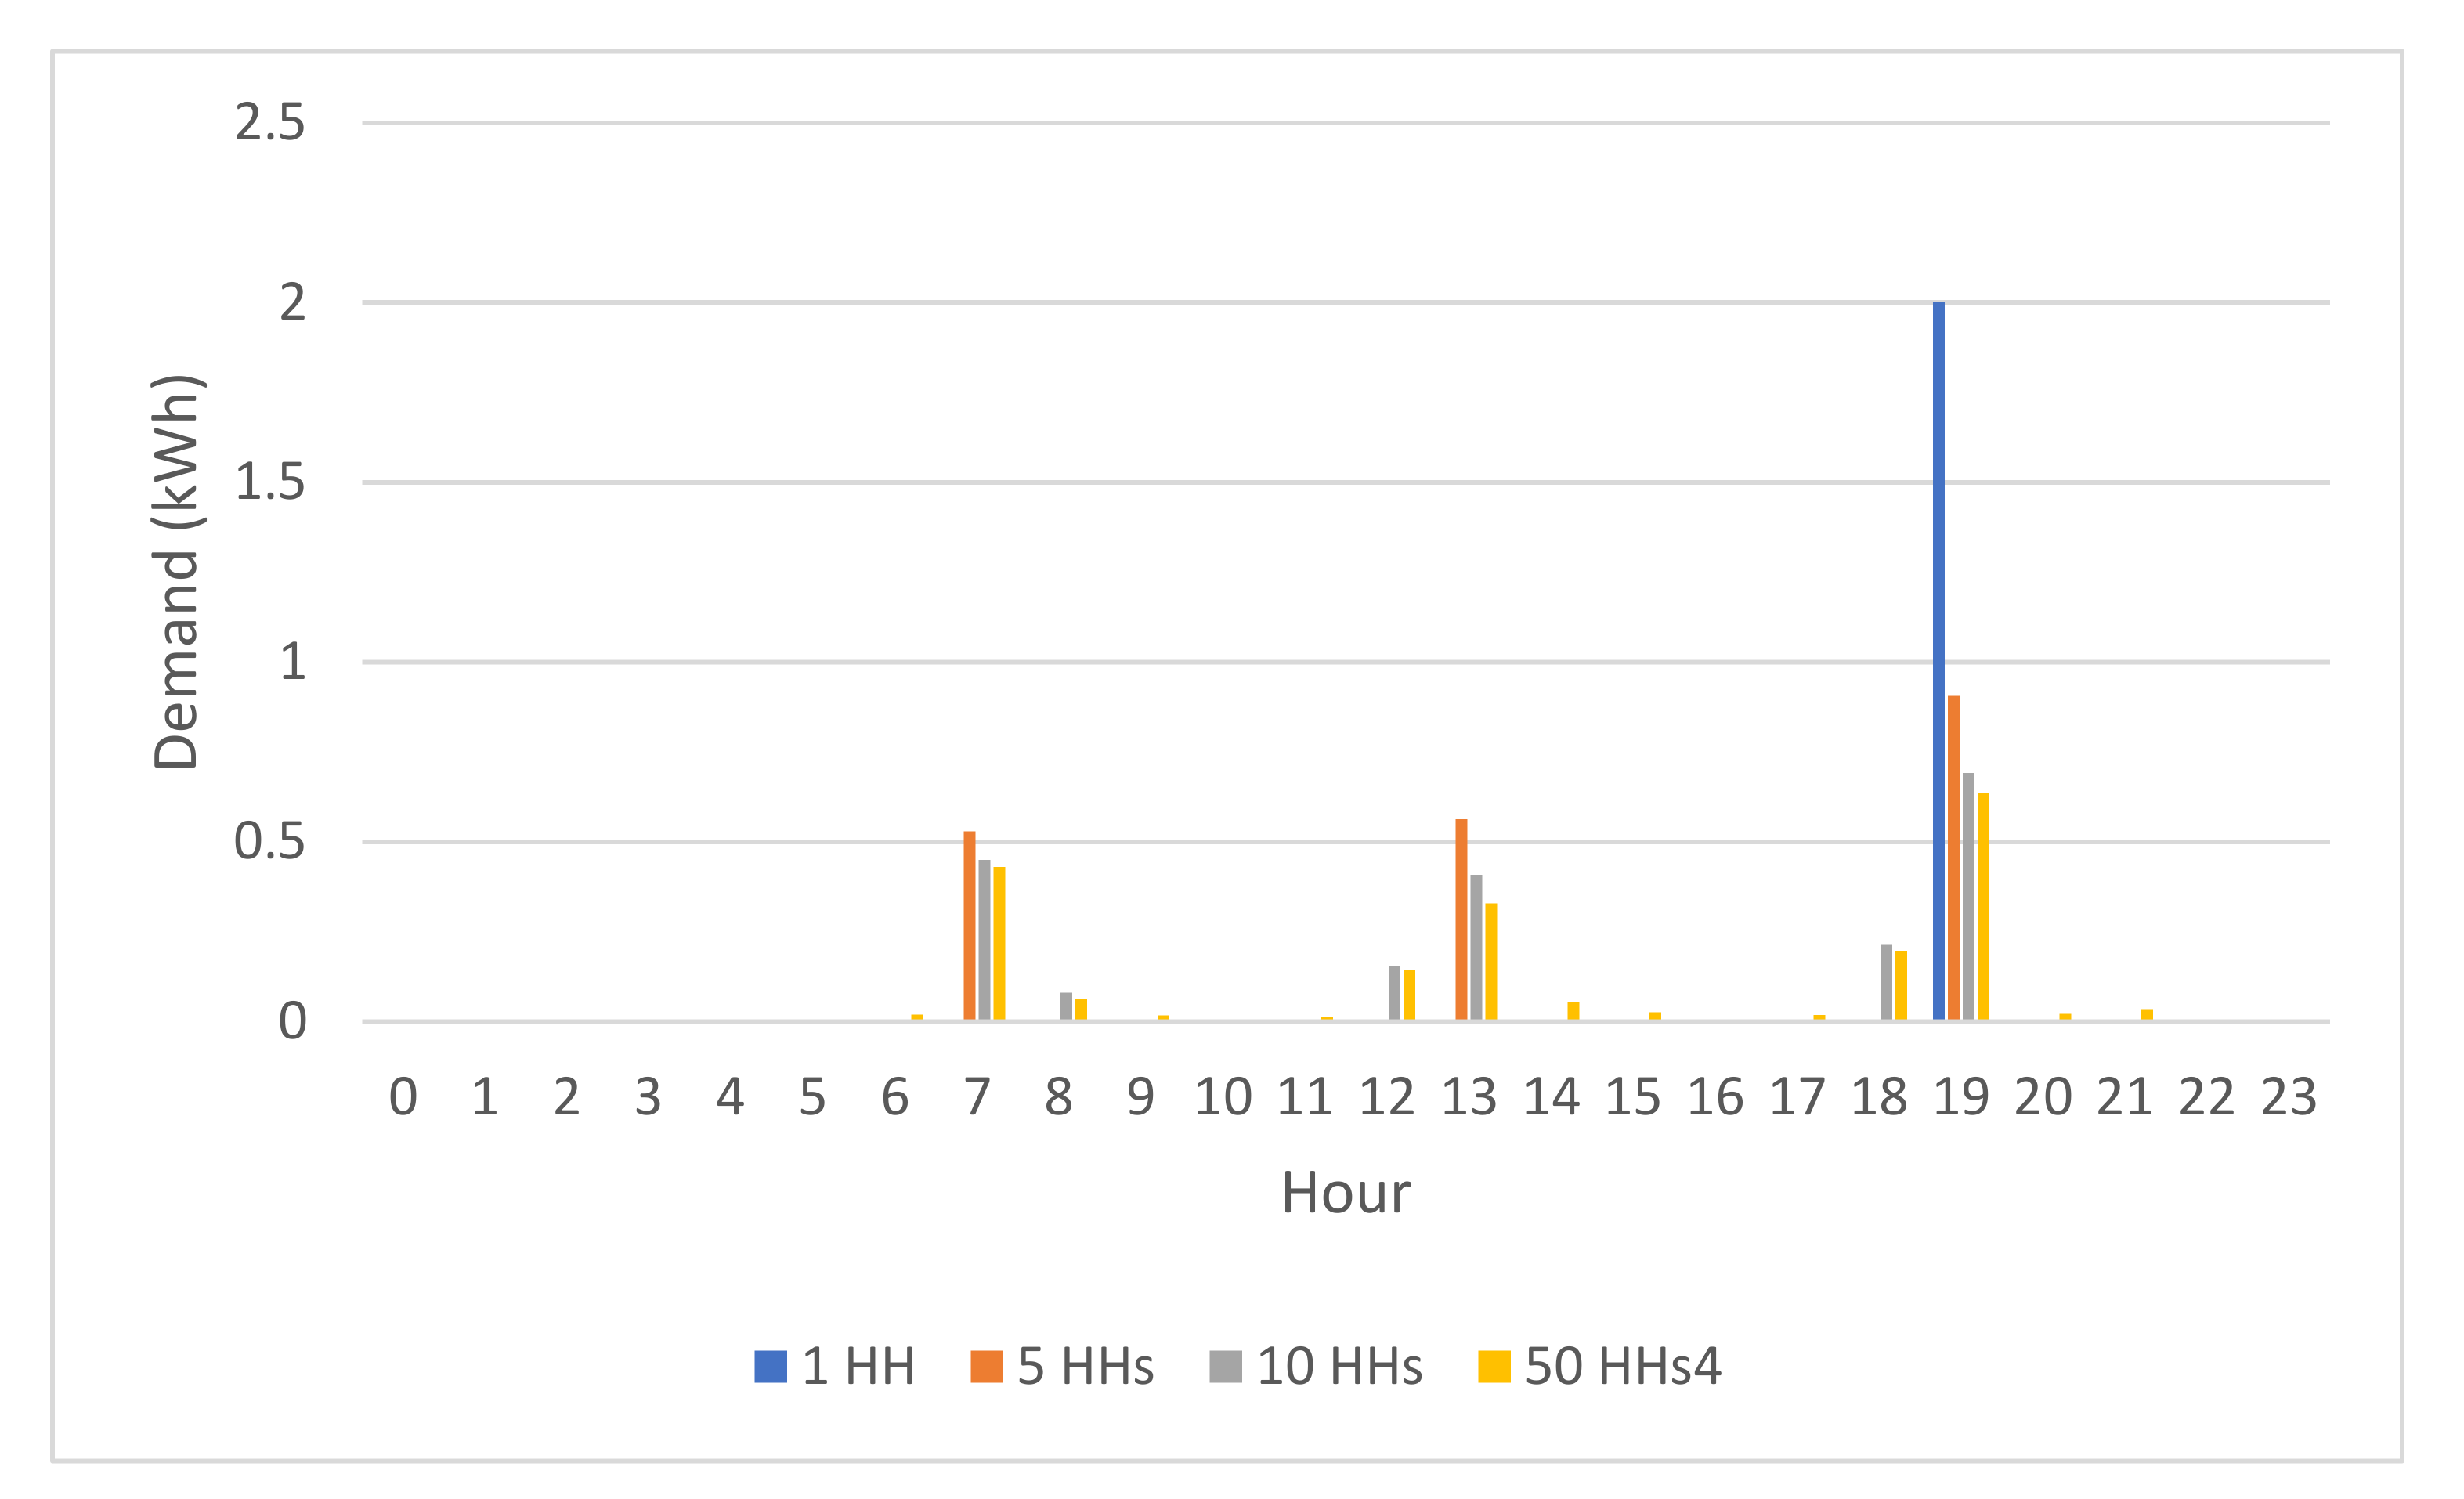
2.4. Household Electricity Demand
2.5. Cooking Alternatives
2.6. Greenhouse Gases Emissions
2.7. Sensitivity Analysis
3. Results and Discussion
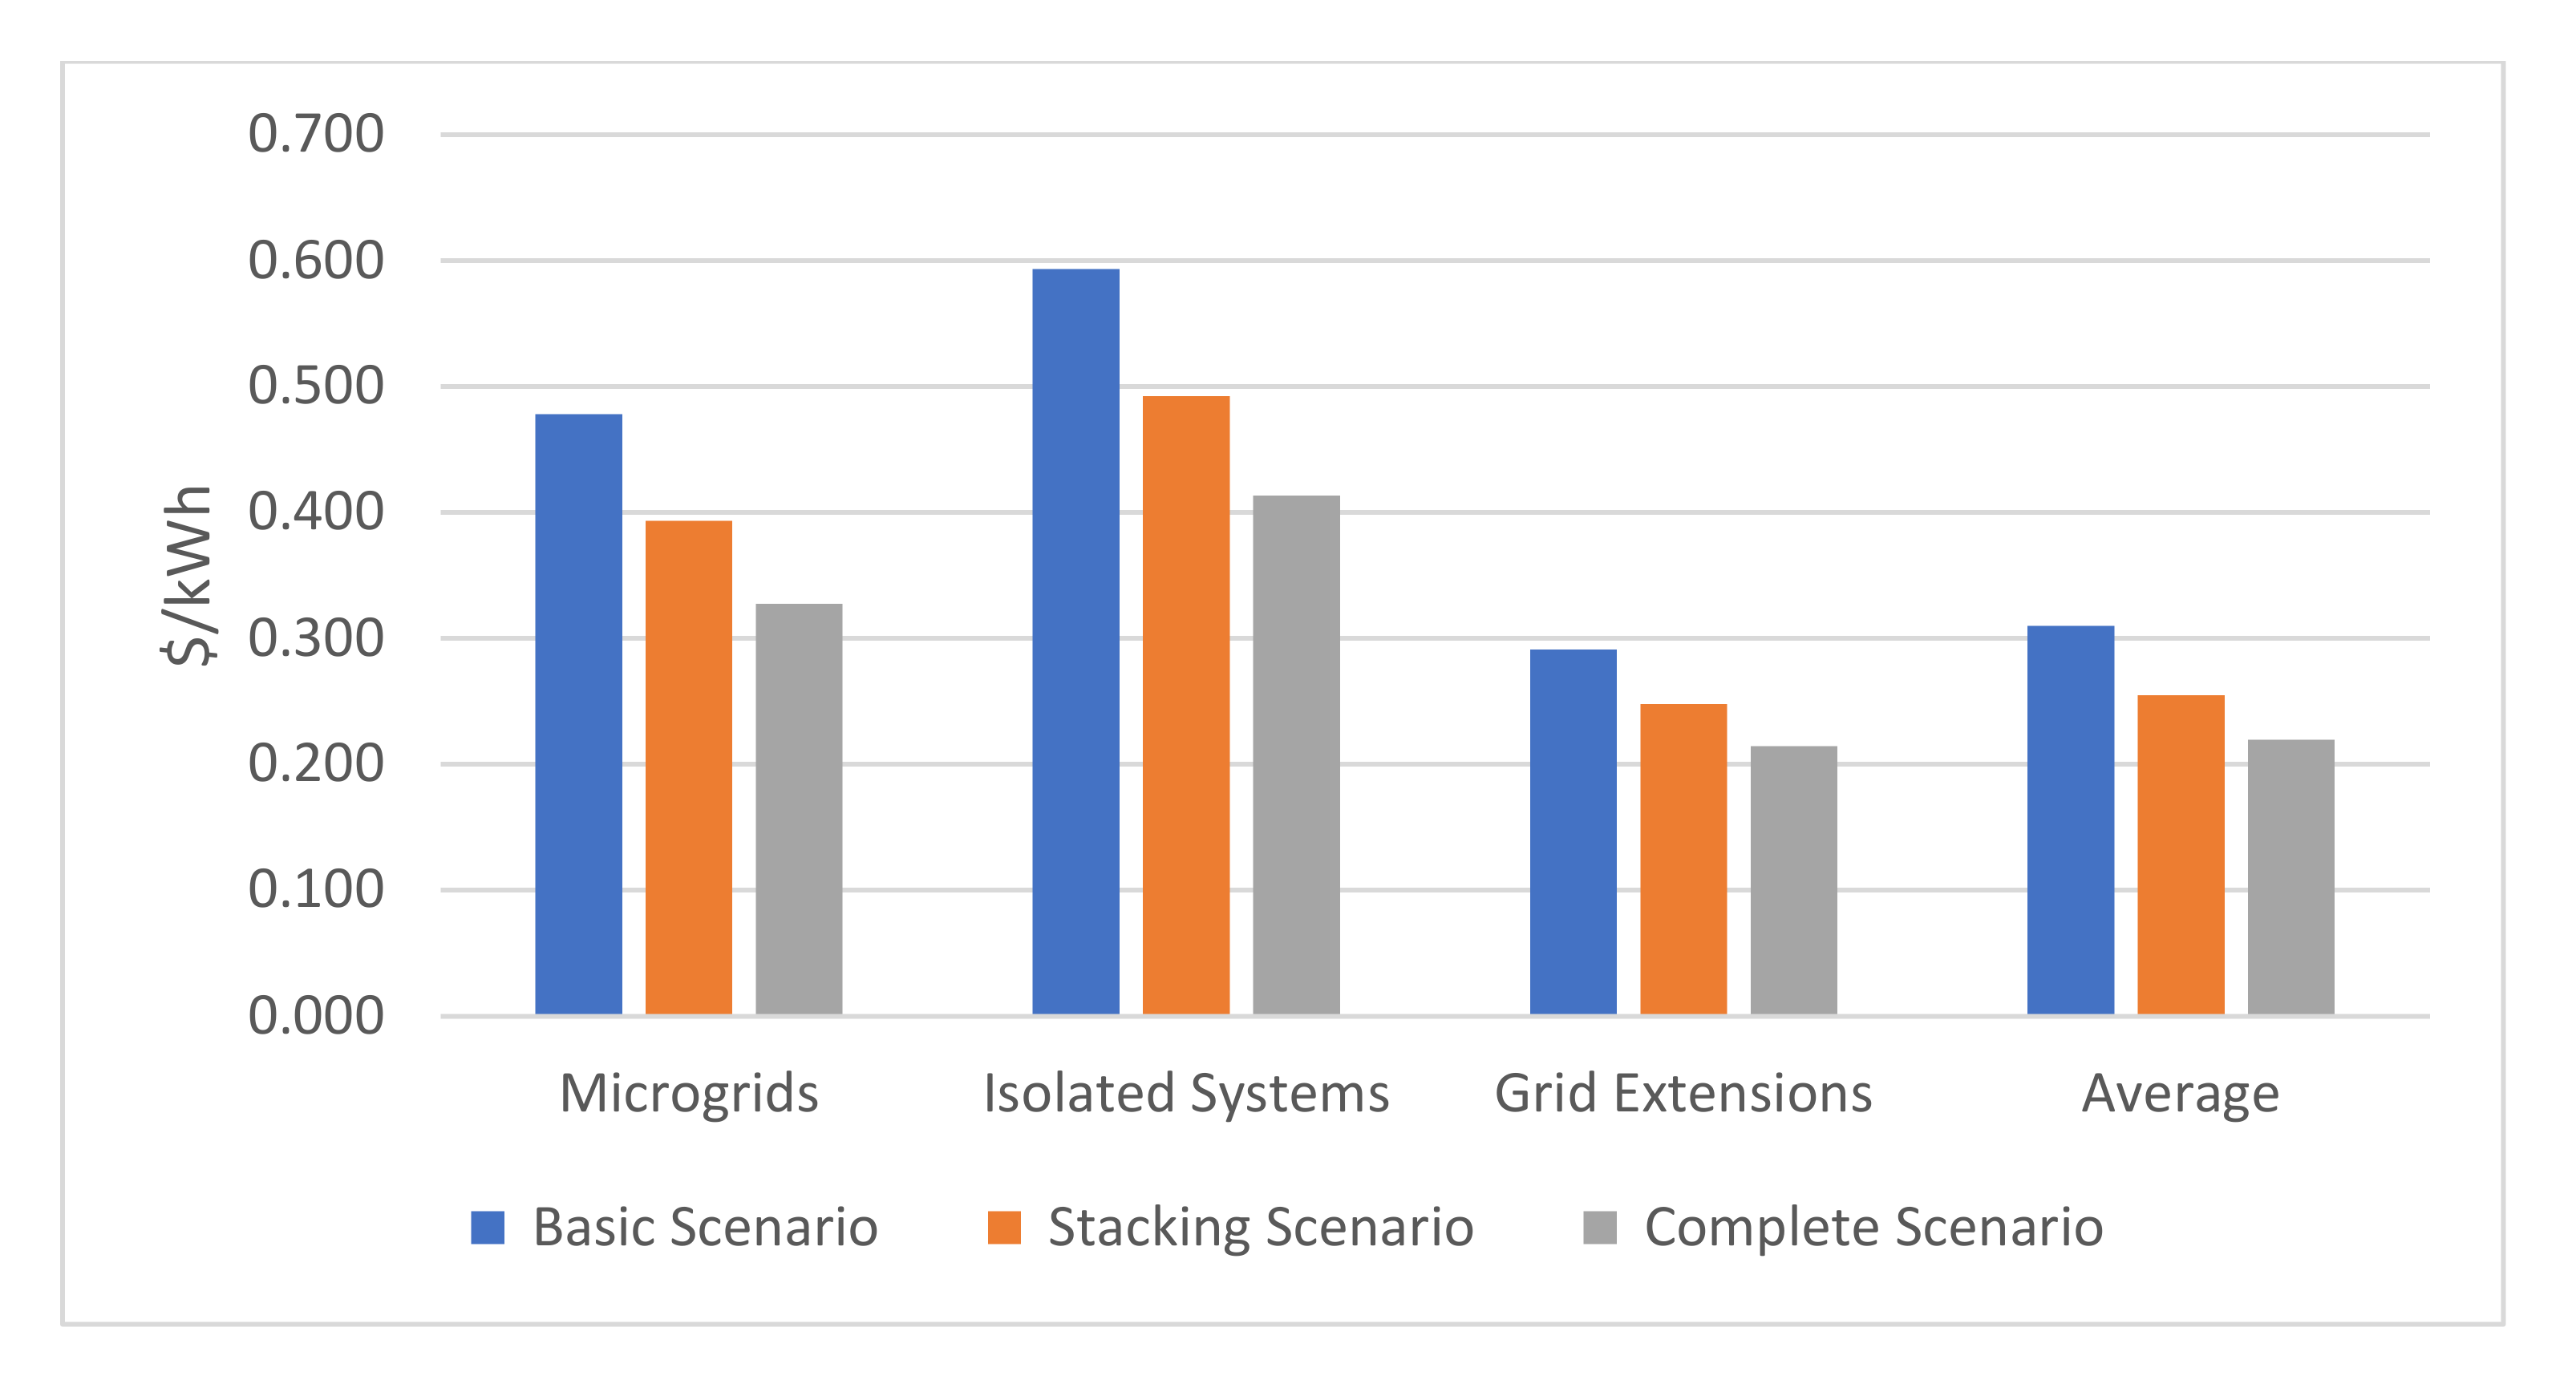
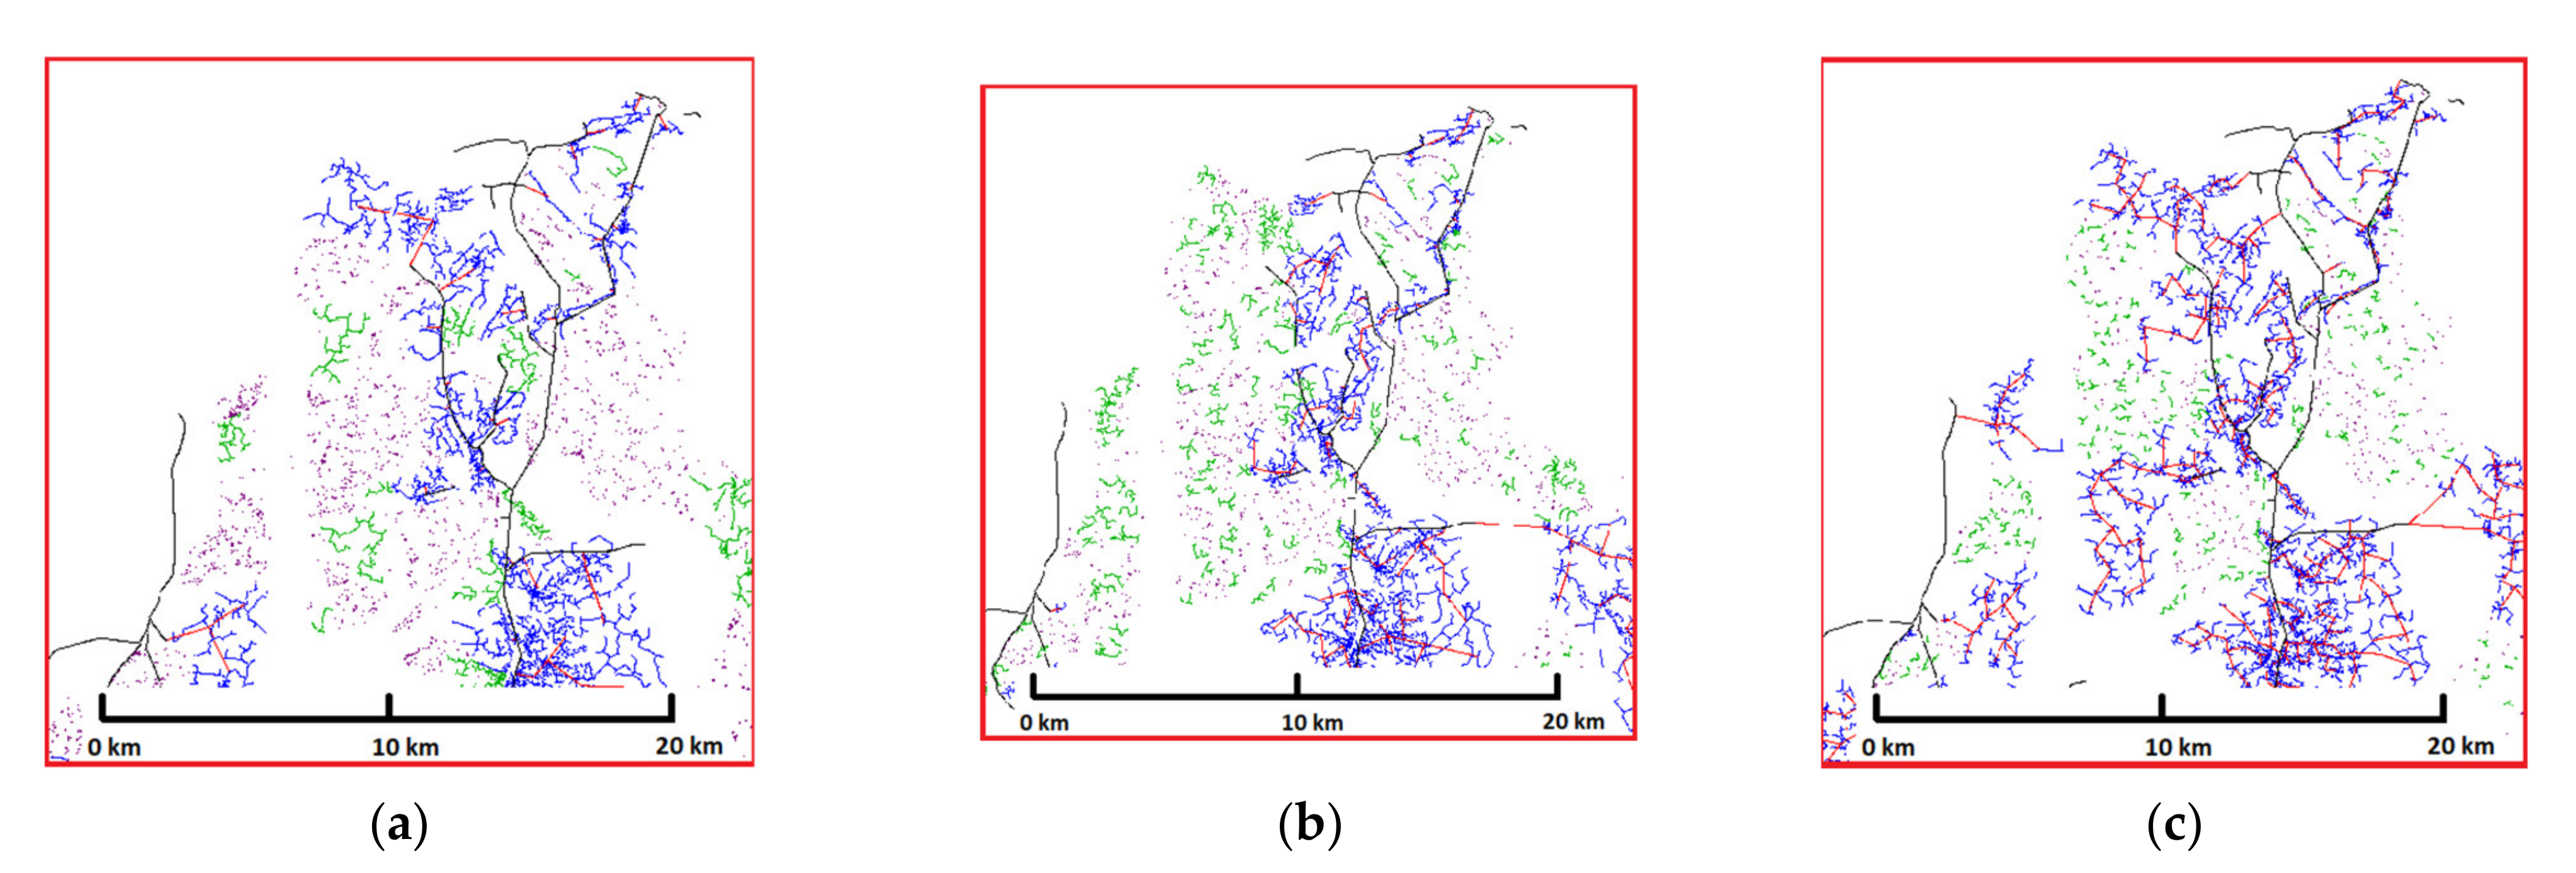
3.1. Fraction of Households by Electrification Mode and Total Cost per kWh
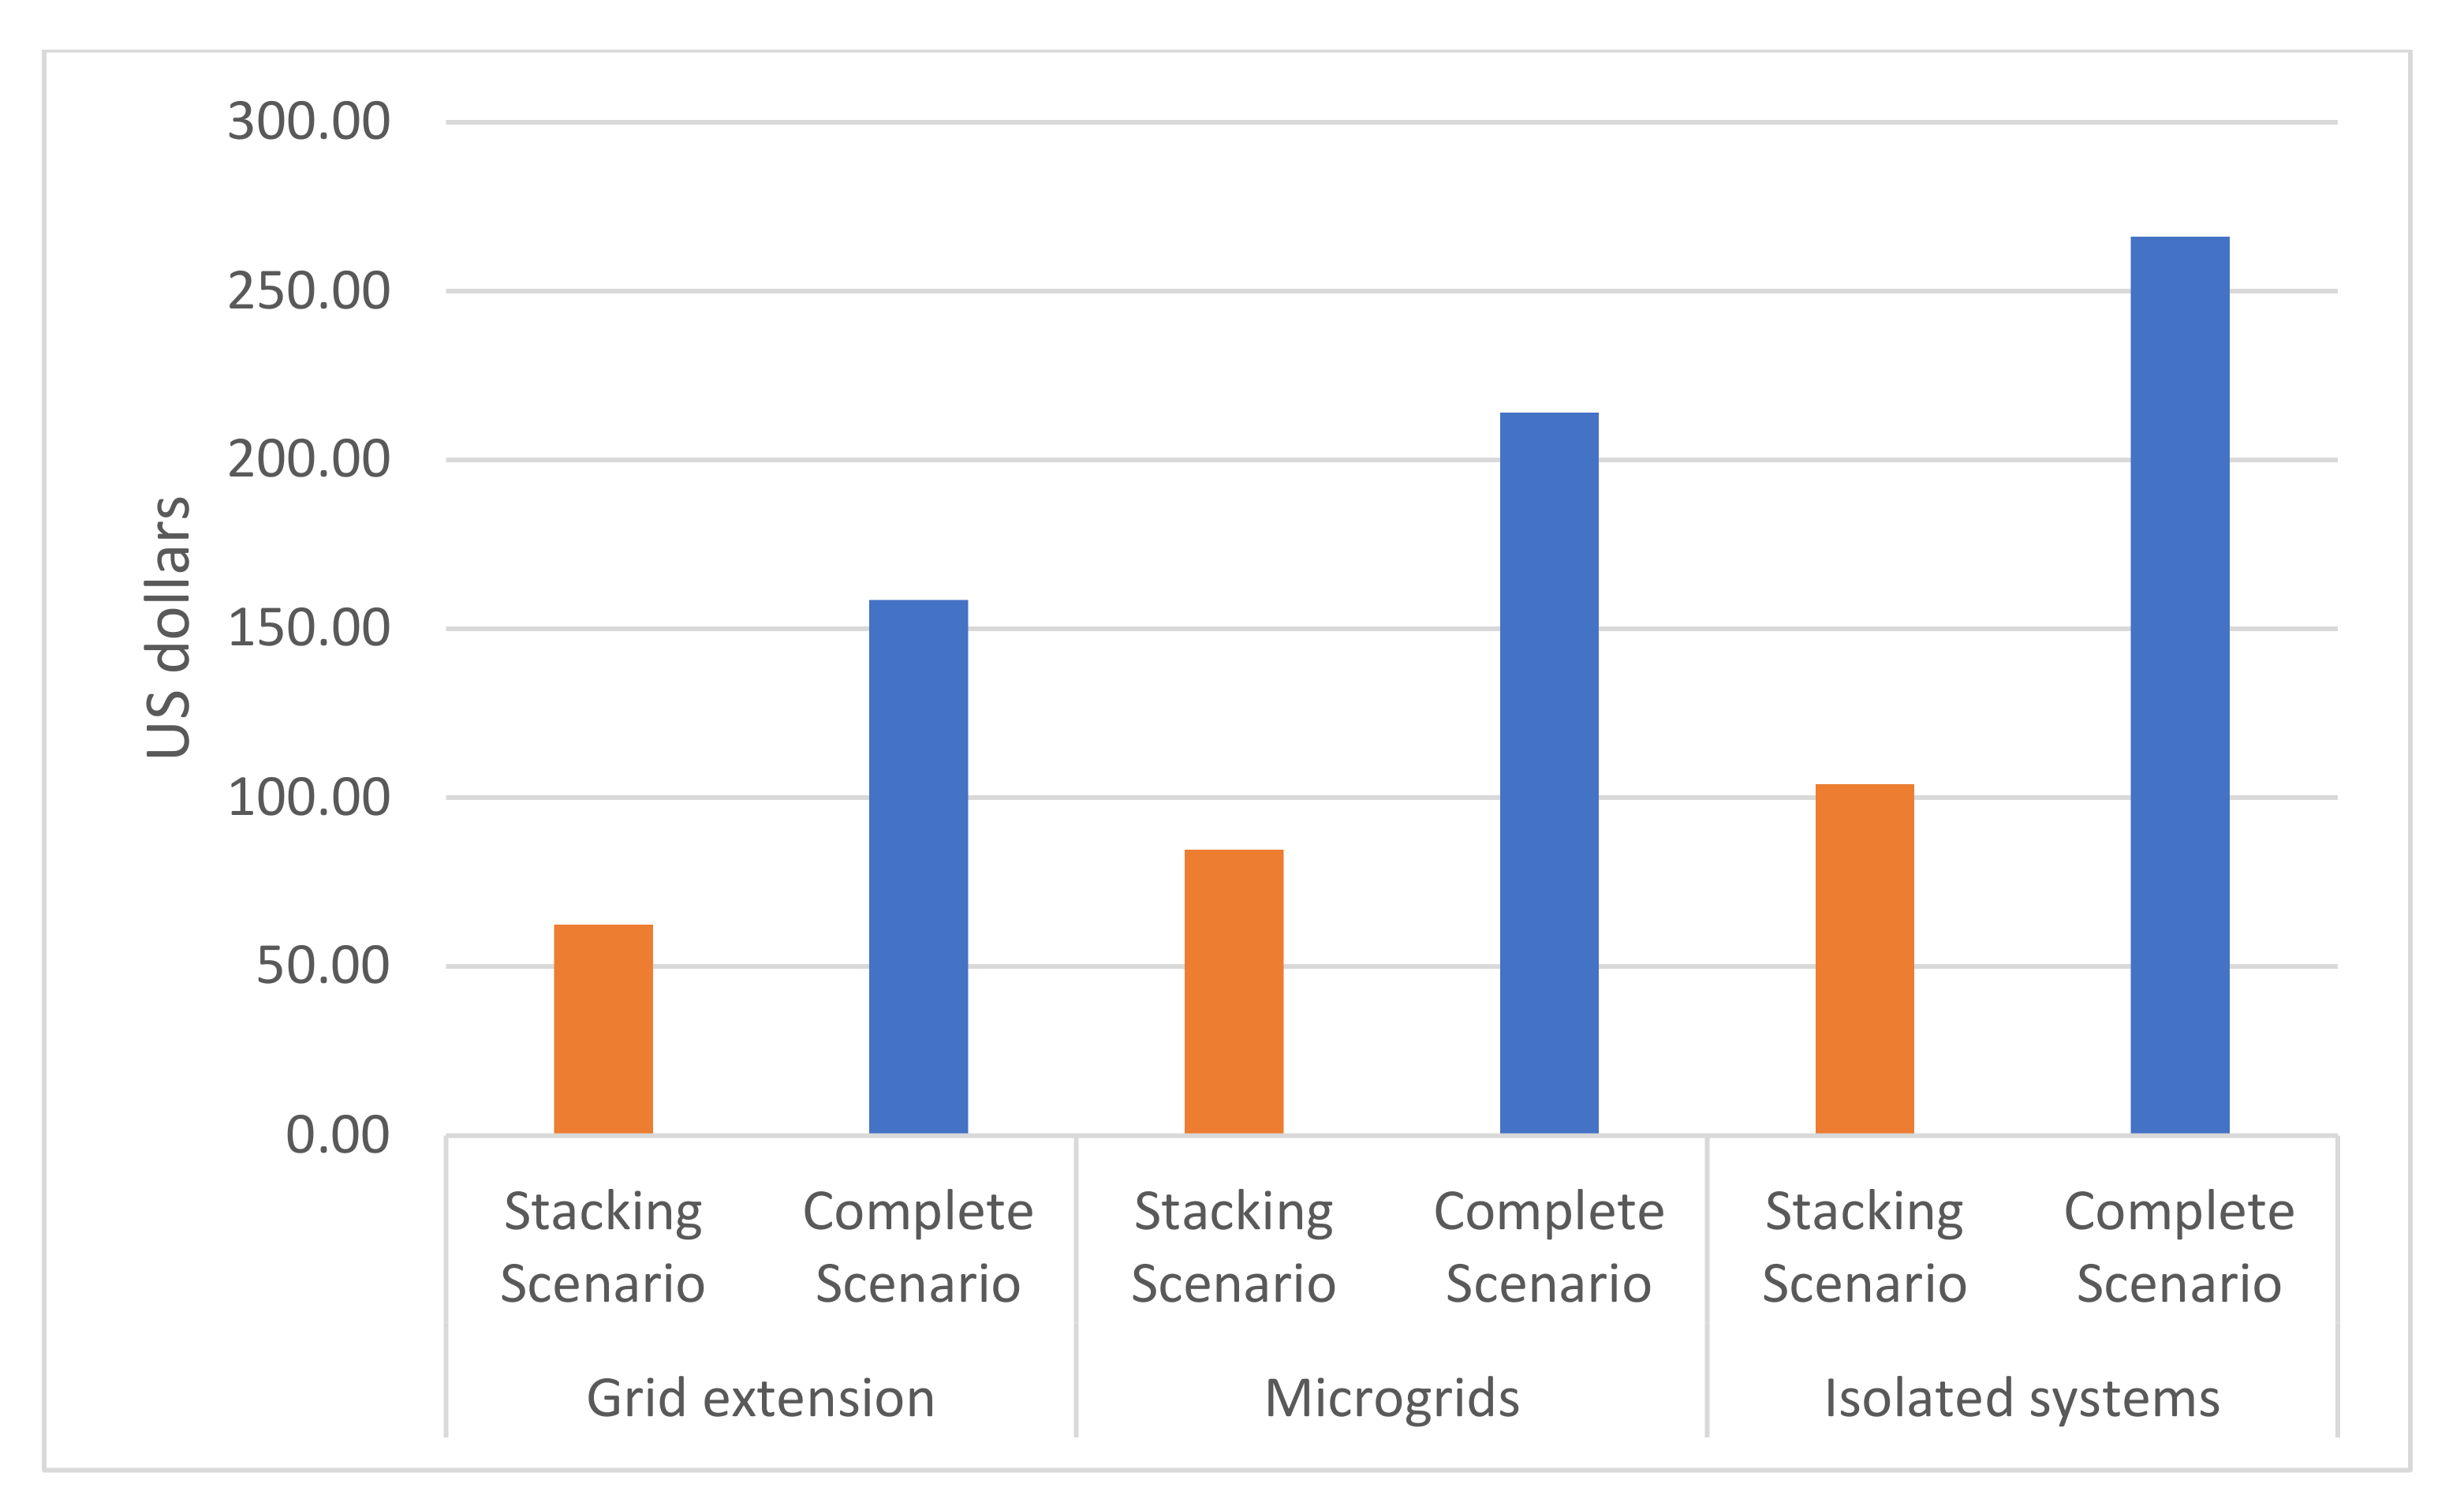
3.2. Household Electricity and Cooking Costs
3.3. Total Cost for Electrification of Nyagatare District
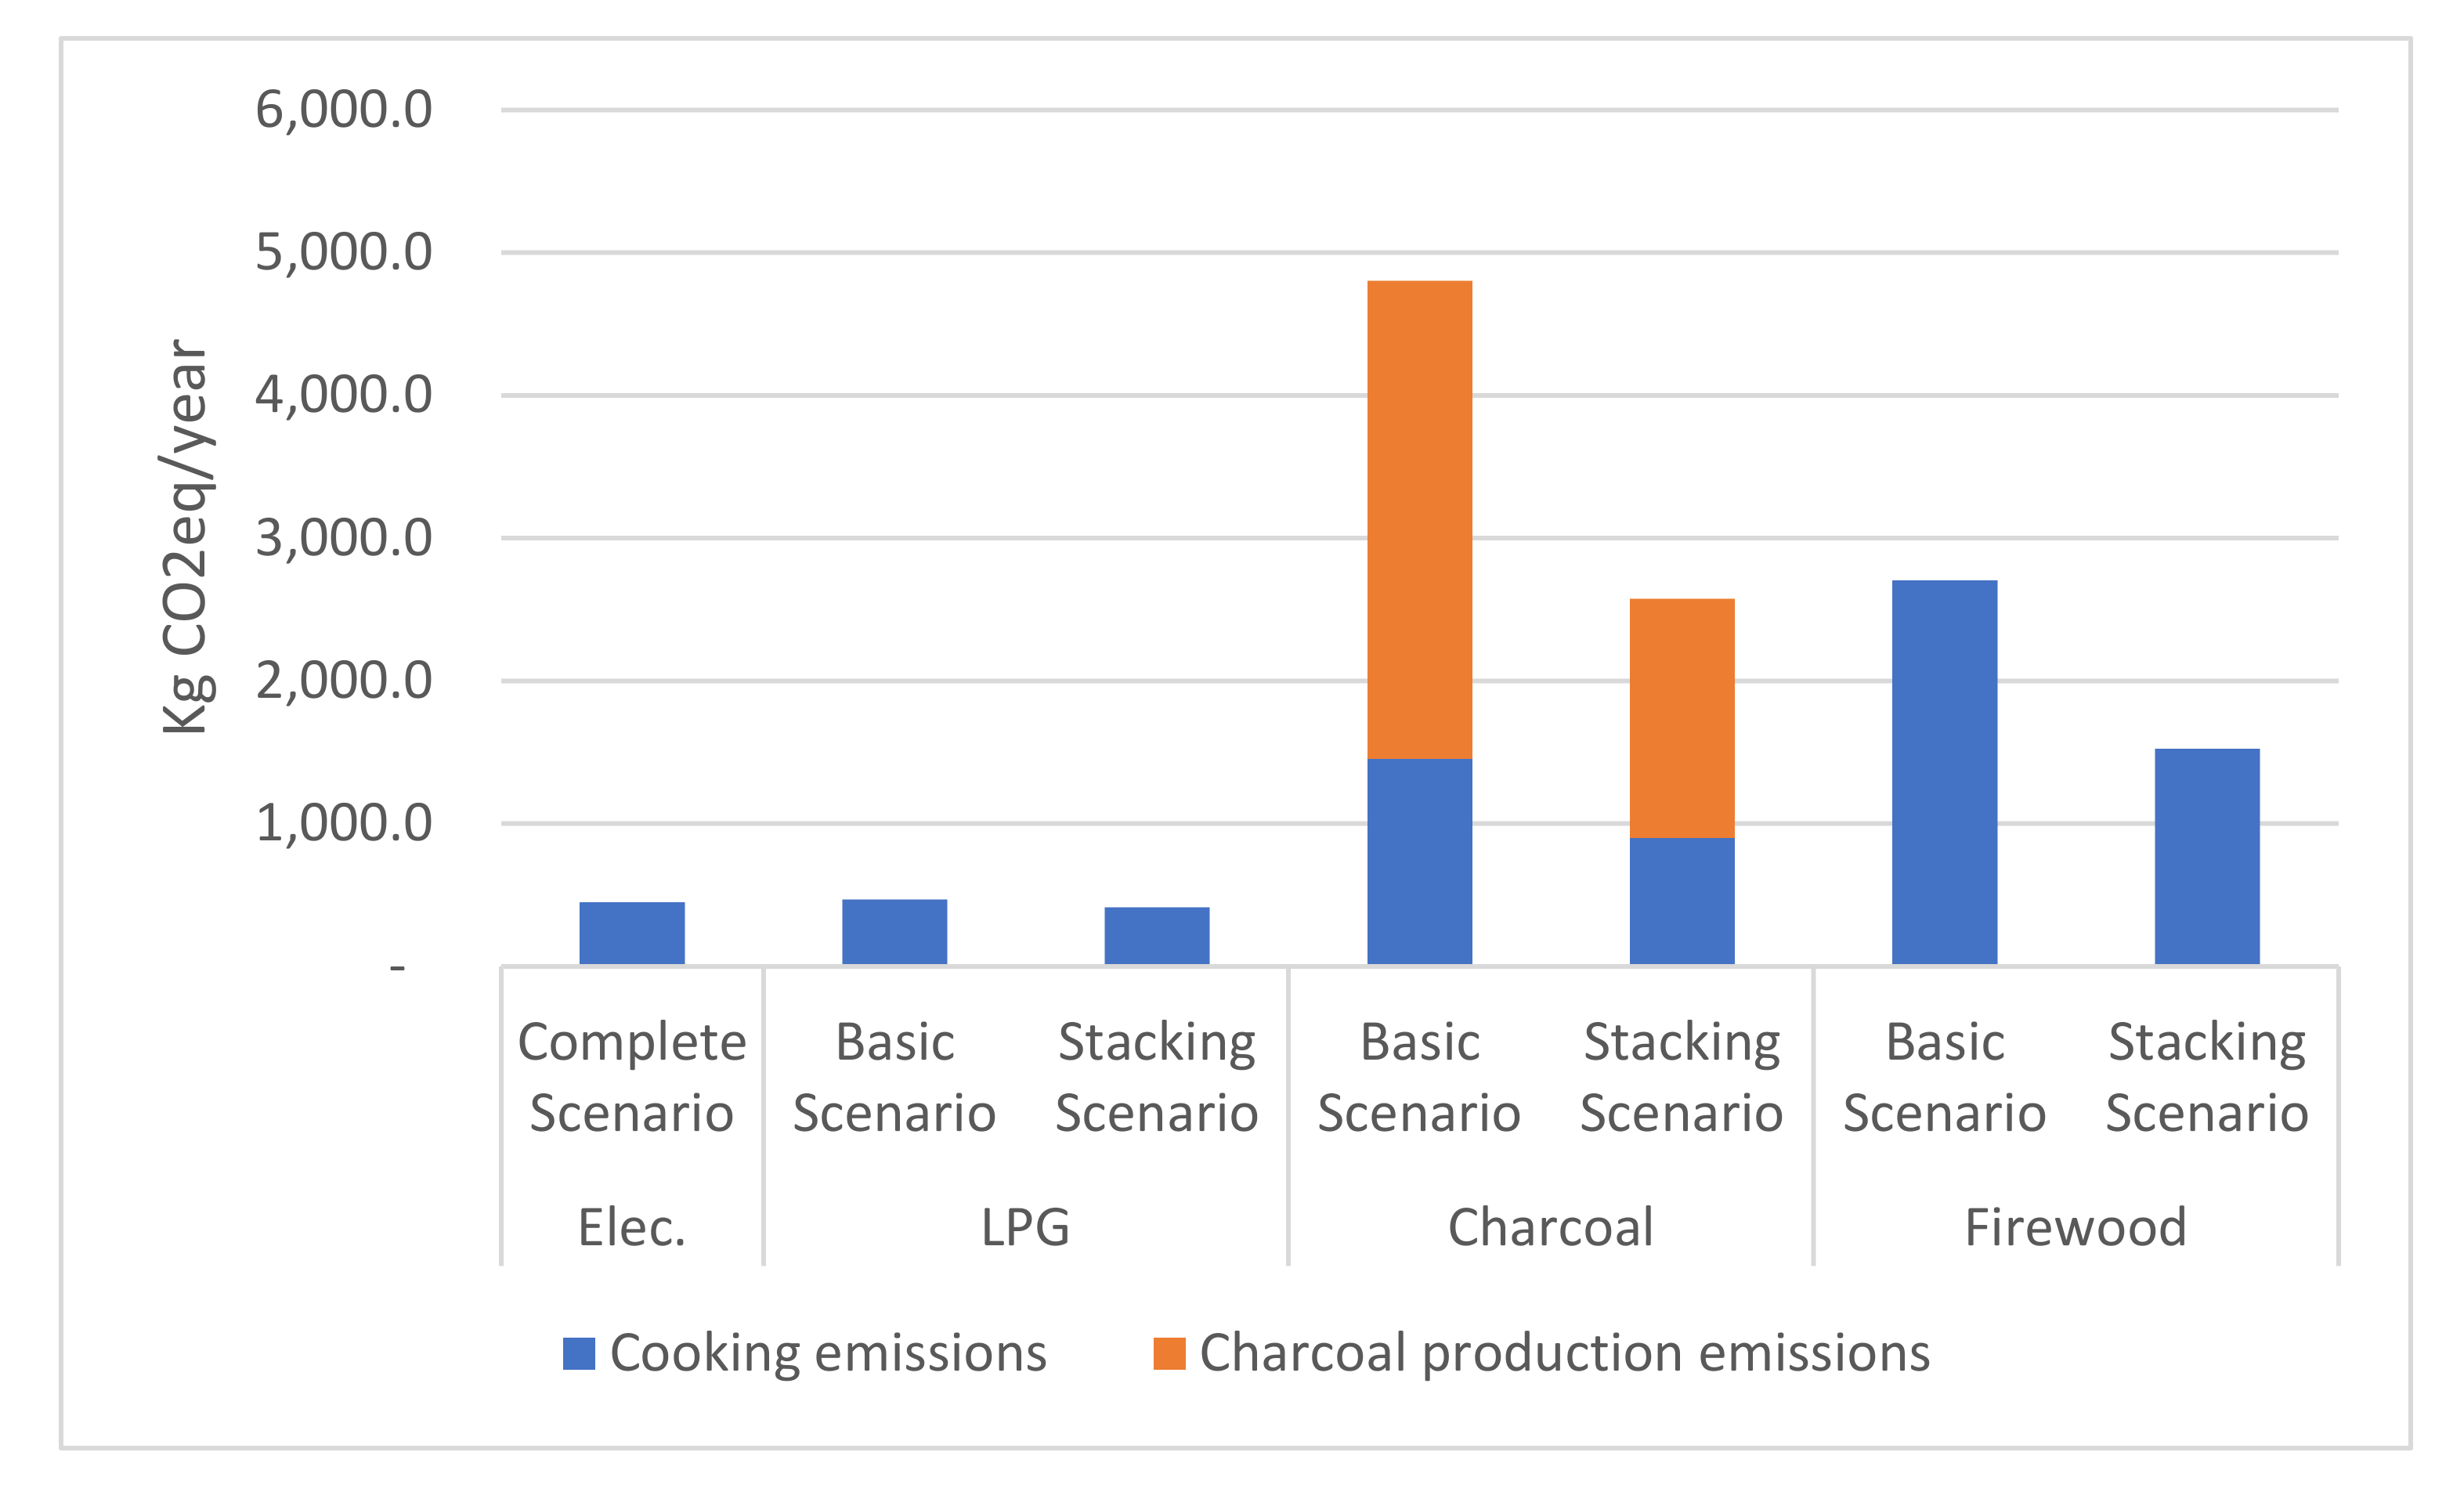
3.4. Greenhouse Emissions
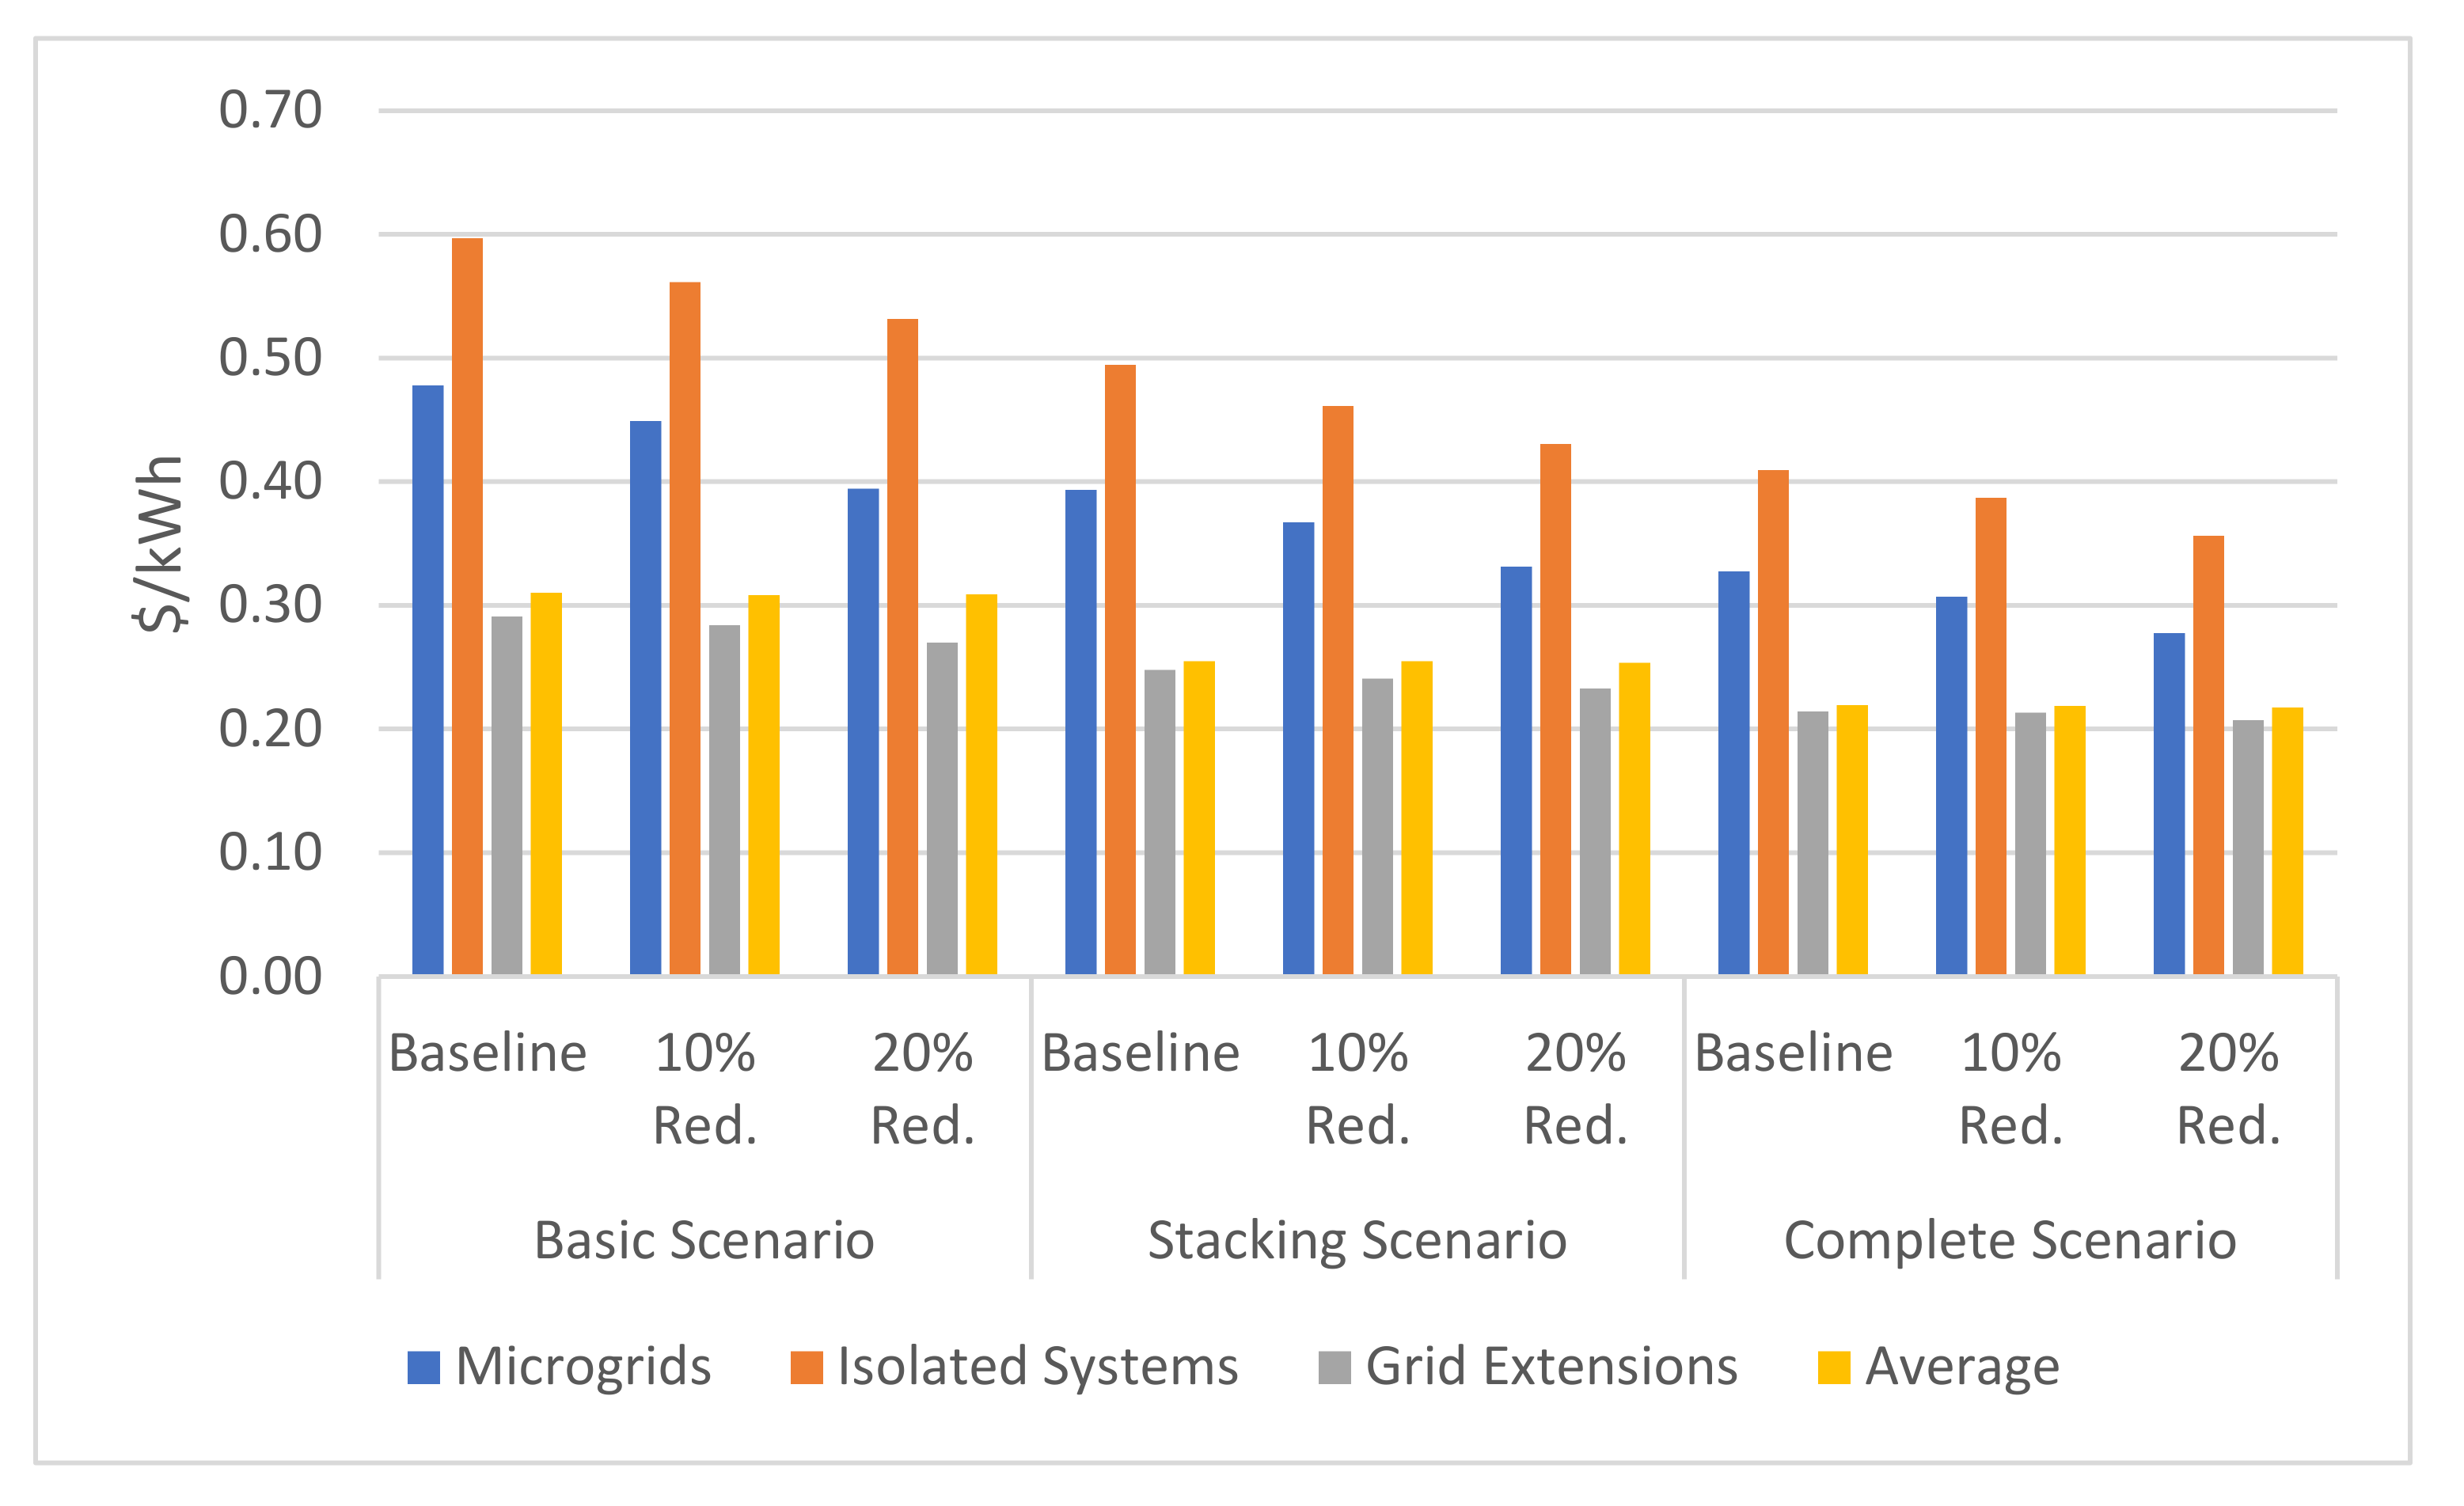
3.5. Sensitivity Analysis
3.6. Caveats and Ongoing Future Research
4. Conclusions
Author Contributions
Funding
Institutional Review Board Statement
Informed Consent Statement
Data Availability Statement
Acknowledgments
Conflicts of Interest
Appendix A. REM Overview
Appendix A.1. REM Inputs and Outputs
- The location and demand of each consumer.
- The location, reliability, and energy cost of the distribution network.
- The catalog of generation components, which includes techno-economic data of solar panels, batteries, diesel generators, inverters, and charge controllers.
- The catalog of network components, which includes techno-economic information of transformers and lines.
- The topographical features of the terrain such as altitudes and protected areas.
- The hourly solar irradiance for a year, which is used to calculate the generation of solar panels.
- Techno-economic and configuration parameters, such as discount rates, cost of diesel, and labor cost.
- The grouping of consumers into clusters and the best electrification mode for each cluster (i.e., a combination of individual standalone systems, a mini-grid, or a grid extension).
- The generation design of each mini-grid and standalone system. REM provides detailed information regarding the generation components included in each design and the corresponding costs.
- The distribution network of each mini-grid and grid extension. The electrification solution includes a bill of material and the location of the lines and transformers needed for each design.
- Relevant information concerning the electrification solution, such as the amount of demand served and reliability of the systems, overnight costs, and costs per kWh of demand served.
Appendix A.2. REM Workflow
- Data preparation. This step aims to collect the input information that REM needs and convert it to the specific formats that the model requires. Satellite imagery and machine learning methods based on convolutional neural networks can estimate the location of the consumers, although there are publicly available datasets such as the High Resolution Settlement Layer (HRSL) with approximates population density in cells of 30 × 30 m2 [77].
- Mini-grid generation. REM optimizes the generation designs of several mini-grid representatives of the analysis region and stores the corresponding information in a look-up table. If REM needs information concerning generation costs of the remaining mini-grids, the model quickly obtains it interpolating among the designs stored in the look-up table.
- Clustering. The model groups the consumers into potential mini-grids and grid extensions, analyzing the trade-offs among costs. For example, large mini-grids have substantial network costs but they benefit from economies of scale in generation.
- Final designs. REM optimizes the network designs of the potential mini-grids and grid extensions, determining the final electrification solution for the analysis region and the corresponding costs.
- Process results. The model generates graphical and statistical outputs that contain critical information about the case study. For example, REM generates files with the distribution networks of mini-grids and grid extensions, which can be projected onto Google Earth.
References
- UN General Assembly. Transforming Our World: The 2030 Agenda for Sustainable Development; United Nations: New York, NY, USA, 2015. [Google Scholar]
- Fonseca, L.M.; Domingues, J.P.; Dima, A.M. Mapping the sustainable development goals relationships. Sustainability 2020, 12, 3359. [Google Scholar] [CrossRef]
- IEA; IRENA; UNSD; WB; WHO. Tracking SDG7: The Energy Progress Report 2021; The World Bank: Washington, DC, USA, 2021. [Google Scholar]
- International Energy Agency World Energy Outlook 2020; World Energy Outlook; OECD: Paris, France, 2020; ISBN 978-92-64-62199-2.
- Masera, O.; Riojas-Rodríguez, H.; Pérez-Padilla, R.; Serrano-Medrano, M.; Schilmann, A.; Ruíz-García, V.; Sierra, L.A.; Berrueta, V. Vulnerabilidad a COVID-19 En Poblaciones Rurales y Periurbanas Por El Uso Doméstico de Leña; Instituto de Investigaciones en Ecosistemas y Sustentabilidad, Universidad Nacional Autónoma de México (UNAM): Mexico City, Mexico, 2020. [Google Scholar]
- Batchelor, S.; Brown, E. Cooking Health Energy Environment and Gender (CHEEG)—Guiding covid recovery plans. Gamos. Loughb. Univ. 2020, Working Paper V1.1, 98. Available online: https://mecs.org.uk/wp-content/uploads/2020/07/CHEEG-Covid-recovery-strategies-Final.pdf (accessed on 7 June 2021).
- HEI Household Air Pollution Group. Household Air Pollution and Noncommunicable Disease; Health Effects Institute: Boston, MA, USA, 2018. [Google Scholar]
- WHO. Burden of Disease from Household Air Pollution for 2016. Description of Method. V4 2018; WHO: Geneva, Switzerland, 2018. [Google Scholar]
- Energy Sector Management Assistance Program (ESMAP). The State of Access to Modern Energy Cooking Services; World Bank: Washington, DC, USA, 2020. [Google Scholar]
- Mazorra, J.; Sánchez-Jacob, E.; de la Sota, C.; Fernández, L.; Lumbreras, J. A comprehensive analysis of cooking solutions co-benefits at household level: Healthy lives and well-being, gender and climate change. Sci. Total Environ. 2020, 707, 135968. [Google Scholar] [CrossRef]
- WHO. WHO Indoor Air Quality: Household Fuel Combustion; WHO: Geneva, Switzerland, 2014. [Google Scholar]
- Smith, K.R.; Sagar, A. Making the clean available: Escaping India’s chulha trap. Energy Policy 2014, 75, 410–414. [Google Scholar] [CrossRef]
- CCA. Clean Cooking Catalog: Product and Performance Data for the Clean Cooking Sector. Available online: http://catalog.cleancookstoves.org (accessed on 18 May 2021).
- De la Sota, C.; Lumbreras, J.; Mazorra, J.; Narros, A.; Fernández, L.; Borge, R. Effectiveness of improved cookstoves to reduce indoor air pollution in developing countries. The case of the cassamance natural subregion, Western Africa. GEP 2014, 2, 1–5. [Google Scholar] [CrossRef][Green Version]
- De la Sota, C.; Lumbreras, J.; Pérez, N.; Ealo, M.; Kane, M.; Youm, I.; Viana, M. Indoor air pollution from biomass cookstoves in rural Senegal. Energy Sustain. Dev. 2018, 43, 224–234. [Google Scholar] [CrossRef]
- Quinn, A.K.; Bruce, N.; Puzzolo, E.; Dickinson, K.; Sturke, R.; Jack, D.W.; Mehta, S.; Shankar, A.; Sherr, K.; Rosenthal, J.P. An analysis of efforts to scale up clean household energy for cooking around the world. Energy Sustain. Dev. 2018, 46, 1–10. [Google Scholar] [CrossRef]
- Puzzolo, E.; Cloke, J.; Parikh, J.; Evans, A.; Pope, D. National Scaling up of LPG to Achive SDG 7: Implications for Policy, Implementation, Public Health and Environment; MECS: Loughborough, UK, 2020. [Google Scholar]
- International Energy Agency. Africa Energy Outlook: A Focus on Energy Prospects in Sub-Saharan Africa; World Energy Outlook; OECD: Paris, France, 2014. [Google Scholar]
- Couture, T.; Jacobs, D. Beyond Fire. How to Achieve Electric Cooking; World Future Council : Hamburg, Germany; Hivos: The Hague, The Netherlands, 2019. [Google Scholar]
- Jürisoo, M.; Serenje, N.; Mwila, F.; Lambe, F.; Osborne, M. Old habits die hard: Using the energy cultures framework to understand drivers of household-level energy transitions in urban Zambia. Energy Res. Soc. Sci. 2019, 53, 59–67. [Google Scholar] [CrossRef]
- Rehfuess, E.A.; Puzzolo, E.; Stanistreet, D.; Pope, D.; Bruce, N.G. Enablers and barriers to large-scale uptake of improved solid fuel stoves: A systematic review. Environ. Health Perspect. 2014, 122, 120–130. [Google Scholar] [CrossRef]
- Malla, S.; Timilsina, G.R. Household Cooking Fuel Choice and Adoption of Improved Cookstoves in Developing Countries: A Review; Policy Research Working Papers; The World Bank: Washington, DC, USA, 2014. [Google Scholar]
- ESMAP. Clean and Improved Cooking in Sub-Saharan Africa; World Bank Group: Washington, DC, USA, 2014. [Google Scholar]
- IEA. Africa Energy Outlook 2019. World Energy Outlook Special Report; International Energy Agency: Paris, France, 2019. [Google Scholar]
- IRENA. Renewable Energy Market Analysis: GCC 2019; IRENA: Abu Dhabi, UAE, 2019. [Google Scholar]
- Muchira, N. East Africa power consumers unable to buy the surplus. The East African, 19 May 2019. Available online: https://www.theeastafrican.co.ke/tea/business/east-africa-power-consumers-unable-to-buy-the-surplus-1417824 (accessed on 7 June 2021).
- Batchelor, S.; Brown, E.; Scott, N.; Leary, J. Two birds, one stone—Reframing cooking energy policies in Africa and Asia. Energies 2019, 12, 1591. [Google Scholar] [CrossRef]
- IPCC. 2014. Climate Change 2014: Mitigation of Climate Change. Contribution of Working Group III to the Fifth Assessment Report of the Intergovernmental Panel on Climate Change; Grafham, O., Pichs-Madruga, R., Sokona, Y., Farahani, E., Kadner, S., Seyboth, K., Adler, A., Baum, I., Brunner, S., Eickemeier, P., et al., Eds.; Cambridge University Press: Cambridge, UK; New York, NY, USA, 2015; Volume 3, ISBN 1-107-05821-X. [Google Scholar]
- Smith, K.R.; Uma, R.; Kishore, V.V.N.; Lata, K.; Joshi, V.; Zhang, J.; Rasmussen, R.A.; Khalil, M.A.K. Greenhouse Gases from Small-Scale Combustion Devices in Developing Countries, Phase IIA: Household Stoves in India; US EPA: Washington, DC, USA, 2000. [Google Scholar]
- ERG. Comparative Analysis of Fuels for Cooking: Life Cycle Environmental Impacts and Economic and Social Considerations; Global Alliance for Clean Cookstoves: Washington, DC, USA, 2017. [Google Scholar]
- Ivanova, I. Cities Are Banning Natural Gas in New Homes, Citing Climate Change. CBS News, 6 December 2019. Available online: https://www.cbsnews.com/news/cities-are-banning-natural-gas-in-new-homes-because-of-climate-change/ (accessed on 7 June 2021).
- IPCC. Global Warming of 1.5°C. An IPCC Special Report on the Impacts of Global Warming of 1.5°C above Pre-Industrial Levels and Related Global Greenhouse Gas Emission Pathways, in the Context of Strengthening the Global Response to the Threat of Climate Change, Sustainable Development, and Efforts to Eradicate Poverty; IPCC: Geneva, Switzerland, 2018; In Press. [Google Scholar]
- Moner-Girona, M.; Puig, D.; Mulugetta, Y.; Kougias, I.; AbdulRahman, J.; Szabó, S. Next generation interactive tool as a backbone for universal access to electricity. Wiley Interdiscip. Rev. Energy Environ. 2018, 7, e305. [Google Scholar] [CrossRef]
- Bhattacharyya, S.C.; Palit, D. A critical review of literature on the nexus between central grid and off-grid solutions for expanding access to electricity in Sub-Saharan Africa and South Asia. Renew. Sustain. Energy Rev. 2021, 141, 110792. [Google Scholar] [CrossRef]
- Morrissey, J. Achieving universal electricity access at the lowest cost: A comparison of published model results. Energy Sustain. Dev. 2019, 53, 81–96. [Google Scholar] [CrossRef]
- KTH. Accelerating the Transition to Clean and Modern Cooking for the 3 Billion People without Access. Available online: https://www.energy.kth.se/energy-systems/desa-news/accelerating-the-transition-to-clean-and-modern-cooking-for-the-3-billion-people-without-access-1.1056280 (accessed on 23 May 2021).
- Alem, Y.; Hassen, S.; Köhlin, G. The Dynamics of Electric Cookstove Adoption; Environment for Development Initiative: Gothenburg, Sweden, 2013. [Google Scholar]
- Global LEAP Awards. 2020 Buyer’s Guide for Electric Pressure Cookers; MECS: Loughborough, UK, 2021. [Google Scholar]
- Leary, J.; Batchelor, S.; Scott, N. Cooking Diaries 3.0 Protocols; MECS: Loughborough, UK, 2019. [Google Scholar]
- Batchelor, S.; Leary, J.; Sago, S.; Mnja, E.; Sawe, J.; Suma, N.; Scott, N. ECook Tanzania Country Report; MECS: Loughborough, UK, 2018. [Google Scholar]
- Energy Sector Management Assistance Program (ESMAP). Cooking with Electricity: A Cost Perspective; World Bank: Washington, DC, USA, 2020. [Google Scholar]
- Lombardi, F.; Riva, F.; Sacchi, M.; Colombo, E. Enabling combined access to electricity and clean cooking with PV-microgrids: New evidences from a high-resolution model of cooking loads. Energy Sustain. Dev. 2019, 49, 78–88. [Google Scholar] [CrossRef]
- IEA. World Energy Outlook 2018; International Energy Agency: Paris, France, 2018. [Google Scholar]
- Lee, S.J.; Sánchez Jacob, E.; González García, A.; Ciller Cutillas, P.; Dueñas Martínez, P.; Taneja, J.; Cuadra García, F.; Lumbreras Martín, J.; Daly, H.; Stoner, R.J.; et al. Investigating the necessity of demand characterization and stimulation for geospatial electrification planning in developing countries. Mit Cent. Energy Environ. Policy Res. 2019, Working Paper. http://ceepr.mit.edu/files/papers/2019-018.pdf.
- SE4ALL. Data Standards for Integrated Energy Planning; Sustainable Energy For All. SE4ALL: Vienna, Austria, 2020. [Google Scholar]
- Ciller, P.; Ellman, D.; Vergara, C.; Gonzalez-Garcia, A.; Lee, S.J.; Drouin, C.; Brusnahan, M.; Borofsky, Y.; Mateo, C.; Amatya, R.; et al. Optimal electrification planning incorporating on- and off-grid technologies: The reference electrification model (REM). Proc. IEEE 2019, 107, 1872–1905. [Google Scholar] [CrossRef]
- MIT & IIT-Comillas Universal Energy Access Research Group—Projects. Available online: http://universalaccess.mit.edu//#/cases (accessed on 18 May 2021).
- Waya. Energy Projects. Available online: https://waya-energy.com/projects (accessed on 18 May 2021).
- Ciller, P.; Lumbreras, S. Electricity for all: The contribution of large-scale planning tools to the energy-access problem. Renew. Sustain. Energy Rev. 2020, 120, 109624. [Google Scholar] [CrossRef]
- Drouin, C. Geospatial Cost Drivers in Computer-Aided Electrification Planning: The Case of Rwanda. Master’s Thesis, Department of Mechanical Engineering, Massachusetts Institute of Technology, Cambridge, MA, USA, 2018. [Google Scholar]
- Ciller, P.; de Cuadra, F.; Lumbreras, S. Optimizing off-grid generation in large-scale electrification-planning problems: A direct-search approach. Energies 2019, 12, 4634. [Google Scholar] [CrossRef]
- Shankar, A.V.; Quinn, A.K.; Dickinson, K.L.; Williams, K.N.; Masera, O.; Charron, D.; Jack, D.; Hyman, J.; Pillarisetti, A.; Bailis, R. Everybody stacks: Lessons from household energy case studies to inform design principles for clean energy transitions. Energy Policy 2020, 141, 111468. [Google Scholar] [CrossRef]
- World Bank. World Bank Open Data. Available online: https://data.worldbank.org/ (accessed on 18 May 2021).
- NISR. Fourth Population and Housing Census, Rwanda, 2012. District Profile. Nyagatare; National Institute of Statistics of Rwanda: Kigali, Rwanda, 2015. [Google Scholar]
- NISR. Fourth Population and Housing Census, Rwanda, 2012. Population Projetions; National Institute of Statistics of Rwanda: Kigali, Rwanda, 2015. [Google Scholar]
- World Bank. Rwanda Beyond Connections. Energy Access Diagnostic Report Based on the Multi-Tier Framework; World Bank: Washington, DC, USA, 2018. [Google Scholar]
- Institute for Health Metrics and Evaluation (IHME). GBD Results Tool. Available online: http://ghdx.healthdata.org/gbd-results-tool (accessed on 18 May 2021).
- Development Bank of Rwanda. Rwanda Energy Access and Quality Improvement Project. Component 3b Increasing Access to Clean Cooking Solutions Operations Manual. Ver 02 15.03.2021; Development Bank of Rwanda: Kigali, Rwanda, 2021. [Google Scholar]
- Bhatia, M.; Angelou, N. Beyond Connections: Energy Access Redefined; World Bank: Washington, DC, USA, 2015. [Google Scholar]
- REG. Review Assessment of Current Electrification Programs Prepared by REG/EDCL and Confirmation on Institutional, Technical and Financial Aspects. TASK 2 Report. Design of the National Ministry of Infrastructures; Rwanda Energy Group: Kigali, Rwanda, 2019. [Google Scholar]
- International Energy Agency. Defining Energy Access: 2020 Methodology. Available online: https://www.iea.org/articles/defining-energy-access-2019-methodology (accessed on 20 May 2021).
- Lee, S.J. Adaptive Electricity Access Planning; Massachusetts Institute of Technology, School of Engineering: Cambridge, MA, USA, 2018. [Google Scholar]
- Fobi, S.; Deshpande, V.; Ondiek, S.; Modi, V.; Taneja, J. A longitudinal study of electricity consumption growth in Kenya. Energy Policy 2018, 123, 569–578. [Google Scholar] [CrossRef]
- Puzzolo, E.; Zerriffi, H.; Carter, E.; Clemens, H.; Stokes, H.; Jagger, P.; Rosenthal, J.; Petach, H. Supply considerations for scaling up clean cooking fuels for household energy in low- and middle-income countries. GeoHealth 2019, 3, 370–390. [Google Scholar] [CrossRef] [PubMed]
- Drigo, R.; Bailis, R.; Ghilardi, A.; Masera, O.; Suber, M. Pan-tropical analysis of woodfuel supply, demand and sustainability. Glob. Alliance Clean Cookstoves 2014. https://www.researchgate.net/publication/312021671_Pan-tropical_analysis_of_woodfuel_supply_demand_and_sustainability_2014?channel=doi&linkId=58695ce808ae8fce4917d86f&showFulltext=true (accessed on 7 June 2021). [CrossRef]
- MARGE. Biomass Energy Strategy (BEST) Rwanda; EUEI-PDF, GTZ, MARGE: Kigali, Rwanda, 2009. [Google Scholar]
- GIZ. Multiple-Household Fuel Use—A Balanced Choice between Firewood, Charcoal and LPG; Deutsche Gesellschaft für Internationale Zusammenarbeit: Bonn, Germany, 2014. [Google Scholar]
- Ministry of Infrastructure. Sustainable Energy for All. Action Agenda.; Ministry of Infrastructure: Kigali, Rwanda, 2016.
- Gouldson, A.; Colenbrander, S.; Sudmant, A.; Chilundika, N.; de Melo, L. The Economics of Low Carbon Cities: Kigali, Rwanda (2018); International Crowth Centre, University of Leeds: Leeds, UK, 2018. [Google Scholar]
- Moretti, L.; Astolfi, M.; Vergara, C.; Macchi, E.; Pérez-Arriaga, J.I.; Manzolini, G. A Design and dispatch optimization algorithm based on mixed integer linear programming for rural electrification. Appl. Energy 2019, 233, 1162. [Google Scholar] [CrossRef]
- Kit Solaire Discount. Autonomous Solar Kits. Available online: https://kitsolaire-discount.com/gb/12-autonomous-solar-kits (accessed on 23 May 2021).
- Republic of Rwanda. Nationally Determined Contribution. Updated; Ministry or Environment: Kigali, Rwanda, 2020.
- Hakizimana, E.; Wali, U.G.; Sandoval, D.; Venant, K. Environmental impacts of biomass energy sources in Rwanda. Energy Environ. Eng. 2020, 7, 62–71. [Google Scholar] [CrossRef]
- Bishumba, N. What Is behind the recent spike in cooking gas prices? The New Times, 19 March, 2021. Available online: https://www.newtimes.co.rw/news/what-behind-recent-spike-cooking-gas-prices (accessed on 7 June 2021).
- Batchelor, S.; Brown, E.; Leary, J.; Scott, N.; Alsop, A.; Leach, M. Solar electric cooking in Africa: Where will the transition happen first? Energy Res. Soc. Sci. 2018, 40, 257–272. [Google Scholar] [CrossRef]
- Dagnachew, A.G.; Hof, A.F.; Lucas, P.L.; van Vuuren, D.P. Scenario analysis for promoting clean cooking in Sub-Saharan Africa: Costs and benefits. Energy 2020, 192, 116641. [Google Scholar] [CrossRef]
- Facebook Connectivity Lab and Center for International Earth Science Information Network—CIESIN—Columbia University High Resolution Settlement Layer (HRSL). Source Imagery for HRSL©. 2016 DigitalGlobe. Available online: https://www.ciesin.columbia.edu/data/hrsl/ (accessed on 24 June 2021).


| LPG Single Burner | Charcoal Stove | Wood Stove | Energy-Efficient Electric Appliance | |
|---|---|---|---|---|
| Cost (USD) | 45 | 22.5 | 22.5 | 75 |
| Lifetime (years) | 5 | 2 | 2 | 5 |
| Annual cost (USD) | 9.0 | 11.3 | 11.3 | 15 |
| Consumption as sole source (kWh/day or Kg/day) | 0.28 | 1.75 | 3.5 | 2 |
| Consumption in Stacking Sc. (kWh/day or Kg/day) | 0.14 | 0.875 | 1.75 | 0.7 |
| GWP100 | LPG | Charcoal | Firewood | Charcoal Kiln | |
|---|---|---|---|---|---|
| CO2 | 3085 | 2335 | 1519 | 1800 | |
| fNRB 1 | 100.00% | 58.45% | 58.45% | 58.45% | |
| CO2 non- renewable | 1 | 3085 | 1364.8 | 887.9 | 1052.1 |
| CO | 1.9 | 15.00 | 192.5 | 70.00 | 225.00 |
| CH4 | 28 | 0.05 | 10.2 | 3.90 | 44.60 |
| BC | 460 | 0.01 | 0.07 | 1.90 | 5.47 |
| CO2eq | 3120 | 2048 | 2004 | 5245 |
| Scenarios | Fraction of Households | HH’s Total Cost per kWh (USD/kWh) | |||||
|---|---|---|---|---|---|---|---|
| Microgrids | Isolated Systems | Grid Extensions | Microgrids | Isolated Systems | Grid Extensions | Average | |
| Basic Sc. | 3.66% | 4.01% | 92.33% | 0.478 | 0.593 | 0.291 | 0.310 |
| Stacking Sc. | 2.21% | 1.54% | 96.25% | 0.393 | 0.492 | 0.248 | 0.255 |
| Complete Sc. | 2.74% | 0.94% | 96.32% | 0.327 | 0.413 | 0.214 | 0.219 |
| Cost of Electricity | Total and Partial Costs of Cooking with Electricity | Breakeven Price | |||||||||
|---|---|---|---|---|---|---|---|---|---|---|---|
| Total | For Basic Services | For Cooking | Electricity Cost in Basic Sc. | Additional Cost * | Appliances Cost | Electricity and Appliances Cost | LPG | Charcoal | Firewood | ||
| Grid Extension | Stacking Sc. | 153.70 | 90.41 | 63.29 | 106.21 | 47.49 | 15.00 | 62.49 | 1.05 | 0.16 | 0.08 |
| Complete Sc. | 234.69 | 78.23 | 156.46 | 106.21 | 128.48 | 30.00 | 158.48 | 1.37 | 0.21 | 0.11 | |
| Microgrids | Stacking Sc. | 244.11 | 143.59 | 100.52 | 174.43 | 69.68 | 15.00 | 84.68 | 1.48 | 0.23 | 0.10 |
| Complete Sc. | 358.47 | 119.49 | 238.98 | 174.43 | 184.04 | 30.00 | 214.04 | 1.92 | 0.30 | 0.13 | |
| Isolated Systems | Stacking Sc. | 305.54 | 179.73 | 125.81 | 216.48 | 89.06 | 15.00 | 104.06 | 1.86 | 0.29 | 0.13 |
| Complete Sc. | 452.57 | 150.86 | 301.71 | 216.48 | 236.09 | 30.00 | 266.09 | 2.43 | 0.38 | 0.17 | |
| Scenarios | All Customers | Household Customers | Non-HH Customers | |||
|---|---|---|---|---|---|---|
| Microgrids | Isolated Systems | Grid Extensions | Total | Total | Total | |
| Basic Sc, | 513,662 | 657,450 | 9697,502 | 10,868,613 | 8406,912 | 2461,701 |
| Stacking Sc. | 407,696 | 347,214 | 13,145,682 | 13,900,591 | 11,744,338 | 2156,253 |
| Complete Sc. | 733,959 | 316,966 | 18,730,646 | 19,781,572 | 17,845,445 | 1936,127 |
| Energy Consumption | % Grid Connected HH | GHG Emissions per HH (kg CO2eq/year) | GHG Emissions in Nyagatare (t CO2eq/year) | ||||||
|---|---|---|---|---|---|---|---|---|---|
| Electricity (kWh/year) | Fuel (kg/year) | From Electricity | From Fuel | Total | Including Charcoal Production | ||||
| Elec. | Complete Sc. | 1095.0 | - | 92.33% | 414.5 | - | 449.0 | 449.0 | 33,334 |
| LPG | Basic Sc. | 365.0 | 102.2 | 96.32% | 144.1 | 318.8 | 468.5 | 468.5 | 34,782 |
| Stacking Sc. | 620.5 | 51.1 | 96.2% | 244.9 | 159.4 | 413.8 | 413.8 | 30,725 | |
| Charcoal | Basic Sc. | 365.0 | 638.8 | 96.3% | 144.1 | 1308.4 | 1452.5 | 4802.5 | 356,577 |
| Stacking Sc. | 620.5 | 319.4 | 96.2% | 244.9 | 654.2 | 899.1 | 2574.0 | 191,118 | |
| Firewood | Basic Sc. | 365.0 | 1277.5 | 96.3% | 144.1 | 2560.2 | 2704.3 | 2704.3 | 200,790 |
| Stacking Sc. | 620.5 | 638.8 | 96.2% | 244.9 | 1280.1 | 1524.9 | 1524.9 | 113,224 | |
| Wood Consumption | Non-Renewable Biomass | ||||
|---|---|---|---|---|---|
| Per HH (Kg/year) | For Nyagatare (t/year) | Per HH (Kg/year) | For Nyagatare (t/year) | ||
| Charcoal | Basic Sc. | 3193.8 | 1866.7 | 237,129.6 | 138,602 |
| Stacking Sc. | 1596.9 | 933.4 | 118,564.8 | 69,301 | |
| Firewood | Basic Sc. | 1277.5 | 746.7 | 94,851.8 | 55,441 |
| Stacking Sc. | 638.8 | 373.3 | 47,425.9 | 27,720 | |
| Scenario | Grid Cost | Fraction of Households | kWh Cost (USD) | |||||
|---|---|---|---|---|---|---|---|---|
| USD/kWh | Microgrids | Isolated Systems | Grid Extensions | Microgrids | Isolated Systems | Grid Extensions | Average | |
| Basic Sc. | 0.09 | 3.66% | 4.01% | 92.33% | 0.478 | 0.597 | 0.291 | 0.310 |
| 0.12 | 8.20% | 4.94% | 86.86% | 0.453 | 0.597 | 0.315 | 0.340 | |
| 0.06 | 1.19% | 2.56% | 96.25% | 0.479 | 0.597 | 0.267 | 0.278 | |
| Stacking Sc. | 0.09 | 2.21% | 1.54% | 96.25% | 0.393 | 0.494 | 0.248 | 0.255 |
| 0.12 | 7.96% | 2.95% | 89.09% | 0.387 | 0.494 | 0.271 | 0.287 | |
| 0.06 | 1.70% | 1.23% | 97.07% | 0.393 | 0.494 | 0.217 | 0.223 | |
| Complete Sc. | 0.09 | 2.74% | 0.94% | 96.32% | 0.327 | 0.409 | 0.214 | 0.219 |
| 0.12 | 7.07% | 1.55% | 91.38% | 0.326 | 0.409 | 0.243 | 0.252 | |
| 0.06 | 0.83% | 0.39% | 98.78% | 0.338 | 0.409 | 0.185 | 0.187 | |
| ER Cost Reduction | Fraction of Customers | HH’s Total Cost per kWh (USD/kWh) | ||||||
|---|---|---|---|---|---|---|---|---|
| % | Microgrids | Isolated Systems | Grid Extensions | Microgrids | Isolated Systems | Grid Extensions | Aver. | |
| Basic Sc. | 0% | 3.66% | 4.01% | 92.33% | 0.478 | 0.597 | 0.291 | 0.310 |
| −10% | 6.26% | 5.06% | 88.68% | 0.449 | 0.561 | 0.284 | 0.308 | |
| −20% | 16.82% | 6.93% | 76.25% | 0.394 | 0.532 | 0.270 | 0.309 | |
| Stacking Sc. | 0% | 2.21% | 1.54% | 96.25% | 0.393 | 0.494 | 0.248 | 0.255 |
| −10% | 6.51% | 2.72% | 90.77% | 0.367 | 0.461 | 0.241 | 0.255 | |
| −20% | 13.29% | 3.91% | 82.80% | 0.331 | 0.430 | 0.233 | 0.254 | |
| Complete Sc. | 0% | 2.74% | 0.94% | 96.32% | 0.327 | 0.409 | 0.214 | 0.219 |
| −10% | 3.72% | 1.14% | 95.15% | 0.307 | 0.387 | 0.213 | 0.219 | |
| −20% | 10.32% | 1.95% | 87.74% | 0.278 | 0.356 | 0.207 | 0.217 | |
| Basic Pack. | Fraction of Customers | HH’s Total Cost per kWh (USD/kWh) | ||||||
|---|---|---|---|---|---|---|---|---|
| Microgrids | Isolated Systems | Grid Extensions | Microgrids | Isolated Systems | Grid Extensions | Average | ||
| Basic Sc. | 1 kWh | 3.66% | 4.01% | 92.33% | 0.478 | 0.593 | 0.291 | 0.310 |
| NEP | 13.96% | 8.93% | 77.11% | 0.959 | 2.823 | 0.550 | 0.810 | |
| Stacking Sc. | 1 kWh | 2.21% | 1.54% | 96.25% | 0.393 | 0.492 | 0.248 | 0.255 |
| NEP | 12.38% | 4.15% | 83.47% | 0.505 | 0.765 | 0.318 | 0.359 | |
| Complete Sc. | 1 kWh | 2.74% | 0.94% | 96.32% | 0.327 | 0.413 | 0.214 | 0.219 |
| NEP | 4.47% | 1.43% | 94.10% | 0.372 | 0.486 | 0.249 | 0.258 | |
| Basic Package | Microgrids | Isolated Systems | Grid Extensions | Total | Household Customers | Non-HH Customers | |
|---|---|---|---|---|---|---|---|
| Basic Sc. | 1 kWh | 513,662 | 657,450 | 9,697,502 | 10,868,613 | 8,406,912 | 2,461,701 |
| NEP | 904,282 | 1,045,292 | 6,128,391 | 8,077,965 | 4,512,670 | 3,565,295 | |
| Stacking Sc. | 1 kWh | 407,696 | 347,214 | 13,145,682 | 13,900,591 | 11,744,338 | 2,156,253 |
| NEP | 1,596,983 | 731,233 | 9,078,421 | 11,406,636 | 8,825,401 | 2,581,235 | |
| Complete Sc. | 1 kWh | 733,959 | 316,966 | 18,730,646 | 19,781,572 | 17,845,445 | 1,936,127 |
| NEP | 996,180 | 417,405 | 16,149,374 | 17,562,959 | 15,446,649 | 2,116,310 |
Publisher’s Note: MDPI stays neutral with regard to jurisdictional claims in published maps and institutional affiliations. |
© 2021 by the authors. Licensee MDPI, Basel, Switzerland. This article is an open access article distributed under the terms and conditions of the Creative Commons Attribution (CC BY) license (https://creativecommons.org/licenses/by/4.0/).
Share and Cite
Sánchez-Jacob, E.; González-García, A.; Mazorra, J.; Ciller, P.; Lumbreras, J.; Pérez-Arriaga, J.I. Joint Optimal Planning of Electricity and Modern Energy Cooking Services Access in Nyagatare. Energies 2021, 14, 4093. https://doi.org/10.3390/en14144093
Sánchez-Jacob E, González-García A, Mazorra J, Ciller P, Lumbreras J, Pérez-Arriaga JI. Joint Optimal Planning of Electricity and Modern Energy Cooking Services Access in Nyagatare. Energies. 2021; 14(14):4093. https://doi.org/10.3390/en14144093
Chicago/Turabian StyleSánchez-Jacob, Eduardo, Andrés González-García, Javier Mazorra, Pedro Ciller, Julio Lumbreras, and José Ignacio Pérez-Arriaga. 2021. "Joint Optimal Planning of Electricity and Modern Energy Cooking Services Access in Nyagatare" Energies 14, no. 14: 4093. https://doi.org/10.3390/en14144093
APA StyleSánchez-Jacob, E., González-García, A., Mazorra, J., Ciller, P., Lumbreras, J., & Pérez-Arriaga, J. I. (2021). Joint Optimal Planning of Electricity and Modern Energy Cooking Services Access in Nyagatare. Energies, 14(14), 4093. https://doi.org/10.3390/en14144093