
The Effect of Perforation Spacing on the Variation of Stress Shadow


Abstract
:
1. Introduction
2. Numerical Analysis Method
2.1. Principle of the XFEM
2.2. Fluid-Mechanical Coupling Principle
Fluid Flow Model
2.3. Failure Criterion
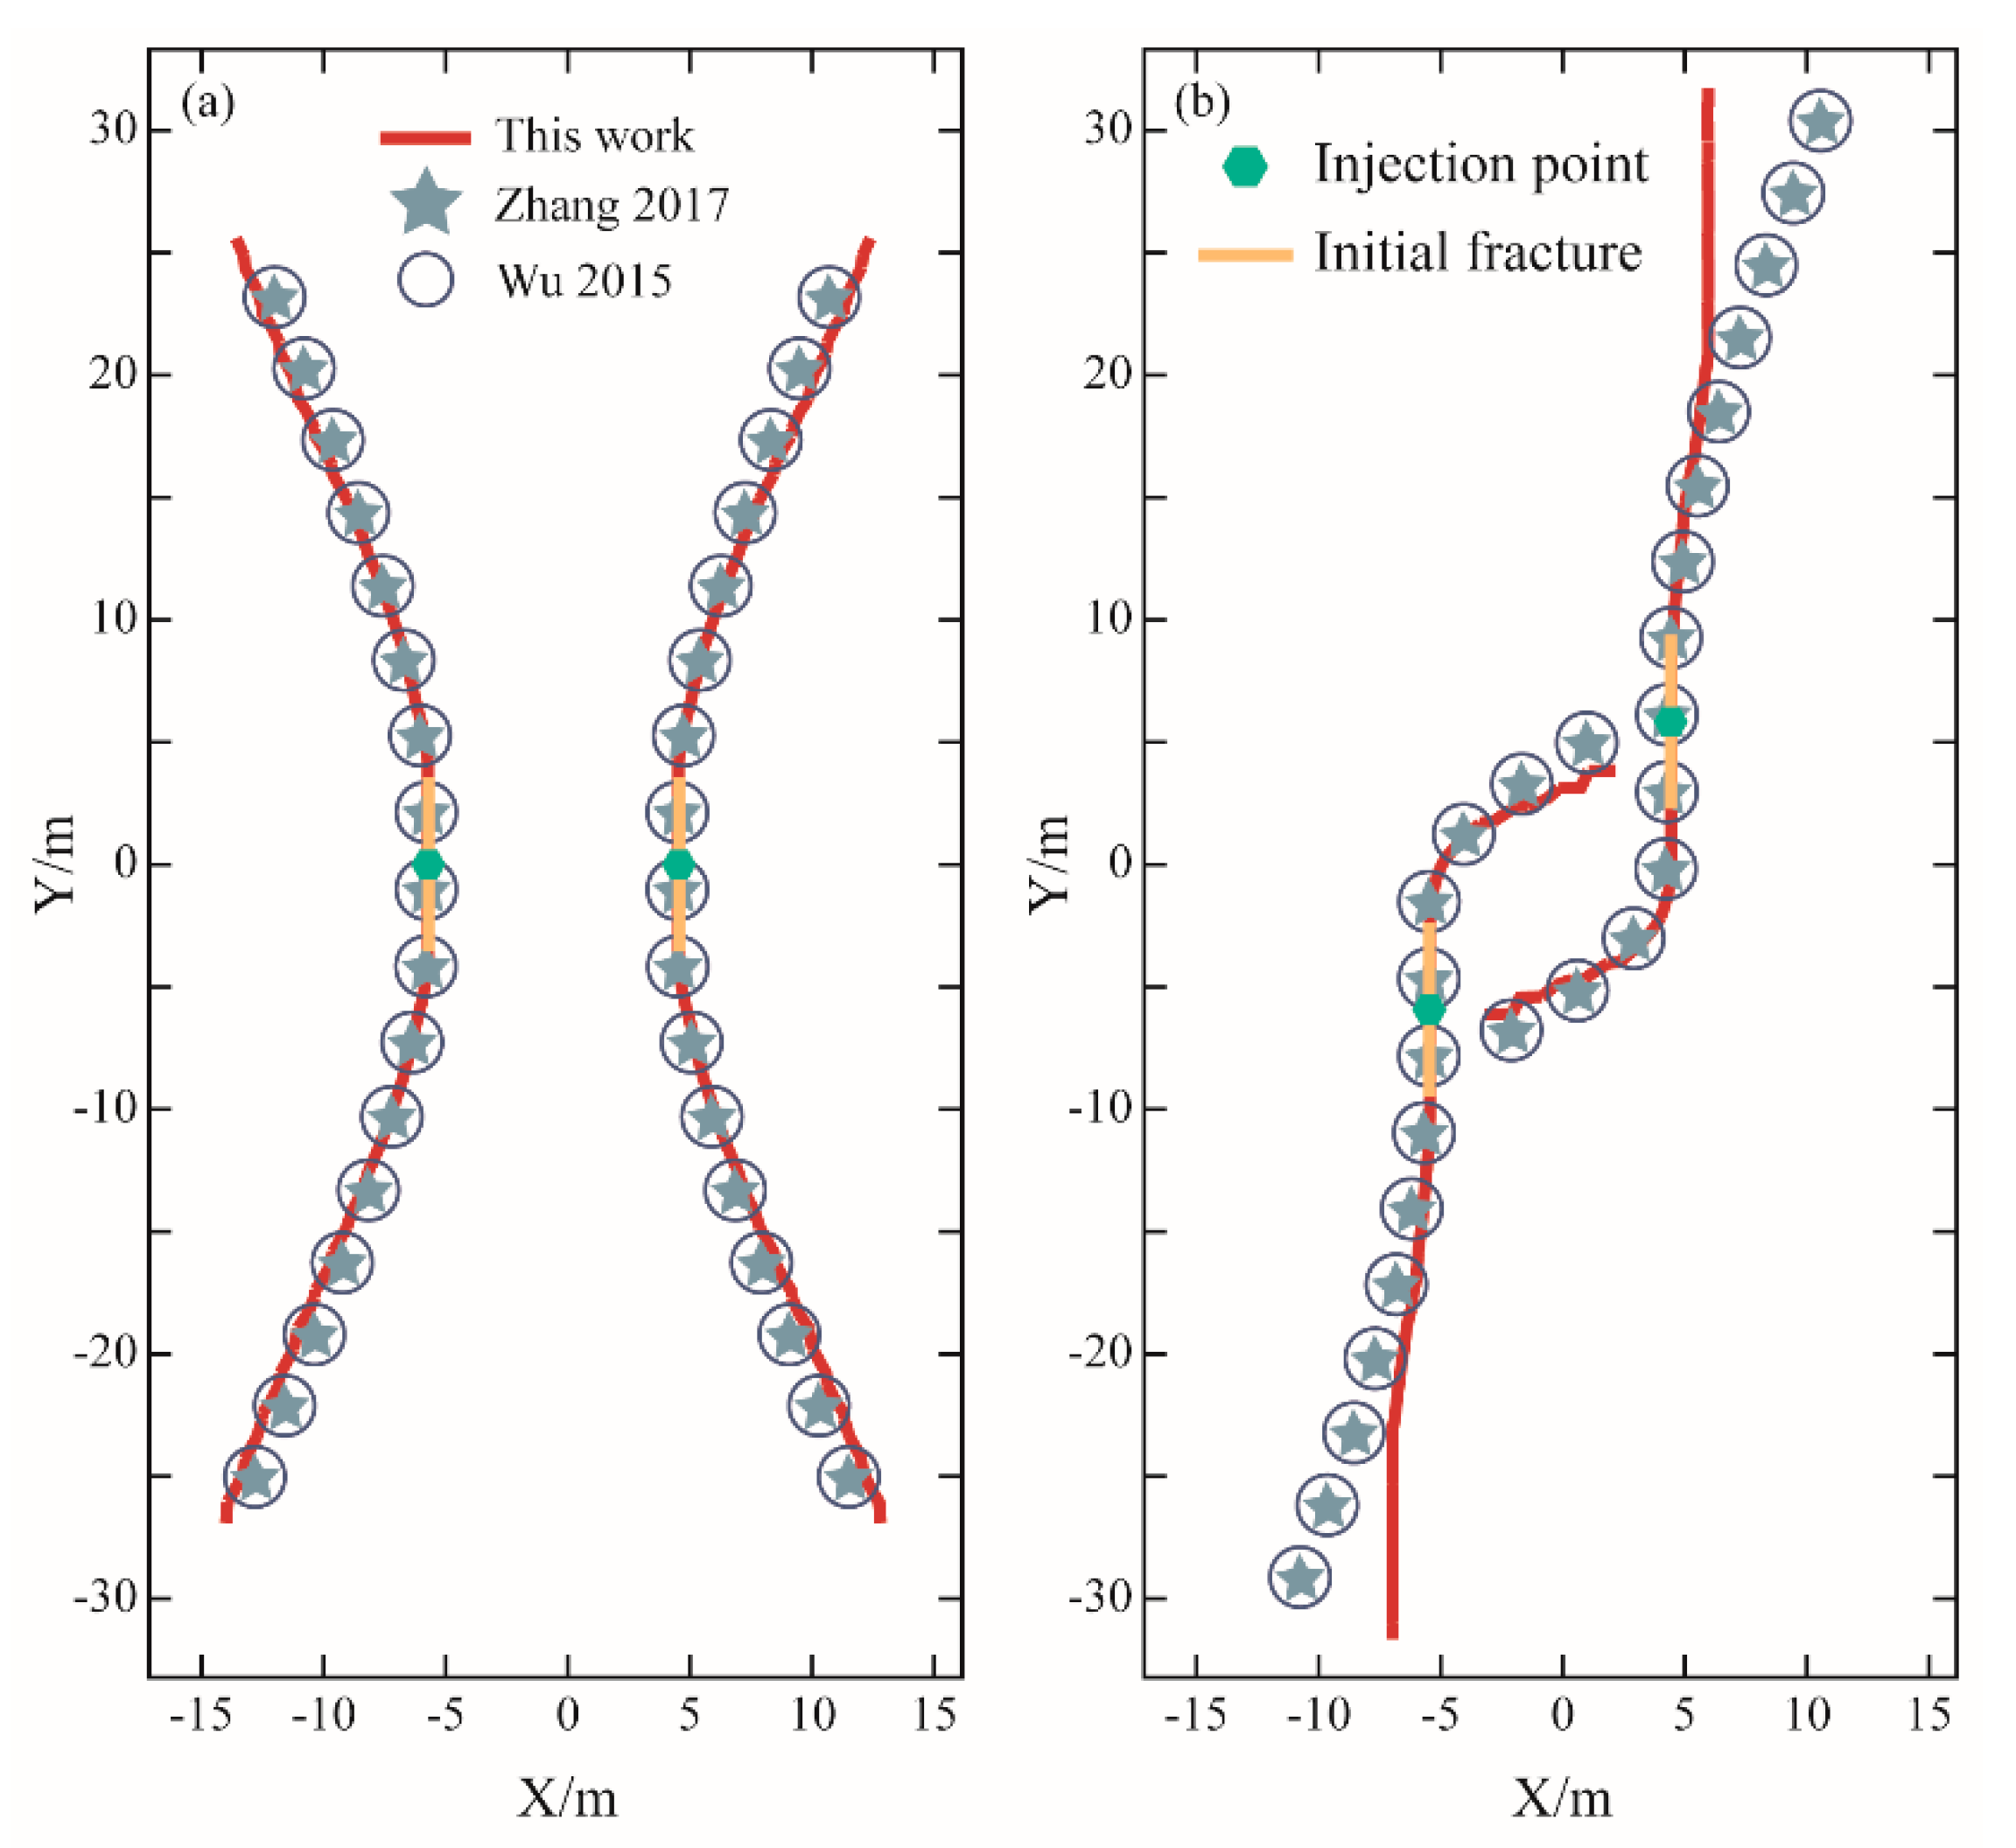
3. Model Validation
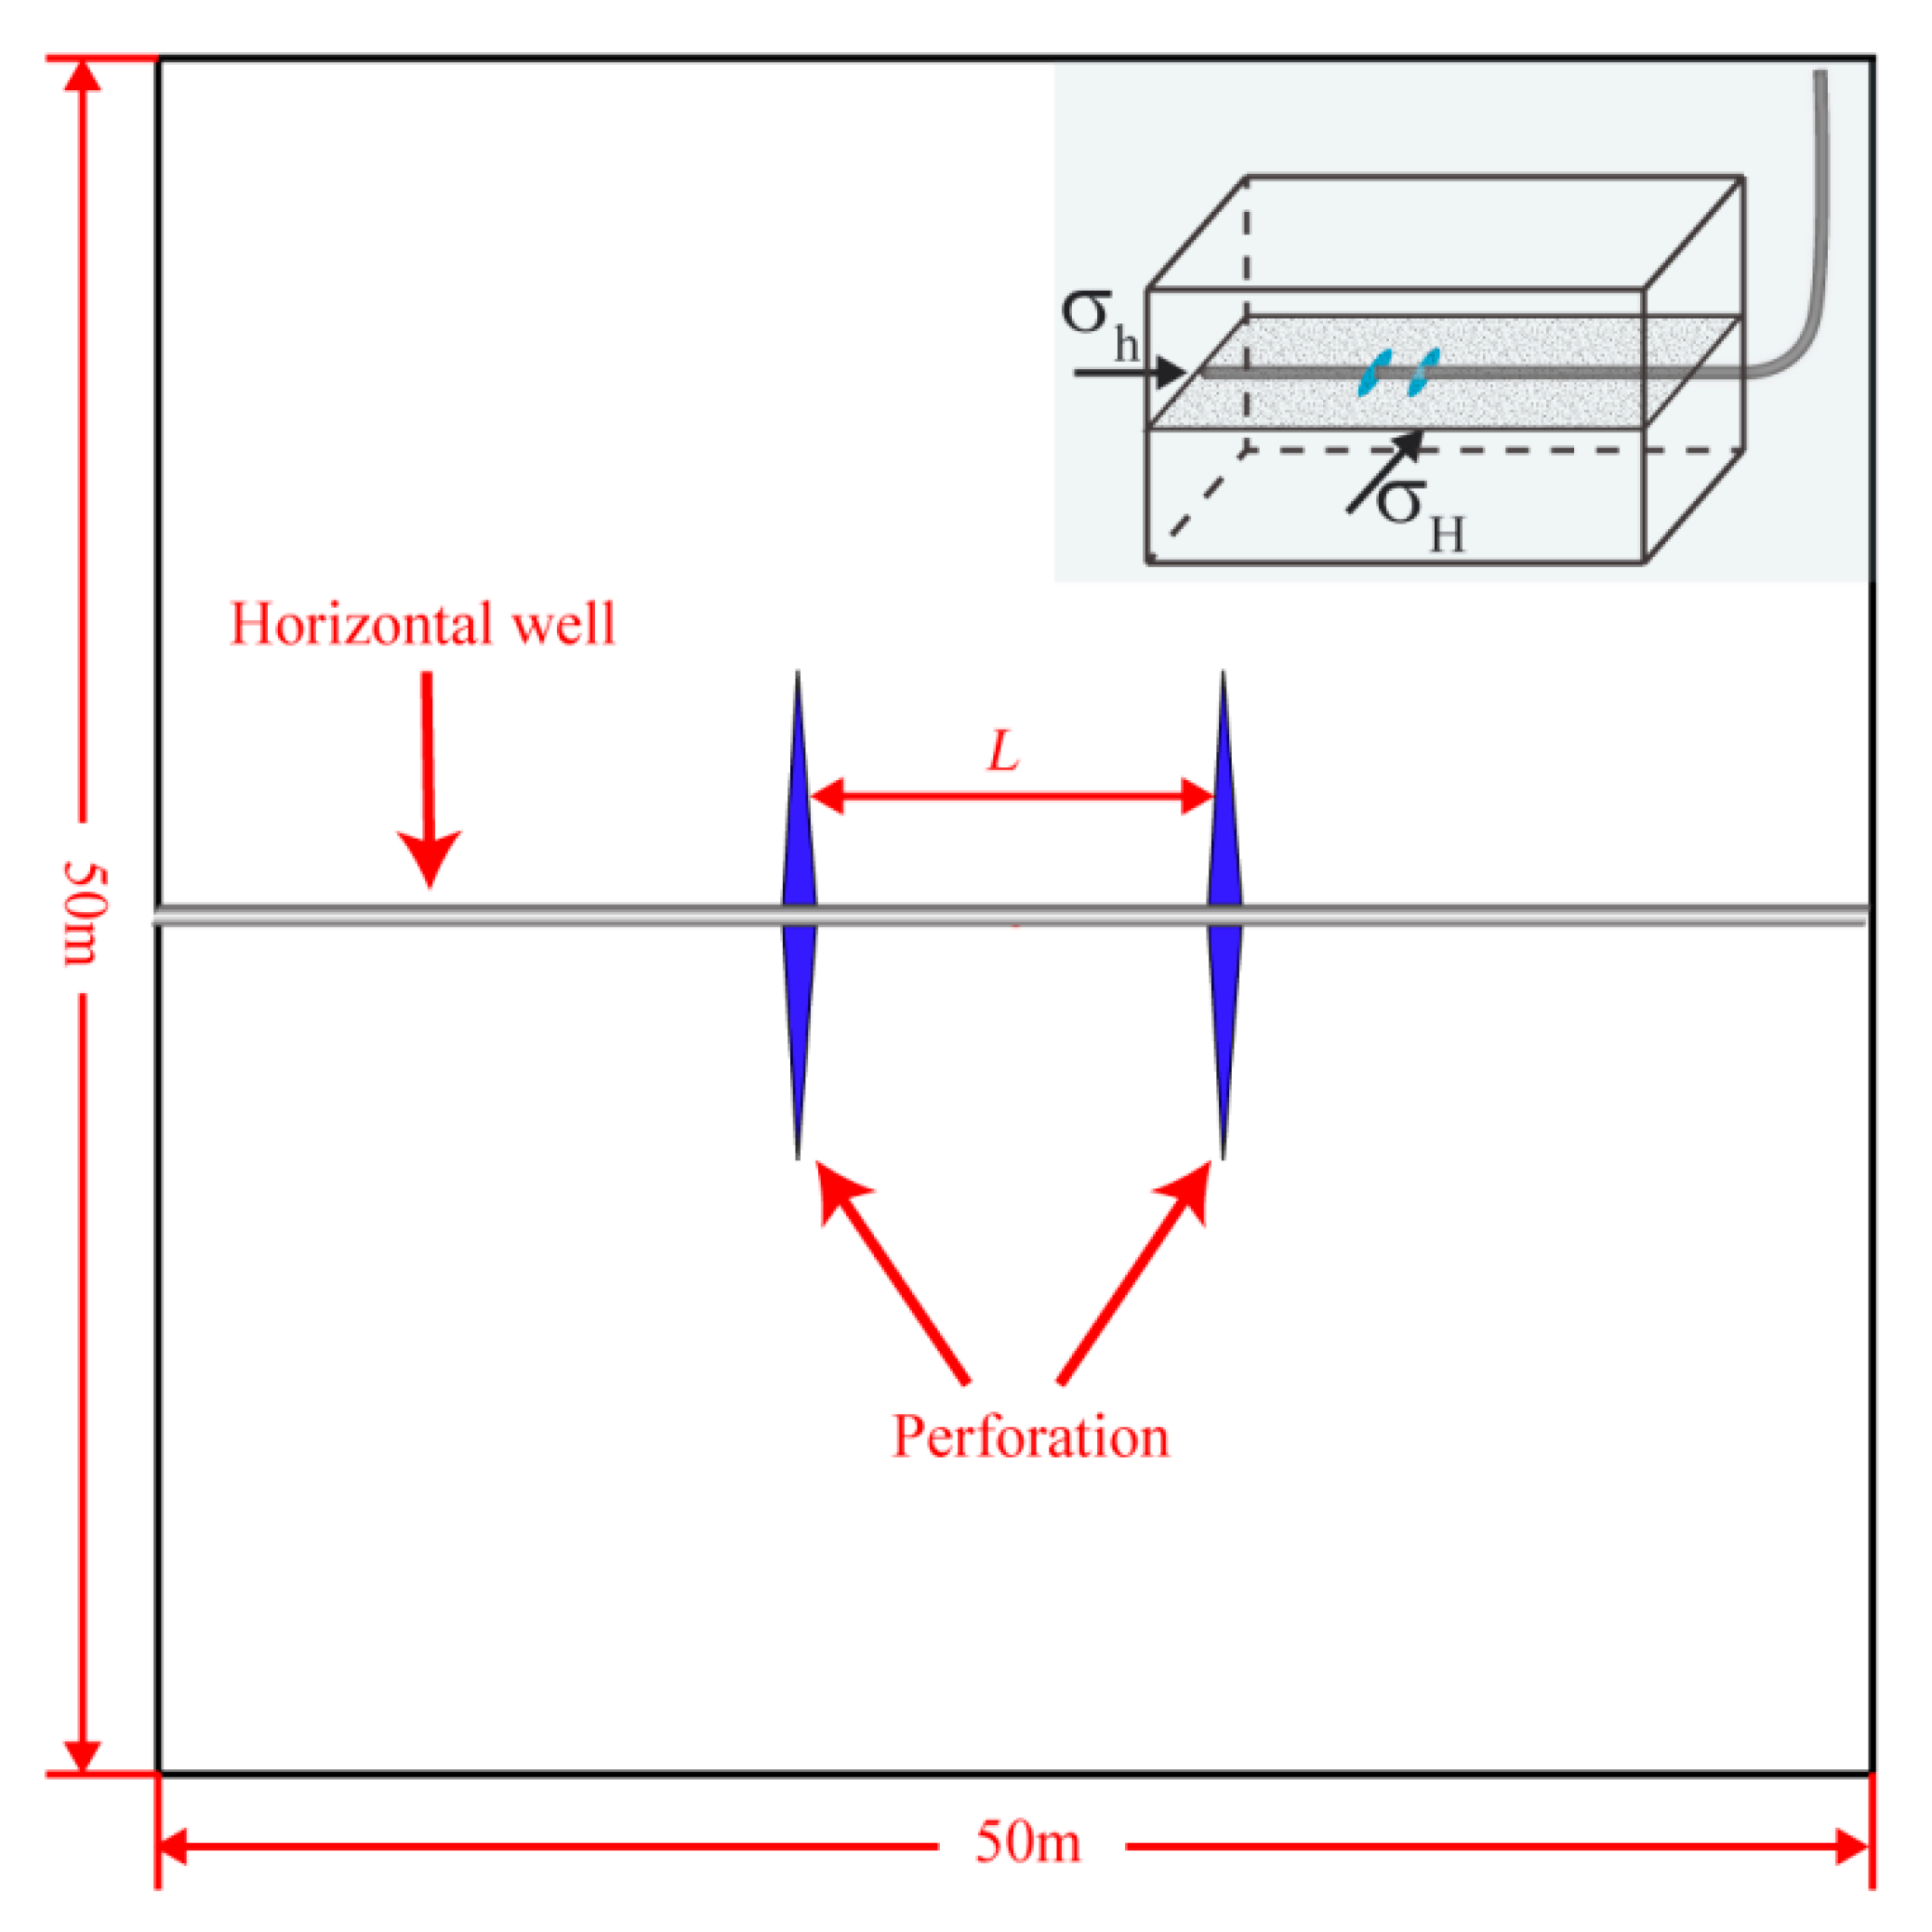
4. Numerical Model
5. Results
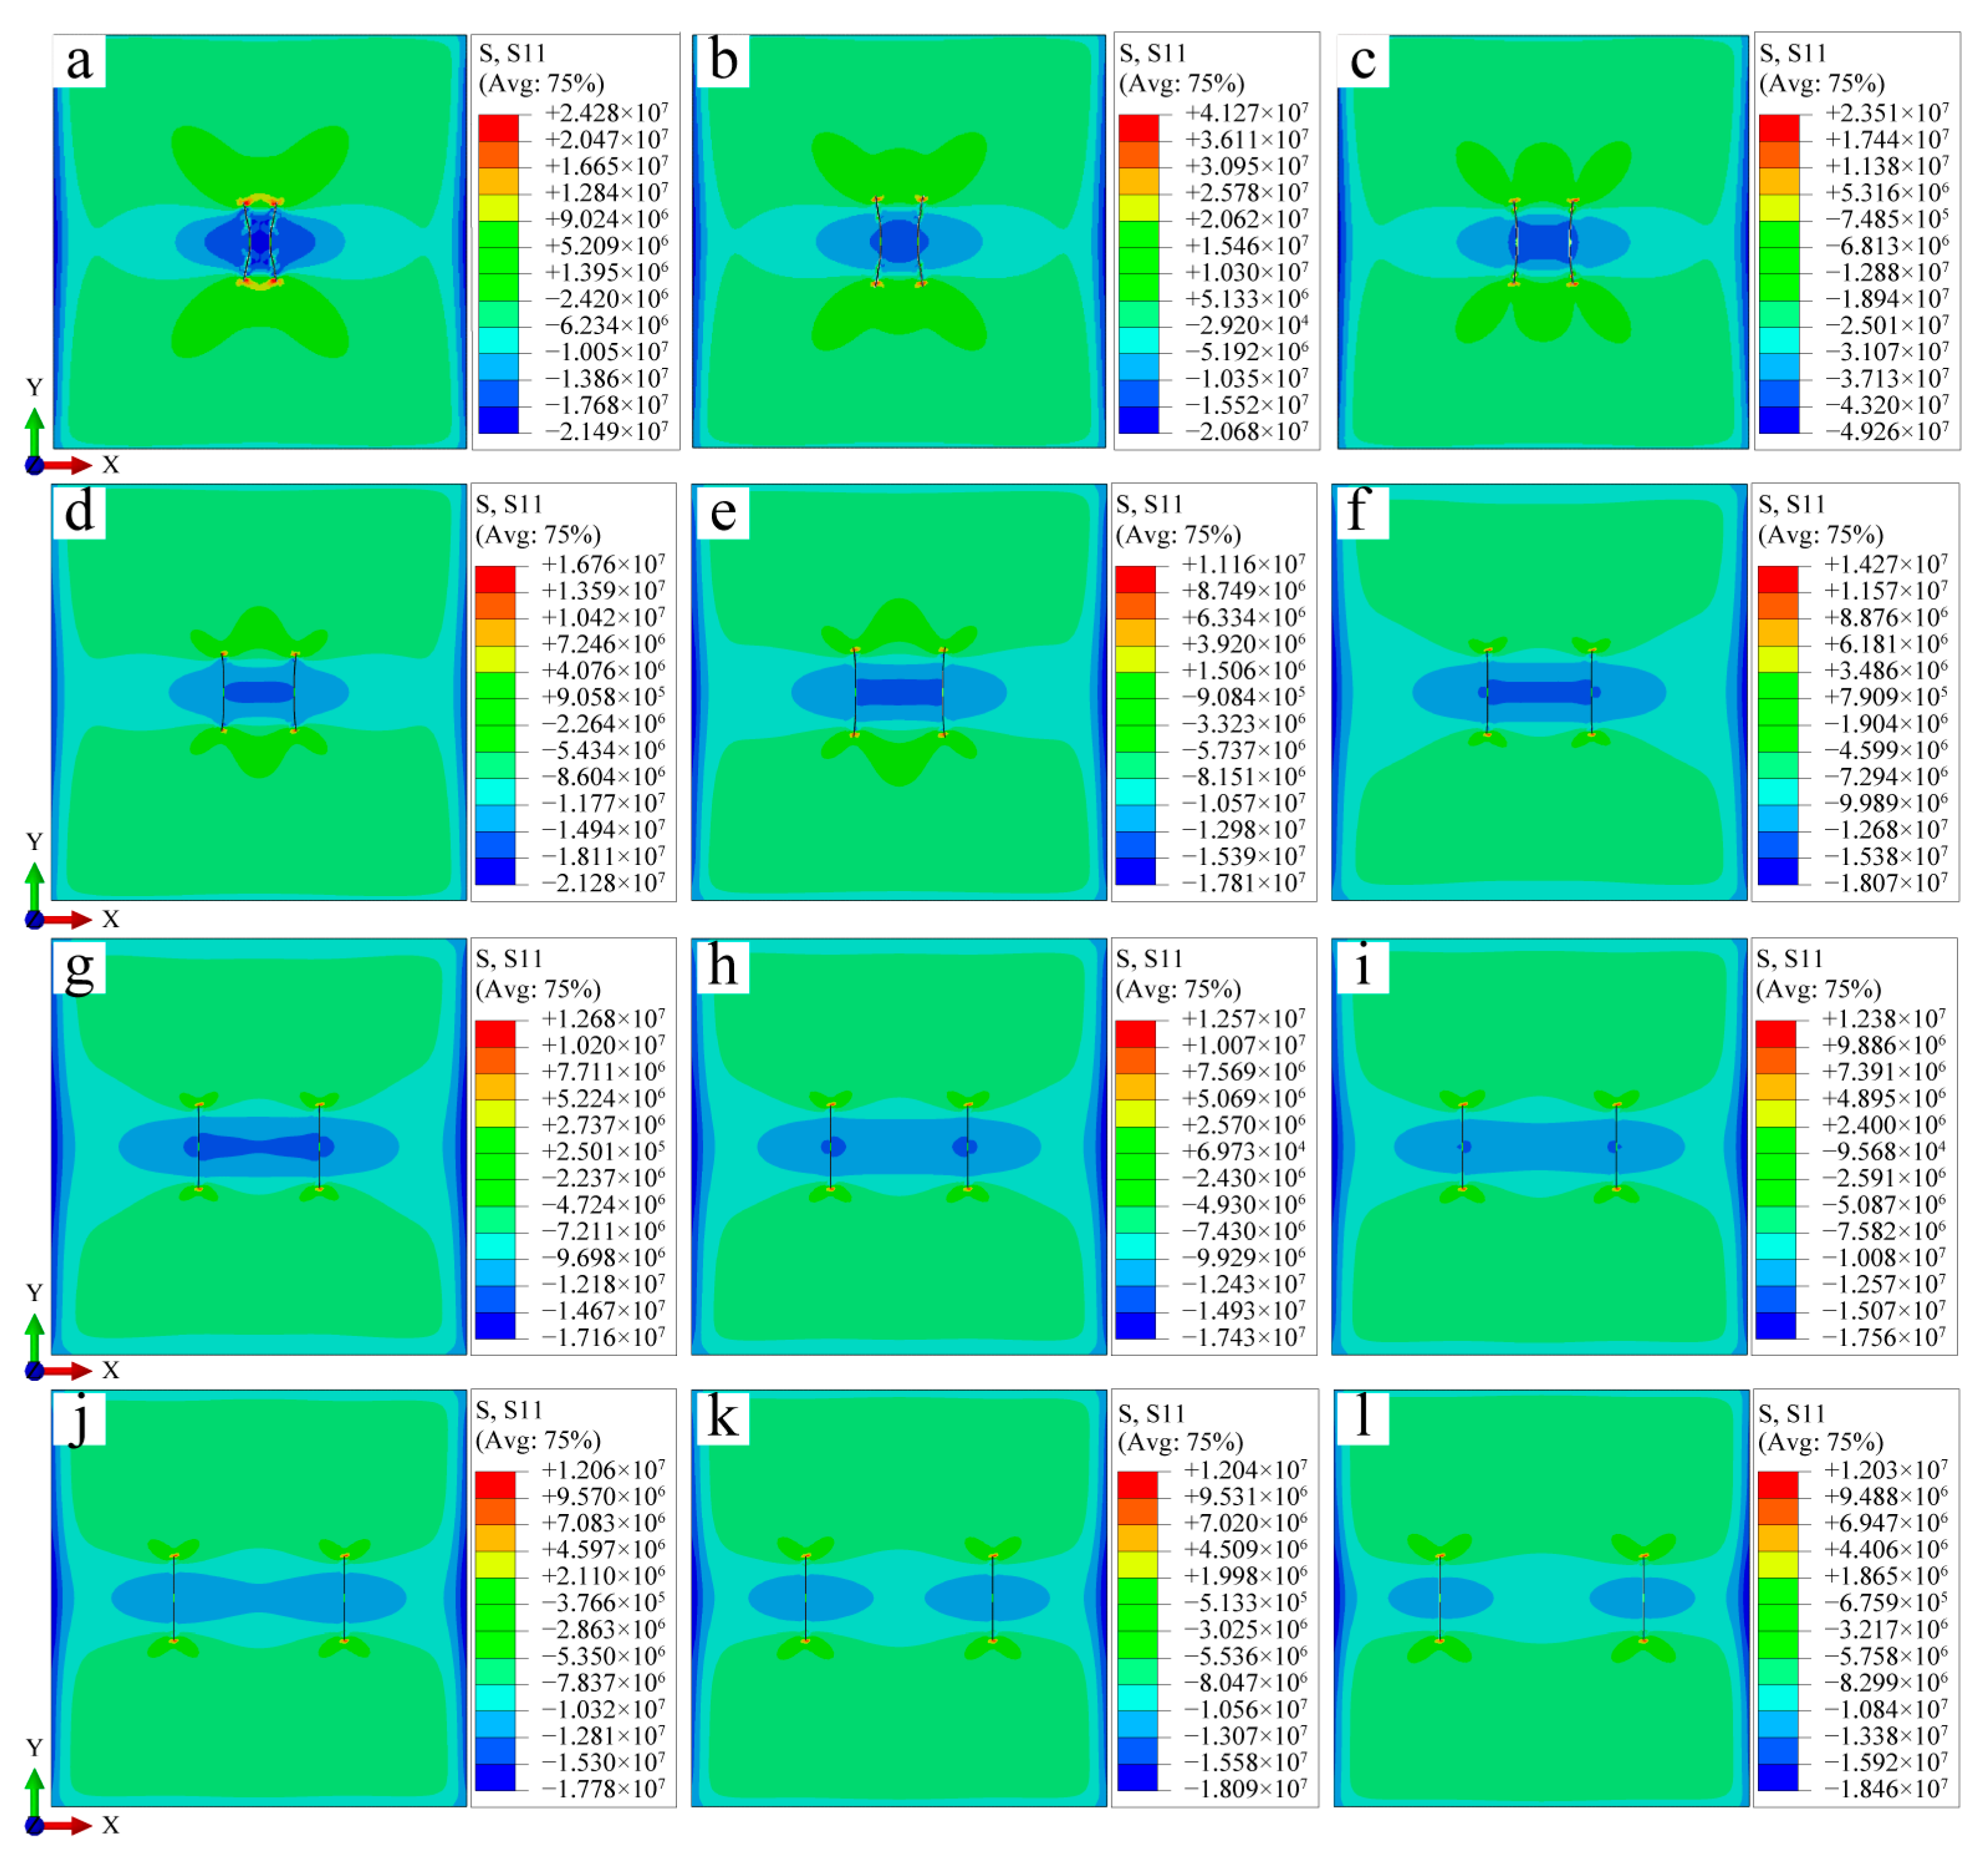
5.1. Stress Distribution
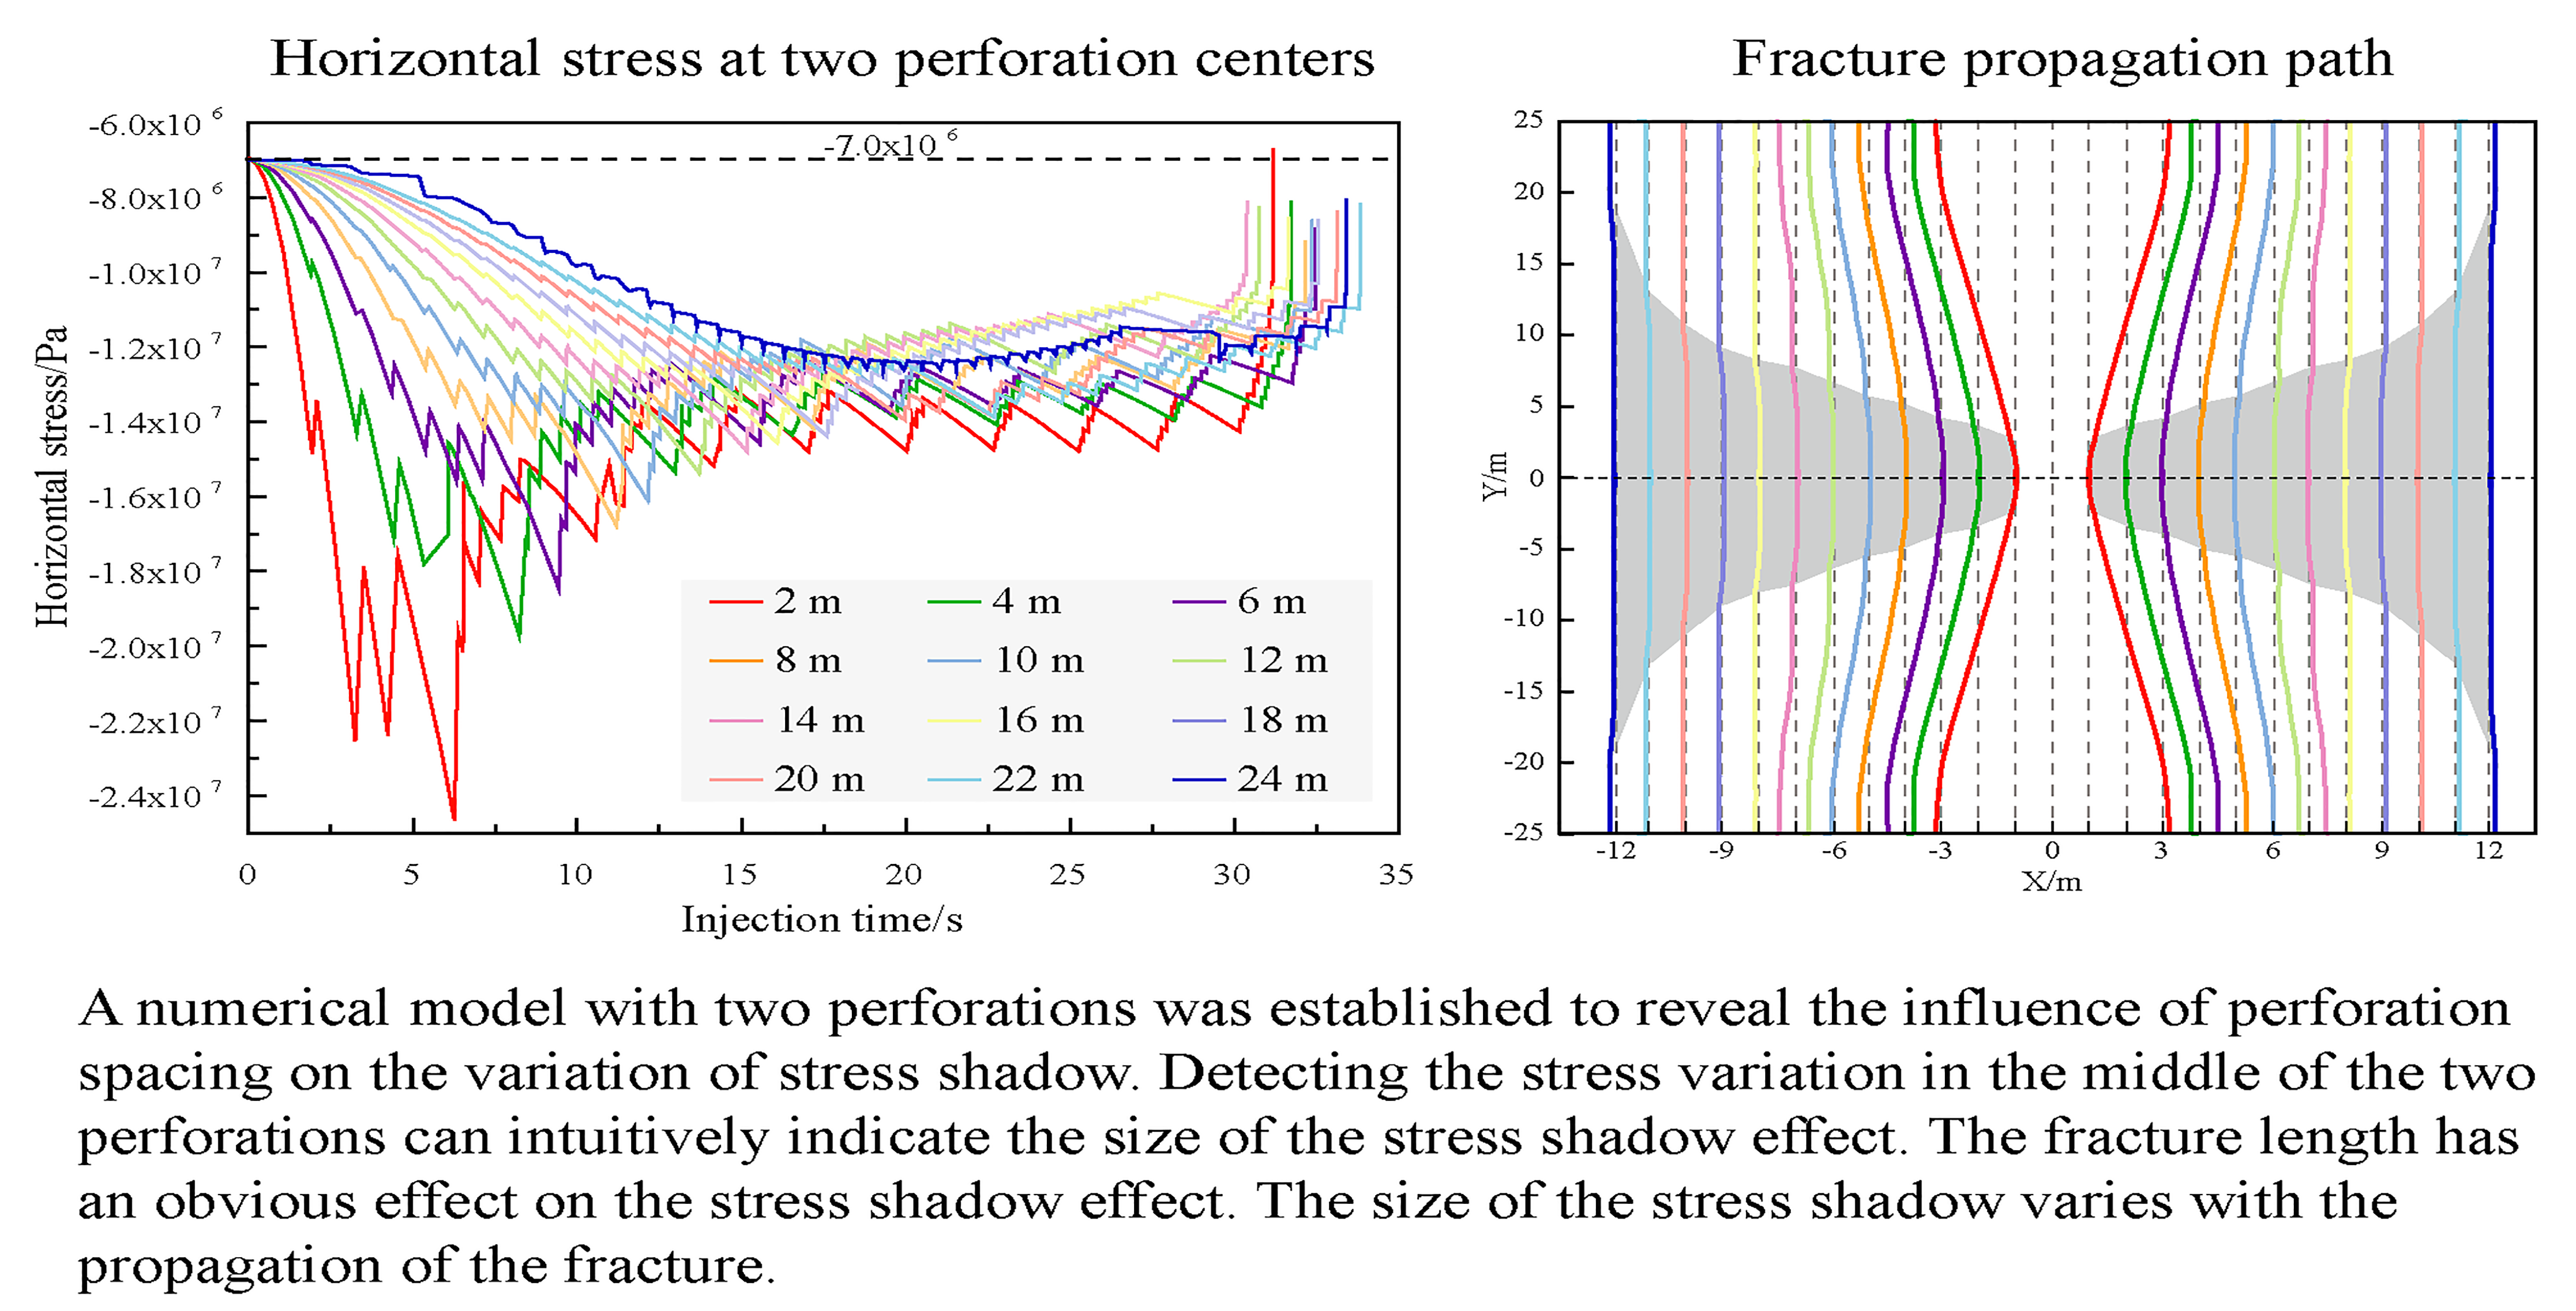
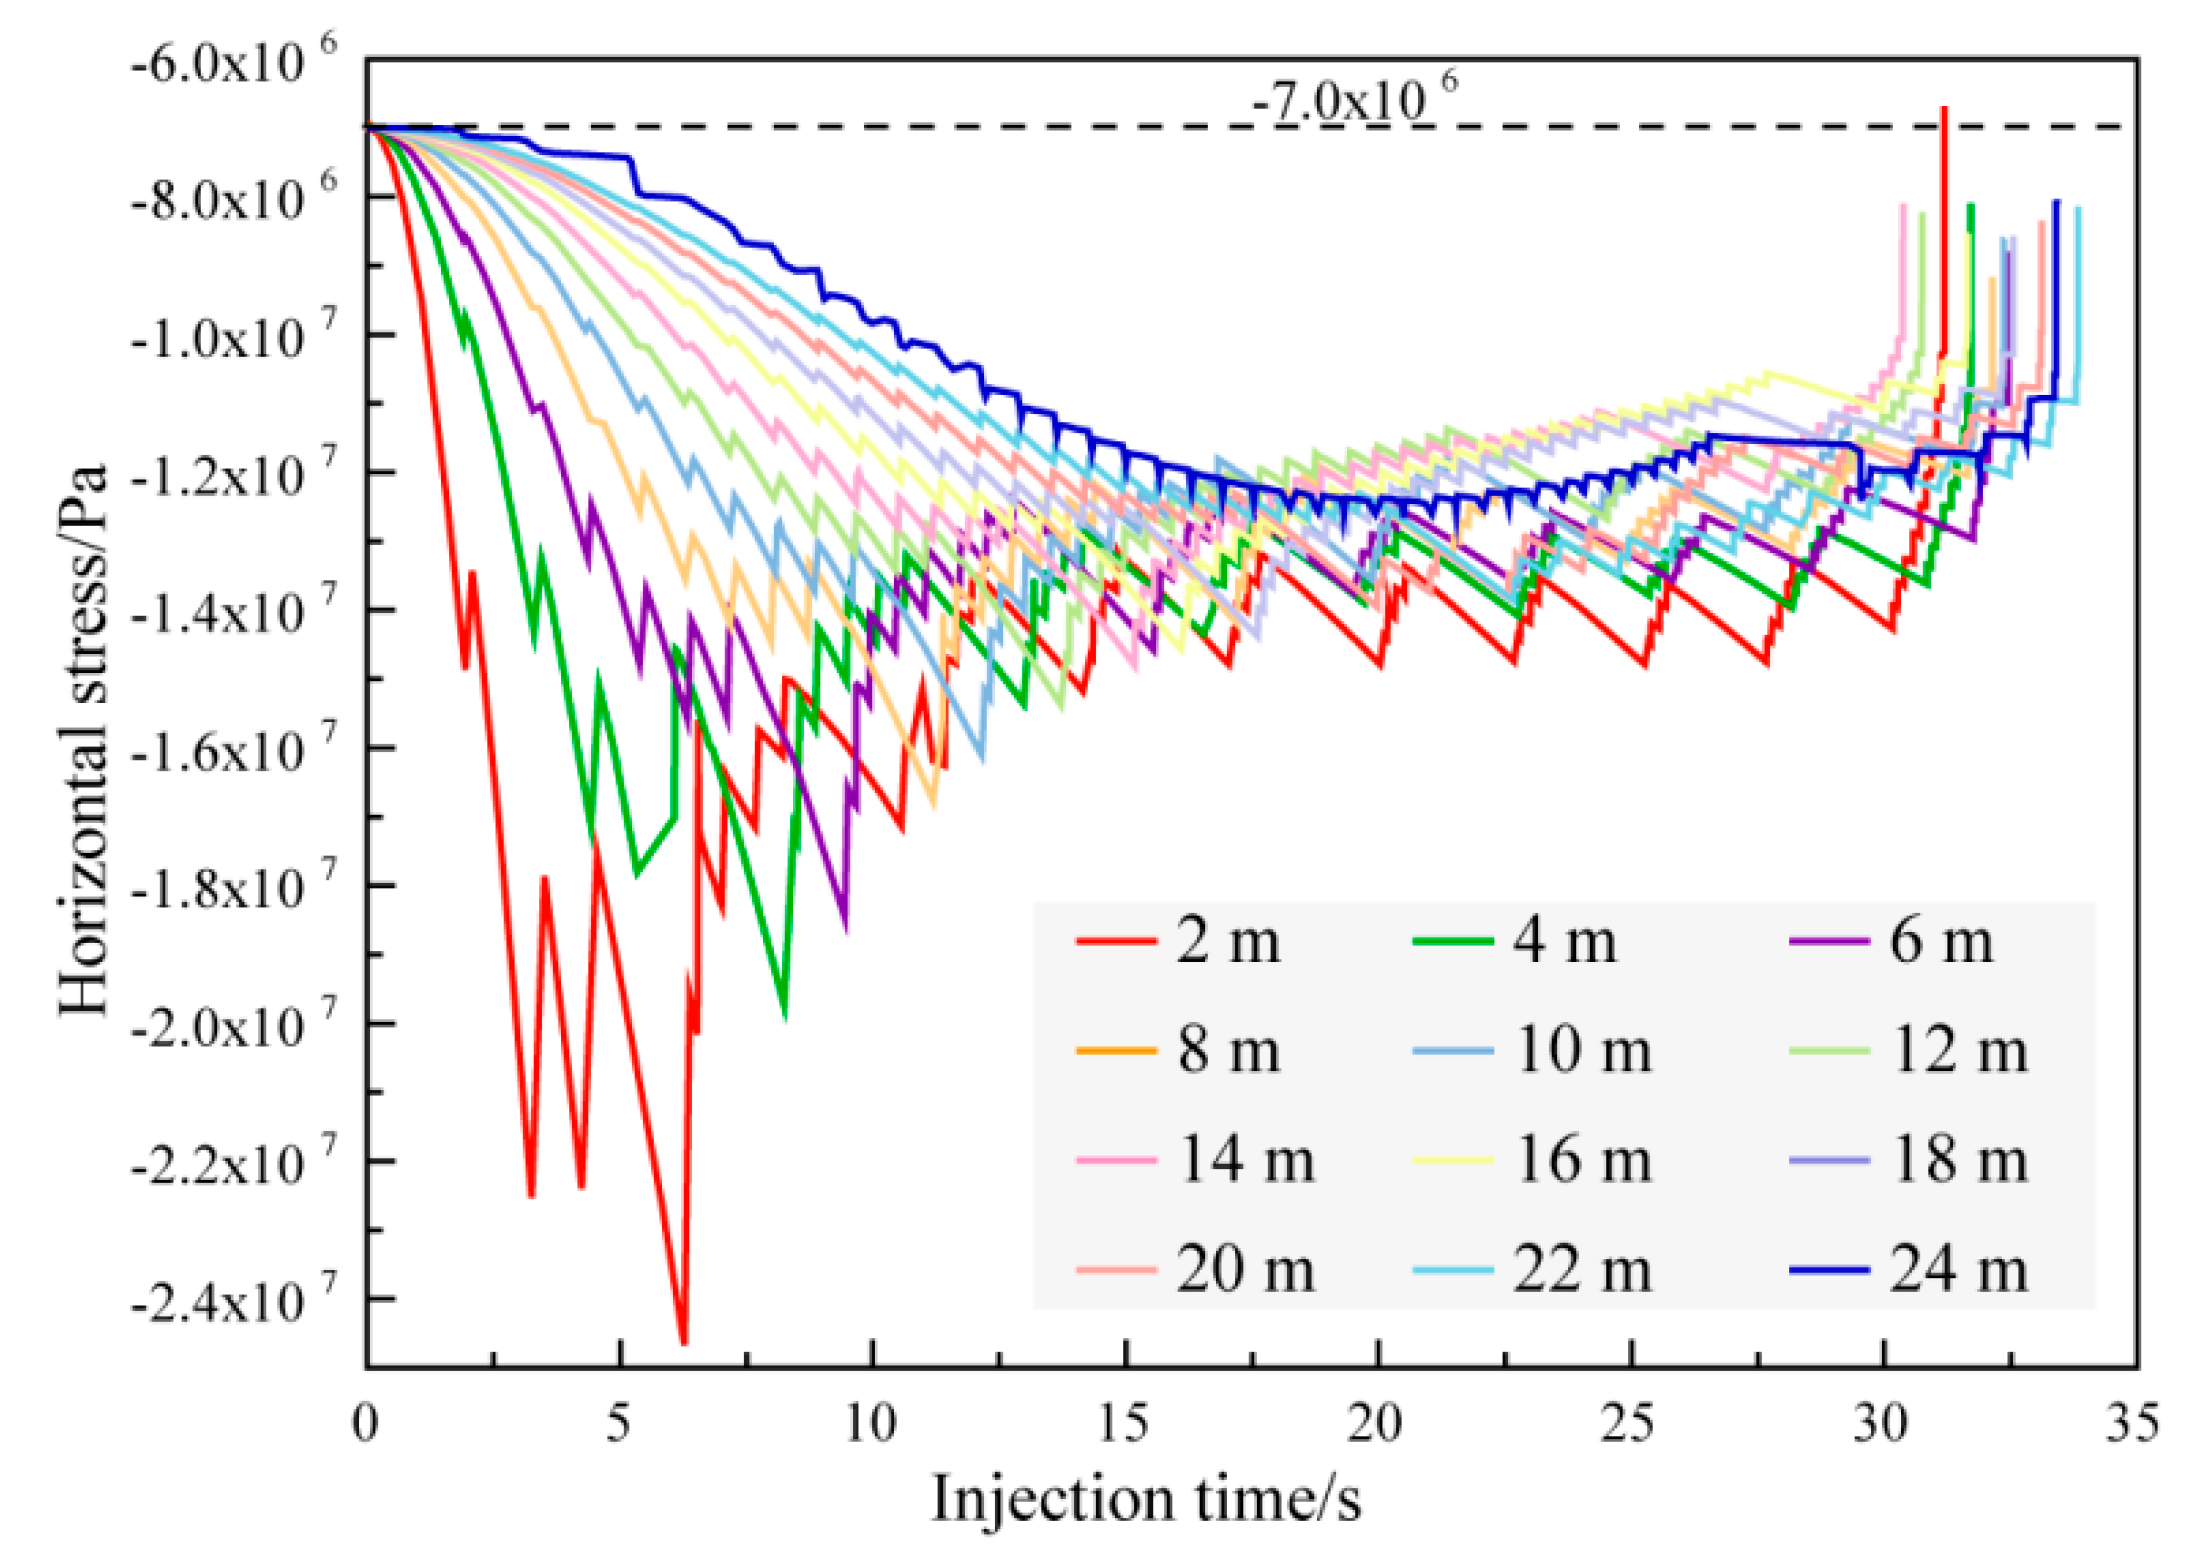
5.2. Stress at the Center of Two Perforations
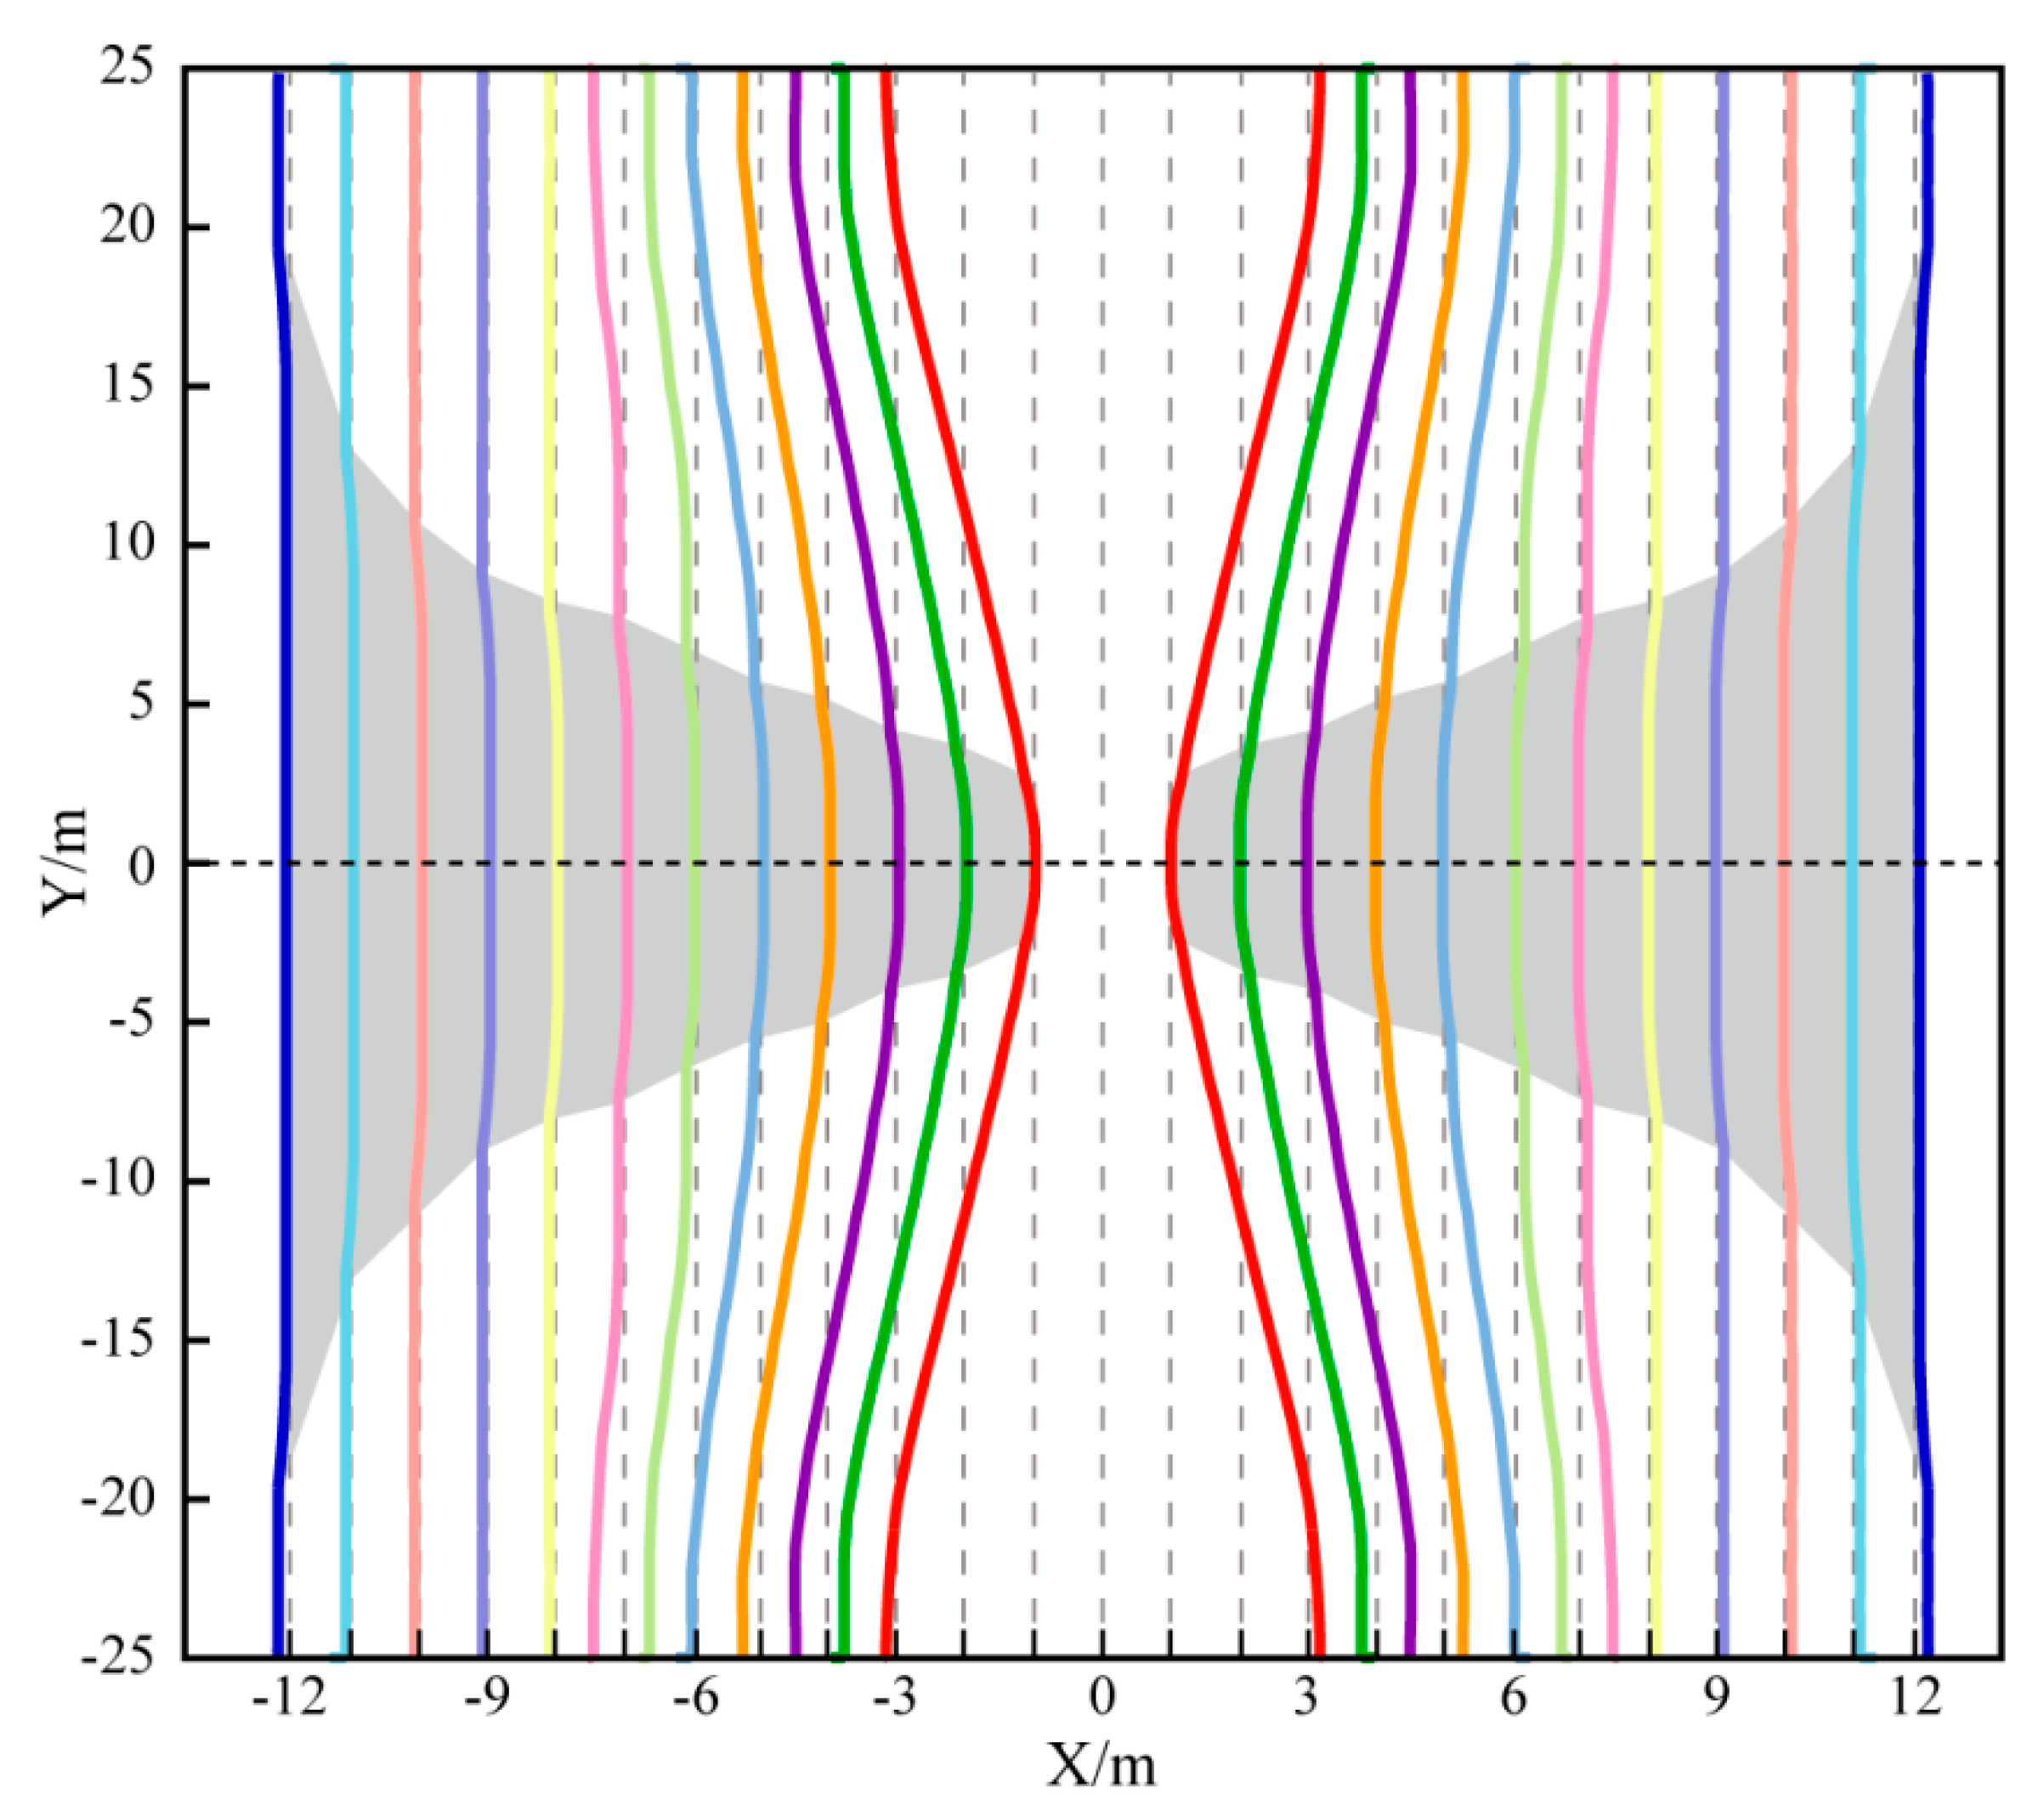
5.3. Fracture Propagation Path
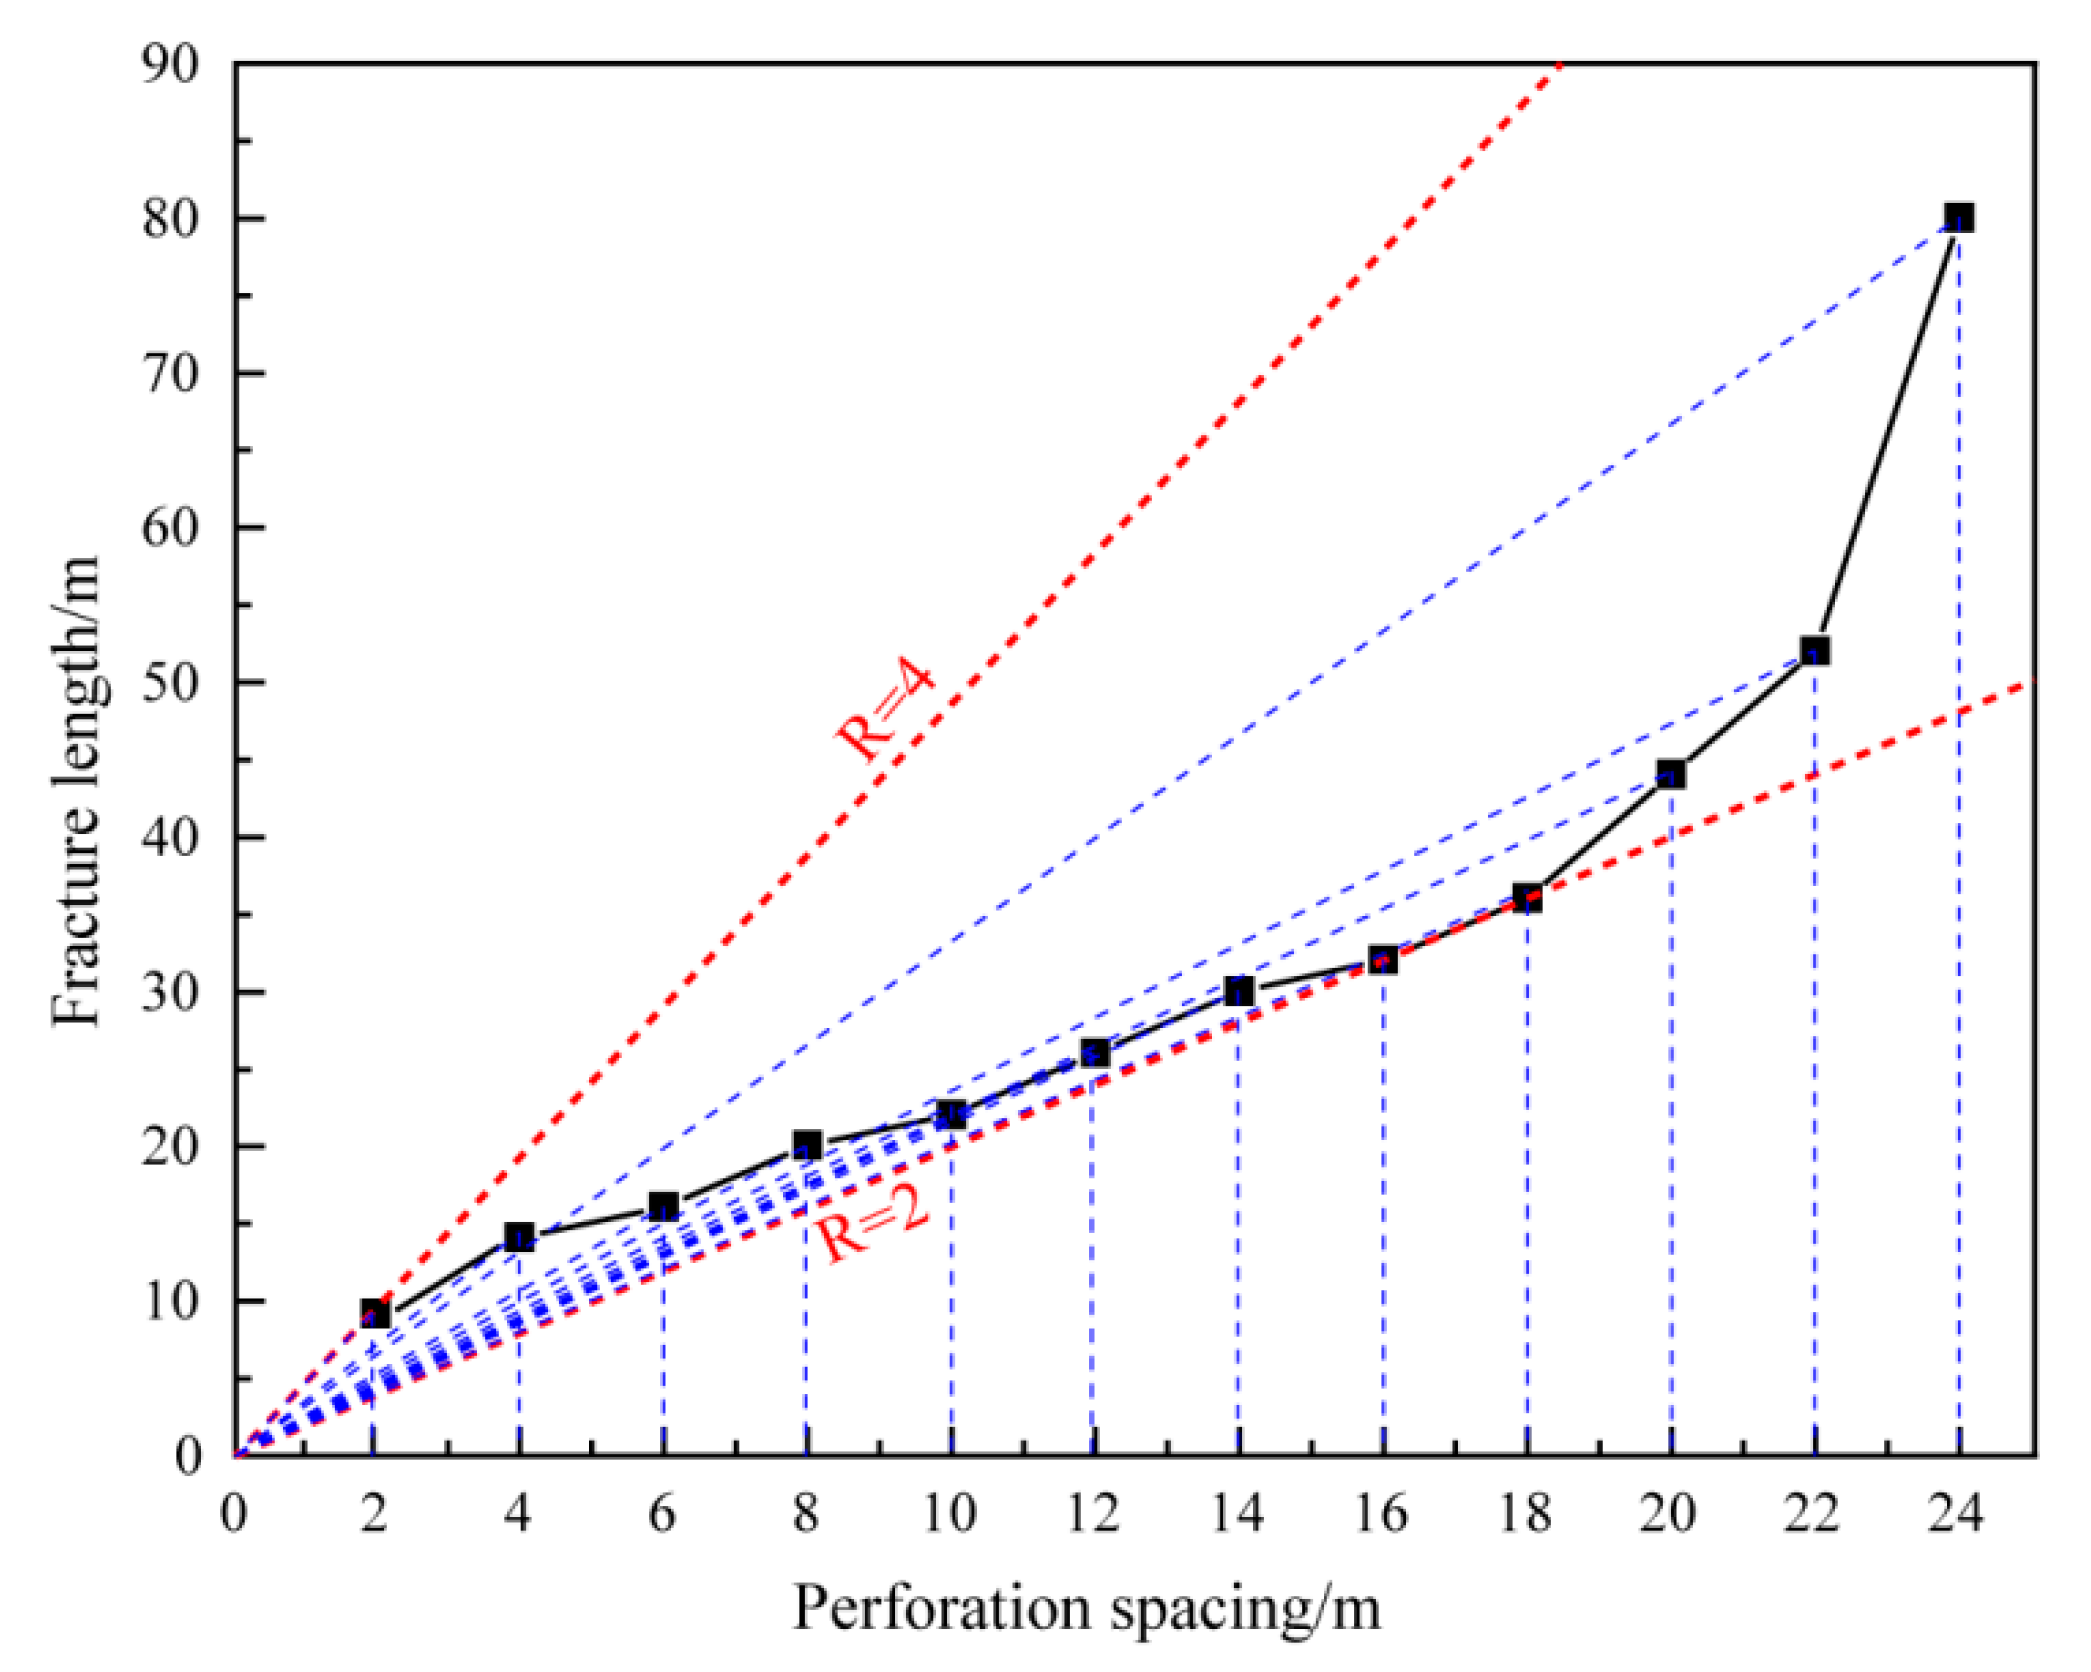
5.4. Fracture Length
6. Discussion
7. Conclusions
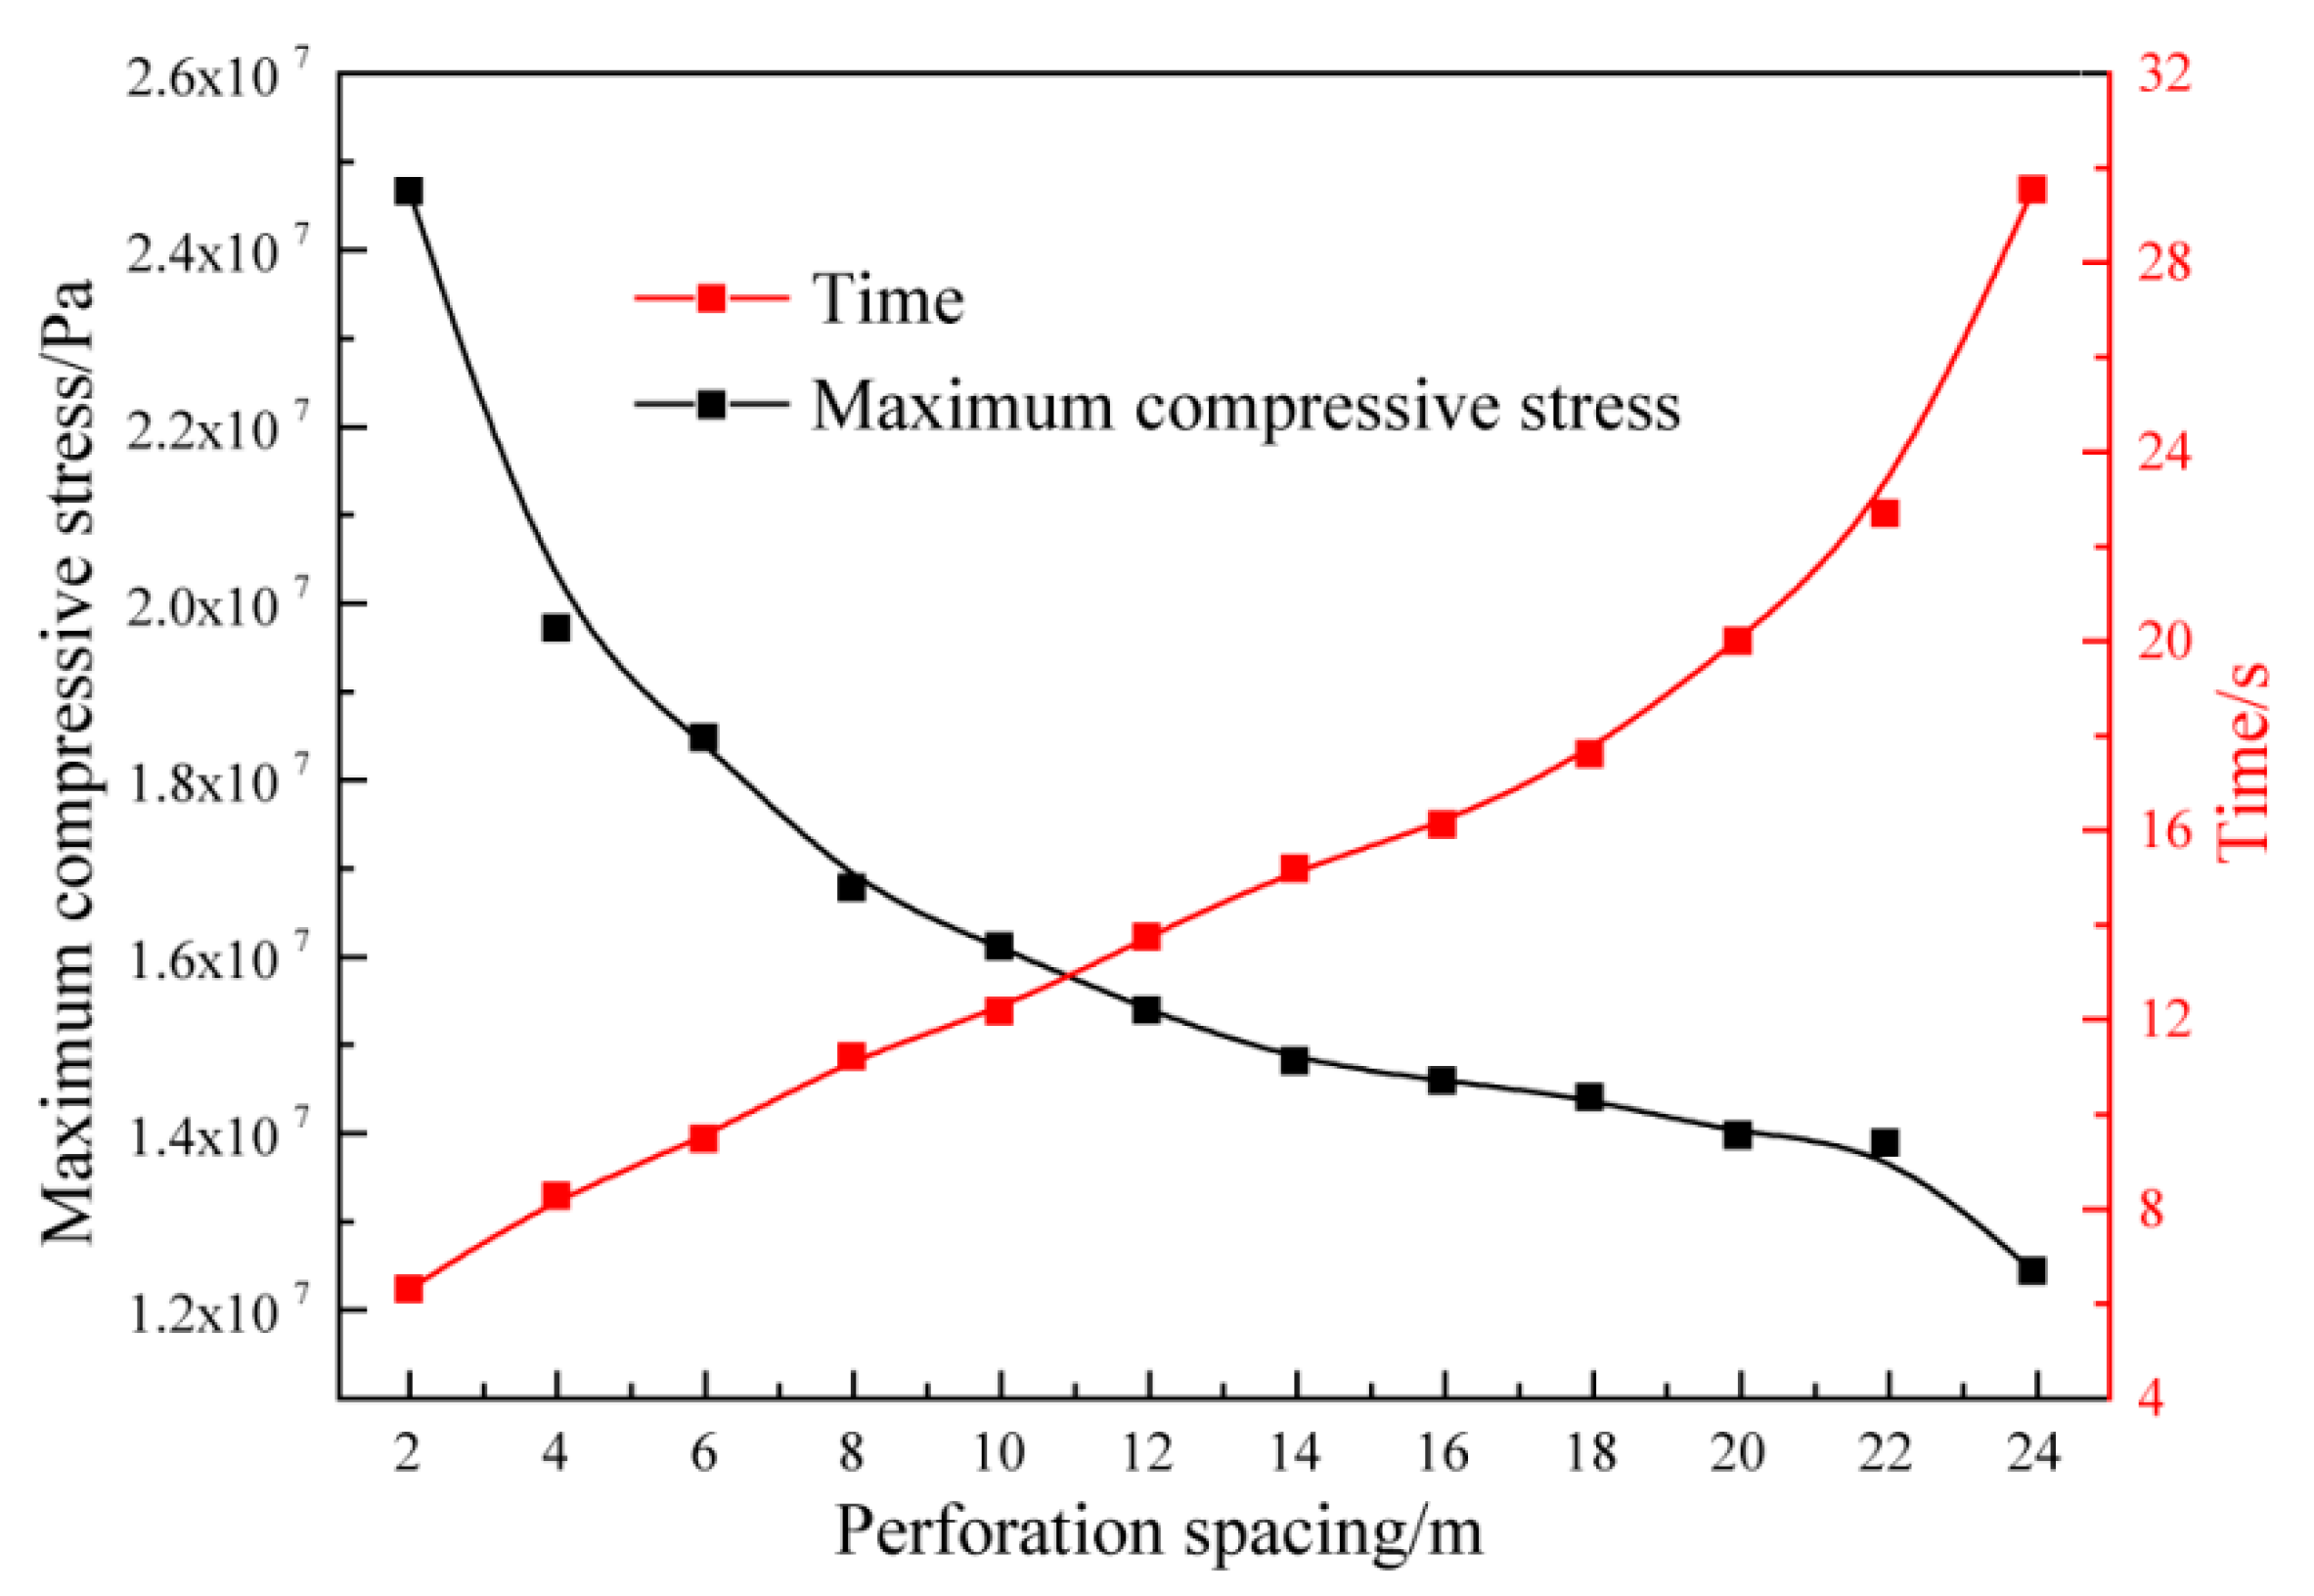
- The rock reservoir between the two perforations is always in a state of compressive stress. Additionally, the perforation spacing is small while the compressive stress value is large. The stress shadow effect can be quantitatively analyzed by using the compressive stress values at the two perforation centers.
- The size of the stress shadow varies with the fracturing process. Moreover, the size is more likely to be maximized at smaller perforation spacing.
- As the two fractures deviate from each other, fracture spacing increases continuously. When it enlarges to a particular value, the stress shadow effect begins to weaken until the in situ stress becomes the dominant factor again.
- The stress shadow effect will be strongest if the fracture length is 2.5 times the length of the perforation spacing.
- There is a perforation spacing that minimizes the initiation pressure, so this spacing can be used as a fracture design value. Furthermore, the positive effects of the stress shadow can be exploited by changing the fracturing sequence and controlling the perforation angle, thus increasing the fracture area and productivity.
Author Contributions
Funding
Conflicts of Interest
References
- Yuan, J.; Luo, D.; Feng, L. A review of the technical and economic evaluation techniques for shale gas development. Appl. Energy 2015, 148, 49–65. [Google Scholar] [CrossRef]
- Middleton, R.S.; Gupta, R.; Hyman, J.D.; Viswanathan, H.S. The shale gas revolution: Barriers, sustainability, and emerging opportunities. Appl. Energy 2017, 199, 88–95. [Google Scholar] [CrossRef]
- Roussel, N.P.; Sharma, M.M.J.S.P.; Operations. Optimizing fracture spacing and sequencing in horizontal-well fracturing. SPE Prod. Oper. 2011, 26, 173–184. [Google Scholar] [CrossRef]
- Zhou, J.; Zeng, Y.; Jiang, T.; Zhang, B. Laboratory scale research on the impact of stress shadow and natural fractures on fracture geometry during horizontal multi-staged fracturing in shale. Int. J. Rock Mech. Min. Sci. 2018, 107, 282–287. [Google Scholar] [CrossRef]
- Morrill, J.; Miskimins, J.L. Optimization of Hydraulic Fracture Spacing in Unconventional Shales. In Proceedings of the SPE Hydraulic Fracturing Technology Conference, The Woodlands, TX, USA, 1 January 2012; p. 12. [Google Scholar]
- Liu, C.; Liu, H.; Zhang, Y.; Deng, D.; Wu, H. Optimal spacing of staged fracturing in horizontal shale-gas well. J. Pet. Sci. Eng. 2015, 132, 86–93. [Google Scholar] [CrossRef]
- Yu, Y.; Zhu, W.; Li, L.; Wei, C.; Yan, B.; Li, S. Multi-fracture interactions during two-phase flow of oil and water in deformable tight sandstone oil reservoirs. J. Rock Mech. Geotech. Eng. 2020, 12, 821–849. [Google Scholar] [CrossRef]
- Kresse, O.; Weng, X.; Gu, H.; Wu, R. Numerical Modeling of Hydraulic Fractures Interaction in Complex Naturally Fractured Formations. Rock Mech. Rock Eng. 2013, 46, 555–568. [Google Scholar] [CrossRef]
- Zeng, Q.; Yao, J. Numerical simulation of fracture network generation in naturally fractured reservoirs. J. Nat. Gas Sci. Eng. 2016, 30, 430–443. [Google Scholar] [CrossRef]
- Weng, X.; Kresse, O.; Chuprakov, D.; Cohen, C.-E.; Prioul, R.; Ganguly, U. Applying complex fracture model and integrated workflow in unconventional reservoirs. J. Pet. Sci. Eng. 2014, 124, 468–483. [Google Scholar] [CrossRef]
- Vahab, M.; Khalili, N. X-FEM Modeling of Multizone Hydraulic Fracturing Treatments Within Saturated Porous Media. Rock Mech. Rock Eng. 2018, 51, 3219–3239. [Google Scholar] [CrossRef]
- Khoei, A.R.; Vahab, M.; Hirmand, M. An enriched–FEM technique for numerical simulation of interacting discontinuities in naturally fractured porous media. Comput. Methods Appl. Mech. Eng. 2017, 331, 197–231. [Google Scholar] [CrossRef]
- Taghichian, A.; Hashemalhoseini, H.; Zaman, M.; Beheshti Zavareh, S. Propagation and aperture of staged hydraulic fractures in unconventional resources in toughness-dominated regimes. J. Rock Mech. Geotech. Eng. 2018, 10, 249–258. [Google Scholar] [CrossRef]
- Qi, M.; Li, M.; Li, Y.; Guo, T.; Gao, S. Numerical simulation of horizontal well network fracturing in glutenite reservoir. Oil Gas Sci. Technol. Rev. d’IFP Energ. Nouv. 2018, 73. [Google Scholar] [CrossRef]
- Luo, W.; Li, H.-T.; Wang, Y.-Q.; Wang, J.-C.; Zhu, S.-Y. A New Completion Methodology to Improve Oil Recovery for Horizontal Wells Completed in Highly Heterogeneous Reservoirs. Arab. J. Sci. Eng. 2014, 39, 9227–9237. [Google Scholar] [CrossRef]
- Ghaderi, S.M.; Clarkson, C.R.; Kaviani, D. Investigation of Primary Recovery in Low-Permeability Oil Formations: A Look at the Cardium Formation, Alberta (Canada). Oil Gas Sci. Technol. Rev. d’IFP Energ. Nouv. 2013, 69, 1155–1170. [Google Scholar] [CrossRef] [Green Version]
- Peirce, A.; Bunger, A. Interference Fracturing: Nonuniform Distributions of Perforation Clusters That Promote Simultaneous Growth of Multiple Hydraulic Fractures. SPE-172500-PA 2015, 20, 384–395. [Google Scholar] [CrossRef] [Green Version]
- Salimzadeh, S.; Usui, T.; Paluszny, A.; Zimmerman, R.W. Finite element simulations of interactions between multiple hydraulic fractures in a poroelastic rock. Int. J. Rock Mech. Min. Sci. 2017, 99, 9–20. [Google Scholar] [CrossRef] [Green Version]
- Belytschko, T.; Black, T. Elastic crack growth in finite elements with minimal remeshing. Int. J. Numer. Methods Eng. 1999, 45, 601–620. [Google Scholar] [CrossRef]
- Stolarska, M.; Chopp, D.L.; Moës, N.; Belytschko, T. Modelling crack growth by level sets in the extended finite element method. Int. J. Numer. Methods Eng. 2001, 51, 943–960. [Google Scholar] [CrossRef]
- Han, W.; Cui, Z.; Zhang, J. Fracture path interaction of two adjacent perforations subjected to different injection rate increments. Comput. Geotech. 2020, 122, 103500. [Google Scholar] [CrossRef]
- ABAQUS. Analysis Techniques, Modeling Abstractions. In Abaqus Documentation; Version 2017; ABAQUS: Paris, France, 2017. [Google Scholar]
- Wu, R.; Kresse, O.; Weng, X.; Cohen, C.-E.; Gu, H. Modeling of Interaction of Hydraulic Fractures in Complex Fracture Networks. In Proceedings of the SPE Hydraulic Fracturing Technology Conference, The Woodlands, TX, USA, 1 January 2012; p. 14. [Google Scholar]
- Zhang, Z.; Li, X.; He, J.; Wu, Y.; Li, G. Numerical study on the propagation of tensile and shear fracture network in naturally fractured shale reservoirs. J. Nat. Gas Sci. Eng. 2017, 37, 1–14. [Google Scholar] [CrossRef]
- Wu, K.; Olson, J.E. Simultaneous Multifracture Treatments: Fully Coupled Fluid Flow and Fracture Mechanics for Horizontal Wells. SPE-172500-PA 2015, 20, 337–346. [Google Scholar] [CrossRef]
- Nagel, N.B.; Sanchez-Nagel, M.A.; Zhang, F.; Garcia, X.; Lee, B. Coupled Numerical Evaluations of the Geomechanical Interactions Between a Hydraulic Fracture Stimulation and a Natural Fracture System in Shale Formations. Rock Mech. Rock Eng. 2013, 46, 581–609. [Google Scholar] [CrossRef]
- Crosby, D.G.; Rahman, M.M.; Rahman, M.K.; Rahman, S.S. Single and multiple transverse fracture initiation from horizontal wells. J. Pet. Sci. Eng. 2002, 35, 191–204. [Google Scholar] [CrossRef]
- Haimson, B.; Fairhurst, C. Initiation and extension of hydraulic fractures in rocks. Soc. Pet. Eng. J. 1967, 7, 310–318. [Google Scholar] [CrossRef]
- Huang, J.; Griffiths, D.V.; Wong, S.-W. Initiation pressure, location and orientation of hydraulic fracture. Int. J. Rock Mech. Min. Sci. 2012, 49, 59–67. [Google Scholar] [CrossRef]
- Yang, H.; Wang, R.; Zhou, W.; Li, L.; Chen, F. A study of influencing factors on fracture initiation pressure of cemented sliding sleeve fracturing. J. Nat. Gas Sci. Eng. 2014, 18, 219–226. [Google Scholar] [CrossRef]
- Cheng, Y.; Zhang, Y. Experimental study of fracture propagation: The application in energy mining. Energies 2020, 13, 1411. [Google Scholar] [CrossRef] [Green Version]
- Guo, Y.; Deng, P.; Yang, C.; Chang, X.; Wang, L.; Zhou, J. Experimental investigation on hydraulic fracture propagation of carbonate rocks under different fracturing fluids. Energies 2018, 11, 3502. [Google Scholar] [CrossRef] [Green Version]
- Yang, H.L.; Shen, R.C.; Fu, L. Composition and mechanical properties of gas shale. Pet. Drill. Tech. 2013, 41, 31–35. [Google Scholar]
- Han, W.; Cui, Z.; Tang, T.; Zhang, J.; Wang, Y. Effects of different bedding plane strength on crack propagation process under three points bending. J. China Coal Soc. 2019, 44, 3022–3030. (In Chinese) [Google Scholar]
- Janiszewski, M.; Shen, B.; Rinne, M. Simulation of the interactions between hydraulic and natural fractures using a fracture mechanics approach. J. Rock Mech. Geotech. Eng. 2019, 11, 1138–1150. [Google Scholar] [CrossRef]
- Cui, Z.; Han, W. In situ scanning electron microscope (SEM) observations of damage and crack growth of shale. Microsc. Microanal. 2018, 24, 107–115. [Google Scholar] [CrossRef] [PubMed]
- Meng, Q.-X.; Xu, W.-Y.; Wang, H.-L.; Zhuang, X.-Y.; Xie, W.-C.; Rabczuk, T. DigiSim—An Open Source Software Package for Heterogeneous Material Modeling Based on Digital Image Processing. Adv. Eng. Softw. 2020, 148, 102836. [Google Scholar] [CrossRef]
- Wang, L.; Liu, J.-F.; Pei, J.-L.; Xu, H.-N.; Bian, Y. Mechanical and permeability characteristics of rock under hydro-mechanical coupling conditions. Environ. Earth Sci. 2015, 73, 5987–5996. [Google Scholar] [CrossRef]
- Li, B.; Bao, R.; Wang, Y.; Liu, R.; Zhao, C. Permeability Evolution of Two-Dimensional Fracture Networks During Shear Under Constant Normal Stiffness Boundary Conditions. Rock Mech. Rock Eng. 2021, 54, 409–428. [Google Scholar] [CrossRef]
- Zhang, F.; Nagel, N.; Lee, B.; Sanchez-Nagel, M. The Influence of Fracture Network Connectivity on Hydraulic Fracture Effectiveness and Microseismicity Generation. In Proceedings of the 47th U.S. Rock Mechanics/Geomechanics Symposium, San Francisco, CA, USA, 1 January 2013; p. 13. [Google Scholar]
- Zhang, F.; Dontsov, E.; Mack, M. Fully coupled simulation of a hydraulic fracture interacting with natural fractures with a hybrid discrete-continuum method. Int. J. Numer. Anal. Methods Geomech. 2017, 41, 1430–1452. [Google Scholar] [CrossRef]
- Hou, B.; Chen, M.; Cheng, W.; Diao, C. Investigation of Hydraulic Fracture Networks in Shale Gas Reservoirs with Random Fractures. Arab. J. Sci. Eng. 2016, 41, 2681–2691. [Google Scholar] [CrossRef]


| Parameter | Units | Value |
|---|---|---|
| Elastic modulus E | GPa | 27 |
| Poisson’s ratio | - | 0.23 |
| Tensile strength | MPa | 10 |
| Maximum horizontal stress σH | MPa | 18 |
| Minimum horizontal stress σh | MPa | 12 |
| Fluid leak off | m/Pa·s | 1 × 10⁻¹⁴ |
| Void ratio | % | 5 |
| Permeability | m/s | 1 × 10⁻⁷ |
| Injection rate | m3/s | 0.01 |
| Fluid viscosity | Pa·s | 1 × 10⁻³ |
Publisher’s Note: MDPI stays neutral with regard to jurisdictional claims in published maps and institutional affiliations. |
© 2021 by the authors. Licensee MDPI, Basel, Switzerland. This article is an open access article distributed under the terms and conditions of the Creative Commons Attribution (CC BY) license (https://creativecommons.org/licenses/by/4.0/).
Share and Cite
Han, W.; Cui, Z.; Zhu, Z. The Effect of Perforation Spacing on the Variation of Stress Shadow. Energies 2021, 14, 4040. https://doi.org/10.3390/en14134040
Han W, Cui Z, Zhu Z. The Effect of Perforation Spacing on the Variation of Stress Shadow. Energies. 2021; 14(13):4040. https://doi.org/10.3390/en14134040
Chicago/Turabian StyleHan, Weige, Zhendong Cui, and Zhengguo Zhu. 2021. "The Effect of Perforation Spacing on the Variation of Stress Shadow" Energies 14, no. 13: 4040. https://doi.org/10.3390/en14134040
APA StyleHan, W., Cui, Z., & Zhu, Z. (2021). The Effect of Perforation Spacing on the Variation of Stress Shadow. Energies, 14(13), 4040. https://doi.org/10.3390/en14134040