Article

Experimental Investigation of the Dynamic Tensile Properties of Naturally Saturated Rocks Using the Coupled Static–Dynamic Flattened Brazilian Disc Method

State Key Laboratory of Hydraulics and Mountain River Engineering, College of Water Resource and Hydropower, Sichuan University, Chengdu 610065, China
*
Author to whom correspondence should be addressed.
Energies 2021, 14(16), 4784; https://doi.org/10.3390/en14164784
Submission received: 12 July 2021 / Revised: 30 July 2021 / Accepted: 4 August 2021 / Published: 6 August 2021

Abstract

:
In a naturally saturated state, rocks are likely to be in a stress field simultaneously containing static and dynamic loads. Since rocks are more vulnerable to tensile loads, it is significant to characterize the tensile properties of naturally saturated rocks under coupled static–dynamic loads. In this study, dynamic flattened Brazilian disc (FBD) tensile tests were conducted on naturally saturated sandstone under static pre-tension using a modified split-Hopkinson pressure bar (SHPB) device. Combining high-speed photographs with digital image correlation (DIC) technology, we can observe the variation of strain applied to specimens’ surfaces, including the central crack initiation. The experimental results indicate that the dynamic tensile strength of naturally saturated specimens increases with an increase in loading rate, but with the pre-tension increases, the dynamic strength at a certain loading rate decreases accordingly. Moreover, the dynamic strength of naturally saturated sandstone is found to be lower than that of natural sandstone. The fracture behavior of naturally saturated and natural specimens is similar, and both exhibit obvious tensile cracks. The comprehensive micromechanism of water effects concerning the dynamic tensile behavior of rocks with static preload can be explained by the weakening effects of water on mechanical properties, the water wedging effect, and the Stefan effect.

Graphical Abstract

1. Introduction

Deep rocks are usually faced with complicated geoenvironments with multifield or multiscale coupling, such as thermomechanical coupling, groundwater disturbance, and static–dynamic load coupling [1,2,3,4,5]. Rocks in deep engineering are not only subjected to static loads caused by gravity stress and tectonic stress, but also affected by dynamic loads, generally induced by earthquakes, excavation, blasting, and drilling [6,7,8,9]. There is a general consensus that the water evidently weakens the mechanical properties of rocks, which may pose potential hazards to rock engineering [10,11,12,13]. Moreover, rocks are quite vulnerable to tensile loads, and their tensile strength is exceedingly low compared to their compressive strength [14,15]. Therefore, under simultaneous dynamic and static loads, characterizing the tensile behavior of naturally saturated rock is crucial for the stability assessment and construction safety of underground rock structures.
For brittle rocks, the object of existing studies mainly concerns the tensile properties under pure static or dynamic loadings, by conducting direct or indirect tensile tests [16,17,18]. For the direct tensile tests, the stress concentration always occurs around the gripping areas, causing partial damage to rock specimens. Moreover, it is difficult to keep the clamping device and rock specimen axis coincident, which induces bending moments in the specimen and causes measurement deviation. To avoid such fatal defects in direct tensile tests, some indirect methods have been proposed, and the Brazilian disc (BD) test is recommended by the International Society for Rock Mechanics (ISRM) to gauge the tensile strength of rocks [19,20,21,22,23]. For the BD testing method, the appearance of a central crack is a very eventful factor to validly calculate the tensile strength of rocks [24]. Since high stress concentration always appears around the contact area between the specimen’s periphery and the loading plates in BD experiments, observation of the central crack’s initiation cannot always be guaranteed [25]. To meet the prerequisite of central crack initiation in BD tests, researchers made some modifications to the loading devices, including using a curved loading jaw and adding cushions to the loading plates [17]. However, these modifications greatly complicate the BD tests. Alternatively, another convenient method is to change the shape of the BD specimen. To reasonably change the specimen’s shape, Wang et al. [26] cut the two ends of the disc into a platform shape—namely, a flattened Brazilian disc (FBD) specimen—so as to reliably ensure the central crack’s initiation. By selecting a proper loading angle (2α) between 20° and 30°, it can be well guaranteed to observe the central crack’s initiation in the FBD testing method [27]. Subsequently, the FBD method was proposed to conduct dynamic tensile tests, and it has proven suitable to gauge the dynamic tensile strength of rocks via this indirect method [28,29].
Previous studies have revealed that for brittle materials, the capacity for resisting external force differs significantly between pure static or dynamic loads; that is, the dynamic strength is significantly greater than the static strength [7,8,25]. Additionally, a great deal of literature on rocks related to the tensile response devotes attention to static or dynamic tensile loading tests, with little attention paid to coupled dynamic–static tensile loading tests. Zhou et al. [30] explored the dynamic behavior of BD specimens under simultaneous dynamic and static loads, and pointed out that the dynamic tensile strength decreases with pre-static load. Wu et al. [31] applied coupled static–dynamic loads to BD specimens and revealed that the dynamic tensile strength goes up with the loading rate, and that the influence of pre-tension on total tensile strength can be negligible. Recently, Pei et al. [32] proposed a novel flattened Brazilian disc (FBD) testing method for rocks under simultaneous dynamic and static loads, measuring the tensile behavior of sandstone at a certain pre-static load and loading rate through experiments and numerical simulations.
The investigations reviewed above were focused on natural rocks, yet the tensile behavior of naturally saturated rocks under coupled dynamic–static loading has never been reported. Since underground water significantly affects the physical and mechanical properties of rocks, sufficient attention should be applied to the dynamic tensile response of saturated sandstone at various static pre-tensions [5,33,34]. In this study, the dynamic FBD test method was adopted for naturally saturated sandstone under static pre-compression via a modified SHPB system. Under conditions of simultaneous dynamic and static loading, the tensile properties and fracturing behavior of naturally saturated sandstone were investigated, and the comprehensive effects of water on the dynamic tensile properties of naturally saturated FBD sandstone are discussed. The structure of this paper is as follows: there is a brief introduction of the SHPB system, the test method for rocks under simultaneous dynamic and static loads, and the preparation of the naturally saturated FBD specimen in Section 2; Section 3 reports the experimental results, including dynamic force equilibrium, central crack initiation, and dynamic tensile strength; Section 4 discusses the micromechanism of water effects on the dynamic tensile properties and fracturing behavior of naturally saturated sandstone; the summary is presented in Section 5.

2. Methodology

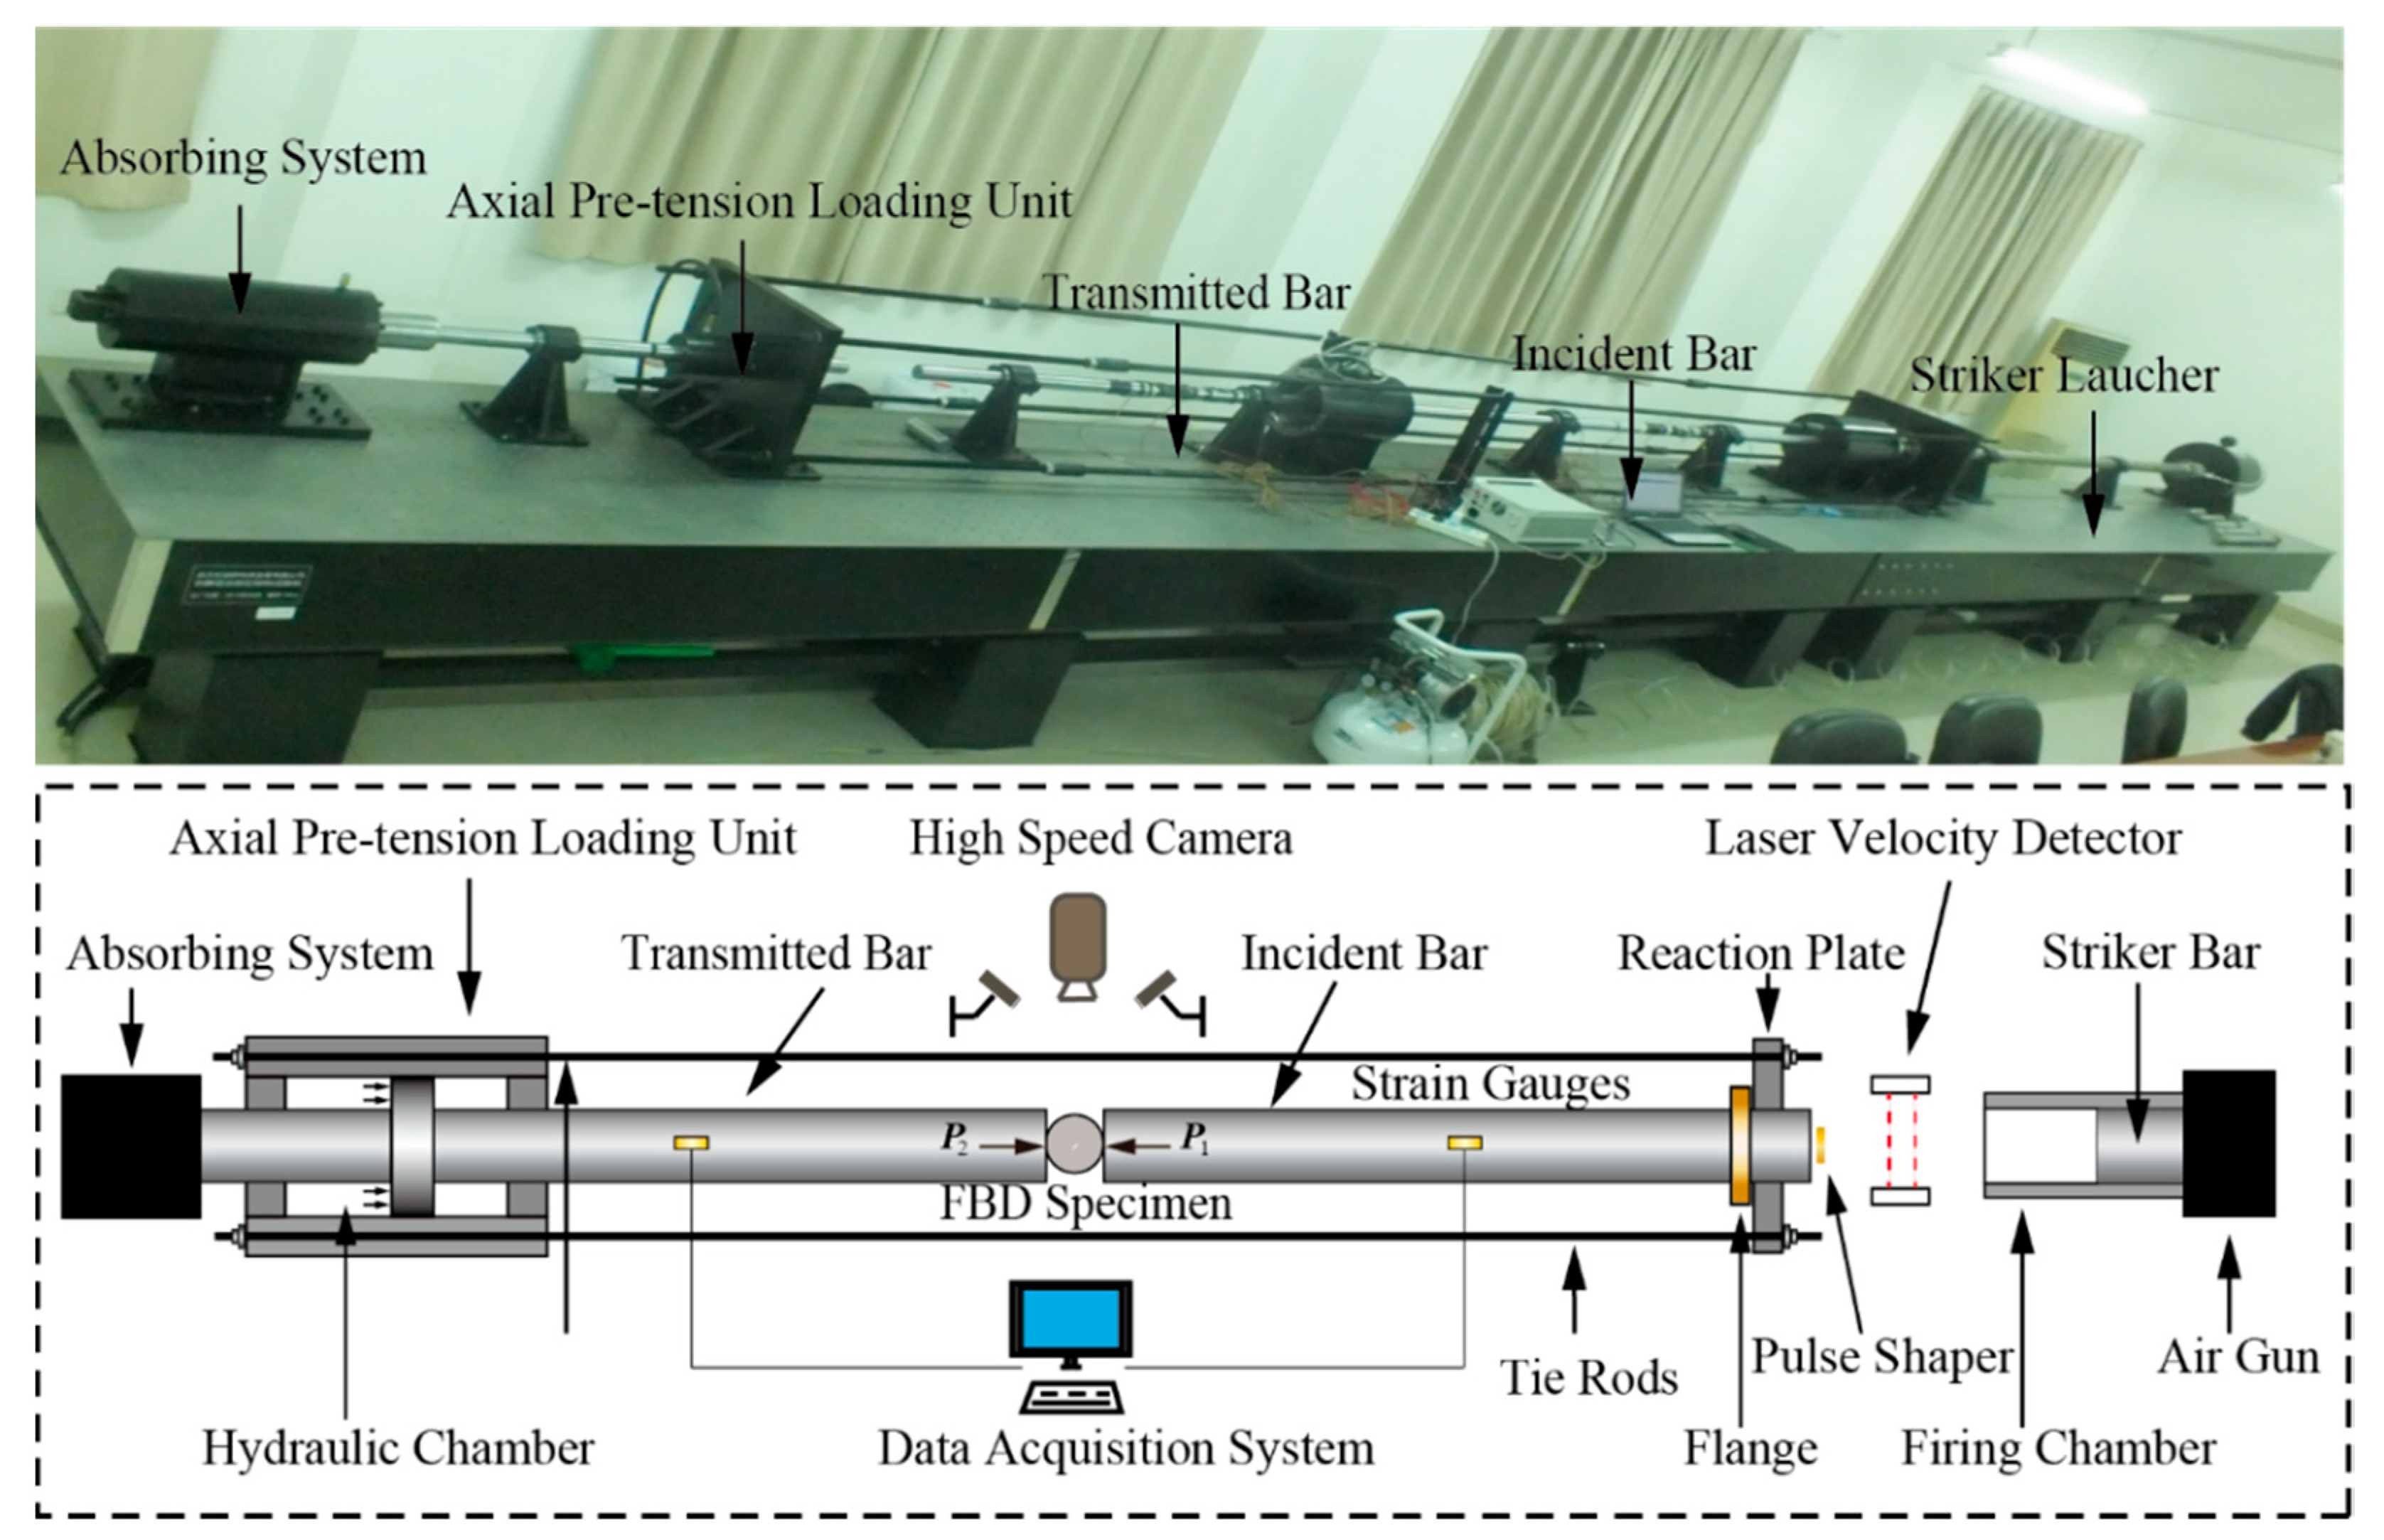
2.1. Testing Apparatus

As exhibited in Figure 1, the coupled static–dynamic FBD tests were conducted using a modified SHPB device. The modified SHPB device was made of a system of bars—namely, the striker bar, the incident bar, and the transmitted bar—an axial pre-tension loading unit, and a data acquisition system. The density of the above low-alloy steel bars was 7800 kg/m3, and all of the bars had a consistent diameter of 50 mm. Since the elastic modulus E of the bars was 211 GPa, the longitudinal wave velocity was calculated by the formula ( c 0 = E / ρ )—namely, 5201 m/s. By utilizing small copper discs as shapers, the waveform of stress wave generated by the impact of striker bar can be shaped into a ramped wave, with the dynamic force equilibrium on both platforms of the FBD specimen being facilitated accordingly. As shown in Figure 1 and Figure 2a, the FBD specimens were first clamped among the incident bar and the transmitted bar. Driven by a hydraulic chamber, the transmitted bar moved towards the incident end and was fixed by the flange; thus, the specific pre-load was successfully applied to the FBD specimens. The four tied rods were used to tighten the reaction plates to avoid bending moments in the bars. After the pre-static load was applied, the incident wave could be generated to propagate along the bars by the impact test. Due to the rapid reflection and transmission of the stress wave in the interface between the bars and the specimen, the stress waves in the transmitted bar were generated by the conversion of incident waves. With two sets of strain gauges properly mounted on the bars, in the form of a strain signal, the stress waves can be recorded without overlap. In line with the one-dimensional wave theory, as long as the strain history on bars is measured, the dynamic force history on both sides of specimens can be determined as follows [35]:
P 1 ( t ) = A E ( ε 0 + ε i ( t ) + ε r ( t ) )
P 2 ( t ) = A E ( ε 0 + ε t ( t ) )
where P1(t) and P2(t) are the dynamic force at the incident and transmitted platforms of the specimen, respectively; ε0, εi(t), εr(t), and εt(t) are the strains caused by the pre-load, incident wave, reflected wave, and transmitted wave, respectively; and A and E denote the cross-sectional area and the elastic modulus of the bars, respectively.
To capture the progressive fracture process during the SHPB experiment, we used digital image correlation (DIC) technology, which is based on the calculation of deformation from the reference state to subsequently deformed states on the surface of the specimen using digital images from a high-speed camera [36,37]. The high-speed camera was set at 180,000 frames per second, and provided successive digital images of specimens with a 256- × 256-pixel resolution. For the sake of improving the calculation accuracy of the DIC algorithm, random speckle patterns were painted on the facade of the specimens, which were used to calculate the strain field by tracking their movement.

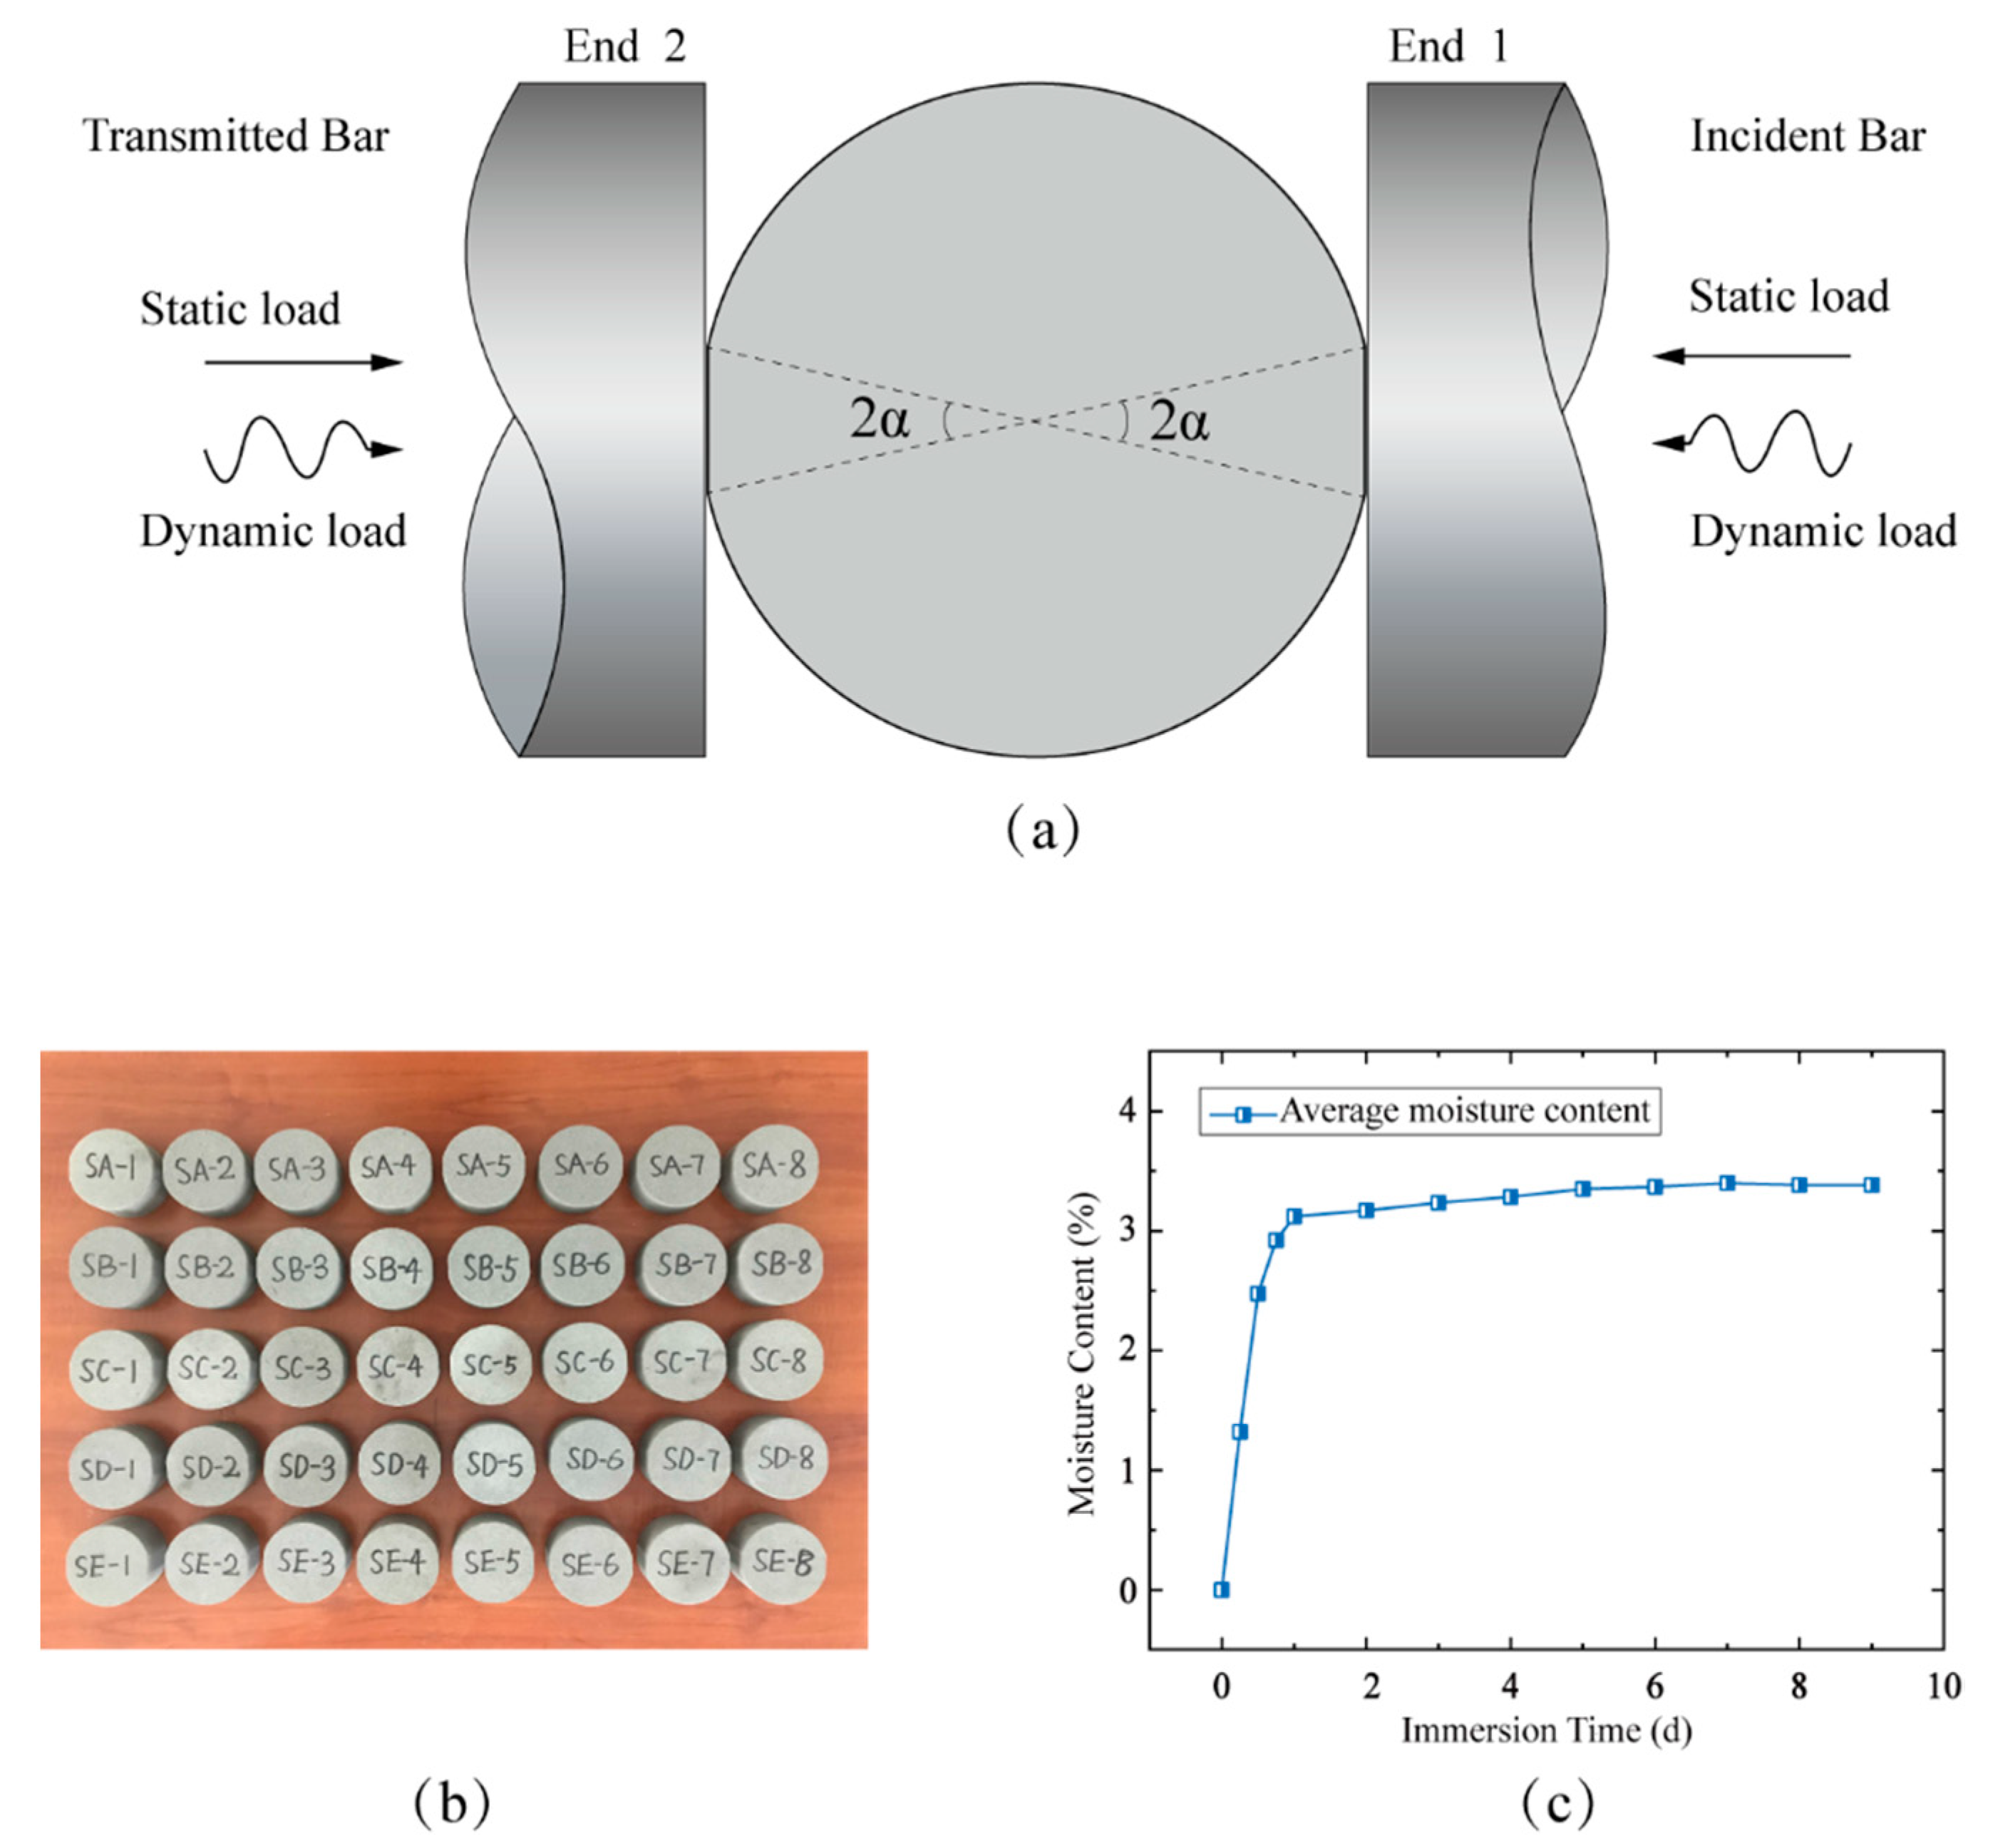
2.2. The Coupled Static–Dynamic FBD Test Method

Considering the pivotal matter in question for the BD tests mentioned above, the coupled static–dynamic FBD testing method newly improved by Pei et al. [32] was applied. Under the condition of simultaneous dynamic and static loading, the advantages of using FBD specimens to measure tensile response are as follows: (1) due to the two-platform design of the disc, the stress concentration can be avoided by increasing the contact area between the FBD specimens and the force device; (2) the two parallel platforms in FBD specimens can ensure a consistent contact area throughout the entire loading process; (3) under dynamic impact loads, it can be ensured that the central crack’s initiation is observed with the proper loading angle of 20° < 2α < 30° [26,27]. In this study, to ensure that the stress in the disc center was larger than that of any other places in the FBD specimens, so as to ensure the feasibility of the FBD method, we chose a loading angle of 2α = 25° when designing the FBD specimens [26].
Due to the existence of two platforms on the FBD specimens, it was no longer suitable to calculate tensile strength by using traditional BD calculation formulae. According to the Griffith criterion, the tensile strength of FBD specimens with certain loading angles can be determined by adding a coefficient to the traditional BD formula [32]:
σ t = k 2 P π D B
where σt is the measured tensile strength; P is the maximum load; B and D are the thickness and diameter of the FBD specimens, respectively; and k is the coefficient with a certain loading angle, in which the coefficient k equals 0.9445 for a loading angle 2α = 25° [32]. Therefore, the dynamic tensile strength in our tests can be determined as follows:
σ t = 0.9445 2 P π D B

2.3. Specimen Preparation and Test Scheme

In FBD tests, in order to reduce the dispersion of the test results, all of the FBD specimens were taken from a same sandstone block, which was fine-grained homogeneous sandstone taken from Neijiang, Sichuan Province, China. The FBD specimens had a consistent diameter and thickness of 87 mm and 43.5 mm, respectively. The surface roughness of the specimens was maintained within 0.02 mm, and the non-parallelism of both platforms was less than 0.05 mm. The naturally saturated specimen was prepared via the immersion tests [38,39,40], and all of the prepared FBD specimens are shown in Figure 2b. These FBD specimens were first immersed in pure water for 6 h, and then taken out and weighed after the surfaces of the specimens were wiped off with a towel. The above operations were repeated until the quality difference of the saturated specimens between the last two cycles did not exceed 0.1 g. Rock specimens after final immersion treatment were considered to have reached the naturally saturated state, and the last weighing was considered to be the quality of the naturally saturated rock FBD specimen. The curve of average moisture content in sandstone versus immersion time is shown in Figure 2c, in which the water content of sandstone can be determined as follows:
w s = m s m d m d
where ws is the naturally saturated water content; and ms and md are the mass of the FBD specimen in its naturally saturated state and natural state, respectively.
As revealed in Figure 2c, it takes almost 9 days for the natural sandstone specimen to reach a naturally saturated state. The average density and longitudinal wave speed of the naturally saturated FBD specimens were 2387 kg/m3 and 2570 m/s, respectively.
In this study, the quasistatic loading tests were first carried out for naturally saturated FBD specimens to determine the static tensile strength, using the MTS-815 rock-testing system to provide a reference for selecting appropriate pre-static loads. The typical load–displacement curve is shown in Figure 3a. The tensile strength is determined by the stress Pmax of the curve, and just at this time the first crack appears in the central disc, as shown in Figure 3b. Table 1 lists the quasistatic test results. The average static tensile strength of the naturally saturated sandstone was 5.5 MPa. In order to explore the influence of static preloads on the dynamic tensile properties of naturally saturated sandstone, five groups of tests are considered (i.e., groups SA, SB, SC, SD, and SE). For the five test groups, the static pre-tension loads were 0 MPa, 1.1 MPa, 2.2 MPa, 3.3 MPa and 4.4 MPa, corresponding to the static pre-tension ratios of 0, 0.2, 0.4, 0.6 and 0.8, respectively. For the dynamic loading under each static preload, eight impacting tests were conducted to cover a wide range of loading rates (50~350 GPa/s).

3. Experimental Results

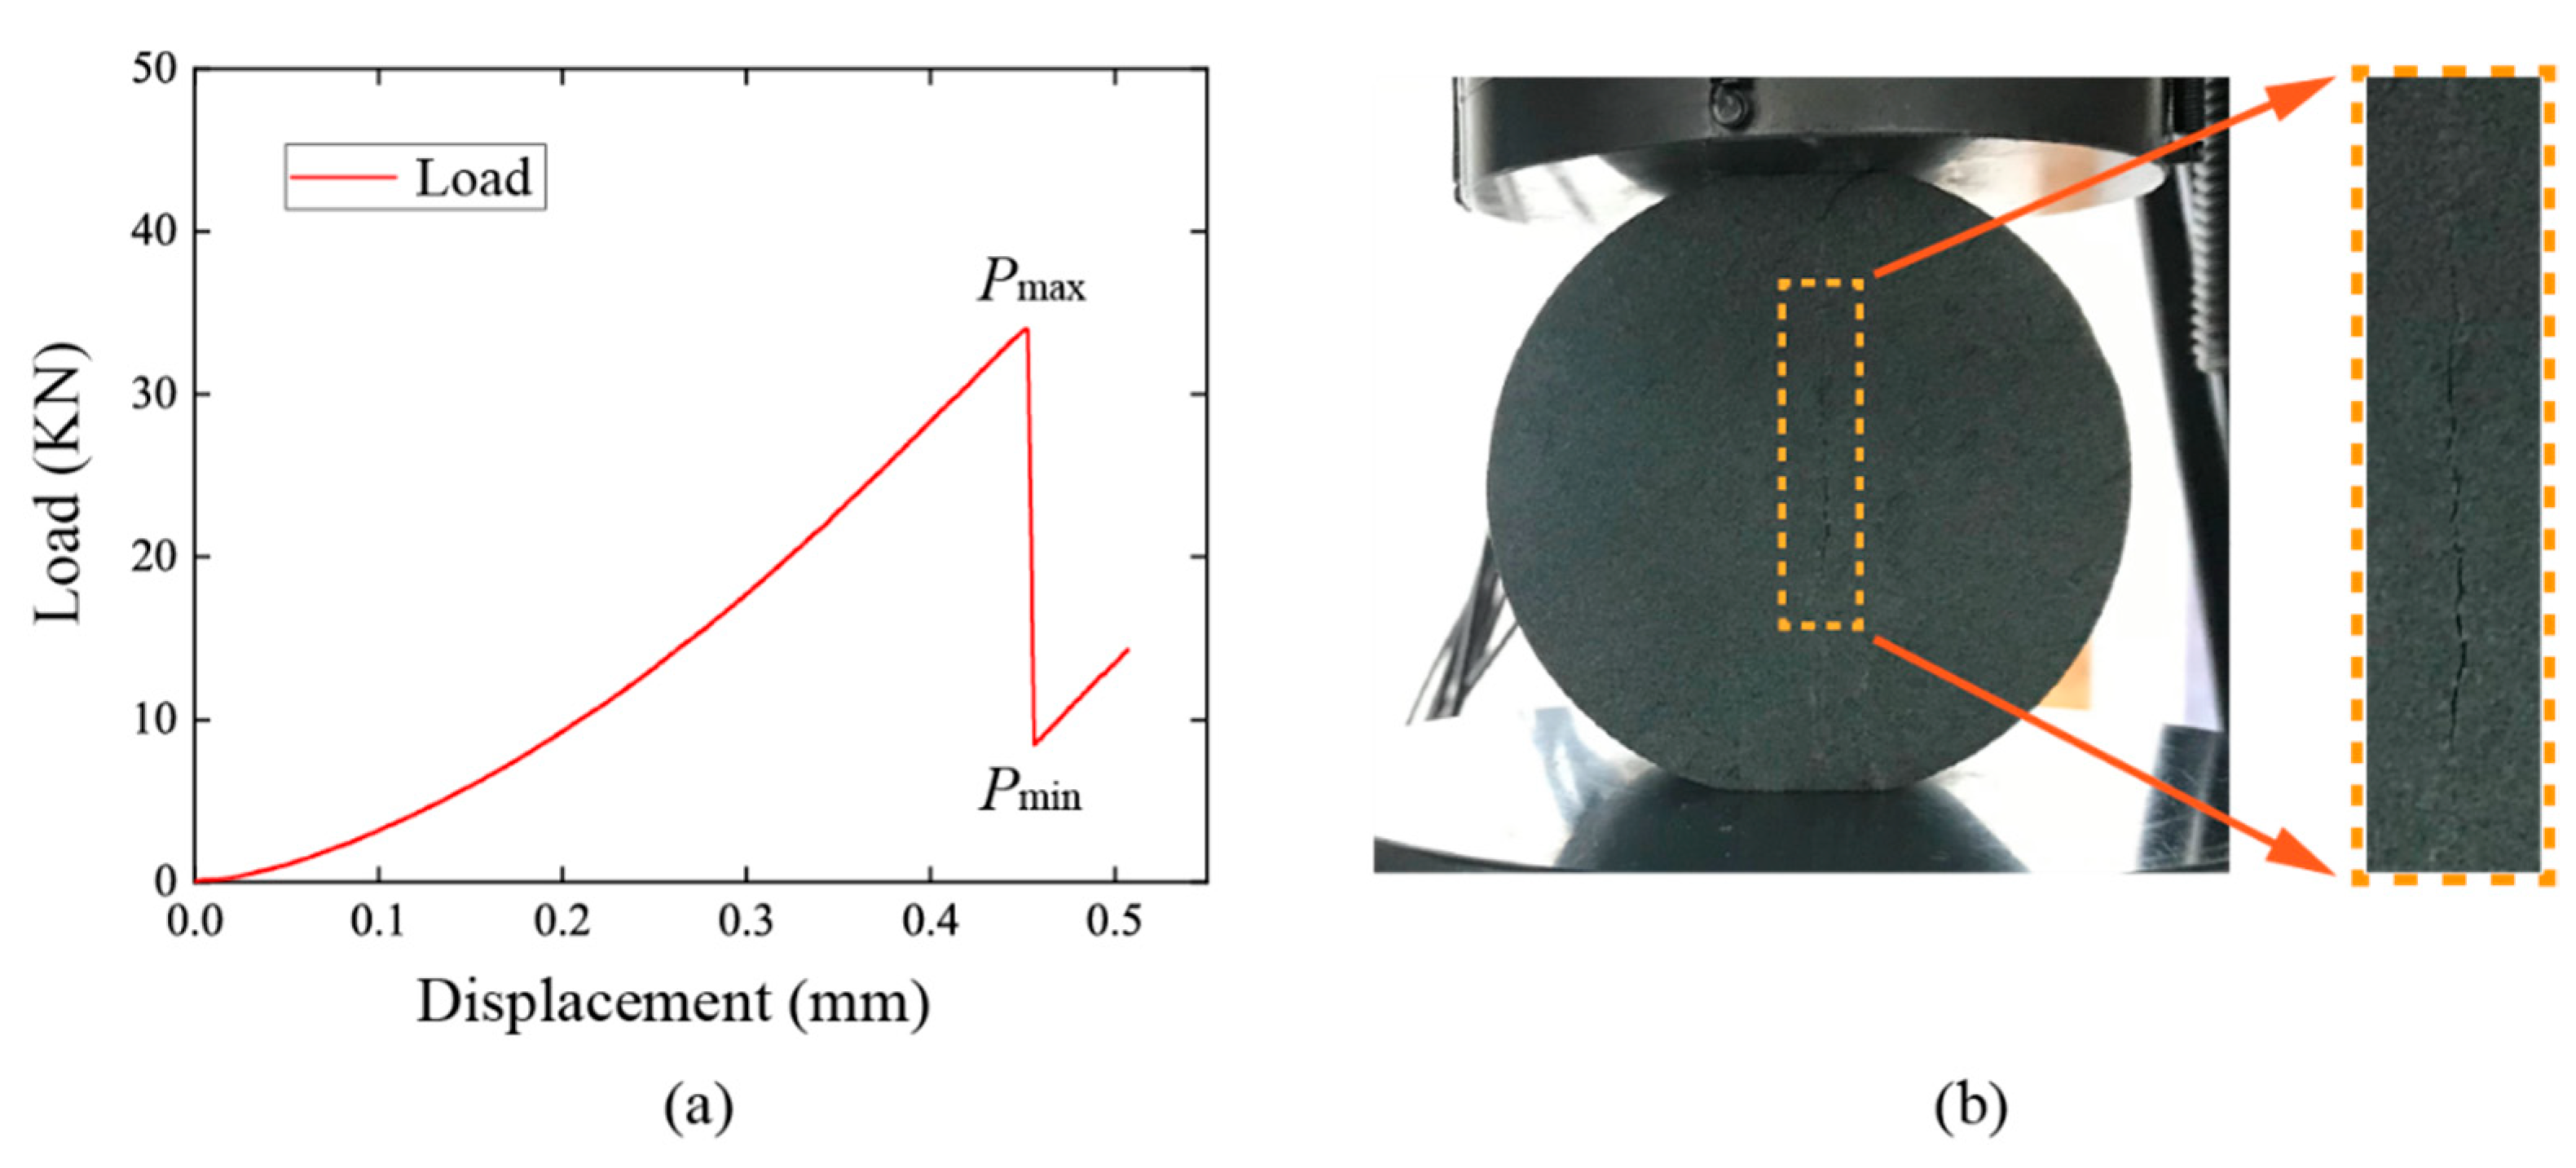
3.1. Dynamic Force Equilibrium

Given the fact that ensuring balance of the dynamic forces at both ends of the FBD specimen is the crucial prerequisite for ignoring the inertial effect and conducting the valid quasistatic data analysis method in the experiments [35,41], we firstly checked the force equilibrium in the dynamic impact tests by adapting a pulse-shaping technique, which can convert incident waves into ramped waveforms.
Figure 4a depicts the force history for a typical coupled static–dynamic FBD test (specimen SC-1). By shifting the time zeros of stress waves to the bar–specimen interface, and using the abovementioned Equations (1) and (2), the dynamic force histories on both side of the specimen can be determined, which are denoted as black curve In and red curve Re for incident force history and reflected force history, respectively, in Figure 4a. The dynamic force history on the incident platform of the specimen is the superposition of the incident and reflected force (represented as blue curve In + Re), while the force history on the transmitted side of the specimen is represented as green curve Tr. For rock materials, after 3–4 stress wave reverberations inside the specimen, the force on both sides of the specimen becomes consistent [42]. Since the P-wave velocity of naturally saturated sandstone is ~2570 m/s and the diameter of FBD is 87 mm, the time required for dynamic force equilibrium is ~102–135 μs. As shown in Figure 4a, during the time from the initial equilibrium moment (represented as tequil) to the peak stress moment (represented as tf)—namely, 105–211 μs—the dynamic force at both platforms of the FBD specimen is approximately equal, indicating that the dynamic force equilibrium of the FBD specimen is achieved in our tests. From Equation (4), the maximum stress in the tensile stress history can be adopted to measure the tensile strength. Moreover, as shown in Figure 4b, the slope of the pre-peak linear region of the stress history curve can be used to determine the loading rate.

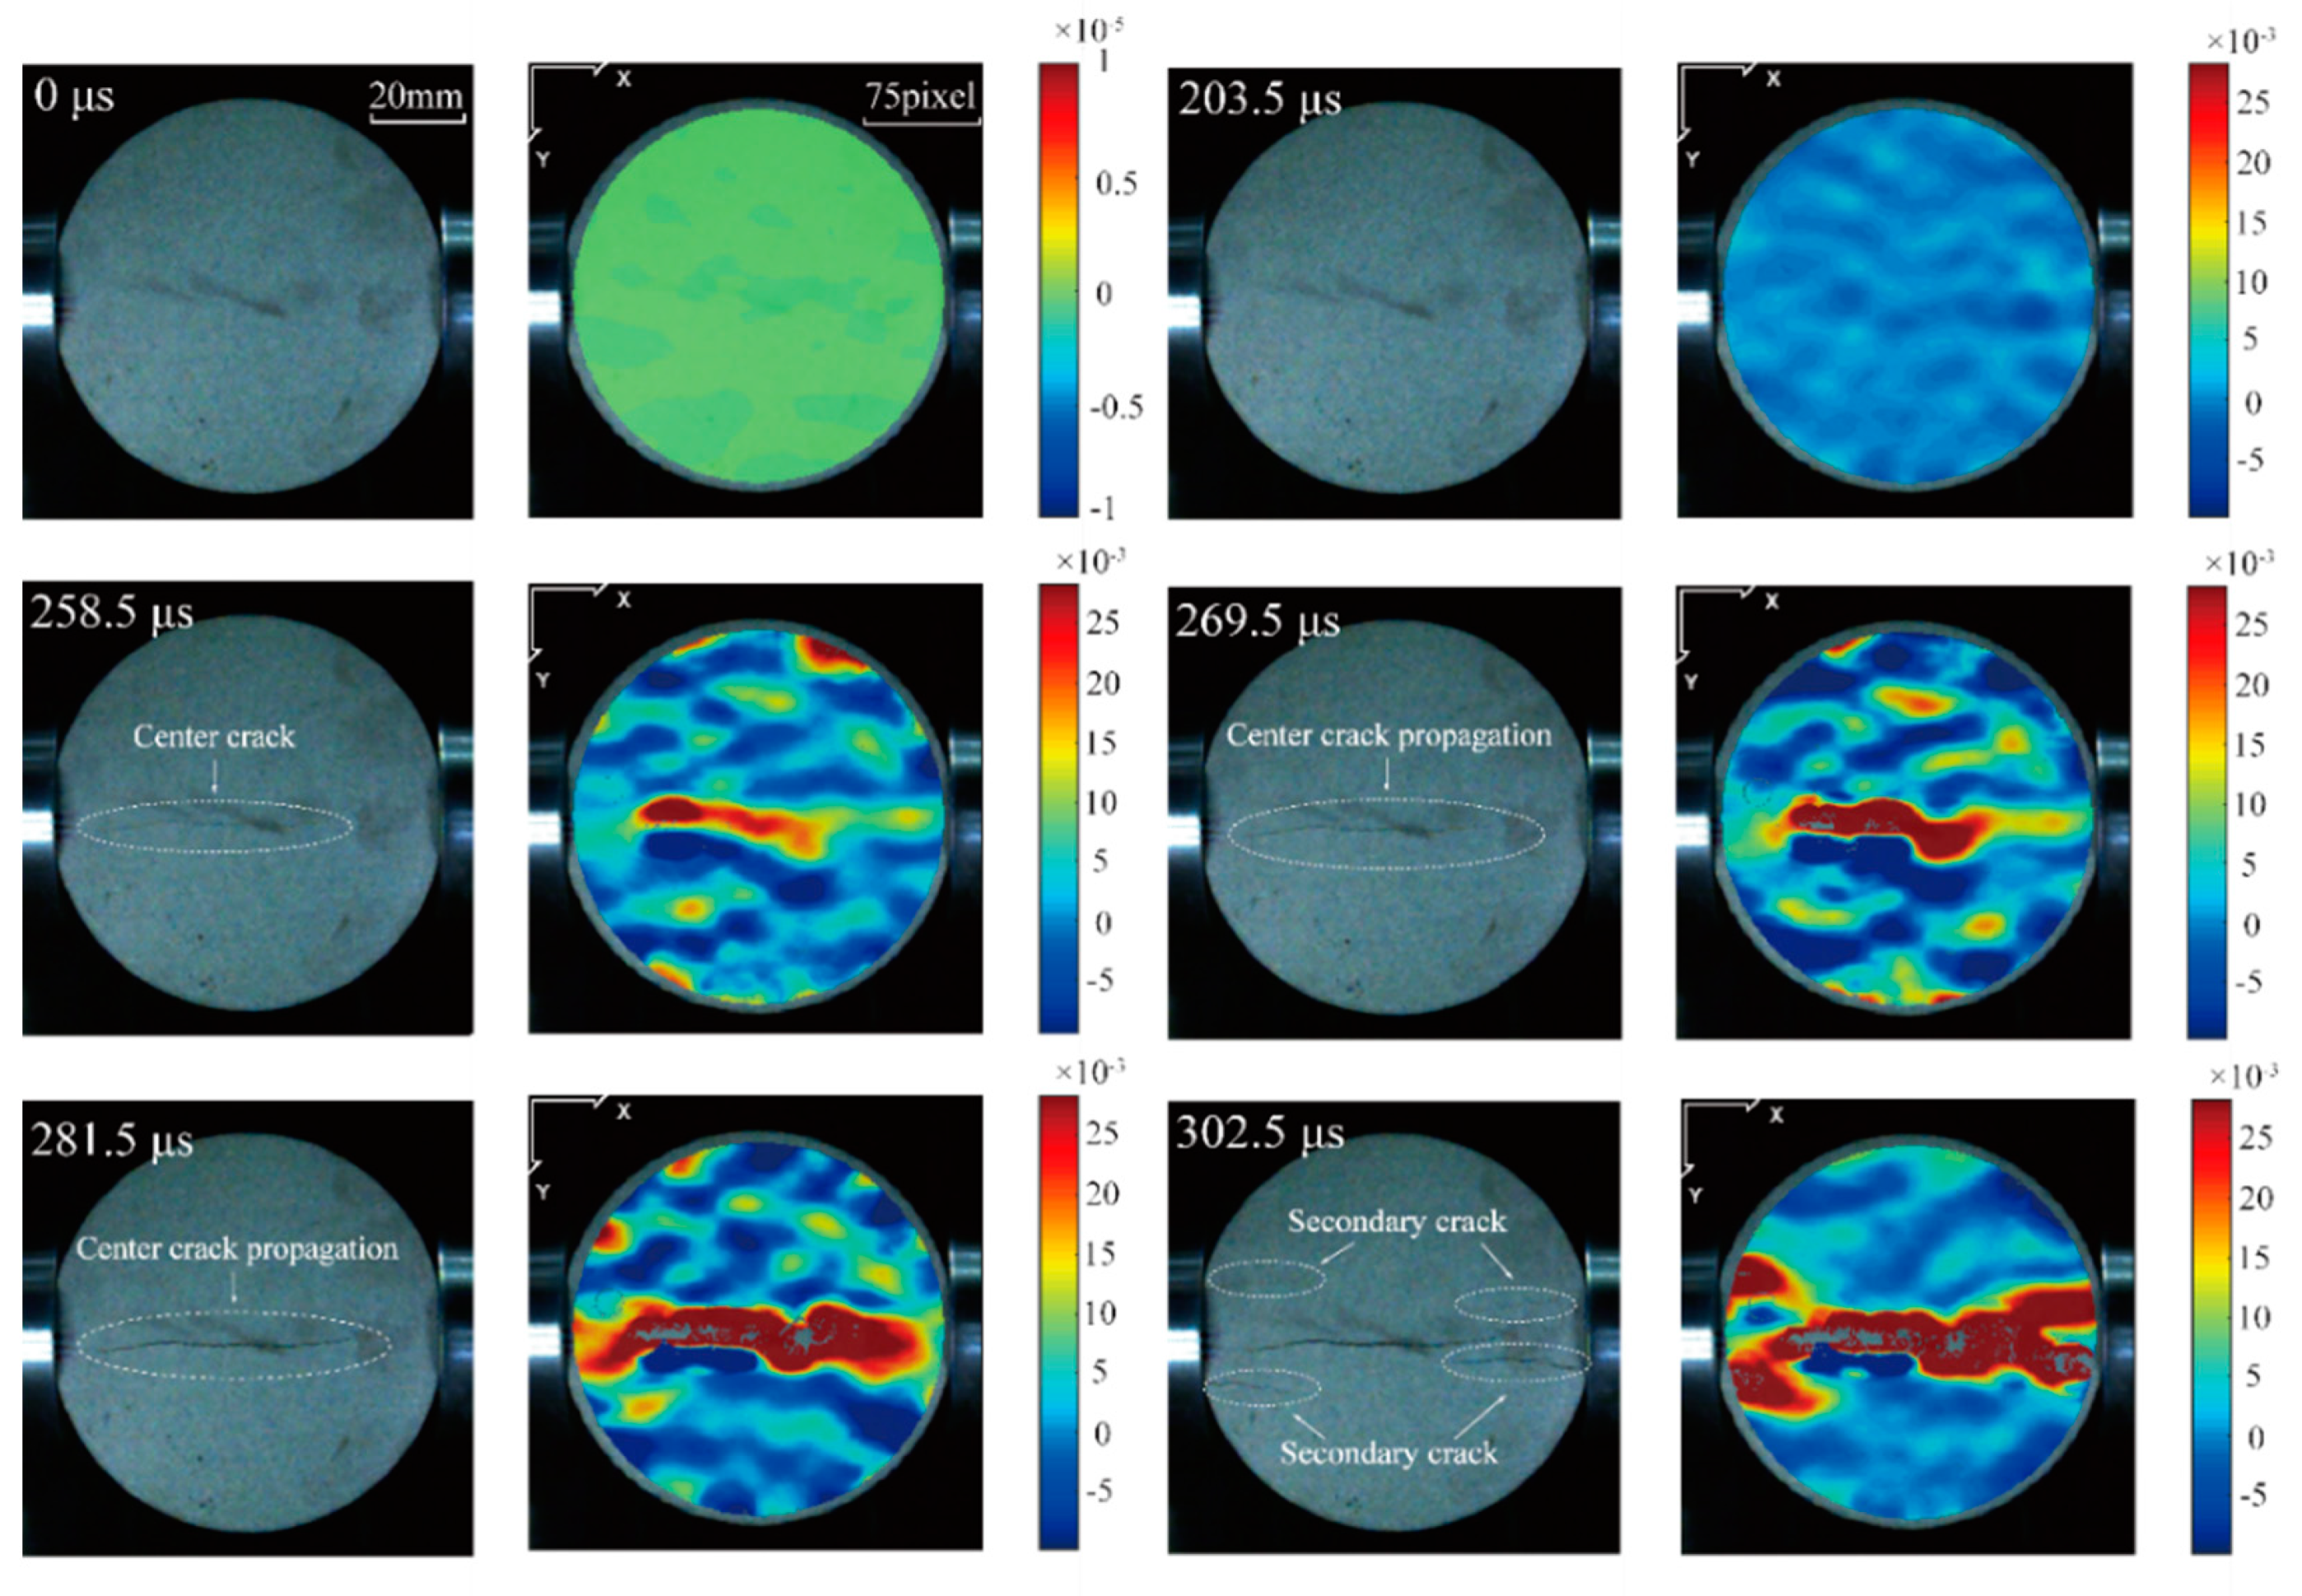
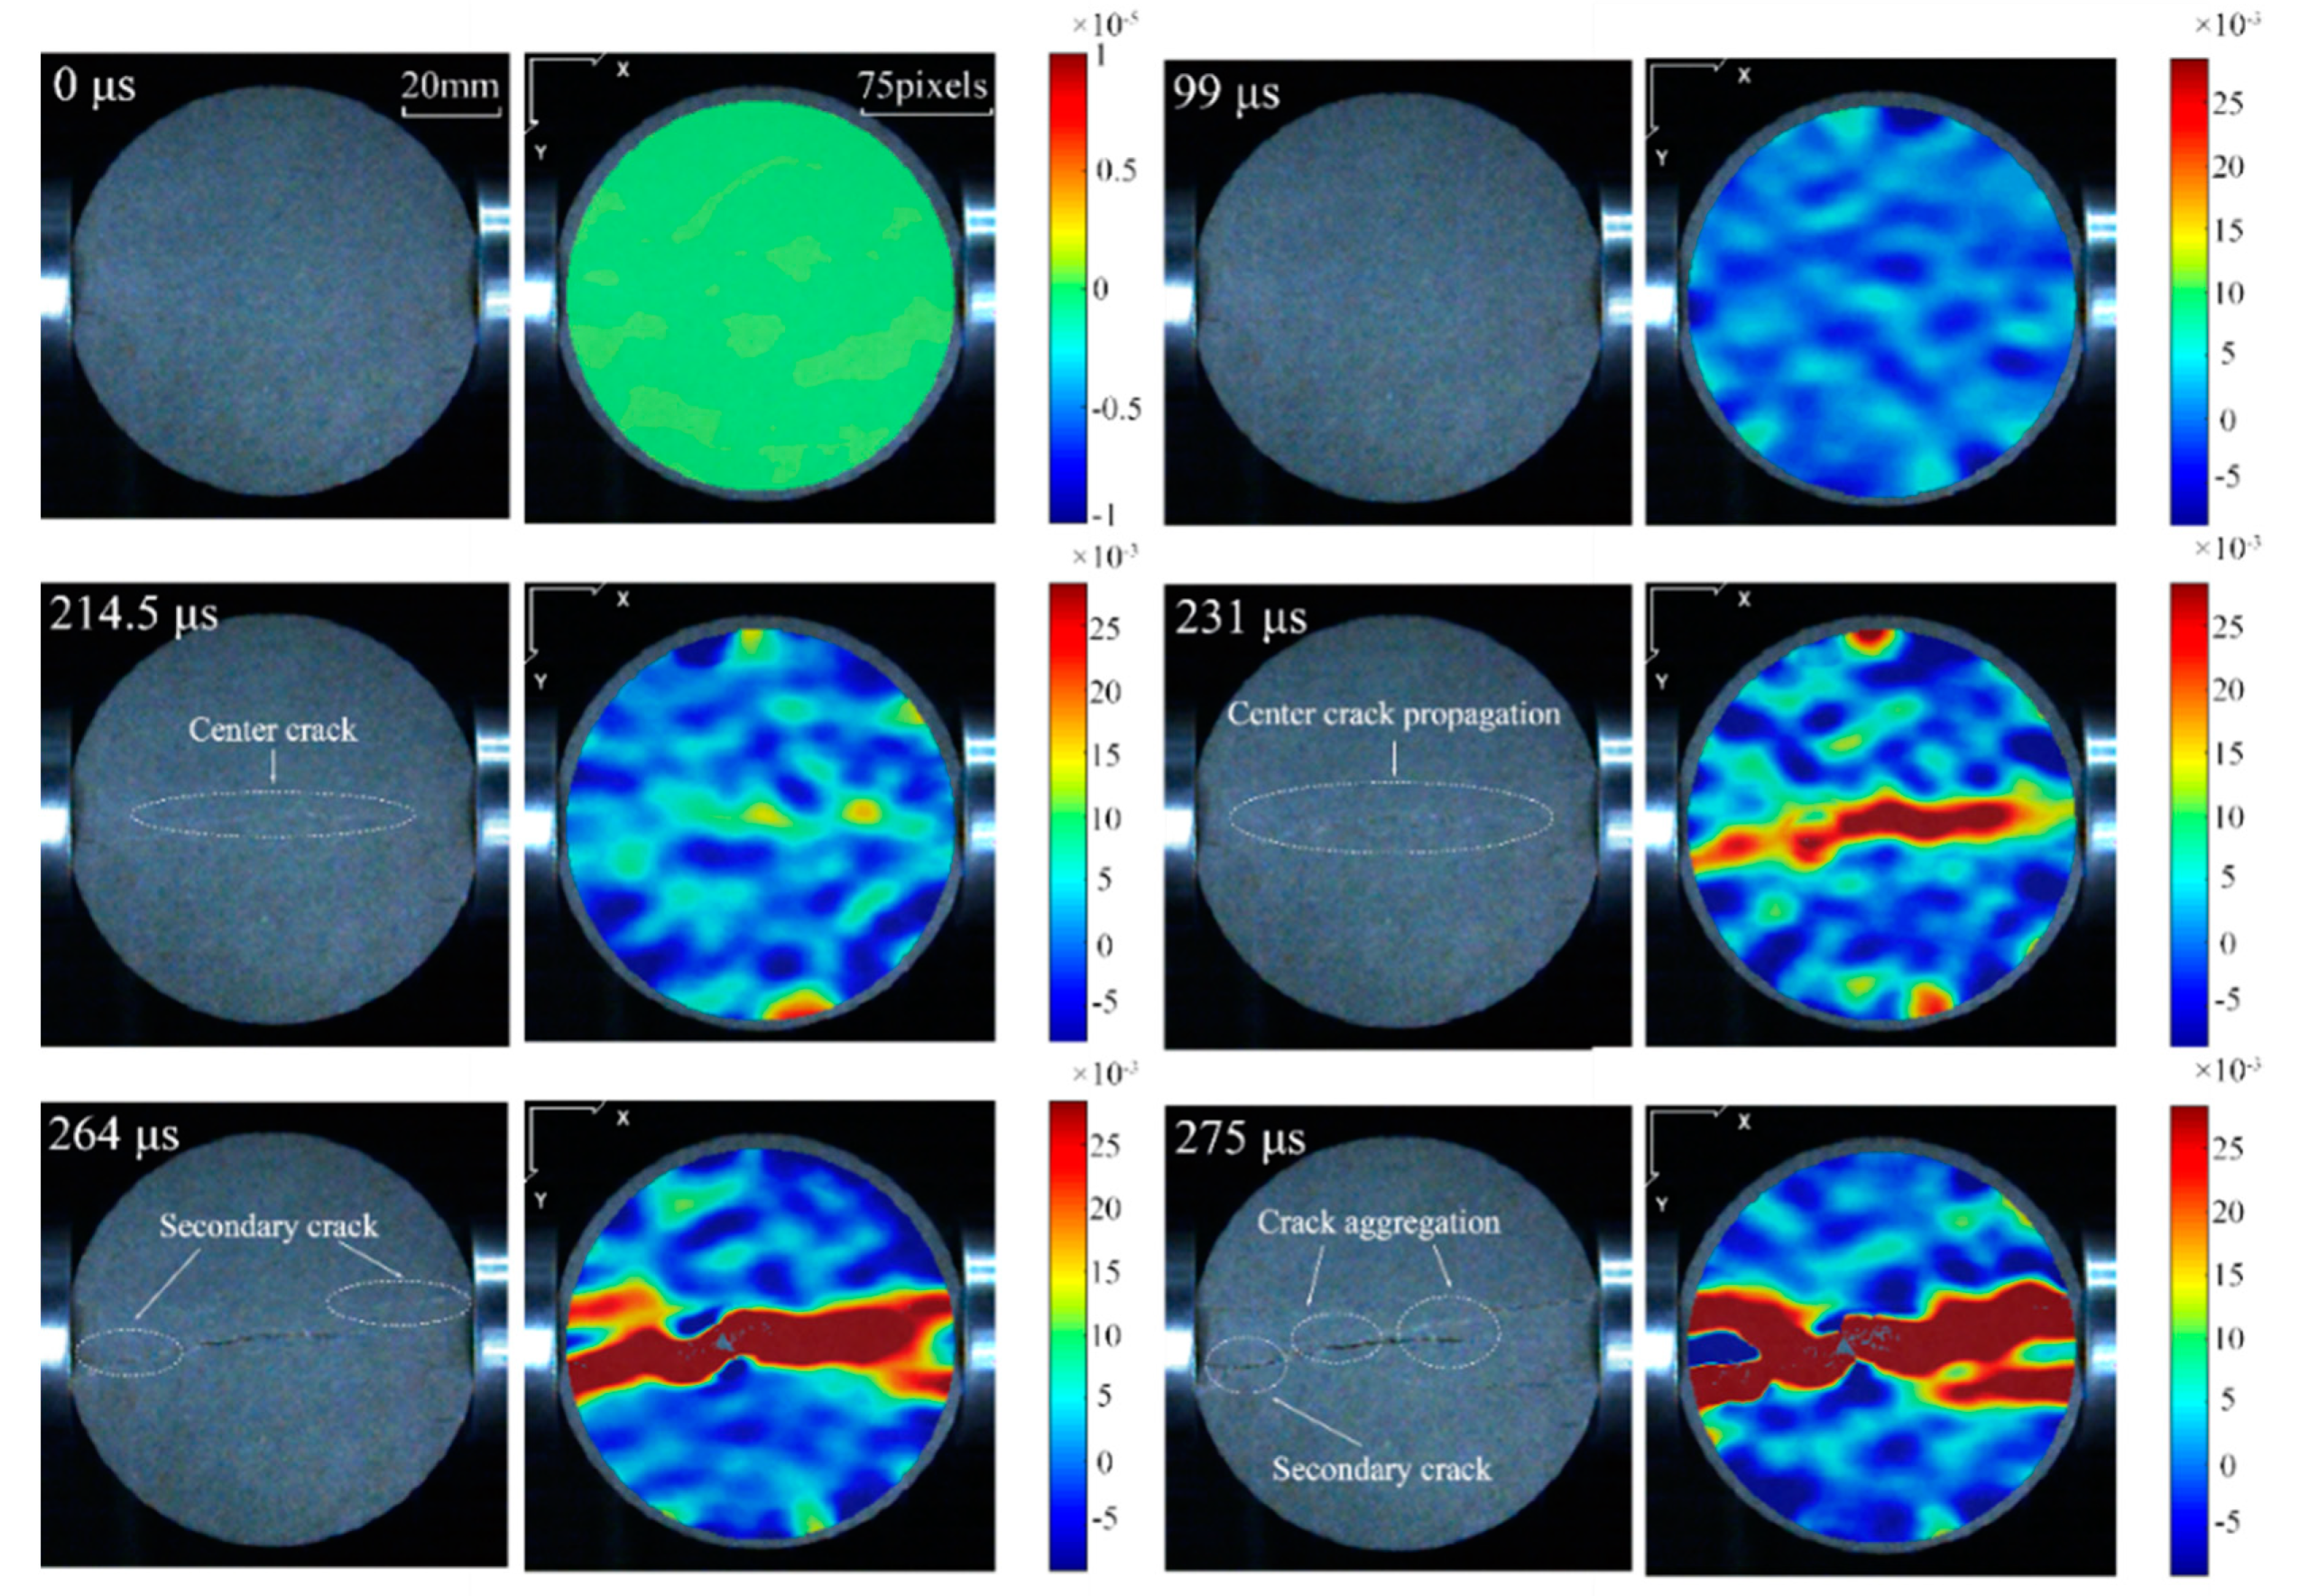
3.2. Central Crack Initiation

As mentioned above, the central crack’s initiation should be carefully checked before the interpretation of the results. Via virtual high-speed photography, the progressive failure processes of FBD specimens under the condition of coupled static–dynamic loading were completely recorded. To measure the progressive evolution of strain applied to the surface of the specimen, high-speed photographs were analyzed using DIC technology. Figure 5 depicts the typical progressive fracturing processes of specimen SC-1, and the interval of the legend; that is, the strain range is (−10~30) × 10−3. The first frame (at 0 μs) depicts the initial state of the FBD specimen when the incident ramped wave first appears on the interface of the incident bar and the specimen. At this moment, no obvious strain and macroscopic cracks can be observed on the specimen surface. As loading continues, a tensile crack first appears at the disc center, and a corresponding strain concentration band appears. Note that the tensile stress history also reaches the maximum stress at the same time (214.5 μs). Subsequently, as the strain concentration bands form and expand, the central tensile crack horizontally propagates along the loading direction, and secondary cracks also initiate from the edges of the platform during the post-peak stage. Eventually, two strain concentration banks in the shape of an “X” are formed (275 μs), leading to the final failure of the FBD specimen. For the whole failure process, the initiation of the central crack was watched in the FBD specimen, and thus the important factor for a valid method was guaranteed in our tests.

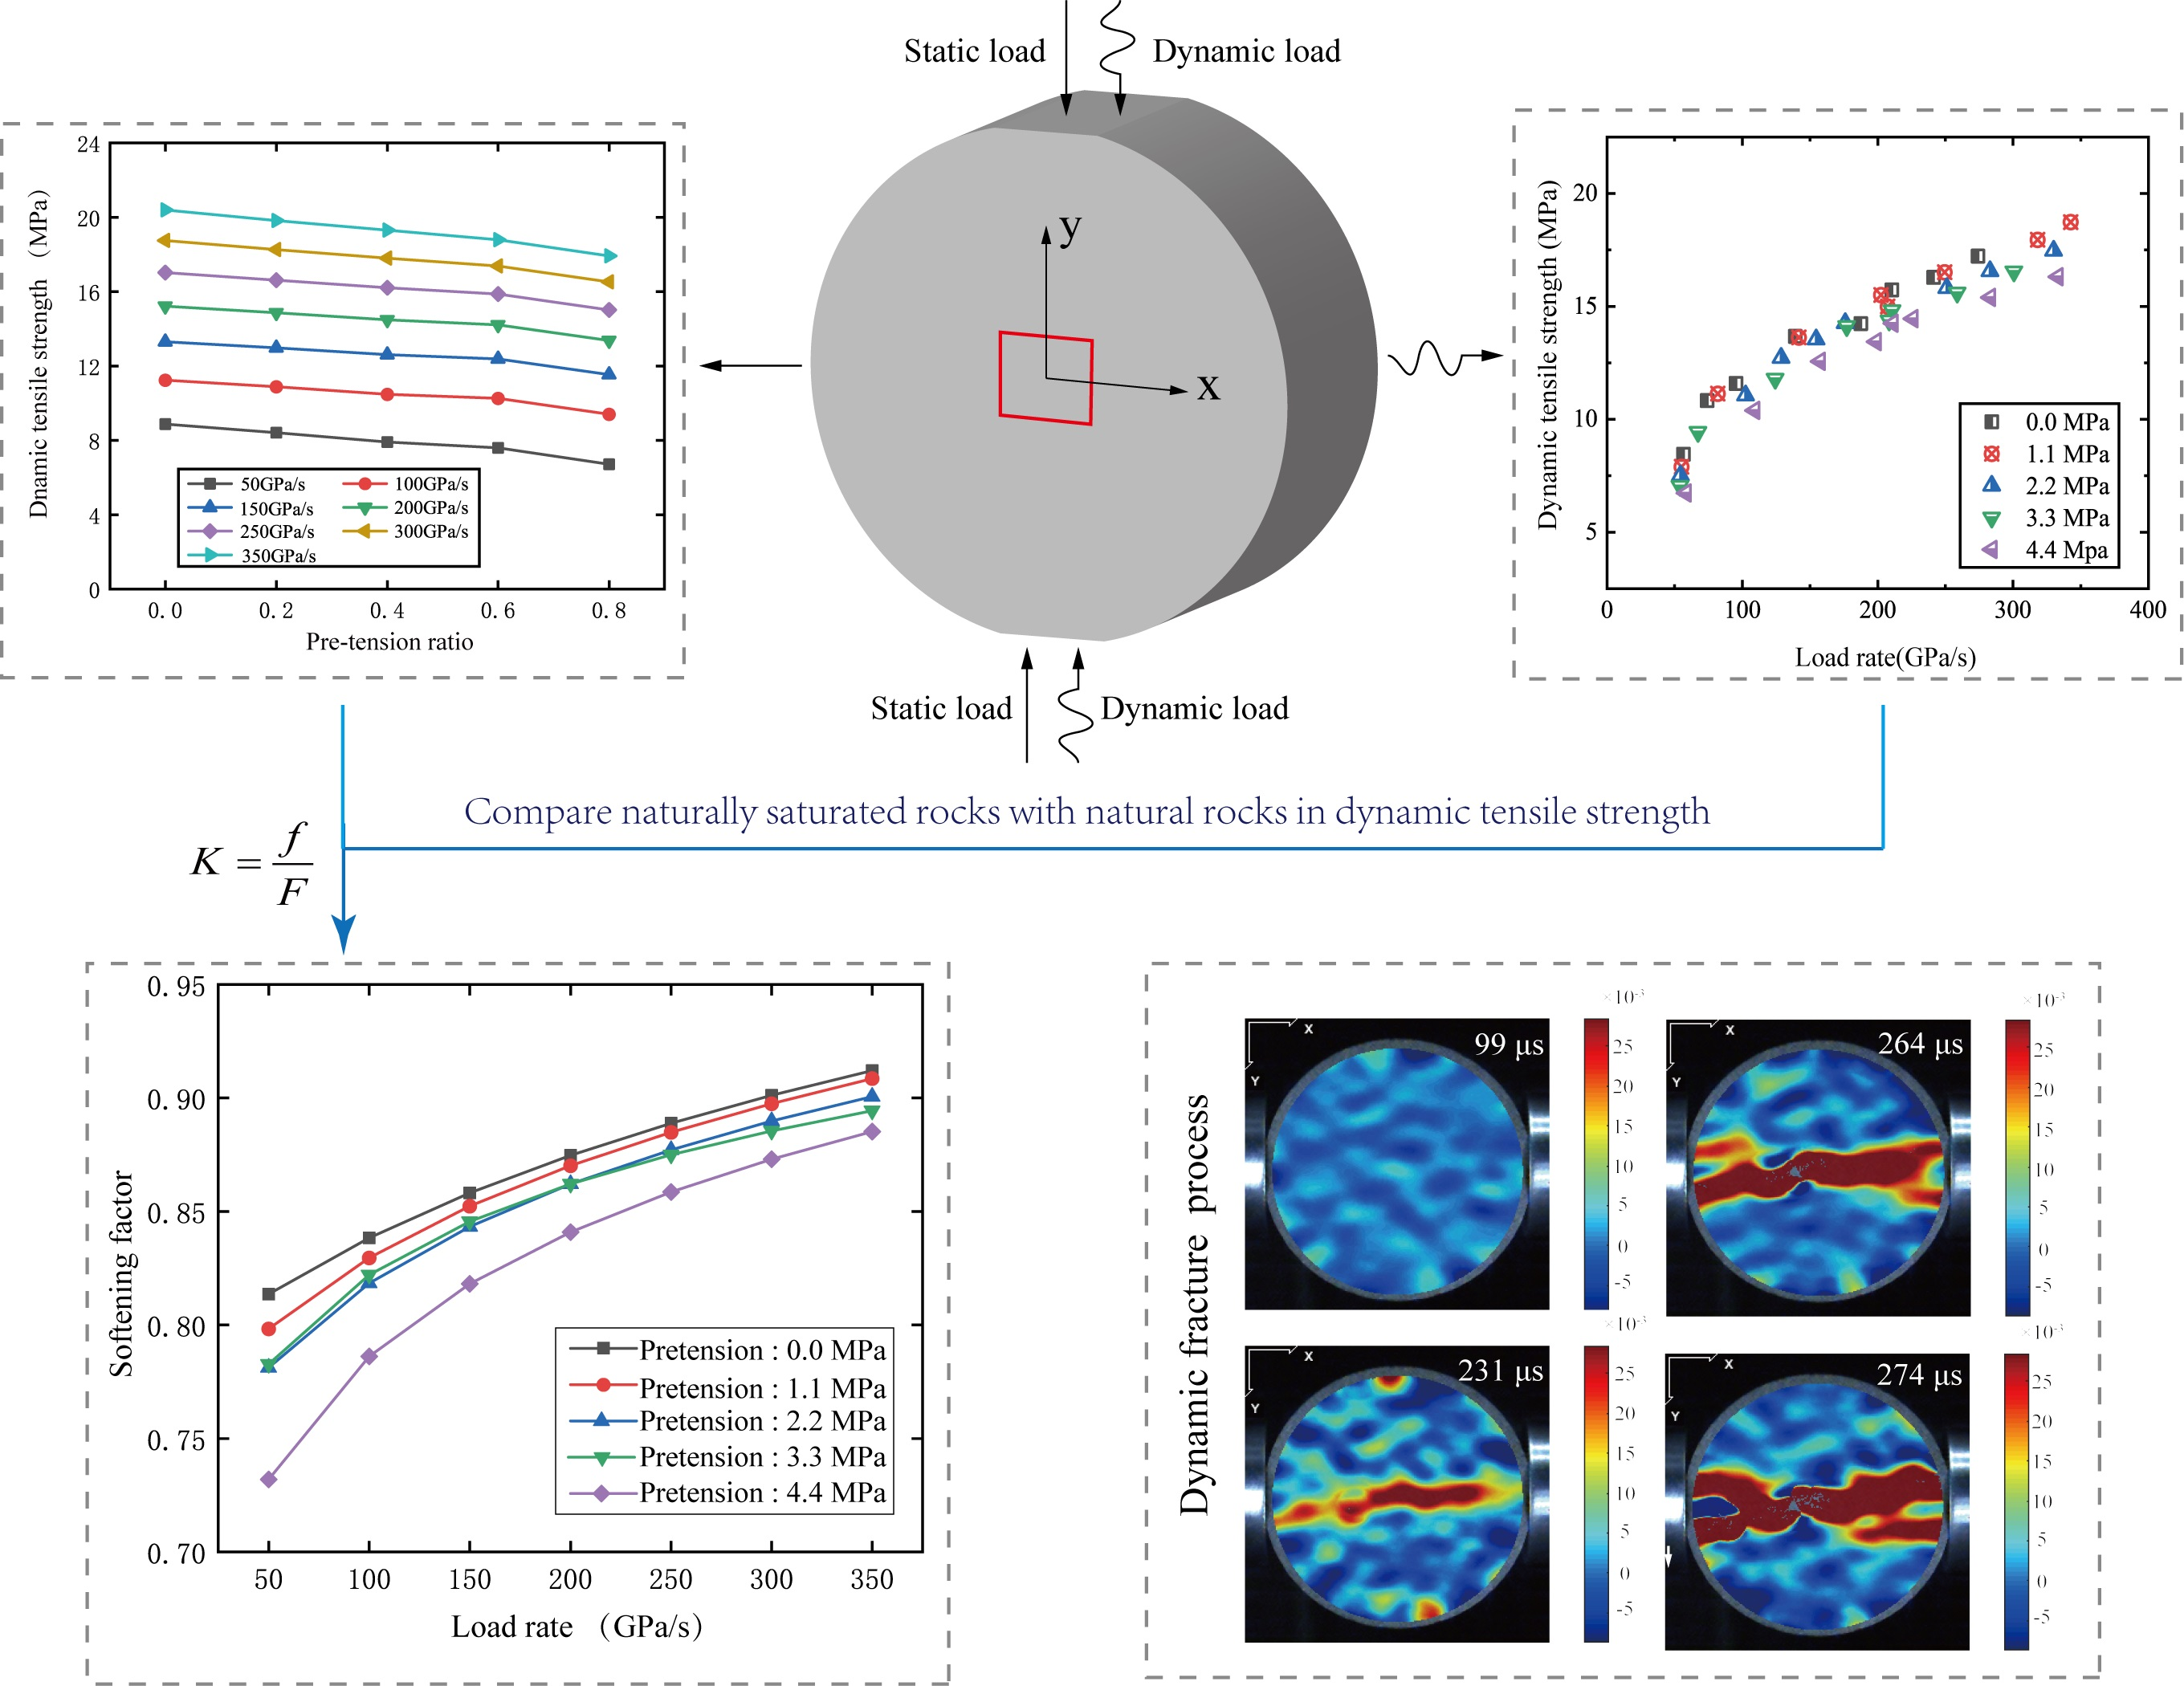
3.3. Influence of Loading Rate on the Dynamic Tensile Strength

By subtracting the pre-static tensile stress from the total tensile strength, the experimental results—namely, dynamic tensile strength—are shown in Table 2. Figure 6a–e exhibits the curves of dynamic tensile strength versus loading rate for the naturally saturated FBD specimens with distinct pre-tension ratios of 0, 0.2, 0.4, 0.6, and 0.8, respectively. Without considering the pre-static load, the dynamic tensile strength increases with the loading rate. Taking the pre-tension ratio of 0.4 as a typical case, with the loading rate increases from 54.36 GPa/s to 330.01 GPa/s, the dynamic tensile strength increases from 7.51 MPa to 17.47 MPa, showing a significant loading rate dependency.
To fit the empirical function of the dynamic tensile strength and the loading rate at a certain static pre-tension ratio, the exponential function ( S = σ r + A σ ˙ B ) was used to fit the experimental results [32]:
{ S = 5.5 + 0.171 σ ˙ 0.763 ,   R 2 = 0.975 ( σ p r e / σ s t = 0 ) S = 4.4 + 0.267 σ ˙ 0.693 ,   R 2 = 0.975 ( σ p r e / σ s t = 0.2 ) S = 3.3 + 0.377 σ ˙ 0.640 ,   R 2 = 0.971 ( σ p r e / σ s t = 0.4 ) S = 2.2 + 0.564 σ ˙ 0.577 ,   R 2 = 0.983 ( σ p r e / σ s t = 0.6 ) S = 1.1 + 0.619 σ ˙ 0.564 ,   R 2 = 0.984 ( σ p r e / σ s t = 0.8 )
where S, σr, and σst are the dynamic tensile strength, residual tensile strength, and static tensile strength of naturally saturated FBD specimens, respectively; σ ˙ is the dynamic loading rate; A and B are the correlation coefficients varied with pre-tension ratios; and σpre is the pre-tension stress. Using Equation (6), the dynamic tensile strength of naturally saturated sandstone under simultaneous dynamic and static loading can be predicted.

3.4. Influence of Pre-Tension on the Dynamic Tensile Strength

As revealed in Figure 6f, dynamic tensile strength not only displays rate dependency, but is also affected by the pre-static load. To demonstrate, the dynamic tensile strength and pre-tension ratio curves of specimen SC-1 at typical loading rates are exhibited in Figure 7. It can be observed that as the static pre-tension ratio increases, the dynamic strength at a specific loading rate consistently decreases accordingly. For instance, under a typical loading rate of 200 GPa/s (green curve in Figure 7), as the pre-tension ratio increases from 0 to 0.8 at an interval of 0.2, the strength reductions of the naturally saturated specimen are 0.34 MPa, 0.40 MPa, 0.30 MPa, and 0.81 MPa, respectively. Note that there are evident turning points at the pre-tension ratio of 0.6. The test results can perhaps be interpreted by the opening and generation of microcracks caused by static pre-tension [32]. In the wake of the increase of the pre-static load, more closed cracks open and more microcracks accumulate in the naturally saturated specimen, which decreases the dynamic tensile strength. When the pre-tension ratio exceeds 0.6, the microcracking begins to accelerate, inducing further reduction of the dynamic tensile properties.

4. Discussion

4.1. Comparison of the Dynamic Tensile Strength between Natural and Naturally Saturated Sandstone

To compare the dynamic tensile strength at natural and naturally saturated states, the experimental data of coupled static–dynamic FBD tests from Pei et al. [32] are cited, and the interpolation is applied to obtain the dynamic tensile strength in the loading rate range of 50–350 GPa/s with various pre-tensions (i.e., 1.1 MPa, 2.2 MPa, 3.3 MPa, and 4.4 MPa). As shown in Figure 8a,b, rocks in both natural and naturally saturated states, at various loading rates and pre-tension ratios, show a similar tendency for the dynamic tensile strength—namely, it increases with increasing loading rate, while decreasing with an increase in the pre-tension ratio. Figure 9a–e illustrates the variation of the dynamic tensile strength in natural and naturally saturated sandstone versus loading rate. Moreover, we can find that the dynamic tensile strength of naturally saturated sandstone is lower than that of natural sandstone in the event of a similar loading rate, indicating the overall degradation in the mechanical properties of the naturally saturated sandstone. To quantitatively analyze the rate effect of tensile strength, the rate effect difference is presented as the derived difference in the tensile strength fitting formula concerning the loading rate for natural and naturally saturated rocks, as exhibited in Table 3, in which the tensile strength-fitting formulae of natural and naturally saturated rocks are taken from Pei et al. [32] and Equation (6), respectively. The upper and lower limits of rate effect difference are calculated as follows:
{ | Δ S σ t | upper = | S sat σ t S nat σ t | max | Δ S σ t | lower = | S sat σ t S nat σ t | m in
where | Δ S σ t | upper and | Δ S σ t | lower are the upper and lower limits of rate effect difference, respectively; and S sat σ t and S nat σ t are the derivatives of the tensile strength fitting formula concerning the loading rate for natural and naturally saturated rocks, respectively—namely, the rate effect for natural and naturally saturated rocks.
According to Figure 8c, it can be found that when the pre-tension ratio is less than 0.6, the upper and lower limits of rate effect difference are relatively stable. However, when the pre-tension ratio reaches 0.8, the upper and lower limits of rate effect difference increase sharply, from 7.99% to 17.14% and 0.75% to 2.25%, respectively. The above phenomenon reveals that the presence of pore water can influence the rate effect of rock to some extent, and that the opening and generation of microcracks caused by a pre-tension ratio of 0.8 increases the influence of pore water on the rate effect of the tensile strength of rocks.
Combining high-speed photographs with DIC technology, the progressive fracture process of specimen NC-1 (from Pei et al. [32]) is shown in Figure 10, which shares a similar loading rate and pre-tension rate with specimen SC-1. The range of the legend in Figure 10—that is, the strain range—is (−10~30) × 10−3. At 258.5 μs, the specimen cracks first at the center of the disc, and an evident strain concentration bank occurs. As loading continues, secondary cracks appear on the edges of the two flat ends. Subsequently, with the propagation and coalescence of cracks, two strain concentration banks in the shape of an “X” are gradually formed, leading to the final failure. Compared with Figure 5, it can be observed that the progressive fracture processes of naturally saturated and natural specimens are similar; they both display central crack initiation and the occurrence of secondary cracks at the ends of the specimens. Finally, both specimens fail accompanied by two strain concentration banks in the shape of an “X”.

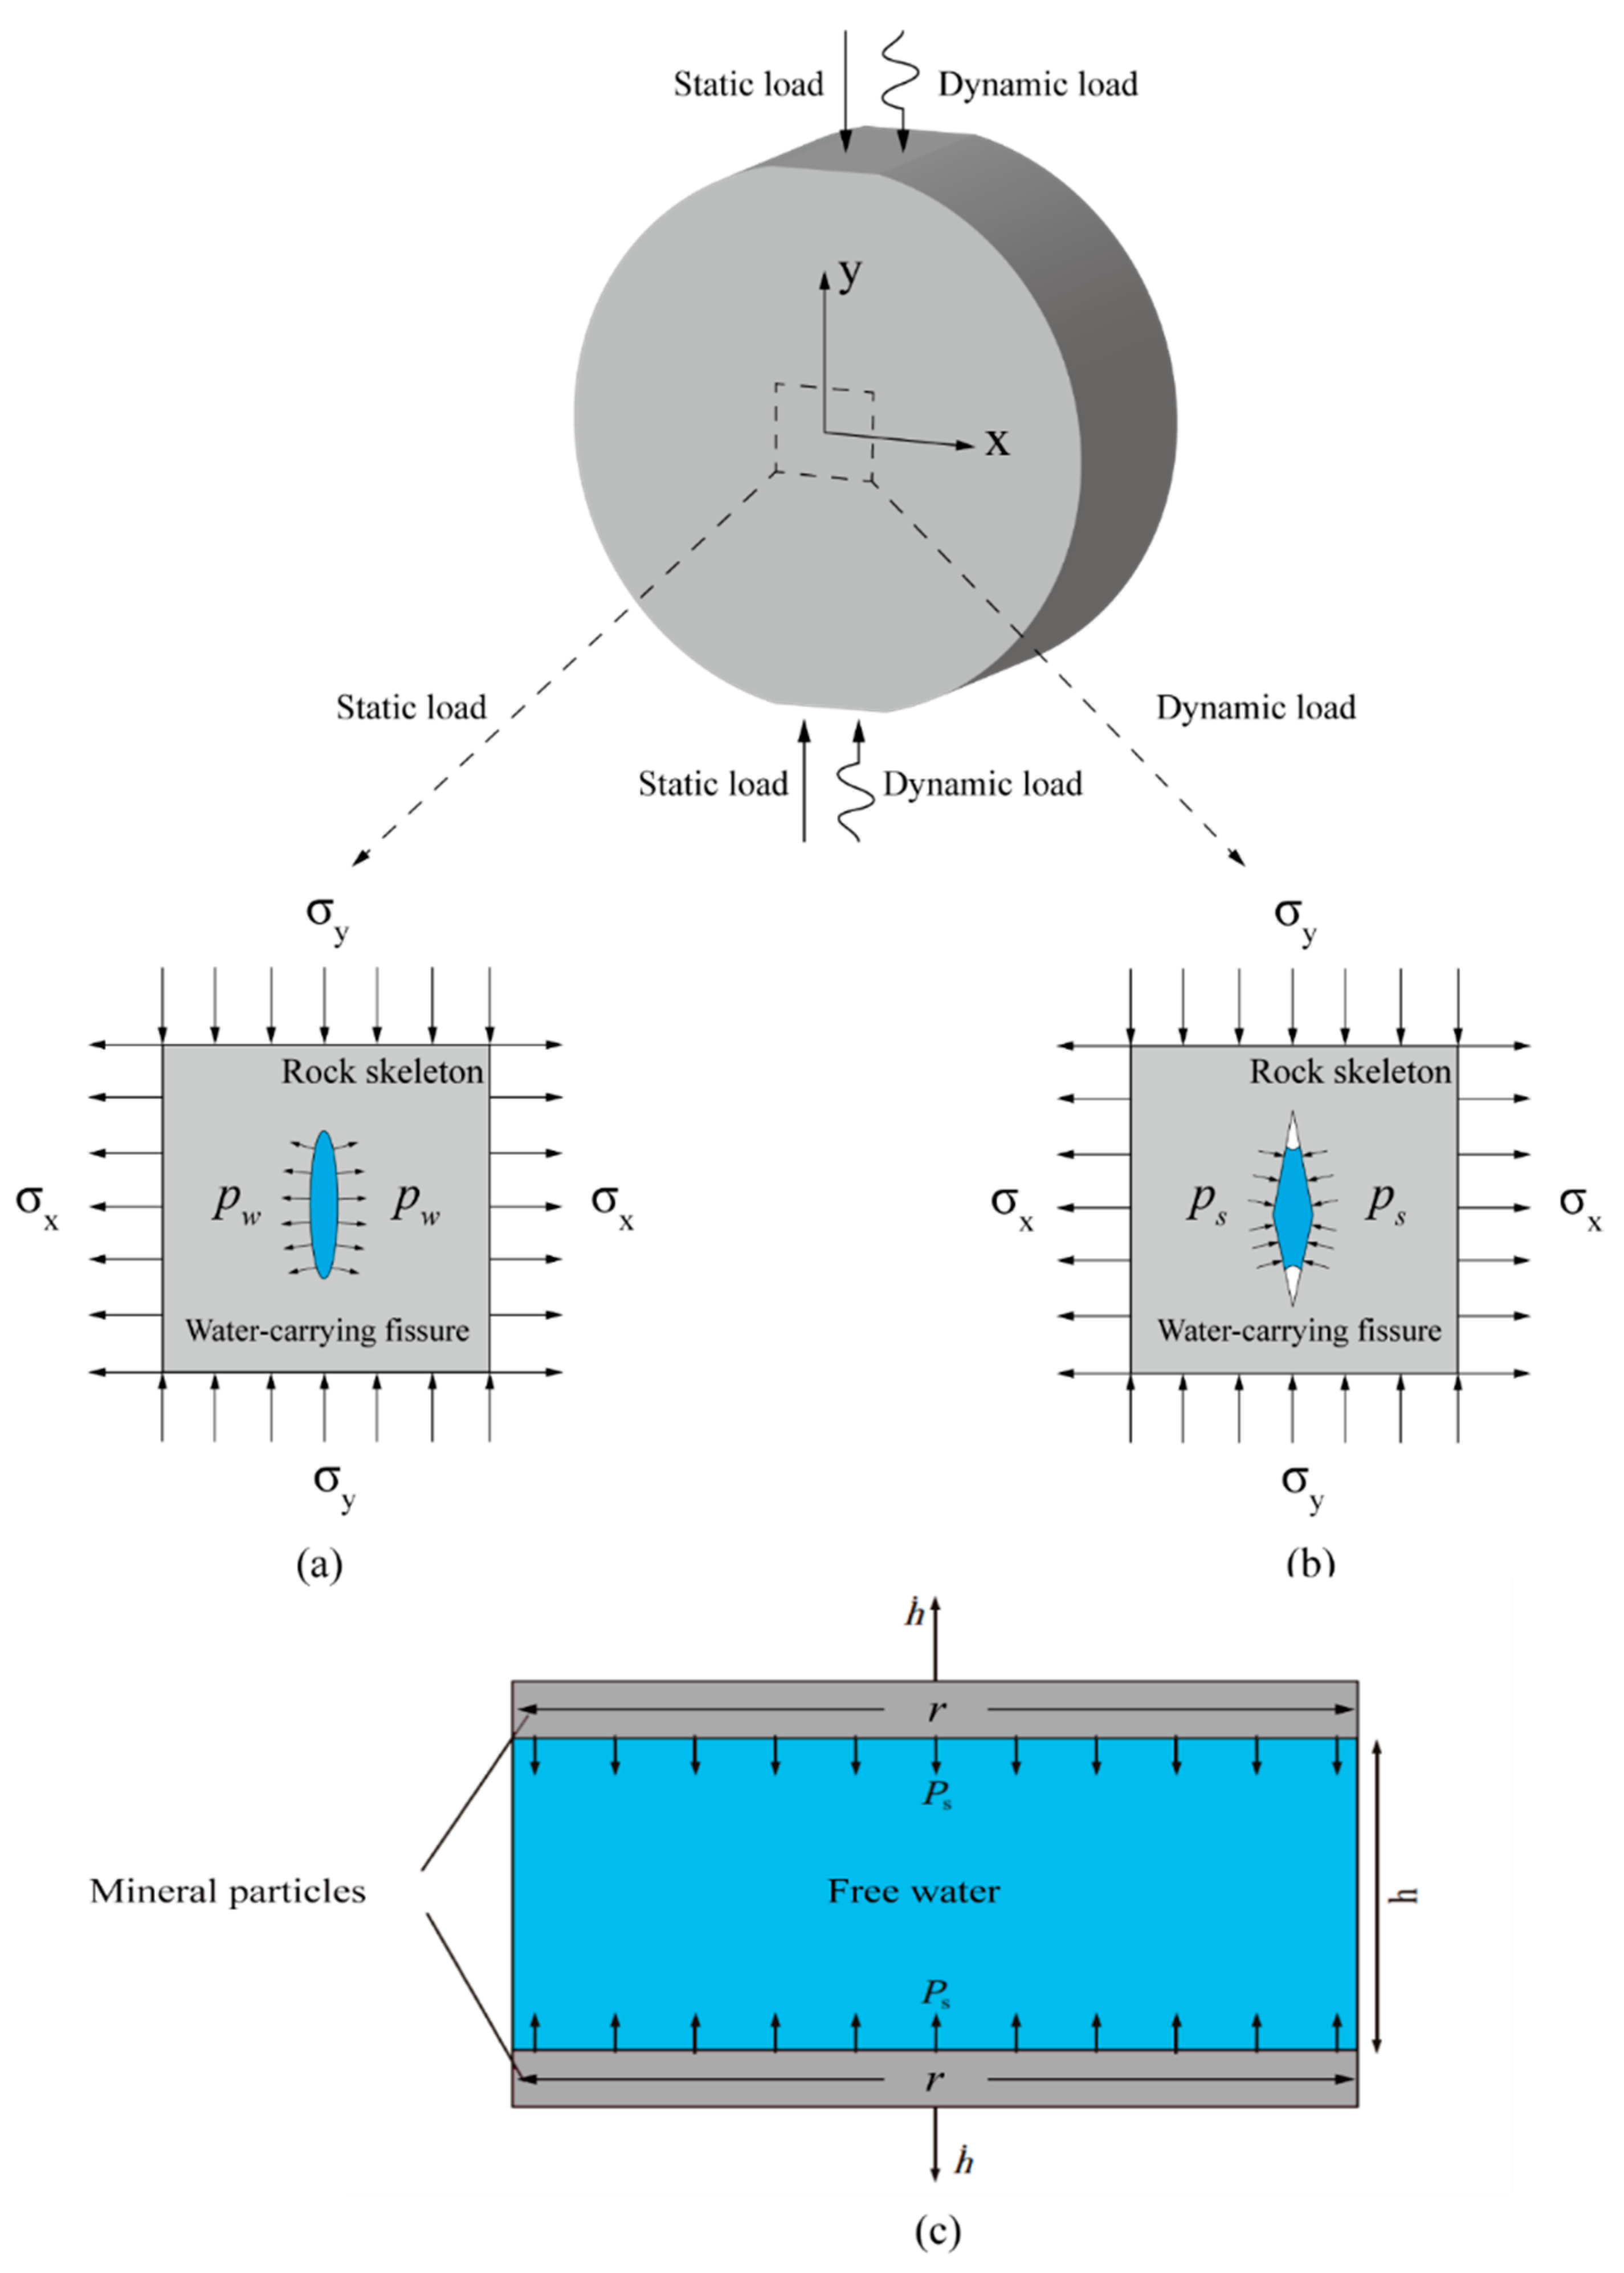
4.2. Micromechanism of Dynamic Tensile Strength Reduction Induced by Water Effects

The weakening effects of water have been widely researched and recognized with respect to the physical and mechanical properties of rock materials [9,10,11,12,13]. The softening coefficient (K) was introduced to evaluate the weakening effect of water on the dynamic tensile strength of sandstone under various external forces, while k is delimited as the specific value of the tensile strength of the naturally saturated sandstone relative to that of the natural sandstone:
K = f F
where f and F represent the tensile strength of sandstone in naturally saturated and natural states, respectively. Thus, the softening coefficient K0 of static tensile strength can be calculated—namely, K0 = 0.803. This can be explained by the fact that the hydrophilic clay minerals in rocks are partially dissolved in the pore water, resulting in reduced cementation strength between the mineral particles, while the friction coefficient between mineral particles will be reduced after saturation, inducing a reduction in the load-bearing capacity.
Figure 9f shows the variation of the softening coefficient versus the loading rate under different pre-tensions. It can be found that, under lower loading rates, the softening coefficient of naturally saturated rocks under pre-static loads is less than the static softening coefficient K0. Moreover, the larger the pre-static load, the smaller the softening coefficient, which indicates that the pre-static load can weaken the dynamic tensile strength of naturally saturated rocks. This can be interpreted, as regards the weakening effect of water on pre-static load, as follows: Firstly, the pre-static load causes compressive deformation of FBD specimens, resulting in the generation of pore water pressure and the migration of pore water to the crack tip in the saturated pores. Moreover, the wedging effect in the saturated pores [34,42], which is induced by pore water under external loads, further promotes the propagation of microcracks, leading to a reduction in tensile strength, as shown in Figure 11a. In addition, when the pre-tension ratio is 0.6 and the loading rate is 54 GPa/s, the time of central crack initiation in naturally saturated rocks and natural rocks is 214.5 μs (Figure 5) and 258.5 μs (Figure 10), respectively, which proves that the pre-static load can weaken the dynamic tensile properties of naturally saturated rocks.
It can be clearly seen from Figure 9f that the softening coefficient gradually increases with the increase in loading rate from—that is, the weakening effects induced by water decrease with loading rate—and the Stefan effect can be used to explained this phenomenon. As shown in Figure 11c, when two plates with a radius of r and a distance of h are separated at a speed h ˙ , the viscous fluid between the plates will generate a reaction force Ps to prevent the two plates from separating. According to the Stefan effect, for saturated rocks, the pore water is considered to be the viscous fluid, while the mineral particles on both sides of the pores are equivalent to the two plates, as shown in Figure 11b,c [43,44,45]. When naturally saturated rocks are subjected to dynamic loads, much like saturated rocks, the mineral particles bear tensile stress and tend to separate from one another. The higher the loading rate, the faster the separation speed of mineral particles, resulting in a larger reaction force to restrain the separation of the mineral particles. Therefore, the softening coefficient decreases with loading rate.

5. Conclusions

In this study, coupled static–dynamic FBD tests were conducted to explore the tensile behavior of naturally saturated sandstone using a modified SHPB device. Five groups of specimens with pre-tension ratios of 0, 0.2, 0.4. 0.6, and 0.8 were tested under a wide loading rate range of 50–300 GPa/s. By careful use of a pulse-shaping technique, the dynamic force equilibrium of the FBD specimens was achieved, and the initiation of the central crack was also observed using high-speed photography and DIC technology. Our experimental results comprehensively revealed the influences of loading rate and pre-static load on the tensile failure mechanism of naturally saturated sandstone. The dynamic tensile strength of naturally saturated sandstone increases with an increase in loading rate at a certain pre-static load, showing an obvious loading rate dependency. Under similar loading rate conditions, the dynamic tensile strength of naturally saturated sandstone decreases with increasing pre-static load, indicating that the pre-tension weakens the dynamic tensile strength of naturally saturated sandstone. Compared with the natural sandstone specimens, the tensile strength of naturally saturated sandstone specimens was lower at a certain pre-tension ratios and loading rates, while both specimens displayed a similar tensile failure process. The comprehensive micromechanism of water’s effects on the dynamic tensile failure of naturally saturated sandstone was discussed, and explained by the weakening effects of water on mechanical properties, the water-wedging effect, and the Stefan effect.

Author Contributions

Conceptualization, X.L. and P.P.; methodology, X.L.; software, Y.L.; validation, F.D. and Y.L.; formal analysis, X.L.; investigation, P.P.; resources, F.D.; data curation, P.P.; writing—original draft preparation, X.L.; writing—review and editing, Z.Y.; visualization, Y.L.; supervision, F.D.; project administration, F.D.; funding acquisition, F.D. All authors have read and agreed to the published version of the manuscript.

Funding

This research was funded by the National Natural Science Foundation of China, grant number 52039007 and 51779164.

Data Availability Statement

All data included in this study are available upon request from the corresponding author.

Acknowledgments

The authors are grateful for the financial support from the National Natural Science Foundation of China (No. 52039007 and No. 51779164).

Conflicts of Interest

The authors declare no conflict of interest.

References

  1. Xiao, P.; Zheng, J.; Dou, B.; Tian, H.; Cui, G.; Kashif, M. Mechanical behaviors of granite after thermal shock with different cooling rates. Energies 2021, 14, 3721. [Google Scholar] [CrossRef]
  2. Du, H.; Dai, F.; Xu, Y.; Yan, Z.; Wei, M. Mechanical Responses and failure mechanism of hydrostatically pressurized rocks under combined compression-shear impacting. Int. J. Mech. Sci. 2020, 165, 105219. [Google Scholar] [CrossRef]
  3. Xiong, F.; Zhu, C.; Jiang, Q. A novel procedure for coupled simulation of thermal and fluid flow models for rough-walled rock fractures. Energies 2021, 14, 951. [Google Scholar] [CrossRef]
  4. Liu, Y.; Dai, F.; Fan, P.; Xu, N.; Dong, L. Experimental investigation of the influence of joint geometric configurations on the mechanical properties of intermittent jointed rock models under cyclic uniaxial compression. Rock Mech. Rock Eng. 2017, 50, 1453–1471. [Google Scholar] [CrossRef]
  5. Wong, L.N.Y.; Maruvanchery, V.; Liu, G. Water effects on rock strength and stiffness degradation. Acta Geotech. 2016, 11, 713–737. [Google Scholar] [CrossRef]
  6. Jiang, R.; Dai, F.; Liu, Y.; Li, A. Fast marching method for microseismic source location in cavern-containing rockmass: Performance analysis and engineering application. Engineering 2021, 7, 1023–1034. [Google Scholar] [CrossRef]
  7. Feng, P.; Dai, F.; Liu, Y.; Xu, N.; Du, H. Coupled effects of static-dynamic strain rates on the mechanical and fracturing behaviors of rock-like specimens containing two unparallel fissures. Eng. Fract. Mech. 2019, 207, 237–253. [Google Scholar] [CrossRef]
  8. Liu, Y.; Dai, F. A damage constitutive model for intermittent jointed rocks under cyclic uniaxial compression. Int. J. Rock Mech. Min. 2018, 103, 289–301. [Google Scholar] [CrossRef]
  9. Liu, Y.; Dai, F.; Feng, P.; Xu, N. Mechanical behavior of intermittent jointed rocks under random cyclic compression with different loading parameters. Soil Dyn. Earthq. Eng. 2018, 113, 12–24. [Google Scholar] [CrossRef]
  10. Dang, W.; Wu, W.; Konietzky, H.; Qian, J. Effect of shear-induced aperture evolution on fluid flow in rock fractures. Comput. Geotech. 2019, 114, 103152. [Google Scholar] [CrossRef]
  11. Zhao, Z.; Yang, J.; Zhang, D.; Peng, H. Effects of wetting and cyclic wetting–drying on tensile strength of sandstone with a low clay mineral content. Rock Mech. Rock Eng. 2017, 50, 485–491. [Google Scholar] [CrossRef]
  12. Zhao, Z.; Yang, J.; Zhou, D.; Chen, Y. Experimental investigation on the wetting-induced weakening of sandstone joints. Eng. Geol. 2017, 225, 61–67. [Google Scholar] [CrossRef]
  13. Koudelka, P.; Fila, T.; Rada, V.; Zlamal, P.; Sleichrt, J.; Vopalensky, M.; Kumpova, I.; Benes, P.; Vavrik, D.; Vavro, L.; et al. In-situ X-ray differential micro-tomography for investigation of water-weakening in quasi-brittle materials subjected to four-point bending. Materials 2020, 13, 1405. [Google Scholar] [CrossRef] [PubMed] [Green Version]
  14. Liu, Y.; Dai, F.; Dong, L.; Xu, N.; Feng, P. Experimental investigation on the fatigue mechanical properties of intermittently jointed rock models under cyclic uniaxial compression with different loading parameters. Rock Mech. Rock Eng. 2018, 51, 47–68. [Google Scholar] [CrossRef]
  15. Wei, M.; Dai, F.; Xu, N.; Zhao, T. Stress intensity factors and fracture process zones of ISRM-suggested chevron notched specimens for mode I fracture toughness testing of rocks. Eng. Fract. Mech. 2016, 168, 174–189. [Google Scholar] [CrossRef]
  16. Guo, R.; Ren, H.; Zhang, L.; Long, Z.; Jiang, X.; Wu, X.; Wang, H. Direct dynamic tensile study of concrete materials based on mesoscale model. Int. J. Impact Eng. 2020, 143, 103598. [Google Scholar] [CrossRef]
  17. Li, D.; Wong, L.N.Y. The Brazilian disc test for rock mechanics applications: Review and new insights. Rock Mech. Rock Eng. 2013, 46, 269–287. [Google Scholar] [CrossRef]
  18. Imani, M.; Nejati, H.R.; Goshtasbi, K. Dynamic response and failure mechanism of Brazilian disk specimens at high strain rate. Soil Dyn. Earthq. Eng. 2017, 100, 261–269. [Google Scholar] [CrossRef]
  19. Zhao, S.; Zhang, Q.; Lesiuk, G. Dynamic crack propagation and fracture behavior of pre-cracked specimens under impact loading by split Hopkinson pressure bar. Adv. Mater. Sci. Eng. 2019, 2019, 1–11. [Google Scholar] [CrossRef] [Green Version]
  20. Yan, Z.; Dai, F.; Liu, Y.; Wei, M.; You, W. New insights into the fracture mechanism of flattened Brazilian disc specimen using digital image correlation. Eng. Fract. Mech. 2021, 252, 107810. [Google Scholar] [CrossRef]
  21. Liu, Y.; Dai, F.; Xu, N.; Zhao, T. Cyclic flattened Brazilian disc tests for measuring the tensile fatigue properties of brittle rocks. Rev. Sci. Instrum. 2017, 88, 083902. [Google Scholar] [CrossRef] [PubMed]
  22. Shi, X.; Liu, D.A.; Yao, W.; Shi, Y.; Tang, T.; Wang, B.; Han, W. Investigation of the anisotropy of black shale in dynamic tensile strength. Arab. J. Geosci. 2018, 11, 1–11. [Google Scholar] [CrossRef]
  23. Suggested ISRM. Method for determining tensile strength of rock material. Int. J. Rock Mech. Min. Sci. Geomech. Abstr. 1978, 15, 99–103. [Google Scholar] [CrossRef]
  24. Swab, J.J.; Yu, J.; Gamble, R.; Kilczewski, S. Analysis of the diametral compression method for determining the tensile strength of transparent magnesium aluminate spinel. Int. J. Fract. 2011, 172, 187–192. [Google Scholar] [CrossRef]
  25. Wong, L.N.Y.; Zou, C.; Cheng, Y. Fracturing and failure behavior of Carrara marble in quasi-static and dynamic Brazilian disc tests. Rock Mech. Rock Eng. 2014, 47, 1117–1133. [Google Scholar] [CrossRef]
  26. Wang, Q.; Jia, X.; Kou, S.; Zhang, Z.; Lindqvist, P.A. The flattened Brazilian disc specimen used for testing elastic modulus, tensile strength and fracture toughness of brittle rocks: Analytical and numerical results. Int. J. Rock Mech. Min. 2004, 41, 245–253. [Google Scholar] [CrossRef]
  27. Wang, Q.; Li, W.; Song, X. A method for testing dynamic tensile strength and elastic modulus of rock materials using SHPB. Pure Appl. Geophys. 2006, 163, 1091–1100. [Google Scholar] [CrossRef]
  28. Chen, R.; Dai, F.; Qin, J.; Lu, F. Flattened Brazilian disc method for determining the dynamic tensile stress-strain curve of low strength brittle solids. Exp. Mech. 2016, 53, 1153–1159. [Google Scholar] [CrossRef]
  29. Liu, Y.; Dai, F.; Xu, N.; Zhao, T.; Feng, P. Experimental and numerical investigation on the tensile fatigue properties of rocks using the cyclic flattened Brazilian disc method. Soil Dyn. Earthq. Eng. 2018, 105, 68–82. [Google Scholar] [CrossRef]
  30. Zhou, Z.; Li, X.; Zou, Y.; Jiang, Y.; Li, G. Dynamic Brazilian tests of granite under coupled static and dynamic loads. Rock Mech. Rock Eng. 2014, 47, 495–505. [Google Scholar] [CrossRef]
  31. Wu, B.; Chen, R.; Xia, K. Dynamic tensile failure of rocks under static pre-tension. Int. J. Rock Mech. Min. 2015, 80, 12–18. [Google Scholar] [CrossRef]
  32. Pei, P.; Dai, F.; Liu, Y.; Wei, M. Dynamic tensile behavior of rocks under static pre-tension using the flattened Brazilian disc method. Int. J. Rock Mech. Min. 2020, 126, 104208. [Google Scholar] [CrossRef]
  33. Liu, Y.; Dai, F. A review of experimental and theoretical research on the deformation and failure behavior of rocks under cyclic loads. J. Rock Mech. Geotech. Eng. 2021. [Google Scholar] [CrossRef]
  34. Zhao, Z.; Guo, T.; Ning, Z.; Dou, Z.; Dai, F.; Yang, Q. Numerical modeling of stability of fractured reservoir bank slopes subjected to water-rock interactions. Rock Mech. Rock Eng. 2018, 51, 2517–2531. [Google Scholar] [CrossRef]
  35. Du, H.; Dai, F.; Liu, Y.; Xu, Y.; Wei, M. Dynamic response and failure mechanism of hydrostatically pressurized rocks subjected to high loading rate impacting. Soil Dyn. Earthq. Eng. 2020, 129, 105927. [Google Scholar] [CrossRef]
  36. Yan, Z.; Dai, F.; Liu, Y.; Du, H.; Luo, J. Dynamic strength and cracking behaviors of single-flawed rock subjected to coupled static–dynamic compression. Rock Mech. Rock Eng. 2020, 53, 4289–4298. [Google Scholar] [CrossRef]
  37. Zhou, X.; Wang, Y.; Zhang, J.; Liu, F. Fracturing behavior study of three-flawed specimens by uniaxial compression and 3D digital image correlation: Sensitivity to brittleness. Rock Mech. Rock Eng. 2019, 52, 691–718. [Google Scholar] [CrossRef]
  38. Guo, J.; Feng, G.; Qi, T.; Wang, P.; Yang, J.; Li, Z.; Bai, J.; Du, X.; Wang, Z. Dynamic mechanical behavior of dry and water saturated igneous rock with acoustic emission monitoring. Shock. Vib. 2018, 2018, 2348394. [Google Scholar] [CrossRef] [Green Version]
  39. Kahraman, S. The correlations between the saturated and dry P-wave velocity of rocks. Ultrasonics 2007, 46, 341–348. [Google Scholar] [CrossRef]
  40. Wang, S.; Li, H.; Wang, W.; Li, D.; Yang, W. Experimental study on strength, acoustic emission, and energy dissipation of coal under naturally and forcedly saturated conditions. Adv. Civ. Eng. 2018, 2018, 1049802. [Google Scholar] [CrossRef]
  41. Dai, F.; Xia, K. Loading Rate Dependence of tensile strength anisotropy of barre granite. Pure Appl. Geophys. 2010, 167, 1419–1432. [Google Scholar] [CrossRef]
  42. Zhou, Z.; Cai, X.; Ma, D.; Chen, L.; Wang, S.; Tan, L. Dynamic tensile properties of sandstone subjected to wetting and drying cycles. Constr. Build. Mater. 2018, 182, 215–232. [Google Scholar] [CrossRef]
  43. Wang, Y.; Zhou, X.; Kou, M. Three-dimensional numerical study on the failure characteristics of intermittent fissures under compressive-shear loads. Acta Geotech. 2019, 14, 1161–1193. [Google Scholar] [CrossRef]
  44. Rossi, P. A physical phenomenon which can explain the mechanical behavior of concrete under high strain rates. Mater. Struct. 1991, 24, 422–424. [Google Scholar] [CrossRef]
  45. Zheng, D.; Li, Q. An explanation for rate effect of concrete strength based on fracture toughness including free water viscosity. Eng. Fract. Mech. 2004, 71, 2319–2327. [Google Scholar] [CrossRef]
Figure 1. Modified split-Hopkinson pressure bar device.
Energies 14 04784 g001
Figure 2. (a) Schematic of the FBD specimens under simultaneous dynamic and static loading. (b) Naturally saturated FBD specimens employed in our tests. (c) Curve of average moisture content in FBD specimens versus immersion time.
Energies 14 04784 g002
Figure 3. Splitting tests on naturally saturated FBD specimens under quasistatic loads: (a) load–displacement curve; (b) fracture behavior at disc center.
Energies 14 04784 g003
Figure 4. (a) Force histories of the bars for specimen SC-1. (b) Tensile stress history of specimen SC-1 under coupled static–dynamic loading.
Energies 14 04784 g004
Figure 5. Progressive fracture process of specimen SC-1 under simultaneous dynamic and static loading.
Energies 14 04784 g005
Figure 6. The variation of dynamic tensile strength versus loading rate at a specified static pre-tension: (a) 0 MPa for group SA; (b) 1.1 MPa for group SB; (c) 2.2 MPa for group SC; (d) 3.3 MPa for group SD; and (e) 4.4 MPa for group SE. Panel (f) shows the relationship between dynamic tensile strength and loading rate at certain pre-tension ratios.
Energies 14 04784 g006
Figure 7. Dynamic tensile strength versus pre-tension ratio curve of naturally saturated FBD specimens under different loading rates.
Energies 14 04784 g007
Figure 8. (a) The diversification of dynamic tensile strength under various external load conditions for natural rocks. (b) The diversification of dynamic tensile strength under various external load conditions for naturally saturated rocks. (c) The curve of the upper and lower limits of the rate effect difference of natural and naturally saturated rocks versus static pre-tension ratio.
Energies 14 04784 g008
Figure 9. The variation in dynamic tensile strength versus loading rate for naturally saturated and natural sandstone under a specified static pre-tension: (a) 0 MPa, (b) 1.1 MPa, (c) 2.2 MPa, (d) 3.3 MPa for, and (e) 4.4 MPa. (f) The relationship between softening factor and loading rate under different pre-tensions.
Energies 14 04784 g009
Figure 10. Progressive fracture process of a dry FBD specimen under coupled static–dynamic loading.
Energies 14 04784 g010
Figure 11. Pore water effect on rock under coupled static–dynamic loading: (a) pore water pressure under pre-static load promotes crack growth; (b) Stefan effect hinders crack growth under dynamic load; (c) a schematic diagram of the Stefan effect.
Energies 14 04784 g011
Table 1. Quasistatic test results of naturally saturated sandstone specimens.
Specimen No.Peak Force (KN)Tensile Strength (MPa)
S-135.415.62
S-234.015.40
S-336.495.79
S-433.545.32
S-535.055.56
Average34.95.5
Table 2. Coupled static–dynamic FBD test results of naturally saturated sandstone specimens.
Pre-Tension RatioSpecimen No.Loading Rate (GPa/s)Dynamic Tensile Strength (MPa)
0.0SA-156.578.45
SA-273.9310.83
SA-395.2311.59
SA-4241.2716.29
SA-5138.9613.67
SA-6187.5314.24
SA-7210.4315.73
SA-8274.0317.22
0.2SB-154.977.90
SB-281.8011.14
SB-3141.8013.63
SB-4202.4715.51
SB-5207.3215.00
SB-6249.4716.52
SB-7342.5818.73
SB-8318.1617.95
0.4SC-154.367.51
SC-2102.4111.06
SC-3154.5013.53
SC-4176.0114.26
SC-5128.6112.72
SC-6283.0316.56
SC-7330.0117.47
SC-8251.1015.81
0.6SD-154.027.05
SD-267.319.44
SD-3124.2011.79
SD-4208.4114.37
SD-5210.7414.83
SD-6177.2214.13
SD-7300.6016.54
SD-8258.6815.61
0.8SE-158.376.73
SE-2109.0510.40
SE-3157.4012.56
SE-4211.2014.25
SE-5226.0214.46
SE-6198.8113.34
SE-7333.0916.31
SE-8283.2415.39
Table 3. Rate effect difference of natural and naturally saturated sandstone specimens.
Pre-Tension RatioUpper Limit of Rate Effect Difference (%)Lower Limit of Rate Effect Difference (%)
0.07.400.78
0.29.091.51
0.48.360.39
0.67.990.75
0.817.142.25
Publisher’s Note: MDPI stays neutral with regard to jurisdictional claims in published maps and institutional affiliations.

