Abstract
The exploitation of bioenergy plays a key role in the process of decarbonising the economic system. Huge efforts have been made to develop bioenergy and other renewable energy systems, but it is necessary to investigate the costs and problems associated with these technologies. Soil consumption and, in particular, soil sealing are some of these aspects that should be carefully evaluated. Agricultural biogas plants (ABPs) often remove areas dedicated to agricultural activities and require broad paved areas for the associated facilities. This study aimed to (i) assess the surfaces destined to become facilities and buildings in ABPs, (ii) correlate these surfaces with each other and to the installed powers of the plants, and (iii) estimate the consumption of soil in bioenergy applications in Italy. Two hundred ABPs were sampled from an overall population of 1939, and the extents of the facilities were measured by aerial and satellite observations. An ABP with an installed power of 1000 kW covers an average surface area of up to 23,576 m2. Most of this surface, 97.9%, is obtained from previously cultivated areas. The ABP analysis proved that 24.7 m2 of surface area produces 1 kW of power by bioenergy. The obtained model estimated a total consumption of soil by ABPs in Italy of 31,761,235 m2. This research can support stakeholders in cost-benefit analyses to design energy systems based on renewable energy sources.
1. Introduction
Bioenergy is one of the most commonly used forms of renewable energy [1] because of both the wide range of suitable biomasses and the ease of energy production and storage [2,3]. However, studies are progressing in the field of optimising the benefits of biomass exploitation, especially regarding by-products [4], in the optimal location of bioenergy plants [5], in the consideration of bioenergy districts [6], and in the maximization of economic profits by minimizing the transportation and processing costs [7,8,9].
Agricultural activities play a key role in developing and managing bioenergy systems [10]. This sector can be an integral part of rural community economies and of agricultural processes [11]. The applications of bioenergy can contribute to reducing carbon emissions produced by agricultural activities [12,13] and by industrial and manufacturing activities [14]; this aspect could lead to an actual conversion of the energy system [15]. From economic and social points of view, bioenergy contributes to creating an energy system based on the local production of resources and an increased awareness in local communities [16,17]. Among the technical opportunities, the advantages of the treatment of livestock effluents in digesters should be considered; the digestate is a stable product for nitrogen removal and can be used as a fertilizer in agronomic activities [18]. Together with these opportunities, some issues must be carefully considered. It is essential to carefully consider all the implications, including both the benefits and problems, that can arise when using biomasses for energy purposes [19]. One of the most important problems is the competition between the energy and food destinations of crops [20].
Regarding the use of land for energy crops, preserving the soil conditions is a crucial issue [21]; many studies have discussed how to conjugate energy crops with environmental protection [22] by considering areas not suitable for agricultural cultivations [23], such as marginal lands [24,25] and grasses harvested on riverbanks [26]. However, on a large scale, it has been extensively explained that bioenergy systems based on energy crops are the basis of vast cultivated area losses [27] because of the depletion of organic carbon [28], soil erosion [29], and the occupation of land that cannot be used for food production [13,30]. For these reasons, the use of by-products allows the consideration of only the land area of a bioenergy plant as the land occupied for bioenergy production, thus not affecting agricultural production in the territory. This approach allows broad areas of cultivated land to be saved. Considering the most important crops used for energy purposes [31] and their yields per hectare and energy value, it can be determined that providing the diet for an agricultural biogas plants (ABP) with a power of 1000 kW requires a wide area of land (Table 1).

Table 1.
Land area necessary to supply, with energy crops, an ABP with an installed power of 1000 kW.
When using by-products, the areas to be considered in estimating land use are only those areas that are necessary for the energy plants and the related facilities [38] because soil consumption for primary crops does not lead to the direct loss of utilized agricultural areas (UAA) destined for food production. For these reasons, it is crucial to focus attention on by-products and waste products from agricultural activities to avoid detrimental competition. The use of by-products and livestock waste, which does not affect food production, can support the construction of a new energy system and represents a valid opportunity for new types of businesses in rural communities [39,40].
Currently, several types of agricultural by-products can be used for energy production: straw [41], grass [42], pruning residues [43], and livestock manure [44,45]. However, even the use of by-products involves the consumption of soil because of the construction of anaerobic digestion plants. Soil provides a multitude of ecosystem services that are essential for environmental sustainability and, more broadly, for human survival [46,47]. However, soil is a limited and non-renewable resource and should only be consumed to the extent that is it needed [48]. A concrete signal aimed at the protection and sustainable consumption of soil has been launched by the European Commission, which has set challenging targets to limit, mitigate, and compensate soil sealing, the leading cause of degradation [49]. The permanent covering of soil by buildings, roads, or other impermeable anthropic materials causes soil sealing [50,51]. This permanent condition entails severe consequences to soil functioning [52], including rising temperatures in the atmosphere near urban areas [53], flooding caused by increasing volumes of stormwater [54], and reductions in hydraulic conductivity and the infiltration rate [55].
The current literature presents some general studies that summarize the most common practices regarding the design and construction phases of bioenergy plants [56] and identifies the critical phases in biogas plant construction processes [57]. A standard scheme of a biogas plant includes the following components:
- –
- Roads: both for the connection to the road network and inner traffic circulation. These roads include service areas for parking vehicles.
- –
- Storage surface: where silage is stored. These components can be bunker silos, concrete enclosures filled, packed, and covered with plastic cloth to make them airtight, or silo-bags, polyethylene bags consisting of several co-extruded layers of plastic film.
- –
- Digestion unit: this is where microbial activity occurs and where organic biomass is transformed into biogas.
- –
- Other facilities: tanks, storage sites, and other buildings used for technical and administrative needs.
Several authors have broadly studied the structures and elements present in biogas plants to describe the differences among facilities based on the feedstock used [58]. In recent studies, attention has been given to automatizing the production process to obtain flexible digester technology that is robust and suitable for handling variable feedstock characteristics [59].
Quantifying the surfaces covered by these structures allows the determination of the actual consumption of soil by bioenergy and permits the comparison of this value with those of other forms of renewable energy.
The present study aimed to analyse the impacts on land consumption that occur because of the construction of ABPs for producing renewable energy by providing information and quantitative details on the presence and characteristics of these plants in the Italian territory. In this analysis, the impact of the construction of new digesters on agricultural land was verified; the use of land dedicated to energy crops was not considered, but particular attention was focused on facilities and areas dedicated to anaerobic digestion systems.
The objective of this study was thus to provide a reliable parametrization of soil consumption of anaerobic digestion plants for biogas production, with specific reference to the Italian area. Analysis included identification of the different parts of digestion plants and proposed a modelling as a function of installed power. This value will allow a comparison with other renewable energy sources, to establish an effective environmental impact of bioenergy production.
2. Materials and Methods
2.1. Italian Biogas Plants
In 2008, there were 352 bioenergy plants in Italy, with an installed power of 1555.3 MW and a production capacity of 7631 GWh. In 2019, this number increased to 2835 bioenergy plants (Figure 1) in operation with a total installed power of 4119.7 MW [60] and a production capacity of 19,562 GWh of electric energy [61].
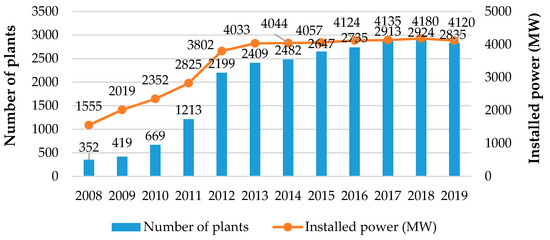
Figure 1.
Number of bioenergy plants and amount of installed power in Italy from 2008 to 2019.
2.2. Data Collection and Sampling
This research was performed using data supplied by the national database of biomass energy production plants, Atlaimpianti, made available by Gestore Servizi Energetici (GSE), which is the energy services managing authority. The database collects all the information for each registered plant: the bioenergy source (biogas, liquid biomass, solid biomass, waste), location, and installed power. The location of each plant is defined by its region (NUTS-2 level), province (NUTS-3 level), municipality, and coordinates.
Of the 2835 registered biomass plants, 1939 agricultural biogas plants were specifically identified for the analysis and subsequent sampling because they were supplied by agricultural products such as energy crops, by-products, or animal waste. Each ABP was analysed on the basis of both the declared power supply and the installed power.
In terms of the installed nominal power capacities, the distribution of the plants showed that most of them have installed power capacities up to 1000 kW (Table 2). This is due to the eco-incentive tariff that was enforced from 2008 until 2012, which provided an all-inclusive tariff of 0.28 €/kWh undifferentiated for ABPs up to 999 kW [61].
Table 2.
Frequency of digesters categorized by their power capacities.
The data show that the power class between 800 and 1000 kW is the most frequent; 36.8% of the plants fall within this range (714 plants), comprising 53.3% of the total installed power (704.5 GW). The percentage of digesters with powers between 990 and 999 kW is 28.4% (equal to 551 plants), with 41.6% of the installed power (550.2 GW); the threshold for incentives is exactly 999 kW, which has led to the adoption of many systems with powers within this range. There is a decreasing trend in frequency from small installations below 200 kW to those with powers of 800 kW. Larger plants, with more than 1000 kW of power output, are also much less frequent.
A random sampling selection was applied to the available dataset. Through this technique, of the 1939 biogas plants, a significant set of 200 Italian ABPs were selected and constituted the sample for this analysis. These digesters were selected randomly while respecting the distributional proportions of the plants in Italy to obtain a representative result of the actual situation with which to perform the desired analyses and to obtain conclusions with the lowest possible biases. In this work, ABPs with various powers were sampled, ranging in power capacity from 60 kW to 1156 kW (Figure 2). The biogas plants are represented with their installed power. Most of the ABPs are in northern Italy, and the distribution of the sampled plants is consistent with that of the entire sample; intensive agricultural activities are practised more intensively in these regions because there is a higher availability of resources for bioenergy production.
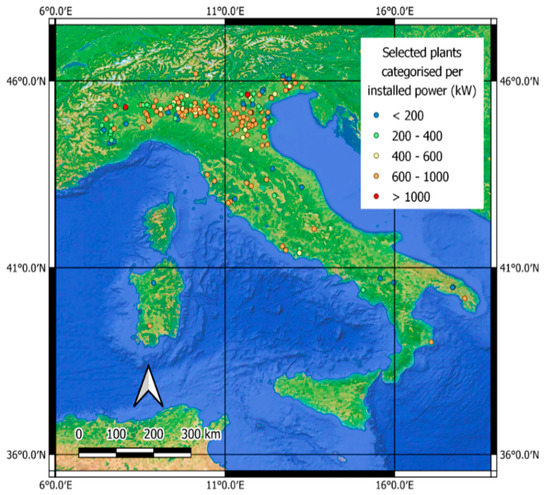
Figure 2.
Map of biogas plants in Italy.
The distribution of the installed nominal power capacities of the studied plants is represented in Table 3. Most of the sample plants have an installed power between 800 and 1000 kW, comprising 94 plants (47.0% of the total), with an overall installed power of 93.5 GW (70.7% of the total). In the sample, there are 80 biogas plants (40.0% of the total) with an installed power between 990 kW and 999 kW, with a total installed power of 79.9 GW (60.4% of the total).
Table 3.
Frequency of sampled digesters split by power capacity.
2.3. Data Processing and Analysis
To characterise the sizes and occupied areas of the studied plants, in addition to the information described above, in the present study, additional satellite and aerial imagery was included by the Google Earth Pro TM tool (Google Inc., Mountain View, CA, USA), which provides detailed images of the entire surface of the globe (Figure 3), allowing extensive territorial analysis [62]. The software is equipped with two useful functions: (i) it allows the measurement of areas from aerial images and (ii) it makes available, for a given area, in addition to the most-updated images, images from the past, allowing their comparison and thus the evaluation of changes that have occurred in the territory over time. Once a national database system was selected, its nominal power (expressed in kW) was noted. Subsequently, its position was identified in Google Earth Pro using the latitude and longitude coordinates included in the database provided by GSE.
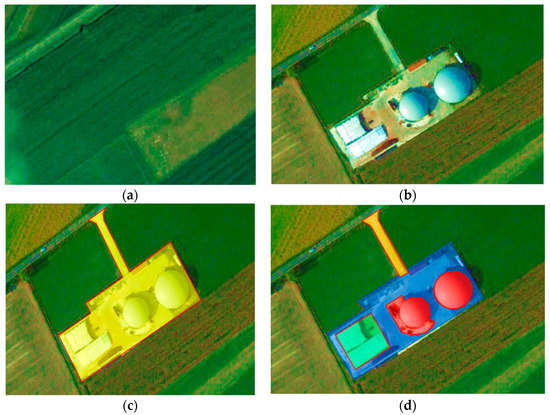
Figure 3.
Before (a) and after (b) situation of a soil surface converted from agricultural cultivation land into a plant for anaerobic digestion with the scheme of the built structures. The total area occupied by the plant (c); the land surface occupied by digester structures (red), storage surfaces (green), new roads (orange), and other structures and remaining areas (blue) (d).
Then, once each plant was located, measurements of the following parameters were collected (Figure 3):
- –
- Total area occupied by the biogas plant: the total surface area dedicated to the plant, including the manoeuvring spaces, loading unloading spaces, and other structures such as those used for storage or as sheds, as realised contextually with the biogas plant.
- –
- Surface occupied by structures: the area occupied by digester structures, including the anaerobic digester, engine generator, and the technical space assigned to the plant.
- –
- Surface occupied by storage areas: the surface occupied by storage facilities for the organic material destined to feed the plant.
- –
- Surface occupied by new roads: the new roads specifically built to make the plant accessible.
- –
- Remaining area: the remaining covered land dedicated to the plant that does not fall within the other categories, calculated by subtracting all the other surface areas from the total area. The remaining area includes yards, manoeuvring areas, and technical structures that are not directly part of the digester but form part of the plant and are therefore built together with the plant; for example, stables or residential buildings are not included.
Using this combined analytical–visual method, data from 200 ABPs were integrated and analysed. The ABPs were analysed individually and aggregated per power class to reduce the noise due to outlier values.
3. Results and Discussion
3.1. Biogas Plant Area Analysis
The biogas plant-covered surfaces were correlated with the related technical and performance parameters (Figure 4). The 200 analysed digesters supply a total power of 132,263 kW and cover a total area of 3,259,663 m2, divided as follows: 413,276 m2 occupied by digester facilities (12.7% of the total); 730,200 m2 occupied by storage surfaces (22.4% of the total); 2,096,534 m2 comprising remaining areas (64.3% of the total); and 19,652.2 m2 of new roads (0.6% of the total). On average, one ABP requires 16,380 m2 of land.
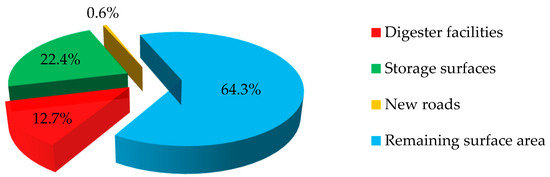
Figure 4.
Percentage breakdown of the total area occupied by installations with their intended uses.
On average, 64.3% of the covered surface area is free from any facility dedicated to anaerobic digestion. For 24 of the studied biogas plants, this percentage is above 75%, and for 18 of them, up to 2 hectares are allocated in this manner. These values demonstrate how crucial the proper planning of inner traffic circulation in biogas plants is for reducing soil sealing. The remaining 35.7% of the area is divided between areas occupied by the plant and areas dedicated to storage systems. The latter category occupies more than one-fifth of the total area because of the large volume of biomass that must be stored to allow the continuous and efficient operation of the anaerobic digestion process. In 58 ABPs, the surfaces occupied for storage exceed 5000 m2. This value highlights the importance of an efficient supply of feedstock. The digester, the main element of each complex, occupies, on average, together with the technical installations, a relatively small portion of the total space, covering up to 0.5 ha only in 7 sampled plants. The surfaces converted from agricultural areas to new roads compose the remaining 0.6%. Only in 16 cases were new roads asphalted from scratch; all the other systems were installed in easily accessible areas thanks to existing roads.
3.2. Analysis of Punctual Trends
The results of the punctual trend analysis and its statistical significance inferred from the sample data analysed for Italian ABPs are reported and discussed. The correlation between the total surface areas and the areas occupied by digesters was studied (Figure 5). These digesters, mainly composed of digestion tanks or engine placement buildings, occupied 12.7% of the total area. The results showed that there is a correlation between the two considered measurements, with an R2 value equal to 0.55, especially in cases where the surface area dedicated to digesters was below 3000 m2, as in 162 cases; here, the areas dedicated to the digester structures and the total areas grow proportionally, and there is very low dispersion.
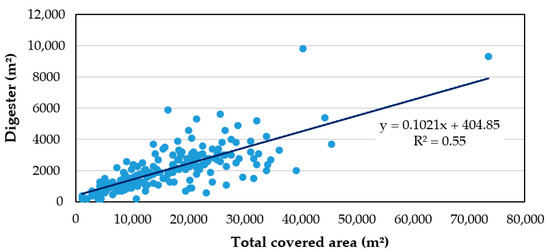
Figure 5.
Correlation between digester facilities areas and total covered area.
The relationship between the total surface areas and the areas intended for storage was also studied (Figure 6). On average, storage areas occupy 22.4% of the total surface area; the determination index was R2 = 0.56 and the p-value < 0.0001, attesting to the high correlation between the two variables. Only in 33 plants did the area dedicated to the storage surface exceed 30% of the overall surface area, and in 11 cases, the storage surface area was less than 10% of the total covered area.
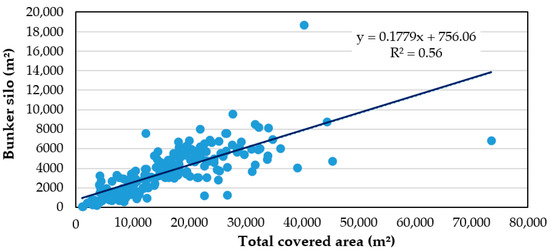
Figure 6.
Correlation between storage areas and total covered area.
The particular condition of the plants could have led to higher or lower values of the parameters; for example, the use of existing structures or service areas or the presence of multiple areas for bunker silos, due to a process of conversion, determined larger areas compared to the model. These plants were not excluded by the analysis because they represent actual situations that have to be considered in the general model.
3.3. Analysis of Aggregated Trends
The digesters were grouped into six power classes so as to have a less distributed and therefore more clear representation of the analysed data. The study of the classes allowed the identification of soil consumption for the different levels of installed power, including the two most frequent sizes in the Italian area: 300 kW and 999 kW. For each class, a different number of observations was reported, with almost half of the surveys reporting powers greater than 900 kW, which was coherent with the actual composition of the overall population of ABPs. The value of each class corresponds to the average of the observations that compose the class. The total area occupied by each ABP was reported as a function of its installed power (Figure 7).
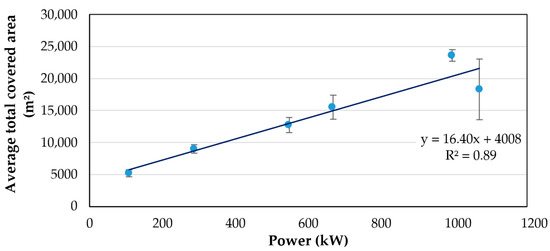
Figure 7.
Relation between installed power and average total covered area (m2).
The obtained model can be described by Equation (1) as follows:
where:
TCA = 16.40 ∙ IP + 4008
TCA is the total covered area (expressed in square meters);
IP is the installed power (expressed in kilowatts).
The resulting coefficient of determination was R2 = 0.89, providing evidence of a high correlation between the two parameters; the p-value = 0.004 also indicated a statistically significant correlation. Given the slope of the line, the model showed that the average consumption of soil increased by 16.4 m2 per kilowatt-hour requested. The model indicated an intercept equal to 4008 m2, which can be fixed as the minimum surface occupied by a plant facility. However, this value was highly correlated to the size of the plants and, to better clarify this point, the average land consumption (LC) of the ABPs was calculated based on different values of installed power. The relations between the average installed power and the LC per kilowatt installed were assessed. These relations considered the LC due to the digester unit, the bunker silo, and the total plant area.
In Figure 8, the relation between the installed power and the average LC per installed kilowatt is reported. The model indicated an increase in efficiency for larger plants: a biogas plant with an installed power ranging between 0 and 200 kW occupies on average 49 m2 per kilowatt, whereas biogas plants with 801–1000 kW needs on average 24 m2 per kilowatt. The resulting parameters and the p-value = 0.002 provide indication of a statistically significant correlation
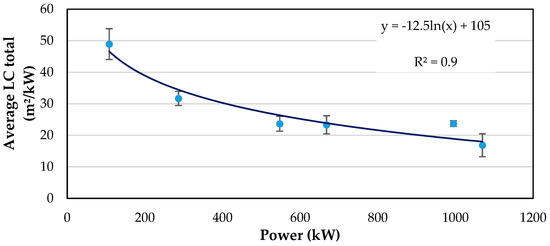
Figure 8.
Relation between installed power and average total LC (m2/kW).
In order to define the influence of installed power on the size of different ABP structures, the installed power was studied along with the average LC of the digester (Figure 9a) and the bunker silo (Figure 9b). On average, biogas plants with an installed power lower than 200 kW had 6.6 m2/kW occupied by the digester and 9.3 m2/kW by the bunker silo. These values reduced to 2.9 m2/kW and 5.5 m2/kW, respectively, for biogas plants ranging between 801 and 1000 kW. The coefficient of determination as well as the p-value of the two models indicated a high correlation between the variables (installed power vs. average digester LC, p < 0.001; vs. average bunker silo LC, p = 0.013). The model can be thus implemented in order to reliably estimate the surface request of these bioenergy energy plants and predict soil consumption for a given value of plant power.
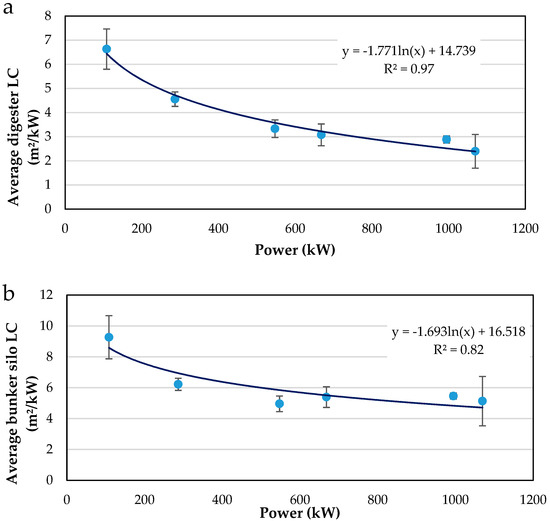
Figure 9.
Relation between installed power and average digester LC (a) and average bunker silo LC (b).
3.4. Soil Consumption of Bioenergy
The study concluded that one ABP requires an average surface area of 16,380 m2. Observing the aerial images of the studied ABPs, 97.9% of the plant surfaces were previously used as agricultural areas. Reporting these values to the overall population of biogas plants, with 1939 ABPs, it was assessed that 31.8 km2 (i.e., 3176 ha) of land has been dedicated to ABPs in Italy, most of which (3109 ha) consisted of previously cultivated areas. To better understand this value, it should be kept in mind that between 2012 and 2017 in Italy, an average of 49.7 square km of land was consumed for new urbanization each year [63].
The energy productivity of these plants was assessed: at 40.5 W/m2, to produce 1 kW of electric energy, an average surface area of 24.7 m2 is necessary. These results can be compared with those derived from preliminary studies of other forms of electric energy production collected by the same authors (Table 4).
Table 4.
Land use requirements for different energy plants.
To produce 1 kW of electric energy with photovoltaic panels, on average, 144 m2 of land surface is necessary, whereas to produce the same amount of energy with onshore wind systems, 5.6 m2 of land surface is needed. Considering the largest thermal power stations operating in Italy, it was assessed that to produce 1 kW of electric energy, 2.63 m2 must be occupied by the plant. The wide differences among these values reflect the huge differences among various energy production forms. Moreover, to achieve a reliable balance of the environmental impact of biogas plants, other features must be taken into consideration: polluting gas emissions, non-renewable resource consumption, and impacts on local communities.
4. Conclusions
In this study, the consumption of soil by anaerobic digestion plants in Italy was analysed. The analysis only considered ABPs and did not involve those using forest biomasses or municipal waste products. A sample of 200 ABPs was randomly selected for the analysis from the entire population of 1939 biogas plants operating in Italy. It was found that to produce 1 kW of electric energy power, it is necessary to cover 24.7 m2 of the land surface. This surface is dedicated to the digesters and related machinery (3.1 m2/kW), bunker silos and other storage areas (5.5 m2/kW), new roads built for the plants (0.1 m2/kW), and other covered areas related to the plants, such as yards, manoeuvring areas, and technical structures that are not directly part of the digesters but form part of the plants and are therefore built together with plants (15.9 m2/kW).
This study assessed the proportionality among the areas of facilities and between these areas and the installed powers. This model makes it possible to estimate the total surface area covered by this type of renewable energy. Future research could compare the results achieved herein with other renewable energy sources to estimate the consumption of land and the extent of soil sealing. It would also be important to consider the consequences of the use of energy crops in land consumption and its effects on agricultural spatial planning.
Author Contributions
Conceptualization, F.M. and A.P.; data curation, G.F. and M.S.; investigation, G.F. and F.I.; methodology, G.F., F.M., and A.P.; software, G.F., F.I., and M.S.; supervision, F.M. and A.P.; validation, G.F., M.S., F.M., and A.P.; writing—original draft, G.F.; writing—review & editing, F.M. and A.P. All authors have read and agreed to the published version of the manuscript.
Funding
This research received no external funding.
Institutional Review Board Statement
Not applicable.
Informed Consent Statement
Not applicable.
Data Availability Statement
Not applicable.
Acknowledgments
The authors are grateful to the Gestore Servizi Energetici (Italian National Grid Operator) for data provided (https://www.gse.it/, accessed on 22 March 2020).
Conflicts of Interest
The authors declare no conflict of interest.
References
- World Bioenergy Association. WBA Global Bioenergy Statistics 2018. Available online: http://www.worldbioenergy.org/uploads/181017%20WBA%20GBS%202018_Summary_hq.pdf (accessed on 23 June 2021).
- Yılmaz Balaman, Ş.; Selim, H. Sustainable design of renewable energy supply chains integrated with district heating systems: A fuzzy optimization approach. J. Clean. Prod. 2016, 133, 863–885. [Google Scholar] [CrossRef]
- Ferrari, G.; Pezzuolo, A.; Nizami, A.-S.; Marinello, F. Bibliometric Analysis of Trends in Biomass for Bioenergy Research. Energies 2020, 13, 3714. [Google Scholar] [CrossRef]
- Mirkouei, A.; Haapala, K.R.; Sessions, J.; Murthy, G.S. A mixed biomass-based energy supply chain for enhancing economic and environmental sustainability benefits: A multi-criteria decision making framework. Appl. Energy 2017, 206, 1088–1101. [Google Scholar] [CrossRef]
- Delivand, M.K.; Cammerino, A.R.B.; Garofalo, P.; Monteleone, M. Optimal locations of bioenergy facilities, biomass spatial availability, logistics costs and GHG (greenhouse gas) emissions: A case study on electricity productions in South Italy. J. Clean. Prod. 2015, 99, 129–139. [Google Scholar] [CrossRef]
- Karschin, I.; Geldermann, J. Efficient cogeneration and district heating systems in bioenergy villages: An optimization approach. J. Clean. Prod. 2015, 104, 305–314. [Google Scholar] [CrossRef]
- Mohr, L.; Burg, V.; Thees, O.; Trutnevyte, E. Spatial hot spots and clusters of bioenergy combined with socio-economic analysis in Switzerland. Renew. Energy 2019, 140, 840–851. [Google Scholar] [CrossRef]
- Singh, J.; Panesar, B.S.; Sharma, S.K. A mathematical model for transporting the biomass to biomass based power plant. Biomass Bioenergy 2010, 34, 483–488. [Google Scholar] [CrossRef]
- Bacenetti, J.; Negri, M.; Fiala, M.; González-García, S. Anaerobic digestion of different feedstocks: Impact on energetic and environmental balances of biogas process. Sci. Total Environ. 2013, 463–464, 541–551. [Google Scholar] [CrossRef]
- Valenti, F.; Zhong, Y.; Sun, M.; Porto, S.M.C.; Toscano, A.; Dale, B.E.; Sibilla, F.; Liao, W. Anaerobic co-digestion of multiple agricultural residues to enhance biogas production in southern Italy. Waste Manag. 2018, 78, 151–157. [Google Scholar] [CrossRef]
- Scarlat, N.; Dallemand, J.F.; Monforti-Ferrario, F.; Nita, V. The role of biomass and bioenergy in a future bioeconomy: Policies and facts. Environ. Dev. 2015, 15, 3–34. [Google Scholar] [CrossRef]
- Castrillón Mendoza, R.; Rey Hernández, J.; Velasco Gómez, E.; San José Alonso, J.; Rey Martínez, F. Analysis of the Methodology to Obtain Several Key Indicators Performance (KIP), by Energy Retrofitting of the Actual Building to the District Heating Fuelled by Biomass, Focusing on nZEB Goal: Case of Study. Energies 2018, 12, 93. [Google Scholar] [CrossRef] [Green Version]
- Valentine, J.; Clifton-Brown, J.; Hastings, A.; Robson, P.; Allison, G.; Smith, P. Food vs. fuel: The use of land for lignocellulosic “next generation” energy crops that minimize competition with primary food production. GCB Bioenergy 2012, 4, 1–19. [Google Scholar] [CrossRef]
- Mandova, H.; Gale, W.F.; Williams, A.; Heyes, A.L.; Hodgson, P.; Miah, K.H. Global assessment of biomass suitability for ironmaking—Opportunities for co-location of sustainable biomass, iron and steel production and supportive policies. Sustain. Energy Technol. Assess. 2018, 27, 23–39. [Google Scholar] [CrossRef]
- Thrän, D.; Bauschmann, M.; Dahmen, N.; Erlach, B.; Heinbach, K.; Hirschl, B.; Hildebrand, J.; Rau, I.; Majer, S.; Oehmichen, K.; et al. Bioenergy beyond the German “Energiewende”–Assessment framework for integrated bioenergy strategies. Biomass Bioenergy 2020, 142. [Google Scholar] [CrossRef]
- Rossi, A.M.; Hinrichs, C.C. Hope and skepticism: Farmer and local community views on the socio-economic benefits of agricultural bioenergy. Biomass Bioenergy 2011, 35, 1418–1428. [Google Scholar] [CrossRef]
- Pagliacci, F.; Defrancesco, E.; Mozzato, D.; Bortolini, L.; Pezzuolo, A.; Pirotti, F.; Pisani, E.; Gatto, P. Science of the Total Environment Drivers of farmers’ adoption and continuation of climate-smart agricultural practices. A study from northeastern Italy. Sci. Total Environ. 2020, 710, 136345. [Google Scholar] [CrossRef] [PubMed]
- Provolo, G.; Perazzolo, F.; Mattachini, G.; Finzi, A.; Naldi, E.; Riva, E. Nitrogen removal from digested slurries using a simplified ammonia stripping technique. Waste Manag. 2017, 69, 154–161. [Google Scholar] [CrossRef]
- Johnson, T.G.; Altman, I. Rural development opportunities in the bioeconomy. Biomass Bioenergy 2014, 63, 341–344. [Google Scholar] [CrossRef]
- Ignaciuk, A.; Vöhringer, F.; Ruijs, A.; van Ierland, E.C. Competition between biomass and food production in the presence of energy policies: A partial equilibrium analysis. Energy Policy 2006, 34, 1127–1138. [Google Scholar] [CrossRef]
- Kluts, I.; Wicke, B.; Leemans, R.; Faaij, A. Sustainability constraints in determining European bioenergy potential: A review of existing studies and steps forward. Renew. Sustain. Energy Rev. 2017, 69, 719–734. [Google Scholar] [CrossRef] [Green Version]
- Hattori, T.; Morita, S. Energy crops for sustainable bioethanol production; which, where and how? Plant Prod. Sci. 2010, 13, 221–234. [Google Scholar] [CrossRef]
- Cronin, J.; Zabel, F.; Dessens, O.; Anandarajah, G. Land suitability for energy crops under scenarios of climate change and land-use. GCB Bioenergy 2020, 12, 648–665. [Google Scholar] [CrossRef]
- Liu, T.T.; McConkey, B.G.; Ma, Z.Y.; Liu, Z.G.; Li, X.; Cheng, L.L. Strengths, weaknessness, opportunities and threats analysis of bioenergy production on Marginal Land. Energy Procedia 2011, 5, 2378–2386. [Google Scholar] [CrossRef] [Green Version]
- Shortall, O.K. “Marginal land” for energy crops: Exploring definitions and embedded assumptions. Energy Policy 2013, 62, 19–27. [Google Scholar] [CrossRef]
- Boscaro, D.; Pezzuolo, A.; Sartori, L.; Marinello, F.; Mattioli, A.; Bolzonella, D.; Grigolato, S. Evaluation of the energy and greenhouse gases impacts of grass harvested on riverbanks for feeding anaerobic digestion plants. J. Clean. Prod. 2018, 172, 4099–4109. [Google Scholar] [CrossRef]
- Sands, R.D.; Malcolm, S.A.; Suttles, S.A.; Marshall, E. Dedicated Energy Crops and Competition for Agricultural Land; ERR-223; U.S. Department of Agriculture, Economic Research Service: Washington, DC, USA, 2017; 72p.
- Zhang, B.; Xu, J.; Lin, Z.; Lin, T.; Faaij, A.P.C. Spatially explicit analyses of sustainable agricultural residue potential for bioenergy in China under various soil and land management scenarios. Renew. Sustain. Energy Rev. 2021, 137. [Google Scholar] [CrossRef]
- Wang, E.; Cruse, R.M.; Sharma-Acharya, B.; Herzmann, D.E.; Gelder, B.K.; James, D.E.; Flanagan, D.C.; Blanco-Canqui, H.; Mitchell, R.B.; Laird, D.A. Strategic switchgrass (Panicum virgatum) production within row cropping systems: Regional-scale assessment of soil erosion loss and water runoff impacts. GCB Bioenergy 2020, 12, 955–967. [Google Scholar] [CrossRef]
- Ignaciuk, A.M.; Dellink, R.B. Biomass and multi-product crops for agricultural and energy production-an AGE analysis. Energy Econ. 2006, 28, 308–325. [Google Scholar] [CrossRef]
- Villa, R.; Ortega Rodriguez, L.; Fenech, C.; Anika, O.C. Ensiling for anaerobic digestion: A review of key considerations to maximise methane yields. Renew. Sustain. Energy Rev. 2020, 134, 110401. [Google Scholar] [CrossRef]
- Al Seadi, T.; Rutz, D.; Janssen, R.; Drosg, B. Biomass Resources for Biogas Production. In The Biogas Handbook: Science, Production and Applications; Woodhead Publishing: Sawston, UK, 2013; ISBN 9780857097415. [Google Scholar]
- Murphy, J.; Bochmann, G.; Weiland, P.; Wellinger, A. Biogas from Crop Digestion. IEA Bioenergy Task 37. 2011. Available online: https://www.ieabioenergy.com/wp-content/uploads/2011/10/Update_Energy_crop_2011.pdf (accessed on 27 February 2020).
- Garcia, N.H.; Mattioli, A.; Gil, A.; Frison, N.; Battista, F.; Bolzonella, D. Evaluation of the methane potential of different agricultural and food processing substrates for improved biogas production in rural areas. Renew. Sustain. Energy Rev. 2019, 112, 1–10. [Google Scholar] [CrossRef]
- Hammer, G.L.; Broad, I.J. Genotype and environment effects on dynamics of harvest index during grain filling in sorghum. Agron. J. 2003, 95, 199–206. [Google Scholar] [CrossRef] [Green Version]
- Pöschl, M.; Ward, S.; Owende, P. Evaluation of energy efficiency of various biogas production and utilization pathways. Appl. Energy 2010, 87, 3305–3321. [Google Scholar] [CrossRef]
- Hay, R.K.M. Harvest index: A review of its use in plant breeding and crop physiology. Ann. Appl. Biol. 1995, 126, 197–216. [Google Scholar] [CrossRef]
- ESAN Bachmann. Design and engineering of biogas plants. Biogas Handb. Sci. Prod. Appl. 2013, 191–211. [Google Scholar] [CrossRef]
- Chiumenti, A.; Pezzuolo, A.; Boscaro, D.; Da Borso, F. Exploitation of mowed grass from green areas by means of anaerobic digestion: Effects of grass conservation methods (drying and ensiling) on biogas and biomethane yield. Energies 2019, 12, 3244. [Google Scholar] [CrossRef] [Green Version]
- Statuto, D.; Frederiksen, P.; Picuno, P. Valorization of Agricultural By-Products Within the “Energyscapes”: Renewable Energy as Driving Force in Modeling Rural Landscape. Nat. Resour. Res. 2019, 28, 111–124. [Google Scholar] [CrossRef]
- Brosowski, A.; Bill, R.; Thrän, D. Temporal and Spatial Availability of Cereal Straw in Germany Case Study: Biomethane for the Transport Sector. Energy Sustain. Soc. 2020. [Google Scholar] [CrossRef]
- Mattioli, A.; Boscaro, D.; Dalla Venezia, F.; Correale Santacroce, F.; Pezzuolo, A.; Sartori, L.; Bolzonella, D. Biogas from Residual Grass: A Territorial Approach for Sustainable Bioenergy Production. Waste Biomass Valorization 2017, 8, 2747–2756. [Google Scholar] [CrossRef]
- Pari, L.; Suardi, A.; Santangelo, E.; García-Galindo, D.; Scarfone, A.; Alfano, V. Current and innovative technologies for pruning harvesting: A review. Biomass Bioenergy 2017, 107, 398–410. [Google Scholar] [CrossRef]
- Chiumenti, A.; Da Borso, F.; Pezzuolo, A.; Sartori, L.; Chiumenti, R. Ammonia and greenhouse gas emissions from slatted dairy barn floors cleaned by robotic scrapers. Res. Agric. Eng. 2018, 64, 26–33. [Google Scholar] [CrossRef]
- Finzi, A.; Mattachini, G.; Lovarelli, D.; Riva, E.; Provolo, G. Technical, economic, and environmental assessment of a collective integrated treatment system for energy recovery and nutrient removal from livestock manure. Sustainability 2020, 12, 2756. [Google Scholar] [CrossRef] [Green Version]
- Pulleman, M.; Creamer, R.; Hamer, U.; Helder, J.; Pelosi, C.; Pérès, G.; Rutgers, M. Soil biodiversity, biological indicators and soil ecosystem services-an overview of European approaches. Curr. Opin. Environ. Sustain. 2012, 4, 529–538. [Google Scholar] [CrossRef]
- Pereira, P.; Bogunovic, I.; Muñoz-Rojas, M.; Brevik, E.C. Soil ecosystem services, sustainability, valuation and management. Curr. Opin. Environ. Sci. Heal. 2018, 5, 7–13. [Google Scholar] [CrossRef]
- Congedo, L.; Marinosci, I.; Riitano, N.; Strollo, A.; De Fioravante, P.; Munafò, M. Monitoring of land consumption: An analysis of loss of natural and agricultural areas in Italy. Ann. Bot. 2017, 7, 1–9. [Google Scholar] [CrossRef]
- European Commission. European Commission Proposal for a Directive of the European Parliament and of the Council Establishing a Framework for the Protection of Soil and Amending Directive 2004/35/EC; European Commission: Brussels, Belgium, 2006. [Google Scholar]
- Pistocchi, A.; Calzolari, C.; Malucelli, F.; Ungaro, F. Soil sealing and flood risks in the plains of Emilia-Romagna, Italy. J. Hydrol. Reg. Stud. 2015, 4, 398–409. [Google Scholar] [CrossRef]
- Munafò, M.; Salvati, L.; Zitti, M. Estimating soil sealing rate at national level—Italy as a case study. Ecol. Indic. 2013, 26, 137–140. [Google Scholar] [CrossRef]
- Scalenghe, R.; Ajmone-Marsan, F. The anthropogenic sealing of soils in urban areas. Landsc. Urban Plan. 2009, 90, 1–10. [Google Scholar] [CrossRef]
- Murata, T.; Kawai, N. Degradation of the urban ecosystem function due to soil sealing: Involvement in the heat island phenomenon and hydrologic cycle in the Tokyo metropolitan area. Soil Sci. Plant Nutr. 2018, 64, 145–155. [Google Scholar] [CrossRef]
- Jacobson, C.R. Identification and quantification of the hydrological impacts of imperviousness in urban catchments: A review. J. Environ. Manag. 2011, 92, 1438–1448. [Google Scholar] [CrossRef]
- Nciizah, A.D.; Wakindiki, I.I.C. Soil sealing and crusting effects on infiltration rate: A critical review of shortfalls in prediction models and solutions. Arch. Agron. Soil Sci. 2015, 61, 1211–1230. [Google Scholar] [CrossRef]
- Samer, M. Biogas Plant Constructions. Biogas 2012, 1. [Google Scholar] [CrossRef] [Green Version]
- Zareei, S. Project scheduling for constructing biogas plant using critical path method. Renew. Sustain. Energy Rev. 2018, 81, 756–759. [Google Scholar] [CrossRef]
- Benato, A.; Macor, A. Italian biogas plants: Trend, subsidies, cost, biogas composition and engine emissions. Energies 2019, 12, 979. [Google Scholar] [CrossRef] [Green Version]
- Theuerl, S.; Herrmann, C.; Heiermann, M.; Grundmann, P.; Landwehr, N.; Kreidenweis, U.; Prochnow, A. The Future Agricultural Biogas Plant in Germany: A Vision. Energies 2019, 12, 396. [Google Scholar] [CrossRef] [Green Version]
- Terna Rete Italia. Impianti di Generazione. 2019. Available online: https://www.terna.it/it/sistema-elettrico/statistiche (accessed on 10 February 2019).
- Terna Rete Italia. Produzione di Energia Elettrica in Italia. 2019. Available online: https://www.terna.it/it/sistema-elettrico/statistiche (accessed on 10 February 2019).
- Cogato, A.; Pezzuolo, A.; Sørensen, C.G.; De Bei, R.; Sozzi, M.; Marinello, F. A GIS-based multicriteria index to evaluate the mechanisability potential of Italian vineyard area. Land 2020, 9, 496. [Google Scholar] [CrossRef]
- ISPRA. Territorio-Processi e Trasformazioni in Italia; 2018; ISBN 9781626239777. Available online: https://www.isprambiente.gov.it/files2018/pubblicazioni/rapporti/Rapporto_territorio_web.pdf (accessed on 3 March 2018).
Publisher’s Note: MDPI stays neutral with regard to jurisdictional claims in published maps and institutional affiliations. |
© 2021 by the authors. Licensee MDPI, Basel, Switzerland. This article is an open access article distributed under the terms and conditions of the Creative Commons Attribution (CC BY) license (https://creativecommons.org/licenses/by/4.0/).