Abstract
Existing megawatt-scale photovoltaic (PV) power plant producers must understand that simple and low-cost Operation and Maintenance (O&M) practices, even executed by their own personal and supported by a comparison of field data with simulated ones, play a key role in improving the energy outputs of the plant. Based on a currently operating 18 MW PV plant located in an under-developing South-Asia country, we show in this paper that comparing real field data collected with simulated results allows a central vision concerning plant underperformance and valuable indications about the most important predictive maintenances actions for the plant in analysis. Simulations using the globally recognized software PVSyst were first performed to attest to the overall power plant performance. Then, its energy output was predicted using existing ground weather data located at the power plant. Compared with the actual plant’s annual energy output, it was found that it was underperforming by −4.13%, leading to a potential monetary loss of almost 175,000 (EUR)/year. Besides, an analysis of the O&M power plant reports was performed and compared to the best global practices. It was assessed that the tracker systems’ major issues are the forerunner of the most significant PV power plant underperformance. In addition, issues in inverters and combiner boxes were also reported, leading to internal shutdowns. In this case, predictive maintenance and automated plant diagnosis with a bottom-up approach using low-cost data acquisition and processing systems, starting from the strings level, were recommended.
1. Introduction
Renewable energy deployment has been on the rise since the last decade. Statistics from International Renewable Energy Agency (IRENA) published in the Renewable Capacity Statistics report 2019 [1] provide an insight into an increase in the installed renewable power generation in GW over the last ten years. Table 1 shows a renewable capacity increase globally, in Europe, and in specific countries relevant to the study. Among the renewable energy technologies, the hydro, wind, and solar account for the majority share of the installed capacity, contributing up to 50%, 24%, and 20%, respectively. The statistic of the gradual increase in the last decade of these three major technologies is presented in Table 2. Solar photovoltaics has not only shown a remarkable percentage increase of approximately 2000 percent during the decade. Still, it has shown the maximum installed capacity in the last year, with 94 GW of new installed capacity in 2018 [1,2,3].

Table 1.
Increase in renewable power generation (GW) in the last decade.
Table 2.
Increase in capacity (GW) of hydro, wind, and solar technologies in the last decade.
To increase the returns on investment further, on one hand, research is being carried out to improve the energy conversion efficiency of solar PV technologies using novel materials and different mechanisms of generation. On the other hand, existing power producers are trying to improve the output of power plants by improving their operations and maintenance (O&M) activities.
Operations and maintenance of solar PV power plants are one of the most critical aspects. The most jobs intensive segment employs 1/3rd of the total workforce employed in the solar PV sector and entails the longest phase during a PV power plant life lasting 25–35 years [4]. Effective operations and maintenance can improve the levelized cost of energy and positively impact returns on investment [4]. As per a report published by International Finance Corporation (IFC) [5], power plant operations and maintenance’s objective is to maximize the energy yield and the plant’s useful life while minimizing the costs.
During the lifecycle, the power plant faces a range of issues such as natural degradation, component failures (module cracking, hotspots, inverter failures, trackers alignment, and positioning, etc.), weather conditions (snow, soiling, and wind), and other issues (such as tightening loose cable connections, replacing fusses, fixing SCADA faults, repairing tracker faults, etc.). Therefore, a holistic approach addresses these issues under the operations and maintenance annual plan, usually divided into preventive, corrective, and conditioned-based maintenance categories [5]. Recent trends in operations and maintenance of solar PV power plants include smart monitoring, data-driven operations, and maintenance followed by predictive maintenance and retrofit coatings [6] to improve energy output and decrease costs.
The power plant’s performance is judged based on its operations and maintenance data collection, reporting and judged based on the effectiveness of response on operations and maintenance issues arising throughout the year. International standard IEC 61724, published by International Electro-Technical Commission (IEC) in 1998, is considered the basis for performance assessment of the solar PV power plants [7]. The standard IEC 61724 lists and describes the mandatory parameters that need to be evaluated to determine the performance of the solar PV system. The parameters are array yield, final yield, reference yield, performance ratio, capacity factor, module, inverter, system efficiency, and total energy generation. These indicators provide a foundation on which solar PV systems can be compared, operating under different conditions [8,9].
The novelty of this paper relies on showing that low-cost and simple O&M procedures, even executed by proper employees and sustained by comparison between observed and simulated energy outputs, are enough to increase the energy production potential of an MW scale PV plant, but unfortunately, few studies about operation and maintenance for GW PV power plants are located in under-developing countries. Hence, their need is for simple and low-cost methodologies that are enough to increase their energy production, adapted to the plant’s particular environmental conditions. It is in this context that the title question appears: why can simple operation and maintenance (O&M) practices in large-scale grid-connected PV power plants play a key role in improving its energy output?
2. State-of-Art
PV power plant operations and maintenance are usually categorized as separate divisions of activities at the plant site. Plant operations correspond to remote and on-site monitoring, control, and supervision of the plant, in which documentation management is an integral part (datasheets, input record control, alarm descriptions, etc.) On the other hand, maintenance involves inspecting and restoring the plant to its normal condition, separated into preventive or corrective types, normally being annual or extraordinary maintenance categories [10,11].
O&M is generally the longest phase, lasting 115 to 25 years in a PV power plant’s lifetime. Other power plant phases are development and construction, which last up to 1 to 3 years and few months. Dismantling, which is the final stage, generally occurs within few months at the end of the lifetime. A report published by Solar Power Europe [4] has been used as the main reference for comparing PV plants O&M with the best practices adopted within the solar PV industry.
Detailed data collection and analysis of the power plant is the first step in careful performance analysis [11]. As a minimum requirement, the power plant’s performance must be compared at various levels, starting from portfolio level where performance, operations, and maintenance are compared with other PV power plants operated and maintained by the operator. After portfolio level, assessment and comparison of the plant and inverter level parameters are also considered minimum requirements for suitable O&M practices. Finally, monitoring down to string level is always recommended [12], which allows accurate troubleshooting possibilities in the shortest times, helping improve plant availability.
Factors other than operations and maintenance, such as the installed capacity, power plant location, weather data, diversity in installed equipment such as modules, inverters, transformers, cabling, etc., have also been considered. All these factors also create a difference in the magnitude of the power plant’s energy output. Therefore, key performance indicators (KPIs) must be used [13], providing a technical basis to evaluate different PV plants’ performance existing in the portfolio. Table 3 lists the KPIs mostly used by the PV industry [9]. The indicators are grouped according to the type of data treated and type of association: Raw data measurement, PV Plant KPIs, O&M KPIs, Equipment KPIs, and Incident reporting. Each indicator also has an obligation label associated: Minimum, Recommendation, or Best practice.
Table 3.
Key performance indicators (KPI) [9].
2.1. Key Performance Indicators (KPIs) for PV Plants
It is important to know the main KPIs for a PV power plant to achieve the best energy outcome and compare its performance. In addition, KPIs will help achieve an efficient planning of operation and maintenance management to meet contract requirements, increase the PV plant’s economic life, and maximize its revenue. In reality, there is not a set of KPIs that every solar operator uses. However, we have collected a list of the top 6 O&M KPIs (listed in Table 3), defined as follows.
Reference yield corresponds to theoretically possible yield at ideal conditions (no losses) over a specific period (daily, monthly, yearly). As shown in (1), it is the total in-plane irradiance value divided by reference irradiance of 1000 W/m2 at Standard Test Conditions [7,8].
Specific yield, as shown in (2), is the actual total energy generated per installed power capacity over a specific period (daily, monthly, yearly), [1].
Performance ratio is a quality indicator. As shown in (3), it is defined by the ratio of specific yield per reference yield , [9].
Expected yield is calculated by multiplying reference yield by expected performance ratio (4). This indicator is based on previous values of irradiation data.
Energy Performance Index is defined in (5) being the ratio between the specific yield and the expected yield .
Technical availability (Uptime) and energy-based availability are closely described terms. Technical availability corresponds to the time the plant operated divided by the possible time it could operate. The possible operation time corresponds to when the plant received irradiance values above the minimum irradiance threshold level. PV plant Uptime shows the PV plant’s downtimes irrespective of the cause, while energy-based availability contains certain exclusion factors [14].
Acknowledgment time, also called reaction time, is the time interval between detecting a fault and dispatching a technician to rectify it.
Intervention time is the technician’s time interval or third-party support to reach the site where the fault is located.
Response time is the sum of acknowledgment and intervention times.
Resolution time corresponds to the time taken to solve when the technician or a third party reaches the site where the fault is located.
Apart from the KPIs, field inspections such as infrared thermography, IV curve tracing, electroluminescence imaging, and soiling measurements are recommended.
Infrared thermography is used to detect the heat differential between solar cells through which it is determined whether any of those cells are damaged or defective (such as hotspots, inactive substrings, and inactive modules) [15]. It is also used to inspect inverters, cables, switches, fuses, and batteries.
IV curve characteristic measurements are conducted to determine open-circuit voltage, short-circuit current, power, series and shunt resistance, fill factor, etc., of PV modules. These measurements are usually taken periodically to evaluate the correlation between possible IV curve changes and performance degradation due to the elevated operating temperatures [16], as is the case with our PV power plant.
Electroluminescence imaging helps to identify microcracks, which are not conclusively identified by infrared thermography.
For soiling, ground-based measurements are generally conducted where a reference module is soiled, another reference cell is cleaned, and a third reference cell is automatically cleaned.
2.2. PV Power Plant Maintenance
According to the main guidelines in O&M [9], a PV power plant maintenance should be split into five categories and coordinated with the operations team’s analysis. The five maintenance categories are:
- Preventive maintenance [17]: it includes physical inspections and conformity with operations manuals. An annual maintenance plan is part of preventive maintenance and includes a schedule of inspections performed on different time intervals (daily, bi-monthly, monthly, quarter-yearly, bi-annually, and annually);
- Corrective maintenance [18]: it is performed to restore the faults in equipment or components to bring them back to a functioning state properly. The main elements of corrective maintenance include fault diagnosis and repair;
- Predictive maintenance [19]: it is condition-based maintenance being carried out after profound monitoring, analysis, and evaluation of main parameters associated with the degradation of equipment under observation. For instance, if power loss in the inverter occurs due to overheating, several reasons such as filter obstructions, problems in the airflow, or high seasonal temperature could be the reason. As per predictive maintenance, airflow inspection, ventilation systems inspection, or cleaning/replacement of filters shall be performed to avoid damage and equipment loss;
- Additional maintenance [20]: it includes modules cleaning, vegetation control, road management, buildings control, perimeter security, etc.;
- Extraordinary maintenance [21]: this aims to cover unpredictable events on the PV power plant. It covers events such as theft, fire, and modifications mandated subsequently by regulatory authorities.
2.3. Analysis of PV Power Plant Based on Predictive Software Simulation
Various software is used to simulate energy production in PV power plants. We conducted a study to determine which software to use toward creating a baseline against which the plant output could be compared. A review paper published in 2014 [22] mentioned approximately 50 solar PV industry-related software tools categorized as simulation, economic evaluation, analysis and planning, string design, system sizing, monitoring and control tools, solar irradiation maps, and online software. The authors compared twelve simulation software, namely, PVsyst, Homer, RETScreen, TRANSYS, INSEL, PV F Chart, SAM, solar design tool, ESP-r, Solar Pro, PV Design Pro-G, and PVSOL. Their analysis concluded in recommending PVsyst to be the most appropriate software to be used amongst all.
A second but more detailed study was published in 2015 [23] comparing seven different solar PV design software tools: Homer, PVF chart, PV Planner, PVsyst, RETScreen, SAM, and Solar Pro. These were analyzed based on existing functions, user interface, historical weather data, PV module data, inverter information, and pricing. For user interface and functions categories, Solar Pro was on top, followed by PVsyst. In terms of weather data, PVsyst stood in the first place. For PV module data and inverter information, PVsyst and Solar Pro shared the top position. For pricing, PVsyst and SAM received the highest points of the table. Hence, since PVsyst takes the top position in most of the criteria, PVsyst was considered the most appropriate simulation software again.
Another review paper published in 2018 [24] compared the main features of ten simulation software. The software compared were HelioScope, HOMER, PVsyst, PVSOL, PV F Chart, RETScreen, SAM, Solarius PV, Solar Pro, and SOLARGIS. The analysis focused on a 1 MW PV power plant’s degradation and performance analysis, comparing different software simulation results to actual PV plant data to find the most effective software. The results obtained found out PVsyst, Homer, RETScreen, and SAM be the most suitable software set in the comparison.
Considering all those review papers’ results and some others from 2020 to 2021 [25,26,27,28,29,30], we concluded that PVsyst software is the most appropriate choice for PV power projects’ simulation studies, weighting cost, accuracy, and global experience.
2.4. PV Plant Power Losses
During the PV plant operation, many factors lead to power losses and degradation of the system. For example, a study conducted in tropical countries shows how the environmental conditions, mainly temperature and humidity, affect the rate of degradation in PV plants. For example, in Ghana [31], authors calculated a decrease of 18.2% to 38.8% of generated power during the PV plant’s lifetime, equivalent to degradation of 1.54% per year. Another more recent study, now in India [32] in a 10 MW power plant, forecasted a degradation rate of 1.93% annually. A study performed in northern India [33], close to the installed PV plant considered in this paper, reported degradation ranges between 0.6% and 5% per year.
Countries with arid and dusty environments show greater degradation rates. In very recent research for a PV plant in Kuwait [34], degradation rates in the order of 10% caused by soiling effects due to deposited dust were computed. In Shiraz, Iran, soiling losses from dusty PV modules in August achieved a yearly degradation rate of around 1.17% [35]. Moreover, recently, the degradation of a PV system in the arid environment of Patagonia was presented [36]. Using the data listed in the paper, one can estimate a degradation rate of 0.9%/year. Independent of being arid or humid, these studies indicate that it is important to consider various factors that lead to power losses and PV system degradation while performing PV plant simulations. In this context, PVsyst, the software selected for our simulations, allows the users to input and modify several loss factors. Let us summarize them. They are:
- Near shading losses are related to shading produced by near objects, which in a PV power plant corresponds to power losses caused by fewer inter-row/column spaces between solar panels. The losses are related to irradiance losses because of lack of space between rows/columns, as some irradiance does not fall on the panels;
- Array incidence losses or IAM (Incidence Angle Modifier) refer to module-dependent losses estimated by the software. These losses refer to a decrease of the irradiance reaching the PV cells’ surface compared to the irradiance falling under normal incidence. These losses occur due to the glass cover on the panel that increases the angle of incidence. Results indicate that losses should not be more than 3% [37,38].
- Soiling losses are the losses in the module’s power due to dirt, snow, dust, and particles that cover the surface of the PV panel. In 2016 [39] studied 250 sites and applied a linear regression model to characterize soiling losses. They found out that soiling accounts for a range of 1.5% to 6.2% of losses depending upon the PV plant’s location. Besides, the study found out that rain does not necessarily always clean the modules. Sometimes, a light shower can worsen the dust and make mud on the panels’ surface, adding to the modules’ soiling. At least 20 mm of rainfall is required to clean the surface of the modules. Another study on soiling losses [40] details that they generally range between 3% to 6%, which can go as high as 30% depending on the location and number of cleaning cycles observed. In [41], the authors reviewed the effect of dust, humidity, and air velocity on photovoltaic cells’ efficiency in different countries. They found out efficiency reduction of 1% to 4.7% in the United States in two months, 40% in 6 months in Saudi Arabia, and 17% to 65% in 38 days in Kuwait, all depending upon tilt angle and time cleaning. A report [42] on uncertainty in long-term photovoltaic yield predictions states a 2% reduction in efficiency due to soiling losses.
- Losses due to irradiance level and temperature correspond to a decrease in PV system efficiency because of the lower level of irradiance or higher temperature. PVsyst software computes these losses based on the site meteorological data and the PAN data file of module manufacturer input in the PVsyst software [38]. Generally, open-circuit voltage increases logarithmically with increased solar radiation, and short-circuit current increases linearly, increasing power output. On the other hand, an increase in the module/cell temperature causes a decrease in open-circuit voltage. Even though short-circuit current increases fractionally with an increase in the cell temperature due to irradiance increase, the overall cell efficiency drops. Hence, to improve the module’s efficiency, it is advised to reduce its surface temperature, which can be achieved by either employing a cooling mechanism or reducing heat stored within the module under operation [42].
- Module quality loss or module derating is the difference between the module’s performance specified by the manufacturer and operating in the field. In general, this difference corresponds to the manufacturer’s tolerance (e.g., ±5%), generally more on the negative side than on the positive. PVsyst recommends a −1.5% average module quality loss in its simulations [38,42].
- Light-Induced Degradation (LID) appears in crystalline solar cells fabricated using the Czochralski method. Degradation appears during initial prolonged exposure to light. When oxygen impurities in the silicon wafers react with the doped (p-type) boron during initial illumination of the cell (A boron-oxygen defect in the wafer). PVsyst’s default setting takes this value as 2%.
- Module array mismatch losses happen because modules with the same nameplate power capacity do not necessarily have the same current and voltage characteristics during the module’s production process. As a result, when these modules are connected in series or parallel, voltage and current inequality between modules result in power loss. A study on performance comparison on mismatch losses [41] shows that they can be minimized to less than 1% using a genetic algorithm technique for their optimized arrangement. In comparison, it is higher than 1.02% for other module arrangement techniques.
- Ohmic wiring losses correspond to the Joule losses between the PV modules and the inverter. These losses should not be more than 2% at standard test conditions, whereas with optimum design and selection of the right cables, they can be reduced up to 1%. Research in [41] revealed that the losses usually range between 1.2% to 1.5% for a well-designed plant. In PVsyst, the software takes a default value of 1.5% for ohmic wiring losses.
- System unavailability refers to the downtime in production due to planned and unplanned maintenance activities at the power plant site. For example, annual/biannual plant shut down for maintenance, plant internal tripping, and external grid tripping. The software PVsyst takes an average of 2% as a default value for this. However, as in [24,42], other studies suggest it be decided based on operations and maintenance contracts, and an average value for this should be between 0.5% to 1%.
To summarize all percentage of energy loss values described before, we organize in Table 4 a comparison of the default loss values taken by PVsyst and those established in the literature reviewed as to its minimum values.
Table 4.
PVsyst default loss values and literature minimum losses for PV systems.
2.5. Latest Trends
O&M activities are anticipated to reduce electricity’s levelized cost by 0.8% to 1.4% from 2015 to 2030 [43,44]. This reduction shall be materialized using the latest trends and innovative techniques, some of which we point out:
- Aerial drones’ infrared (IR) thermography: infrared thermographic inspections are an established tool for preventive and corrective PV power plant maintenance. However, the amount of time, labor, and ultimately finances required for just gathering the data continues to be a challenge. This process can be conducted by mounting thermographic cameras on unmanned aerial vehicles (UAVs) instead of handheld devices. A PV power plant as large as 12 MWp can be inspected in one day using this technology, thus saving time, labor, and financial resources [45,46]. Faults within the modules such as optical faults (delamination, discoloration, and glass breakage), electrical mismatches and degradation (cell cracks, poor soldering, short-circuited cells, shading), hot spots, and potential induced degradation can be detected through aerial drones IR thermography [47].
- Automated plant diagnosis: currently, the performance assessment of PV power plants is executed following a top-down approach, i.e., assessment occurs starting from substations to inverters to junction boxes down to strings level. This technique is expert-dependent, time-consuming, and does not assure to uncover all under-performing matters. Automated plant diagnosis using a bottom-up approach utilizing big data mining techniques, starting from string level data acquisition and processing, combined with predictive maintenance and artificial intelligence, saves time by reducing expert data handling and providing improved analysis. Research carried out on a park with six PV power plants up to 10 MW of installed capacity and with data from more than 100 different inverter modules collected over two years [11] indicated that fault prediction (automated plant diagnosis) of up to 7 days in advance was possible with a sensitivity of 95%.
- Anti-soiling coating: PV modules’ surfaces are exposed to dirt deposition and weathering conditions, leading to the module’s soiling and subsequently decreasing the system’s efficiency. To prevent efficiency losses, anti-soiling coatings are applied to the modules. These coatings must have high transparency, abrasion and weather resistance, and dust repellent properties. Generally, hydrophobic and hydrophilic coatings are used for anti-soiling purposes, which help accumulate lesser dust molecules, making it easier to clean and reduce the water consumption than improving energy efficiency [47,48]. Furthermore, an increased gain (yield) of 3% is achievable using these coatings [49].
- Anti-reflective coating: losses caused by reflection are initial losses of solar PV systems while converting solar irradiation to energy. These losses are reduced by applying anti-reflective coatings to the modules already installed in the field. These coatings can increase the energy output by 3–4% [50]. A long-term field test was conducted to examine patterned and un-patterned anti-reflective films. Moth-eye pattern and micro-cone pattern were fabricated using ultraviolet-nanoimprint lithography, which does not use high-temperature or vacuum processes. In seven months of testing, moth-eye pattern film (patterned film) improved the transmittance by 5% and converted electricity by +2.85% than a flat un-patterned film [50].
After installation, O&M procedures are among the most critical aspects of a PV power plant. The most jobs-intensive segment employs 1/3rd of the total workforce hired in the solar PV sector, entailing the longest phase during a PV power plant life lasting about 25–35 years [1]. Effective O&M actions can improve the LCOE and positively affect returns on investment [1]. As per a report published by International Finance Corporation (IFC) [4], the objective of O&M’s actions in any PV power plant is to maximize the energy yield and the useful life of the plant while minimizing costs.
A holistic approach is normally adopted to address O&M issues (natural degradation, component failures, weather conditions, and other issues such as fixing SCADA faults, repairing tracker faults, etc.), all under the operations and maintenance annual plan divided into preventive, corrective, and conditioned-based maintenance categories [5]. The PV power plant’s performance is judged based on its O&M data collection, reporting, and response to those issues arising throughout the year.
International standard IEC 61724, published by International Electro-Technical Commission (IEC), is considered the basis for PV power plants’ performance assessment [51]. The standard ICE 61724 lists and describes the mandatory parameters that need to be evaluated. They are array yield, final yield, reference yield, performance ratio, capacity factor, module, inverter, system efficiency, and total energy generation. These indicators provide a foundation on which PV power plants can be compared, operating under different conditions [52].
This paper analyzes the O&M of an existing 18 MW single-axis tracking PV power plant in Pakistan, doing its performance assessment as a case study. The methodology opted to acquire the PV power plant O&M data, energy output results, and weather data. We compare the O&M used with global best practices, assessing the plant energy output with PVSys simulation results using actual ground weather data to reach more precise results. In the end, recommendations concerning any improvements based on best global practices were provided.
3. Power Plant Operations and Maintenance Review—Case Study of an 18 MW PV Power Plant at Pakistan
The PV power plant with an 18 MW installed capacity and single-axis tracking system is located at latitude 30.58150, longitude 72.89440, and 144 m in Harappa, Pakistan. Figure 1a shows an image of its location. According to the current power plant management, the plant’s location was selected considering the amount of annual solar irradiation, availability, and cost of the national grid’s land, and availability to transfer the energy produced.
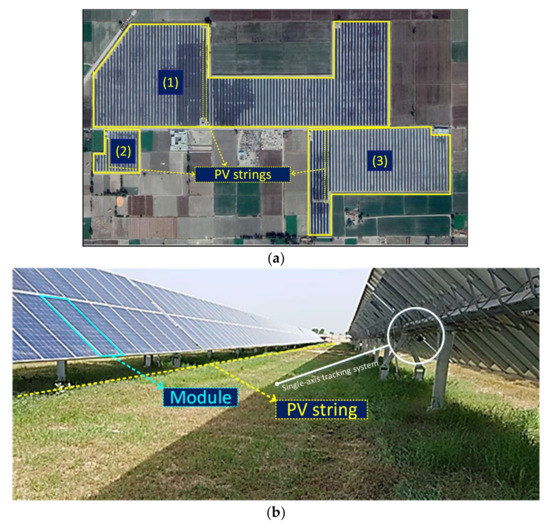
Figure 1.
(a) Google image of the 18 MW PV power plant. (b) Rows of solar PV modules with 7 m distance to avoid near shading.
Each PV module mounted on the plant has a 320 Wp power rating, an open-circuit voltage of 31 V, polycrystalline silicon produced by Phono Solaras model PS 320P-24/T. Modules are installed in strings with a 7 m distance to avoid the impact of shading. These rows are seen in Figure 1a and an on-ground image shown in Figure 1b. Table 5 lists the main characteristics of the PV modules and inverters installed in the PV plant. Inverters from Sungrow (model SG 500 MX) have a 500 kW rating, a voltage range of 460–850 V, a frequency of 50–60 Hz, a rated 98.7% efficiency. PV modules (Phono Solar) are polycrystalline silicon made, 320 Wp, and rated at STC with an efficiency of 16.59%.
Table 5.
PV modules and inverters specifications.
The 18 MW power plant used PVsyst under analysis during their design phase for setting a baseline. Hence, it was decided to use it to reach close to real-time results. Additionally, in Pakistan, the electricity regulatory authority, “National Electricity Power Regulatory Authority (NEPRA),” and global commercial banks consider simulations performed by PVsyst authentic and use them as an integral part of their economic assessment and financing solar PV projects. Therefore, considering all the reasons, PVsyst has been preferred as an analysis tool for our 18 MW PV power plant simulation.
3.1. PV Power Plant: Operations and Performance
In terms of O&M reporting and documentation, the current PV power plant management creates monthly reports. These were provided for these authors for one year, from January 2018 to December 2018, covering the following aspects:
- Plant operations and achieved performance;
- Outages (planned, external, and internal);
- Plant maintenance (corrective, preventive, and spare parts);
- Areas of improvement;
- Safety, housekeeping, and accidents occurred, and;
- Training (internal and external).
The PV plant O&M reports were summarized in their operations key figures such as:
- Energy export indicates the electric energy flowing from the PV power plant into the power grid;
- Plane of Array (POA) is a key figure in the total irradiation incoming normal to the surface of a reference PV module;
- The performance ratio is the ratio between the actual and the theoretically possible electric energy outputs;
- The capacity factor is the ratio of the monthly average energy production by the PV plant divided by the plant’s theoretical maximum monthly energy production, assuming it operates at its peak rated capacity every hour, and;
- Plant availability means the portion of a given operating period in which the PV plant is available without any outages and equipment or seasonal deratings. At last,
- Maintenance is associated here with the PV modules cleaning.
Table 6 summarizes all key figures and respective values measured every month during one year. On average, the PV power plant operation was characterized by a performance ratio of 81.4%, an average capacity of 19.6%, and availability of 99.96%, all this for a maintenance process that, on average, one had 4 PV modules to be cleaned by month. Table 6 indicates that July has the lowest value with 1.5 times. Meanwhile, cleaning is greater or equal to 4 times in all other months. Less cleaning in July is related to extensive local rains this month, making cleaning a less intensive task. Figure 2 plots the yearly evolution of the energy export, the array (POA) plane, and the PV plant’s performance ratio. Plotting these key figures indicates that the POA directly affects the energy export of the PV power plant.
Table 6.
Plant operations, performance, and maintenance data.
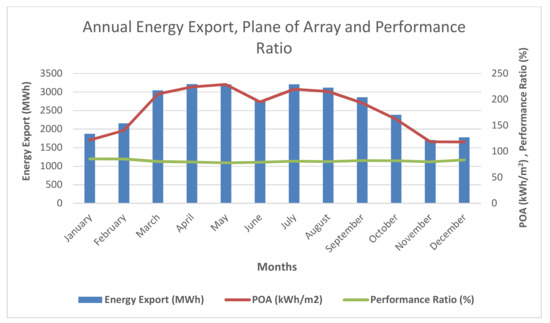
Figure 2.
Annual energy export, plane of array (POA), and performance ratio (PR) of the PV power plant.
3.2. Plant Outage/Unavailability
Three types of outages/plant unavailability were reported. They are:
- Planned outages: corresponding to planned or informed plant shutdown;
- Internal tripping: corresponding to unforeseen events taking place on the PV plant site.
- External outages: unforeseen events on the national grid, which, when trips, leads to loss of energy produced, which is then not utilized. The PV plant operators have no control over external outages. Both internal and external tripping were thus classified under “forced outages” as per the reports.
Table 7 shows when and how much time the PV power plant was unreachable throughout the year. As per the reports, “planned outages” kept the PV power plant unavailable for 1009 min (≅17 h), “external tripping” resulted in a loss of 874 min (≅14.5 h), and a case of “internal tripping” for 13 min. All reports pointed out that most of these issues were caused by problems within inverters during the internal outages. Table 8 resumes the causes that were reported as outages at each report every month. Situations involving inverters and cables were the most recurrent during the year, which caused the O&M team to focus on these two elements in the next operating years.
Table 7.
PV power plant unavailability.
Table 8.
Annual plant outage reporting.
3.3. PV Power Plant Maintenance
Maintenance conducted at the PV power plant site has been categorized into corrective and preventive ones. Corrective maintenance has been performed and documented with pictorial evidence of maintenance activities performed on the plant site. Table 9 shows the number of corrective maintenance activities performed on different PV power plant components throughout one year. As per the documented registers, most maintenance activity has been performed on the tracker system, followed by transmission lines, combiner boxes, and inverters.
Table 9.
Corrective maintenance is performed on plant components throughout the year.
We present key points from the corrective maintenance report of July regarding our analysis since maintenance activities were performed on a maximum number of components this month. They are:
Figure 3a showed when the main cable trench slipped down near the slope area of Block-5. This was rectified by pumping out water, and then, it was filled with soil before compaction, as shown in Figure 3b.
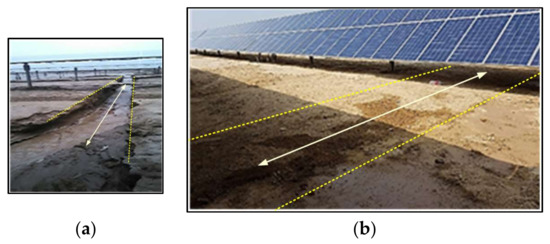
Figure 3.
(a) Cable trench slip due to rain, and (b) cable trench slip rectified after pumping out water.
- Inverter S9NB1 faced a RISO fault, as indicated in the SCADA screen in Figure 4, rectified after a thorough inspection.
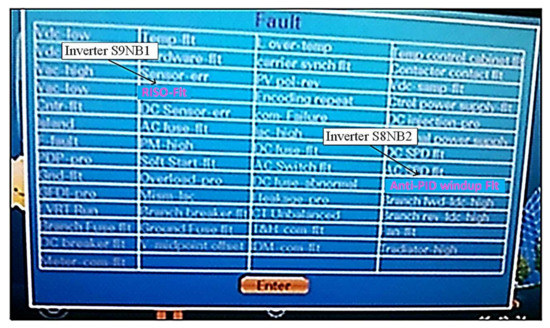 Figure 4. Inverter faults as seen on the SCADA screen.
 - Inverter S8NB2 faced an anti-PID windup fault, as shown in Figure 4, rectified after a thorough inspection.
- Four strings of SCB-S8SCB8 showed zero current, being rectified after cable repair. Figure 5 illustrates a second case where string A5 of Combiner Box S5SCB12 showed zero current. As the picture shows, the cable was repaired with HT and PVC Tape.
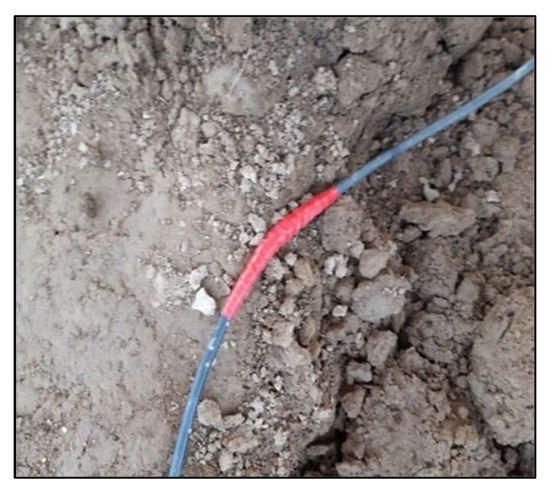 Figure 5. Cable repair with HT and PVC tape.
 - Other three-string cables of SCB S9SCB2 (A13, A14, and A16) showed zero current. When examined, cables were not showing continuity. Inadequate insulation was found over the whole strings. All damaged cables were repaired.
- Due to heavy rains in July in Pakistan, many trenches in the PV power plant area were displaced. All the displaced trenches were refilled and compacted. Figure 6a shows a boundary wall supportive soil of DB structure area was displaced, rectified by pumping out water, being filled with soil before compaction, as indicated in Figure 6b.
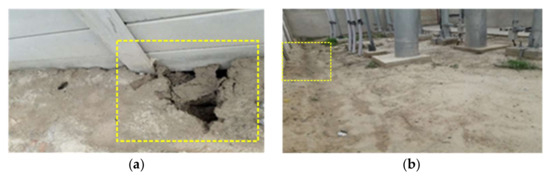 Figure 6. (a) Boundary wall support soil displaced due to rain, and (b) boundary wall support soil rectified.
 - The Fire Alarm of Reverse Osmosis (RO) plant was found faulty during the maintenance team’s daily checklist. After a complete inspection, the Circuit Breaker’s weak insulation was found, which was repaired, as Figure 7 shows.
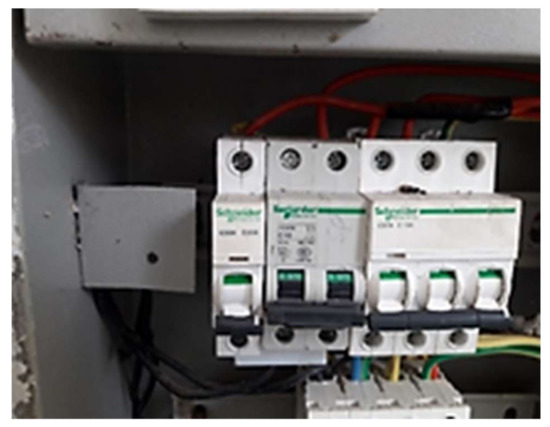 Figure 7. Fire alarm fault detected and repaired at circuit breaker level.
 - One of the PV modules in Block-2 was damaged. Figure 8a shows a photo of the damaged module. After a complete inspection, the damaged PV module was replaced, as Figure 8b shows a photo of it.
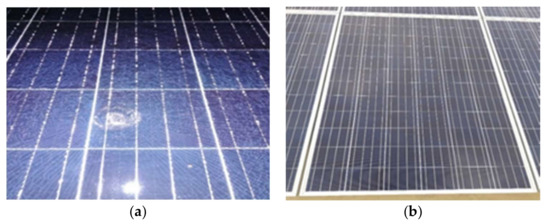 Figure 8. (a) Damaged solar PV module and (b) damaged module replaced with a new one.
 - Tracker Box 1–83 had charge issues. On examination, it was found that the tracker box battery was faulty, and it was replaced with an old charged battery. One of the classic pile heads of Tracker 6 in Block-6 shown in Figure 9 was bent down. After following all the PPEs, a new head was inserted, as indicated in Figure 9.
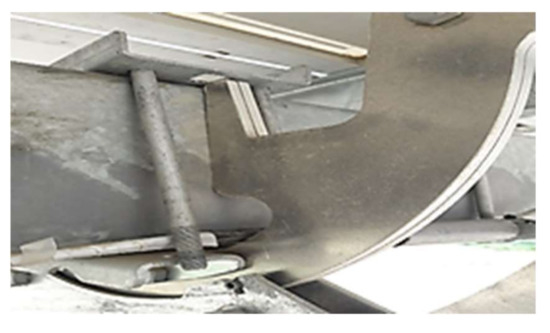 Figure 9. New pile head installed at a tracker.
 - In Block-2, one of the inverters, the S3NB1, was detected with the “fault stop” fault. After a complete inspection, the fault was rectified.
- The cable wire of the internet tower broke due to the heavy rain and wind. After a complete inspection, the cable wire was repaired and tightened.
- One of the tracker boxes # 5–9 had communication issues. When examined, it was not communicating with the OT SERVER. A new tracker box shown in Figure 10 was installed and configured with the OT server.
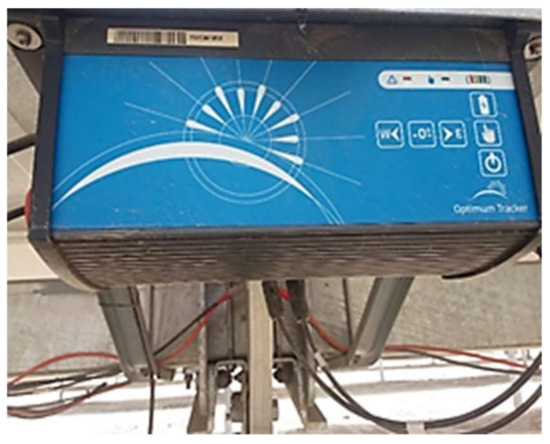 Figure 10. Tracker box communication issues rectified.
 - Twenty-two tracker boxes had communication and battery charging problems. After examination, the software was updated, the battery was charged, and the error was rectified.
Preventive maintenance at the PV power plant is performed through a detailed and documented plan. As an example, Table 10 lists the activities performed in March 2018. It contains the components, their executed preventive maintenance activities, and the schedule after which inspection, servicing, testing, or cleaning has to be performed: A (annually), B (bi-annually), D (daily), M (monthly), and W (weekly). Annual activities took place in September. Bi-annual activities took place in March and September.
Table 10.
Preventive maintenance schedule performed in March 2018.
4. Results, Analysis, and Recommendations
4.1. Software simulations for 18 MW Single-Axis Tracking PV Power Plant
PVsyst has been used as a software simulation tool for the 18 MW single-axis tracking PV power plant. They were performed using three different weather data sets available on the PVsyst: Meteonorm weather data, NASA weather data, and Plant site weather data. Four potential system loss cases were considered during the set of simulations carried:
- Simulation with no losses (Theoretical maximum energy production): simulation with no losses provides an insight into the theoretical maximum energy produced. Of course, it is practically impossible to have such a system output. However, it provides valuable information on the amount of losses created by different types of losses under comparison.
- Simulation with software default losses (Industry average losses): In this case, the software uses the average industry losses to simulate the PV power plant. Generally, this is considered the baseline against which the actual power plant results are compared.
- Simulation with plant site conditions losses (closest to actual plant conditions): loss values have been input in the software after detailed discussions with the plant manager. These simulation results should be considered a future baseline for the power plant against which the actual output should be compared.
- Simulation with minimum losses achievable as per literature review (Aspiration to achieve): in this option, the values have been taken from a literature review of optimally operated plants worldwide. Results should be used to reference which power plant managers should aspire to operate.
Table 11 lists the values of losses considered for the previous four cases. In contrast, Table 12 presents the power plant’s energy output for each case simulated using the three weather data sets available at the PVsyst.
Table 11.
Power plant system losses cases.
Table 12.
Simulations with different weather data sets and power losses scenario.
Table 13 shows that at zero losses scenario (theoretical maximum value), all-weather data sets provided the same results annually, i.e., 35,060 MWh. Similar results were found in the literature minimum losses scenario, with all results close to 33,113 MWh. However, the results obtained using the plant site conditions and software default values have shown considerable differences.
Table 13.
Plant output comparison with simulated results using different weather databases and with plant site loss conditions.
Monthly comparison between the actual plant output and simulated results of plant site losses and all-weather data sets is listed in Table 13. Percentage differences have also been listed and plotted in Figure 11 better to understand both power plants’ overperformance and underperformance. A major difference between plant site weather data simulation and actual plant energy output is 1350 MWh (4.13%) annually. This shows that the PV power plant has not been operating at the ideal conditions, and there is room for improvement in the operations and maintenance of the plant. In March, April, and July, the plant has shown better output than the simulated results, while the rest of the year, the plant has lagged. Major underperformance is verified in November, June, September, October, and December, with underperformance as high as 23.38%, 12.88%, 6.72%, 5.99%, and 5.73%, respectively.
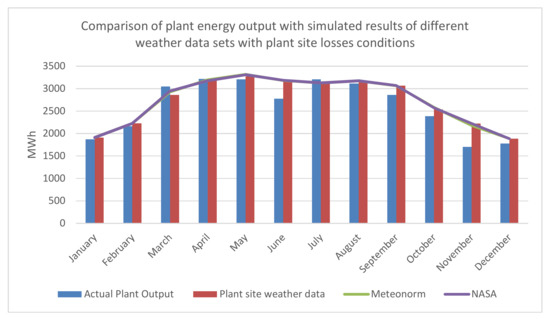
Figure 11.
Difference between actual plant output and simulated results based on different weather data sets.
Figure 11 shows that comparing the actual plant output and those values previewed by simulated results shows that differences are minor and not dependent on weather data. For example, the difference between simulations using the plant site weather data and Meteonorm is 93 MWh (0.28%) annually. Comparing simulations using plant site weather data and NASA data is 133 MWh (0.40%). Results indicate the credibility and reliability of the two different weather data sets. Meteonorm is even more reliable as its results are closer to the plant site weather data simulated results.
In our feasibility studies for the PV power plant, the Meteonorm simulation with the default losses scenario (31,496 MWh) has been considered our baseline. Hence, the plant’s annual output (31,328 MWh) is compared with this value. The difference stayed 169 MWh or a meager at 0.53% annually, which is not significant, with the plant performance being considered satisfactory.
However, to reach a precise figure of how much actual energy the plant should be producing, the baseline must be set using the simulation with actual plant site weather data and actual losses taking place in the power plant. As per that simulation, the power plant should be producing 32,678 MWh annually instead of 31,328 MWh. The difference now is quite significant at 1350 MWh or 4.13%. Table 12 lists the actual power plant’s monthly values, compares them with the present baseline (Meteonorm data + Default losses simulation), and compares them with the recommended baseline (Plant site weather data + Plant site losses conditions). All major underperforming months in both baseline scenarios (present and recommended) are similar, i.e., June, September, November, and December (in gray color at Table 14). This implied the need for complex operations and maintenance documentation and remedies during such times.
Table 14.
Plant energy output comparison with simulated results for the current baseline and recommended baseline.
For the two key simulated results listed in Table 14, the plant’s performance ratio (PR) has also been compared to verify the authenticity of simulations performed. Table 15 lists the PR values. They indicated that the power plant operates close to or even has a slightly better annual performance ratio than predicted using PVsyst. In addition, it considered the plant site weather data and plant site loss conditions. In conclusion, one can say that this validates the results of the simulation performed.
Table 15.
Performance ratio (PR) compares the actual power plant and simulated results for the current and recommended baseline.
At this point, we consider that the PV power plant management needs to look into its O&M scheme to improve its energy output and reach an annual output of 32,678 MWh and achieve the minimum literature losses.
Table 16 compares the actual plant’s power losses with those set as minimum in the literature. To reach it, the plant’s annual output can reach up to 33,113 MWh, increasing revenues even further.
Table 16.
Plant energy output comparison with recommended case and future aspiration.
These results clearly show a major potential of increasing annual revenues by improving the plant energy output. The tariff awarded to the power plant in Pakistan by NEPRA (National Electric Power Regulatory Authority) for the first ten years (out of 25 years of plant life) of plant operation is 14.3961 (USD)/kWh and 6.0422 (USD)/kWh for the next 15 years. Since the PV power plant started its operation in 2017 and even considering it will begin improving its energy output from 2020, Table 17 will preview the annual revenue increment the PV plant can achieve over its lifetime (25 years). Unit conversion from dollar to euro has been considered as 1 USD = 0.9 EUR.
Table 17.
Additional revenue in case of achieving energy output of recommended software simulated results.
In achieving the literature minimum energy losses, the PV power plant can further increase the revenues, as shown in Table 18.
Table 18.
Additional revenue in case of achieving energy output of literature minimum losses simulated results.
4.2. Operations and Maintenance
From the standpoint of O&M, it can be seen that the PV power plant management is doing well in many areas, but there is room for improvement. Precise data collection and reporting are being performed. Maintenance is being categorized as predictive and corrective maintenance, and an annual maintenance plan is in place, as we have shown. Cleaning PV modules are made four times a month, which is more than the monthly average industry cleaning cycle. This is because fine particles cause such a high cleaning rate, as dirt and dust, generated and brought to the surface by wind, vehicular movement (created because of the uncarpeted road), wheat crop harvesting, and coal ash from nearby coal ash disposal sites.
O&M reports do not show details of problems in five months where the power plant has underperformed, i.e., June, September, October, November, and December. Still, comparing the results of Table 9 and Table 13, we can assess that most corrective maintenance activities have been performed on trackers in the months where there has been major underperformance, as Table 19 puts in evidence. From this, it can be inferred that trackers’ faults are major contributors to reducing plant performance, and predictive maintenance should be adopted to address the issue.
Table 19.
Plant underperformance vs. corrective maintenance.
In conclusion, there is a need for automated plant diagnosis with a bottom-up approach with data acquisition and processing, starting from the strings level and combined with predictive maintenance and preventive/corrective maintenance at the plant.
Some of the key performance indicators for performance assessment are being measured in the PV plant. These are listed in Table 20. It shows the key performance indicators, which, as per the best practices in O&M of solar PV power plants, should be measured as the minimum requirement, recommendation, or best practice [6]. The fourth column next to the ‘Requirement’ column shows whether it is being measured at the plant site or not. Power plant management should measure the indicators that are not being measured presently and determine the actual amount of losses generated at various plant areas.
Table 20.
Key performance indicators in operations and maintenance of the PV power plant.
4.3. Recommendations for Managers of Large-Scale PV Power Plants
Based on our case-study results and the analysis of energy output of the PV plant using PVsyst simulations, the data gained allowed us to compare the PV plant operations and maintenance practices with those globally adopted. Hence, taking into account, the constraint reality of an under-developed country, our most relevant outcomes are resumed in the following recommended O&Ms:
- The baseline for comparison should be the simulation results using a plant site weather data with actual plant site losses instead of, for example, Meteonorm weather data and average industry losses;
- Actual losses taking place at the power plant, such as soiling, ohmic losses, module quality, and mismatch, must be measured and documented;
- Measurement of the following Key Performance Indicators should be conducted. One points out first a requirement of a minimum set of KPIs as intervention time and response time. However, the following KPIs are recommended: mean time between failures, inverter specific losses, inverter specific efficiency, module soiling losses, and energy-based availability). As a best practice, these KPIs are advised: temperature corrected performance ratio, energy performance index, and uptime;
- Automated plant diagnosis with a bottom-up approach, with data acquisition and processing, starting from strings level and combined with predictive maintenance in addition to preventive and corrective maintenance, is recommended;
- Dust accumulation on the PV modules is today a terrible must, demanding more cleaning cycles monthly. It must be remembered that this matter should be considered during the site selection of the PV plant as they can potentially increase the O&M costs.
5. Conclusions
Performance analysis of an 18 MW single-axis tracking solar PV power plant has been conducted based on comparing its actual energy output with an expected energy output obtained through simulation using specialized software. In addition, a review of its operations and maintenance reports has been performed, comparing them with global best practices in the solar PV industry.
Software simulations have been performed with three different weather data sets and losses at the plant site. The reference performance value obtained based on Meteonorm weather data with average industry losses (present baseline for performance assessment) is significantly different from the value obtained using the site weather data and losses coefficients reflecting the power plant (recommended baseline for performance assessment). Power plant management needs to change their approach towards setting the baseline because comparing the annual energy output with the software simulated plant weather data with actual plant loss coefficients. It has been found out that the power plant is underperforming by 4.13% at the current state, which in monetary terms translates into a loss of 1.75 × 10⁵ (EUR)/yr and can lead to a loss of 2.58 × 10⁶ (EUR) throughout the lifetime of the project. Improving the operations and Maintenance of this loss can be translated into additional revenue.
Moreover, suppose the power plant strives to reduce the losses to the lowest in the industry. In that case, the software simulated results show that the annual yield can be increased by 5.39%, providing an additional annual revenue of 2.31 × 10⁵ (EUR)/yr. Thus, it would generate 3.41(106 (EUR) of additional revenue over the project’s lifetime.
Operations and maintenance reports do not show details of problems in five months where the power plant has underperformed, i.e., June, September, October, November, and December. Still, comparing underperformance results with corrective maintenance activities performed, it can be assessed that tracker systems’ major issues led to the underperformance. Moreover, issues in inverters and combiner boxes have also been reported leading to internal shutdowns. In this case, predictive Maintenance and automated plant diagnosis with a bottom-up approach with data acquisition and processing starting from strings level are recommended. The majority of large-scale PV power plants in operation were built in the last ten years and are anticipated to remain for about twenty years. Usually, the O&M costs reach about 25% of a PV plant’s annual cost, increasing as the plant becomes older and equipment warranties expire. Therefore, knowing the link between maintenance activity, frequency, and availability is particularly important when the warranty term expires and/or if the OEM exits the market. This paper has shown that the most recommended predictive maintenance procedures can prevent their specific failures. However, future research must have to be pursued to complement the available technical knowledge with patterns recognized via machine learning techniques to identify the reasons behind the incidents, thus helping to develop corresponding relief strategies.
Author Contributions
Conceptualization, methodology, and software: H.I. and E.S.; validation and formal analysis: H.I., E.S., P.J.C.B.; writing—original draft preparation, writing—review and editing, P.J.C.B.; supervision, E.S., P.J.C.B. All authors have read and agreed to the published version of the manuscript.
Funding
This research received no external funding.
Institutional Review Board Statement
Not applicable.
Informed Consent Statement
Not applicable.
Data Availability Statement
Not applicable.
Acknowledgments
FCT supported this work—Foundation for Science and Technology, I.P., through IDMEC, under LAETA, project UIDB/50022/2020.
Conflicts of Interest
The authors declare no conflict of interest.
References
- IRENA. Renewable Capacity Statistics; International Renewable Energy Agency (IRENA): Abu Dhabi, United Arab Emirates, 2019. [Google Scholar]
- International Renewable Energy Agency (IRENA). Renewable Capacity Highlights; International Renewable Energy Agency: Abu Dhabi, United Arab Emirates, 2019. [Google Scholar]
- REN21 Renewables. 2019 Global Status Report; Secretariat: Paris, France, 2019. [Google Scholar]
- Solar Trade; Inter Solar; Solar Power Europe. Operation & Maintenance Best Practices Guidelines, Version 3.0; SolarPower Europe: Brussels, Belgium, 2018. [Google Scholar]
- Bem Lumby, International Finance Corporation. Utility-Scale Solar Photovoltaic Power Plants in Partnership with a Project Developer’s Guide; International Finance Corporation: Washington, DC, USA, 2015; pp. 1–216. [Google Scholar]
- Lisco, F.; Bukhari, F.; Uličná, S.; Isbilir, K.; Barth, K.L.; Taylor, A.; Walls, J.M. Degradation of Hydrophobic, Anti-Soiling Coatings for Solar Module Cover Glass. Energies 2020, 13, 3811. [Google Scholar] [CrossRef]
- IEC 61724-1. Photovoltaic System Performance—Part 1: Monitoring; IEC Central Office: Geneva, Switzerland, 2017. [Google Scholar]
- Srivastava, R.; Tiwari, A.N.; Giri, V.K. An overview on performance of PV plants commissioned at different places in the world. Energy Sustain. Dev. 2020, 54, 51–59. [Google Scholar] [CrossRef]
- Dahmoun, M.E.H.; Bekkouche, B.; Sudhakar, K.; Guezgouz, M.; Chenafi, A.; Chaouch, A. Performance evaluation and analysis of grid-tied large scale PV plant in Algeria. Energy Sustain. Dev. 2021, 61, 181–195. [Google Scholar] [CrossRef]
- Bosman, L.B.; Leon-Salas, W.D.; Hutzel, W.; Soto, E.A. PV System Predictive Maintenance: Challenges, Current Approaches, and Opportunities. Energies 2020, 13, 1398. [Google Scholar] [CrossRef] [Green Version]
- Betti, A.; Tucci, M.; Crisostomi, E.; Piazzi, A.; Barmada, S.; Thomopulos, D. Fault Prediction and Early-Detection in Large PV Power Plants Based on Self-Organizing Maps. Sensors 2021, 21, 1687. [Google Scholar] [CrossRef]
- Ortega, E.; Aranguren, G.; Jimeno, J.C. New monitoring method to characterize individual modules in large photovoltaic systems. Sol. Energy 2019, 193, 906–914. [Google Scholar] [CrossRef]
- Ahmed, N.; Khan, A.N.; Ahmed, N.; Aslam, A.; Imran, K.; Sajid, M.B.; Waqas, A. Techno-economic potential assessment of mega-scale grid-connected PV power plant in five climate zones of Pakistan. Energy Convers. Manag. 2021, 237, 114097. [Google Scholar] [CrossRef]
- Shao, M.; Han, Z.; Sun, J.; Xiao, C.; Zhang, S.; Zhao, Y. A review of multi-criteria decision-making applications for renewable energy site selection. Renew. Energy 2020, 157, 377–403. [Google Scholar] [CrossRef]
- Akram, M.W.; Li, G.; Jin, Y.; Chen, X.; Zhu, C.; Zhao, X.; Aleem, M.; Ahmad, A. Improved outdoor thermography and processing of infrared images for defect detection in PV modules. Sol. Energy 2019, 190, 549–560. [Google Scholar] [CrossRef]
- Grubišić-Čabo, F.; Nižetić, S.; Marinić Kragić, I.; Čoko, D. Further progress in the research of fin-based passive cooling technique for the free-standing silicon photovoltaic panels. Int. J. Energy Res. 2019, 43, 3475–3495. [Google Scholar] [CrossRef]
- Baklouti, A.; Mifdal, L.; Dellagi, S.; Chelbi, A. An Optimal Preventive Maintenance Policy for a Solar Photovoltaic System. Sustainability 2020, 12, 4266. [Google Scholar] [CrossRef]
- Walker, H.; Lockhart, E.; Desai, J.; Ardani, K.; Klise, G.; Lavrova, O.; Tansy, T.; Deot, J.; Fox, B.; Pochiraju, A. Model of Operation-and-Maintenance Costs for Photovoltaic Systems; (No. NREL/TP-5C00-74840); National Renewable Energy Lab. (NREL): Golden, CO, USA, 2020. [Google Scholar]
- Pleşca, V.; Purece, C. Predictive maintenance of photovoltaic plants using multirotor drones with automatic recharging system of Li-Po batteries. E3S Web Conf. 2020, 180, 02007. [Google Scholar] [CrossRef]
- Alizadeh, H.; Nazari, M.A.; Ghasempour, R.; Shafii, M.B.; Akbarzadeh, A. Numerical analysis of photovoltaic solar panel cooling by a flat plate closed-loop pulsating heat pipe. Sol. Energy 2020, 206, 455–463. [Google Scholar] [CrossRef]
- Sengupta, M.; Habte, A.; Wilbert, S.; Gueymard, C.; Remund, J. Best Practices Handbook for the Collection and Use of Solar Resource Data for Solar Energy Applications; (No. NREL/TP-5D00-77635); National Renewable Energy Lab. (NREL): Golden, CO, USA, 2021. [Google Scholar]
- Sharma, D.K.; Verma, V.; Singh, A.P. Review and analysis of solar photovoltaic softwares. Int. J. Curr. Eng. Technol. 2014, 4, 725–731. [Google Scholar]
- Bhattacharya, I. A Detailed Study of 7 Unique Solar PV Design and Simulation Software. 2015. Available online: https://www.linkedin.com/pulse/comparative-analysis-7-most-popular-solar-pv-design-bhattacharya/?trk=mp-reader-card (accessed on 30 September 2019).
- Umar, N.; Bora, B.; Banerjee, C.; Panwar, B.S. Comparison of different PV power simulation softwares: Case study on performance analysis of 1 MW grid-connected PV solar power plant. Int. J. Eng. Sci. Invent. 2018, 7, 11–24. [Google Scholar]
- Matchanov, N.A.; Seok, K.O.; Mirzaev, A.A.; Malikov, M.A.; Saidov, D.S. Study of Energy Yield on Grid Connected Micro-Inverter Type 2.24 kW PV System Using PVsyst Simulation Software. Appl. Sol. Energy 2020, 56, 263–269. [Google Scholar] [CrossRef]
- Abdalla, S.N.M.; Özcan, H. Design and simulation of a 1-GWp solar photovoltaic power station in Sudan. Clean Energy 2021, 5, 57–78. [Google Scholar] [CrossRef]
- Akhtar, I.; Kirmani, S.; Jamil, M. Effective grid-connected solar home-based system for smart cities in India. In Smart Cities—Opportunities and Challenges; Springer: Singapore, 2020; pp. 607–614. [Google Scholar]
- Corba, Z.; Popadic, B.; Milicevic, D.; Dumnic, B.; Katic, V.A. A Long-Term Condition Monitoring and Performance Assessment of Grid Connected PV Power Plant with High Power Sizing Factor under Partial Shading Conditions. Energies 2020, 13, 4810. [Google Scholar] [CrossRef]
- Gholami, A.; Ameri, M.; Zandi, M.; Ghoachani, R.G.; Eslami, S.; Pierfederici, S. Photovoltaic potential assessment and dust impacts on photovoltaic systems in Iran. IEEE J. Photovolt. 2020, 10, 824–837. [Google Scholar] [CrossRef]
- Salameh, T.; Assad, M.E.H.; Tawalbeh, M.; Ghenai, C.; Merabet, A.; Öztop, H.F. Analysis of cooling load on commercial building in UAE climate using building integrated photovoltaic façade system. Sol. Energy 2020, 199, 617–629. [Google Scholar] [CrossRef]
- Quansah, D.A.; Adaramola, M.S. Ageing and degradation in solar photovoltaic modules installed in northern Ghana. Sol. Energy 2018, 173, 834–847. [Google Scholar] [CrossRef]
- Kumar, M.; Chandel, S.S.; Kumar, A. Performance analysis of a 10 MWp utility-scale grid-connected canal-top photovoltaic power plant under Indian climatic conditions. Energy 2020, 204, 117903. [Google Scholar] [CrossRef]
- Kumar, N.M.; Gupta, R.P.; Mathew, M.; Jayakumar, A.; Singh, N.K. Performance, energy loss, and degradation prediction of roof-integrated crystalline solar PV system installed in Northern India. Case Stud. Therm. Eng. 2019, 13, 100409. [Google Scholar] [CrossRef]
- Majed, A.R.; Gueymard, C.A.; Al-Khayat, M.; Ismail, A.; Lee, J.A.; Al-Duaj, H. Performance evaluation of a utility-scale dual-technology photovoltaic power plant at the Shagaya Renewable Energy Park in Kuwait. Renew. Sustain. Energy Rev. 2020, 133, 110139. [Google Scholar]
- Yazdani, H.; Yaghoubi, M. Techno-economic study of photovoltaic systems performance in Shiraz, Iran. Renewable Energy 2021, 172, 251–262. [Google Scholar] [CrossRef]
- Vidal, H.; Rivera, M.; Wheeler, P.; Vicencio, N. The Analysis Performance of a Grid-Connected 8.2 kWp Photovoltaic System in the Patagonia Region. Sustainability 2020, 12, 9227. [Google Scholar] [CrossRef]
- PVsyst. Array Incidence Loss. Available online: http://files.pvsyst.com/help/iam_loss.htm (accessed on 30 July 2019).
- Upadhyay. PVsyst Losses & Some Remedies. 2017. Available online: https://www.linkedin.com/pulse/pvsyst-losses-some-remedies-amit-upadhyay/ (accessed on 30 July 2019).
- Maghami, M.R.; Hizam, H.; Gomes, C.; Radzi, M.A.; Rezadad, M.I.; Hajighorbani, S. Power loss due to soiling on solar panel: A review. Renew. Sustain. Energy Rev. 2016, 59, 1307–1316. [Google Scholar] [CrossRef] [Green Version]
- Dunn, L.; Littmann, B.; Caron, J.R.; Gostein, M. PV module soiling measurement uncertainty analysis. In Proceedings of the IEEE 39th Photovoltaic Specialists Conference (PVSC), Tampa, FL, USA, 16–21 June 2013; pp. 658–663. [Google Scholar]
- Mekhilef, S.; Saidur, R.; Kamalisarvestani, M. Effect of dust, humidity and air velocity on efficiency of photovoltaic cells. Renew. Sustain. Energy Rev. 2012, 16, 2920–2925. [Google Scholar] [CrossRef]
- Thevenard, D.; Driesse, A.; Pelland, S.; Turcotte, D.; Poissant, Y. Uncertainty in Long-Term Photovoltaic Yield Predictions; Natural Resources Canada: Ottawa, ON, Canada, 2010.
- Emblemsvåg, J. On the levelised cost of energy of solar photovoltaics. Int. J. Sustain. Energy 2020, 1–26. [Google Scholar] [CrossRef]
- Mansur, A.A.; Amin, M.; Islam, K.K. Performance comparison of mismatch power loss minimization techniques in series-parallel PV array configurations. Energies 2019, 12, 874. [Google Scholar] [CrossRef] [Green Version]
- Jacobson, M.Z.; Delucchi, M.A. Providing all global energy with wind, water, and solar power, Part I: Technologies, energy resources, quantities and areas of infrastructure, and materials. Energy Policy 2011, 39, 1154–1169. [Google Scholar] [CrossRef]
- Mccormack, S.; Conlon, M. Measured Performance of a 1.72 kW Rooftop Grid-Connected Photovoltaic System in Ireland. Energy Convers. Manag. 2011, 52, 816–825. [Google Scholar]
- GENSOL. Generation Assessment and Loss Justification of 315 Wp Panels in 1 MW Power Plant. Available online: https://www.slideshare.net/AnmolJaggi/analysis-of-pvsyst-loss-diagram (accessed on 30 May 2019).
- Lorenz, T.; Klimm, E.; Weiss, K. Soiling and anti-soiling coatings on surfaces of solar thermal systems—Featuring an economic feasibility analysis. Energy Procedia 2014, 48, 749–756. [Google Scholar] [CrossRef]
- de Jesus, M.A.M.L.; Timò, G.; Agustín-Sáenz, C.; Braceras, I.; Cornelli, M.; Ferreira, A.D. Anti-soiling coatings for solar cell cover glass: Climate and surface properties influence. Sol. Energy Mater. Sol. Cells 2018, 185, 517–523. [Google Scholar] [CrossRef]
- Tsanakas, J.A.; Ha, L.; Buerhop, C. Faults and infrared thermographic diagnosis in operating c-Si photovoltaic modules: A review of research and future challenges. Renew. Sustain. Energy Rev. 2016, 62, 695–709. [Google Scholar] [CrossRef]
- Solar-DAO. Everything You Need to Know About Operations & Maintenance (O&M) For Utility Scale PV Solar Plants. 2017. Available online: https://medium.com/@solar.dao/everything-you-need-to-know-about-operations-maintenance-o-m-for-utility-scale-pv-solar-plants-9d0048e9b9a2 (accessed on 30 May 2019).
- IEC Technical Specs IEC TS. Photovoltaic System Performance—Energy Evaluation Method; British Standards Institution [BSI]: London, UK, 2016. [Google Scholar]
Publisher’s Note: MDPI stays neutral with regard to jurisdictional claims in published maps and institutional affiliations. |
© 2021 by the authors. Licensee MDPI, Basel, Switzerland. This article is an open access article distributed under the terms and conditions of the Creative Commons Attribution (CC BY) license (https://creativecommons.org/licenses/by/4.0/).