Article

Zero-Emission Pathway for the Global Chemical and Petrochemical Sector

International Renewable Energy Agency (IRENA), Innovation and Technology Centre (IITC), 53113 Bonn, Germany
*
Author to whom correspondence should be addressed.
Energies 2021, 14(13), 3772; https://doi.org/10.3390/en14133772
Submission received: 28 April 2021 / Revised: 12 June 2021 / Accepted: 16 June 2021 / Published: 23 June 2021
(This article belongs to the Special Issue Energy Planning)

Abstract

:
The chemical and petrochemical sector relies on fossil fuels and feedstocks, and is a major source of carbon dioxide (CO2) emissions. The techno-economic potential of 20 decarbonisation options is assessed. While previous analyses focus on the production processes, this analysis covers the full product life cycle CO2 emissions. The analysis elaborates the carbon accounting complexity that results from the non-energy use of fossil fuels, and highlights the importance of strategies that consider the carbon stored in synthetic organic products—an aspect that warrants more attention in long-term energy scenarios and strategies. Average mitigation costs in the sector would amount to 64 United States dollars (USD) per tonne of CO2 for full decarbonisation in 2050. The rapidly declining renewables cost is one main cause for this low-cost estimate. Renewable energy supply solutions, in combination with electrification, account for 40% of total emissions reductions. Annual biomass use grows to 1.3 gigatonnes; green hydrogen electrolyser capacity grows to 2435 gigawatts and recycling rates increase six-fold, while product demand is reduced by a third, compared to the reference case. CO2 capture, storage and use equals 30% of the total decarbonisation effort (1.49 gigatonnes per year), where about one-third of the captured CO2 is of biogenic origin. Circular economy concepts, including recycling, account for 16%, while energy efficiency accounts for 12% of the decarbonisation needed. Achieving full decarbonisation in this sector will increase energy and feedstock costs by more than 35%. The analysis shows the importance of renewables-based solutions, accounting for more than half of the total emissions reduction potential, which was higher than previous estimates.

1. Introduction

The chemical and petrochemical sector is of vital economic importance. Global production amounted to 5.7 trillion United States dollars (USD) in 2017, including pharmaceuticals. Production is projected to quadruple by 2060 [1]. The sector’s reliance on fossil fuels and fossil feedstocks results in the emissions of carbon dioxide (CO2) during the production, use and end-of-life phases. As a result, the chemical and petrochemical sector is a major contributor to global industrial CO2 emissions, ranking third behind iron and steel-making and cement production. Total direct emissions from production, product use and waste handling amounted to 1.6 gigatonnes (Gt) of CO2 per year, while indirect emissions related to electricity supply accounted for 0.6 Gt of CO2 per year. Production of chemicals results in around 1.1 Gt of energy and processing CO2 emissions annually, accounting for about half of the full life cycle carbon footprint (estimated based on Ref. [2]). Emissions from the use of around 178 million tonnes (Mt) of urea fertiliser and decomposition/incineration of around 60 Mt of plastics per year result in an additional 0.3 Gt of CO2 per year [3]. Another 0.2 Gt of CO2 emissions arise from the use of solvents and surfactants.
The sector produces plastics, fibers, solvents, inorganic chemicals and hundreds of other types of products. Plastics production grew 20-fold over the past five decades to reach 360 Mt by the end of 2018 [4]. In addition, 115 Mt of other synthetic organic materials were produced. However, three-quarters of the total energy and non-energy use is accounted for by the manufacturing of certain products, such as: olefins (ethylene, propylene, butadiene) aromatics, ammonia, methanol and carbon black (see Figure 1). Plastics and fibers account for most of the product mix in volume terms, at around 400 Mt per year in 2018. Polyolefins (made from ethylene, propylene and butadiene) account for nearly half of all plastics production. Various polyethylene (PE) grades, polypropylene (PP) and polyamide (PA) account for 30%, 17% and 15% of all plastics production worldwide, respectively. Polyvinyl chloride (PVC) and polyethylene terephthalate (PET) combined account for another 19% of the total [5].
Around 175 Mt of ammonia was produced in 2020 and was mainly used as nitrogen fertiliser. Annual methanol production amounted to more than 98 Mt in 2019. Methanol is used in the production of formaldehyde, acetic acid, di-methyl terephthalate, olefins and solvents. While ammonia and methanol are largely produced from coal in China, gas-based production dominates elsewhere. Figure 1 provides an overview of material flows in global petrochemicals production in 2017.
The chemical and petrochemical sector is the largest energy user in the manufacturing industry, with a total consumption of 46.8 exajoules (EJ) in 2017 (including non-energy use, NEU) [2]. Oil and gas dominated the sector’s total consumption, with around 10% of global natural gas supply and 12% of all oil consumed by this sector. The chemical and petrochemical sector is unique, as significant amounts of fossil fuels are used as raw material (i.e., feedstock or NEU) [7]. This NEU reflects the energy content of the products that are sold. For products such as ammonia, methanol and plastics, the NEU exceeds the process energy use in their production [8]. This has profound consequences for strategies to abate emissions in the life cycle of the sector’s products, which will be elaborated on below. The added carbon accounting complexity that results from NEU and carbon storage in materials and products is an aspect that warrants more attention in long-term energy scenarios [9]. As a result of this complexity, emission reductions in this sector constitute one of the main challenges for realising the Paris Agreement goals [10]. Moreover, as a large user of oil products, the sector’s continued reliance on fossil fuels results in emissions outside of its boundaries in the petroleum sector [11,12]. This paper provides an assessment of 20 options that can be categorized on five main strategies to put the sector’s life cycle CO2 emissions on a pathway to net-zero by the mid-21st century. The analysis investigates each option’s contribution to put the sector on a net-zero pathway and the respective CO2 mitigation cost. The Supplementary Materials (Section A) provides a detailed overview of the status of low-carbon technologies worldwide.
We address two research questions in this paper:
  • How can zero emissions be achieved, considering the full product life cycle?
  • What is the potential contribution of renewables-based solutions?
This paper combines specific technology assessments to provide sector and life cycle level insights at the global level, with relevance in terms of future energy demand, location choices, plant siting and investment needs. The analysis covers direct emissions from production, as well as materials use and waste handling. The analysis accounts for emissions and carbon storage in products and their subsequent treatment in the waste management phase.
Section 2 provides a review of existing decarbonisation studies for the chemical and petrochemical sectors. Section 3 provides the details of the methodology and technology data. Section 4 presents results followed by a discussion of the opportunities and challenges of decarbonisation in Section 5, and the conclusion is Section 6.

2. Review of Literature on Decarbonisation of the Chemical and Petrochemical Sector

So far, the sector has made limited progress in reducing absolute CO2 emissions levels at a global level, as demand growth has exceeded efficiency gains. Technical energy efficiency potentials have been exhausted. Multiple conversion processes are usually integrated in large, ageing industrial complexes that result in high energy efficiency on site, but that also limits achieving additional energy savings by switching to the best available technologies [8]. Around half of the sector’s heat demand relates to high-temperature processes, which complicate renewable energy deployment [6]. Petrochemical production is increasingly integrated into refinery operations, with modern refinery designs yielding 50% petrochemicals in the product mix. Such plant design locks in fossil energy use going forward. The integration also complicates energy accounting for petrochemical products.
Plastics and other synthetic organic materials are currently produced from fossil fuel feedstocks. These can be replaced with biomass or synthetic feedstocks produced from CO2 and renewables-based hydrogen. Bioplastics constitute less than 1% of current plastics production. The high cost of low-carbon alternatives acts as a major barrier [6,13,14,15] 35% of the emissions reduction potential lies with materials systems optimisation, while the remaining 65% is related to energy use in the materials production processes [16]. However, the circular economy is not well developed in this sector, despite decades of efforts. A majority share of post-consumer plastic and textiles is incinerated or dumped in landfills [17]. Low recycling rates and low energy recovery rates add to energy use and CO2 emissions [18]; the future reconciliation of product demand growth and sustainability is therefore challenging.
Several studies have assessed the future CO2 emissions reduction potentials in the sector. However, the conclusions regarding emissions reductions are not in line with the recent net-zero emissions objectives formulated by major economies [19]. For instance, a study for the Dutch chemical and petrochemical industry, which is representative of the global chemical and petrochemical sector, concluded that a 90% reduction in national sectorial emissions is feasible [20]. This would require 63 billion euros of investments (USD 75 billion), split into 26 billion for new chemical plants and 37 billion for energy supply. Energy and feedstock supply cost would rise by 50%. The average emission mitigation cost would amount to 140 euros per tonne of CO2 (USD 170/t CO2). Annually, the industry would require 280 petajoules (PJ) of biomass and 11.4 gigawatts (GW) of offshore wind capacity. Biomass feedstock accounts for more than one-third, while renewable energy and CCS each account for one-sixth of the effort, and the remainder is accounted for by energy efficiency, closure of materials chains and nitrous oxide emission reductions.
Deep emissions reductions in Europe are technically possible through power supply decarbonisation and CCS integration with chemical processes in the 2030–2050 timeframe [21]. A range of current and future technologies can sustain Europe’s track record of energy and emissions intensity improvements: final energy demand can be maintained at a constant level, and emissions could be virtually eliminated with energy efficiency (33% of the total emissions reductions), CO2 capture and storage (CCS) (25%), renewable electricity (20%) and fuel switching and measures to reduce nitrous oxide emissions (22%). To enable continuous and competitive production, access to large amounts of affordable and reliable energy and feedstock will be necessary, which can be challenging for renewables [20]. Infrastructure will be crucial, including transmission grids for renewable power, pipelines for hydrogen, CO2 and heat, and waste logistics and recycling.
According to the International Energy Agency’s (IEA) Reference Technology Scenario (RTS), global sectorial CO2 emissions would grow by around 40% globally from the current level, in line with a plastics demand growth of 600 Mt/yr [22]. The Clean Technology Scenario (CTS) estimates direct annual CO2 emissions of 0.8 Gt by 2050, equivalent to a 60% reduction compared to the RTS. The IEA’s analysis focuses on the reduction of emissions from direct energy use and processes that only cover two-thirds of the sector’s total life cycle emissions. Energy efficiency therefore plays a key role in the IEA’s analysis, contributing 25% to the mitigation effort. The role of alternative feedstocks and plastics recycling is limited to 15%. The IEA analysis suggests a continued importance of fossil fuel use in the sector, which is inconsistent with net zero by 2050.
According to Ref. [23], electrification of processes and new catalytic conversion routes can be listed as key options. Biomass and recycling are key strategies to reduce fossil feedstock use, while CO2-based fuels and chemicals are unlikely to be significant contributors to global abatement in the next two decades. For energy supply, clean hydrogen, heat pumps and waste energy use, as well as energy management systems, are low-carbon options for decarbonisation.
Historical chemical and petrochemical sector energy efficiency trends have been assessed widely [24,25,26], but only a few studies have estimated the future efficiency potential [27,28,29]. More studies have focused on the assessment of renewable fuels and feedstocks and electrification potentials [30,31]. The sector’s long-term decarbonisation potential is typically assessed as part of all energy-intensive industry sectors [32,33,34,35]. While such a broad perspective is useful from a general industrial policy perspective, gaining insights into the potential, investment needs and challenges of these options in isolation from other sectors is crucial to design sector-specific decarbonisation policies. According to Ref. [36] the industry focuses mainly on supply side mitigation options. Downstream options like material efficiency have received less attention due to the limited availability of material flows and supply chain data, as well as the insufficient understanding of potentials. (The industry often argues that its products reduce life cycle emissions compared to other materials for a range of specific products. A full life cycle analysis for the whole sector would require an assessment of the use stage of buildings, cars, and other type of complex products where plastics and other materials are deployed, which is beyond the scope of this paper).
According to Ref. [37] the lack of manufacturing experience, cost evaluations and proofs of concept of most mitigation measures on a large industrial scale. This is particularly the case for the hydrogen- and CO2-based routes, but also for emerging biomass routes [38]. While technologies for all proposed production pathways are in principle available and demonstration plants are in operation, more efforts are needed to deploy these technologies on an industrial scale.

3. Materials and Methods: Prioritisation of Technology Options for Decarbonisation

A net-zero pathway has been developed for the global chemical and petrochemical sector to 2050, based on a detailed bottom-up technology approach. The full product life cycle emissions are covered in the analysis. Technology-specific mitigation costs have been collected to assess transformation impacts on the sector’s total energy and feedstock cost. The results presented in the paper are part of IRENA’s global energy system optimisation model. Thus, critical issues for the sector, such as competition for scarce biomass resources and the availability of renewable power for chemicals production, have been considered in technology choices.
In the case of the chemical and petrochemical sector, a large share of the energy inputs is used as feedstock, and around two-thirds of all carbon input is stored in chemicals. Moreover, as earlier analyses have shown, the sector’s energy statistics include large uncertainties which require bottom-up methodologies that combine the production and energy use data of individual chemicals [26,29,39]. In this study, energy balances are thus combined with materials flow analysis and materials system optimisation, which includes various stages of the product life cycle. According to Ref. [36], there is a need to enhance the understanding of downstream mitigation options and their techno-economic potential for the proper modeling of impacts from varying efficiencies in material service provision. They also state that it would be important to include the relevant aspects of the MATerials Technologies for greenhouse gas Emission Reduction (MATTER) project, conducted in the late 1990s, which may have represented the peak of ambition with regards to integrated energy- and materials-related climate change mitigation research and other similar models in integrated assessment model frameworks [16].
The tracking of carbon flows from production to the waste management stage in this study helps to better understand the circular economy potential and its role in net-zero strategy development. Such bottom-up modeling can inform integrated assessment models in the representation of complex solutions, such as circular economy concepts.
The analysis covers the 2017–2050 period, and is based on a techno-economic assessment of technologies for decarbonising the global chemical and petrochemical sector, with a special focus on five particular strategies. Each strategy includes several technological options. The energy and emissions impact of each technology has been assessed to 2050, by gauging its potential under the 1.5 °C case compared to the Planned Energy Scenario (PES) [40]. Global results are estimated based on a bottom-up assessment of the energy use and emissions in China, India, Japan, 27 countries of the European Union (EU-27), the US, the remainder of the Group of 20 (G20) countries and the rest of the world. The Supplementary Materials (see Section B) provides further details regarding the scenario definitions and the additional data and assumptions used for the analysis.
As a first step, the production volumes of the major chemical production processes (i.e., high value chemicals, ammonia, methanol and carbon black), their respective specific energy consumption (for fuel and feedstock) values and the production process fuel mix were collected for the base year 2017. The combination of production volume, fuel mix and the specific energy consumption yields the total energy and non-energy use from the production of these chemicals for the base year 2017. These major chemical production processes account for more than 60% of the sector’s total global energy and non-energy uses and related CO2 emissions (Table 1 and Table 2). The energy use related to the production of all other chemicals has been estimated with a country/region-specific coefficient. This share of energy use is attributed to the downstream processing of the chemical building blocks of plastics, fibres, solvents and hundreds of other types of products. Projections reflect the growth of this energy use in proportion with the rest of the sector. (The coefficient includes corrections for energy accounting in the process energy and non-energy use categories in the IEA energy balances, based on our bottom-up assessment of the non-energy use. The coefficient is estimated as a ratio of the bottom-up estimate of the process energy use based on the selected chemicals and the reported process energy use according to the IEA energy balances. While our bottom-up estimate covers 86% of the total NEU reported in the IEA energy balances, we assume that non-energy use is 100% covered by the production of the chemicals selected for this analysis. The 14% of the total reported global non-energy use according to the IEA energy balances is equivalent to 3.6 EJ in absolute terms [2] and a share of this is assumed to be consumed as process energy. Similar statistical accounting issues have been reported previously [8,39]).
To assess the total energy and carbon flows in waste management, additional data for the total volume of plastics production, demand and plastic waste generation have been collected for 2017. In a subsequent step, the energy demand in the PES in the year 2050 has been estimated by considering the growth in production of chemicals and plastics (see Table 3). Projections for future plastics demand growth range from 1% to 3% per year [6,41,42,43]. The higher end of this range was used for the PES, with lower demand in the 1.5 °C case due to greater circular economy efforts. In the PES 2050, the production fuel mix and the shares of waste management options are the same as in 2017 for each country/region, whereas the production growth varies depending on the regional dynamics. In the PES, the growth in energy demand is to some extent offset by improvements in energy efficiency. It is assumed that the specific energy consumption (excluding feedstock/NEU) of all chemicals would reach the level of current best practices, which results in a savings potential of 15% by 2050, compared to 2017 [8].
The net-zero pathway (1.5 °C case) takes five major strategies into account:
-
improve energy efficiency in the production process by adopting best practices and breakthroughs, including substituting fossil fuels with direct renewable energy resources, electrification and other renewables for process heat generation (A)
-
a switch to biomass and synthetic feedstocks based on renewable “green” hydrogen and CO2 (B)
-
a shift to circular economy to reduce primary materials demand by increasing reuse and recycling of plastics and by reducing per capita plastics and chemicals demand through changing consumer behavior and substitution with other materials (C)
-
decarbonising production processes and waste handling by CCS (D)
-
shifting power supply to carbon-free electricity, notably renewables (E)
Table 4 shows the technologies assessed in each pathway and the global cost of CO2 mitigation (per tonne) for each decarbonisation technology. For each strategy, the 2050 country/region implementation potential in the 1.5 °C case relative to the PES has been estimated (see Supplementary Materials, Section B). In a subsequent step, the impacts of decarbonisation on the total energy and feedstock demand and CO2 emissions have been estimated. Finally, a carbon flow analysis was conducted to assess the impact of the uptake of these technology options on the global plastics metabolism and to gain insight into the carbon storage in materials and products through the non-energy use emission accounting tables (NEAT) model for the calculation of carbon storage in petrochemical products [44]. NEAT calculates both CO2 emissions and carbon storage resulting from the non-energy use of fossil fuels, independent from the energy statistics and the national GHG inventory, and complements energy statistics with material flow analysis [39]. Supplementary Materials (Section C) provides the details of the carbon flow analysis methodology.
Table 3. Technology options covered in the assessment.
Technology OptionApplicationRationale/Explanation and Key References Used to Estimate the Fossil Fuel Substitution PotentialsCostUnitReferences for Costs
(A) Energy efficiency, renewable energy and process heat electrification
Best practice technologies (1)Improving energy efficiency to reduce process heat demandGlobal energy saving potential of best practice technologies that are currently available in the market [8] would result in a continuation of the current average energy efficiency trends of 0.5%/yr if they are implemented in all production processes by 2050 [45]. 1 The rate of improvement is average over the period to 2050, and does not necessarily follow a linear path.20–60USD/t CO2 in 2030[46]
Breakthroughs and heat integration (1)New technology options and cross-cutting technologies such as advanced membranes to reduce process heat demand by 2050 [47] would double the improvements to 1%/yr. 2 While pinch analysis for heat integration shows 50% and 30% savings for hot and cold utilities, respectively [48], actual potential could still be lower, since efficiency is typically assessed at site level where a high level of steam system integration reduces potential.Up to 200USD/t CO2 in 2050[47]
Solar process heat (2)Fuel switchingSolar process heating systems can replace fossil fuels for process heat generation [49,50]. 30–100USD/t CO2 in 2030[49]
Biomass for process heat (4)Biofuels produced from various biomass feedstocks can replace fossil fuels for process heat generation by 2030/50 [6]. 40–75USD/t CO2 in 2030[6]
Electrification of process heating combined with renewables (5)Synthetic naphtha produced from renewable hydrogen can replace crude oil-based naphtha for HVC production [51]. 14−60–450USD/t CO2 in 2050[52]
Heat pumps can replace fossil fuels to supply low-temperature process heat [49,50,53,54]. 50–50USD/t CO2 in 2030[49]
(B) Switching from fossil fuel-based feedstocks to biomass and synthetic feedstocks
Biomass for plastics (9)Feedstock switchingBiomass can replace fossil fuels used as feedstock for plastics production [6]. 90–500USD/t CO2 in 2009[6]
Biomass for ammonia (10,19)Feedstock switchingBiomass can replace fossil fuels used as feedstock for ammonia production [55]. 10250–400USD/t CO2[22,56,57]
Biomass for methanol (10,19)Feedstock switchingBiomass can replace fossil fuels used as feedstock for methanol production, either through gasification to methanol or by using biomethane in the traditional production route [58]. 11−150–450USD/t CO2[37,56,57,59,60]
Renewable-hydrogen for ammonia (11,20)Feedstock switchingRenewable hydrogen can replace fossil fuels used as feedstock for ammonia production [22]. 120–150USD/t CO2[37,60,61]
Renewable-hydrogen for methanol (11,20)Feedstock switchingRenewable hydrogen can replace fossil fuels used as feedstock for methanol production [58]. 13−50–200USD/t CO2[37,58,60]
Methanol for olefins (13)Feedstock switchingRenewable hydrogen-based methanol can be used for olefins production, thereby reducing the need of fossil fuels feedstocks [58]. 1450–300USD/t CO2[37]
Synthetic fuels (naphtha) (12)Feedstock switchingSynthetic naphtha produced from renewable hydrogen can replace crude oil-based naphtha for HVC production [51]. 15−60–450USD/t CO2 in 2050[52]
CO2 (14)Feedstock switchingElectrocatalytic CO2 production can replace fossil fuels used as feedstock in ethylene production. 16−30–80USD/t CO2 in 2050[15]
(C) Circular economy concepts
Demand reduction/Reuse (18)Demand reductionPlastics demand is reduced from high end of plastics production projections (3%/yr) to the average of the range found in literature (2%/yr). Reuse of plastics has been assessed as part of this demand reduction strategy.N/AN/A-
Mechanical recycling (6)End of lifeGlobal mechanical recycling rate is assumed to grow around two-fold by 2030 [42] and triple by 2050. 6−140–200USD/t CO2 in 2015[62,63,64,65]
Chemical recycling (7)End of lifeChemical recycling rate is assumed to be commercialized and reach the level of mechanical recycling by 2050 [42,66]. 780–500USD/t CO2 in 2015[20,65,66,67] and industry sources
Incineration with highly efficient energy recovery (8)End of lifeAll remaining post-consumer plastic waste is assumed to be incinerated with high efficiency combined with CCS [43]. 8−200–−50USD/t CO2 in 2020Own estimate
(D) CCS
Capture and storage (15)Process emissionsAll high-purity process CO2 emissions can be captured by 2050. Three-quarters of all emissions from fuel combustion are assumed to be captured. It is assumed that a shift to energy recovery is meaningful from a climate perspective if only coupled with CCS. Biomass use is primarily for cogeneration of heat and power and all processes are assumed to be coupled with CCS. 170–50USD/t CO2 in 2040[20,60,68,69]
Capture and storage (16)Emissions fossil fuel combustion from energy recovery50–150USD/t CO2
Capture and storage with biomass (3)Emissions from biomass-based heat generation150–200USD/t CO2[70,71]
(E) Carbon-free electricity supply (17)
Note: 20 technologies included in the analysis are numbered according to the order of introduction in the assessment of their emissions reductions impact. 1 Net additional cost of improving energy efficiency with best practice technologies for high value chemicals (HVC), ammonia, methanol and chlorine is estimated as USD 6 billion per year in 2030 worldwide. Avoided global CO2 emissions are estimated to be between 100 and 300 Mt per year by 2030. The resulting CO2 mitigation cost is estimated to range from USD 20 to USD 60 per tonne CO2. 2 According to the BLUE scenarios of the IEA (where global energy-related CO2 emissions are halved by 2050 compared to 2007), breakthrough energy efficiency technologies would require a carbon price of up to USD 200/t CO2 for their deployment by 2050. 3 Cost of generating low-temperature process heat is estimated as USD 10–30 per gigajoule (GJ) from solar thermal systems by 2030. Fossil fuel-based process heat generation costs are USD 10–20/GJ. The generation cost difference results in CO2 mitigation cost of USD 0–125/t CO2, assuming around 100 kg CO2 can be avoided per GJ of process heat generated. 4 Costs are estimated based on delivering one GJ of low- and medium-temperature process heat from agricultural and forest residues and dedicated energy crops compared to a mix of fossil fuels in eight world regions from various boiler and combined heat and power generation technologies. The referenced study provides a range for mitigation costs from as low as USD −150 to as high as USD 150 per tonne CO2. This range has been narrowed for this study. 5 Cost of generating low-temperature process heat (<150 °C) is estimated as USD 10–25/GJ for heat pumps by 2030. Fossil fuel-based generation costs USD 10–20/GJ. The generation cost difference results in CO2 mitigation cost of USD 0–50/t CO2, assuming around 100 kg CO2 can be avoided per GJ of process heat generated. 6 In the EU (e.g., Belgium, France, Germany, the Netherlands and Portugal), the costs for plastic collection, sorting and transport range between euro 200 and euro 1450 per tonne plastic waste (in some countries the green dot fee is used as a proxy for recycling costs). Treatment costs of recycled plastics in the Netherlands are around euro 250–300/t of separated plastic. Hence the final production cost of recycled plastic could range from euro 500 to euro 2000 per tonne. Price of virgin plastics range from euro 750 to euro 1500 per tonne. 7 According to industry sources, plastics produced from chemical recycling have a green premium of between 10% and 30%, which adds from euro 75 to euro 450 per tonne over virgin plastics. Around 1 tonne of CO2 is avoided per tonne of chemical recycling resulting in CO2 mitigation cost of USD 75–450/t CO2 in today’s conditions. 8 Costs represent post-consumer plastic waste incineration in combined heat and power plant (total efficiency of 90% operating at 85% capacity factor) with USD 200–400/t waste price. Costs exclude CCS costs of capturing CO2 from power plants at between USD 50–150/t CO2. 9 Costs are estimated for drop-in and new bio-based chemicals and plastics based on their market value and production costs (assuming a sugar price of USD 400/t). 10 Costs are estimated for biomass gasification with a fuel price of USD 8/GJ compared to steam reforming of methane route without CCS. Additional cost of biomass-based ammonia production is USD 600–1000, which avoids a total of 2.3 tonnes CO2 emissions per tonne of ammonia. 11 Costs are estimated for various biomass feedstocks such as wood and residues (ranging from euro 160 to 940 per tonne of methanol) compared to production costs of methanol in Europe from natural gas at USD 100–400/t methanol. Biomass-based methanol avoids around 1.7 tonnes of CO2 per tonne of methanol. 12 Costs of renewable-hydrogen based ammonia production (between USD 460 and 800 per tonne of ammonia) are estimated compared to steam reforming of methane route in Europe (USD 450 per ton) for electricity prices of USD 28–63 per megawatt-hour (MWh) at full load hours of 4000–4500 h per year. Avoided CO2 emissions per tonne of ammonia are assumed as 2.3 tonnes per tonne of ammonia. 13 Costs of renewable-hydrogen-based methanol production (for electricity prices of USD 12–58/MWh at full load hours of 3000–7000 h per year, between USD 350 and 1000 per tonne of methanol today that can go down to USD 70–630 per tonne by 2050) are estimated compared to steam reforming of methane route in Europe (USD 100–400 per tonne). Avoided CO2 emissions of 1.7 tonnes per tonne of methanol are assumed. 14 Costs of producing olefins from renewable-hydrogen route could be up to by a factor of two times more expensive than the conventional naphtha-based route of producing ethylene and propylene. At least 1.89 tonnes of CO2 can be avoided per tonne of high value chemical. 15 Costs are estimated based on the production of synthetic methane and liquids from renewable electricity in Iceland, North and Baltic seas and North Africa and the Middle East in 2050 that range from between euro 6.5 cents and euro 19 cents per kilowatt-hour (kWh) of final product. The reference price of liquid fuel is taken as euro 8 cents per kWh. 16 Costs are estimated for electrocatalysis route at energy conversion efficiency of 70%, Faradaic efficiency of 90%, grid emission intensity of 350 g CO2/kWh and an electricity price of USD 40/MWh. Electrocatalysis route has an estimated ethylene production cost of USD 1100/t. The fossil fuel-based route cost ranges from USD 600 to 1300 per tonne. 17 Costs include transportation costs and electricity demand for CO2 compression 100 kWh/t captured CO2. Additional bioenergy demand of 2 GJ per tonne captured CO2 is assumed for heat requirements of the solvent reboiler.

4. Transformation Scenario for the Chemical and Petrochemical Sector

In this section, we discuss the commodity and technology characteristics (Section 4.1), changes in the energy use (Section 4.2), CO2 emissions and carbon flows (Section 4.3) and cost implications (Section 4.4) of decarbonisation, as well as its implications for the global energy system (Section 4.5).

4.1. Commodity and Technology Characteristics

Global plastics demand is projected to grow 2.5-fold in the PES. This growth of 3% per year is the high end of the literature projections (1000 Mt/yr by 2050) [42]. In the 1.5 °C case, demand reduction strategies reduce plastics demand by one third to 650 Mt/yr in 2050, or around 2% growth per year [72]. In the 1.5 °C case, ammonia and methanol production grow significantly as new market segments emerge for chemical building blocks, shipping fuels and power generation [22,73,74]. (In comparison, PES assumes a 2.5- and 2-fold growth in ammonia and methanol demand, respectively.) Figure 2 illustrates the changing material flows. Green hydrogen is treated as fuel and feedstock. Renewable electricity needed for hydrogen production is shown separately.
Table 4. Global production volumes and the specific fuel and feedstock use of the assessed chemicals in final energy terms, 2017 and 2050.
20172050 PES2050 1.5 °C
ProductionProcess EnergyFeedstock UseProductionProcess Energy 2Feedstock UseProductionProcess EnergyFeedstock Use
(Mt/year)(GJ/t)(GJ/t)(Mt/year)(GJ/t)(GJ/t)(Mt/year)(GJ/t)(GJ/t)
Conventional routes 1
Ethylene (steam cracking)13516.345.037913.945.08012.645.0
Propylene (steam cracking)5016.345.013513.945.02712.645.0
Propylene (fluid catalytic cracking)213.245.0582.745.0222.545.0
Benzene (steam cracking)1716.3-4813.9-1512.6-
Benzene (naphtha extraction)443.240.11202.740.1512.540.1
Toluene263.220.3752.720.3362.520.3
Xylene473.241.01402.741.0682.541.0
Butadiene (steam cracking)1616.3-4413.9-1412.6-
Butadiene (C4 separation)167.344.6446.244.6215.644.6
Butylene303.245.0842.745.0412.545.0
Carbon black159.032.8387.732.8---
Ammonia17215.020.744012.820.710611.620.7
Methanol8610.020.01748.520.0507.820.0
Alternative routes
Plastics from biomass (excluding bio-ethylene) 3------7328.345.0
Synthetic organic materials from biomass 3------5223.345.0
Ethylene from biomass 4------761.045.0
Ethylene from green hydrogen and captured CO2 6------1410.645.0
Methanol to olefins 5------625.0-
Steam cracking with synthetic naphtha (ethylene + propylene) 7------6542.245.0
Steam cracking with synthetic naphtha (benzene + butadiene) 7------1224.6-
Ammonia from green hydrogen 8------3305.820.7
Ammonia from biomass 9------16219.120.7
Methanol from green hydrogen 10------11711.120.0
Methanol from green hydrogen for olefins 10 17711.120.0
Methanol from biomass 11------5736.720.0
1 See Ref. [8] for background assumptions related to the fuel and feedstock use of each chemical. 2 0.5% autonomous efficiency improvements that lead to 15% less demand (savings achievable with today’s best practice technologies) in fuel use by 2050 compared to 2017 have been assumed [45]. 3 Average of the 34–163 GJ biomass per tonne of chemical range for bio-based plastics and synthetic organic materials production. Feedstock demand is deducted to estimate fuel use [6]. 4 Bio-based ethylene production requires in total 100 GJ biomass per tonne of ethylene [75]. Ethylene’s feedstock demand is deducted to estimate the fuel use. 5 See note 10 for details of methanol production from green hydrogen. An additional 5 GJ process electricity is required for conversion [37]. 6 The process requires 13.9 MWh electricity per tonne of ethylene at 100% Faradaic efficiency [15]. Ethylene’s feedstock demand is deducted to estimate the electricity use as process energy. 7 The synthetic liquids production process requires 927 kWh of renewable electricity. As a first step, 800 kWh equivalent hydrogen is produced at 86% efficiency. Processing yields a mix of jet fuel (146 kWh), diesel (348 kWh) and naphtha (81 kWh). Based on energy allocation of outputs, electricity input per GJ naphtha is estimated as 1.6 GJ. Final product feedstock demand is deducted to estimate the hydrogen demand [76]. 8 Total electrolyser electricity demand is 52 MWh per tonne of hydrogen (including 2 MWh for hydrogen storage). One tonne of ammonia requires 27 GJ hydrogen and an additional 2.3 GJ for its synthesis. The process exports 2.5 GJ heat per tonne of ammonia which is assumed to be converted to electricity on site for process energy with a conversion efficiency of 50% [77]. Ammonia’s feedstock demand is deducted to estimate the hydrogen demand. 9 1 kg biomass yields 0.9 kg syngas. Ammonia production requires 2.1 m3 syngas per kg of ammonia. In total, 38 GJ biomass is needed for 1 tonne of ammonia production. In addition, 2.4 GJ natural gas is partially oxidized per tonne of ammonia and 0.25 GJ electricity is needed for process energy [78]. Ammonia’s feedstock demand is deducted to estimate the hydrogen demand. 10 1 tonne of methanol requires 0.19 tonnes of hydrogen and 1.4 tonnes of CO2. This requires 31.1 GJ hydrogen per tonne of methanol. In addition, 1.3 GJ fuel and 1.2 GJ electricity are needed in the process [59]. Methanol’s feedstock demand is deducted to estimate the hydrogen demand. 11 Production of 1 tonne of methanol requires 34.3 GJ bagasse, 9.5 GJ steam and 5.9 GJ electricity. It is assumed that steam and electricity are produced on site from 22 GJ bagasse per tonne of methanol, resulting in total bagasse demand of 56.7 GJ [79]. Methanol’s feedstock demand is deducted to estimate the fuel demand for process energy.

4.2. Energy Use

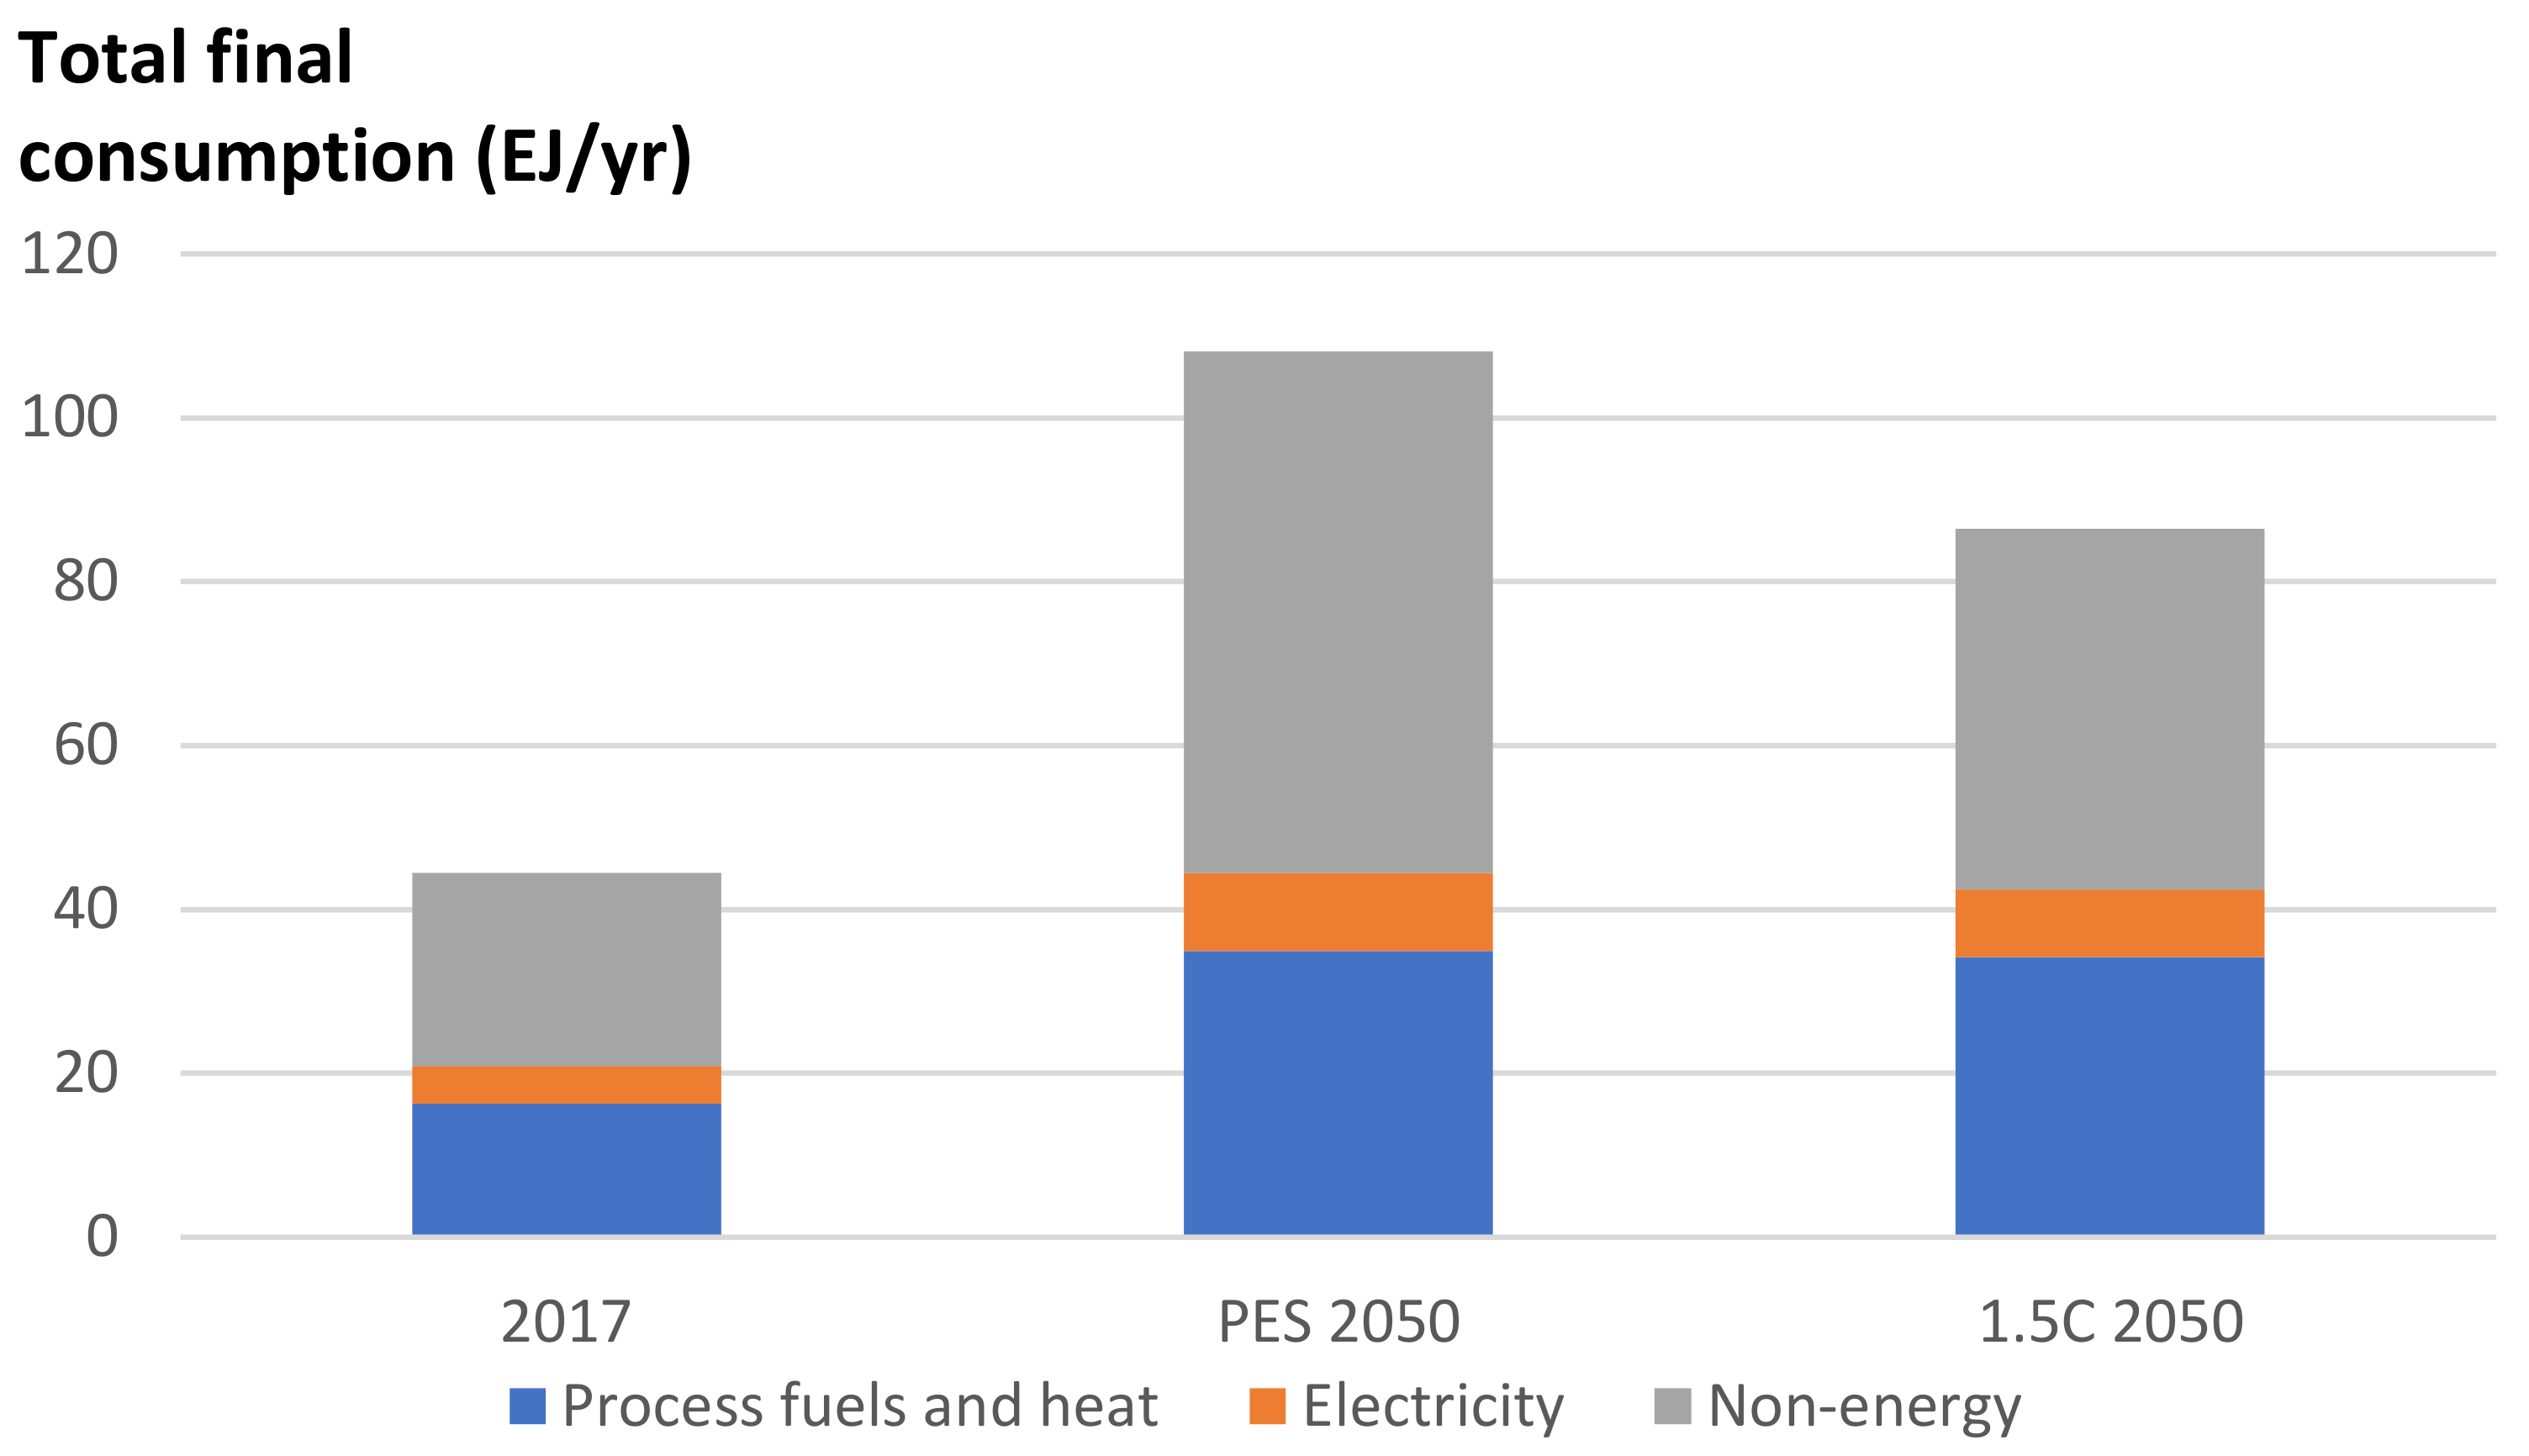
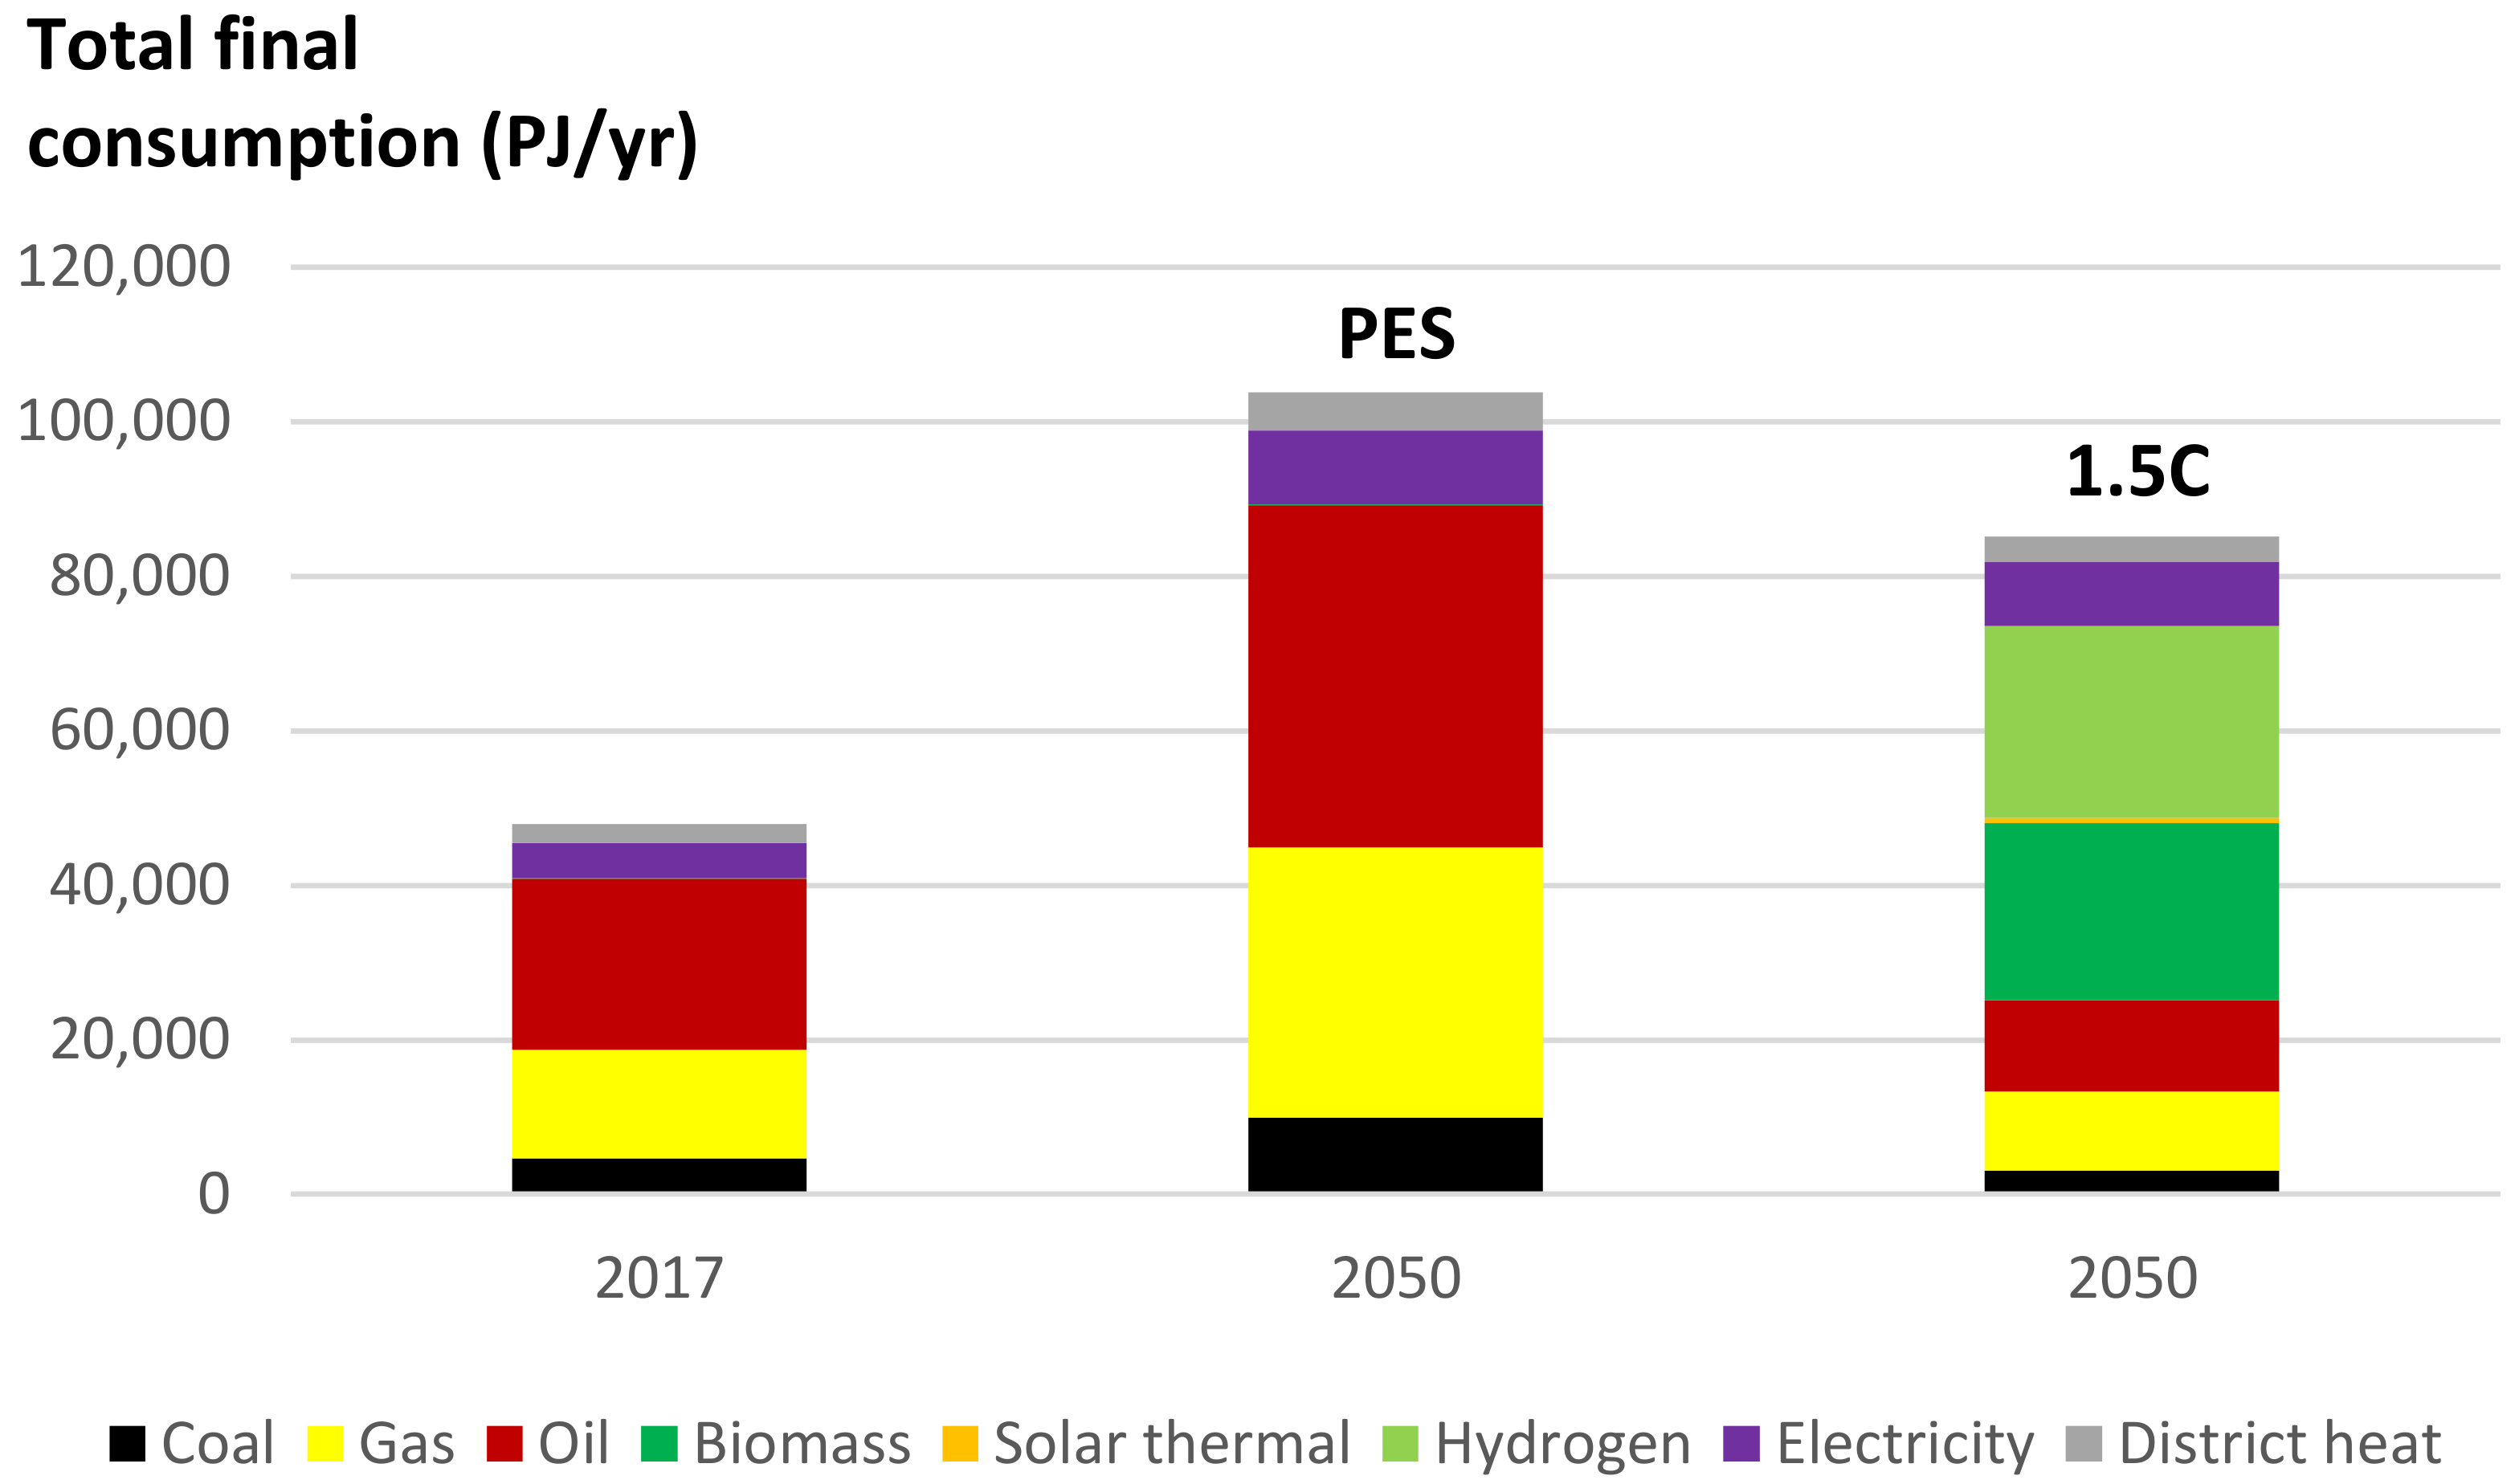
In the PES, total demand for plastics increases from 385 Mt in 2017 to 986 Mt by 2050. Sectorial demand for process heat and electricity more than doubles between 2017 and 2050, from 20.9 EJ to 44.5 EJ per year (see Figure 3). The PES includes autonomous energy efficiency improvements of 0.5%/yr, which result in 15% energy savings by 2050 (7.8 EJ/yr). The growing demand for plastics and other synthetic organic materials more than doubles NEU to 62.4 EJ in 2050. The process energy and NEU mix remains the same throughout the entire period; oil products represent more than 40% of the sector’s total consumption, while gas represents about one-third. Electricity’s share in the total process energy use is 20% (see Figure 4).
In the 1.5 °C case, efficiency breakthroughs and electrification limit process energy use to 42.9 EJ/yr in 2050, a doubling from the 2017 level. This is equivalent to a 5% reduction in total process energy demand compared to the PES, resulting from an annual 1% improvement in energy efficiency of processes, albeit an increase in energy use due to higher demand for ammonia and methanol. (This accounts for the changes in demand for chemicals in the 1.5 °C case compared to the PES: plastics demand decreases by 35% and the demand for ammonia and methanol increases by 47% and 82%, respectively, in 2050). NEU grows by 58% between 2017 and 2050 to reach 43.4 EJ/yr. The limited growth in NEU is driven by circular economy strategies for plastics, which include a combination of demand reduction (limiting demand to 657 Mt/yr by 2050) and higher mechanical and chemical recycling rates.
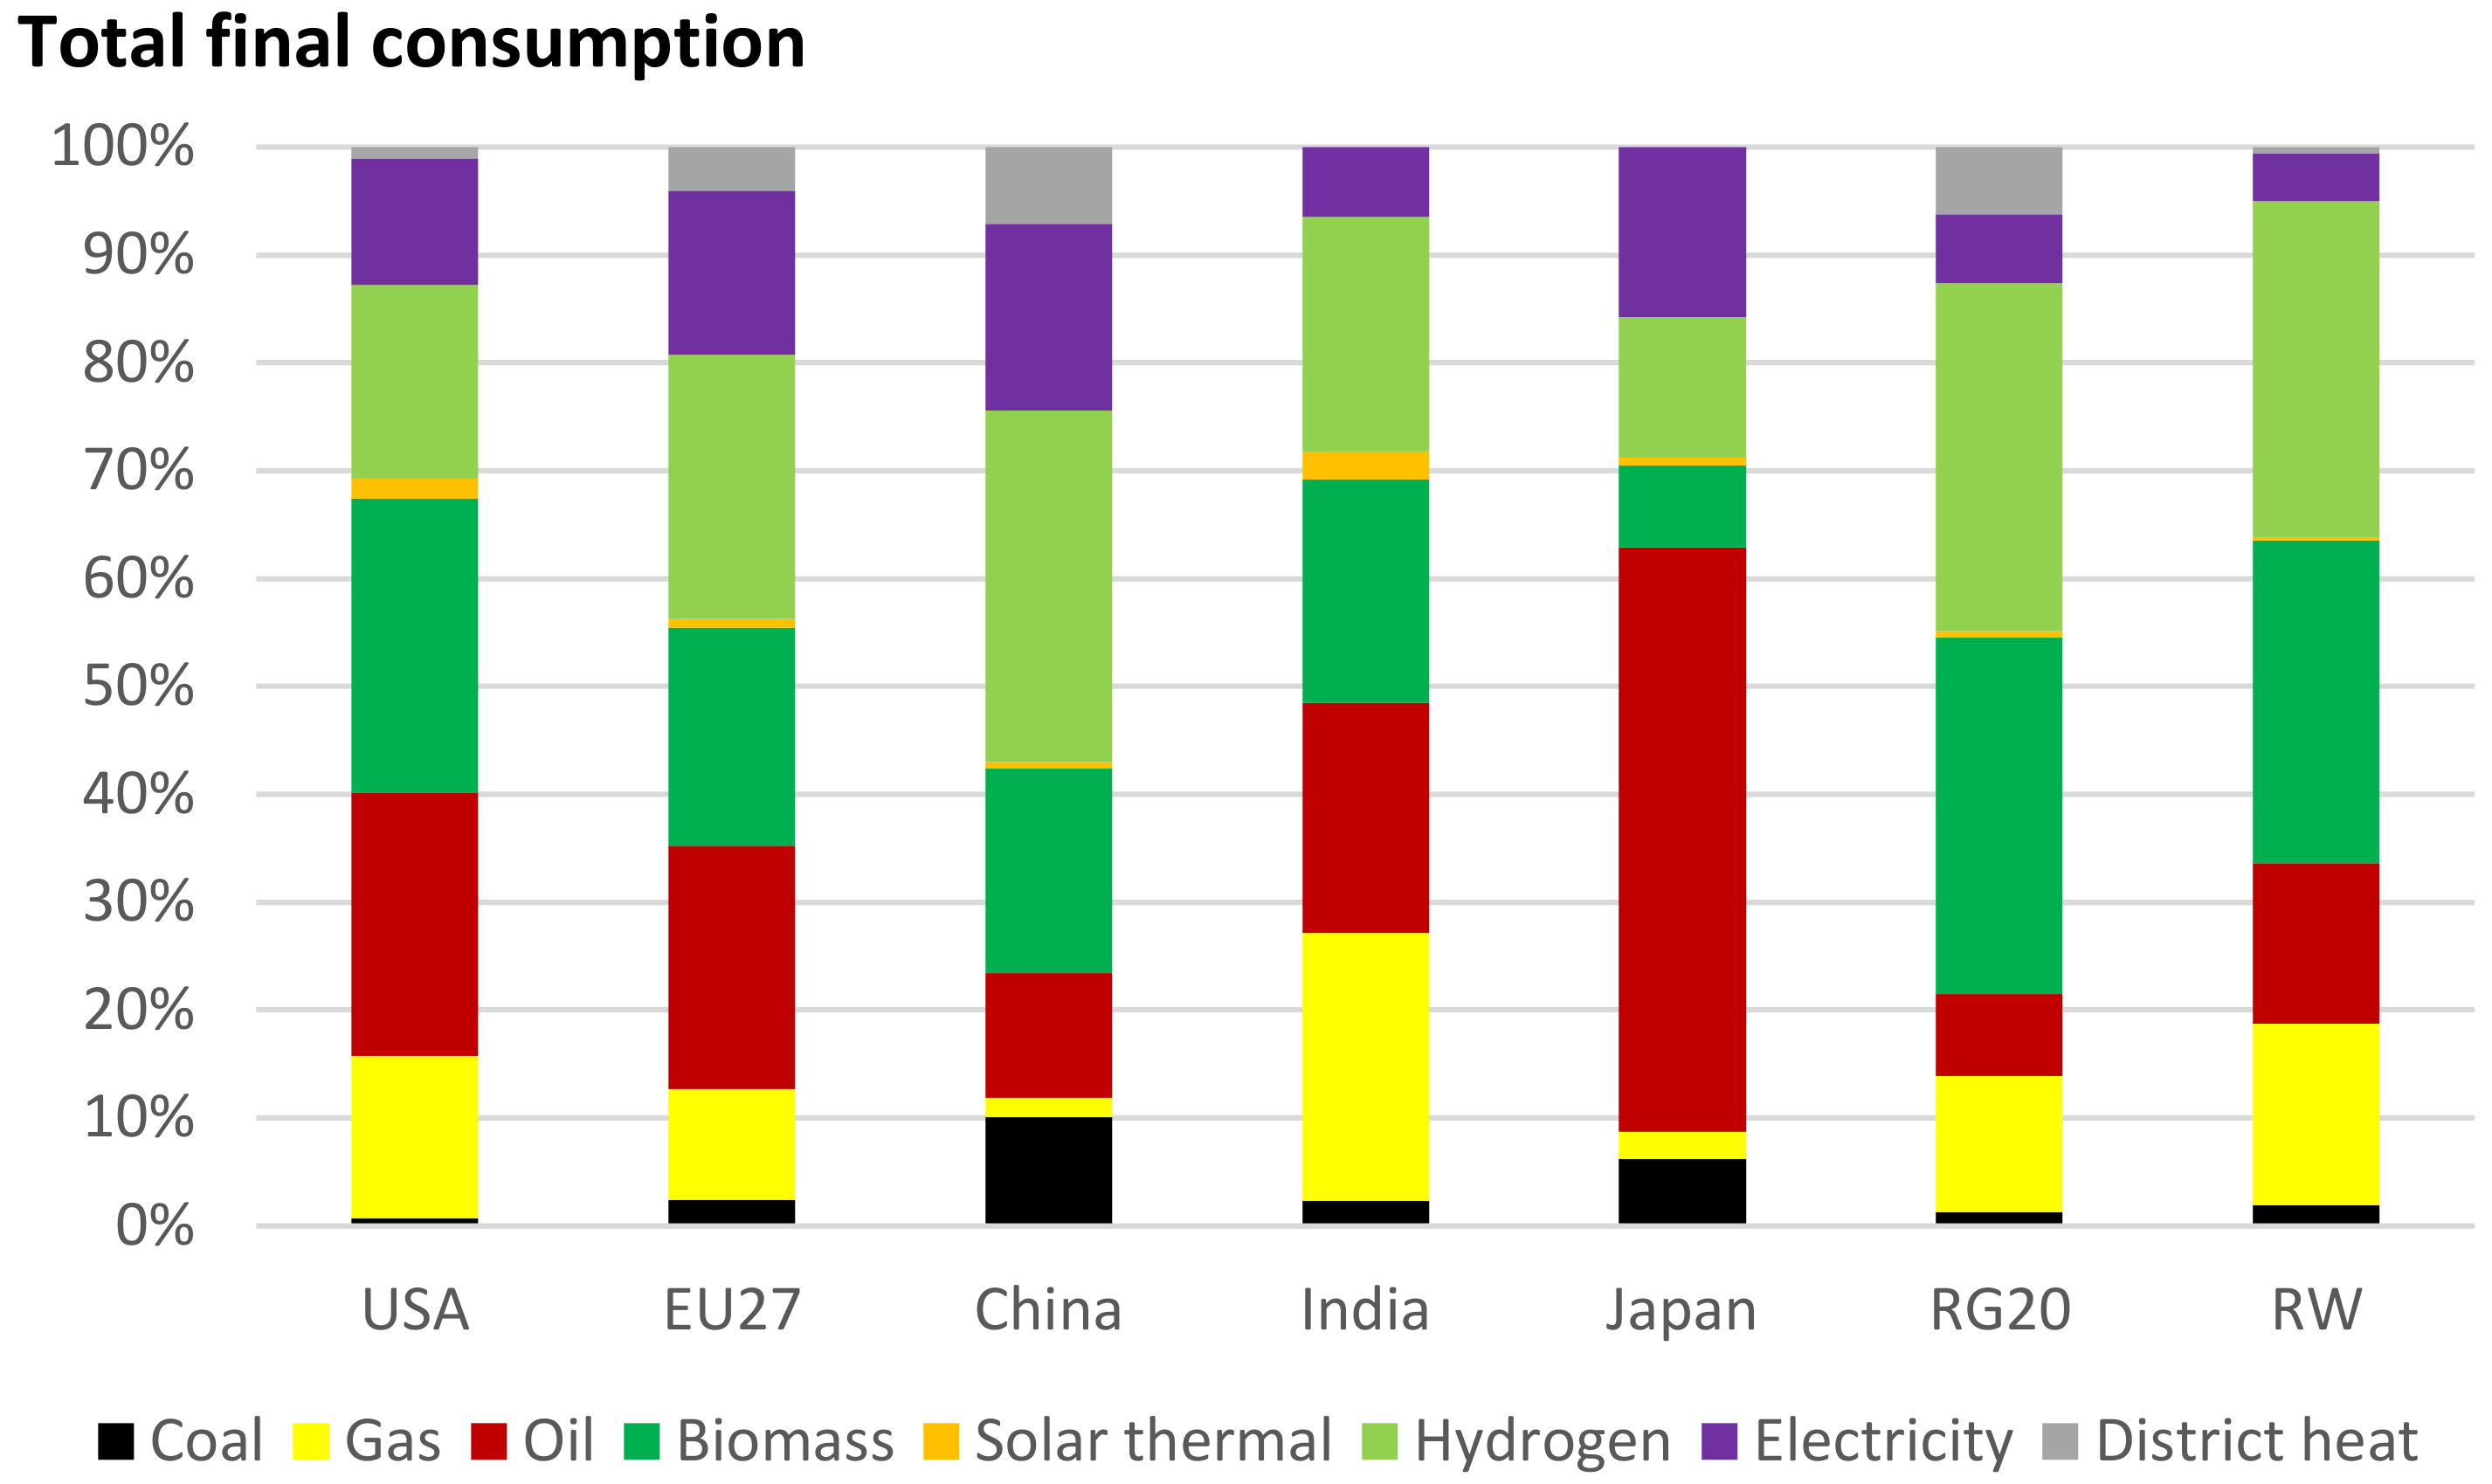
The final consumption mix changes in the 1.5 °C case (see Figure 4): the share of fossil fuel use in total process energy drops from 65% in 2017 to 24% in 2050, a reduction of 19.4 EJ/yr compared to PES in 2050. Direct use of renewables increases to 49% of process energy use including 28% bioenergy, 19% green hydrogen and 2% solar thermal. Electricity accounts for 20% of all process energy use (2320 terawatt-hours (TWh)). This excludes electricity for hydrogen production. If green hydrogen production is included, sector’s electricity demand would increase fivefold.
Fossil fuels constitute nearly all NEU supply in the PES by 2050. Their share decreases to 36% in the 1.5 °C case, with gas and oil representing 15% and 18% of the total, respectively; coal’s share drops to 3%. The remainder is a mix of biomass (25%) and green hydrogen (39%) feedstocks. Green hydrogen is the largest source of feedstock supply in the 1.5 °C case. It is used to produce HVCs, ammonia and methanol. It also is the basis for olefins production via renewable methanol, which accounts for 12% of the total HVC production in 2050. The introduction of renewables-based feedstocks and circular plastic economy strategies impact the use of oil feedstocks for HVC production. Compared to the PES, oil feedstock uses decline by 25 EJ/yr (equivalent to about 13 million barrels per day) to 8 EJ. Natural gas feedstock use is reduced by 70% in the 1.5 °C case (equivalent savings of 18.3 EJ/yr or 520 billion cubic meters per year) compared to the PES in 2050. Renewables, including renewable power and district heating, contribute to 68% of total final consumption.
Biomass demand for NEU increases from around 1 EJ in 2017 to more than 10.9 EJ in 2050. Another 12.2 EJ of biomass is needed for process energy, raising the total demand to around 23 EJ. Green hydrogen demand for process energy and NEU reaches 8.1 EJ and 16.9 EJ by 2050, respectively (in total around 210 Mt/yr, nearly twice today’s global hydrogen demand).
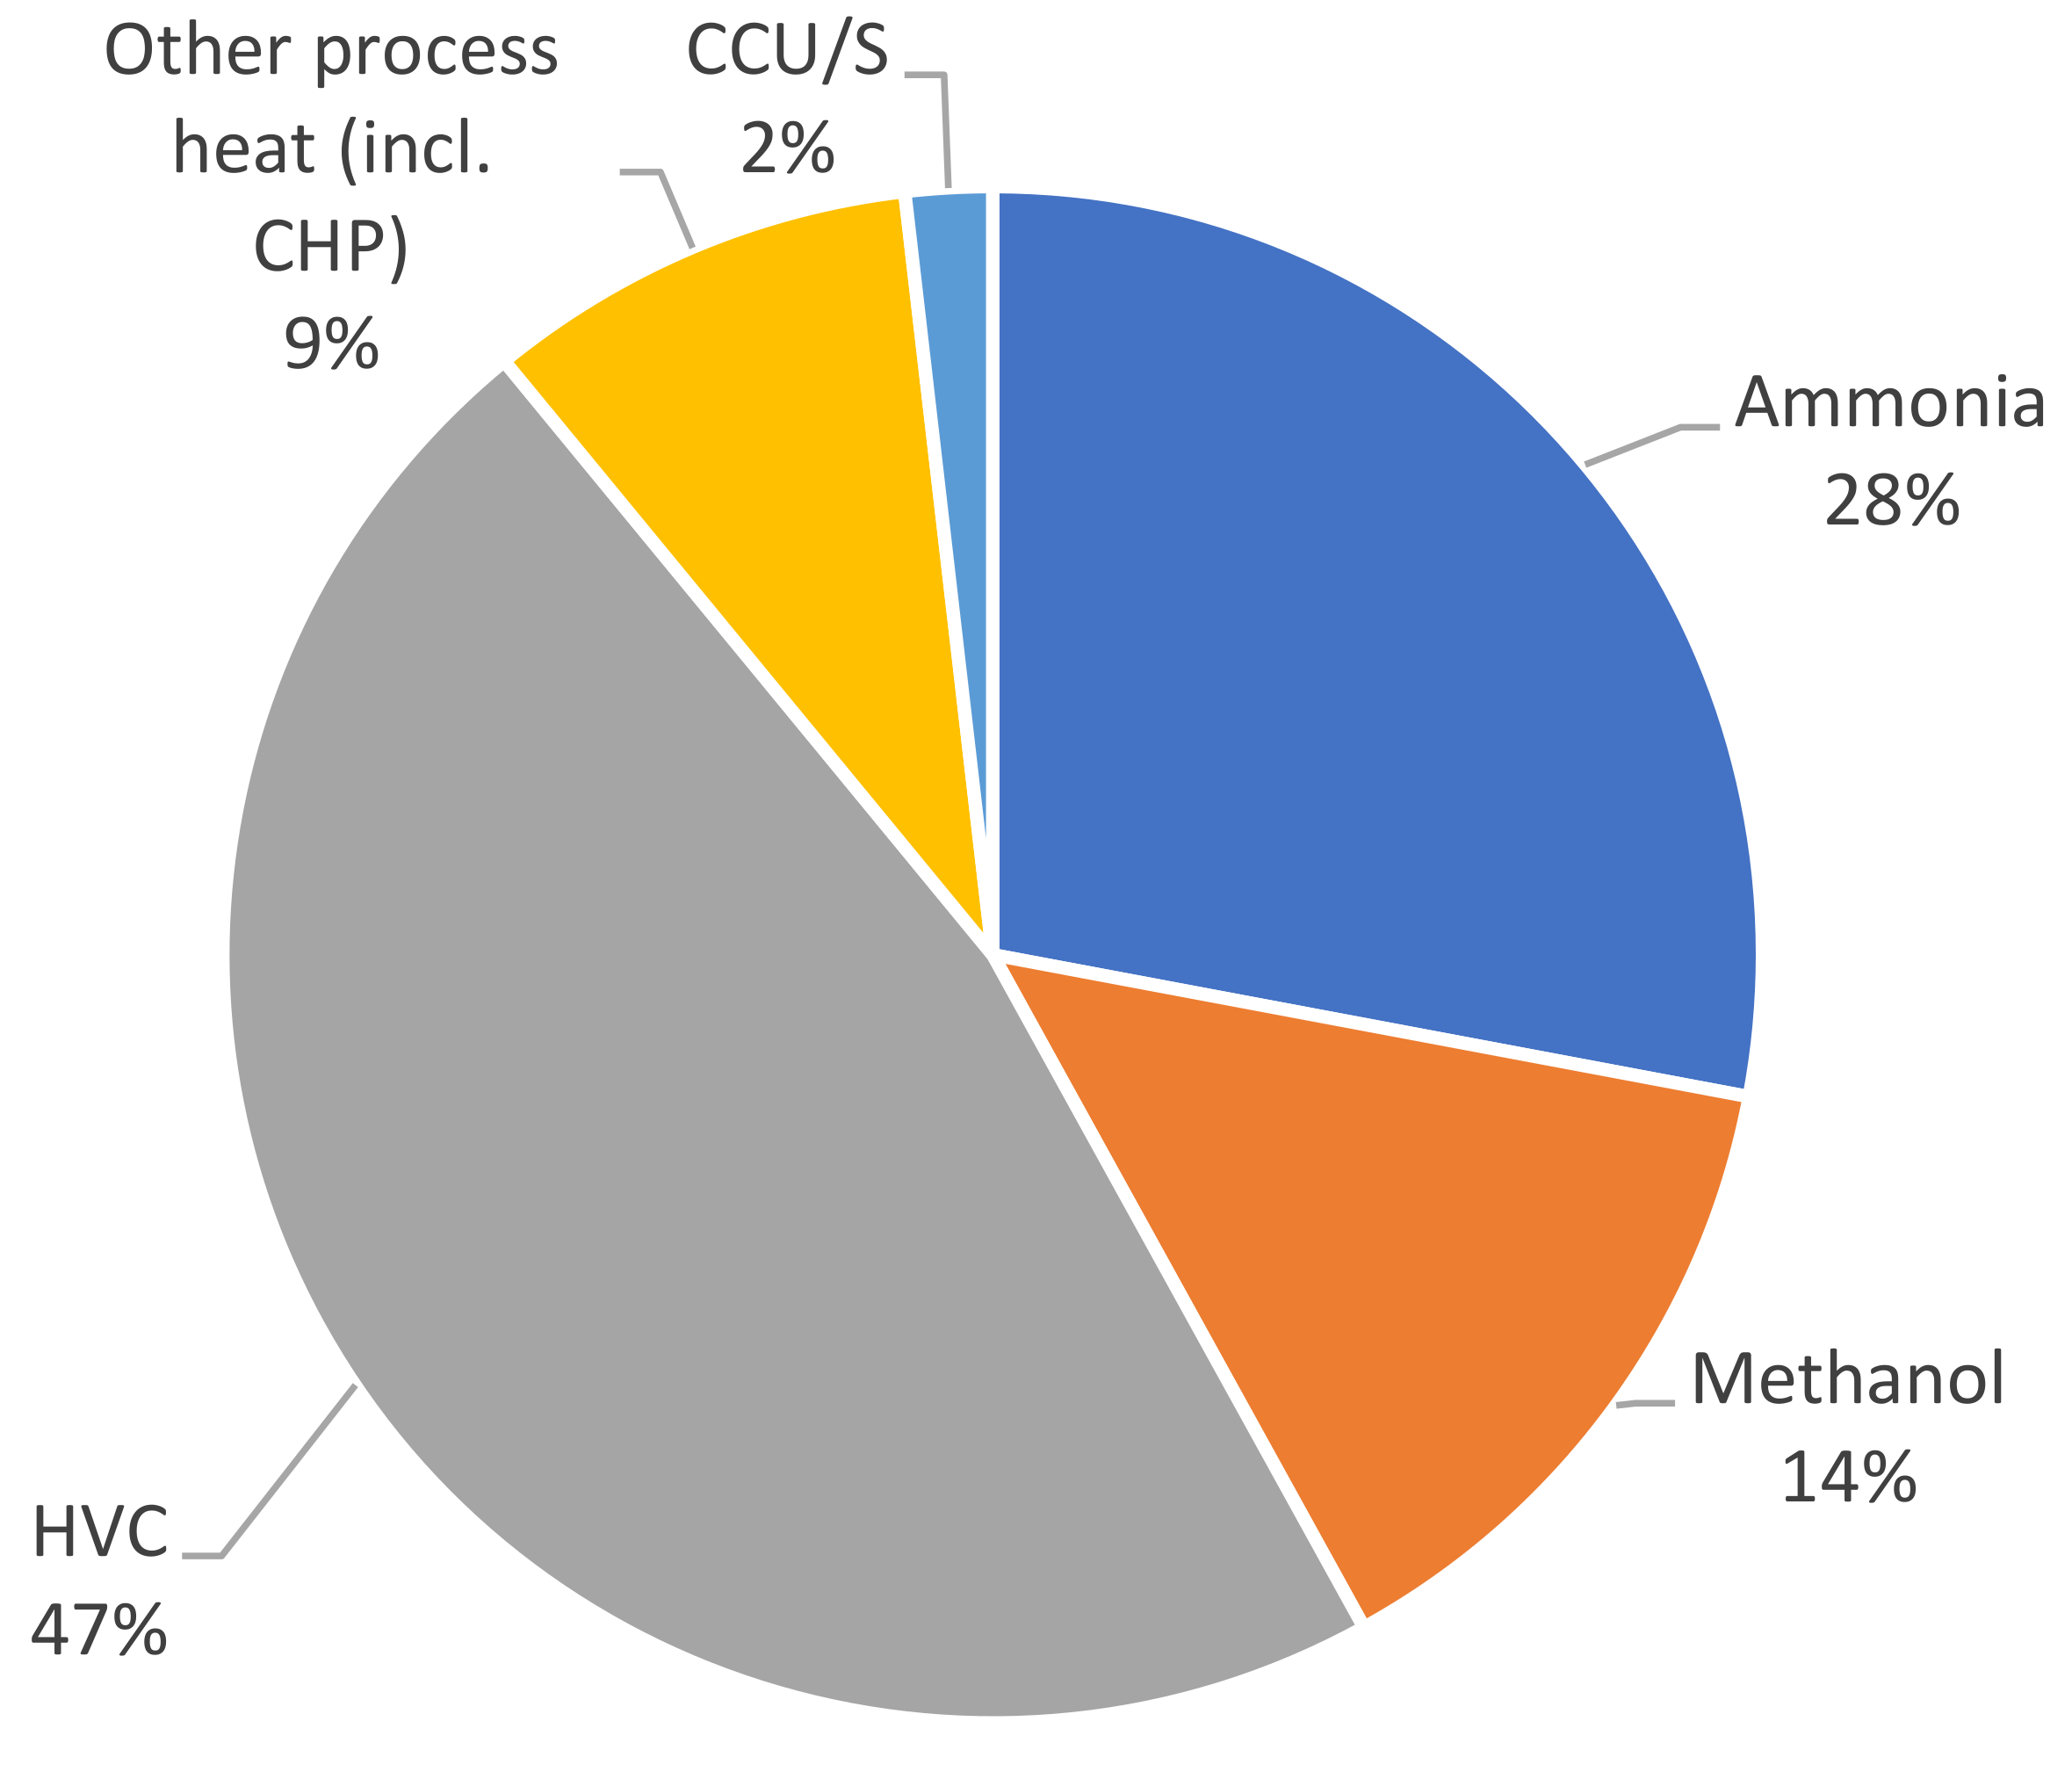
Figure 5 provides a breakdown of biomass use. Apart from process heat, biomass feedstock is used to produce plastics (5.5 EJ/yr), ammonia, methanol and other chemicals (4.5 EJ/yr) and other high-value chemicals (0.9 EJ/yr). To meet the sector’s total biomass demand, around 1.3 Gt of primary biomass would be needed each year, equivalent to 75% modern bioenergy use in 2017.
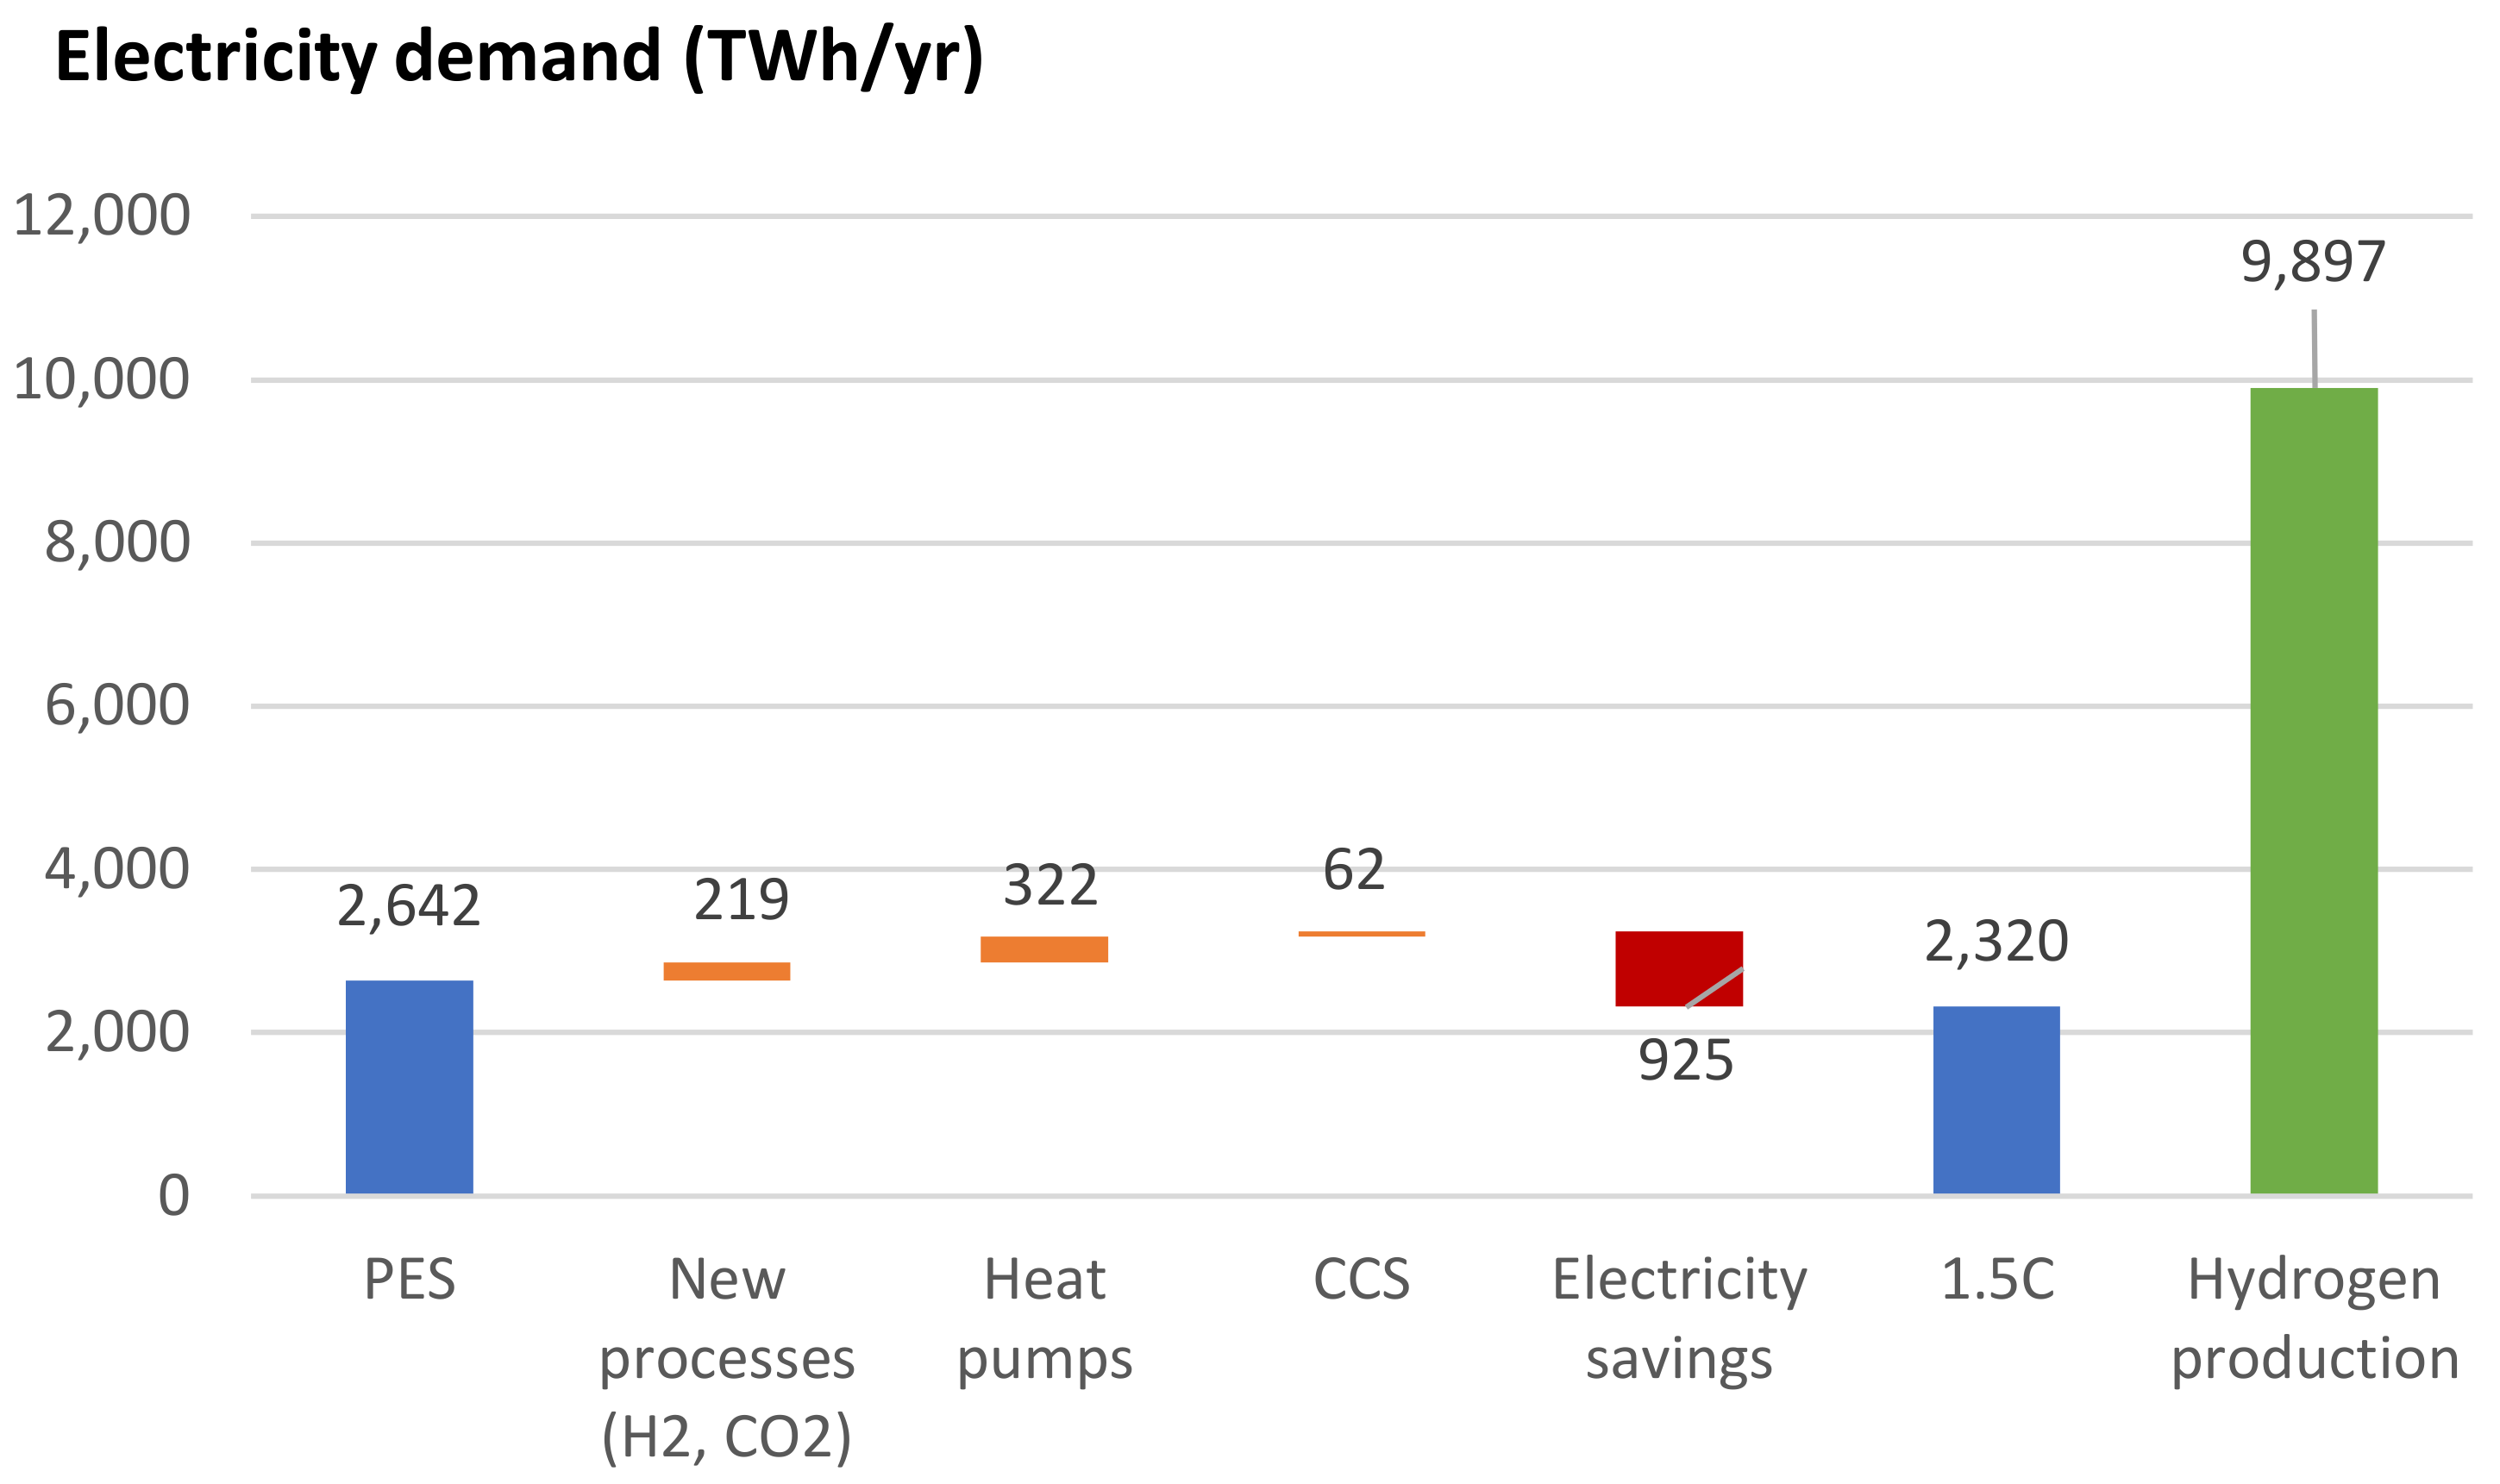
The chemical and petrochemical sector’s electricity demand is estimated to reach around 2640 TWh/yr in 2050 in the PES – equivalent to 80% growth from 2017. The sector’s demand would be around 5% of the estimated total global gross electricity demand in 2050 [40]. In the 1.5 °C case, demand for electricity is slightly lower, at around 2320 TWh/yr (Figure 6). However, this excludes the electricity needed for green hydrogen production for ammonia, methanol and synthetic fuels, estimated at 9895 TWh/yr in 2050. Total electricity use in the sector equals 17% of global electricity demand in the 1.5 °C case. Compared to the PES, electricity efficiency improvements save 925 TWh/yr. Heat pumps for low-temperature process heat generation require another 320 TWh/yr electricity. Electrification has profound impacts; a total of 73 GW of (electric) heat pump capacity would be needed to supply low-temperature process heat. To meet the hydrogen demand for chemicals production, a total of 2435 GW of electrolyser capacity would be needed. (Assuming 350% heat pump efficiency and 65% electrolyser efficiency, with 50% capacity factor for both systems.)

4.3. Emissions Reductions and Carbon Flows

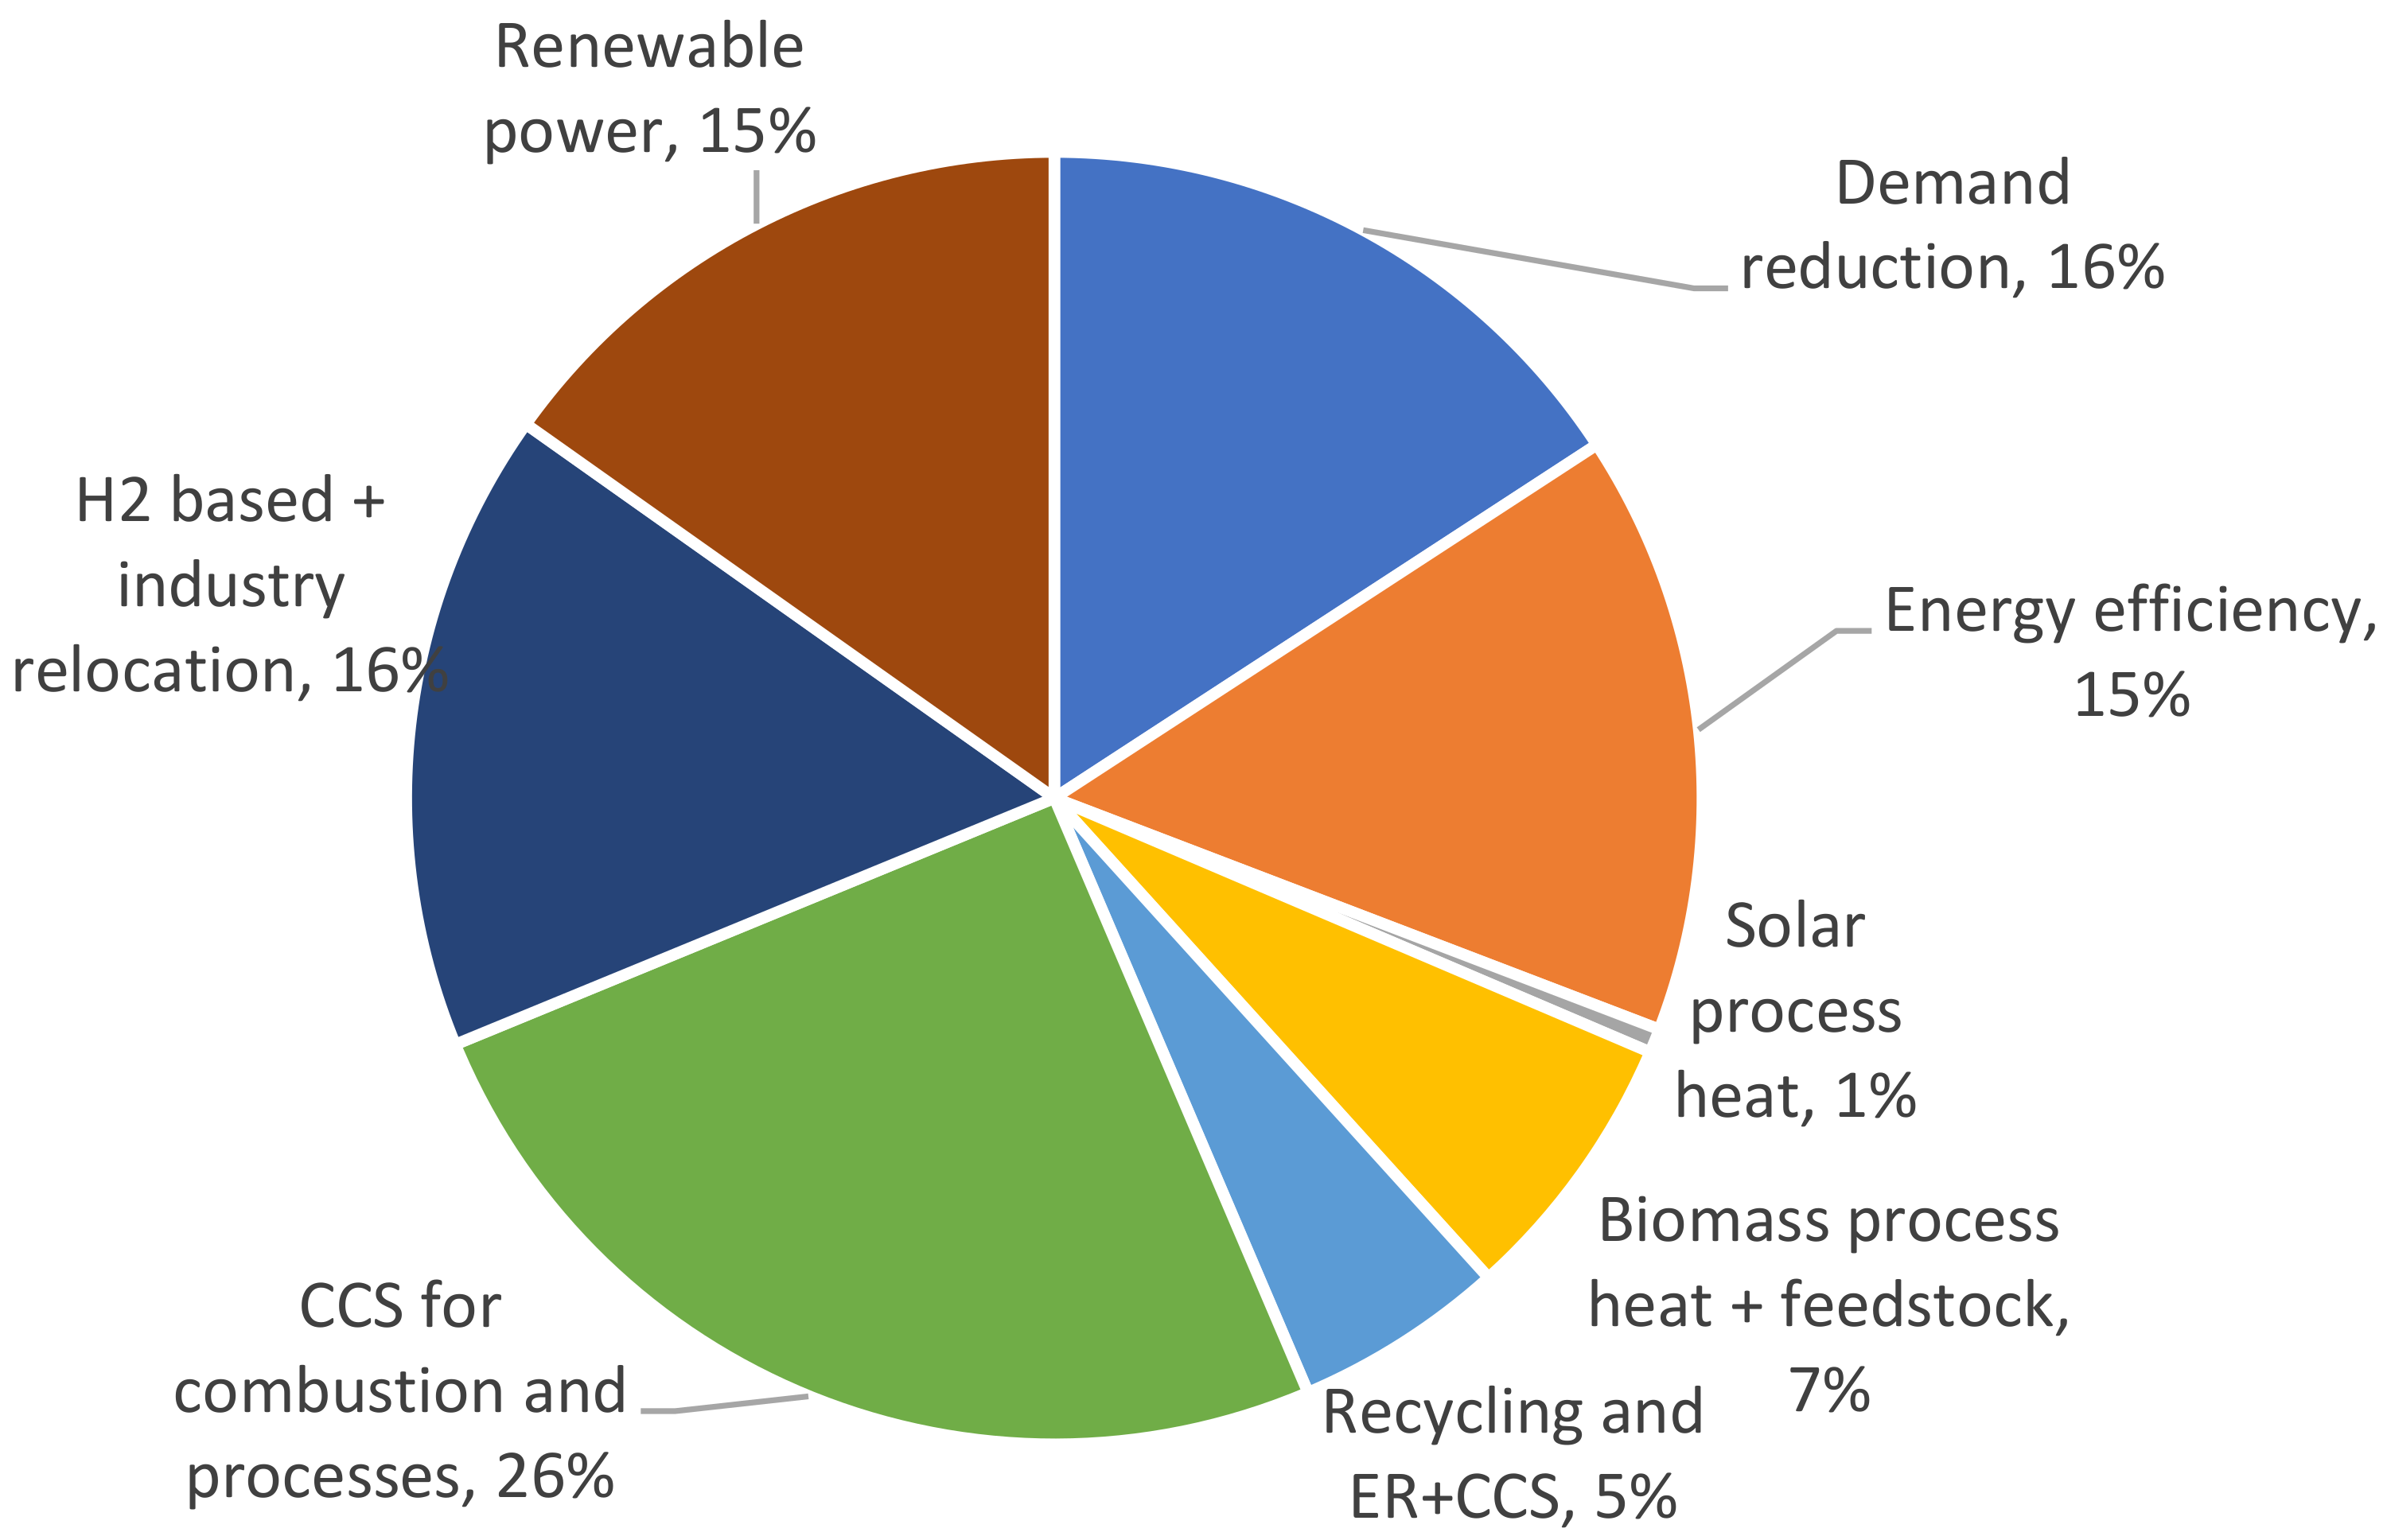
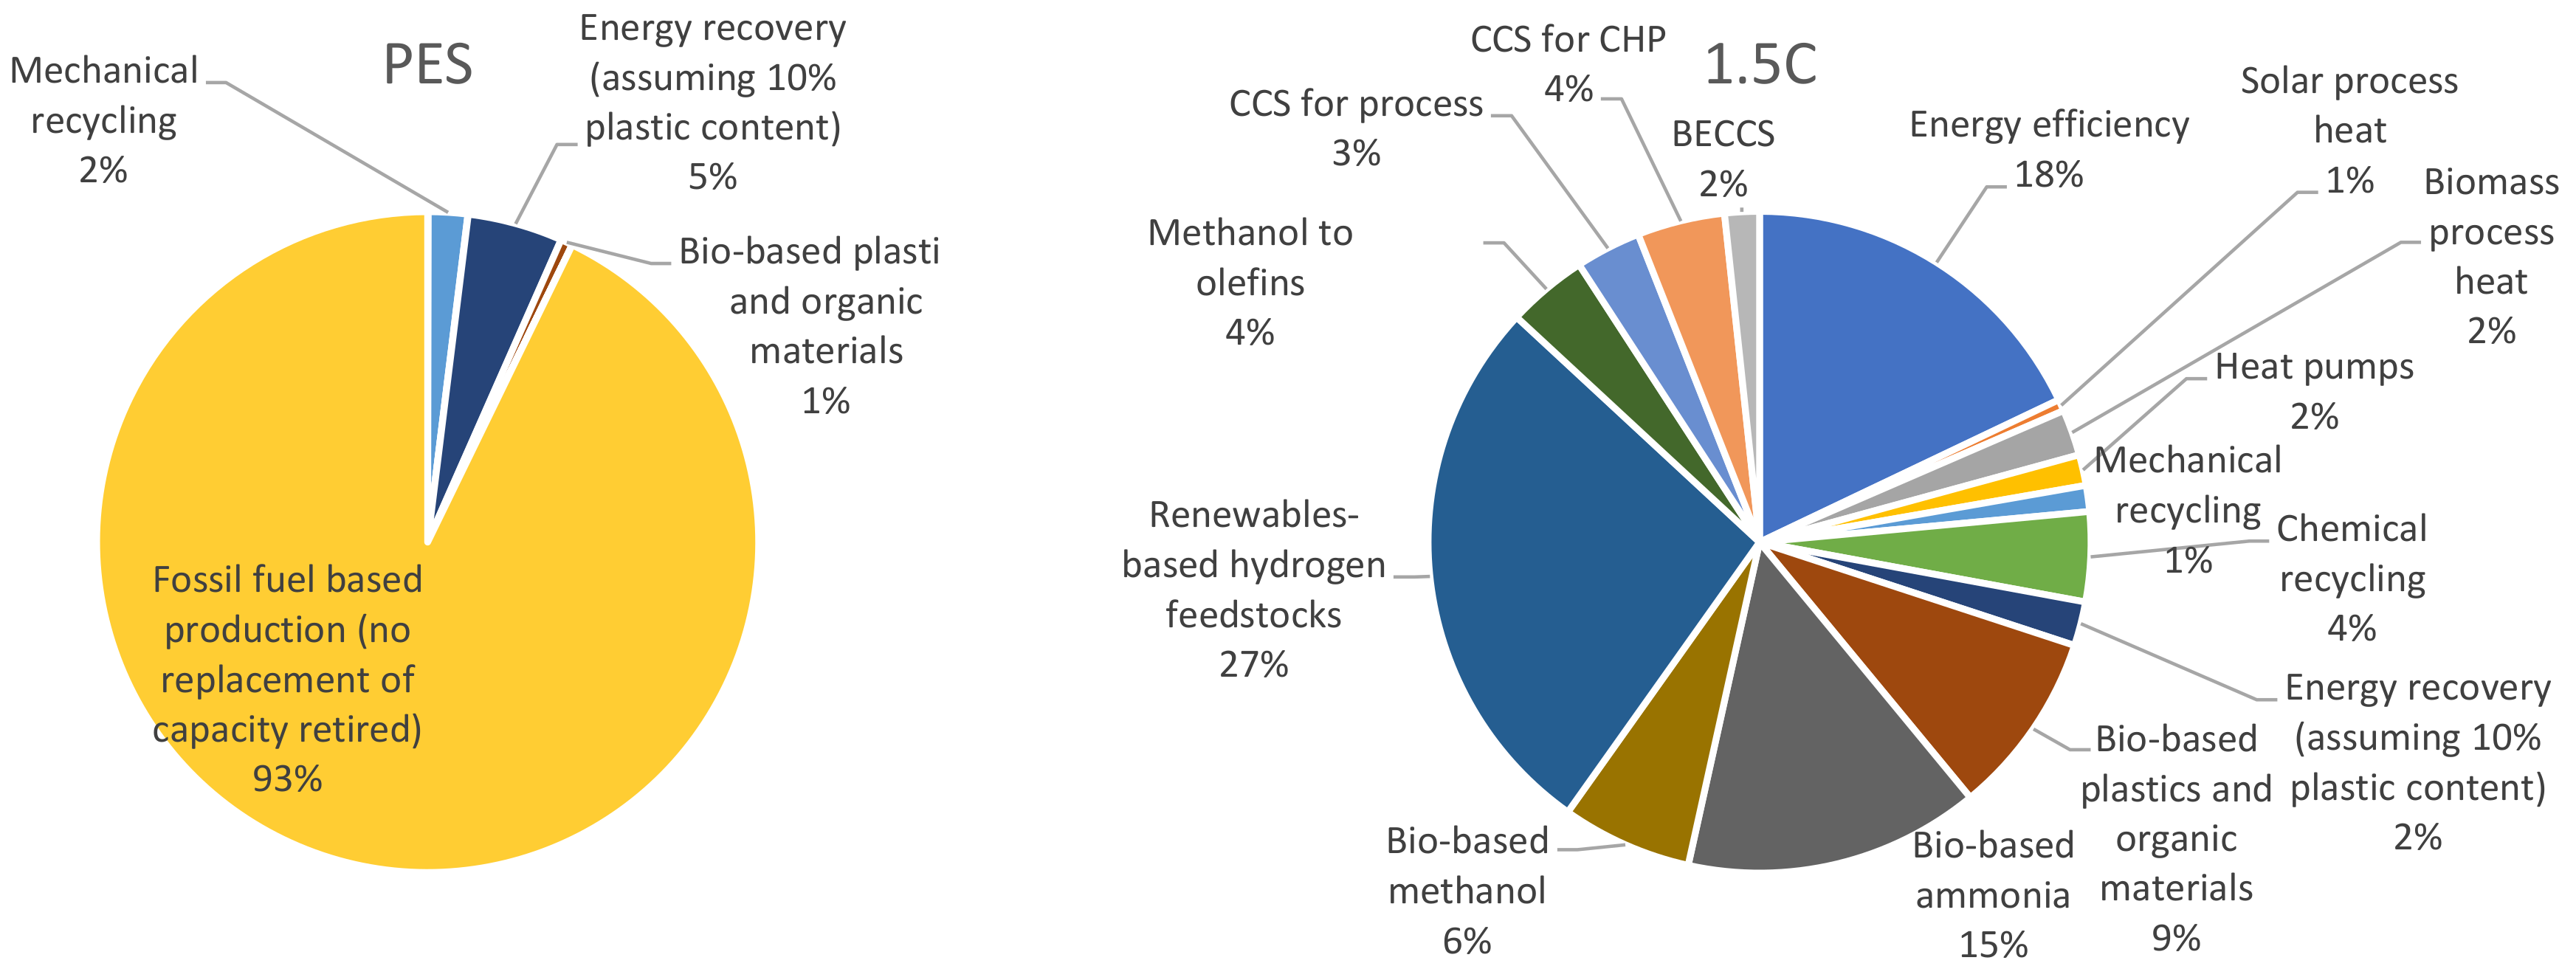
Renewable solutions, in combination with direct and indirect electrification, account for 40% of the emissions mitigation effort to go from 4.74 Gt in 2050 in the PES to zero emissions in the 1.5 °C case, including indirect electricity production emissions of 0.84 Gt and 0.11 Gt, respectively. These emissions reductions include all options (see Figure 7). Recycling rates increase six-fold, and this is coupled with deep demand reduction and CCS-retrofitted energy recovery (circular economy concepts account for 21% of the effort). However, all of this is still not enough: there is a need for 1.2 Gt per year of CCS to remove CO2 from fuel combustion flue gases and the ammonia production process (26% of the total effort). 15% emission savings result from improving energy efficiency, and 8% from renewable-based process heat generation and feedstocks. The relatively small energy efficiency contribution is on top of the PES energy efficiency gains. Demand reduction including reuse of plastics contributes another 16% to total emissions reductions in the 1.5 °C case compared to the PES (350 Mt demand reduction yielding 0.56 Gt emissions savings). Higher mechanical and chemical recycling rates contribute another 5%: from 105 Mt in the PES to 276 Mt mechanical and chemical recycling in the 1.5 °C case. Around 16% of emissions reductions are related to switching to hydrogen-based feedstocks for methanol and ammonia (but also methanol and synthetic naphtha feedstocks for ethylene production). The implication is that part of industry will relocate to regions with lower cost renewable power sources. Finally, the contribution from power supply transformation is 15%, through a shift to renewable electricity.
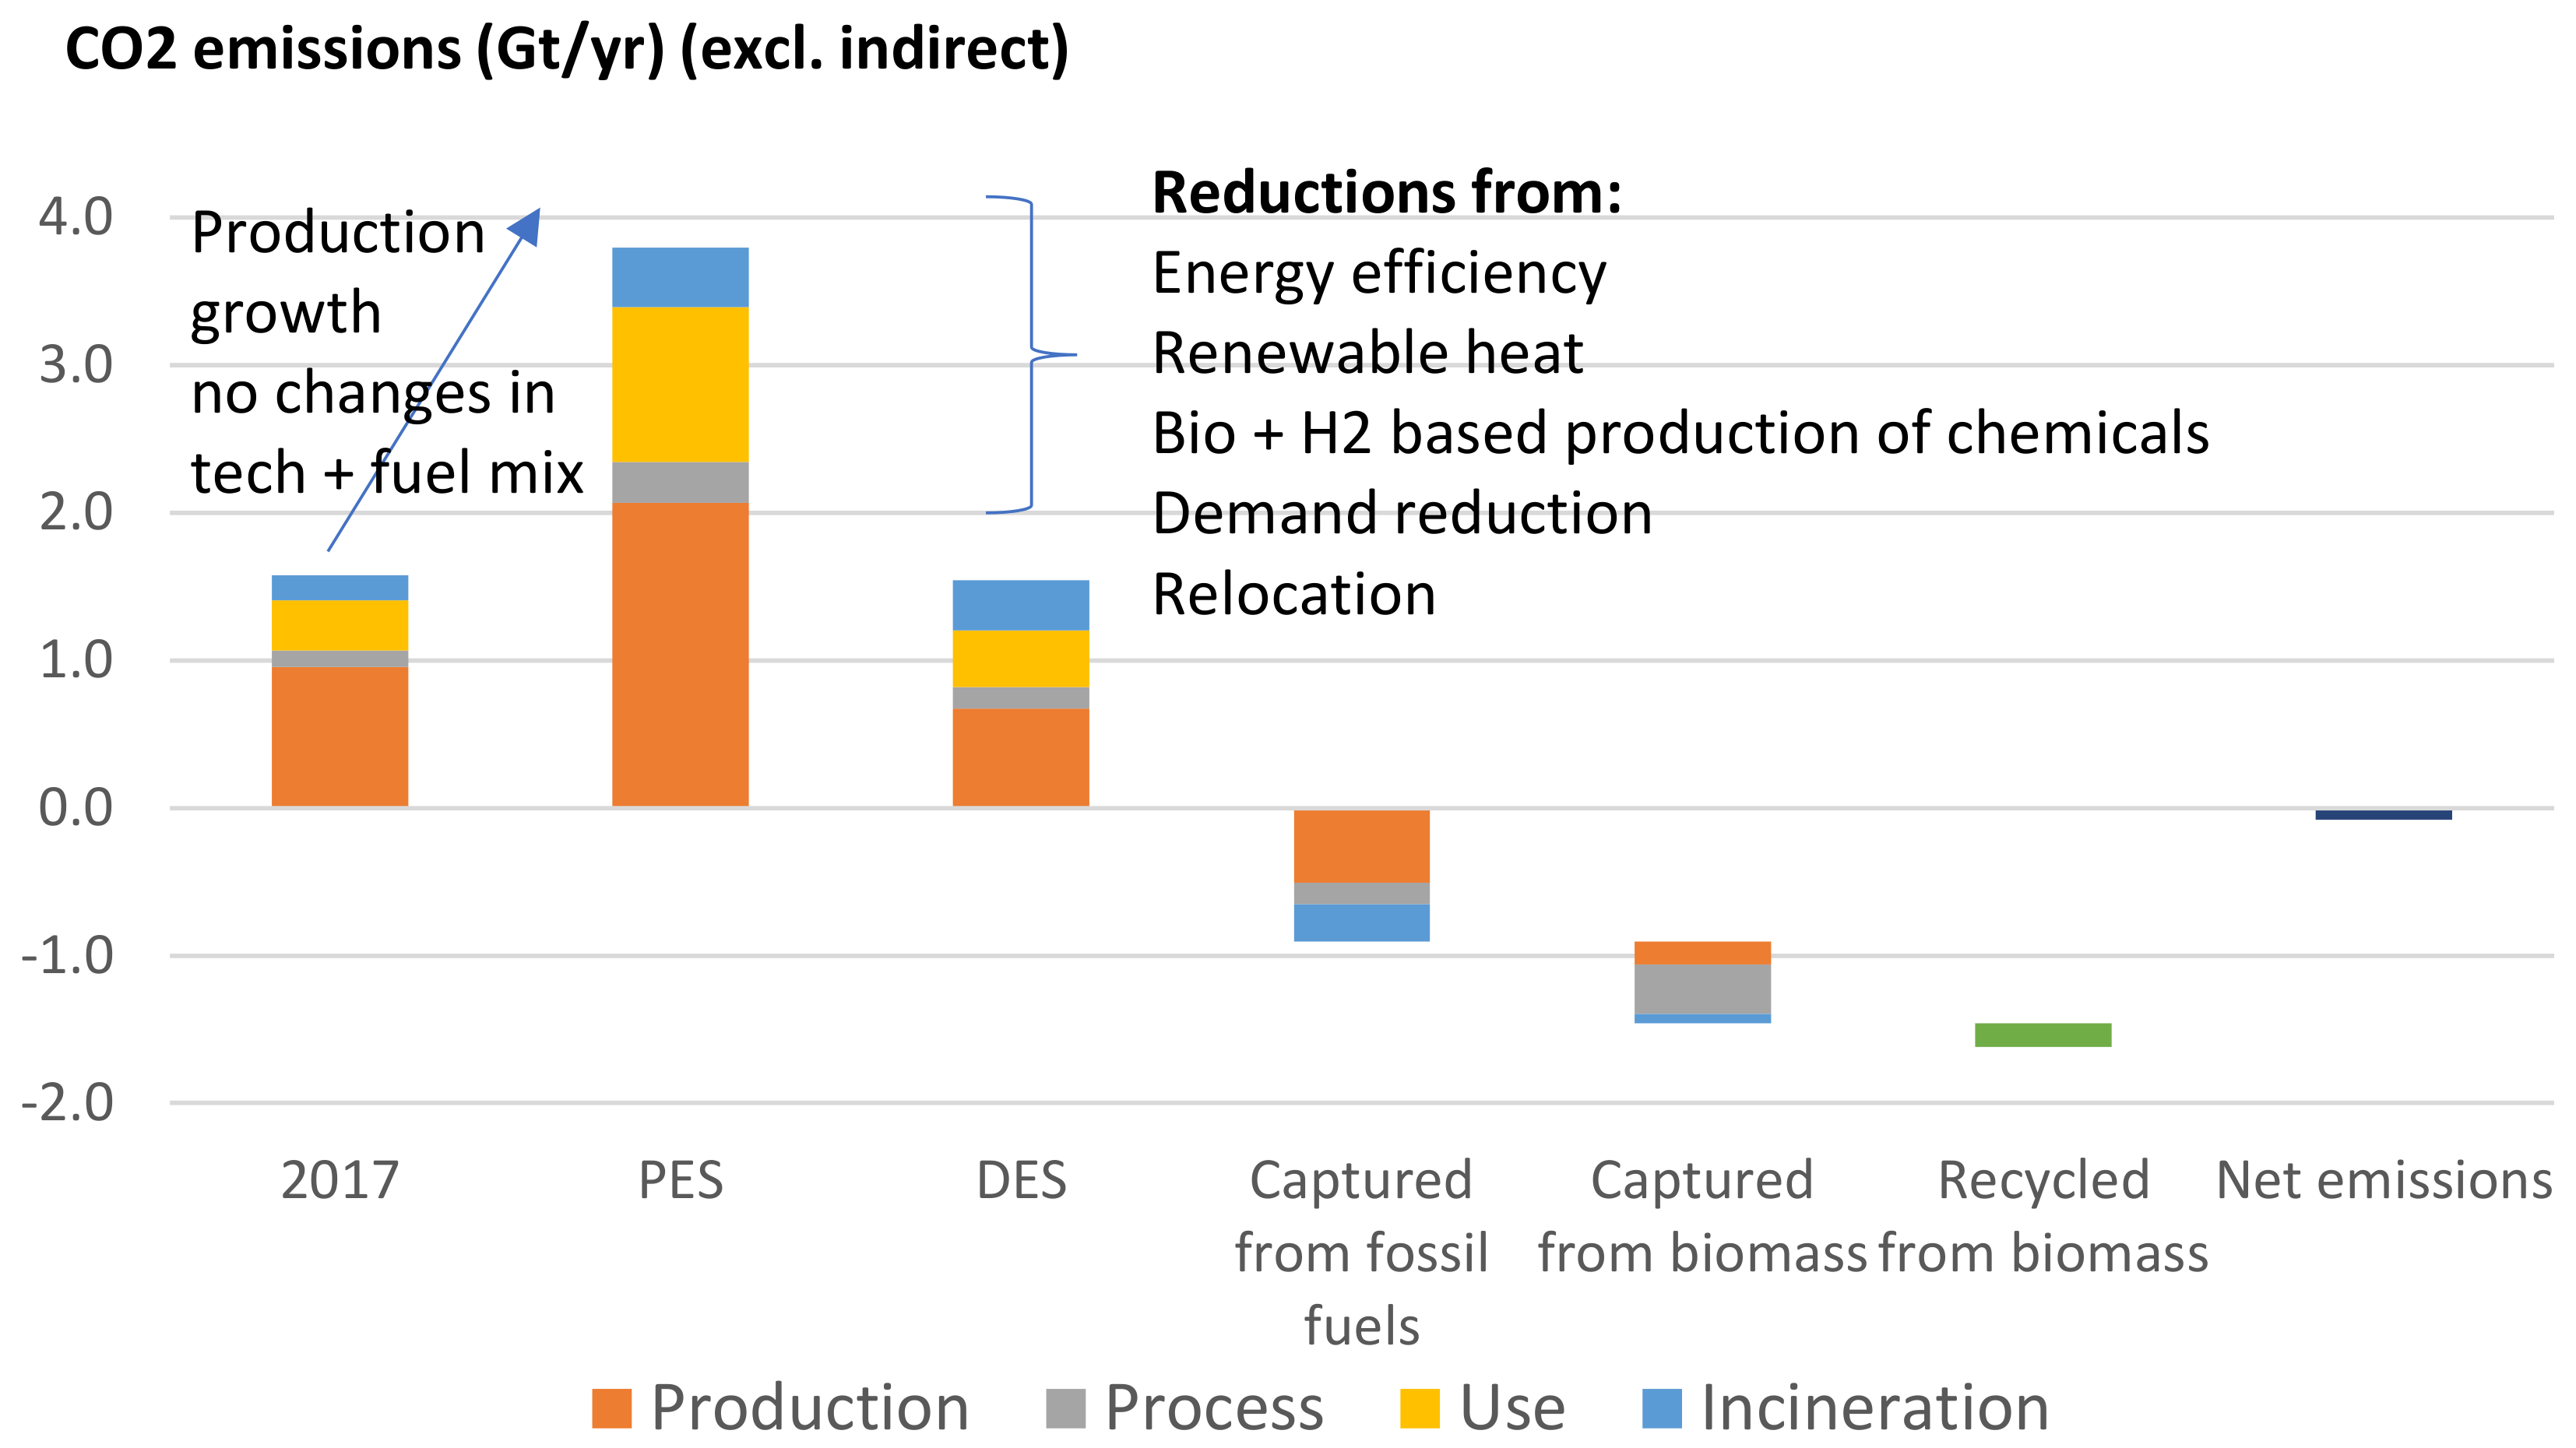
Analysis of the zero-emission pathway shows a 60% reduction potential in the sector’s direct emissions (from 3.9 Gt in the PES to 1.58 Gt in the 1.5 °C case) from energy efficiency, renewable heat and feedstock, hydrogen-based routes and industry relocation and demand reduction (Figure 8). Reducing the remaining 40% relies on CCS integration with production processes and waste management of plastics, as well as through biomass carbon accounting practices. CO2 emissions captured from fossil fuel-based production processes, process emissions and incineration total 0.94 Gt (0.83 Gt of which flows back for use with green hydrogen in the production of synthetic hydrocarbon feedstocks). Another 0.55 Gt is captured from biomass sources, which implies negative emissions. Finally, 0.14 Gt of biomass carbon is recycled back into plastic production. As a result, the sector’s direct emissions become carbon neutral by 2050.
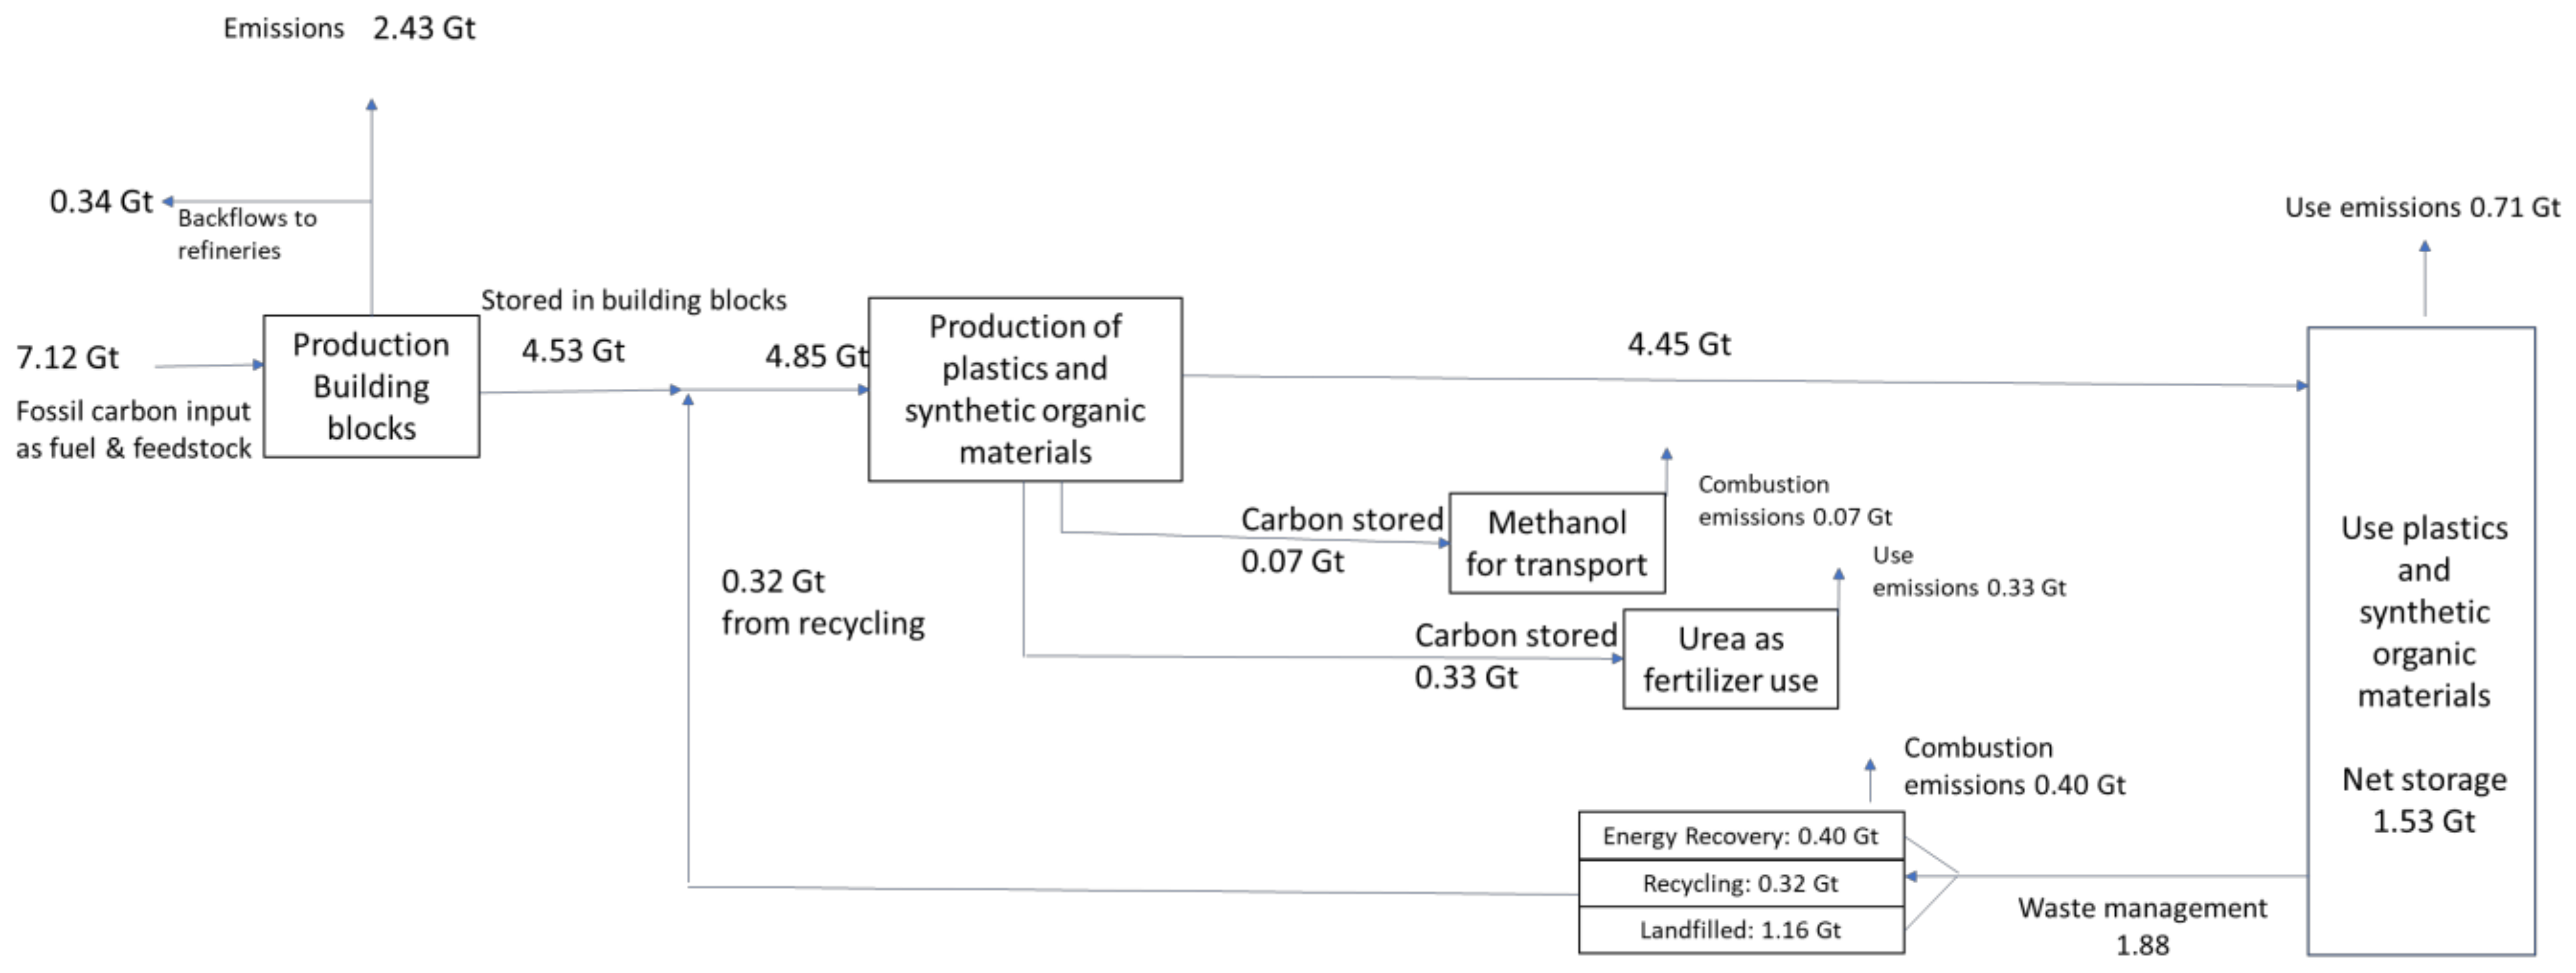
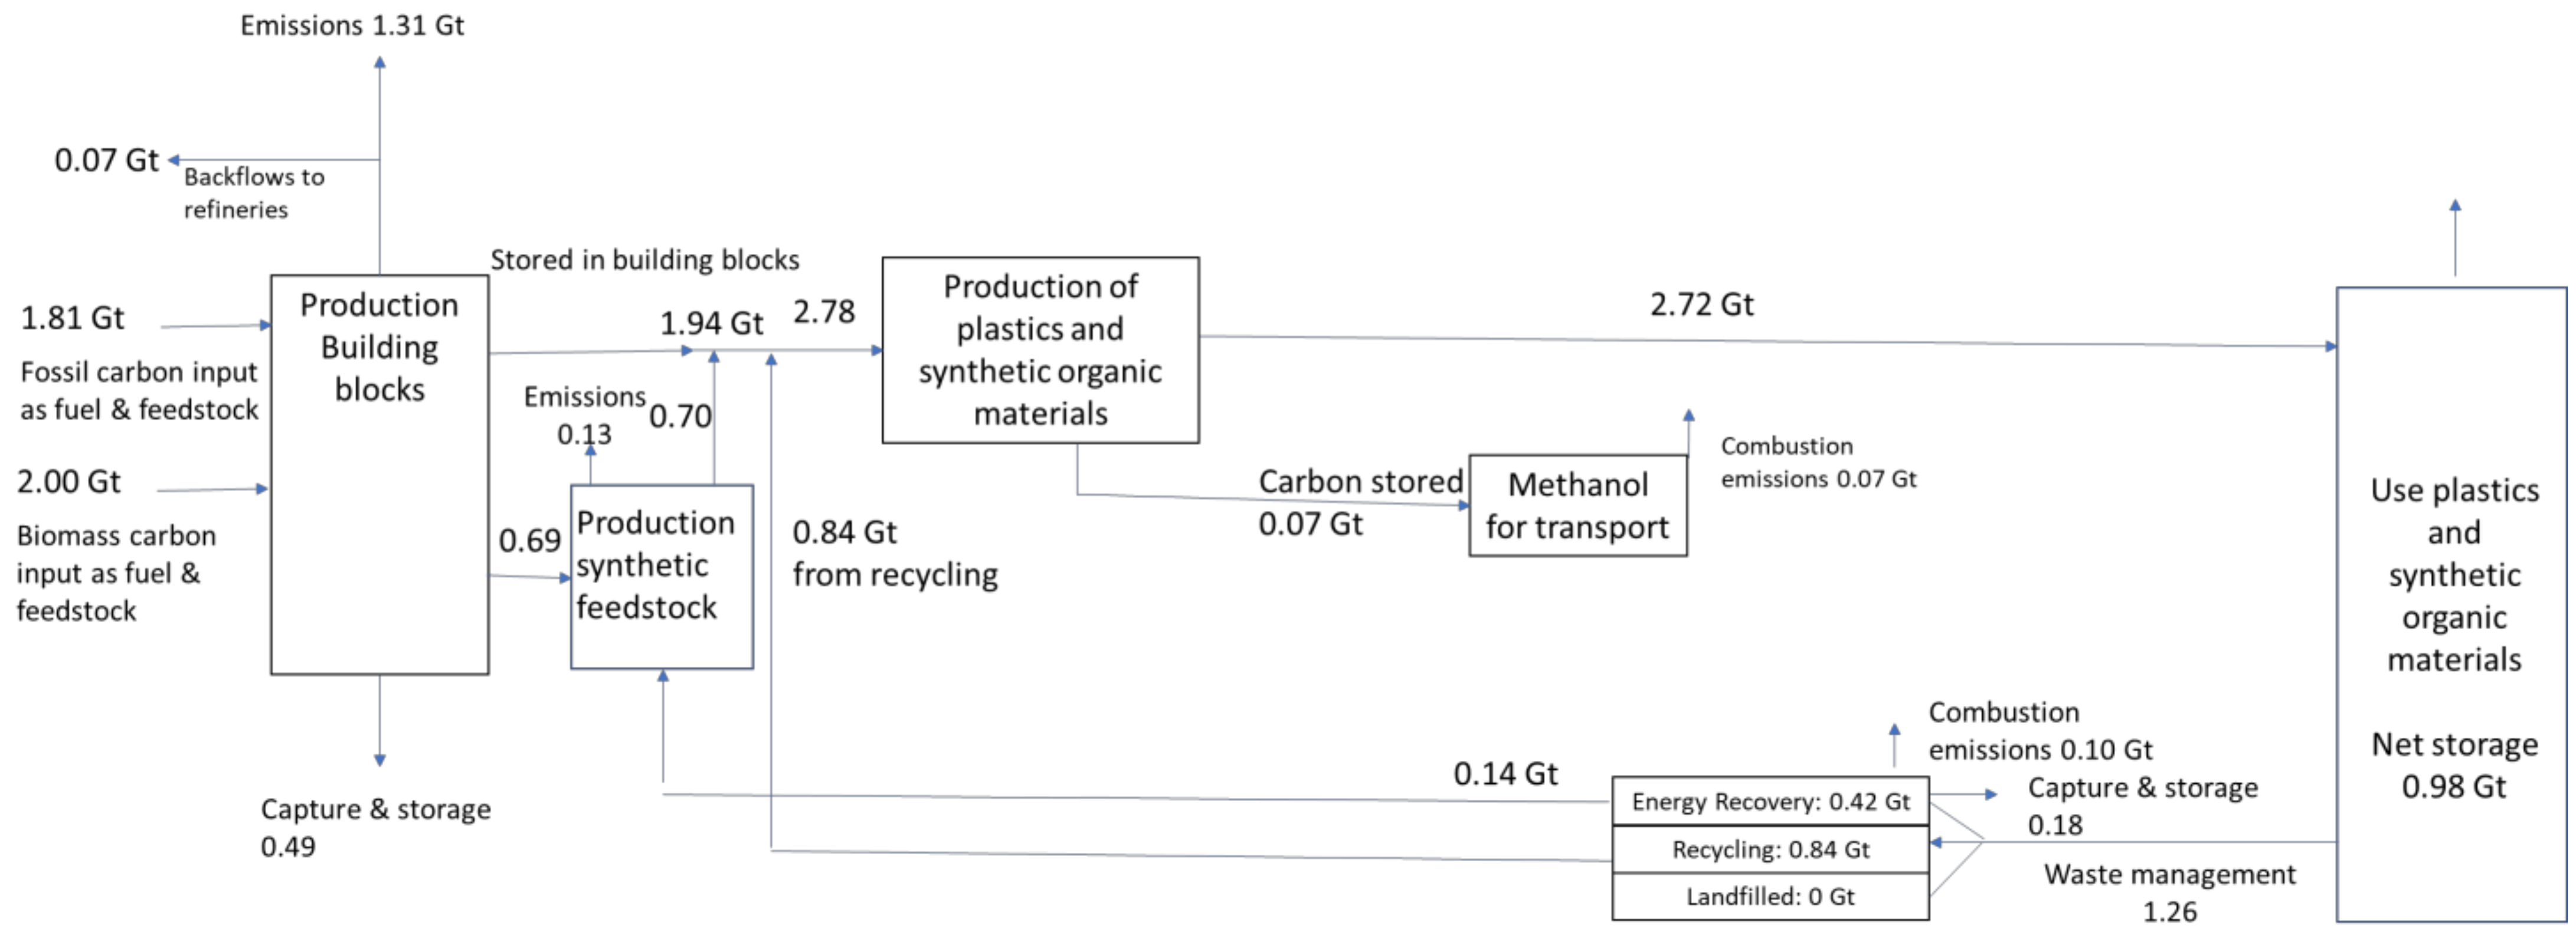
Figure 9 shows the sector’s carbon flows in the PES and the 1.5 °C case (top and bottom, respectively). The graphs show the major changes that are required, with much more use of biomass carbon as well as carbon recycling and CO2 capture and storage.

4.4. Costs of Emissions Reductions

We estimate the costs of decarbonising the chemical and petrochemical sector as the product of CO2 emissions mitigation potential and the cost of each option considered in the analysis. On average, total mitigation costs amount to USD 310 billion per year in 2050; this results in an average mitigation cost of USD 64/t CO2 (see Table 5). The total cost of mitigation equals more than 35% of the total energy and feedstock cost of the global chemical and petrochemical sector, estimated at around USD 860 billion per year in 2050. This is comparable with the findings of Ref. [72], which estimates an increase in production cost of 20–43% by 2050 for the deep decarbonisation of plastics production compared to business as usual (including energy, investment, operation and maintenance costs).
The 1.5 °C case technology portfolio identified requires a total investment of at least USD 4.5 trillion between 2018 and 2050 (on average USD 140 billion per year over the entire period) – an increase of USD 2.55 trillion compared to the PES (Figure 10). Low-carbon technologies require an additional USD 4.3 trillion, but fossil fuel-based production capacity investment needs are reduced by USD 1.8 trillion compared to the PES. Investments related to feedstock switching to biomass and hydrogen represent 61% of the total, followed by energy efficiency (18%), CCS (9%), recycling and energy recovery (8%) and direct use of renewables, including heat pumps (4%). Investments exclude infrastructure needs such as waste collection systems or hydrogen pipelines. Notably, investment cost for circular economy solutions is uncertain due to the complex supply chains and may be underestimated – more research is warranted. At the same time, such investments provide auxiliary environmental services, so their allocation to energy transition is a topic for debate.

4.5. Implications for the Global Energy System

The chemical and petrochemical sector’s role in the global energy system would grow substantially in the PES. Oil demand would double in absolute terms. In the 1.5 °C case, however, oil demand would decrease 30% between now and 2050 (Table 6). Still, the sector accounts for 60% of remaining oil demand in 2050, which is nearly a 6-fold growth from today’s share. This shows the importance of the petrochemical industry energy and feedstock demand for total oil demand projections. A similar effect can be seen for natural gas, where demand in the PES grows 2.5-fold between now and 2050, while consumption is reduced in the 1.5 °C case. The difference in demand levels exceeds today’s natural gas demand in Europe. The scenarios also differ markedly in biomass use, a six-fold increase in the 1.5 °C case compared to the PES. Total electricity demand is nearly five times higher in the 1.5 °C case when the needs for hydrogen production are accounted for, requiring more than 7000 GW of renewable power. Furthermore, in the future the chemical and petrochemical sector will remain deeply integrated with the energy sector, but the nature of the integration changes fundamentally. Despite the significant growth of renewables, the sector would rely on significant use of CCS for production processes and waste incineration, accounting for a quarter of total global CCS use. Around 1200 waste incinerators would require CCS deployment – up from four plants today.

4.6. Impact on Commodity Prices

Commodity price volatility that resulted from the Covid-19 crisis has been widely reviewed in the literature [80,81,82,83]. Oil and gas prices responded markedly, but have recovered since. Additionally, prices of commodities that are in demand because of the energy transition have risen substantially, as is the case for copper and lithium. Changing resource prices may also affect the cost effectiveness of transition strategies for the chemical and petrochemical industry. Fossil fuel prices are likely to decline, while prices of scarce biomass may rise; however, carbon pricing can still compensate wholly or partially for such developments. For renewable electricity and green hydrogen, as well as CCS, it is likely that economies of scale will overcome any scarcity effects. Longer term, the analysis indicates a 40% rise of energy and feedstock cost.
The impact of energy transition on product prices will vary. It will be most pronounced for the energy-and carbon-intensive products, and the effect will be moderate for more sophisticated products with higher value added. While prices will reflect the increased cost, the supply and demand balance will remain volatile, and prices will therefore continue to fluctuate.

5. Discussion of Decarbonisation Challenges

This analysis shows the technology needs for a zero-emission pathway and its impacts on sector’s energy consumption, feedstock needs, carbon flows and investments. In the PES, the sector is responsible for a rising share of the global oil and gas demand. This trend can be reversed through a combination of biomass feedstock use, CCS, circular economy and renewable hydrogen. The implications of such a transition for the sector structure will be profound (Section 5.1). We also reflect on the robustness of the analysis (Section 5.2).

5.1. Discussion of Results

The analysis highlights a need for life cycle policies that encompass both energy and materials. The sector outlook is uncertain, and this poses a risk that investors must consider. The wrong investments in the coming years can result in billions of dollars of stranded assets. The uncertainty also creates a conundrum in terms of where to invest. The analysis suggests that global strategies cannot simply be applied equally at the country/region level without tailoring. At the country level, analysis shows a large potential for hydrogen in China, India and in the rest of the G20 countries (see Figure 11). Biomass share in total final consumption is high in the “Rest of the G20” and in the “Rest of the World” countries. Solar thermal use is higher in India and the United States compared to others. Coal would continue to represent the largest fossil fuel use in China, whereas Japan’s sector would continue to rely on oil to a large extent. In other countries and regions, gas would comprise the majority of fossil fuel use.
New petrochemical complexes are concentrated in the Middle East (based on cheap oil and gas) and China (driven by national product demand). However, future location choice may be determined by the access to low-cost renewable power, biomass feedstock and CO2 storage potential. While it is possible to transport large amounts of biomass to central processing plants, the economics may favor smaller, decentralised plants close to biomass production sites. Such a decentralised structure is evident in existing biomass industries, such as sugar and ethanol plants, as well as pulp and paper mills, where access to fuel and raw material supply is crucial. Similar to existing sugar/ethanol biorefineries, new types of electricity/biofuel/biochemical biorefineries may emerge that can adjust their product mix based on market circumstances. North and South America, as well as South Asia, are potential locations for such a roll-out, given resource endowment and existing economic structure. Low-cost renewable-hydrogen production will be concentrated in remote desert locations, including in the Middle East and Africa as well as Australia and Chile, among others. Since hydrogen is a commodity that can be traded, it offers an opportunity for countries that already produce and export gas – a pillar of today’s chemicals production – to switch to renewable exports. Manufacture of products such as ammonia, methanol and other chemicals should take place nearby to hydrogen production sites in order to reduce shipping costs, thereby highlighting the opportunity for new industrial activities that may result in a global relocation of chemicals production. Such developments are evident, with green ammonia projects in Australia, Chile, Oman and Saudi Arabia currently under development.
Demand for chemicals is currently concentrated in developed countries [46]. As developing countries catch up, demand for plastics could triple, as assumed in this analysis. However, concerted action to minimise consumption and maximise circular economy efforts may reduce plastics demand from nearly 1000 Mt in PES to 650 Mt in 1.5 °C case in 2050, with future fossil fuel-based production returning to the 2017 level of 350 Mt. Therefore, the growth potential is significant but uncertain. The outcome will depend on new product policy, waste management policies, innovation and R&D in material sciences, as well as logistics in end-of-life management of post-consumer plastic waste [13].
We demonstrated a single zero-emission pathway based on the 1.5 °C case. We argue the robustness of this finding, since the pathway is comparable with the findings of other studies, as reviewed in Section 2, whilst we added several new insights at the technology and material levels. The sectorial pathway assumes the rest of the global economy will join a zero-emission pathway, following the ambitious climate policy choices countries have started taking. However, key hurdles are present for the sector. In a nutshell, these are: (a) the availability, accessibility, and acceptance of CO2 storage sites for the CCS route, but not their safety, which has been extensively proven; (b) the very high electricity and energy demand (due to the need to synthesise hydrogen via electrolysis and to energise CO2 for the CCU route, with the associated strict requirement of very low carbon-intensity of the electricity mix); and (c) the availability of land for biomass production, as well as competition with other biomass and land use.
Decarbonisation solutions need to be developed by considering that a large share of the carbon is stored in products. This limits the contribution of traditional measures such as energy efficiency. New sources of carbon feedstock have been identified from CO2 capture, biomass and recycling. The CCS route has two main advantages: (i) it can exploit the existing technology and the infrastructure of the current petrochemical and chemical industry, without the need for a complete reshaping of it; and (ii) CO2 captured from point sources and/or from air plus permanent CO2 storage in geological formations constitutes the key elements of the negative emissions technologies [84]. The analysis assumed massive use of CCS, to the tune of 1.5 Gt per year (including BECCS as a backstop, which is not yet deployed globally). In comparison, today’s CCS use across all sectors is well below 50 Mt per year. It is likely that the incumbents will opt for CCS-based solutions that can be integrated into existing plants, while new players will aim for more innovative solutions. However, local acceptance and availability of suitable CO2 storage sites could restrict its application. The key role of CCS in this sector is so far not fully appreciated and very few pilot projects exist beyond enhanced oil recovery. Therefore, the potential to ramp up CCS use is unclear. While there has been some progress on CCS for ammonia plants, other components are lagging. In the context of the life cycle of petrochemicals, emerging BECCS technologies and CCS for waste incinerators must be part of the solution. Our analysis suggests significant CCU use as captured carbon from chemical production processes would supply the carbon needed for green hydrogen-based routes. At the sector level, however, CCU must be combined with biomass use to fully replace primary fossil fuel feedstock and ensure carbon neutrality, as CCU for fossil CO2 sources would yield only a 35–50% emissions reduction for the petrochemicals sector overall.
Around 1.3 Gt of biomass needs to be deployed. Large biobased industries will likely be located close to the biomass supply. Whereas harbors with large petrochemical activities, such as Rotterdam and Antwerp, are developing biorefineries based on imported biomass, the economic feasibility of such strategies is not yet evident. Another key uncertainty is the availability of sustainable biomass feedstock. To put the 1.2 Gt into perspective, that equals the potential bioenergy production of the United States [85]. This illustrates the land use implications and the logistical challenges of such a strategy [6]. More than one-fifth of all products should be biomass-based by 2050. Some studies suggest even more ambitious shares of 40% to 70% by 2050, but the progress in recent decades has been modest [55,86]. Food production and consumption requirements in a world with rising populations, sustainability concerns, changing consumption patterns and climate change effects result in an uncertain outlook for biomass-based production [87].
Synthetic feedstocks provide a technically feasible option, but our analysis suggests that given the high cost and small pilot plant deployment scale today, its growth will be too slow to have a significant impact by 2050. The same applies for green hydrogen; while demand may grow substantially on relative terms, the small capacity today means that a roll-out will take time. Around 0.3 GW of hydrogen electrolyser capacity is in place today, while the 1.5 °C case assumes 2435 GW of electrolyser capacity for the chemical and petrochemical sector alone by 2050. This equals nearly half of the total green hydrogen manufacturing capacity that is projected for 2050 in the 1.5 °C case [40]. Green ammonia production will represent an economically viable early opportunity for renewable hydrogen deployment, and the first commercial plants are expected in the coming years. Wider use of hydrogen and other synthetic feedstocks will require the availability of low-cost electricity, high utilisation of electrolyser capacities and improvements in the efficiency and costs of electrolysers. Any transition in this sector will have profound effects on the power system and its cost-effective development will depend on the availability of renewable power. Growth of green hydrogen production must be matched by the roll-out of massive renewable power generation capacity, on top of the necessary transition of the existing generation capacity. Supplying the necessary power to meet 25 EJ hydrogen by 2050 would require around 7000 GW of electricity generation capacity, roughly the level of total global power generation capacity today [40]. Assuming an average investment cost of USD 1000/kW for renewable power, this translates into a total investment of USD 7 trillion.
As the analysis shows, biomass-based feedstocks will be the key solution to stem the growing demand for fossil fuels for plastics and chemicals production. Production of 300–350 Mt of biomaterials (from less than 10 Mt per year today) requires a growth rate of 13% per year over the next three decades. This is compatible with the second scenario of the drawdown project (https://drawdown.org/, accessed on 1 June 2021), where bioplastics demand grows to 357 Mt, or 46% of the market in 2050. Plants in Brazil and India have already demonstrated that bio-ethylene can be produced at competitive prices if low-cost biomass is available. The next step is the accelerated expansion of bio-based chemicals to substitute petrochemical-based polymers, starting with high value-added opportunities. Early niche markets include beverage bottles and cosmetics packaging.
The analysis assumes stringent circular economy measures, including minimisation of product use, such as one-way packaging, new ecological product design and maximum recycling efforts. Increased waste recycling is also essential. Around half of all plastics should be recycled by mid-century (from around 10% today); this includes chemical and mechanical recycling. Higher mechanical recycling rates require industry innovations, notably in collection and sorting. A better collection infrastructure would lead to a larger supply of well-sorted, high-quality, post-consumer plastics. This would increase the scale and further improve the economics of mechanical recycling [88]. Chemical and feedstock recycling offer the possibility of operating at a larger scale with less pure feedstock. The various scenarios suggest rapid growth of pyrolysis, a technology that is not yet fully proven, and that would incur significant carbon and energy losses (see also Supplementary Materials).

5.2. Strategic Implications

Overall, the sector’s development in the 1.5 °C case is very different from the sector’s current investment trends. This is a cause for concern, as it points to a significant risk of stranded assets that need to be better understood.
In this analysis, several key aspects that pertain to the decarbonisation of the global chemical and petrochemical sector have been combined, namely the energy impacts, emissions reductions potential and the costs and investment needs of the key low-carbon emission technologies covering the life cycle of chemicals and plastics, the impacts of decarbonisation on location choices and plant siting, as well as on materials use and waste handling, and finally, the role of accounting carbon storage in products as a crucial step in the complete assessment of the sector’s emissions. This combination helps to provide an overall picture for the sector’s net-zero pathway, thereby complementing the many existing studies that individually focus on the various components of decarbonisation. At the same time, the analysis is subject to uncertainty, as it is based on a set of bold yet uncertain assumptions regarding technology uptake for a limited number for key chemicals. Higher product granularity and further regional granularity may affect the findings.
While thorough technological analysis was carried out for certain solutions (e.g., energy efficiency, renewable energy heating and feedstocks, hydrogen and CCU/S), the potentials of recycling and other circular plastic strategies are uncertain. Technology progress continuously changes the outlook for a zero-emission pathway. For instance, green hydrogen has only emerged in the last couple of years. New prospects of green ammonia production and the scale up of hydrogen use in the production of methanol and other HVCs brighten the outlook for energy transition in the sector. The emphasis of the sector’s technology and emissions analyses has somewhat shifted strategy in recent years, from energy efficiency and biomass feedstocks to understanding the role of renewables for heating, hydrogen, CCUS and circular energy. It is unlikely that the technology transformation outlook will change fundamentally in the coming three decades, and we therefore regard our choice of five components as the key strategies. Specific to the chemical and petrochemical sector, most carbon is stored in products, and this limits the strategy scope; either carbon supply is carbon free, or CO2 is stored after use. This aspect is not properly reflected in existing models, as they lack material flows, and few industry strategies properly account for such scope-3 emissions. For example, if urea continues to be used as nitrogen fertiliser (and CO2 is released in the use phase), there is no way around biomass feedstock for ammonia production to ensure renewable CO2 supply. At a regional level, the analysis suggests the need for targeted solutions, notably for China and the Middle East, which deserve attention in the coming years. More refined analysis will result in a higher accuracy regarding the 1.5 °C case’s viability, and provide a better understanding regarding the steps needed from now until 2050.

6. Conclusions

A zero-carbon chemical and petrochemical industry is feasible by mid-21st century. Today, fossil hydrocarbon feedstocks are at the center of the chemical and petrochemical industry – this has profound implications for CO2 mitigation strategies. A life cycle approach is needed to capture the full greenhouse gas emissions impact and all mitigation opportunities. A set of twenty options across five strategies have been identified that can be deployed for this purpose. Energy efficiency and renewables-based process heating, biomass feedstocks, circular economy concepts, synthetic hydrocarbons from green hydrogen and CO2, CCS and the correct accounting of biomass carbon have key roles to play; together they can yield deep emissions reductions.
However, the product cost may increase by more than 35% compared to today’s level. Such a cost increase implies that a premium must be paid for green products, or the negative environmental impacts of fossil fuels and feedstocks must be priced properly. Renewables would provide nearly 70% of final consumption of energy, and feedstock and renewable supply solutions – in combination with direct and indirect electrification – account for 40% of the emission mitigation effort. When BECCS is included, the role of renewables increases to more than half of all emissions reduction. The key role of renewables-based solutions represents a new insight that reflects the significant cost reduction and technology improvement witnessed in recent years. Investment needs amount to USD 4.5 trillion between now and 2050, and CO2 mitigation would cost on average USD 64/t in 2050 – these costs are lower than previous estimates, yet this transition will not happen by itself. There is no significant experience with such an operating structure beyond a few scattered demonstration plants. The upscaling effort will be significant, and a certain lock-in of pathways may occur. The sector’s structure must change fundamentally, and the implications for the global energy system can be significant, as well as the material flow and location choice effects. Significant uncertainty remains in terms of how quickly this transition will take place, and what direction it will take – this creates an important conundrum for investors today. A concerted global effort to transition the chemical and petrochemical sector seems unlikely. Front runners – consumers, governments and chemical and petrochemical clusters and companies alike – will need to force this change, and this will require attention for competitiveness issues and carbon leakage. For example, certification of green supply chains may be required, as well as the creation of market niches, including a mandatory share of green product supply. Governments must create the right enabling environment to allow for transition experiments and foster the necessary growth to achieve the required economies of scale and technology learning.

Supplementary Materials

The following are available online at https://www.mdpi.com/article/10.3390/en14133772/s1, Figure B-1: Estimated change in production of chemicals in the PES and 1.5 °C case by 2050 compared to the 2017 level; Table A-1: Potentials and cost of key mitigation options; Table B-1. Estimated production volume, specific energy consumption and fuel mix of the major products in selected country/regions, 2017; Table B-2. Feedstock consumption per unit of product; Table B-3: Technology penetration assumptions in the 1.5 °C case in 2050; Table B-4: Estimated plastics production, demand and waste generation in the PES and 1.5 °C case, 2017-2050; Table D-1. Investment cost assumptions of technology options; Table D-1. Global overview of completed, operating and operational carbon capture storage and utilization facilities.

Author Contributions

Conceptualisation, D.S. and D.G.; methodology, D.S. and D.G.; formal analysis, D.S. and D.G.; data curation, D.S. and D.G.; writing—original draft preparation, D.S. and D.G.; writing—review and editing, D.S. and D.G.; visualisation; funding acquisition, D.S. Both authors have read and agreed to the published version of the manuscript.

Funding

This research received no external funding.

Acknowledgments

We thank Ricardo Gorini, Rodrigo Leme, Gayathri Prakash and Sean Ratka (all IRENA) for their valuable comments, and Florian Ausfelder and Alexis Bazzanella (DECHEMA) who have reviewed earlier versions of this manuscript.

Conflicts of Interest

The authors declare no conflict of interest.

References

  1. OECD. Saving Costs in Chemicals Management: How the OECD Ensures Benefits to Society; OECD: Paris, France, 2019. [Google Scholar]
  2. IEA. World Energy Balances 2019; OECD/IEA: Paris, France, 2019. [Google Scholar]
  3. Khemka, P. Ammonia and Urea: Global Overcapacity to Continue to Subdue Global Operating Rates in the Medium Term; Nexant: White Plains, NY, USA, 2019. [Google Scholar]
  4. Plastics Europe. Plastics—The Facts 2019. An Analysis of European Plastics Production, Demand and Waste Data; Plastics Europe: Brussels, Belgium, 2019. [Google Scholar]
  5. Grau, E. Bio-Sourced Polymers. Master’s Thesis, University of Bordeaux, Bordeaux, France, 2019. [Google Scholar]
  6. Saygin, D.; Gielen, D.; Draeck, M.; Worrell, E.; Patel, M. Assessment of the technical and economic potentials of biomass use for the production of steam, chemicals and polymers. Renew. Sustain. Energy Rev. 2014, 40, 1153–1167. [Google Scholar] [CrossRef]
  7. Weiss, M.; Neelis, M.; Zuidberg, M.; Patel, M. Applying bottom-up analysis to identify the system boundaries of non-energy use data in international energy statistics. Energy 2008, 33, 1609–1622. [Google Scholar] [CrossRef]
  8. Saygin, D.; Patel, M.; Worrell, E.; Tam, C.; Gielen, D. Potential of best practice technology to improve energy efficiency in the global chemical and petrochemical sector. Energy 2011, 36, 5779–5790. [Google Scholar] [CrossRef]
  9. IRENA. Global Renewables Outlook; International Renewable Energy Agency: Abu Dhabi, United Arab Emirates, 2020. [Google Scholar]
  10. Rogelj, J.; Shindell, D.; Jiang, K.; Fifita, S.; Forster, P.; Ginzburg, V.; Handa, C.; Kheshgi, H.; Kobayashi, S.; Kriegler, E.; et al. Mitigation Pathways Compatible with 1.5 °C in the Context of Sustainable Development. In Global Warming of 1.5 °C. An IPCC Special Report on the Impacts of Global Warming of 1.5 °C above Pre-Industrial Levels and Related Global Greenhouse Gas Emission Pathways, in the Context of Strengthening the Global Response to the Threat of Climate Change, Sustainable Development, and Efforts to Eradicate Poverty; Cambridge Press: Cambridge, UK, 2018. [Google Scholar]
  11. Ike, G.N.; Usman, O.; Sarkodie, S.A. Testing the role of oil production in the environmental Kuznets curve of oil producing countries: New insights from Method of Moments Quantile Regression. Sci. Total. Environ. 2020, 711, 135208. [Google Scholar] [CrossRef]
  12. Sadik-Zada, E.R.; Gatto, A. The puzzle of greenhouse gas footprints of oil abundance. Socio-Econ. Plan. Sci. 2021, 75, 100936. [Google Scholar] [CrossRef]
  13. Chen, G.-Q.; Patel, M.K. Plastics Derived from Biological Sources: Present and Future: A Technical and Environmental Review. Chem. Rev. 2012, 112, 2082–2099. [Google Scholar] [CrossRef]
  14. Karan, H.; Funk, C.; Grabert, M.; Oey, M.; Hankamer, B. Green Bioplastics as Part of a Circular Bioeconomy. Trends Plant Sci. 2019, 24, 237–249. [Google Scholar] [CrossRef]
  15. De Luna, P.; Hahn, C.; Higgins, D.; Jaffer, S.A.; Jaramillo, T.F.; Sargent, E.H. What would it take for renewably powered electrosynthesis to displace petrochemical processes? Science 2019, 364. [Google Scholar] [CrossRef] [Green Version]
  16. Gielen, D. Materializing Dematerialization. Ph.D. Thesis, Technical University Delft, Delft, The Netherlands, 1999. [Google Scholar]
  17. Kümmerer, K.; Clark, J.H.; Zuin, V.G. Rethinking chemistry for a circular economy. Science 2020, 367, 369–370. [Google Scholar] [CrossRef]
  18. Hatti-Kaul, R.; Nilsson, L.J.; Zhang, B.; Rehnberg, N.; Lundmark, S. Designing Biobased Recyclable Polymers for Plastics. Trends Biotechnol. 2020, 38, 50–67. [Google Scholar] [CrossRef]
  19. ECIU. Net Zero Tracker. Energy & Climate Intelligence Unit. 2021. Available online: https://www.eciu.net/netzerotracker (accessed on 24 April 2021).
  20. Stork, M.; de Beer, J.; Lintmeijer, N.; den Ouden, B. Chemistry for Climate: Acting on the Need for Speed. Roadmap for the Dutch Chemical Industry towards 2050; Ecofys and Berenschot: Utrecht, The Netherlands, 2018. [Google Scholar]
  21. CEFIC. European Chemistry for Growth. Unlocking a Competitive, Low Carbon and Energy Efficient Future; CEFIC: Brussels, Belgium, 2013. [Google Scholar]
  22. IEA. The Future of Petrochemicals. Towards More Sustainable Plastics and Fertilisers; OECD/IEA: Paris, France, 2018. [Google Scholar]
  23. Rissman, J.; Bataille, C.; Masanet, E.; Aden, N.; Morrow, W.R.; Zhou, N.; Elliott, N.; Dell, R.; Heeren, N.; Huckestein, B.; et al. Technologies and policies to decarbonize global industry: Review and assessment of mitigation drivers through 2070. Appl. Energy 2020, 266, 114848. [Google Scholar] [CrossRef]
  24. Economidou, M. Assessing the Progress towards the EU Energy Efficiency Targets Using Index Decomposition Analysis; No. EUR 28710 EN; Publications Office of the European Union: Luxembourg, 2017. [Google Scholar]
  25. Reuter, M.; Patel, M.K.; Eichhammer, W. Applying ex post index decomposition analysis to final energy consumption for evaluating European energy efficiency policies and targets. Energy Effic. 2019, 12, 1329–1357. [Google Scholar] [CrossRef] [Green Version]
  26. Saygin, D.; Worrell, E.; Tam, C.; Trudeau, N.; Gielen, D.; Weiss, M.; Patel, M. Long-term energy efficiency analysis requires solid energy statistics: The case of the German basic chemical industry. Energy 2012, 44, 1094–1106. [Google Scholar] [CrossRef]
  27. Boulamanti, A.; Moya, J.A. Energy Efficiency and GHG Emissions: Prospective Scenarios for the Chemical and Petrochemical Industry; No. EUR 28471 EN; Publications Office of the European Union: Luxembourg, 2017. [Google Scholar]
  28. Kesicki, F.; Yanagisawa, A. Modelling the potential for industrial energy efficiency in IEA’s World Energy Outlook. Energy Effic. 2015, 8, 155–169. [Google Scholar] [CrossRef]
  29. Saygin, D.; Wetzels, W.; Worrell, E.; Patel, M.K. Linking historic developments and future scenarios of industrial energy use in the Netherlands between 1993 and 2040. Energy Effic. 2013, 6, 341–368. [Google Scholar] [CrossRef]
  30. McLellan, B.; Corder, G.; Giurco, D.; Ishihara, K. Renewable energy in the minerals industry: A review of global potential. J. Clean. Prod. 2012, 32, 32–44. [Google Scholar] [CrossRef]
  31. Schiffer, Z.J.; Manthiram, K. Electrification and Decarbonization of the Chemical Industry. Joule 2017, 1, 10–14. [Google Scholar] [CrossRef] [Green Version]
  32. Åhman, M.; Nilsson, L.J.; Johansson, B. Global climate policy and deep decarbonization of energy-intensive industries. Clim. Policy 2017, 17, 634–649. [Google Scholar] [CrossRef] [Green Version]
  33. Fais, B.; Sabio, N.; Strachan, N. The critical role of the industrial sector in reaching long-term emission reduction, energy efficiency and renewable targets. Appl. Energy 2016, 162, 699–712. [Google Scholar] [CrossRef] [Green Version]
  34. Gerres, T.; Ávila, J.P.C.; Llamas, P.L.; Román, T.G.S. A review of cross-sector decarbonisation potentials in the European energy intensive industry. J. Clean. Prod. 2019, 210, 585–601. [Google Scholar] [CrossRef]
  35. Gielen, D.; Taylor, M. Modelling industrial energy use: The IEAs Energy Technology Perspectives. Energy Econ. 2007, 29, 889–912. [Google Scholar] [CrossRef]
  36. Levi, P.G.; Cullen, J.M. Mapping Global Flows of Chemicals: From Fossil Fuel Feedstocks to Chemical Products. Environ. Sci. Technol. 2018, 52, 1725–1734. [Google Scholar] [CrossRef] [PubMed]
  37. Bazzanella, A.M.; Ausfelder, F. Low Carbon Energy and Feedstock for the European Chemical Industry; Technical Study; Dechema E.V.: Frankfurt am Main, Germany, 2017. [Google Scholar]
  38. Serrano-Ruiz, J.C.; West, R.M.; Dumesic, J.A. Catalytic Conversion of Renewable Biomass Resources to Fuels and Chemicals. Annu. Rev. Chem. Biomol. Eng. 2010, 1, 79–100. [Google Scholar] [CrossRef] [PubMed]
  39. Patel, M.; Neelis, M.; Gielen, D.; Olivier, J.; Simmons, T.; Theunis, J. Carbon dioxide emissions from non-energy use of fossil fuels: Summary of key issues and conclusions from the country analyses. Resour. Conserv. Recycl. 2005, 45, 195–209. [Google Scholar] [CrossRef]
  40. IRENA. World Energy Transitions Outlook: 1.5 °C Pathway (Preview); IRENA: Abu Dhabi, United Arab Emirates, 2021. [Google Scholar]
  41. Bourguignon, D. Plastics in a Circular Economy. Opportunities and Challenges; Briefing; European Parliament: Brussels, Belgium, 2017. [Google Scholar]
  42. Hundertmark, T.; Mayer, M.; McNally, C.; Simons, T.J.; Witte, C. How Plastics-Waste Recycling Could Transform the Chemical Industry; McKinsey & Company: New York, NY, USA, 2018. [Google Scholar]
  43. WEF. The New Plastics Economy. Rethinking the Future of Plastics; World Economic Forum: Geneva, Switzerland, 2016. [Google Scholar]
  44. Gielen, D.; Patel, M.K. The NEAT model, non-energy use emission accounting tables. In Proceedings of the First NEU-CO2 workshop, Paris, France, 22–23 September 1999. [Google Scholar]
  45. Zuberi, M.J.S.; Patel, M.K. Cost-effectiveness analysis of energy efficiency measures in the Swiss chemical and pharmaceutical industry. Int. J. Energy Res. 2019, 43, 313–336. [Google Scholar] [CrossRef] [Green Version]
  46. Broeren, M.; Saygin, D.; Patel, M. Forecasting global developments in the basic chemical industry for environmental policy analysis. Energy Policy 2014, 64, 273–287. [Google Scholar] [CrossRef]
  47. IEA. Energy Technology Transitions for the Industry. Strategies for Next Industrial Revolution; OECD/IEA: Paris, France, 2009. [Google Scholar]
  48. Parvatker, A.G.; Eckelman, M.J. Simulation-Based Estimates of Life Cycle Inventory Gate-to-Gate Process Energy Use for 151 Organic Chemical Syntheses. ACS Sustain. Chem. Eng. 2020, 8, 8519–8536. [Google Scholar] [CrossRef]
  49. IRENA. Renewable Energy in Manufacturing. A Technology Roadmap for REmap 2030; International Renewable Energy Agency: Abu Dhabi, United Arab Emirates, 2014. [Google Scholar]
  50. Taibi, E.; Gielen, D.; Bazilian, M. The potential for renewable energy in industrial applications. Renew. Sustain. Energy Rev. 2012, 16, 735–744. [Google Scholar] [CrossRef]
  51. Lechtenböhmer, S.; Nilsson, L.J.; Åhman, M.; Schneider, C. Decarbonising the energy intensive basic materials industry through electrification—Implications for future EU electricity demand. Energy 2016, 115, 1623–1631. [Google Scholar] [CrossRef] [Green Version]
  52. Perner, J.; Unteutsch, M.; Lövenich, A. The Future Cost of Electricity-Based Synthetic Fuels; Agora Energiewende and Agora Verkehrswende: Berlin, Germany, 2018. [Google Scholar]
  53. Jung, O. Industrial Heat Pumps; Svenska Kyl &, Värmepumpdagen, Mölndal, Sweden, 17 October 2019. Available online: https://www.kvpdagen.se/wp-content/uploads/2019/11/Sal%201/20191017%20Industrial%20heat%20pumps%20-Oliver%20Jung.pdf (accessed on 11 June 2021).
  54. Van Kranenburg, K.; Schols, E.; Gelevert, H.; de Kler, R.; van Delft, Y.; Weeda, M. Empowering the Chemical Industry. Opportunities for Electrification; Whitepaper; TNO and ECN: Utrecht, The Netherlands; Petten, The Netherlands, 2016. [Google Scholar]
  55. Daioglou, V.; Faaij, A.P.C.; Saygin, D.; Patel, M.K.; Wicke, B.; Van Vuuren, D.P. Energy demand and emissions of the non-energy sector. Energy Environ. Sci. 2014, 7, 482–498. [Google Scholar] [CrossRef] [Green Version]
  56. IEA. The Future of Hydrogen. Seizing Today’s Opportunities; OECD/IEA: Paris, France, 2019. [Google Scholar]
  57. Karka, P.; Papadokonstantakis, S.; Kokossis, A. Cradle-to-gate assessment of environmental impacts for a broad set of biomass-to-product process chains. Int. J. Life Cycle Assess. 2017, 22, 1418–1440. [Google Scholar] [CrossRef]
  58. IRENA; Methanol Institute. Production of Renewable Methanol; IRENA: Abu Dhabi, United Arab Emirates, 2021. [Google Scholar]
  59. Matzen, M.; Alhajji, M.; Demirel, Y. Technoeconomics and Sustainability of Renewable Methanol and Ammonia Productions Using Wind Power-based Hydrogen. J. Adv Chem Eng. 2015, 5, 128. [Google Scholar] [CrossRef] [Green Version]
  60. IRENA. Accelerating the Energy Transition through Innovation; International Renewable Energy Agency: Abu Dhabi, United Arab Emirates, 2017. [Google Scholar]
  61. Philibert, C. Direct and indirect electrification of industry and beyond. Oxf. Rev. Econ. Policy 2019, 35, 197–217. [Google Scholar] [CrossRef]
  62. Da Cruz, N.F.; Ferreira, S.; Cabral, M.; Simões, P.; Marques, R.C. Packaging waste recycling in Europe: Is the industry paying for it? Waste Manag. 2014, 34, 298–308. [Google Scholar] [CrossRef] [PubMed] [Green Version]
  63. Ferreira, S.; Cabral, M.; da Cruz, N.; Simões, P.; Marques, R.C. The costs and benefits of packaging waste management systems in Europe: The perspective of local authorities. J. Environ. Plan. Manag. 2016, 60, 773–791. [Google Scholar] [CrossRef] [Green Version]
  64. Gradus, R.H.; Nillesen, P.H.; Dijkgraaf, E.; van Koppen, R.J. A Cost-effectiveness Analysis for Incineration or Recycling of Dutch Household Plastic Waste. Ecol. Econ. 2017, 135, 22–28. [Google Scholar] [CrossRef]
  65. Pilz, H. Criteria for Eco-Efficient (Sustainable) Plastic Recycling and Waste Management; Background Report for Associated Presentation No. Version 1.2; Denkstatt: Vienna, Austria, 2014. [Google Scholar]
  66. Bergsma, G. Chemical Recycling and Its CO2 Reduction Potential; CE Delft: Delft, The Netherlands, 2019. [Google Scholar]
  67. Devasahayam, S.; Raju, G.B.; Hussain, C.M. Utilization and recycling of end of life plastics for sustainable and clean industrial processes including the iron and steel industry. Mater. Sci. Energy Technol. 2019, 2, 634–646. [Google Scholar] [CrossRef]
  68. Kuramochi, T.; Ramírez, A.; Turkenburg, W.; Faaij, A. Comparative assessment of CO2 capture technologies for carbon-intensive industrial processes. Prog. Energy Combust. Sci. 2012, 38, 87–112. [Google Scholar] [CrossRef]
  69. Saygin, D.; Broek, M.V.D.; Ramírez, A.; Patel, M.; Worrell, E. Modelling the future CO2 abatement potentials of energy efficiency and CCS: The case of the Dutch industry. Int. J. Greenh. Gas Control. 2013, 18, 23–37. [Google Scholar] [CrossRef] [Green Version]
  70. Bhave, A.; Taylor, R.H.; Fennell, P.; Livingston, W.R.; Shah, N.; Mac Dowell, N.; Dennis, J.; Kraft, M.; Pourkashanian, M.; Insa, M.; et al. Screening and techno-economic assessment of biomass-based power generation with CCS technologies to meet 2050 CO2 targets. Appl. Energy 2017, 190, 481–489. [Google Scholar] [CrossRef] [Green Version]
  71. Pröll, T.; Zerobin, F. Biomass-based negative emission technology options with combined heat and power generation. Mitig. Adapt. Strat. Glob. Chang. 2019, 24, 1307–1324. [Google Scholar] [CrossRef] [Green Version]
  72. Material Economics. Industrial Transformation 2050—Pathways to Net-Zero Emissions from EU Heavy Industry; Material Economics: Stockholm, Sweden, 2019. [Google Scholar]
  73. Brown, T. What Drives New Investments in Low-Carbon Ammonia Production? One Million Tons per Day Demand. Ammonia Industry. 2018. Available online: https://ammoniaindustry.com/what-drives-new-investments-in-low-carbon-ammonia/ (accessed on 11 June 2021).
  74. IRENA. Global Energy Transformation: A Roadmap to 2050, 2019th ed.; IRENA: Abu Dhabi, United Arab Emirates, 2019. [Google Scholar]
  75. Haro, P.; Ollero, P.; Trippe, F. Technoeconomic assessment of potential processes for bio-ethylene production. Fuel Process. Technol. 2013, 114, 35–48. [Google Scholar] [CrossRef]
  76. Fasihi, M.; Bogdanov, D.; Breyer, C. Techno-Economic Assessment of Power-to-Liquids (PtL) Fuels Production and Global Trading Based on Hybrid PV-Wind Power Plants. In Energy Procedia, Proceedings of the 10th International Renewable Energy Storage Conference, IRES 2016, Düsseldorf, Germany, 15–17 March 2016; Elsevier: Amsterdam, The Netherlands, 2016; pp. 243–268. [Google Scholar]
  77. Ikäheimo, J.; Kiviluoma, J.; Weiss, R.; Holttinen, H. Power-to-ammonia in future North European 100 % renewable power and heat system. Int. J. Hydrogen Energy 2018, 43, 17295–17308. [Google Scholar] [CrossRef]
  78. Gilbert, P.; Thornley, P. Energy and carbon balance of ammonia production from biomass gasification. In Proceedings of the Bioten Conference on Biomass, Bioenergy and Biofuels, Birmingham, UK, 21–23 September 2010; CPL Press: Birmingham, UK, 2010. [Google Scholar]
  79. Renó, M.L.G.; Lora, E.E.S.; Palacio, J.C.E.; Venturini, O.J.; Buchgeister, J.; Almazan, O. A LCA (life cycle assessment) of the methanol production from sugarcane bagasse. Energy 2011, 36, 3716–3726. [Google Scholar] [CrossRef]
  80. Uddin, M.; Chowdhury, A.; Anderson, K.; Chaudhuri, K. The effect of COVID-19 pandemic on global stock market volatility: Can economic strength help to manage the uncertainty? J. Bus. Res. 2021, 128, 31–44. [Google Scholar] [CrossRef]
  81. Ezeaku, H.C.; Asongu, S.A.; Nnanna, J. Volatility of international commodity prices in times of COVID-19: Effects of oil supply and global demand shocks. Extr. Ind. Soc. 2021, 8, 257–270. [Google Scholar] [CrossRef]
  82. Bakas, D.; Triantafyllou, A. Commodity price volatility and the economic uncertainty of pandemics. Econ. Lett. 2020, 193, 109283. [Google Scholar] [CrossRef]
  83. Gaudenzi, B.; Zsidisin, G.A.; Pellegrino, R. Measuring the financial effects of mitigating commodity price volatility in supply chains. Supply Chain Manag. Int. J. 2020, 26, 17–31. [Google Scholar] [CrossRef]
  84. Gabrielli, P.; Gazzani, M.; Mazzotti, M. The Role of Carbon Capture and Utilization, Carbon Capture and Storage, and Biomass to Enable a Net-Zero-CO2 Emissions Chemical Industry. Ind. Eng. Chem. Res. 2020, 59, 7033–7045. [Google Scholar] [CrossRef] [Green Version]
  85. Langholtz, M.H.; Stokes, B.J.; Eaton, L.M. 2016 Billion-Ton Report: Advancing Domestic Resources for a Thriving Bioeconomy; Economic Availability of Feedstocks (No. ORNL/TM-2016/160); US Department of Energy: Oak Ridge, TN, USA, 2016; Volume 1.
  86. Mandley, S.; Daioglou, V.; Junginger, H.; van Vuuren, D.; Wicke, B. EU bioenergy development to 2050. Renew. Sustain. Energy Rev. 2020, 127, 109858. [Google Scholar] [CrossRef]
  87. Daioglou, V.; Doelman, J.C.; Wicke, B.; Faaij, A.; van Vuuren, D.P. Integrated assessment of biomass supply and demand in climate change mitigation scenarios. Glob. Environ. Chang. 2019, 54, 88–101. [Google Scholar] [CrossRef] [Green Version]
  88. IHS Markit. Plastics Recycling. In Chemical Economics Handbook; IHS Markit: London, UK, 2019. [Google Scholar]
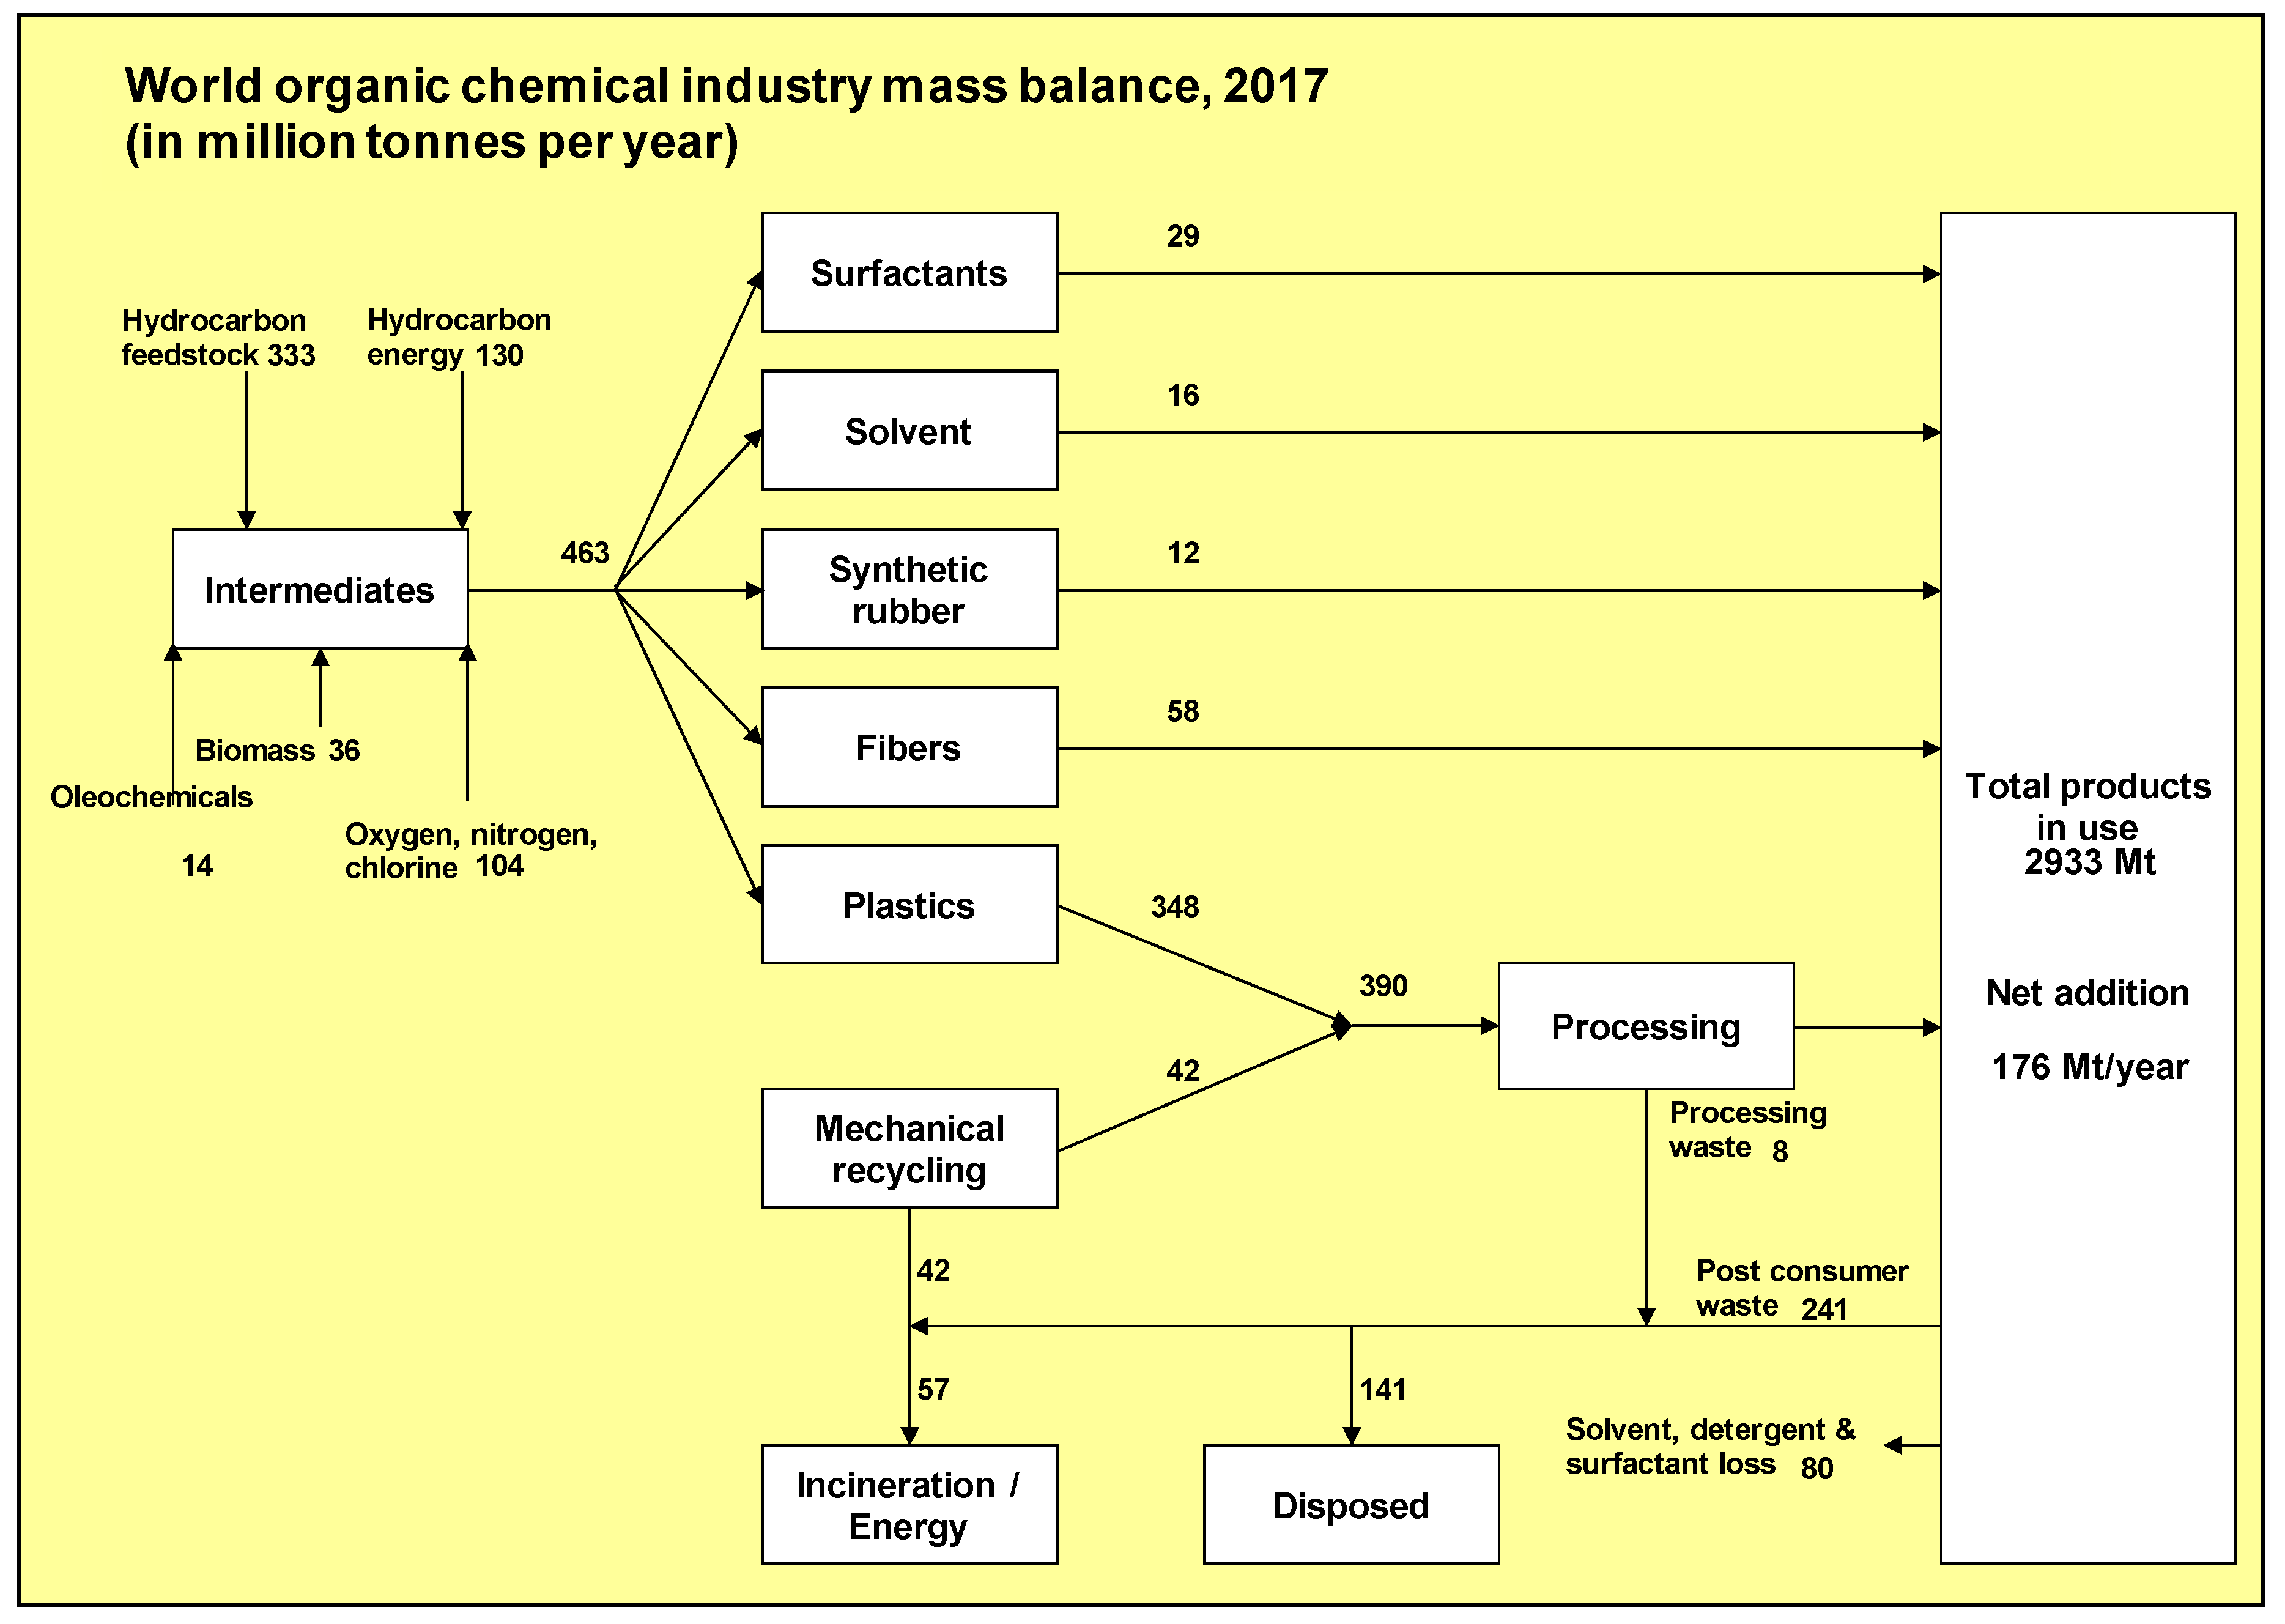
Figure 1. Estimated world petrochemicals production, processing and recycling balance, 2017. Source: updated to the year 2017 based on Ref [6].
Energies 14 03772 g001
Figure 2. Estimated production volumes of the key chemicals, 2017–2050.
Energies 14 03772 g002
Figure 3. Development in the estimated total final consumption of the global chemical and petrochemical sector between 2017 and 2050.
Energies 14 03772 g003
Figure 4. Breakdown of the estimated total final consumption of the global chemical and petrochemical sector by energy carrier, 2017 and 2050.
Energies 14 03772 g004
Figure 5. Estimated global use of biomass as fuel and feedstock in the 1.5 °C case, 2050.
Energies 14 03772 g005
Figure 6. Changes in the estimated electricity demand in the global chemical and petrochemical sector between the PES and the 1.5 °C case, 2050.
Energies 14 03772 g006
Figure 7. Breakdown of the estimated CO2 emissions reductions in the 1.5 °C case compared to the PES, 2050. Note: the breakdown has been estimated by removing the technology penetration of each measure from the 1.5 °C case to arrive back at the estimated PES results in 2050 based on the following order: demand reduction, energy efficiency, renewable process heat, plastic waste treatment, renewable feedstocks, CCUS and renewable power/process heat electrification. The breakdown and the average mitigation costs may change somewhat if a different order is followed.
Energies 14 03772 g007
Figure 8. Changes in the sector’s CO2 emissions, 2017–2050.
Energies 14 03772 g008
Figure 9. Embodied carbon flows for chemicals and petrochemicals in the PES and the 1.5 °C case in 2050. Figures refer to CO2 equivalent flows.
Energies 14 03772 g009aEnergies 14 03772 g009b
Figure 10. Estimated investment needs in the global chemical and petrochemical sector according to the PES and the 1.5 °C case, 2017–2050.
Energies 14 03772 g010
Figure 11. Breakdown of the estimated total final consumption by country/region in the 1.5 °C case, 2050. Note: RG20 = rest of G20; RW = rest of the world.
Energies 14 03772 g011
Table 1. Global energy and non-energy use for petrochemical production according to the energy statistics, 2017.
[EJ/yr]EnergyNon-EnergyTotalTotal in This Analysis
Coal4.50.14.74.7
Natural gas5.77.713.514.0
Oil2.618.921.618.6
Biomass and waste0.11.01.11.1
Heat2.4-2.42.4
Electricity4.6-4.64.6
Total20.027.847.845.4
Source: Ref. [2] and own analysis. Note: biomass for NEU has been included based on bottom-up information.
Table 2. Estimated global energy and non-energy use per type of product, 2017.
[EJ/yr]
Ammonia6.2
Methanol2.7
High vale chemicals21.2
Carbon black1.0
Total31.1
Source: own analysis.
Table 5. Estimated CO2 mitigation cost in the 1.5 °C case, 2050.
Emissions MitigatedMitigation Cost Range
[Gt CO2/yr][USD/t CO2]
Demand reduction0.760–50
Energy efficiency0.7225–125
Solar process heat0.030–100
Biomass process heat0.130–75
Recycling0.24−50–300
Energy recovery + CCS0.31−50–100
Biobased chemicals0.13−100–400
CCS for combustion and processes1.180–200
H2-based chemicals0.54−100–300
Industry relocation0.050–50
Renewable power0.73−25–25
Total4.79−20–150
Table 6. Indicators for energy systems relevance of the chemical and petrochemical sector.
Unit20172050 PES2050 1.5 °C Case1.5 °C case % World Demand 2050
Oil demand[mbd]7.118.15.260
Gas demand[BCM]525134335711
Biomass use[Mt/yr]5.19.0132015
BECCS 1[Mt/yr]0.00.05506.5
Fossil CCS 2[Mt/yr]0.00.094011
Electricity demand 3[TWh/yr]1278264523073.2
Green hydrogen demand[Mt/yr]0.00.021034
Hydrogen electrolyser capacity 4[GW]0.00.0246848
Heat pumps[GW] 7330
Solar thermal[mln m2] 1905
1 share of total global CCS. 2 share of total global CCS. 3 excludes green hydrogen production (10 PWh/yr). 4 chlorine production 1 Mt green hydrogen by-product today excluded.
Publisher’s Note: MDPI stays neutral with regard to jurisdictional claims in published maps and institutional affiliations.