
Optimization of Wind Energy Battery Storage Microgrid by Division Algorithm Considering Cumulative Exergy Demand for Power-Water Cogeneration


Abstract
:1. Introduction
2. Materials and Methods
2.1. Modeling of Wind Turbine (WT)
2.2. Modeling of Battery Bank Storage (BBS)
2.3. Modeling of Seawater Reverse Osmosis Desalination (SWROD)
2.4. Economic Modeling
2.5. Modeling Cumulative Exergy Demand (CExD)
2.6. Modeling the System Reliability
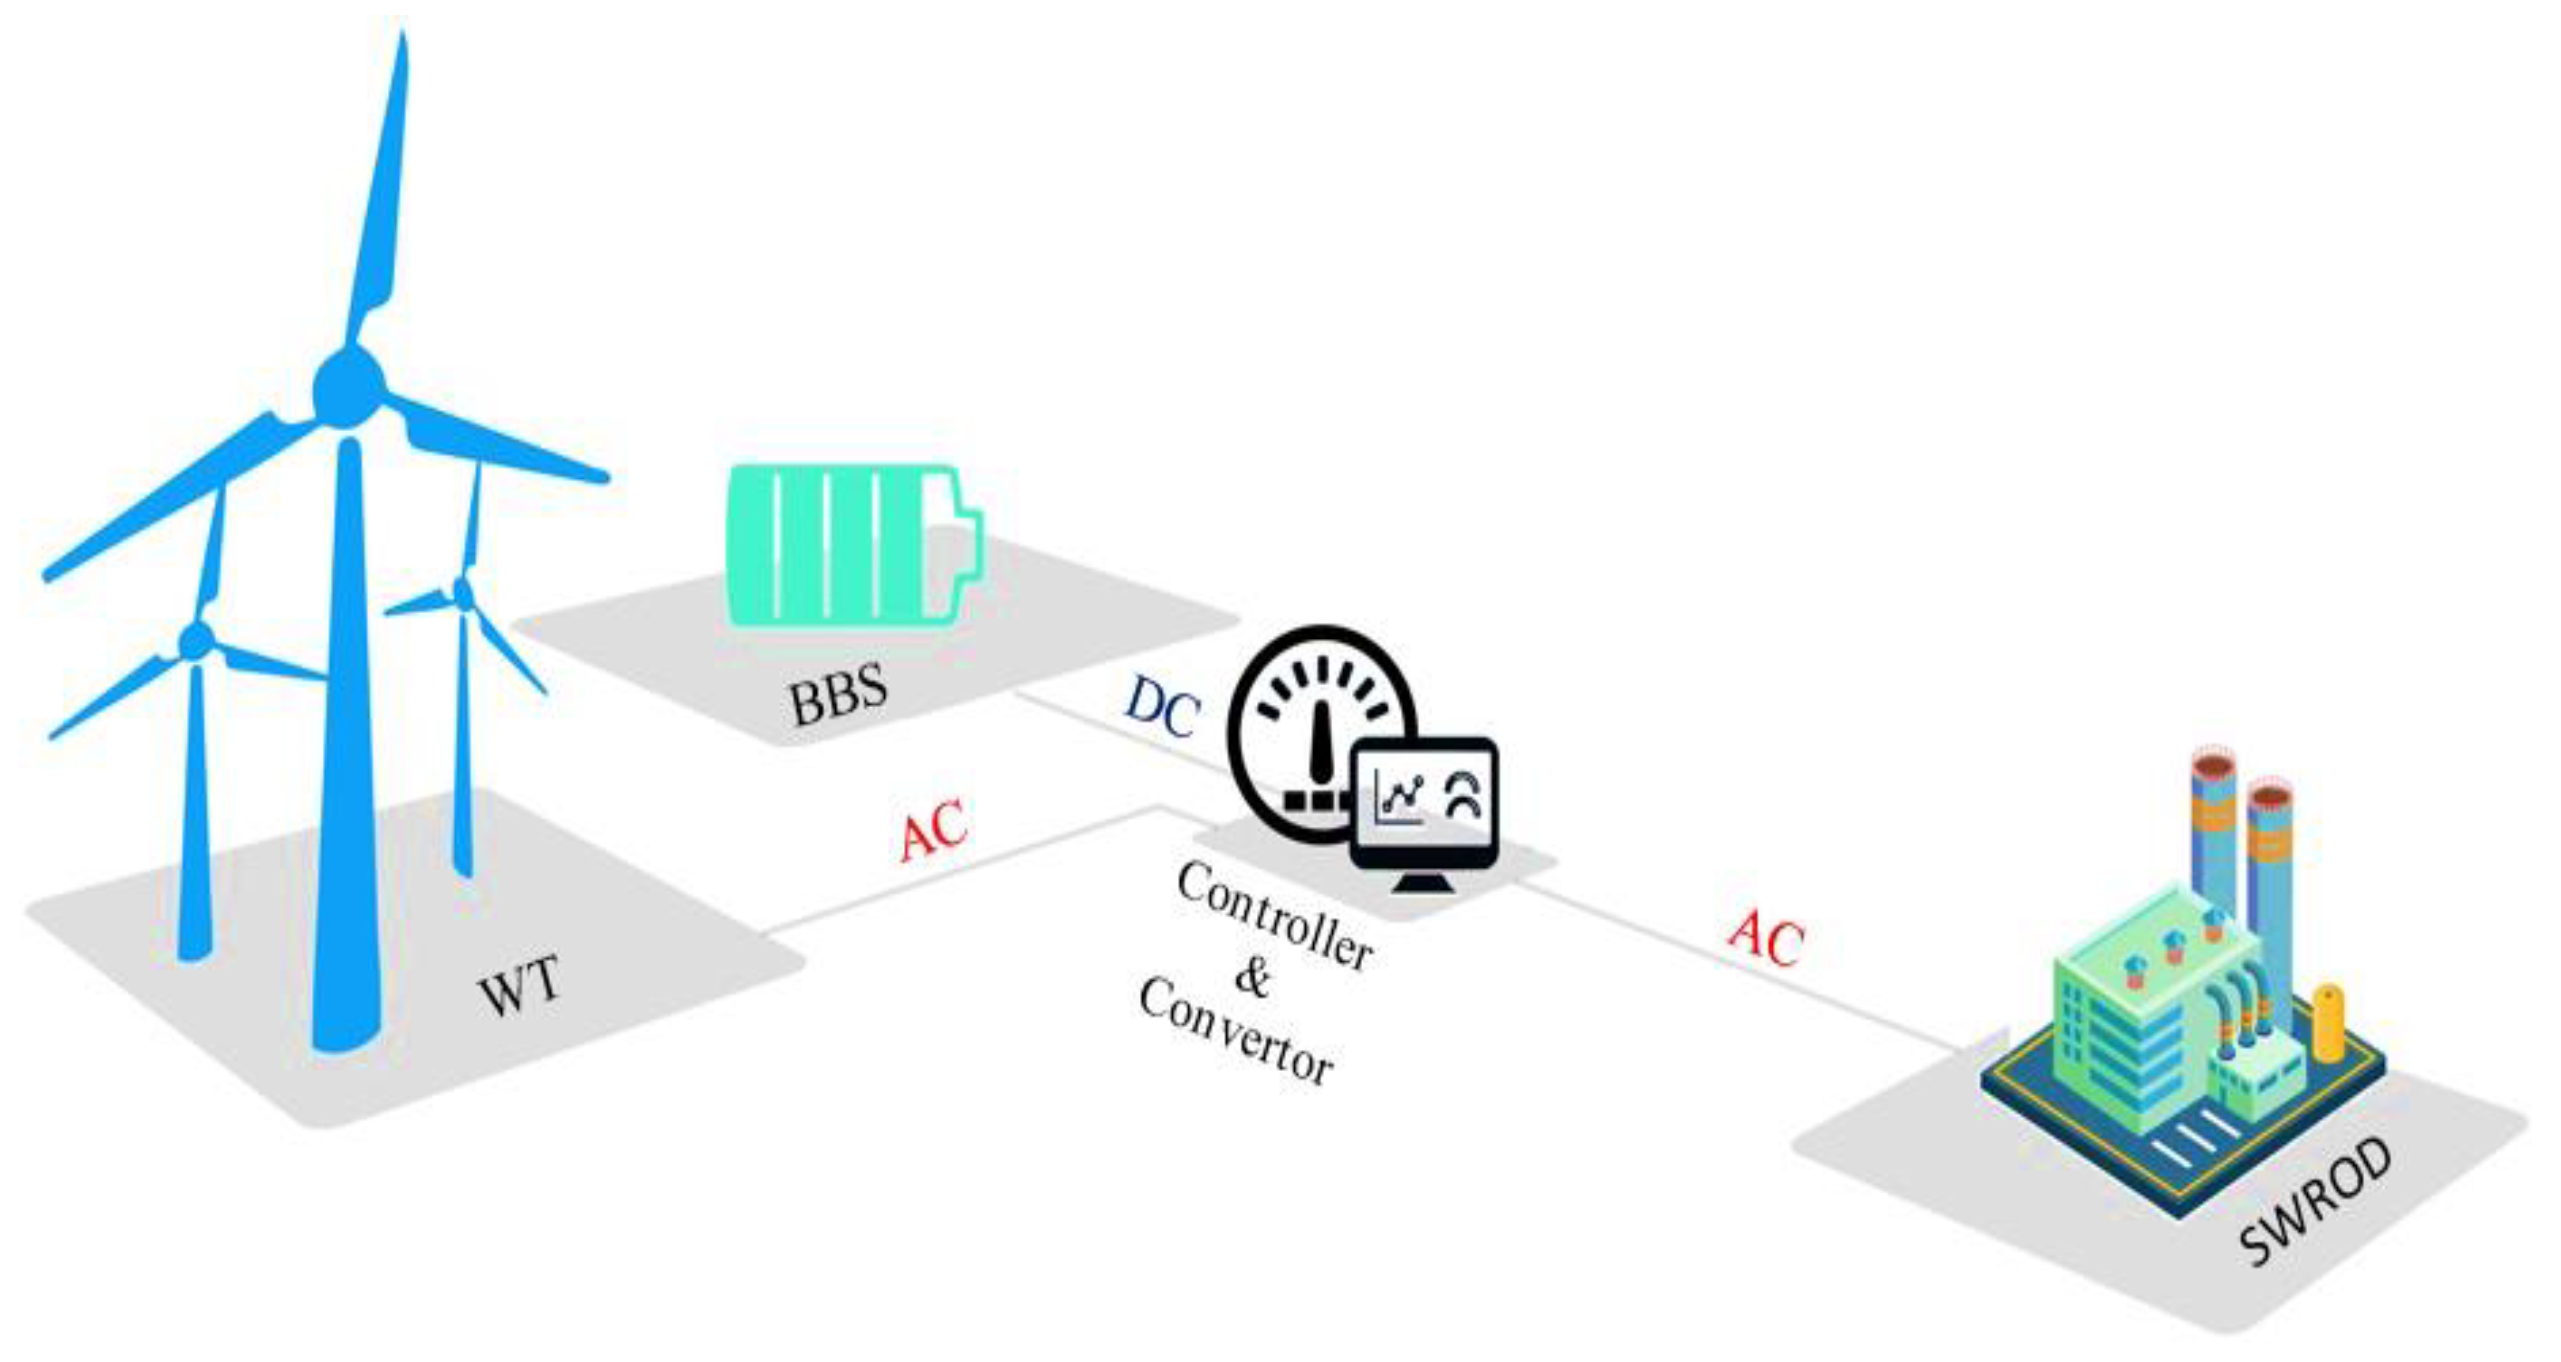
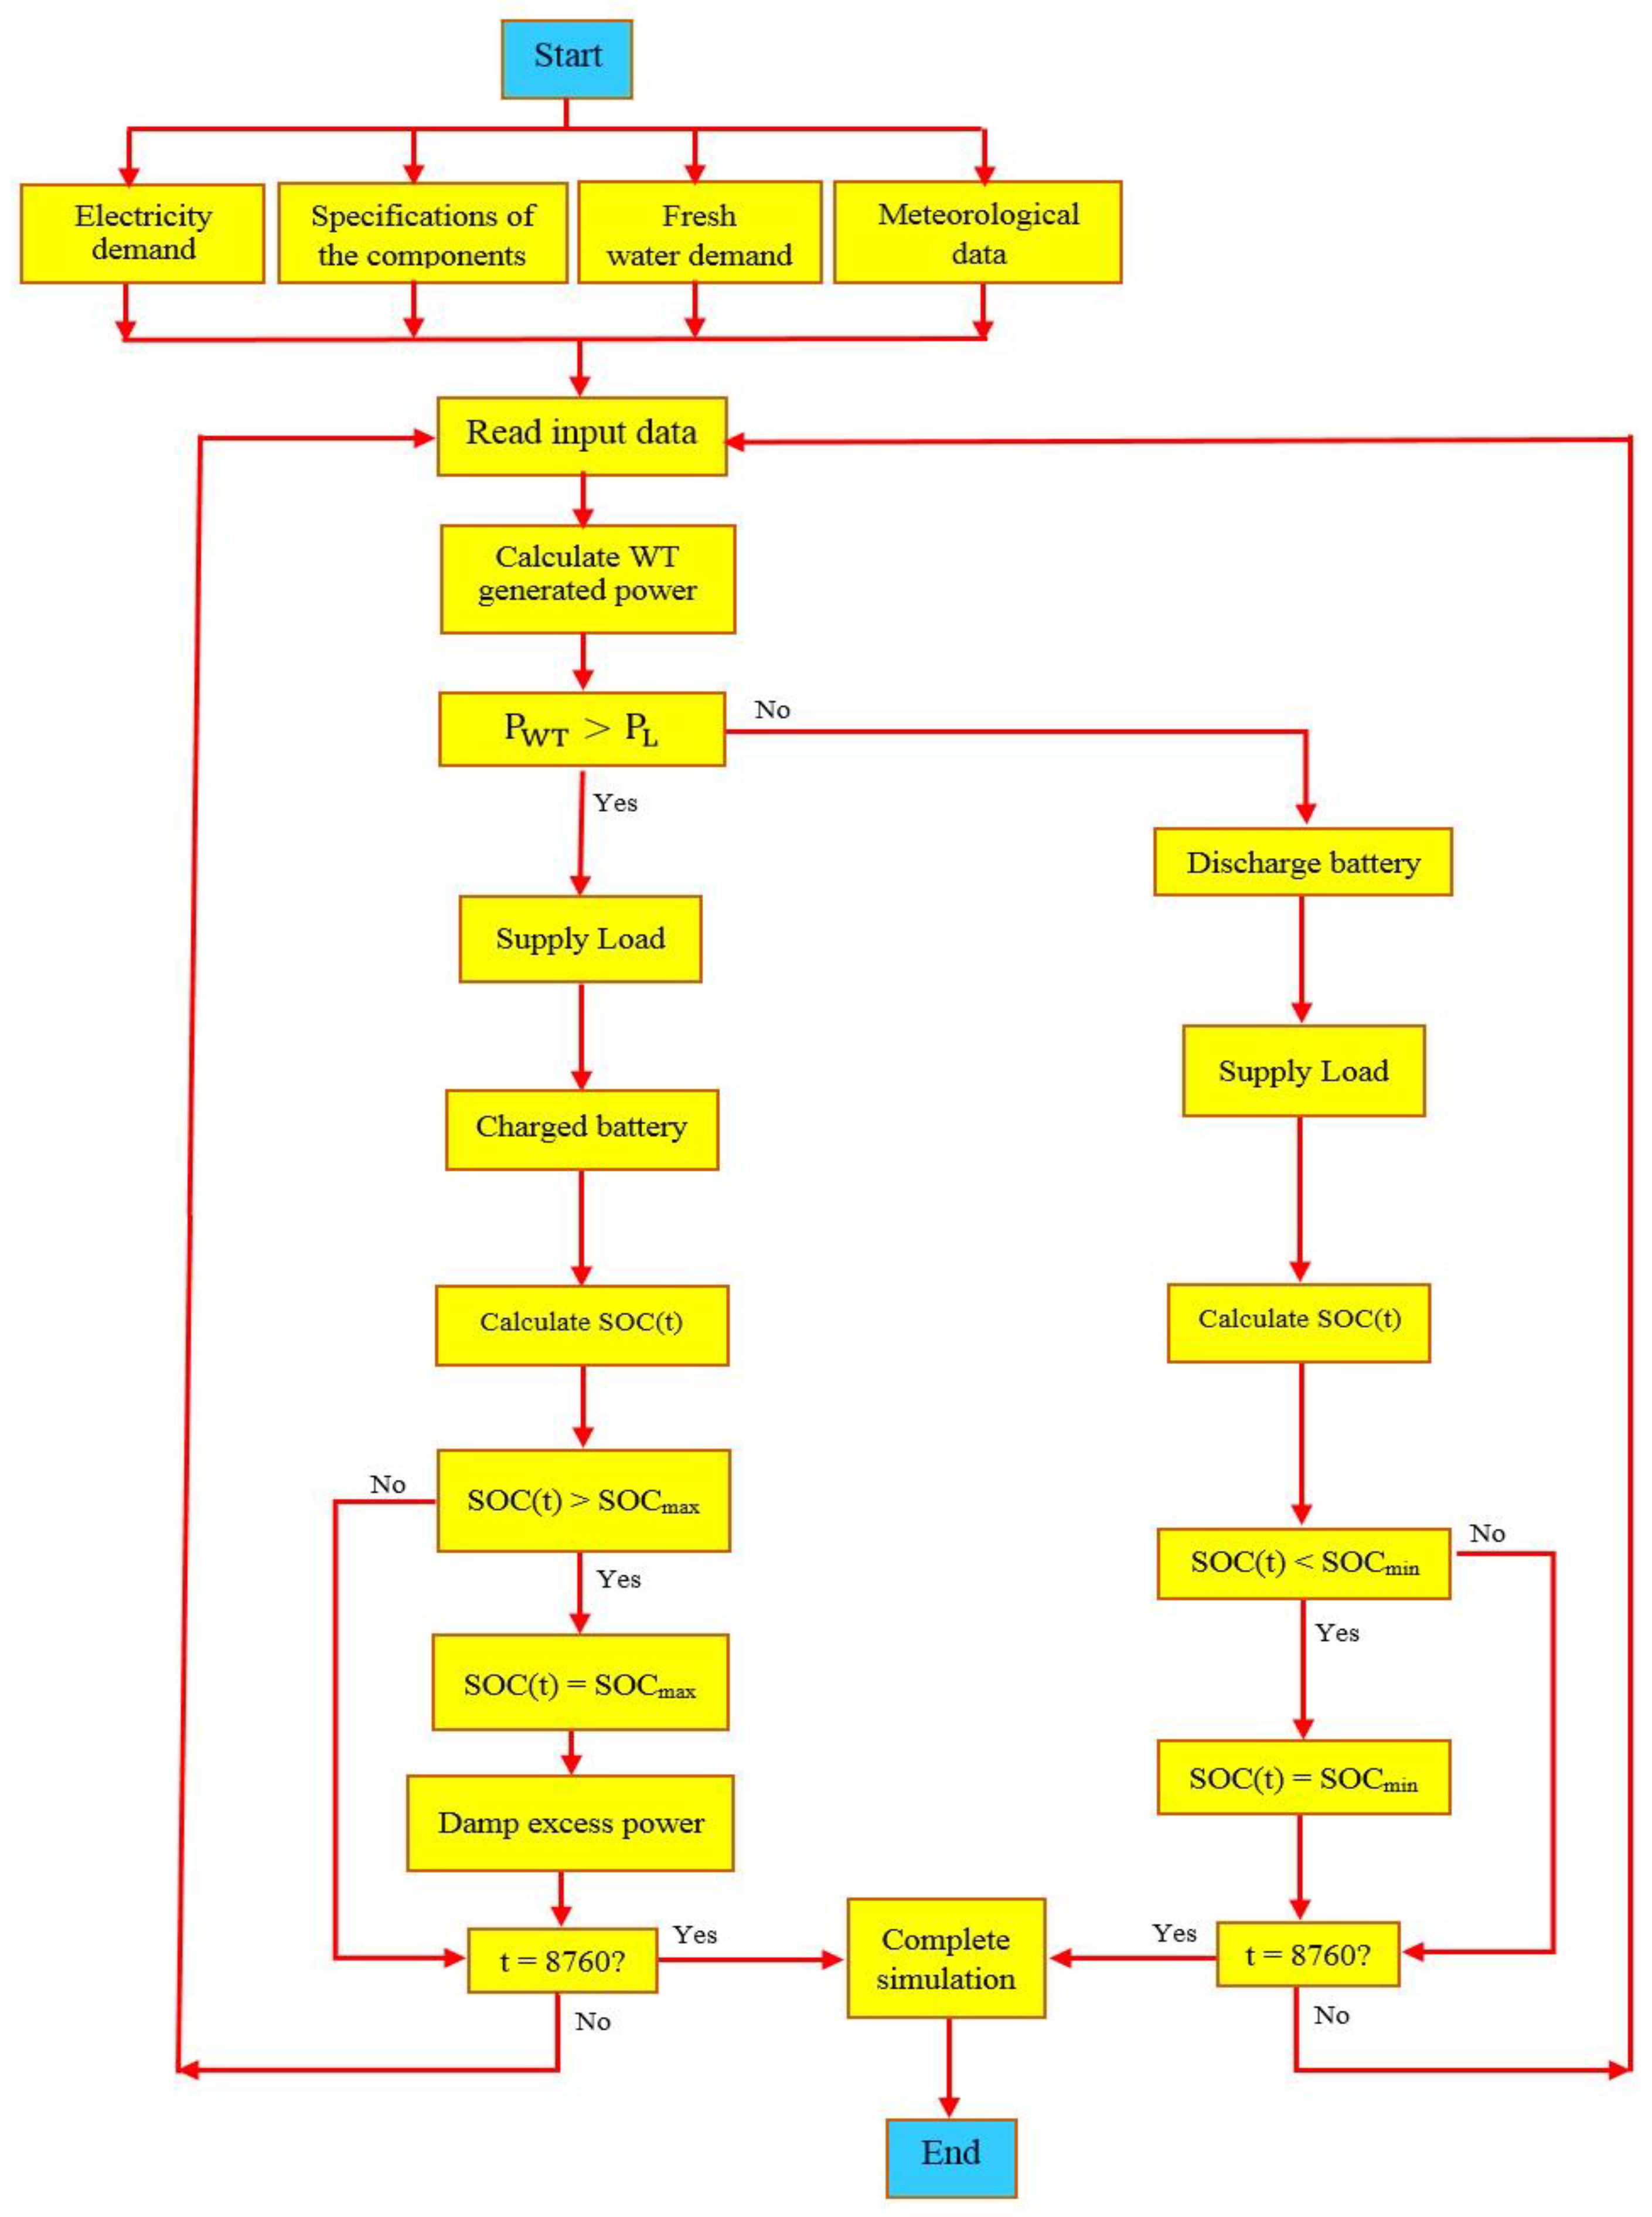
2.7. Power Control System
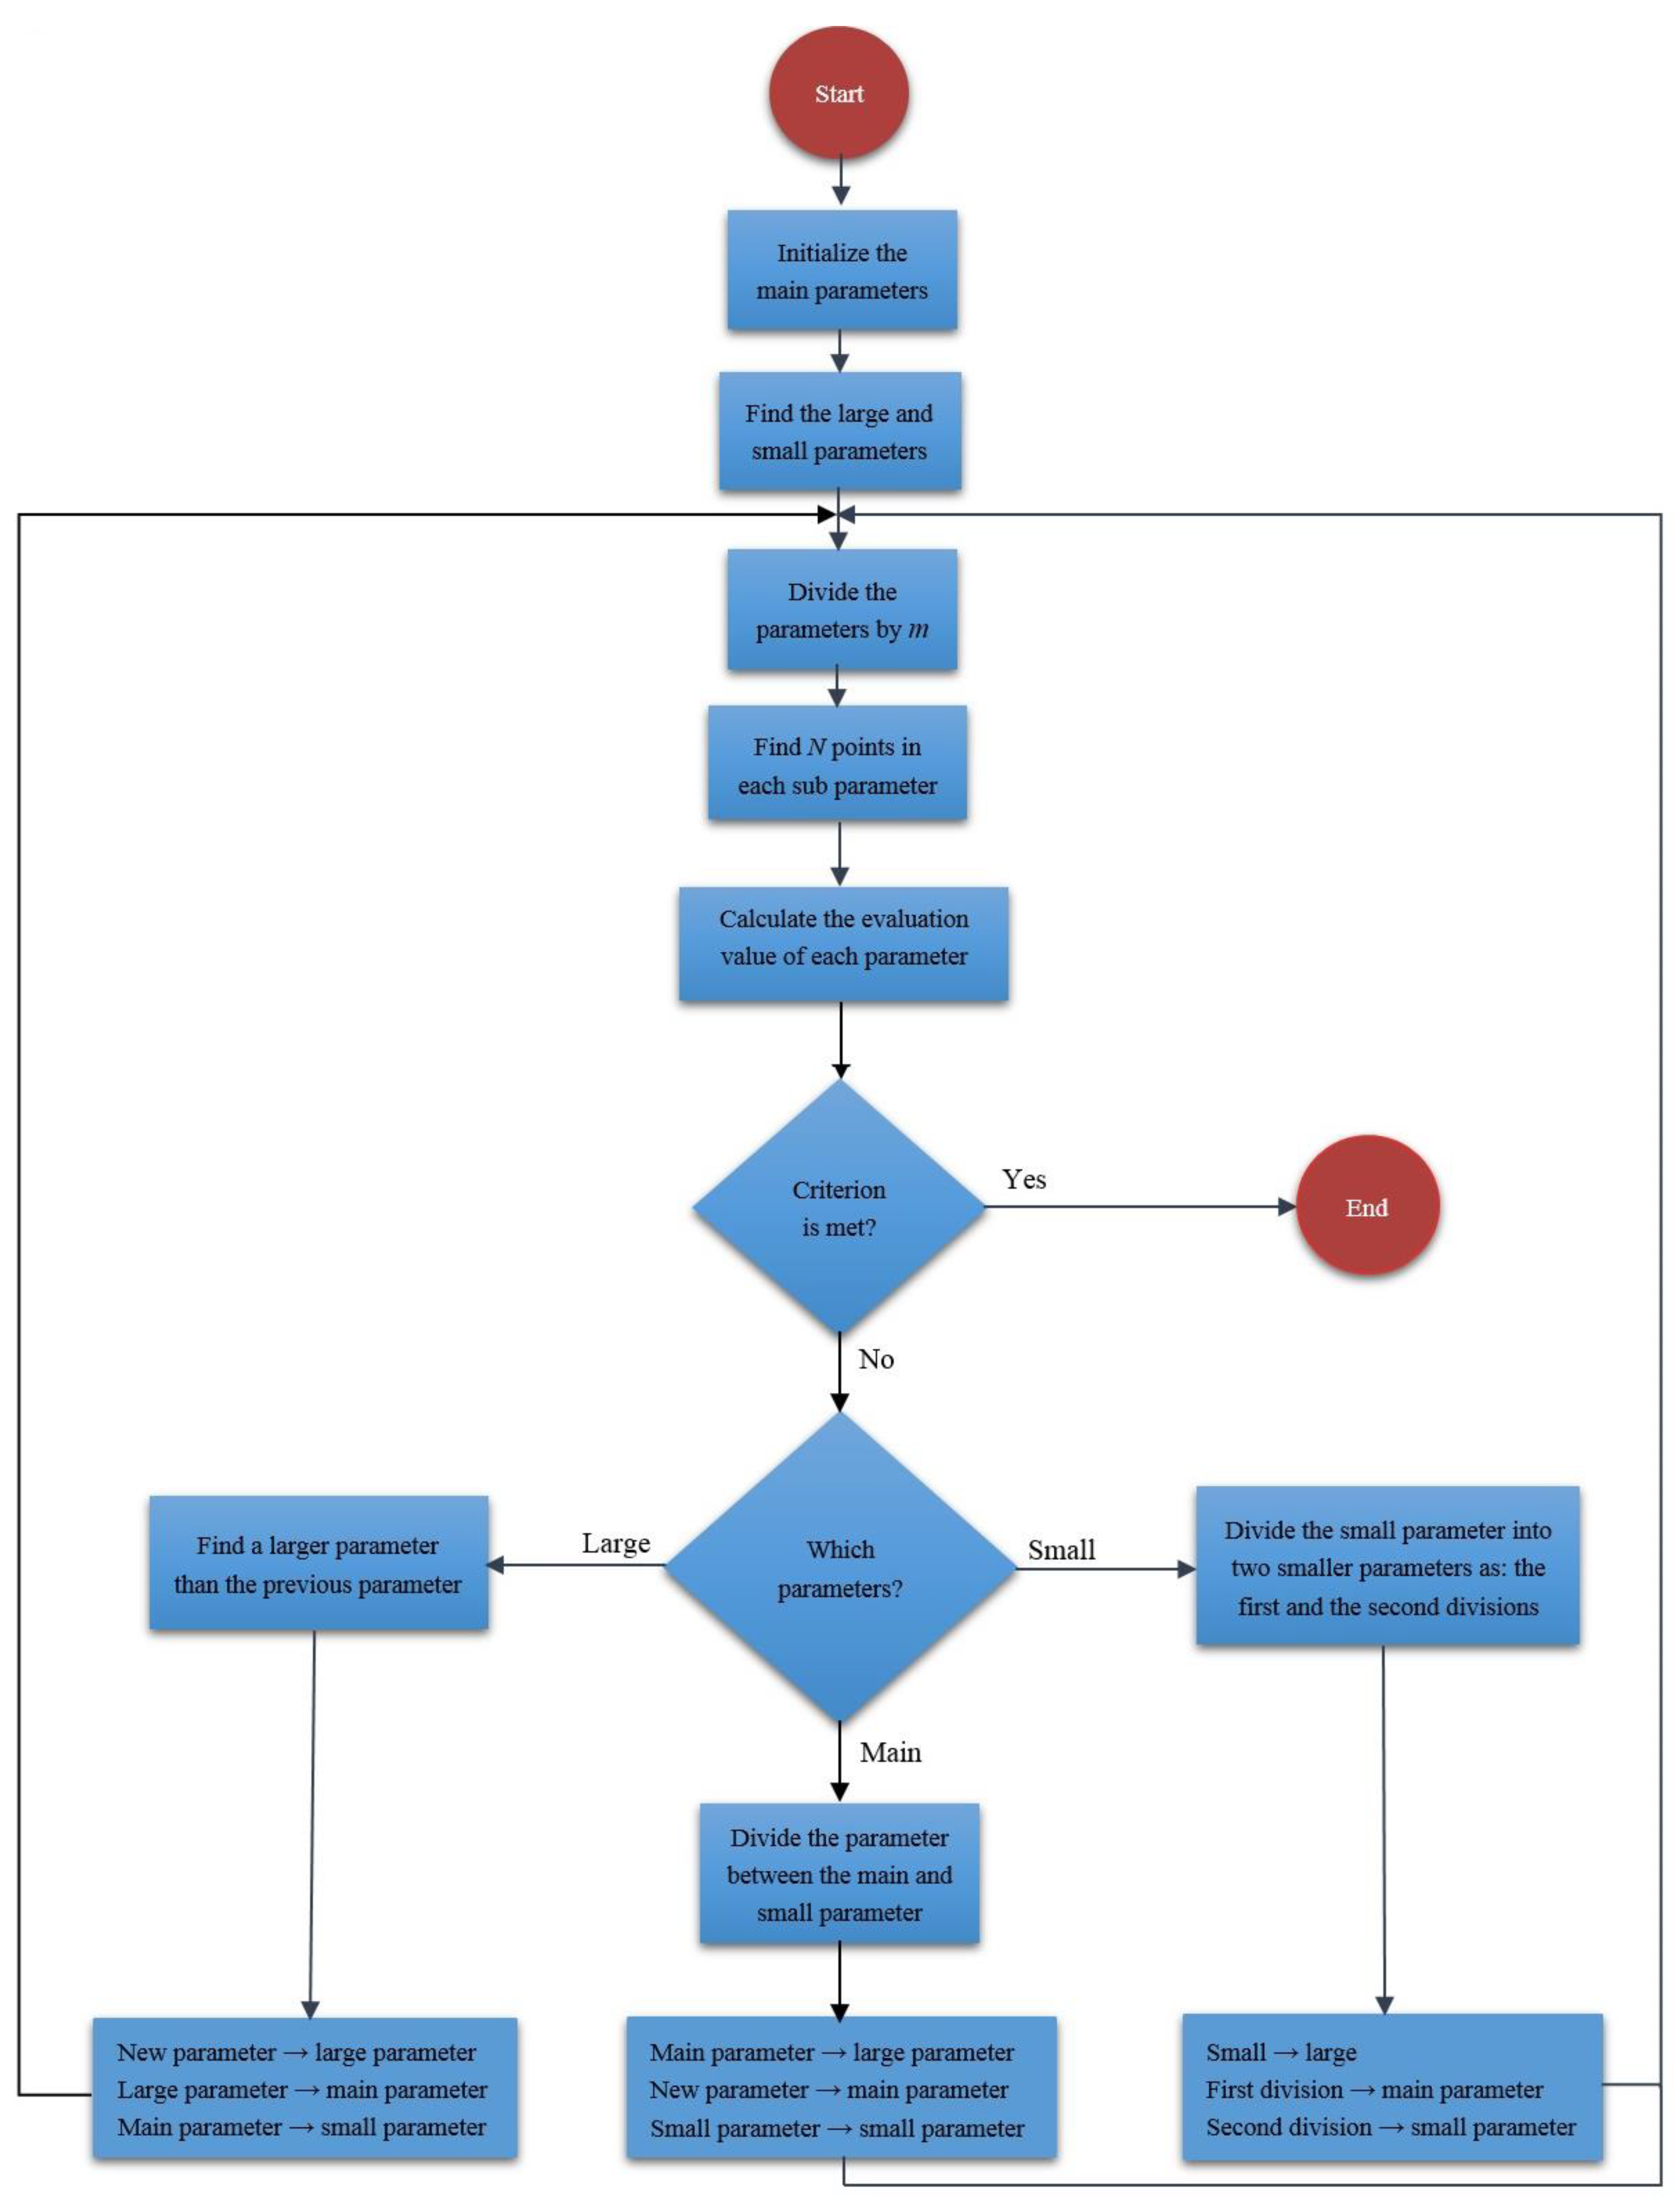
2.8. Optimization Problem
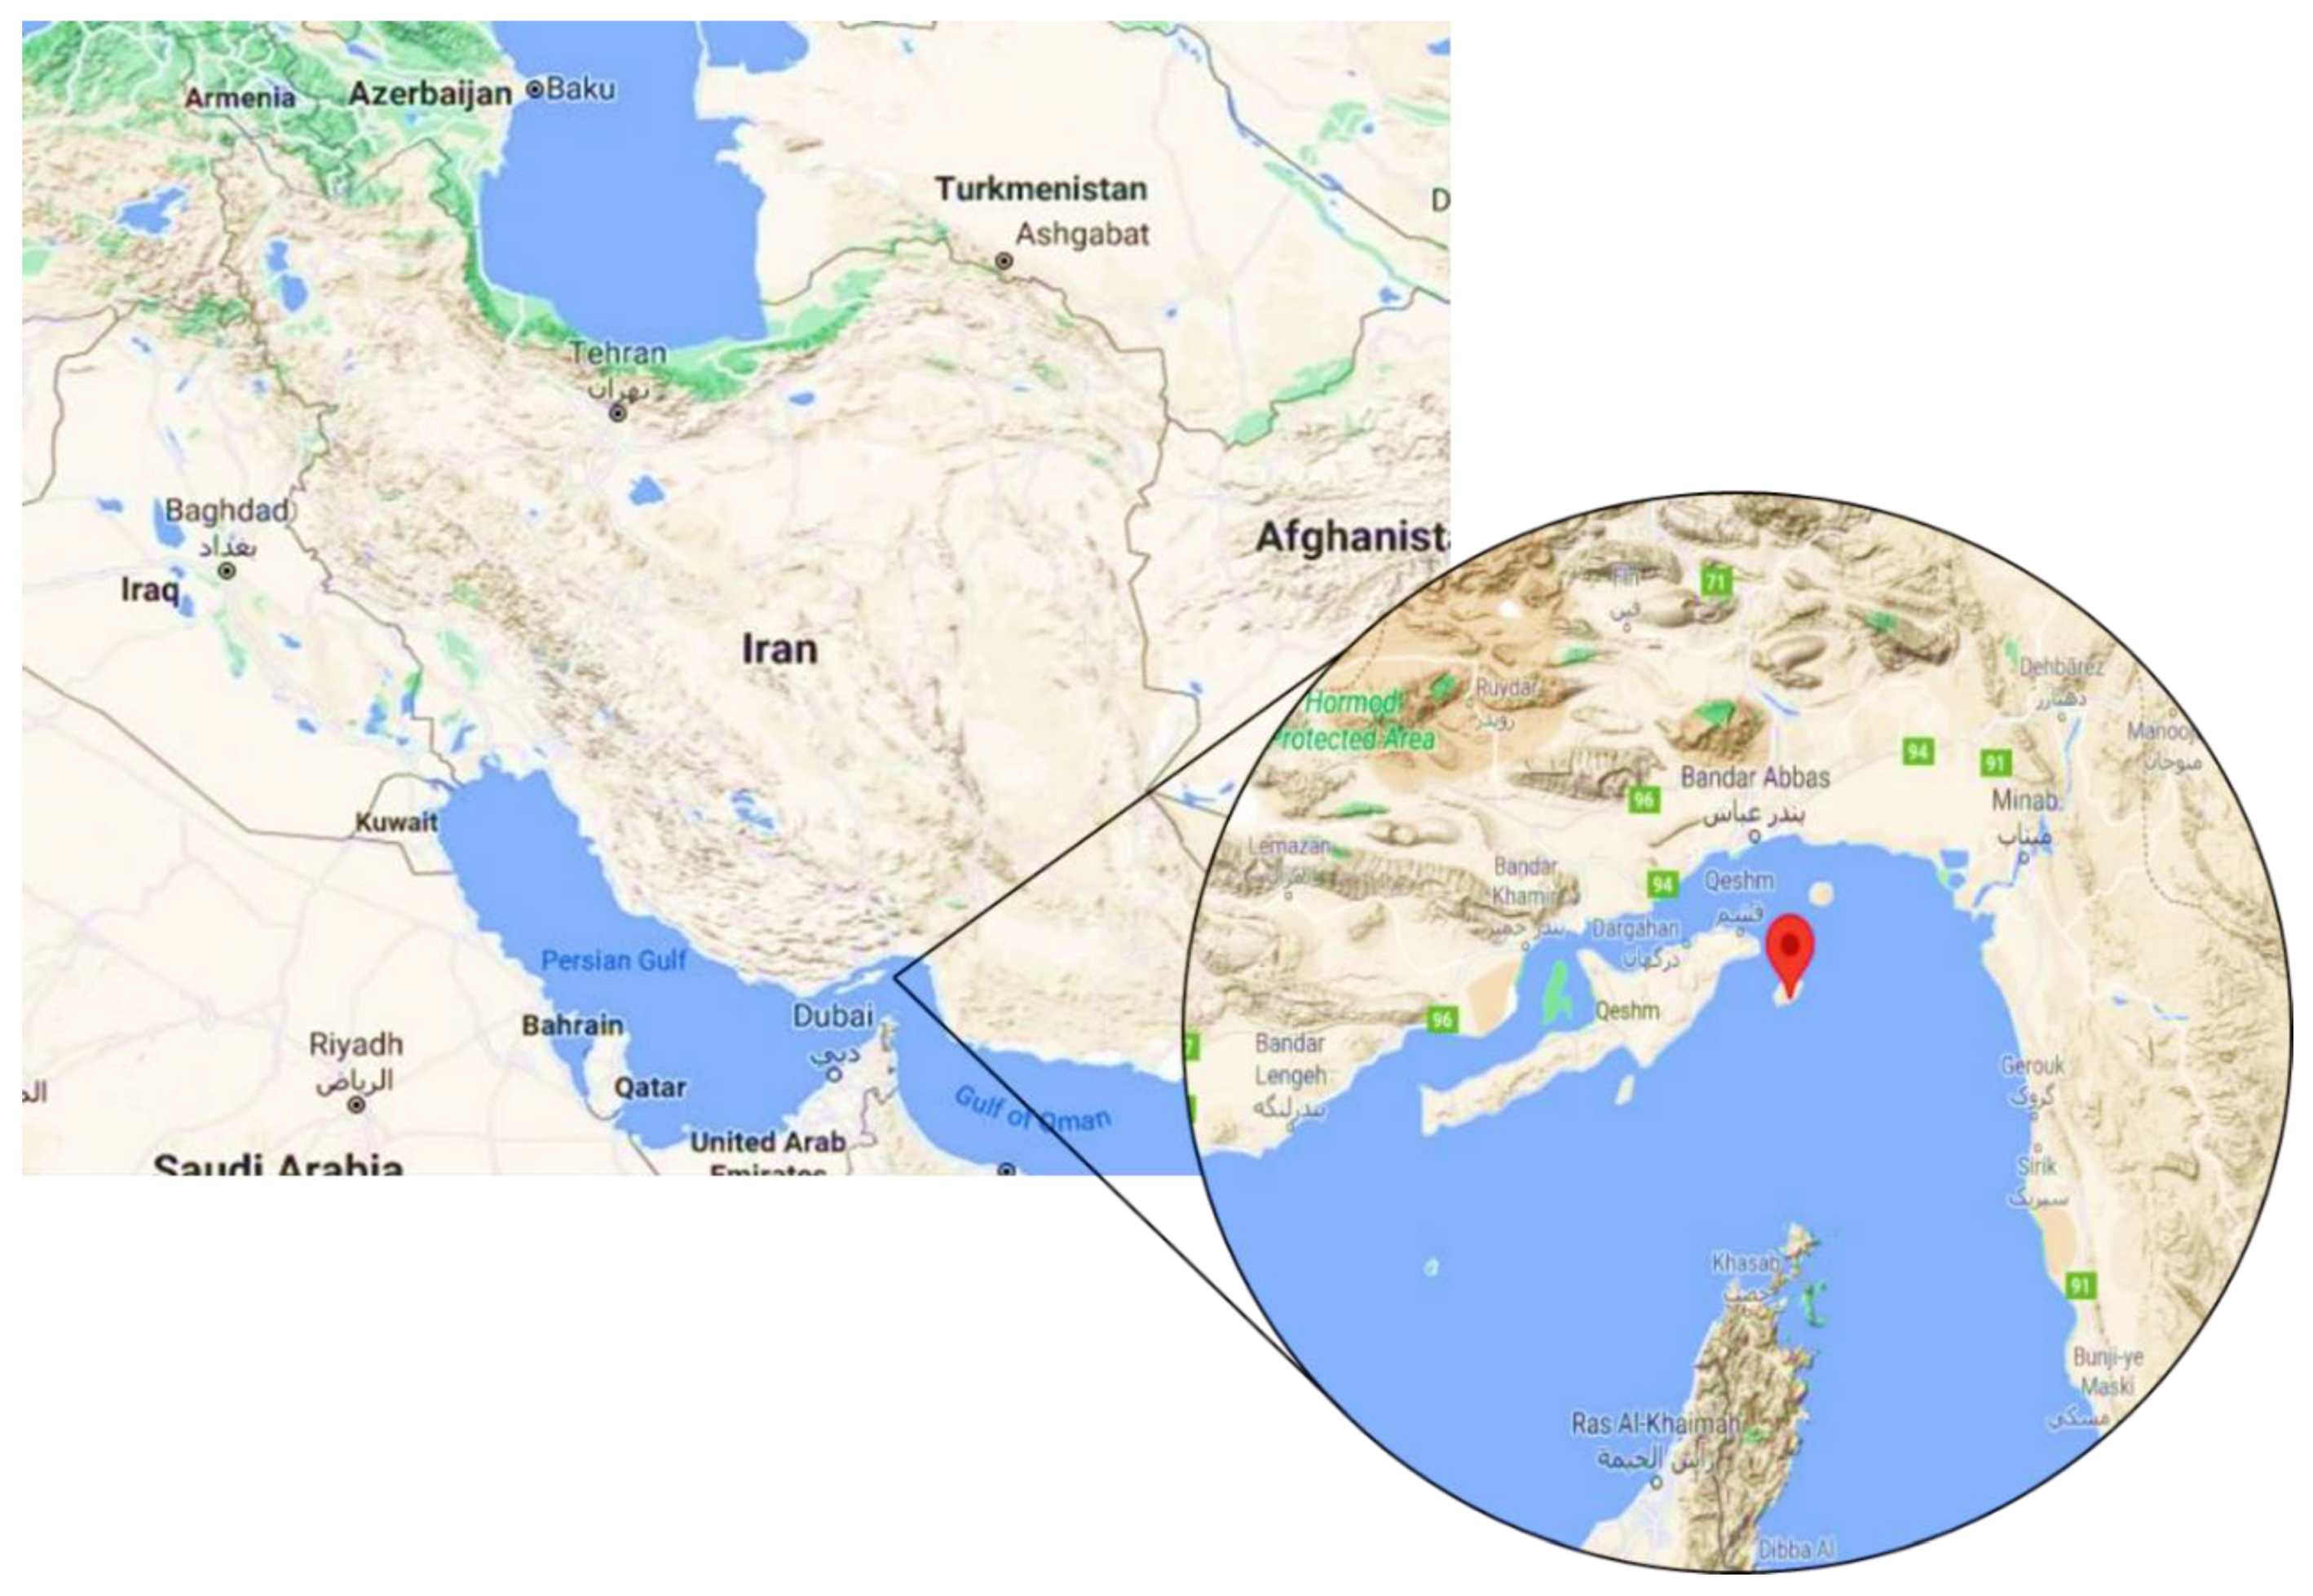
2.9. Characteristics of Case Study
3. Results and Discussion
4. Conclusions and Further Works
Author Contributions
Funding
Institutional Review Board Statement
Informed Consent Statement
Data Availability Statement
Conflicts of Interest
Nomenclature
| AWT | Total area swept by the WT generator blades (m2) |
| CaWD | Capacity of SWRO desalination system (m3/day) |
| CBBS | Battery bank cost ($) |
| CC | Capital cost ($) |
| CCH | Cost of chemicals ($/m3) |
| CConv/Inv | Converter/inverter price ($) |
| CDP | Cumulative degree of perfection |
| CED | Cumulative energy demand |
| CExD | Cumulative exergy demand |
| CMnt-BBS | Annual maintenance cost of the battery ($/year) |
| CMnt-Conv/Inv | Annual maintenance cost of converter/inverter ($/year) |
| CMnt-SWROD | Maintenance cost of SWROD system ($/m3) |
| CMnt-WT | Annual maintenance costs of wind turbine ($/year) |
| CMR | membrane replacement cost ($/m3) |
| CP | Wind power coefficient |
| CRF | Capital recovery factor |
| CSWROD | Cost of SWROD unit per m3/day ($/m3/day) |
| CWT | Wind turbine price ($) |
| CWTa | Water tank cost ($/m3) |
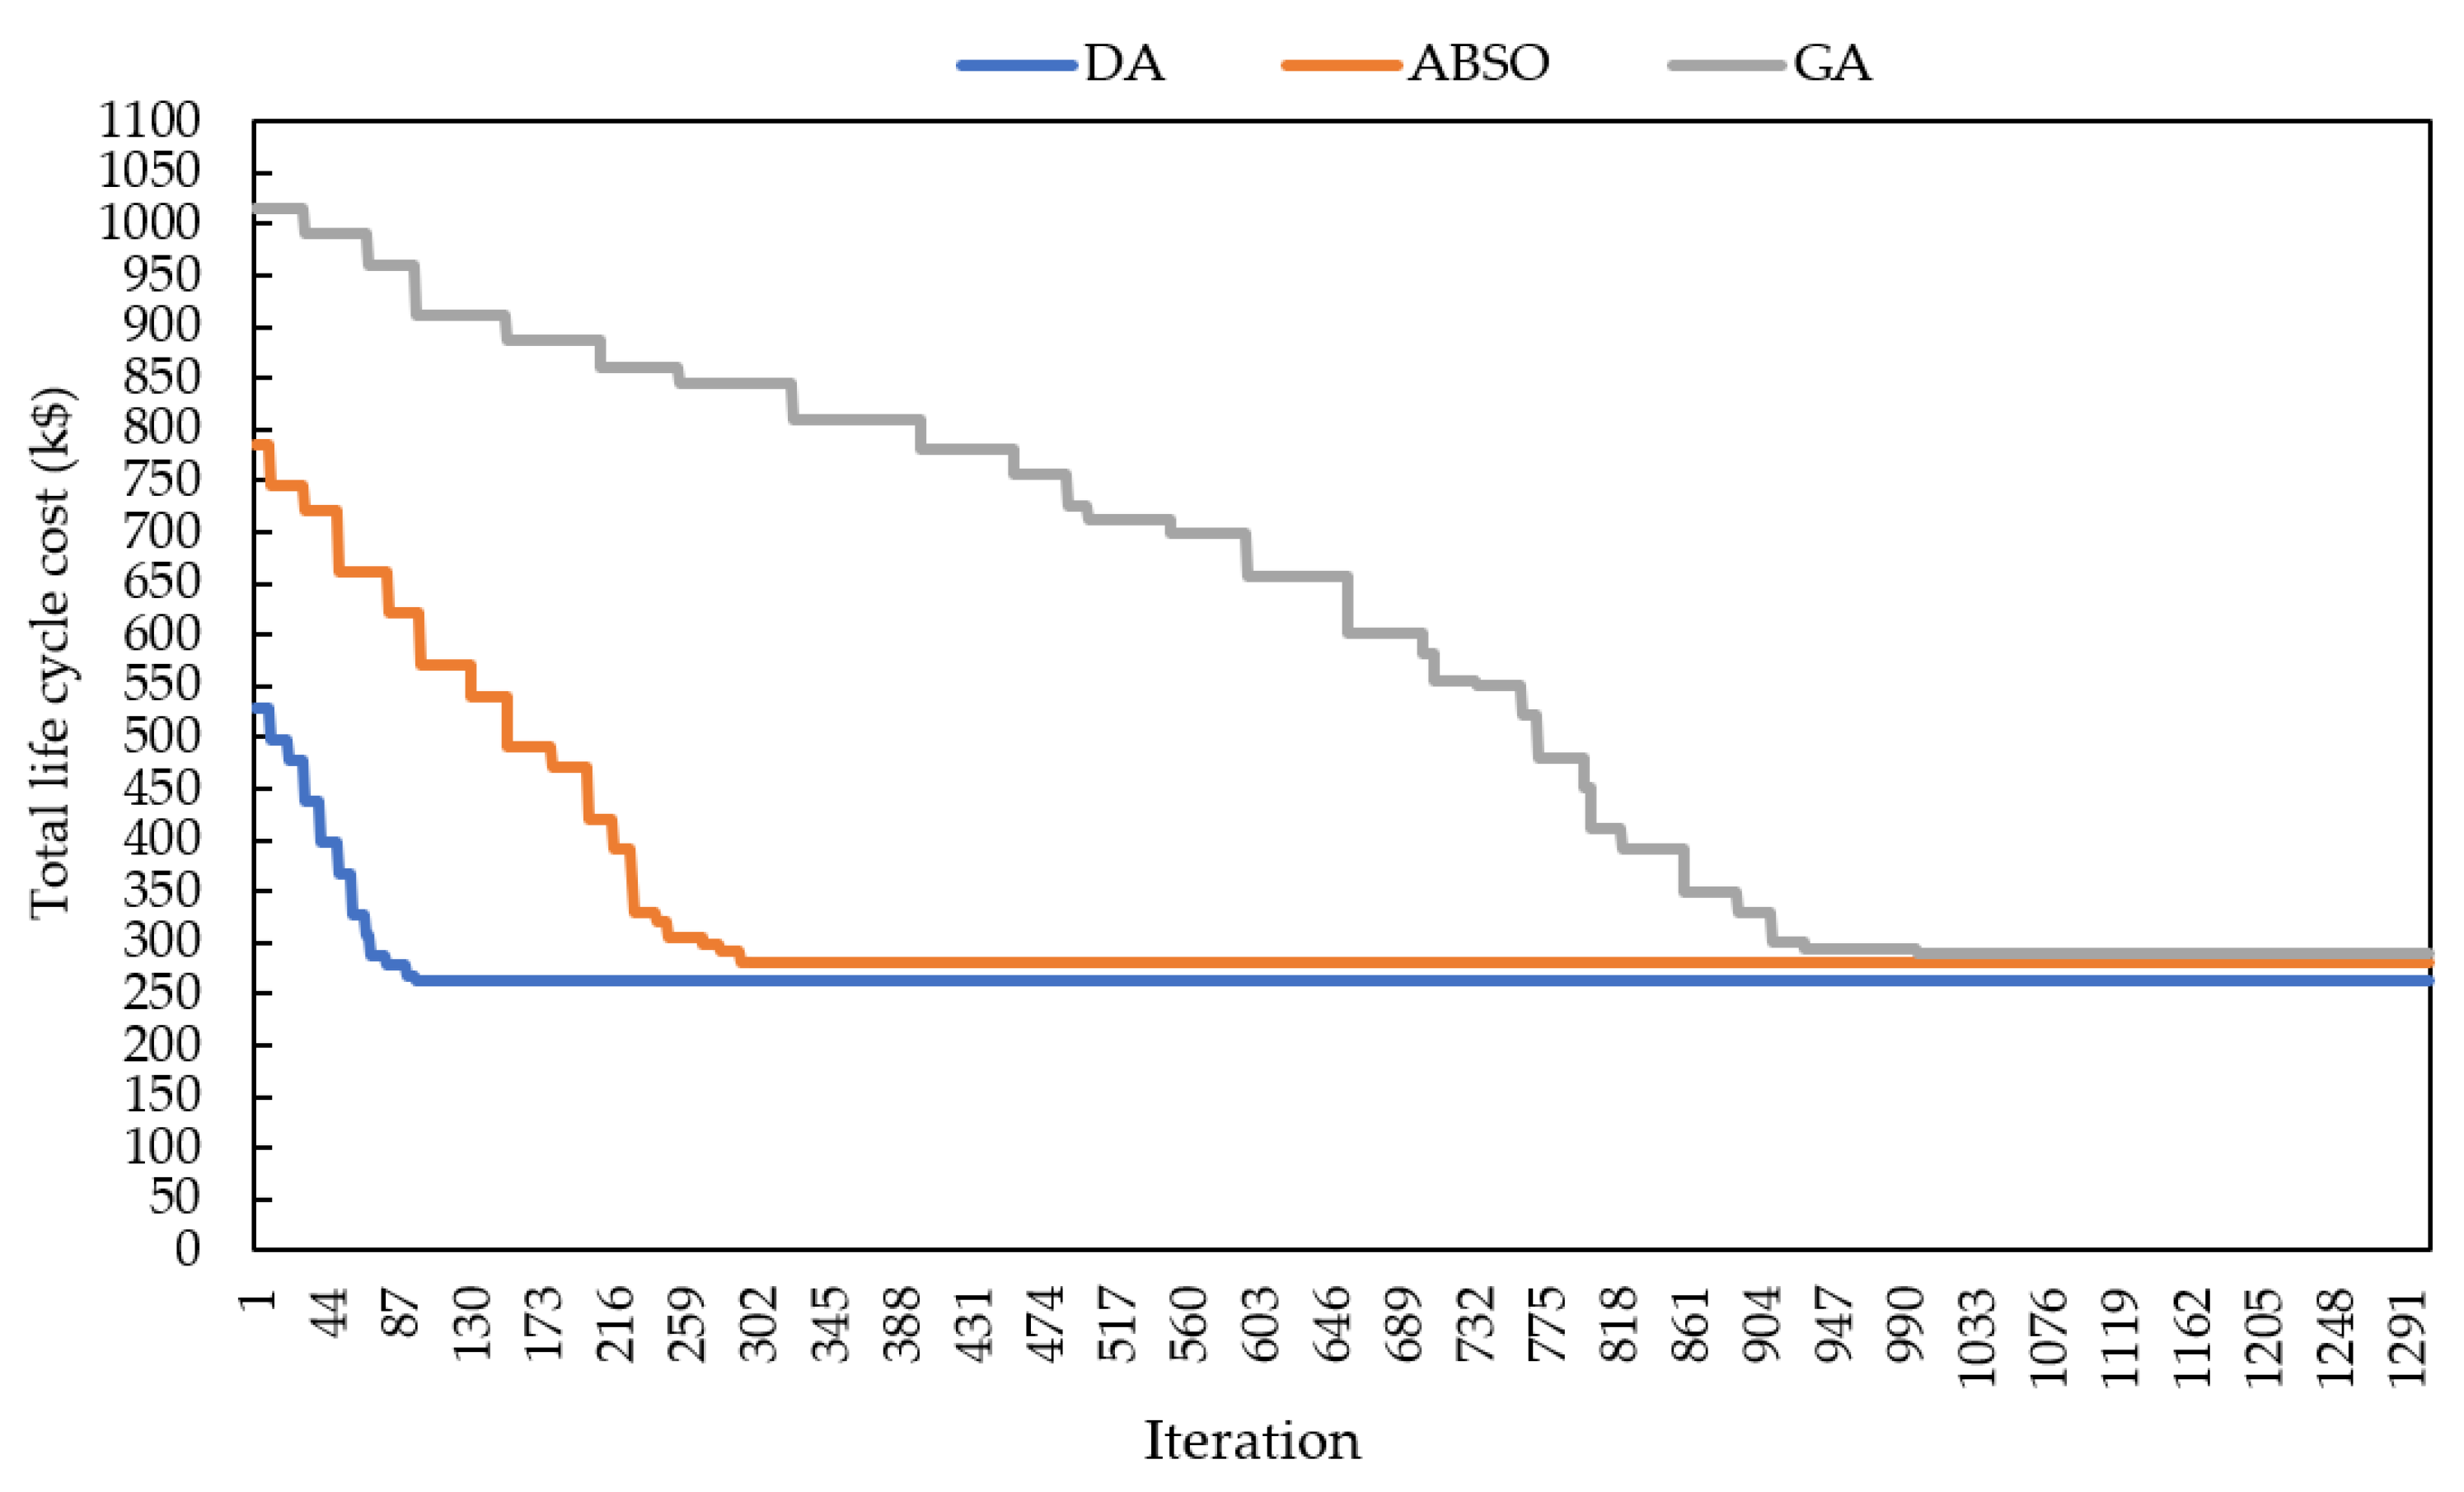
| DA | Division algorithm |
| DOD | Maximum depth of discharge (%) |
| DWD | Daily freshwater demand (m3/day) |
| EIA | Energy information administration |
| GA | Genetic algorithm |
| GHG | Greenhouse gases |
| HWD | Hourly water demand (m3/h) |
| i | Interest rate (%) |
| LPSP | Loss of power supply probability (%) |
| LPSPm | Maximum allowable LPSP (%) |
| MC | Maintenance cost ($) |
| n | Project lifetime (year) |
| NBBS | Number of batteries |
| ƞbc | Charge efficiency of the battery bank (%) |
| ƞbf | Discharging efficiency of the battery bank (%) |
| ƞInv | Converter/inverter efficiency (%) |
| NMe | Number of membrane replacements per year |
| NWT | Number of wind turbine |
| ƞWT | Wind turbine reference efficiency (%) |
| PD | Desalination installed power (kW) |
| PDEM | Power consumption of SWROD plant (kW) |
| PDI | Nominal load of the SWROD plant (kW) |
| PInv | Nominal converter/inverter power (kW) |
| PL | Annual load demand (kW) |
| PMD | Minimum load of the SWROD plant (kW) |
| Pr | Rated power of the wind turbine (kW) |
| PWBBS | Factor of payment present worth of battery |
| PWConv/Inv | Factor of payment present worth of Conv/Inv |
| PWT | Output power of wind turbine (kW) |
| SBBS | Nominal capacity of battery bank (kWh) |
| SDC | Specific energy consumption (kWh/m3) |
| SOC(t) | State of the battery charge at the time t (kWh) |
| SOC(t−1) | State of the battery charge at the time t−1(kWh) |
| SOCmax | Maximum charge of the battery bank (kWh) |
| SOCmin | Minimum charge of the battery bank (kWh) |
| TCCH | Cost of chemicals of ROD unit ($) |
| TCMR | Membrane replacement cost of ROD unit ($) |
| TLCC | Total life cycle cost ($) |
| Vci | Cut-in wind speed (m/s) |
| Vco | Cut-out wind speed (m/s) |
| Vr | Nominal wind speed (m/s) |
| VWTa | Fresh water tank volumetric capacity (m3) |
| ηPC | Power conditioning efficiency (%) |
| ηr | Reducer efficiency (%) |
| ρa | Air density (kg/m3) |
| σ | Hourly self-discharge rate (%) |
References
- Ahmed, F.E.; Hashaikeh, R.; Diabat, A.; Hilal, N. Mathematical and optimization modelling in desalination: State-of-the-art and future direction. Desalination 2019, 469, 114092. [Google Scholar] [CrossRef]
- Abid, A.; Jamil, M.A.; us Sabah, N.; Farooq, M.U.; Yaqoob, H.; Khan, L.A.; Shahzad, M.W. Exergoeconomic optimization of a forward feed multi-effect desalination system with and without energy recovery. Desalination 2021, 499, 114808. [Google Scholar] [CrossRef]
- Behzadi, A.; Habibollahzade, A.; Zare, V.; Ashjaee, M. Multi-objective optimization of a hybrid biomass-based SOFC/GT/double effect absorption chiller/RO desalination system with CO2 recycle. Energy Convers. Manag. 2019, 181, 302–318. [Google Scholar] [CrossRef]
- Abdelshafy, A.M.; Hassan, H.; Jurasz, J. Optimal design of a grid-connected desalination plant powered by renewable energy resources using a hybrid PSO-GWO approach. Energy Convers. Manag. 2018, 173, 331–347. [Google Scholar] [CrossRef]
- Ali, A.; Tufa, R.A.; Macedonio, F.; Curcio, E.; Drioli, E. Membrane technology in renewable-energy-driven desalination. Renew. Sustain. Energy Rev. 2018, 81, 1–21. [Google Scholar] [CrossRef]
- Mehrjerdi, H. Modeling, integration, and optimal selection of the turbine technology in the hybrid wind-photovoltaic renewable energy system design. Energy Convers. Manag. 2020, 205, 112350. [Google Scholar] [CrossRef]
- Tito, S.R.; Lie, T.T.; Anderson, T.N. Optimal sizing of a wind-photovoltaic-battery hybrid renewable energy system considering socio-demographic factors. Sol. Energy 2016, 136, 525–532. [Google Scholar] [CrossRef] [Green Version]
- McManus, M.C. Environmental consequences of the use of batteries in low carbon systems: The impact of battery production. Appl. Energy 2012, 93, 288–295. [Google Scholar] [CrossRef] [Green Version]
- Bahlawan, H.; Poganietz, W.-R.; Spina, P.R.; Venturini, M. Cradle-to-gate life cycle assessment of energy systems for residential applications by accounting for scaling effects. Appl. Therm. Eng. 2020, 171, 115062. [Google Scholar] [CrossRef]
- Alvarenga, R.A.F.; de Oliveira Lins, I.; de Almeida Neto, J.A. Evaluation of abiotic resource LCIA methods. Resources 2016, 5, 13. [Google Scholar] [CrossRef]
- Valderrama, C.; Granados, R.; Cortina, J.L.; Gasol, C.M.; Guillem, M.; Josa, A. Implementation of best available techniques in cement manufacturing: A life-cycle assessment study. J. Clean. Prod. 2012, 25, 60–67. [Google Scholar] [CrossRef]
- Behrooznia, L.; Sharifi, M.; Alimardani, R.; Mousavi-Avval, S.H. Sustainability analysis of landfilling and composting-landfilling for municipal solid waste management in the north of Iran. J. Clean. Prod. 2018. [Google Scholar] [CrossRef]
- Bösch, M.E.; Hellweg, S.; Huijbregts, M.A.J.; Frischknecht, R. Applying cumulative exergy demand (CExD) indicators to the ecoinvent database. Int. J. Life Cycle Assess. 2007, 12, 181. [Google Scholar] [CrossRef]
- Iskin, I.; Taha, R.A.; Daim, T.U. Exploring the adoption of alternative energy technologies: A literature review. Int. J. Sustain. Soc. 2013, 5, 43–61. [Google Scholar] [CrossRef]
- Irfan, M.; Hao, Y.; Ikram, M.; Wu, H.; Akram, R.; Rauf, A. Assessment of the public acceptance and utilization of renewable energy in Pakistan. Sustain. Prod. Consum. 2021, 27, 312–324. [Google Scholar] [CrossRef]
- Ekhteraei Toosi, H.; Merabet, A.; Swingler, A. Dual layer power scheduling strategy for EV ESS controllable load in bi directional dynamic markets for low cost implementation. Int. Trans. Electr. Energy Syst. 2021, 31, e12681. [Google Scholar] [CrossRef]
- Zhao, G.; Nielsen, E.R.; Troncoso, E.; Hyde, K.; Romeo, J.S.; Diderich, M. Life cycle cost analysis: A case study of hydrogen energy application on the Orkney Islands. Int. J. Hydrog. Energy 2019, 44, 9517–9528. [Google Scholar] [CrossRef]
- Zhang, W.; Maleki, A.; Rosen, M.A.; Liu, J. Optimization with a simulated annealing algorithm of a hybrid system for renewable energy including battery and hydrogen storage. Energy 2018, 163, 191–207. [Google Scholar] [CrossRef]
- Mayer, M.J.; Szilágyi, A.; Gróf, G. Environmental and economic multi-objective optimization of a household level hybrid renewable energy system by genetic algorithm. Appl. Energy 2020, 269, 115058. [Google Scholar] [CrossRef]
- Rathish, R.J.; Mahadevan, K.; Selvaraj, S.K.; Booma, J. Multi-objective evolutionary optimization with genetic algorithm for the design of off-grid PV-wind-battery-diesel system. Soft Comput. 2021, 25, 3175–3194. [Google Scholar] [CrossRef]
- Pillai, A.C.; Thies, P.R.; Johanning, L. Development of a Multi-Objective Genetic Algorithm for the Design of Offshore Renewable Energy Systems. In Proceedings of the World Congress of Structural and Multidisciplinary Optimisation, Braunschweig, Germany, 5–9 June 2017; pp. 2013–2026. [Google Scholar]
- Saiprasad, N.; Kalam, A.; Zayegh, A. Triple bottom line analysis and optimum sizing of renewable energy using improved hybrid optimization employing the genetic algorithm: A case study from India. Energies 2019, 12, 349. [Google Scholar] [CrossRef] [Green Version]
- Starke, A.R.; Cardemil, J.M.; Escobar, R.; Colle, S. Multi-objective optimization of hybrid CSP+ PV system using genetic algorithm. Energy 2018, 147, 490–503. [Google Scholar] [CrossRef]
- Wang, Y.; Wei, C. Design optimization of office building envelope based on quantum genetic algorithm for energy conservation. J. Build. Eng. 2021, 35, 102048. [Google Scholar] [CrossRef]
- Su, Y.; Guo, N.; Tian, Y.; Zhang, X. A non-revisiting genetic algorithm based on a novel binary space partition tree. Inf. Sci. 2020, 512, 661–674. [Google Scholar] [CrossRef]
- Kiehbadroudinezhad, M.; Rajabipour, A.; Cada, M.; Khanali, M. Modeling, design, and optimization of a cost effective and reliable hybrid renewable energy system integrated with desalination using the division algorithm. Int. J. Energy Res. 2021, 45, 429–452. [Google Scholar] [CrossRef]
- Manju, S.; Sagar, N. Renewable energy integrated desalination: A sustainable solution to overcome future fresh-water scarcity in India. Renew. Sustain. Energy Rev. 2017, 73, 594–609. [Google Scholar] [CrossRef]
- Ardjal, A.; Merabet, A.; Bettayeb, M.; Mansouri, R.; Labib, L. Design and implementation of a fractional nonlinear synergetic controller for generator and grid converters of wind energy conversion system. Energy 2019, 186, 115861. [Google Scholar] [CrossRef]
- Li, R.; Guo, S.; Yang, Y.; Liu, D. Optimal sizing of wind/concentrated solar plant/electric heater hybrid renewable energy system based on two-stage stochastic programming. Energy 2020, 209, 118472. [Google Scholar] [CrossRef]
- Tanvir, A.A.; Merabet, A. Artificial neural network and Kalman filter for estimation and control in standalone induction generator wind energy DC microgrid. Energies 2020, 13, 1743. [Google Scholar] [CrossRef] [Green Version]
- Balat, M. A review of modern wind turbine technology. Energy Sources A 2009, 31, 1561–1572. [Google Scholar] [CrossRef]
- Gan, L.K.; Shek, J.K.H.; Mueller, M.A. Hybrid wind-photovoltaic-diesel-battery system sizing tool development using empirical approach, life-cycle cost and performance analysis: A case study in Scotland. Energy Convers. Manag. 2015, 106, 479–494. [Google Scholar] [CrossRef] [Green Version]
- Spyrou, I.D.; Anagnostopoulos, J.S. Design study of a stand-alone desalination system powered by renewable energy sources and a pumped storage unit. Desalination 2010, 257, 137–149. [Google Scholar] [CrossRef]
- Wu, B.; Maleki, A.; Pourfayaz, F.; Rosen, M.A. Optimal design of stand-alone reverse osmosis desalination driven by a photovoltaic and diesel generator hybrid system. Sol. Energy 2018, 163, 91–103. [Google Scholar] [CrossRef]
- Szargut, J. Exergy analysis. Mag. Polish Acad. Sci. 2005, 3, 31–33. [Google Scholar]
- Sun, B.; Nie, Z.; Gao, F.; Liu, Y.; Wang, Z.; Gong, X. Cumulative exergy demand analysis of the primary aluminum produced in China and its natural resource-saving potential in transportation. Int. J. Life Cycle Assess. 2015, 20, 1048–1060. [Google Scholar] [CrossRef]
- Wernet, G.; Bauer, C.; Steubing, B.; Reinhard, J.; Moreno-Ruiz, E.; Weidema, B. The ecoinvent database version 3 (part I): Overview and methodology. Int. J. Life Cycle Assess. 2016, 21, 1218–1230. [Google Scholar] [CrossRef]
- Amiri, Z.; Asgharipour, M.R.; Campbell, D.E.; Armin, M. Extended exergy analysis (EAA) of two canola farming systems in Khorramabad, Iran. Agric. Syst. 2020, 180, 102789. [Google Scholar] [CrossRef]
- Zhang, G.; Wu, B.; Maleki, A.; Zhang, W. Simulated annealing-chaotic search algorithm based optimization of reverse osmosis hybrid desalination system driven by wind and solar energies. Sol. Energy 2018, 173, 964–975. [Google Scholar] [CrossRef]
- Maleki, A.; Pourfayaz, F.; Ahmadi, M.H. Design of a cost-effective wind/photovoltaic/hydrogen energy system for supplying a desalination unit by a heuristic approach. Sol. Energy 2016, 139, 666–675. [Google Scholar] [CrossRef]
- Maleki, A.; Khajeh, M.G.; Rosen, M.A. Weather forecasting for optimization of a hybrid solar-wind-powered reverse osmosis water desalination system using a novel optimizer approach. Energy 2016, 114, 1120–1134. [Google Scholar] [CrossRef]
- Gaur, S.; Chahar, B.R.; Graillot, D. Analytic elements method and particle swarm optimization based simulation-optimization model for groundwater management. J. Hydrol. 2011, 402, 217–227. [Google Scholar] [CrossRef]
- Kiehbadroudinezhad, S.; Bousquet, J.-F.; Cada, M.; Short, C.I.; Shahabi, A.; Kiehbadroudinezhad, S. Expansion of a Y-Shaped Antenna Array and Optimization of the Future Antenna Array in Malaysia for Astronomical Applications. J. Mod. Phys. 2019, 10, 888–908. [Google Scholar] [CrossRef] [Green Version]
- Benavides, P.T.; Lee, U.; Zarè-Mehrjerdi, O. Life cycle greenhouse gas emissions and energy use of polylactic acid, bio-derived polyethylene, and fossil-derived polyethylene. J. Clean. Prod. 2020, 277, 124010. [Google Scholar] [CrossRef]
- Tian, S.; Tang, H.; Wang, Q.; Yuan, X.; Ma, Q.; Wang, M. Evaluation and optimization of blanket production from recycled polyethylene terephthalate based on the coordination of environment, economy, and society. Sci. Total Environ. 2021, 772, 145049. [Google Scholar] [CrossRef] [PubMed]
- Spierling, S.; Venkatachalam, V.; Mudersbach, M.; Becker, N.; Herrmann, C.; Endres, H.-J. End-of-life options for bio-based plastics in a circular economy-status quo and potential from a life cycle assessment perspective. Resources 2020, 9, 90. [Google Scholar] [CrossRef]
- Spierling, S.; Röttger, C.; Venkatachalam, V.; Mudersbach, M.; Herrmann, C.; Endres, H.-J. Bio-based plastics-A building block for the circular economy? Procedia CIRP 2018, 69, 573–578. [Google Scholar] [CrossRef]
- Rahman, M.H.; Bhoi, P.R. An overview of non-biodegradable bioplastics. J. Clean. Prod. 2021, 294, 126218. [Google Scholar] [CrossRef]
- Notter, D.A.; Gauch, M.; Widmer, R.; Wager, P.; Stamp, A.; Zah, R.; Althaus, H.-J. Contribution of Li-ion batteries to the environmental impact of electric vehicles. Environ. Sci. Technol. 2010, 44, 6550–6556. [Google Scholar] [CrossRef] [PubMed]
- Padashbarmchi, Z.; Hamidian, A.H.; Khorasani, N.; Kazemzad, M.; McCabe, A.; Halog, A. Environmental life cycle assessments of emerging anode materials for Li ion batteries metal oxide NP s. Environ. Prog. Sustain. Energy 2015, 34, 1740–1747. [Google Scholar] [CrossRef]
- Nikkhah, A.; Kosari-Moghaddam, A.; Troujeni, M.E.; Bacenetti, J.; Van Haute, S. Exergy flow of rice production system in Italy: Comparison among nine different varieties. Sci. Total Environ. 2021, 781, 146718. [Google Scholar] [CrossRef]
- Yang, X.-S. Multiobjective firefly algorithm for continuous optimization. Eng. Comput. 2013, 29, 175–184. [Google Scholar] [CrossRef] [Green Version]
- Cao, K.; Ye, X. Coarse-grained parallel genetic algorithm applied to a vector based land use allocation optimization problem: The case study of Tongzhou Newtown, Beijing, China. Stoch. Environ. Res. Risk Assess. 2013, 27, 1133–1142. [Google Scholar] [CrossRef]
- Amaireh, A.A.; Alzoubi, A.; Dib, N.I. Design of linear antenna arrays using antlion and grasshopper optimization algorithms. In Proceedings of the 2017 IEEE Jordan Conference on Applied Electrical Engineering and Computing Technologies (AEECT), Aqaba, Jordan, 11–13 October 2017; pp. 1–6. [Google Scholar]

| SWROD | AWT (m2) | NBBS | LPSP (%) | LCC ($/m3) | CExD (MJ/m3) A | CExD (MJ/m3) B |
|---|---|---|---|---|---|---|
| 1 | 104.6 | 117 | 0 | 38.10 | 12.80 | 18.21 |
| 1 | 92.1 | 110 | 2 | 33.33 | 11.50 | 16.61 |
| 1 | 78.8 | 101 | 5 | 29.03 | 10.10 | 14.80 |
| 1 | 61.5 | 90 | 10 | 21.17 | 8.35 | 12.52 |
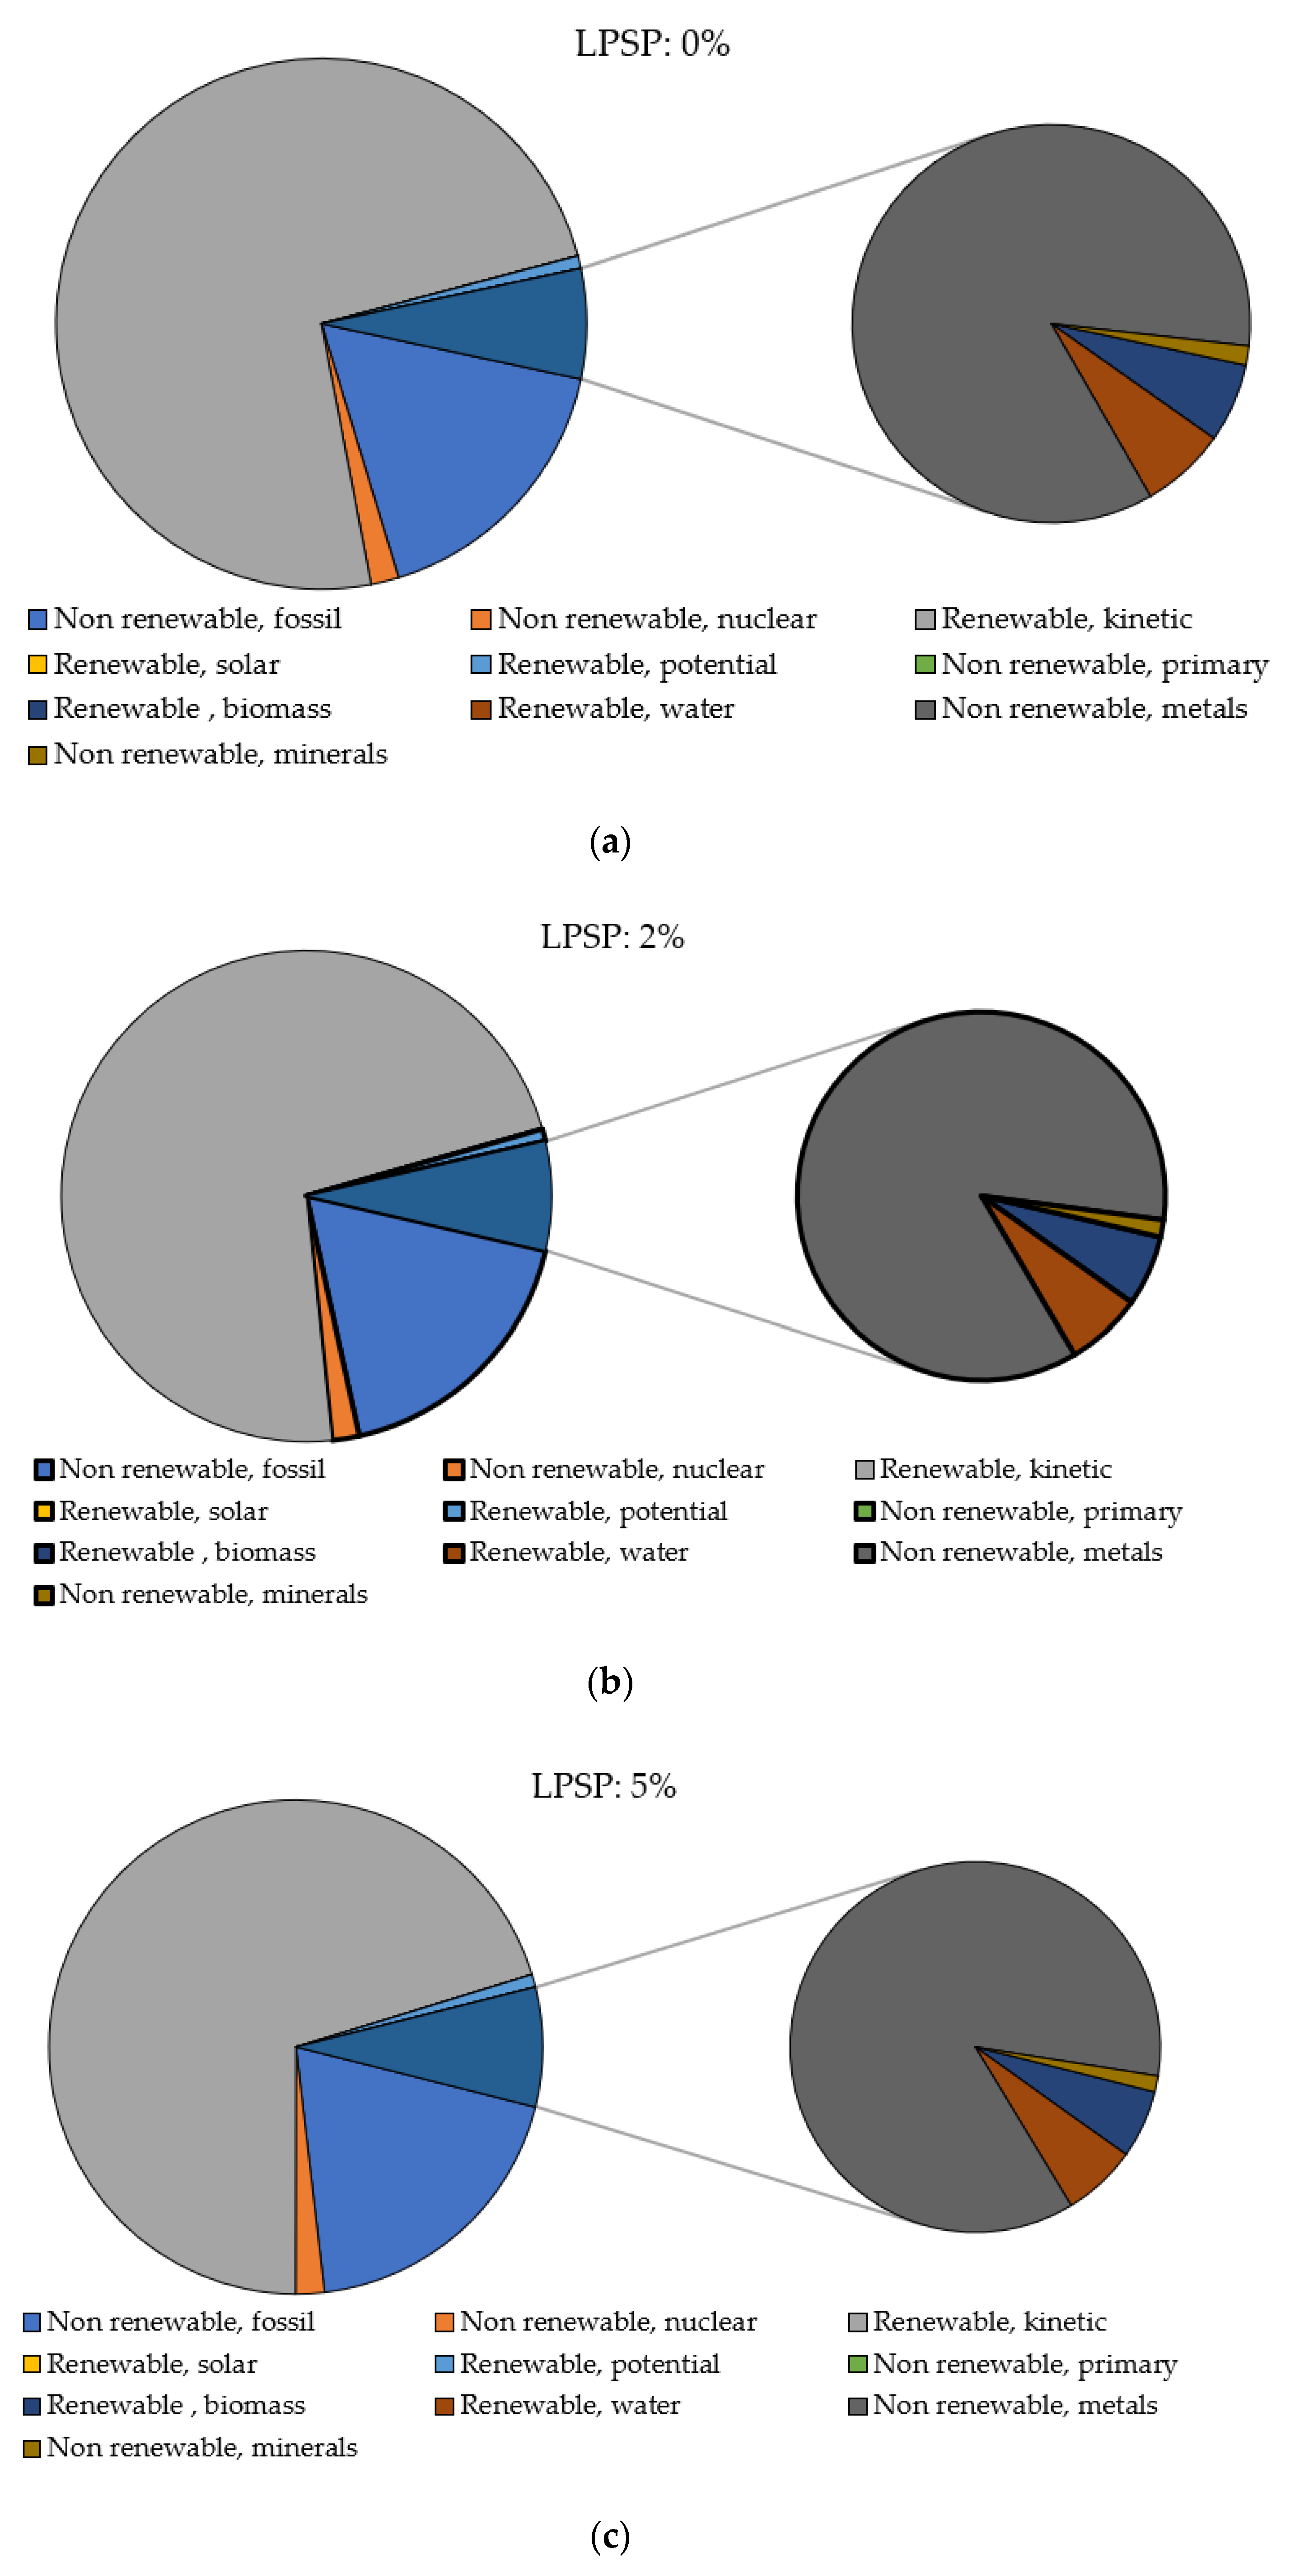
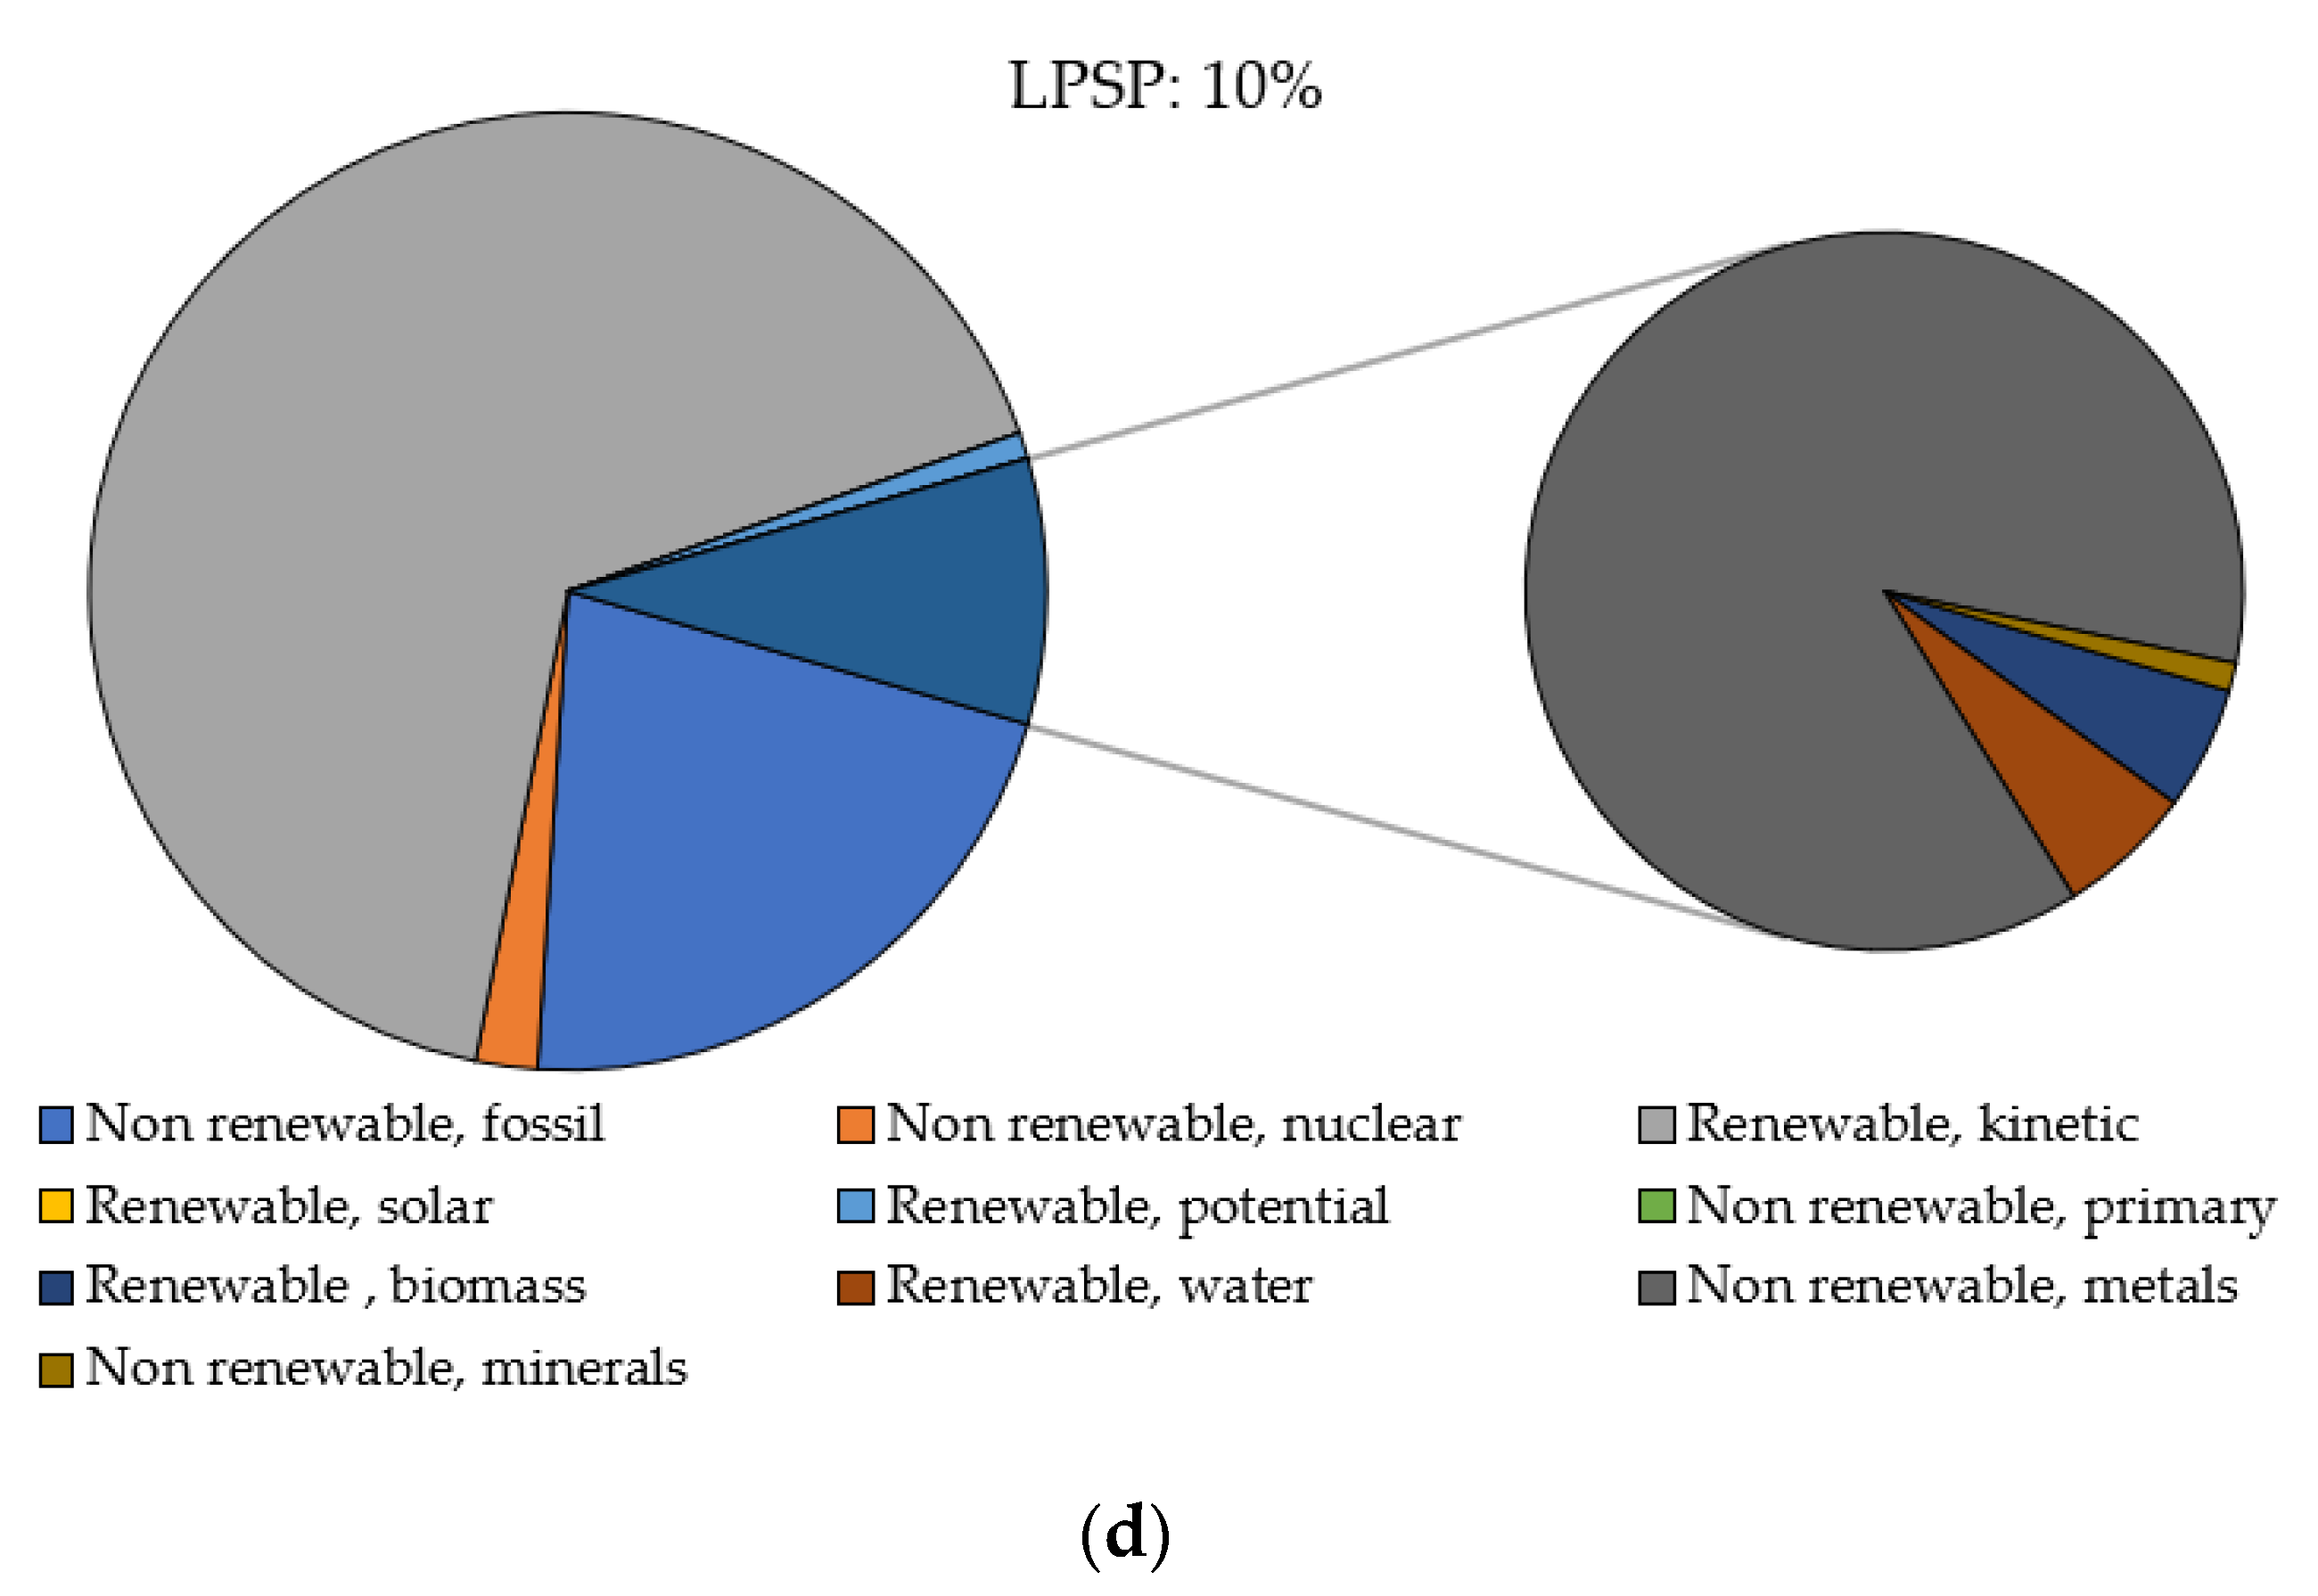
| Impact Category | Unit | LPSP (%) | |||
|---|---|---|---|---|---|
| 0 | 2 | 5 | 10 | ||
| Total | MJ | 1.28 E + 01 | 1.15 E + 01 | 1.01 E + 01 | 8.35 E + 00 |
| Non-renewable, fossil | MJ | 2.17 E + 00 | 2.07 E + 00 | 1.95 E + 00 | 1.80 E + 00 |
| Non-renewable, nuclear | MJ | 2.17 E − 01 | 2.05 E − 01 | 1.91 E − 01 | 1.74 E − 01 |
| Renewable, kinetic | MJ | 9.46 E + 00 | 8.33 E + 00 | 7.12 E + 00 | 5.56 E + 00 |
| Renewable, solar | MJ | 4.30 E − 05 | 3.99 E − 05 | 3.61 E − 05 | 3.15 E − 05 |
| Renewable, potential | MJ | 9.88 E − 02 | 9.22 E − 02 | 8.42 E − 02 | 7.43 E − 02 |
| Non-renewable, primary | MJ | 1.71 E − 04 | 1.61 E − 04 | 1.48 E − 04 | 1.31 E − 04 |
| Renewable, biomass | MJ | 5.51 E − 02 | 5.15 E − 02 | 4.71 E − 02 | 4.16 E − 02 |
| Renewable, water | MJ | 5.94 E − 02 | 5.58 E − 02 | 5.13 E − 02 | 4.58 E − 02 |
| Non-renewable, metals | MJ | 7.30 E − 01 | 7.09 E − 01 | 6.83 E − 01 | 6.52 E − 01 |
| Non-renewable, minerals | MJ | 1.35 E − 02 | 1.24 E − 02 | 1.11 E − 02 | 9.51 E − 03 |
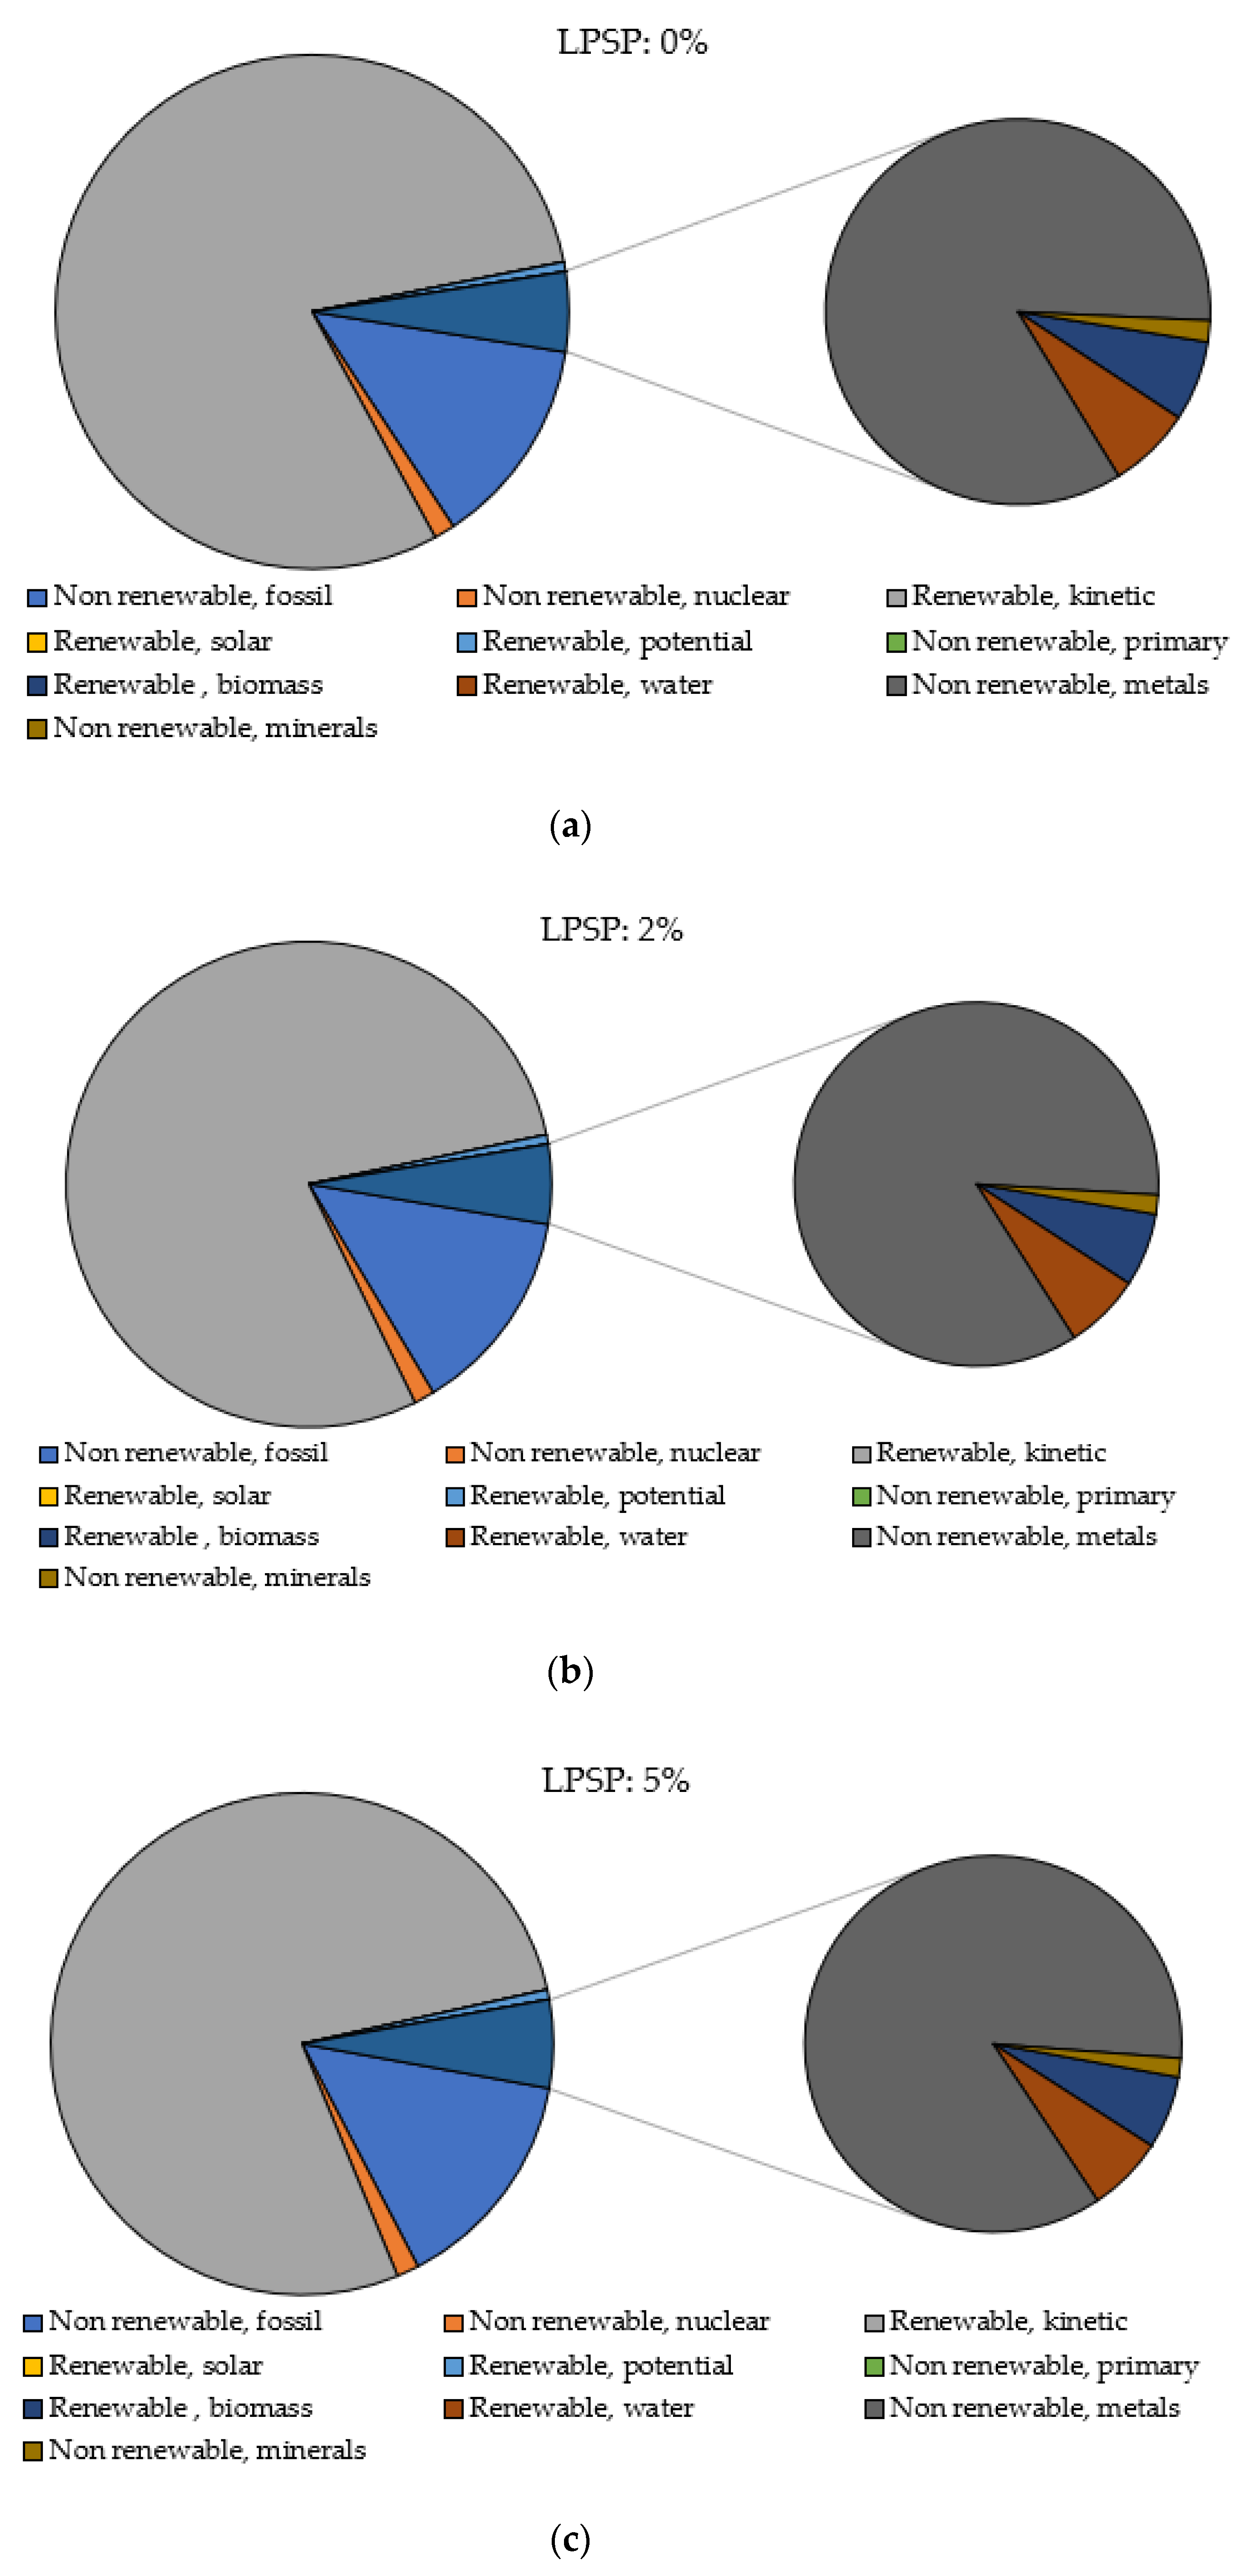
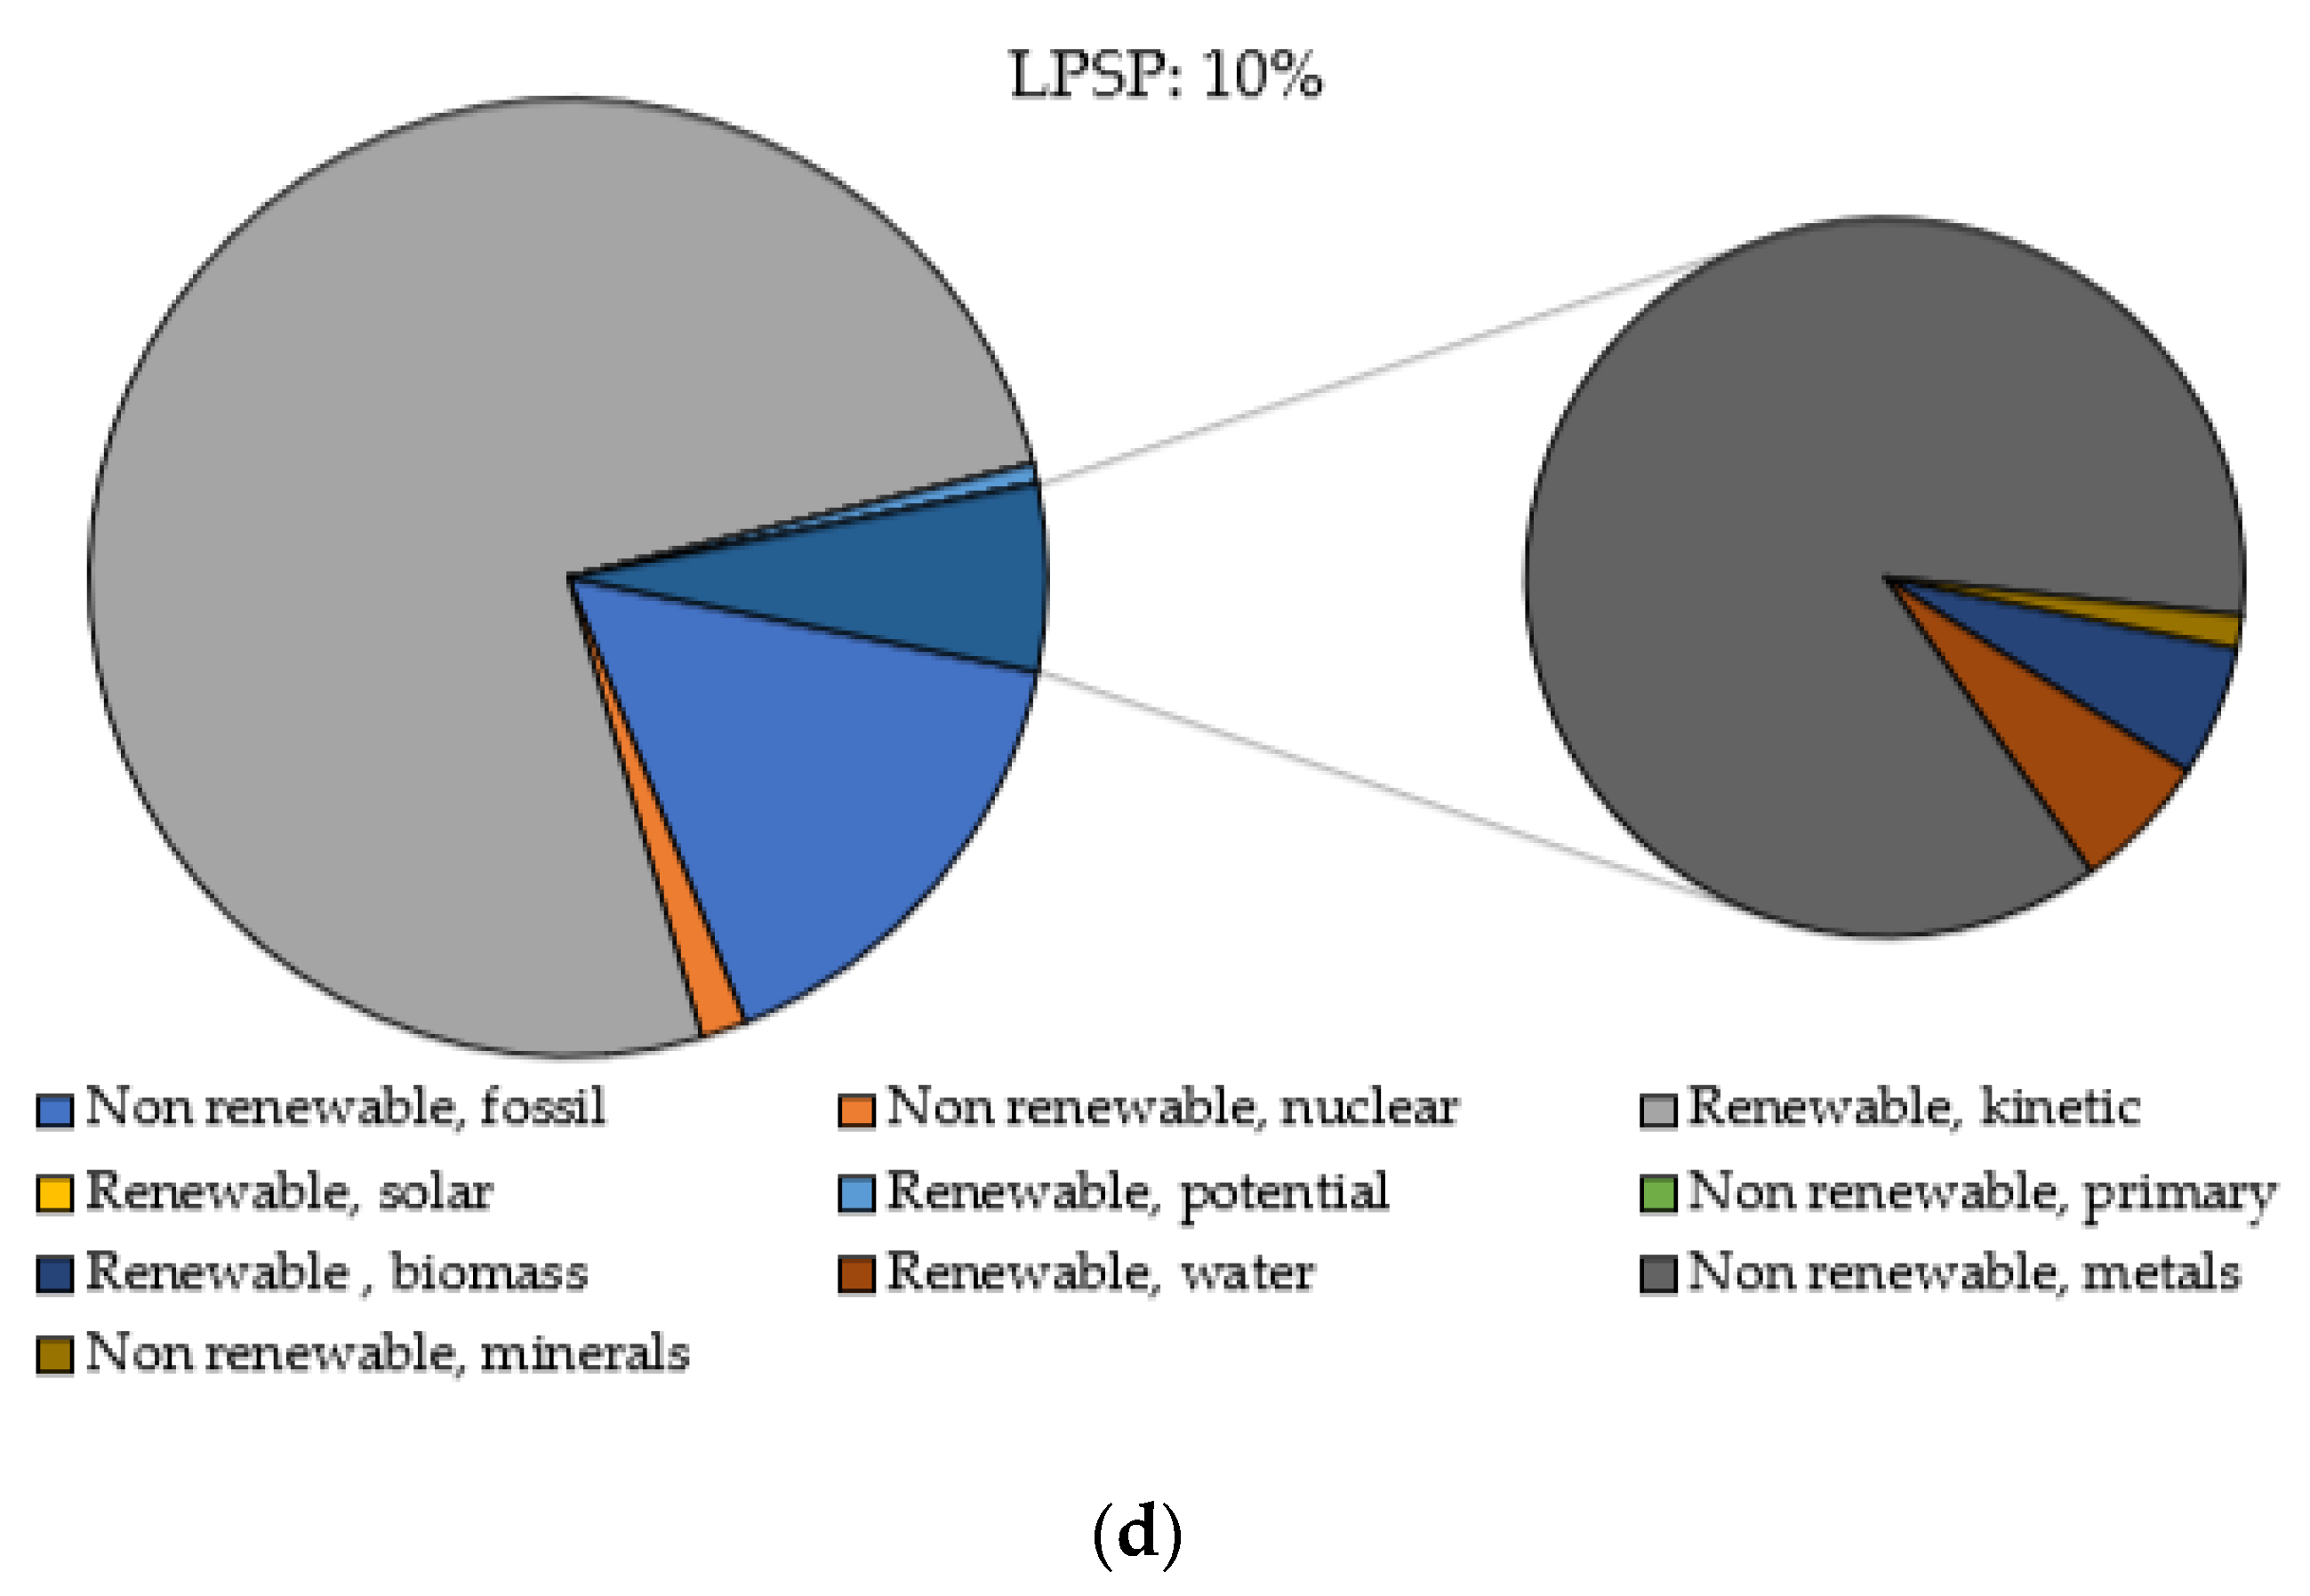
| Impact Category | Unit | LPSP (%) | |||
|---|---|---|---|---|---|
| 0 | 2 | 5 | 10 | ||
| Total | MJ | 1.82 E + 01 | 1.66 E + 01 | 1.48 E + 01 | 1.25 E + 01 |
| Non-renewable, fossil | MJ | 2.41 E + 00 | 2.29 E + 00 | 2.15 E + 00 | 1.98 E + 00 |
| Non-renewable, nuclear | MJ | 2.40 E − 01 | 2.27 E − 01 | 2.11 E − 01 | 1.91 E − 01 |
| Renewable, kinetic | MJ | 1.45 E + 01 | 1.31 E + 01 | 1.15 E + 01 | 9.48 E + 00 |
| Renewable, solar | MJ | 4.83 E − 05 | 4.49 E − 05 | 4.07 E − 05 | 3.56 E − 05 |
| Renewable, potential | MJ | 1.10 E − 01 | 1.03 E − 01 | 9.42 E − 02 | 8.32 E − 02 |
| Non-renewable, primary | MJ | 1.82 E − 04 | 1.71 E − 04 | 1.57 E − 04 | 1.40 E − 04 |
| Renewable, biomass | MJ | 6.16 E − 02 | 5.76 E − 02 | 5.27 E − 02 | 4.66 E − 02 |
| Renewable, water | MJ | 6.36 E − 02 | 5.97 E − 02 | 5.49 E − 02 | 4.90 E − 02 |
| Non-renewable, metals | MJ | 7.71 E − 01 | 7.48 E − 01 | 7.19 E − 01 | 6.84 E − 01 |
| Non-renewable, minerals | MJ | 1.63 E − 02 | 1.51 E − 02 | 1.36 E − 02 | 1.17 E − 02 |
Publisher’s Note: MDPI stays neutral with regard to jurisdictional claims in published maps and institutional affiliations. |
© 2021 by the authors. Licensee MDPI, Basel, Switzerland. This article is an open access article distributed under the terms and conditions of the Creative Commons Attribution (CC BY) license (https://creativecommons.org/licenses/by/4.0/).
Share and Cite
Kiehbadroudinezhad, M.; Merabet, A.; Hosseinzadeh-Bandbafha, H. Optimization of Wind Energy Battery Storage Microgrid by Division Algorithm Considering Cumulative Exergy Demand for Power-Water Cogeneration. Energies 2021, 14, 3777. https://doi.org/10.3390/en14133777
Kiehbadroudinezhad M, Merabet A, Hosseinzadeh-Bandbafha H. Optimization of Wind Energy Battery Storage Microgrid by Division Algorithm Considering Cumulative Exergy Demand for Power-Water Cogeneration. Energies. 2021; 14(13):3777. https://doi.org/10.3390/en14133777
Chicago/Turabian StyleKiehbadroudinezhad, Mohammadali, Adel Merabet, and Homa Hosseinzadeh-Bandbafha. 2021. "Optimization of Wind Energy Battery Storage Microgrid by Division Algorithm Considering Cumulative Exergy Demand for Power-Water Cogeneration" Energies 14, no. 13: 3777. https://doi.org/10.3390/en14133777
APA StyleKiehbadroudinezhad, M., Merabet, A., & Hosseinzadeh-Bandbafha, H. (2021). Optimization of Wind Energy Battery Storage Microgrid by Division Algorithm Considering Cumulative Exergy Demand for Power-Water Cogeneration. Energies, 14(13), 3777. https://doi.org/10.3390/en14133777