
Prosumer Community Portfolio Optimization via Aggregator: The Case of the Iberian Electricity Market and Portuguese Retail Market


Abstract
:1. Introduction
- An optimization model that jointly solves the minimization of the operating costs (energy usage) of an energy community and the optimal participation of an Aggregator in the Spot market and intraday sessions.
- A real scenario (prices and condition of participation) is modeled considering the Portuguese retail market and MIBEL wholesale electricity market.
- A thorough analysis of different case studies, demonstrating interesting insights on the importance of Aggregator participating in the wholesale electricity market.
- A consumer-centric approach that can bring empowerment of small electricity end-users in the power systems.
2. Legal Framework
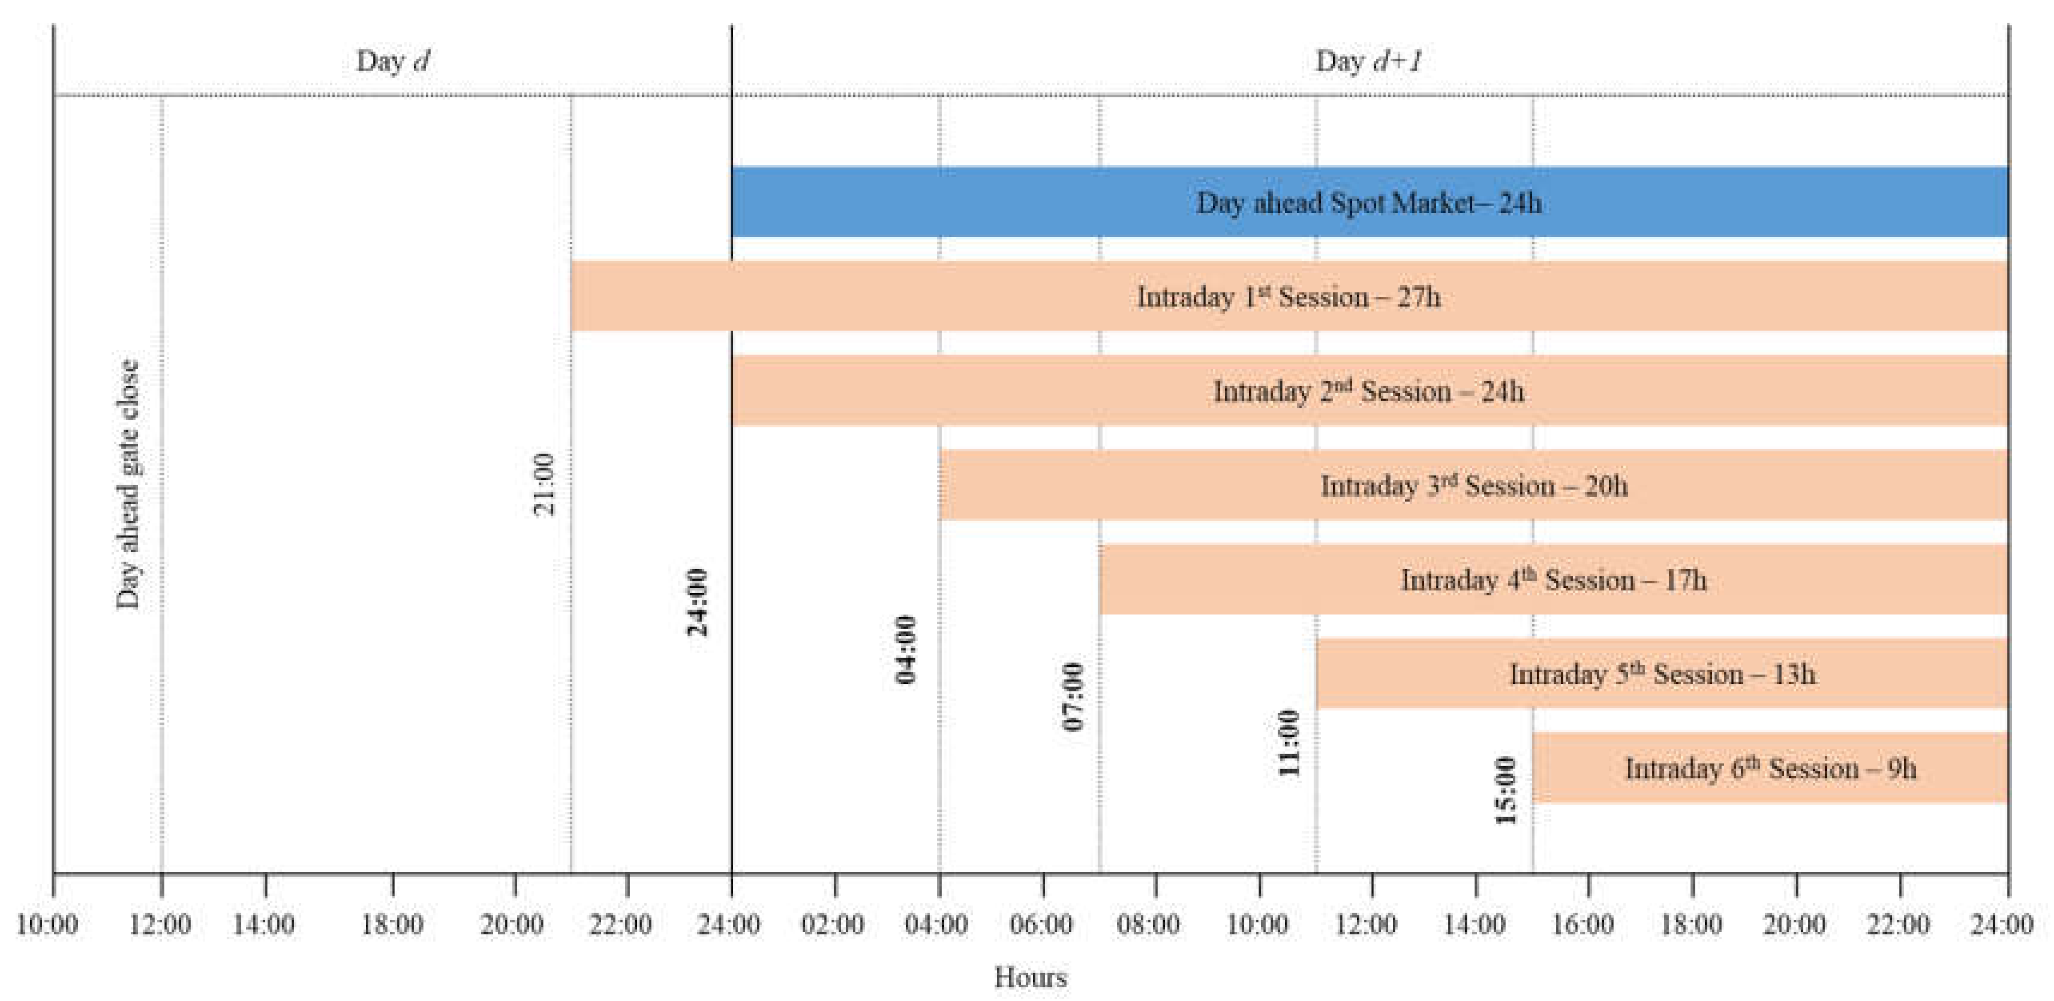
2.1. MIBEL Operation
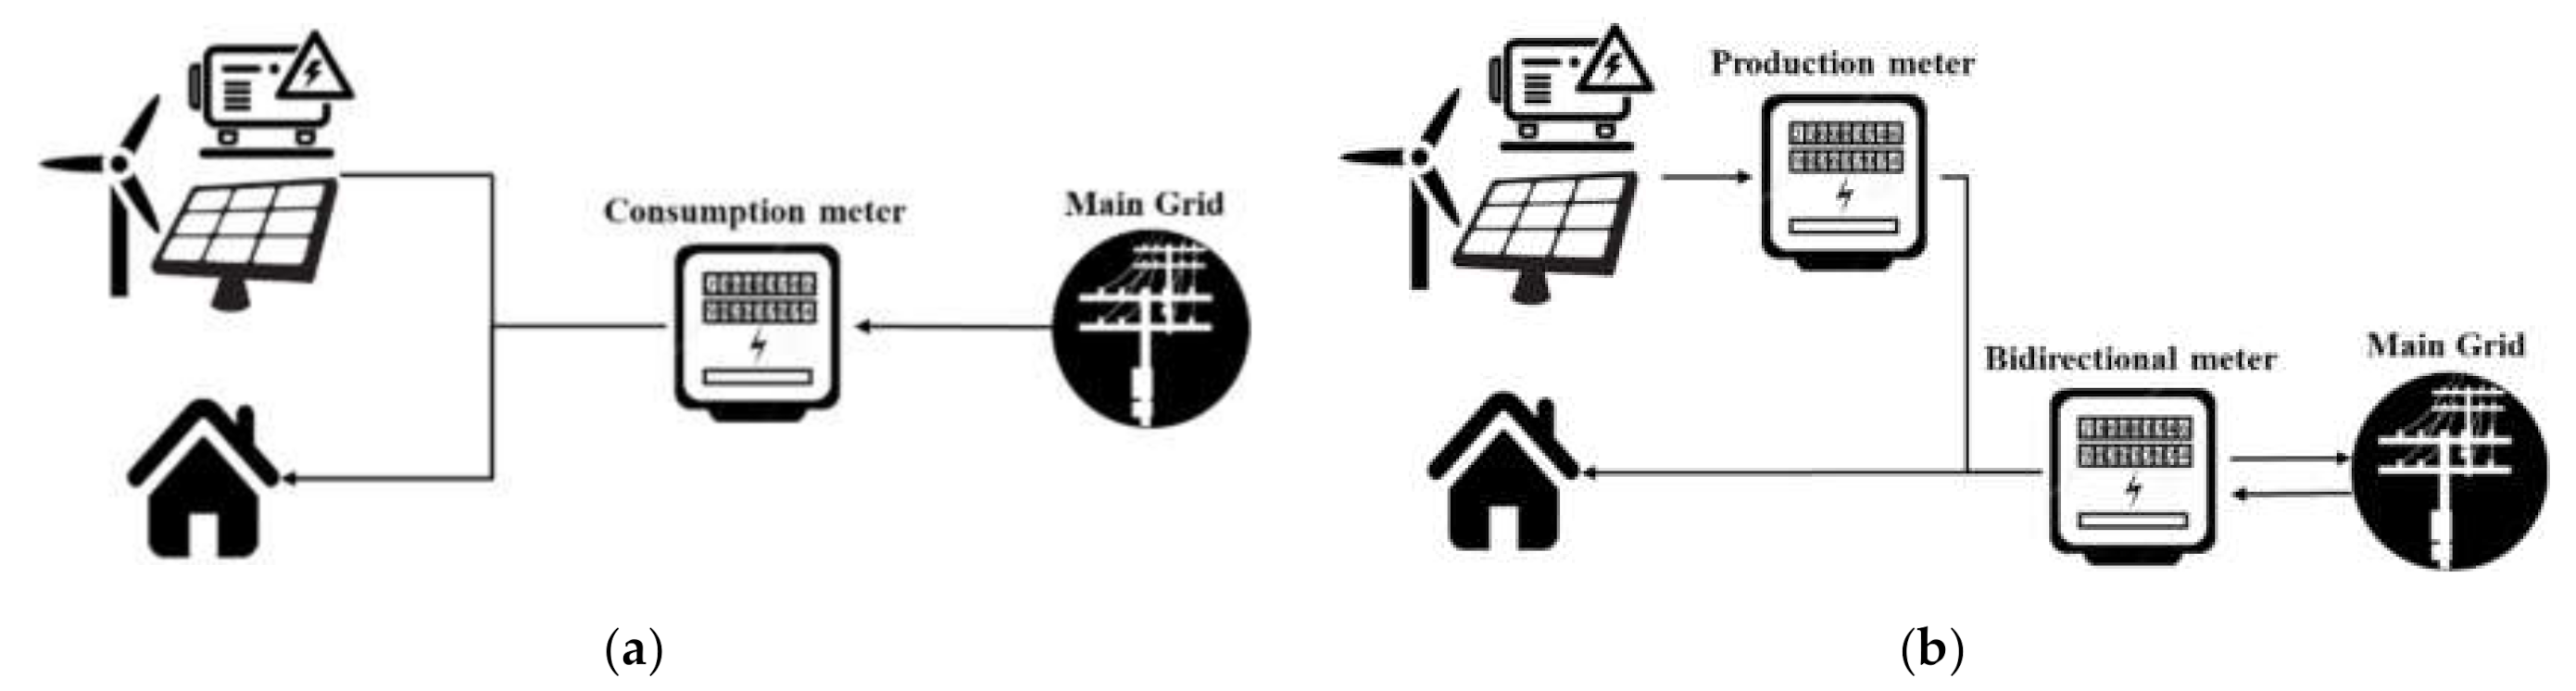
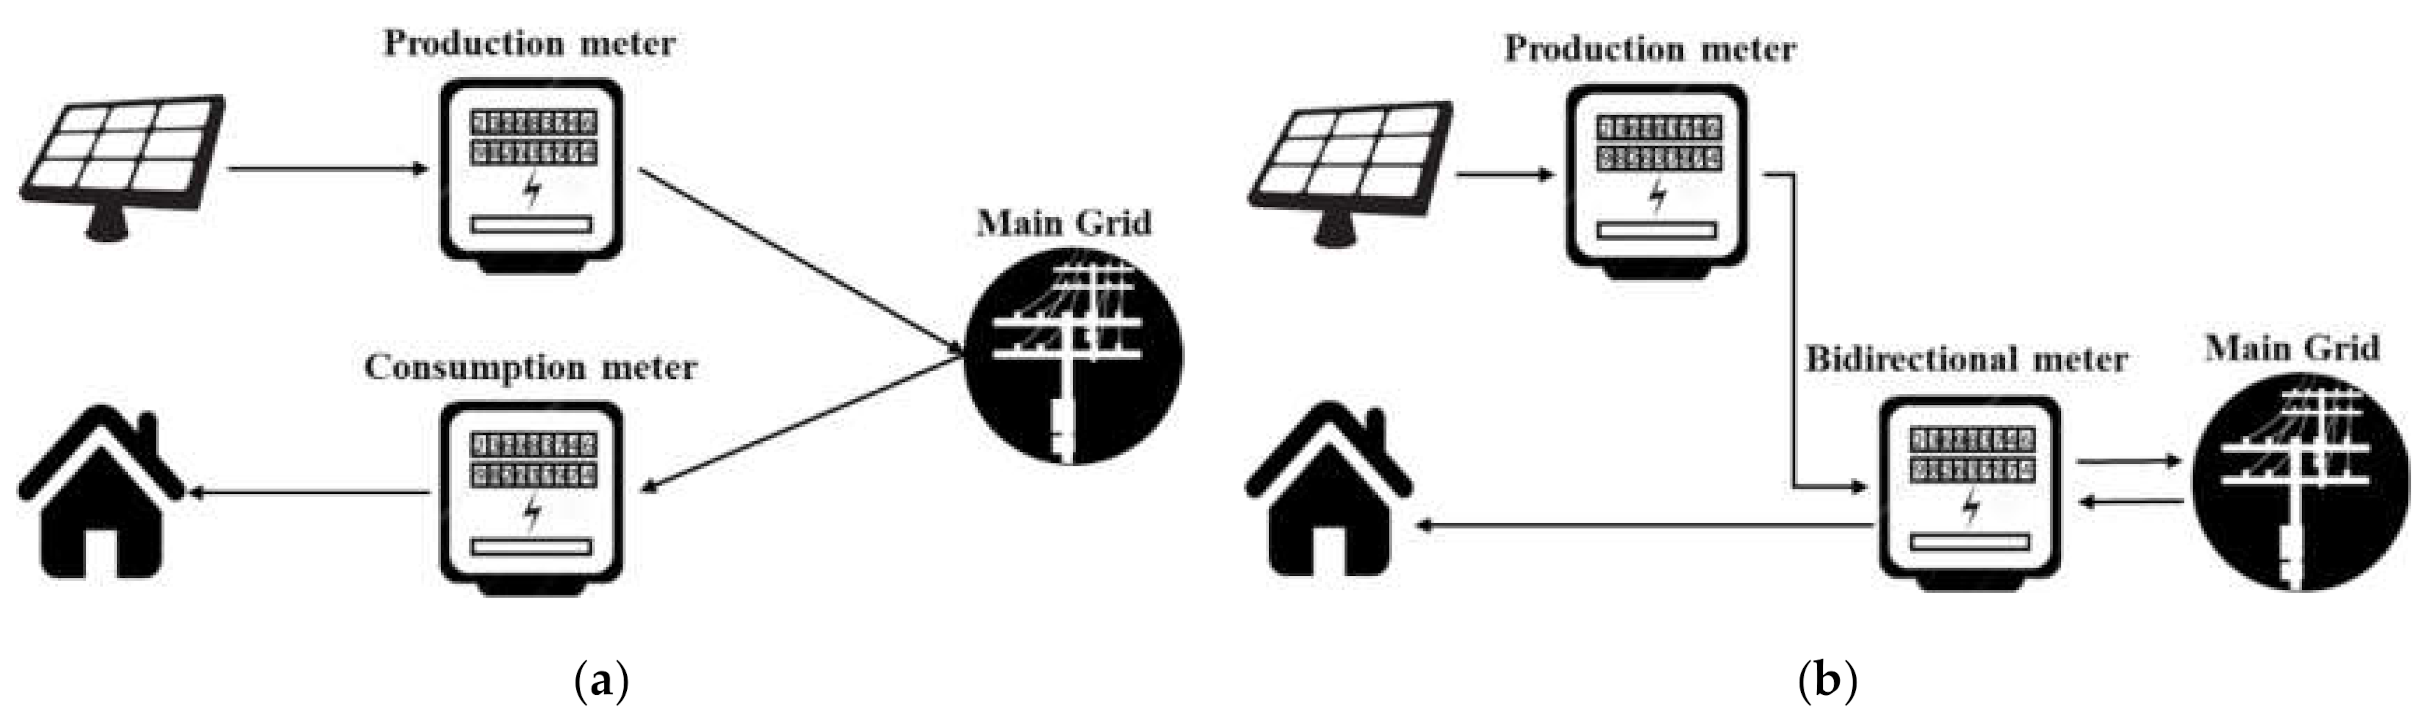
2.2. Distributed Generation in Portugal
3. Proposed Model
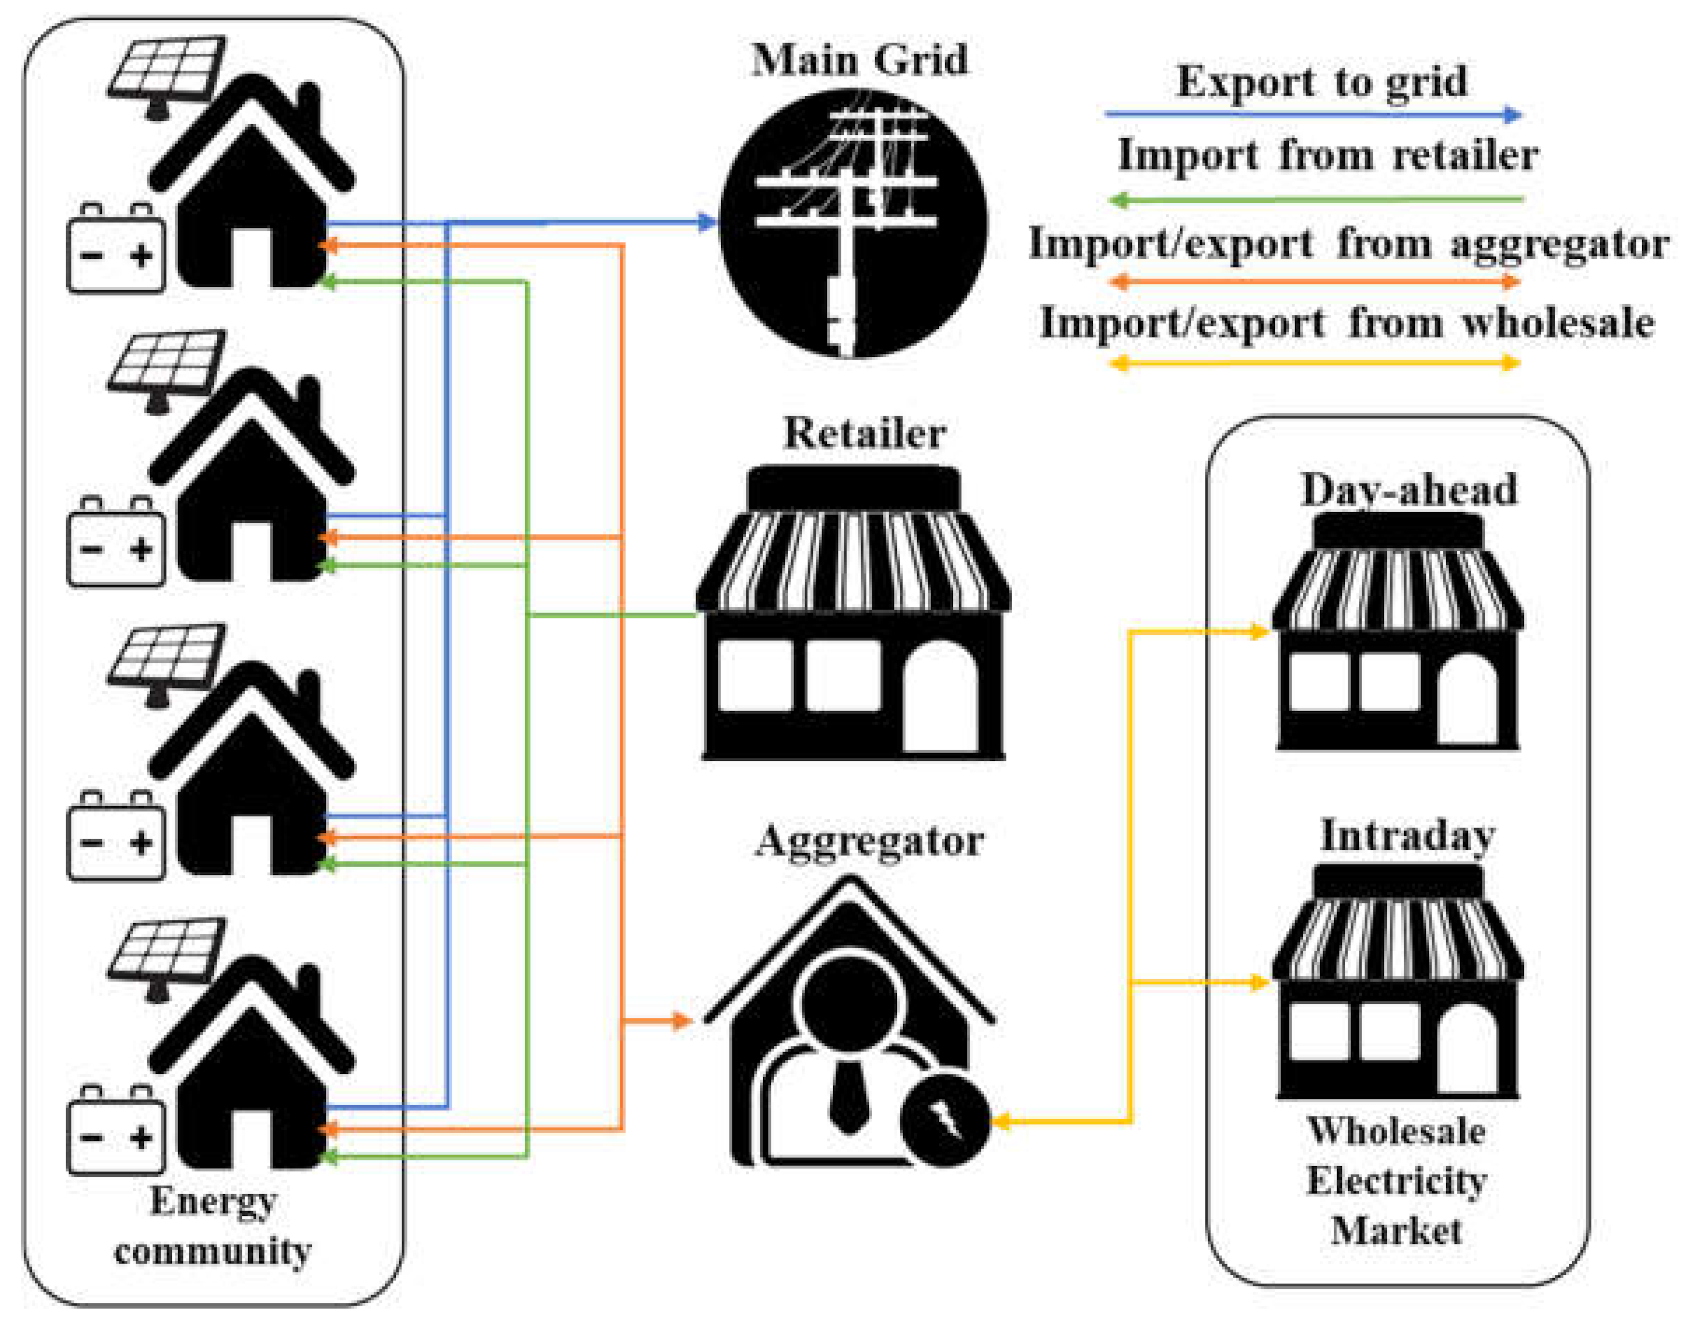
3.1. Model Overview
3.2. Formulation
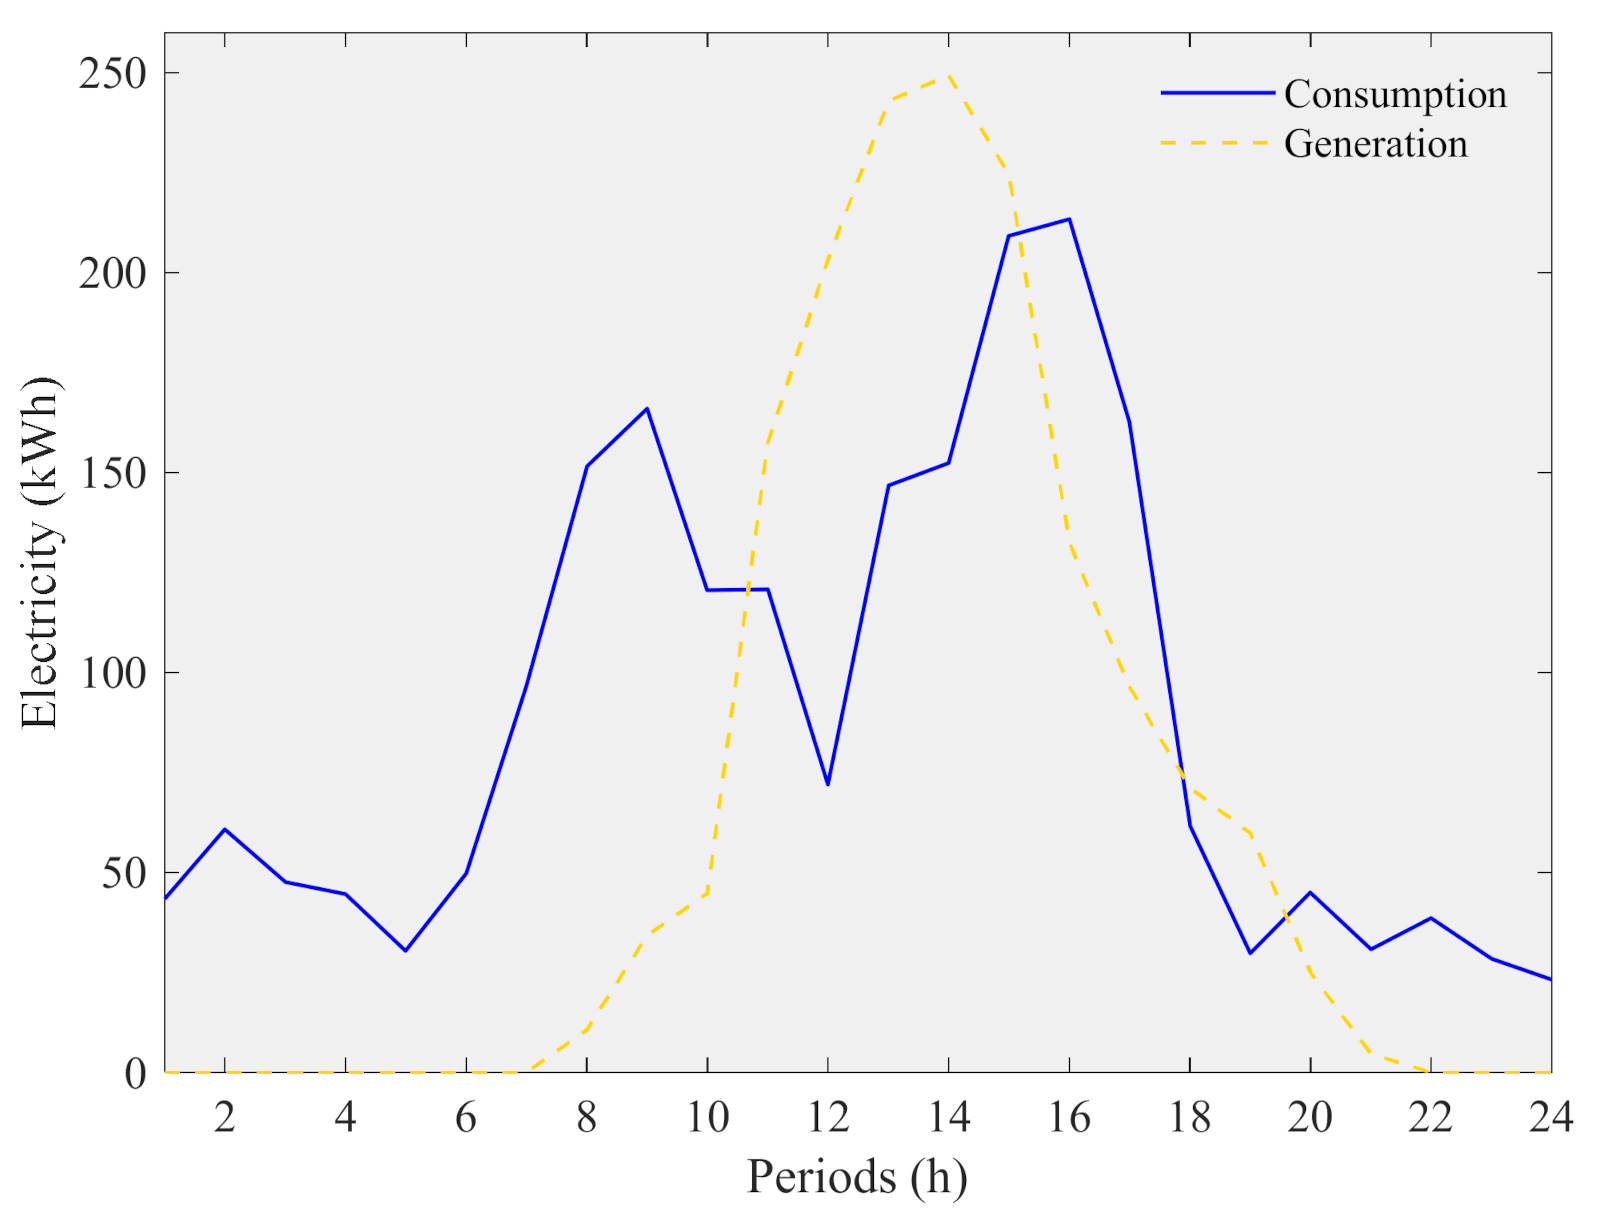
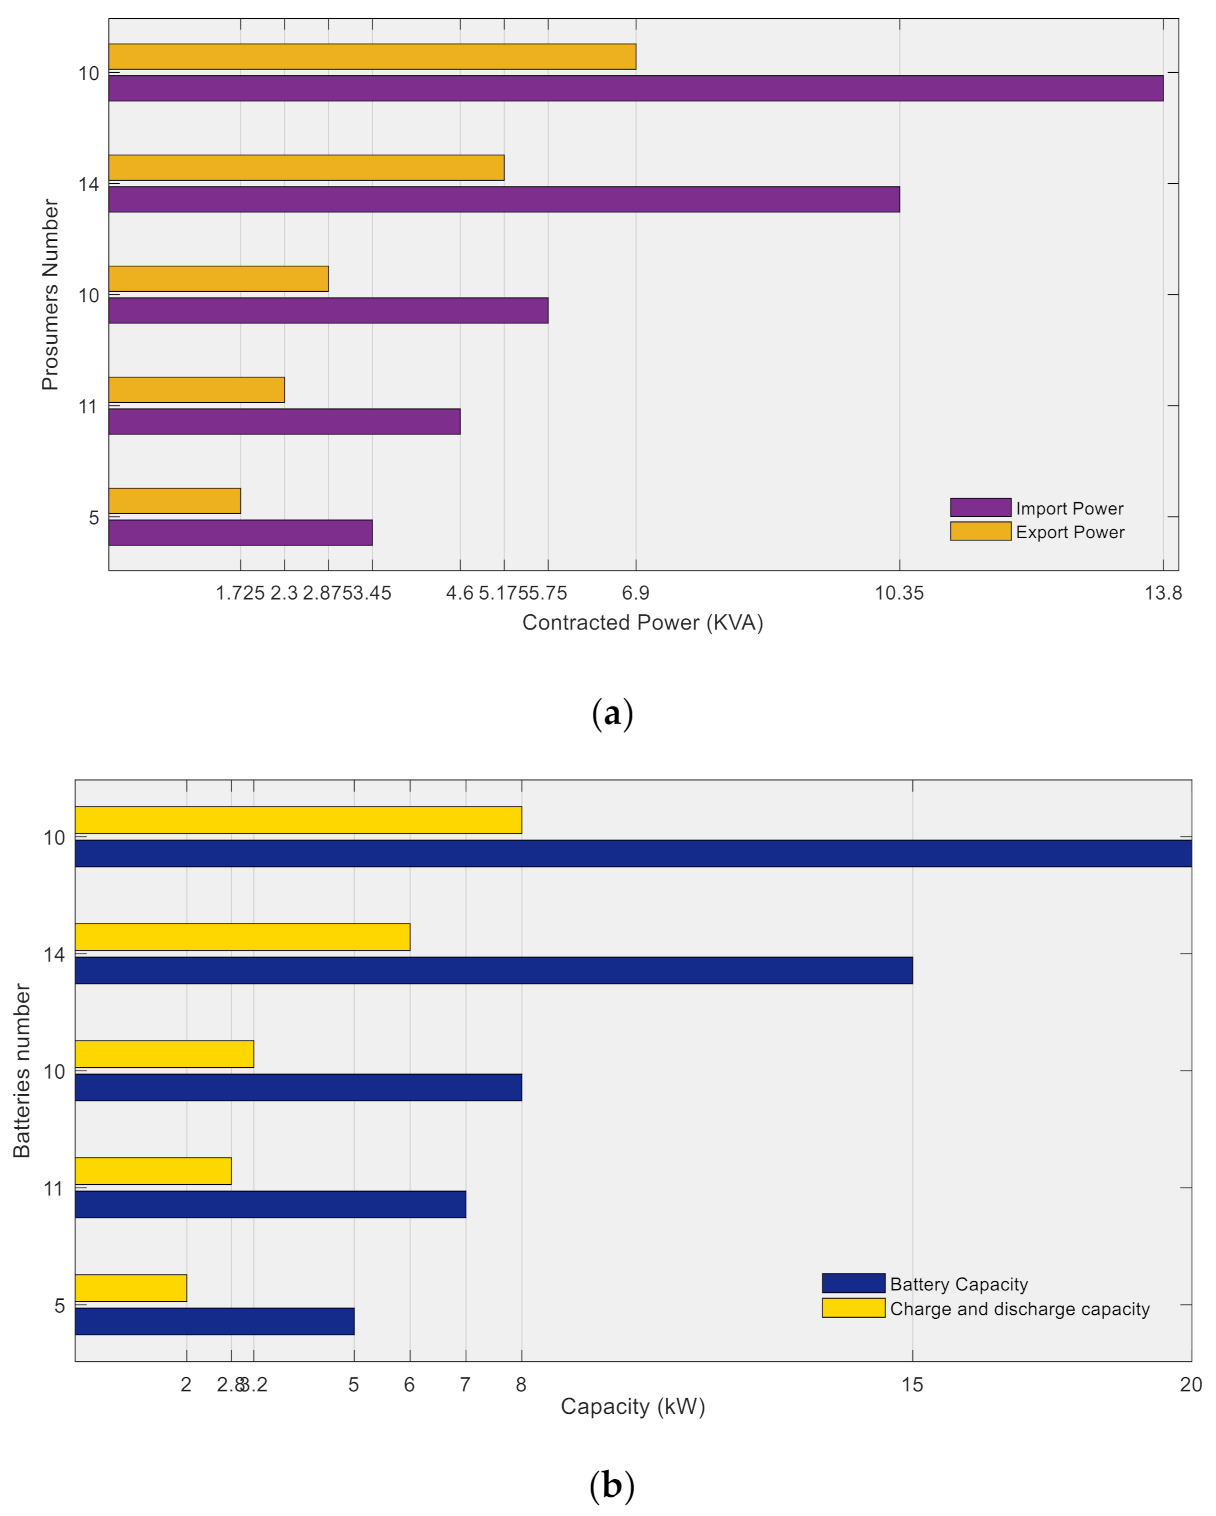
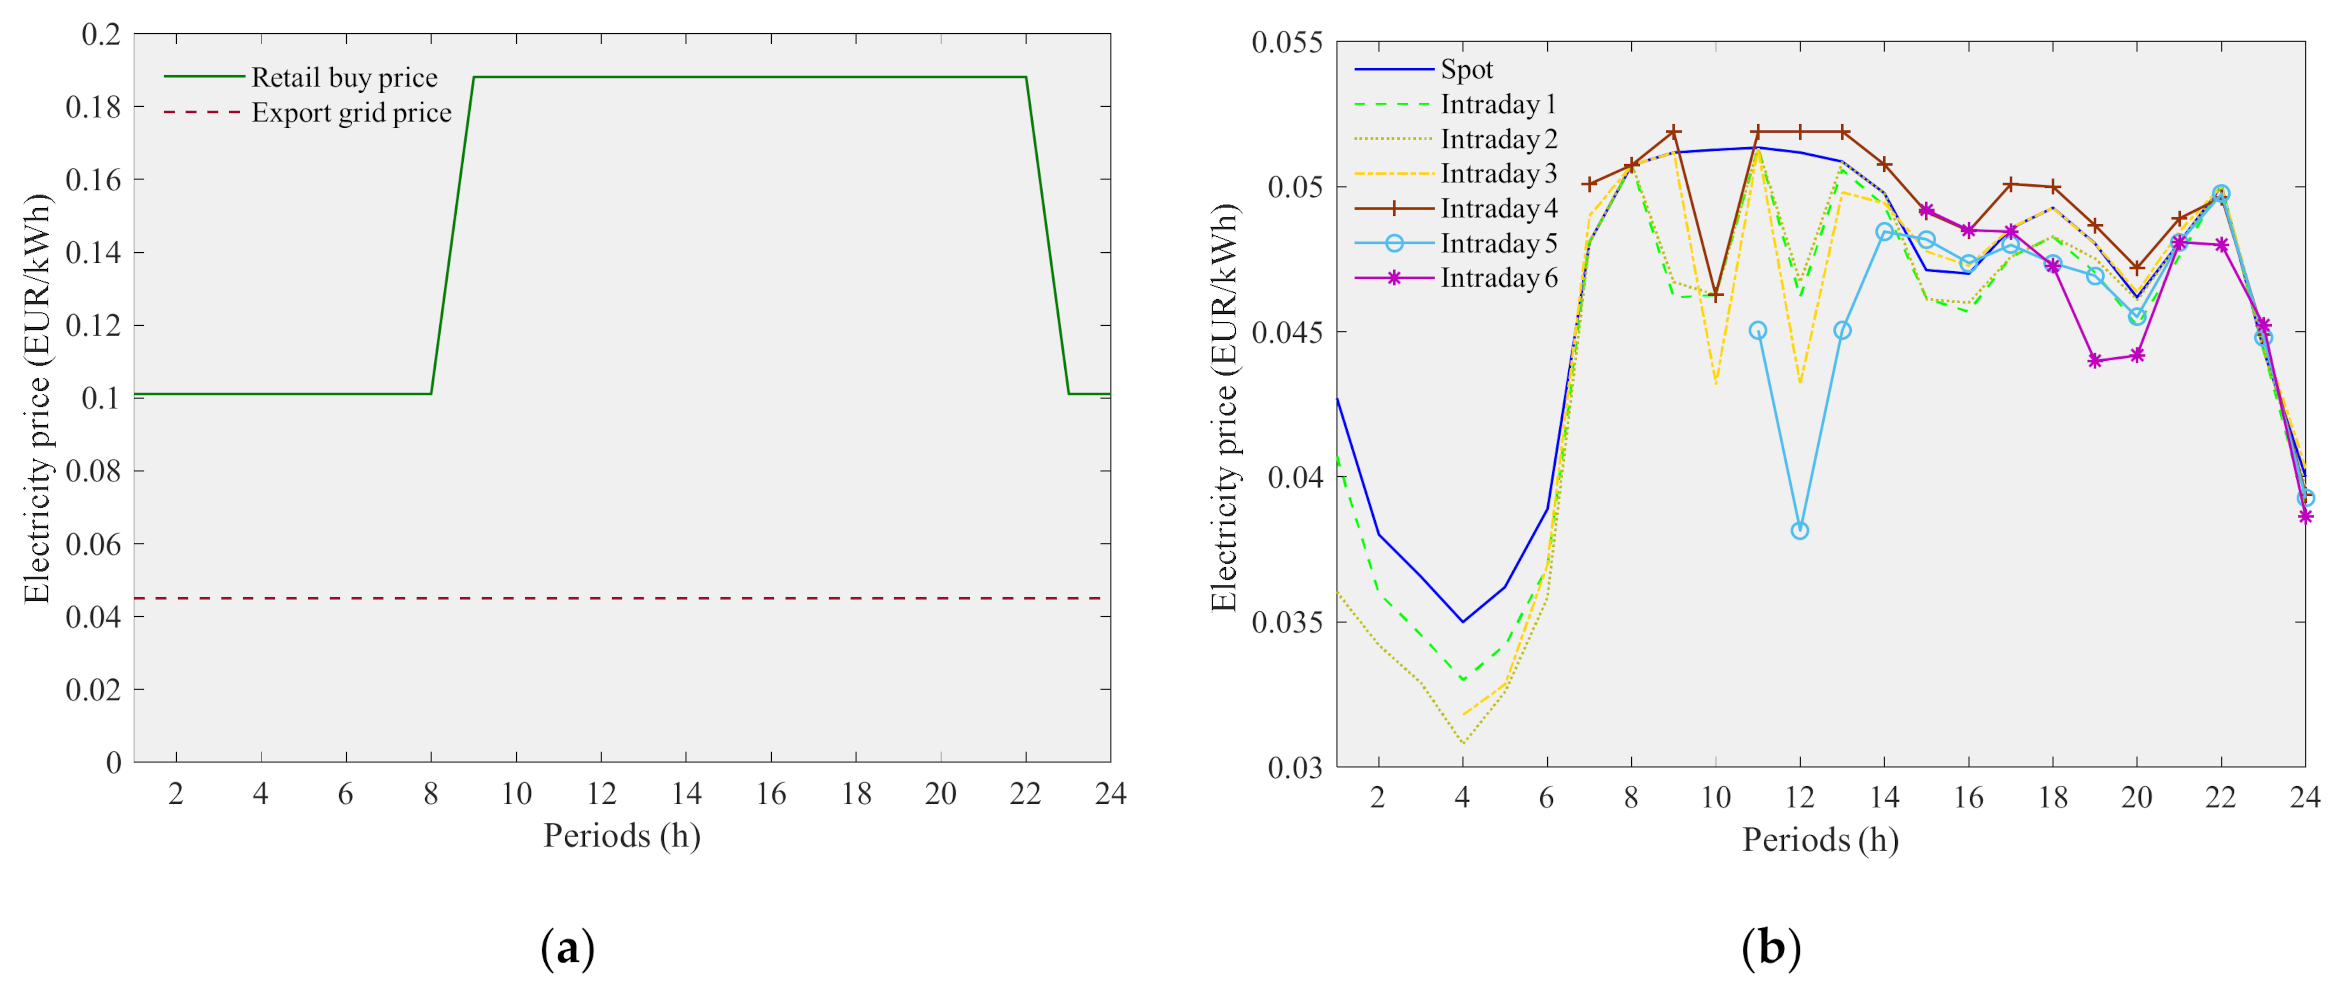
4. Case Study
5. Results
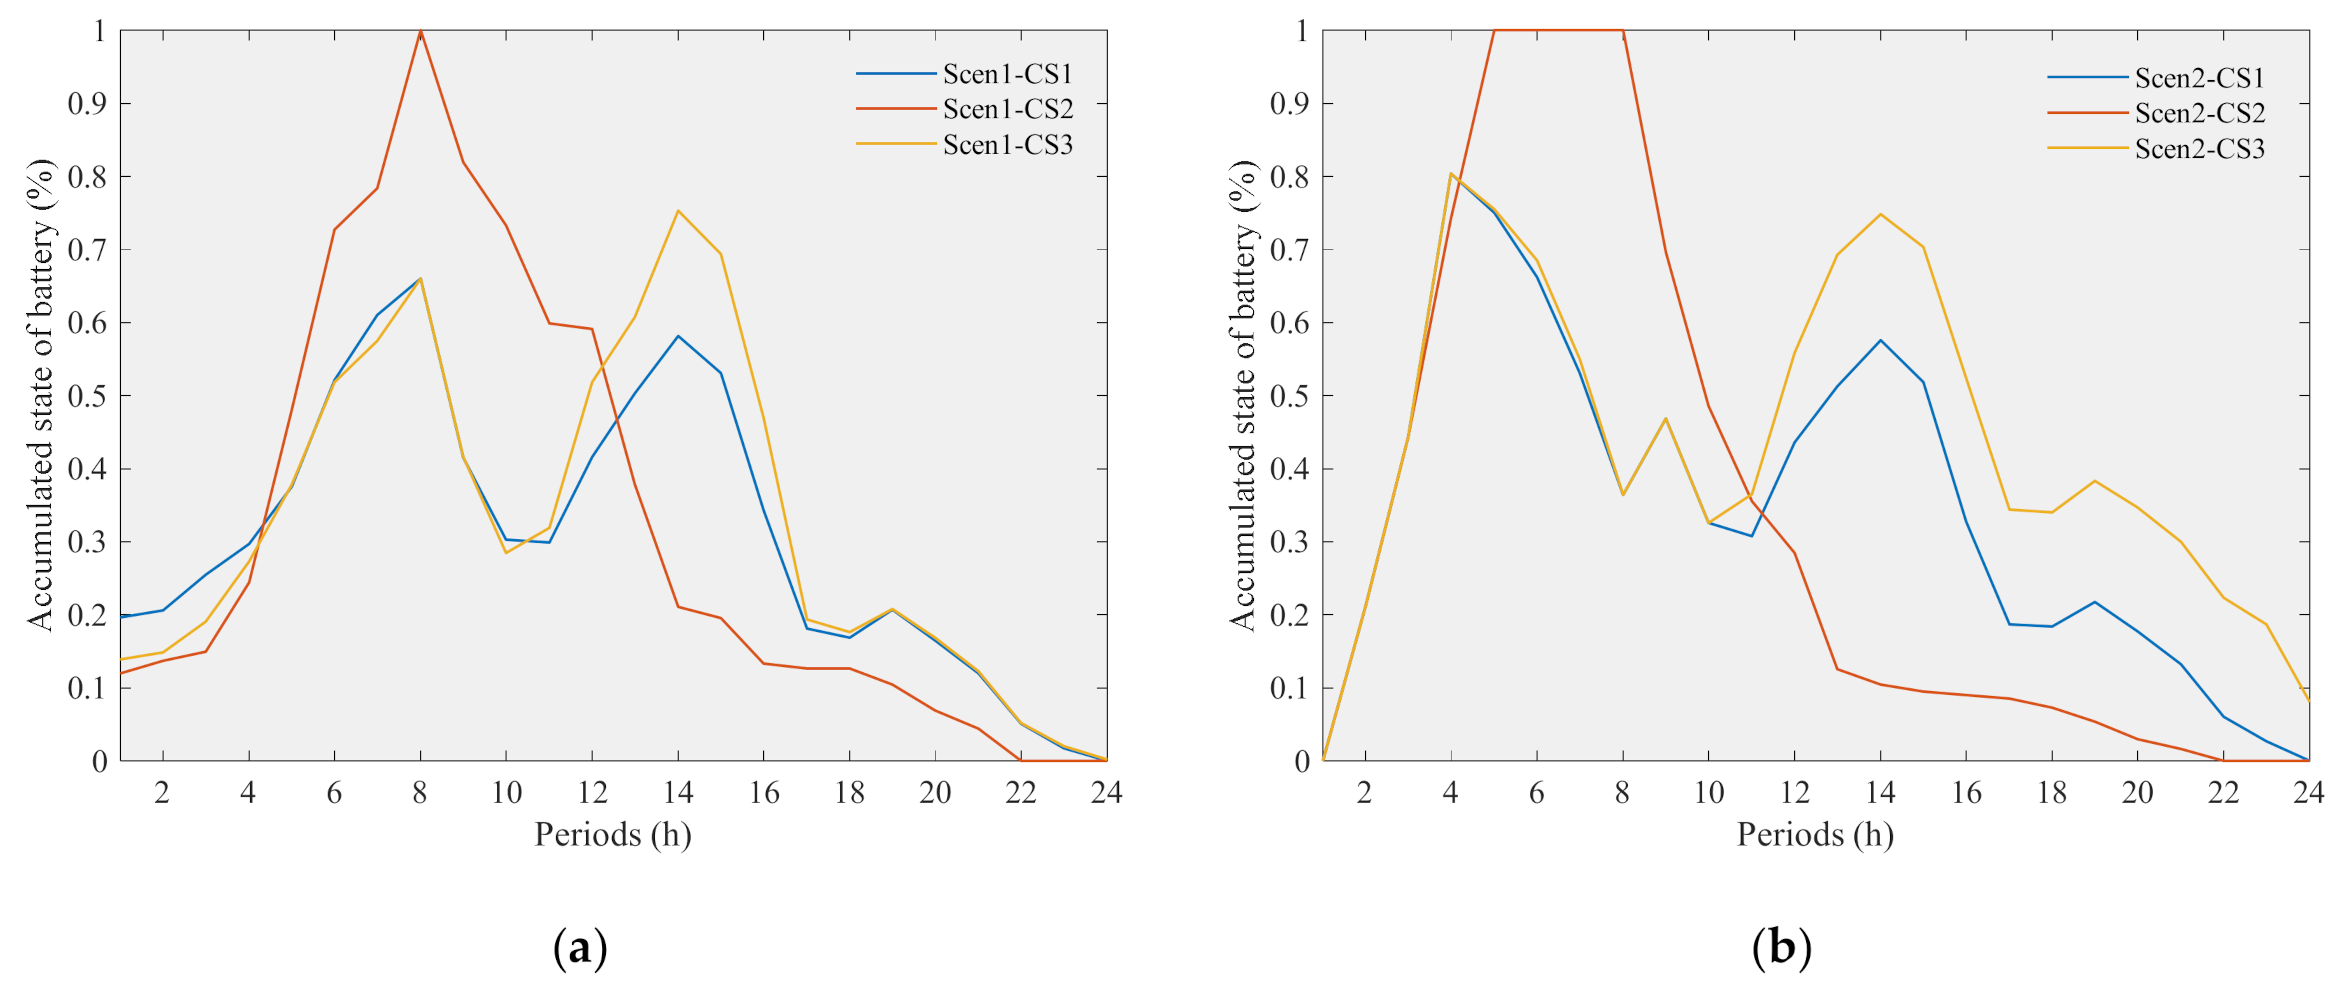
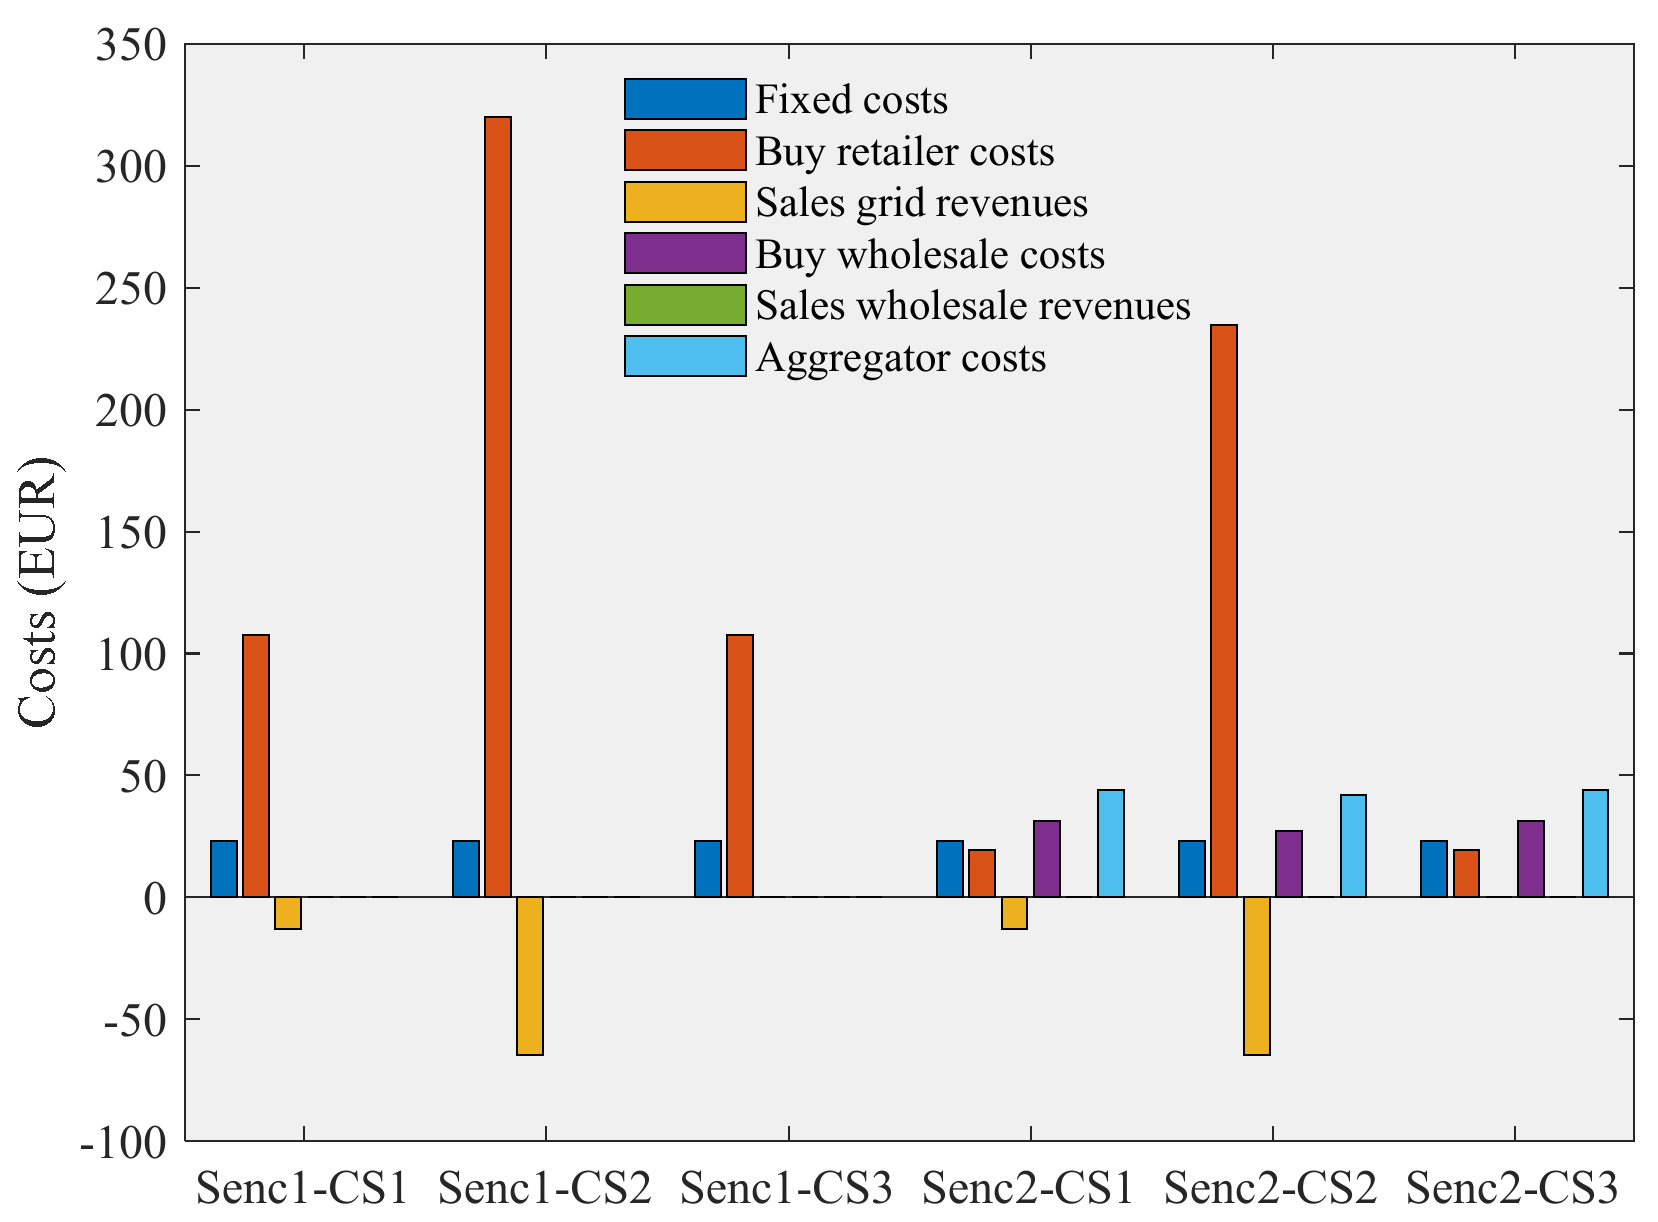
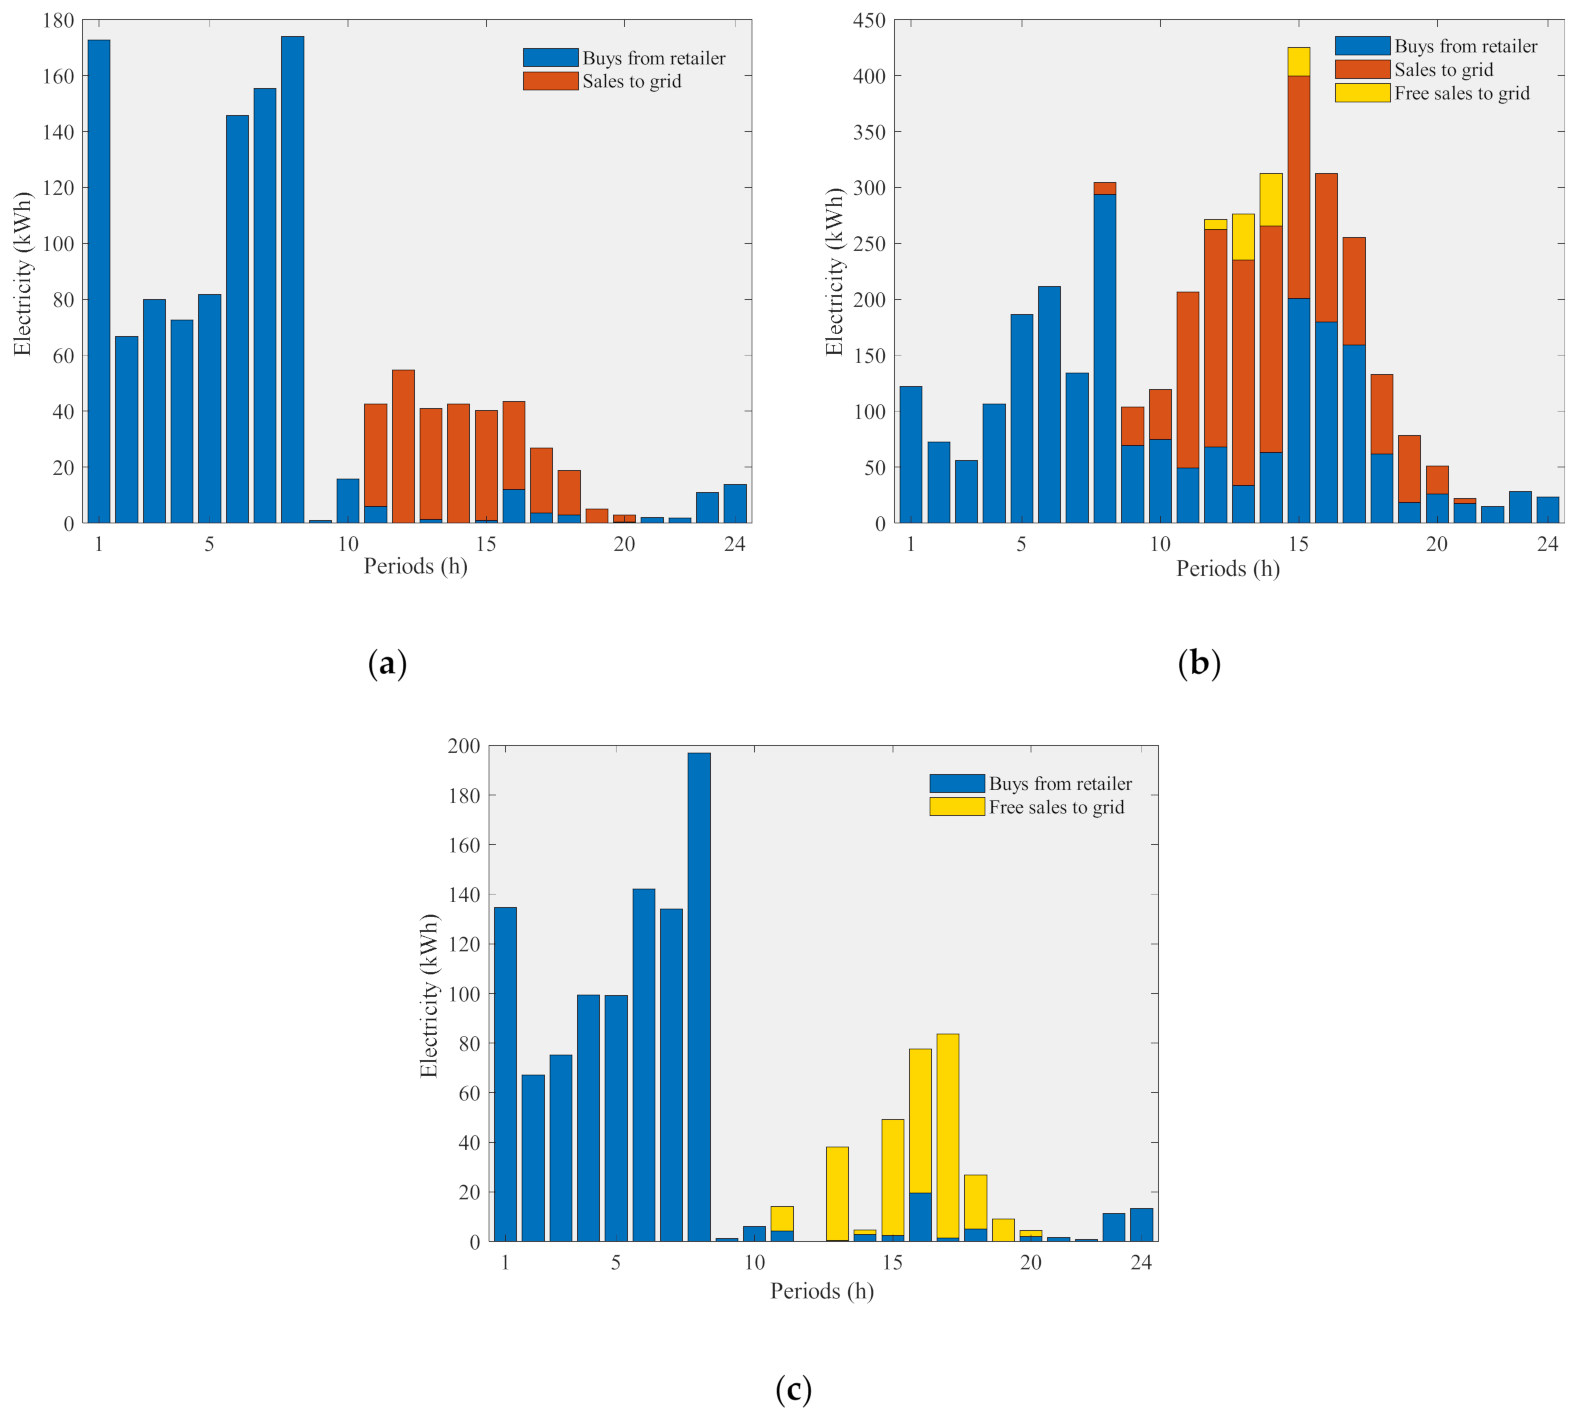
- Scen1-CS1—All-encompassing, without the possibility of transacting electricity in the wholesale market.
- Scen1-CS2—UPP without the possibility of transacting electricity in the wholesale market.
- Scen1-CS3—UPAC without the possibility of transacting electricity in the wholesale market.
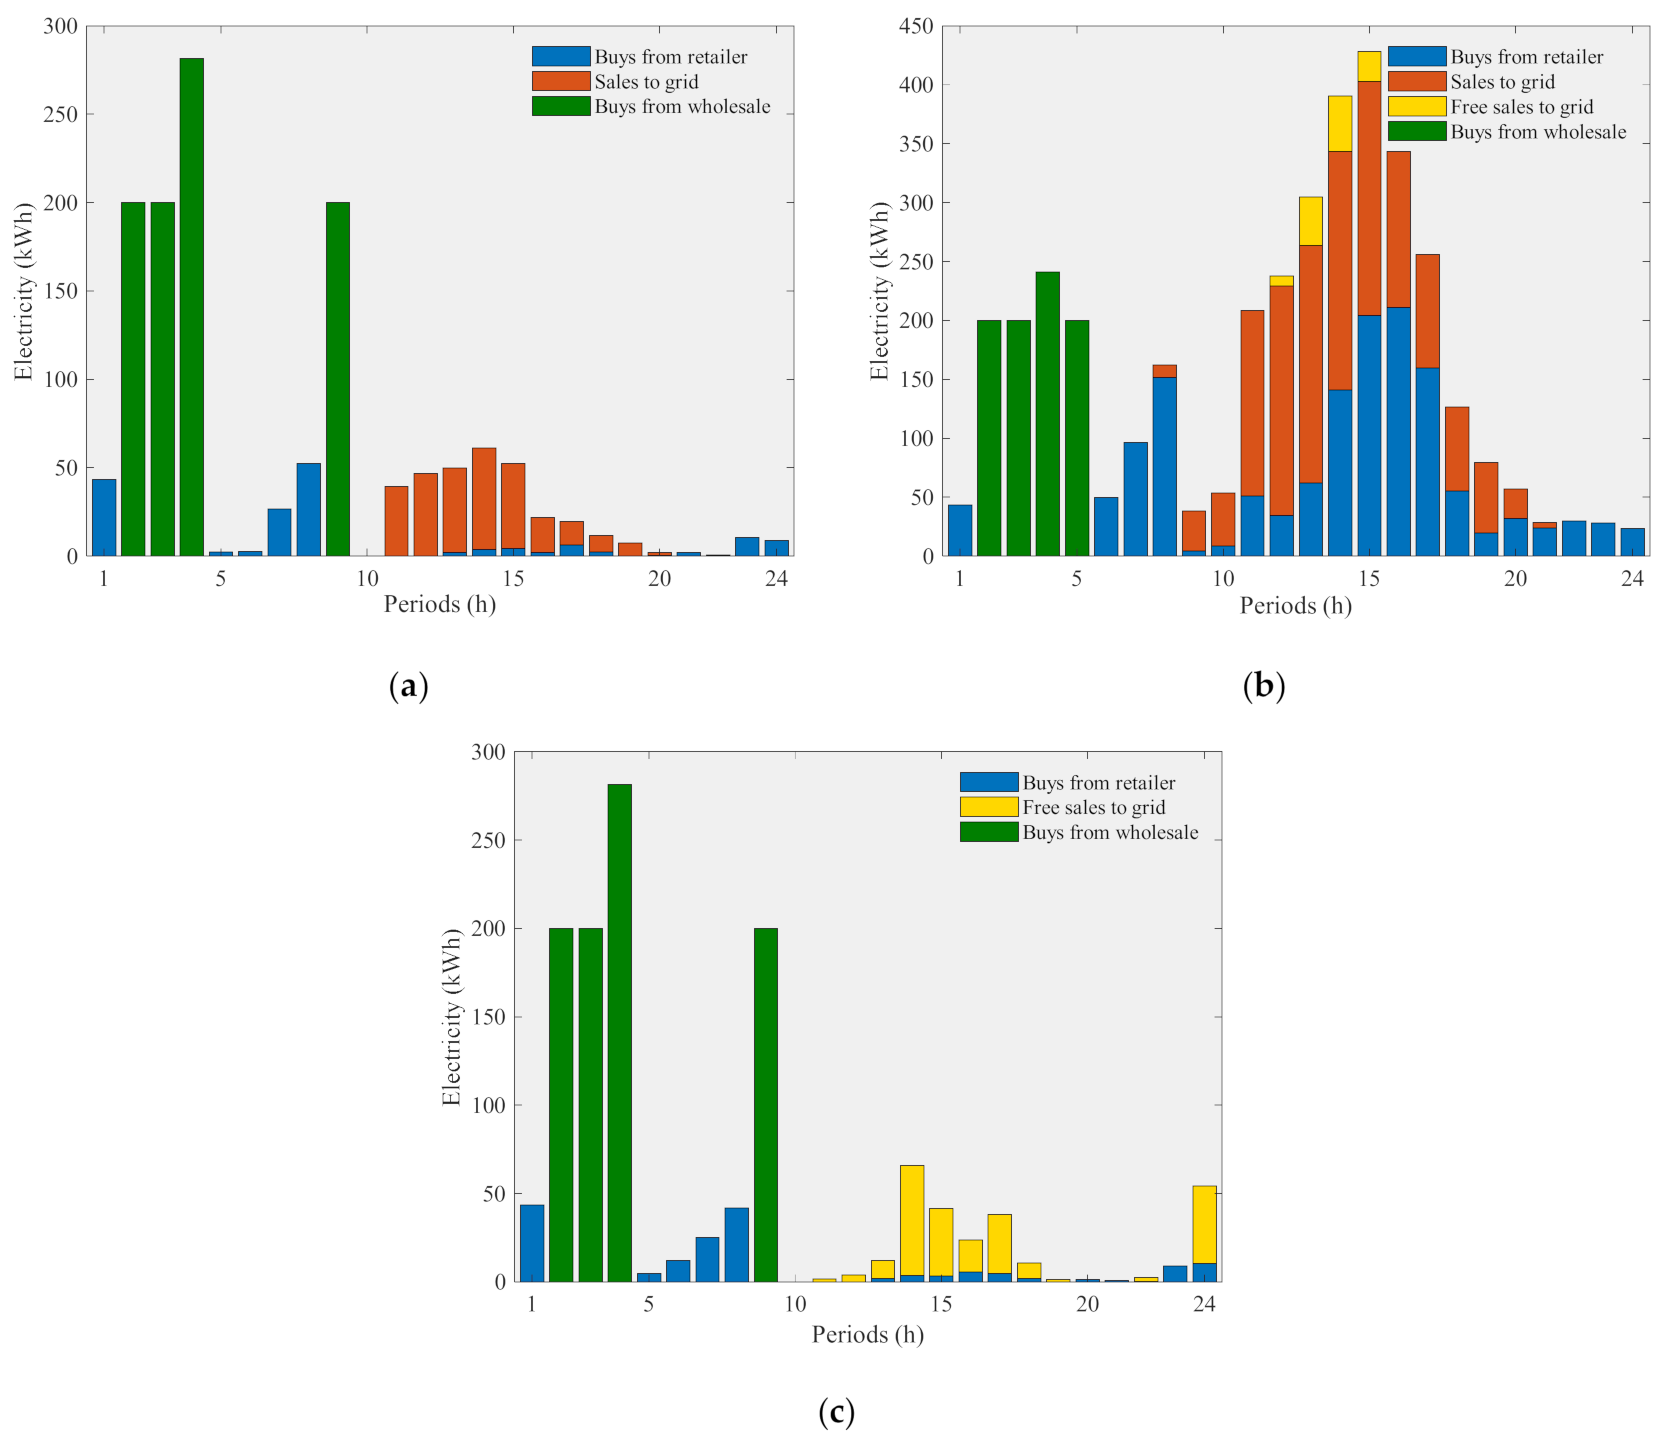
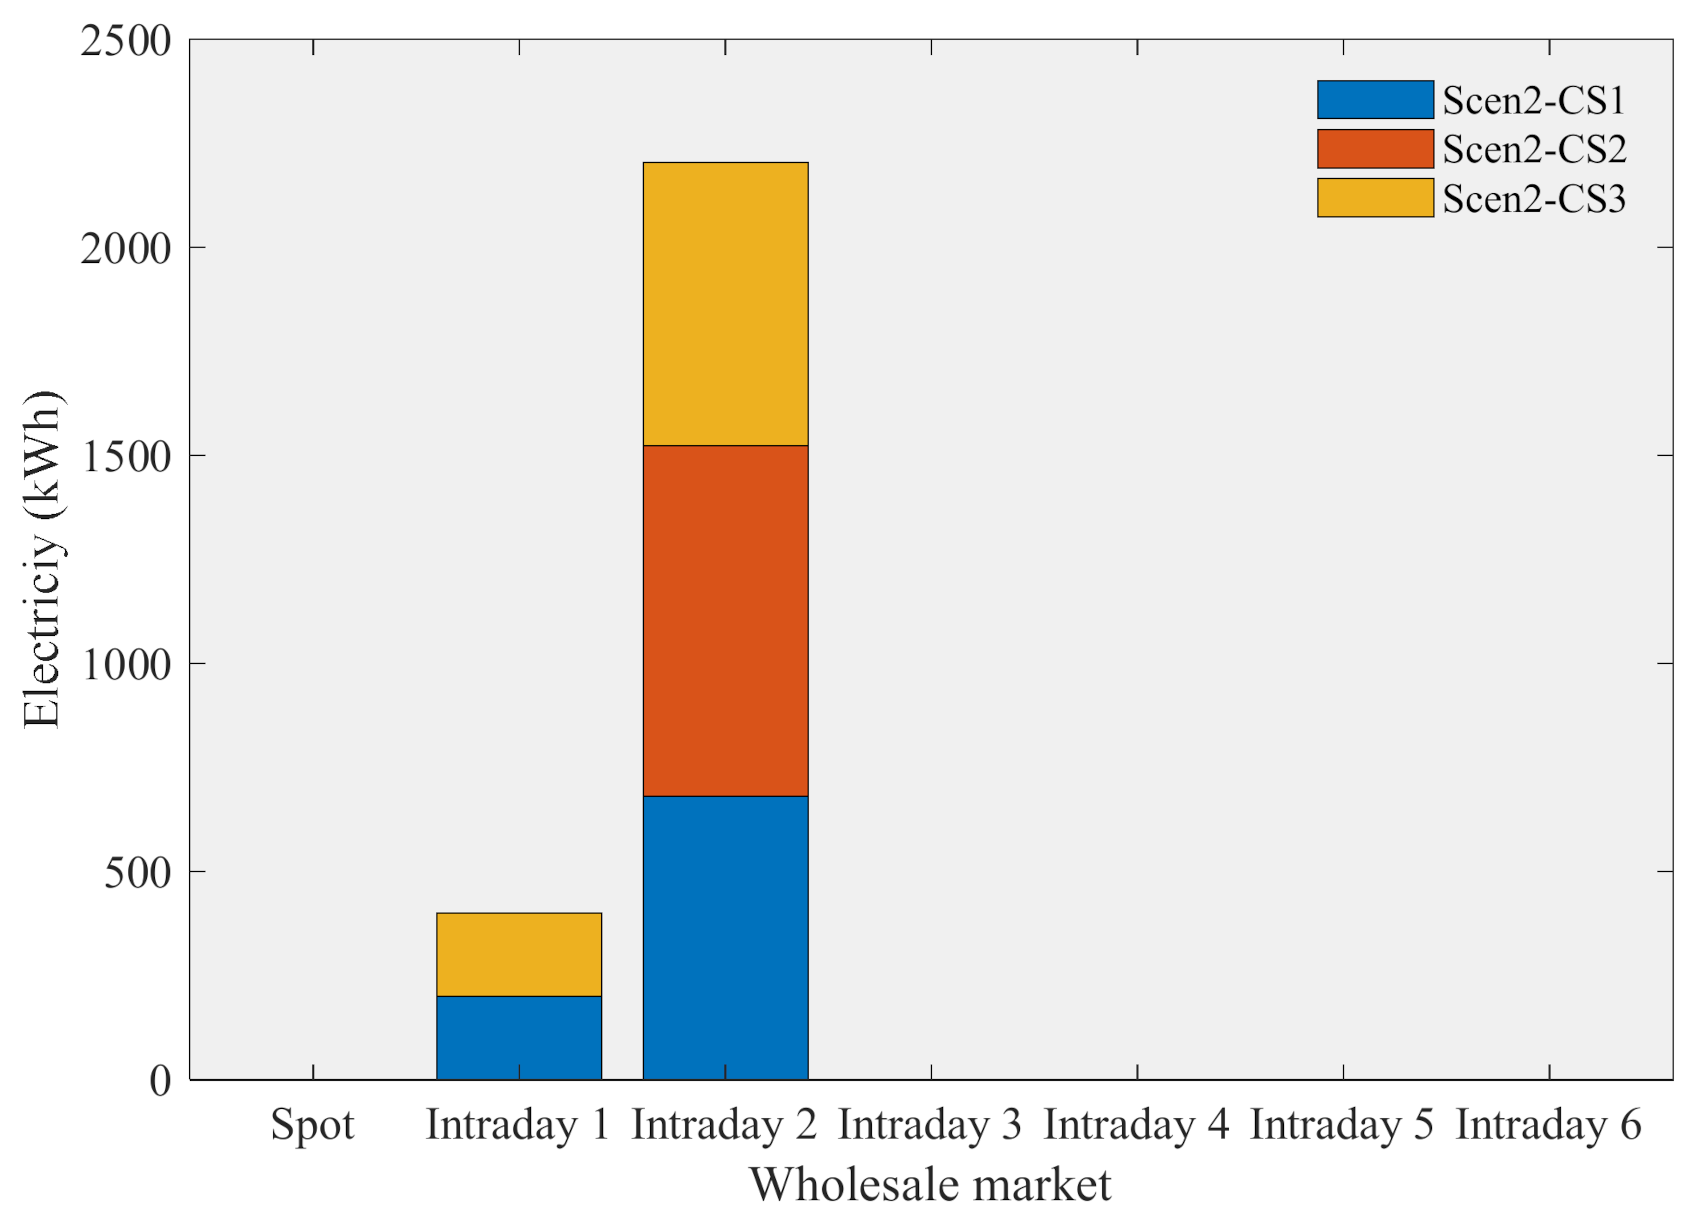
- Scen2-CS1—All-encompassing, with the possibility of transacting electricity in the wholesale market.
- Scen2-CS2—UPP with the possibility of transacting electricity in the wholesale market.
- Scen2-CS3—UPAC with the possibility of transacting electricity in the wholesale market.
6. Conclusions
Author Contributions
Funding
Institutional Review Board Statement
Informed Consent Statement
Data Availability Statement
Conflicts of Interest
References
- European Commission. Greenhouse Gas Emissions—Raising the Ambition. Available online: https://ec.europa.eu/clima/policies/strategies/2030_en (accessed on 16 December 2020).
- Meynkhard, A. Long-term prospects for the development energy complex of Russia. Int. J. Energy Econ. Policy 2020, 10, 224–232. [Google Scholar] [CrossRef]
- Liu, G.; Xu, Y.; Tomsovic, K. Bidding strategy for microgrid in day-ahead market based on hybrid stochastic/robust optimization. IEEE Trans. Smart Grid 2016, 7, 227–237. [Google Scholar] [CrossRef]
- Adefarati, T.; Bansal, R.C. Reliability and economic assessment of a microgrid power system with the integration of renewable energy resources. Appl. Energy 2017, 206, 911–933. [Google Scholar] [CrossRef]
- Faia, R.; Canizes, B.; Faria, P.; Vale, Z.; Terras, J.M.; Cunha, L.V. Optimal Distribution Grid Operation Using Demand Response. In Proceedings of the 2020 IEEE PES Innovative Smart Grid Technologies Europe (ISGT-Europe), The Hague, The Netherlands, 26–28 October 2020; pp. 1221–1225. [Google Scholar]
- Faia, R.; Canizes, B.; Faria, P.; Vale, Z. Distribution Network Expansion Planning Considering the Flexibility Value for Distribution System Operator. In Proceedings of the 2019 International Conference on Smart Energy Systems and Technologies (SEST), Porto, Portugal, 9–11 September 2019; pp. 1–6. [Google Scholar]
- REN21. Global Status Report. 2019. Available online: https://www.ren21.net/wp-content/uploads/2019/05/gsr_2020_full_report_en.pdf. (accessed on 18 June 2021).
- Cox, S.; Walters, T.; Esterly, S.; Booth, S.; Clean, B.; Llc, E. Solar Power: Policy Overview and Good Practices. 2015. Available online: https://www.nrel.gov/docs/fy15osti/64178.pdf (accessed on 18 June 2021).
- Ministério do Ambiente e Ordenamento do Território e Energia. Portaria n.° 15/2015; Ministério do Ambiente e Ordenamento do Território e Energia: Lisboa, Portugal, 2015; pp. 531–532.
- Ambiente e Ação Climática. Portaria n.° 80/2020; Diário da República n.° 60/2020: Lisboa, Portugal, 2020; pp. 5–7.
- Castaneda, M.; Zapata, S.; Cherni, J.; Aristizabal, A.J.; Dyner, I. The long-term effects of cautious feed-in tariff reductions on photovoltaic generation in the UK residential sector. Renew. Energy 2020, 155, 1432–1443. [Google Scholar] [CrossRef]
- Karneyeva, Y.; Wüstenhagen, R. Solar feed-in tariffs in a post-grid parity world: The role of risk, investor diversity and business models. Energy Policy 2017, 106, 445–456. [Google Scholar] [CrossRef]
- An, J.; Mikhaylov, A.; Richter, U.H. Trade war effects: Evidence from sectors of energy and resources in Africa. Heliyon 2020, 6. [Google Scholar] [CrossRef] [PubMed]
- Ministério do Ambiente e Ordenamento do Território e Energia. Decreto-Lei n.° 153/2014; Diário da República n.° 202/2014: Lisboa, Portugal, 2014; pp. 5298–5311.
- Pinto, T.; Vale, Z.A.; Morais, H.; Praca, I.; Ramos, C. Multi-agent based electricity market simulator with VPP: Conceptual and implementation issues. In Proceedings of the 2009 IEEE Power & Energy Society General Meeting, Calgary, AB, Canada, 26–30 July 2009; pp. 1–9. [Google Scholar]
- Henriquez, R.; Wenzel, G.; Olivares, D.E.; Negrete-Pincetic, M. Participation of demand response aggregators in electricity markets: Optimal portfolio management. IEEE Trans. Smart Grid 2018, 9, 4861–4871. [Google Scholar] [CrossRef]
- Lezama, F.; Faia, R.; Faria, P.; Vale, Z. Demand Response of Residential Houses Equipped with PV-Battery Systems: An Application Study Using Evolutionary Algorithms. Energies 2020, 13, 2466. [Google Scholar] [CrossRef]
- Vardanyan, Y.; Wolf, A.; Bacher, P.; Valalaki, K.; Leerbeck, K.; Tual, R.; Cuno, S. Optimal coordinated bidding of a profit-maximizing heat pump aggregator: The Dutch case. In Proceedings of the 2020 International Conference on Smart Grids and Energy Systems (SGES), Perth, Australia, 23–26 November 2020; pp. 71–76. [Google Scholar]
- Clairand, J.M. Participation of electric vehicle aggregators in ancillary services considering users’ preferences. Sustainability 2020, 12, 8. [Google Scholar] [CrossRef] [Green Version]
- Sheikhahmadi, P.; Bahramara, S. The participation of a renewable energy-based aggregator in real-time market: A Bi-level approach. J. Clean. Prod. 2020, 276, 123149. [Google Scholar] [CrossRef]
- Gao, N.; Ge, S.; Tian, Y.; You, C. A Review of Decision-Making Strategies of Profit-Seeking Demand Response Aggregators. In Proceedings of the 2020 IEEE Sustainable Power and Energy Conference (iSPEC), Chengdu, China, 23–25 November 2020; Volume 9, pp. 2135–2140. [Google Scholar]
- Habibifar, R.; Aris Lekvan, A.; Ehsan, M. A risk-constrained decision support tool for EV aggregators participating in energy and frequency regulation markets. Electr. Power Syst. Res. 2020, 185. [Google Scholar] [CrossRef]
- Stede, J.; Arnold, K.; Dufter, C.; Holtz, G.; von Roon, S.; Richstein, J.C. The Role of Aggregators in Facilitating Industrial Demand Response: Evidence from Germany. SSRN Electron. J. 2020. [Google Scholar] [CrossRef] [Green Version]
- Mousavi, M.; Wu, M. A DSO framework for comprehensive market participation of der aggregators. IEEE Power Energy Soc. Gen. Meet. 2020. [Google Scholar] [CrossRef]
- Pinto, T.; Morais, H.; Sousa, T.; Sousa, T.M.; Vale, Z.; Praça, I.; Faia, R.; Pires, E.J.S. Adaptive Portfolio Optimization for Multiple Electricity Markets Participation. IEEE Trans. Neural Netw. Learn. Syst. 2016, 27, 1720–1733. [Google Scholar] [CrossRef] [PubMed]
- Pastor, R.; Da Silva, N.P.; Esteves, J.; Pestana, R. Market-based bidding strategy for variable renewable generation in the MIBEL. Int. Conf. Eur. Energy Mark. EEM 2018. [Google Scholar] [CrossRef]
- Iria, J.; Soares, F. A cluster-based optimization approach to support the participation of an aggregator of a larger number of prosumers in the day-ahead energy market. Electr. Power Syst. Res. 2019, 168, 324–335. [Google Scholar] [CrossRef]
- Schittekatte, T.; Deschamps, V.; Meeus, L. The regulatory framework for independent aggregators. Electr. J. 2021, 34, 106971. [Google Scholar] [CrossRef]
- Faia, R.; Soares, J.; Pinto, T.; Lezama, F.; Vale, Z.; Corchado, J.M. Optimal Model for Local Energy Community Scheduling Considering Peer to Peer Electricity Transactions. IEEE Access 2021, 9, 12420–12430. [Google Scholar] [CrossRef]
- OMI—Polo Español, S.A. (OMIE) OMIE. Available online: https://www.omie.es/pt/market-results/daily/daily-market/daily-hourly-price?scope=daily&date=2020-09-01 (accessed on 1 September 2020).


| CS 1 | CS 2 | CS 3 | ||||
|---|---|---|---|---|---|---|
| UPP | UPAC | |||||
| Scenario 1 | Buy | Retailer | Yes | Yes | Yes | |
| Sell | RESP * | Yes | All | No | ||
| Self-consumption | Yes | No | Yes | |||
| Scenario 2 | Buy | Retailer | Yes | Yes | Yes | |
| MIBEL via AGG | Spot | Yes | Yes | Yes | ||
| Intra-Day | Yes | Yes | Yes | |||
| Sell | RESP * | Yes | Yes | No | ||
| MIBEL via AGG | Spot | Yes | No | Yes | ||
| Intra-Day | Yes | No | Yes | |||
| Self-consumption | Yes | No | Yes | |||
| Variants | Type | Wholesale Market | Total Costs (EUR) | Average Costs (EUR) | Time (s) | |
|---|---|---|---|---|---|---|
| Scen1 | CS1 | All-encompassing | No | 117.41 | 2.15 | 2.34 |
| CS2 | UPP | No | 278.48 | 5.57 | 1.93 | |
| CS3 | UPAC | No | 130.50 | 2.61 | 2.18 | |
| Scen2 | CS1 | All-encompassing | Yes | 104.66 | 2.09 | 225.19 |
| CS2 | UPP | Yes | 262.80 | 5.26 | 10.68 | |
| CS3 | UPAC | Yes | 117.76 | 2.36 | 583.23 | |
| Accumulated Transactions (kWh) | Variants | ||||||
|---|---|---|---|---|---|---|---|
| Scen1-CS1 | Scen1-CS2 | Scen1-CS3 | Scen2-CS1 | Scen2-CS2 | Scen2-CS3 | ||
| Buys from retailer | 1020.83 | 2270.57 | 1020.83 | 170.24 | 1429.44 | 170.24 | |
| Sales to grid | 291.14 | 1434.06 | - | 291.14 | 1434.06 | - | |
| Free sales to the grid | 0 | 122.53 | 270.05 | 0 | 122.53 | 223.43 | |
| Buys from wholesale | Spot | - | _- | - | 0 | 0 | 0 |
| Intraday sessions | - | - | - | 881.43 | 841.13 | 881.43 | |
| Sales to wholesale | Spot | - | - | - | 0 | 0 | 0 |
| Intraday sessions | - | - | - | 0 | 0 | 0 | |
Publisher’s Note: MDPI stays neutral with regard to jurisdictional claims in published maps and institutional affiliations. |
© 2021 by the authors. Licensee MDPI, Basel, Switzerland. This article is an open access article distributed under the terms and conditions of the Creative Commons Attribution (CC BY) license (https://creativecommons.org/licenses/by/4.0/).
Share and Cite
Faia, R.; Pinto, T.; Vale, Z.; Corchado, J.M. Prosumer Community Portfolio Optimization via Aggregator: The Case of the Iberian Electricity Market and Portuguese Retail Market. Energies 2021, 14, 3747. https://doi.org/10.3390/en14133747
Faia R, Pinto T, Vale Z, Corchado JM. Prosumer Community Portfolio Optimization via Aggregator: The Case of the Iberian Electricity Market and Portuguese Retail Market. Energies. 2021; 14(13):3747. https://doi.org/10.3390/en14133747
Chicago/Turabian StyleFaia, Ricardo, Tiago Pinto, Zita Vale, and Juan Manuel Corchado. 2021. "Prosumer Community Portfolio Optimization via Aggregator: The Case of the Iberian Electricity Market and Portuguese Retail Market" Energies 14, no. 13: 3747. https://doi.org/10.3390/en14133747
APA StyleFaia, R., Pinto, T., Vale, Z., & Corchado, J. M. (2021). Prosumer Community Portfolio Optimization via Aggregator: The Case of the Iberian Electricity Market and Portuguese Retail Market. Energies, 14(13), 3747. https://doi.org/10.3390/en14133747