Abstract
Ocean renewable wave power is one of the more encouraging inexhaustible energy sources, with the potential to be exploited for nearly 337 GW worldwide. However, compared with other sources of renewables, wave energy technologies have not been fully developed, and the produced energy price is not as competitive as that of wind or solar renewable technologies. In order to commercialise ocean wave technologies, a wide range of optimisation methodologies have been proposed in the last decade. However, evaluations and comparisons of the performance of state-of-the-art bio-inspired optimisation algorithms have not been contemplated for wave energy converters’ optimisation. In this work, we conduct a comprehensive investigation, evaluation and comparison of the optimisation of the geometry, tether angles and power take-off (PTO) settings of a wave energy converter (WEC) using bio-inspired swarm-evolutionary optimisation algorithms based on a sample wave regime at a site in the Mediterranean Sea, in the west of Sicily, Italy. An improved version of a recent optimisation algorithm, called the Moth–Flame Optimiser (MFO), is also proposed for this application area. The results demonstrated that the proposed MFO can outperform other optimisation methods in maximising the total power harnessed from a WEC.
1. Introduction
Global energy demand has increased tremendously during the last decade and is expected to surge by in 2021 [1] and rise to 45% by 2040 [2]. Renewable energy sources are considered alternatives and are one of the fastest-growing technologies globally. Renewables are set to produce around of generated electricity globally in 2021. The most significant contribution is from solar and wind renewable energy. The electricity produced from wind power and solar PV is predicted to increase by 275 terawatt-hours and 145 terawatt-hours in 2021, respectively. More than of the world’s green power has been generated by China, followed by the United States, the European Union (EU) and India [1].
Ocean wave energy is currently considered the cleanest, safest and most reliable source of renewable energy [3]. Furthermore, the density of wave energy is significantly higher than that of solar and wind energy [4]. Nevertheless, this new kind of renewable energy needs more development and has not fully matured; its commercial perception is still shallow. The main reason for this is that the cost associated with generating energy using sea waves is much higher than that of other kinds of renewable and clean power, such as wind energy [5].
To handle these challenges, numerous studies have been conducted in order to optimise different aspects of wave energy converters (WECs), such as geometry parameters [6,7,8,9,10,11], power take-off settings (PTO) [12,13] and the arrangement of WECs [14,15,16,17,18]. The optimisation of the shape of WECs can be significant for wave energy conversion models, such as oscillating water columns, where the optimum parameters achieved an immersion depth of of the water depth and a chamber diameter of of the water depth [19]), and over-topping designs [20], where the optimum length to opening ratio should be 2.5–3 m.
Most of the studies on optimising the geometry parameters of WECs have been developed to examine a few predefined shapes, because the computational cost of exploring the multi-parameter search space and assessing all feasible designs is high.
This paper develops an improved Moth–Flame Optimisation (IMFO) method in order to maximise the harnessed power output of a WEC. To evaluate the quality of the best-found configurations using the IMFO, we developed a comparison framework including five robust and popular optimisation algorithms including Grey Wolf Optimiser [21] (GWO), Whale Optimisation Algorithm (WOA) [22], standard Moth–Flame Optimisation Algorithm (MFO) [23], Particle Swarm Optimisation (PSO) [24] and Covariance matrix adaptation evolution strategy (CMA-ES) [25]. The experimental results confirm that the proposed MFO method performed the best compared with the other meta-heuristics applied in this work, in terms of higher produced power.
The structure of the article is as follows: Section 2 presents a review of the previous developments of the shape and PTO parameters. Next, Section 3 describes the details of the WEC design and the formulas that are used in order to simulate the incorporated power. Then, the optimisation problem is explained, and Section 5 outlines the proposed and applied meta-heuristic approaches. The optimisation performances are introduced and studied in Section 6. Subsequently, Section 7 presents the conclusions of this research.
2. Related Works
One of the initial efforts to optimise the shape of WECs was proposed by Vantorre et al. [26]; an assortment of geometries for a heaving point absorber were evaluated and compared based on the Belgian coastal area. These shapes incorporated a hemisphere and two different conical geometries. In [26], the most reliable power efficiency was achieved with a cylindrical cone at 90.
Goggins and Finnegan [27] investigated different heights and radii for a point absorber with a vertical-shape cylinder under wave conditions off the west coast of Ireland. Goggins and Finnegan [27] proposed that a trimmed cylinder with a hemisphere, with a full draft at an aspect ratio of 2.5, can produce the maximum power. However, Hager et al. [28] suggested that a concave-shape buoy can extract more power from ocean waves than other shapes, such as a flat or convex model, after evaluating several asymmetrical converter designs.
Another recent published study recommends using a bi-cubic B-spline wave converter shape [29], which can produce more energy than other conventional WEC models. Recently, Neshat et al. [30] proposed a bi-level optimisation algorithm that consists of Grey Wolf Optimiser [21] (GWO) and a self-adaptive differential evolution with ensemble sinusoidal parameter adaptation called LSHADE-EpSin [31]). The authors suggested a large vertical cylinder converter with a radius and height of 14.51 m and 30 m, respectively.
3. Modelling
3.1. Wave Energy Converter
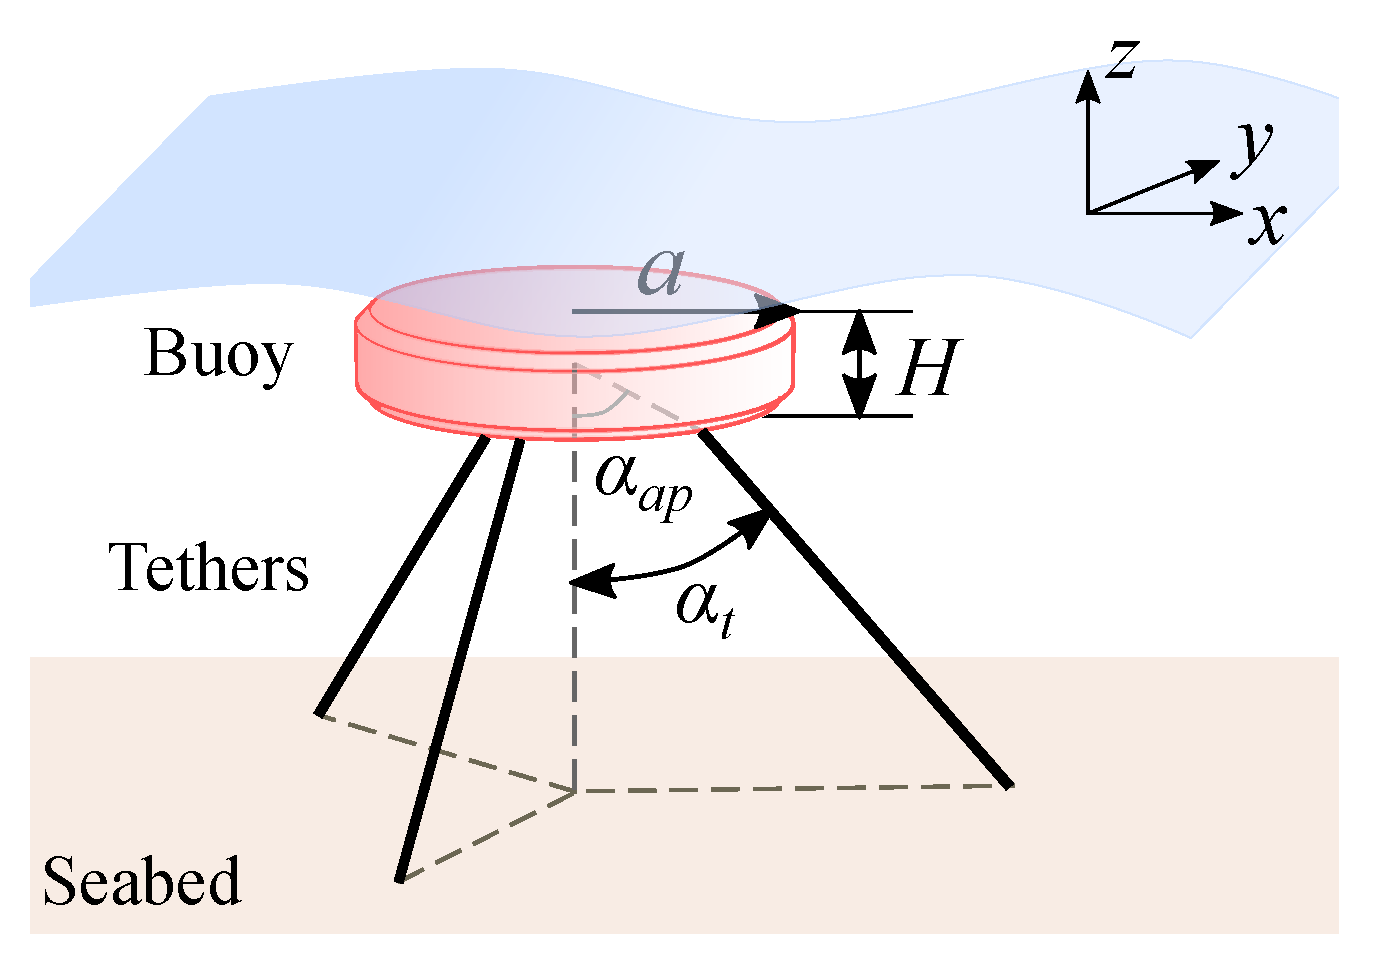
This study focuses on optimising a generic multi-mode wave energy converter that absorbs power from multiple degrees of freedom due to the arrangement of mooring lines. The buoy is positively buoyant, and three inclined tethers should always be under tension to keep it fully submerged. The power is generated using a rotary generator connected to each tether to convert the orbital motion of the WEC to electricity. A simplified sketch of the system is shown in Figure 1. The buoy sits 2 m below the sea water level, has a cylindrical shape, and its geometry is defined by a radius of a and a height of H. The angles and define how the tethers are inclined and attached to the buoy hull.

Figure 1.
A generic multi-mode wave energy converter.
3.2. Site Location and Wave Resource
The wave characteristics dataset was collected using a point absorber located at 37.96 N, 12.04 E, Aegadian sea (Italy), near Marettimo island, over the 32 years between 1979 and 2010. The climate of Marettimo island is Mediterranean; the number of cold months is less than four and the average temperature is below 10 C. Generally, summer is warm (temperature >22 C), dry, and calm in terms of wind speed. Most of the storms happen in the fall and winter seasons. The maximum wind speed is approximately 28 Km/h, blowing from North to North West.
The potential location for this WEC deployment is demonstrated in Figure 2 and the detailed parameters are specified in Table 1.
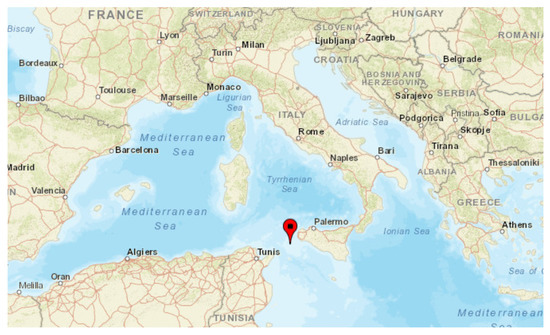
Figure 2.
Location of the Marettimo test site.

Table 1.
Parameters of the Marettimo test site.
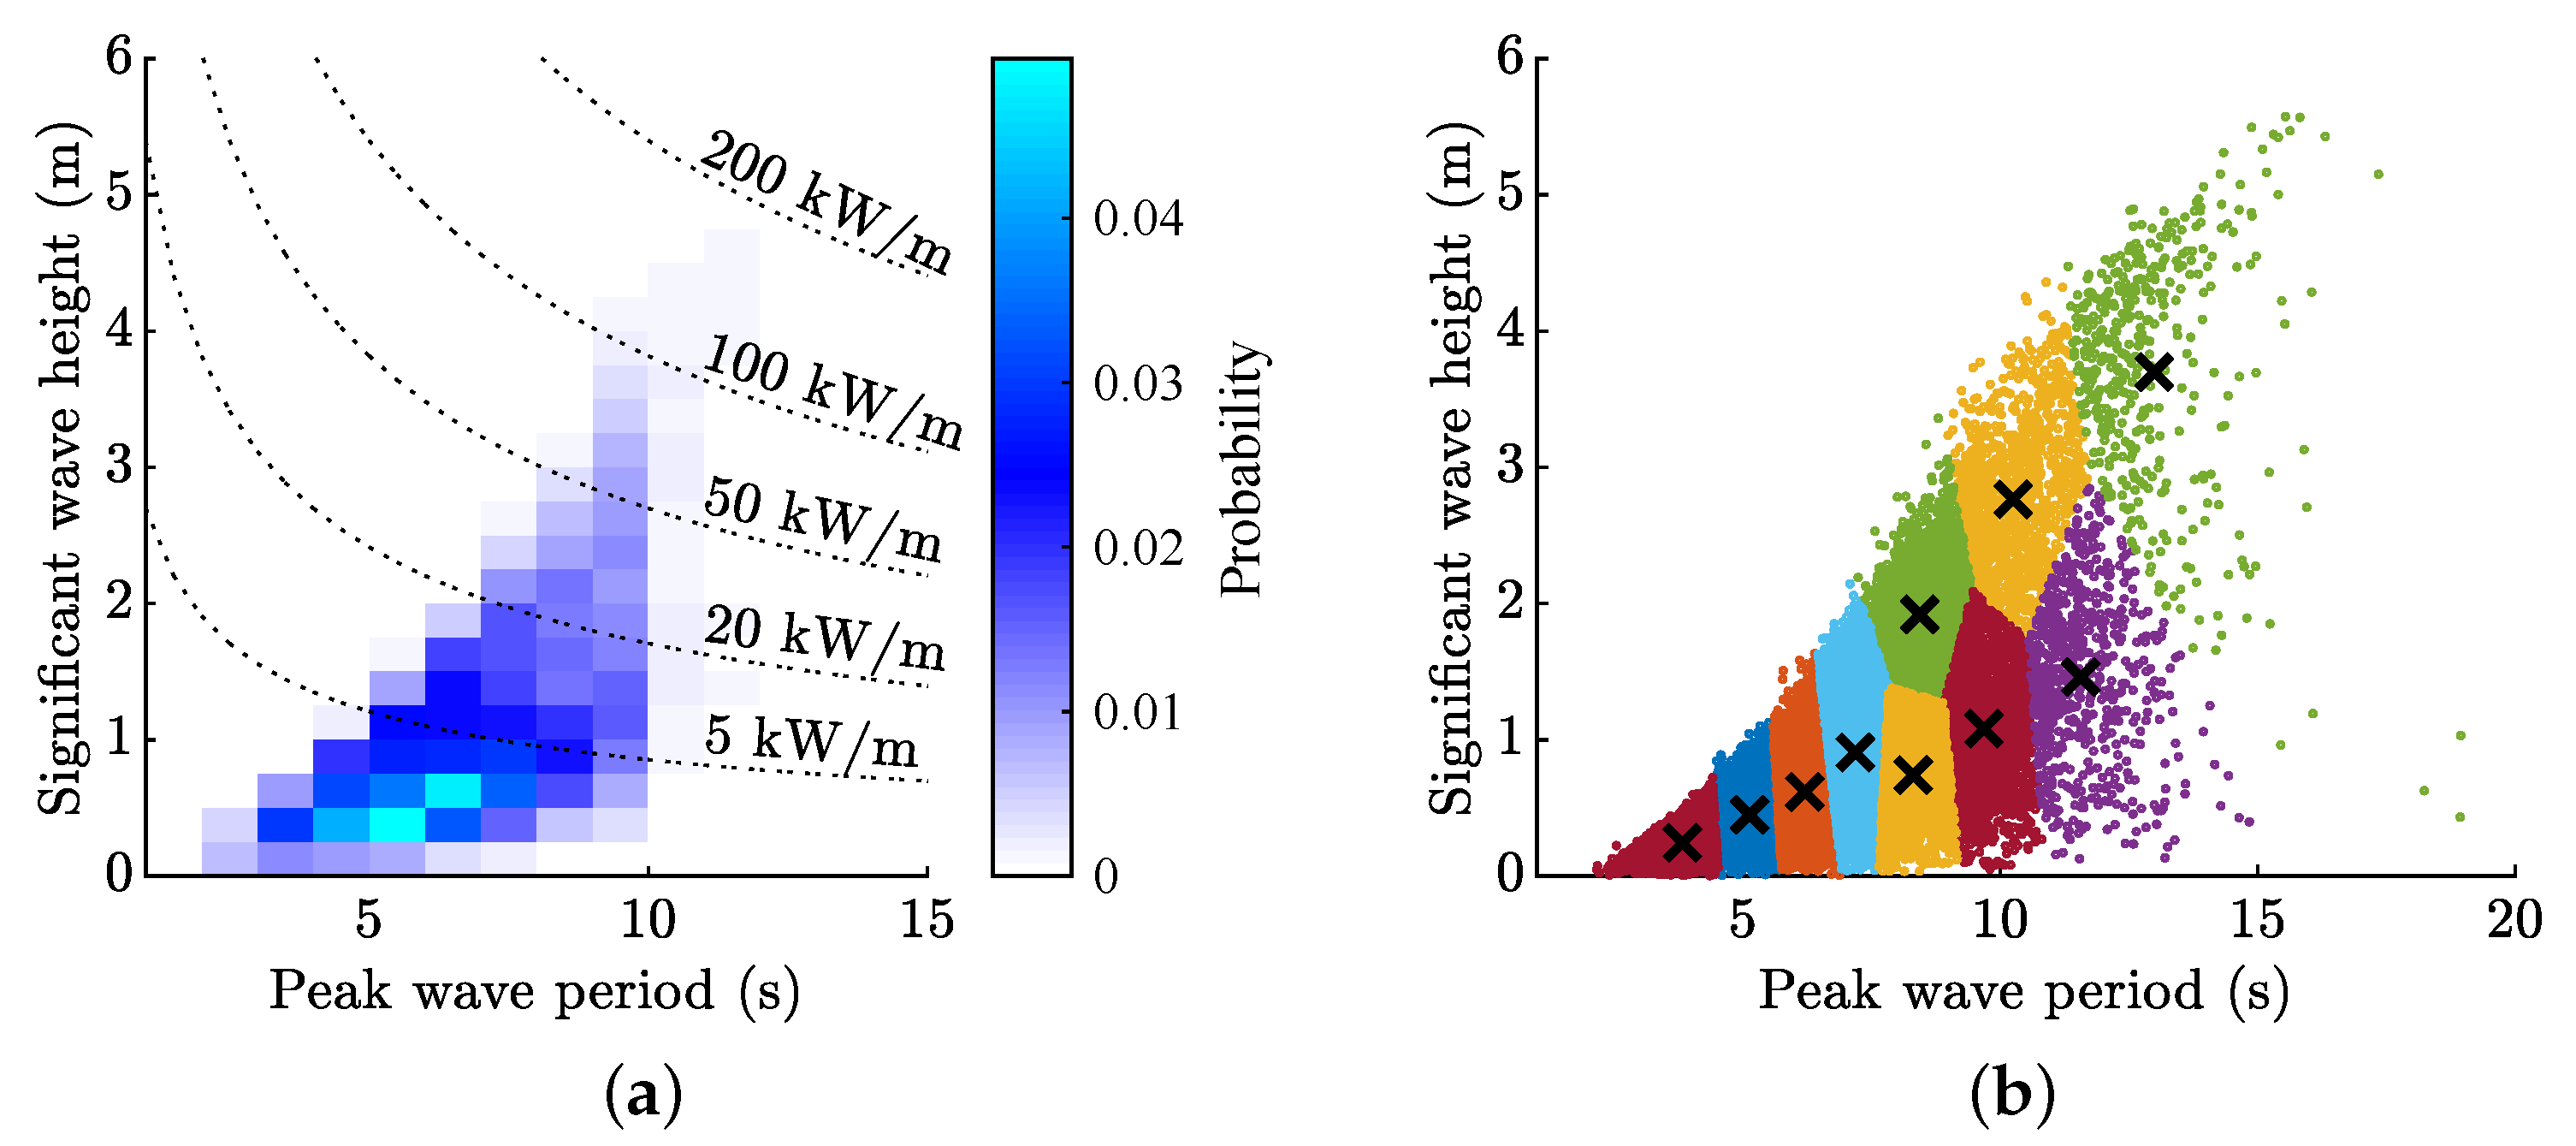
Figure 3a shows the wave scatter diagram of the deployment site. The wave climate is not energetic, with a wave power density of 6.38 kW/m. The dominant wave period is approximately 6 s, and the dominant wave height is less than 1 m.
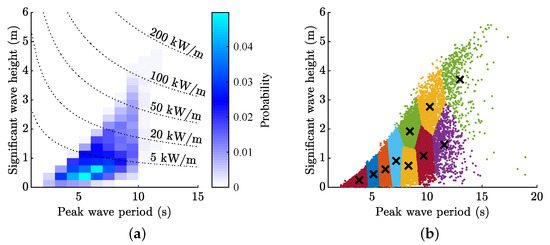
Figure 3.
The Marettimo test site: (a) wave scatter diagram and (b) ten representative sea states identified using the k-means clustering method.
As optimisation requires a large number of objective function evaluations, it is possible to replace the wave climate in Figure 3a with a subset of sea states in order to evaluate the performance of the WEC. Following the procedure explained in [34], a cluster analysis was applied to extract 10 representative sea states using the k-means clustering method, as shown in Figure 3b. The probability of each centroid was then recalculated to make sure that the weighted wave power flux from each centroid corresponded to the sum of all of the probabilities within each cluster.
3.3. Equations of Motion
For this work, it was assumed that waves are mono-directional and propagate along the x axis. The wave structure interaction was modelled using linear wave theory assuming inviscid, irrotational and incompressible fluid. The only nonlinear effects included in the WEC model were viscous forces. It was assumed that the PTO machinery behaves as a linear spring-damper system, where spring and damper parameters that are identical for all three generators are optimised for each sea state of interest.
The dynamics of the WEC were modelled using a spectral-domain approach, where all nonlinear forces were replaced by equivalent linear matrices that were calculated iteratively, applying the statistical linearisation technique [35]. The WEC motion is described by the vector , which represents the complex amplitude of the buoy velocity in all six degrees of freedom:
where is the diagonal mass matrix, is the frequency-dependent matrix of added mass coefficients, is the frequency-dependent radiation damping matrix, and are linearised stiffness and damping matrices that represent the load from the power take-off machinery (refer to [36]), is the equivalent damping term that corresponds to the viscous drag force, and is the excitation force vector ( is the wave amplitude, and is the vector of excitation force coefficients).
In this work, the hydrodynamic parameters , and were calculated using a semi-analytical model [37,38]. The mass matrix is defined by the buoy geometry, assuming that the mass of the buoy is equal to half of the displaced water mass. The PTO matrices and are defined by the arrangement of tethers and PTO control parameters. The value of the equivalent damping term depends on the WEC motion and should be calculated iteratively according to [35]:
where denotes the mathematical expectation, and the viscous force in time domain has the form:
is the water density, is the diagonal matrix of drag coefficients, is the diagonal matrix of the cross-section areas of the buoy perpendicular to the direction of motion, and ⊙ denotes the Hadamard product (element-wise multiplication).
The following iterative procedure should be followed to estimate and the WEC response in any irregular sea state of interest:
- Step 1.
- Select the sea state of interest and calculate the incident wave spectrum for the given and . A Pierson–Moskowitz wave spectrum was used in this study [39].
- Step 2.
- Calculate the power spectral density (PSD) matrix of the excitation force:where denotes the conjugate transpose of a vector/matrix.
- Step 3.
- Evaluate the WEC transfer function:where is the first iteration.
- Step 4.
- Calculate the PSD matrix of the buoy velocity:
- Step 5.
- Compute the covariance matrix of the buoy velocity:
- Step 6.
- Approximate the viscous damping matrix as [35]:
- Step 7.
- Check the convergence:where n is the iteration number and is set to 0.01. Return to Step 3 if Step 7 is not satisfied.
Equation (1) describes the motion of the WEC in the Cartesian coordinate system. However, the power is generated based on the tether elongations and velocities that can be calculated using the inverse kinematic Jacobian as ( is the vector containing the rate of change of each tether length).
If the damping coefficient of each PTO unit is equal to , the average wave power converted by the WEC in the irregular wave is defined by and is [35]:
where k corresponds to the PTO number, and the variance matrix of the tether velocity is calculated as:
For a location with a wave climate described by the matrix , the annual average power production is:
4. Optimisation Setup
With regard to defining the fitness function, we consider that the most significant optimisation variables of the applied cylinder are as follows: (1) The cylinder radius (a); (2) the aspect ratio, which is the dimension of the cylinder height over the radius (); (3) tether attachment angle (); (4) tether inclination angle (); (5) a vector of parameters of damping PTO; and (6) a vector of stiffness coefficients’ PTO values, which are shown as follows:
The variable numbers of both and vectors are the same at , and also the total length of optimisation designs is 24. These decision variables must be optimised in what follows:
The objective function we considered in this study is:
Equation (15) shows the generated power output, on average, of the WEC in one year, and this power should be maximised. Table 2 presents the feasible ranges of the applied optimisation variables.
Table 2.
The feasible range of the cylinder hyper-parameters settings.
5. Bio-Inspired Optimisation Algorithms
To optimise the performance of a three-tether converter that is fully-submerged, in this paper we mainly considered a broad and well-known optimisation strategy called ‘all-at-once’. In this strategy, we performed the optimisers on all decision variables simultaneously. The mentioned variables are as follows: the radius a, aspect ratio (), both tether inclinations (), attachment angle (), both series of the spring stiffness () and damping coefficients ( ) of the power take-off features.
According to the previous study [30], by analysing the characteristics of the search space of this optimisation problem, we can see that these combined parameters formed a multi-modal, constrained and large-scale search space that is sensitive to PTO parameters alteration. These challenges provide the main motivation for applying the meta-heuristic optimisation methods, which are similar to genetic, evolutionary and swarm optimisation methods.
The meta-heuristics performed and compared in this work incorporate Covariance matrix adaptation evolution strategy (CMA-ES) [40], Grey Wolf Optimiser (GWO) [21], Particle Swarm Optimisation (PSO) [41], Whale Optimisation Algorithm (WOA) [22], standard Moth–Flame Optimisation Algorithm (MFO) [23] and the developed MFO. Table 3 lists the applied optimisation methods and their control parameters, where shows the initial population size; and are cognitive and social acceleration coefficients, respectively; and signifies the inertia weight. In GWO, shows the relative coefficient for balancing the exploration and exploitation of the search process. Moreover, both and explain the convergence coefficients of WOA. denotes a constant in order to determine the shape of the logarithmic spiral.
Table 3.
Details of the control parameters of the applied optimisation algorithms. All algorithms are limited to the same number as the fitness function evaluation.
5.1. Improved Moth–Flame Optimisation (IMFO)
The Moth–Flame Optimisation (MFO) algorithm [23] is a state-of-the-art, nature-inspired meta-heuristic method that demonstrates a considerable performance in optimising various numerical [42,43] and real engineering [44,45] optimisation problems. The principal motivation of the Moth–Flame Optimisation algorithm is the navigating strategy of the moth, called ’transverse orientation’. Indeed, some groups of insects, like the moth family, explore their environment based on a navigation model that involves flying a route at a specific angle based on the distance between them and the light source, such as natural or man-made lights. If the natural light sources are followed by the moths, due to the long distance this navigation system assists with keeping to a straight flight path. However, for the man-made lights, the situation is different and leads to the moths flying in a spiral pattern. Equation (16) shows the mathematical model of this logarithmic spiral movement in one dimension, as follows:
where F denotes the situation of each flame in the search space; M signifies the location of the moth, is the absolute interval between each moth and the existing flame. Moreover, equals a time step. Based on Equation (16), a route from the moth to a flame is formed while t linearly reduces between and 1; b is a constant and restricts the speed of approach to a flame.
In the MFO, particles cross in the d dimensional search space and their situations are depicted as feasible or infeasible solutions. Hence, a population of moths and their situations can be identified as follows:
where n denotes the size of the population, and the fitness value of the solutions are recorded as a vector in the following:
To show the flames, the same matrix that can be seen in Equation (19) is used, and each flame shows the best-found solution so far.
Thus, the area around the flames in the search space is explored by a formal moth in order to search for better solutions. The flames’ situations will be updated when a better configuration is observed. Furthermore, Function I initialises a population of random solutions and then determines the fitness values of the solutions. The following approach is used in this way:
where both and are vectors of decision variables’ upper and lower boundary constraints as follows:
The second step is the P function, which signifies the principal component of the MFO algorithm. This function transfers solutions throughout the search space and also renews the status of the recorded flames during the optimisation process. The state of the -th solution in the population with regard to the -th flame will be updated as follows:
In the MFO, the exploration procedure strengthens the candidate solutions to improve the flying direction in general. As a result, the exploration strategy supports the optimisation process to evade trapping in local optima. Furthermore, the exploitation procedure runs while the new location extends inside the search space between the moth and the flame. The next step of the MFO is to sort the candidate solutions with regard to their quality from the best performers to the worst performers. Later, the moth’s location will be updated again, depending on the corresponding flame. Furthermore, in order to obtain a good balance between the exploitation and exploration processes, an adaptive strategy was recommended. This formula reduces the number of flames through iteration, as follows:
where and N are the number of flames and the size of the population, respectively.
5.2. Diversification Strategy
In the MFO, in order to avoid local optima and premature convergence, and to improve the exploration ability, we proposed a diversification strategy for the MFO. In this mechanism, we alllow the MFO to generate a small percentage of new random solutions in each iteration, based on a probability threshold (). These newly generated solutions keep the diversity between the solutions in the population and lead to strengthening the exploration ability until the last iterations. This is mainly because, in the last iterations of the standard MFO, the diversity rate of the population has been reduced and the search algorithm is not able to explore properly. Equation (24) shows the formulation of the diversification strategy.
As in the standard MFO, the number of both moths and flames dwindles, and the exploration ability gradually weakens. The proposed improved MFO was developed using a simple and effective diversification strategy. Therefore, keeping the population diversity extends the algorithm’s global search capability and prevents premature convergence. However, it is expected that the convergence rate of IMFO decreases due to the generation and addition of a few random design solutions in the population. This improved algorithm will be applied to case studies in the next section.
6. Results and Discussions
In this paper, in order to evaluate the searchability of the proposed IMFO algorithm, we developed a comparative framework consisting of a well-known evolutionary algorithm—called CMA-ES [40]—and four popular swarm intelligence methods—Particle Swarm Optimisation (PSO) [41], Grey Wolf Optimiser (GWO) [21], Whale Optimisation Algorithm (WOA) [22] and standard Moth–Flame Optimisation Algorithm (MFO) [23].
The applied control parameters for all optimisation methods are listed in Table 3, as suggested by their developers. In this way, we developed a fair comparison between the applied optimisation methods.
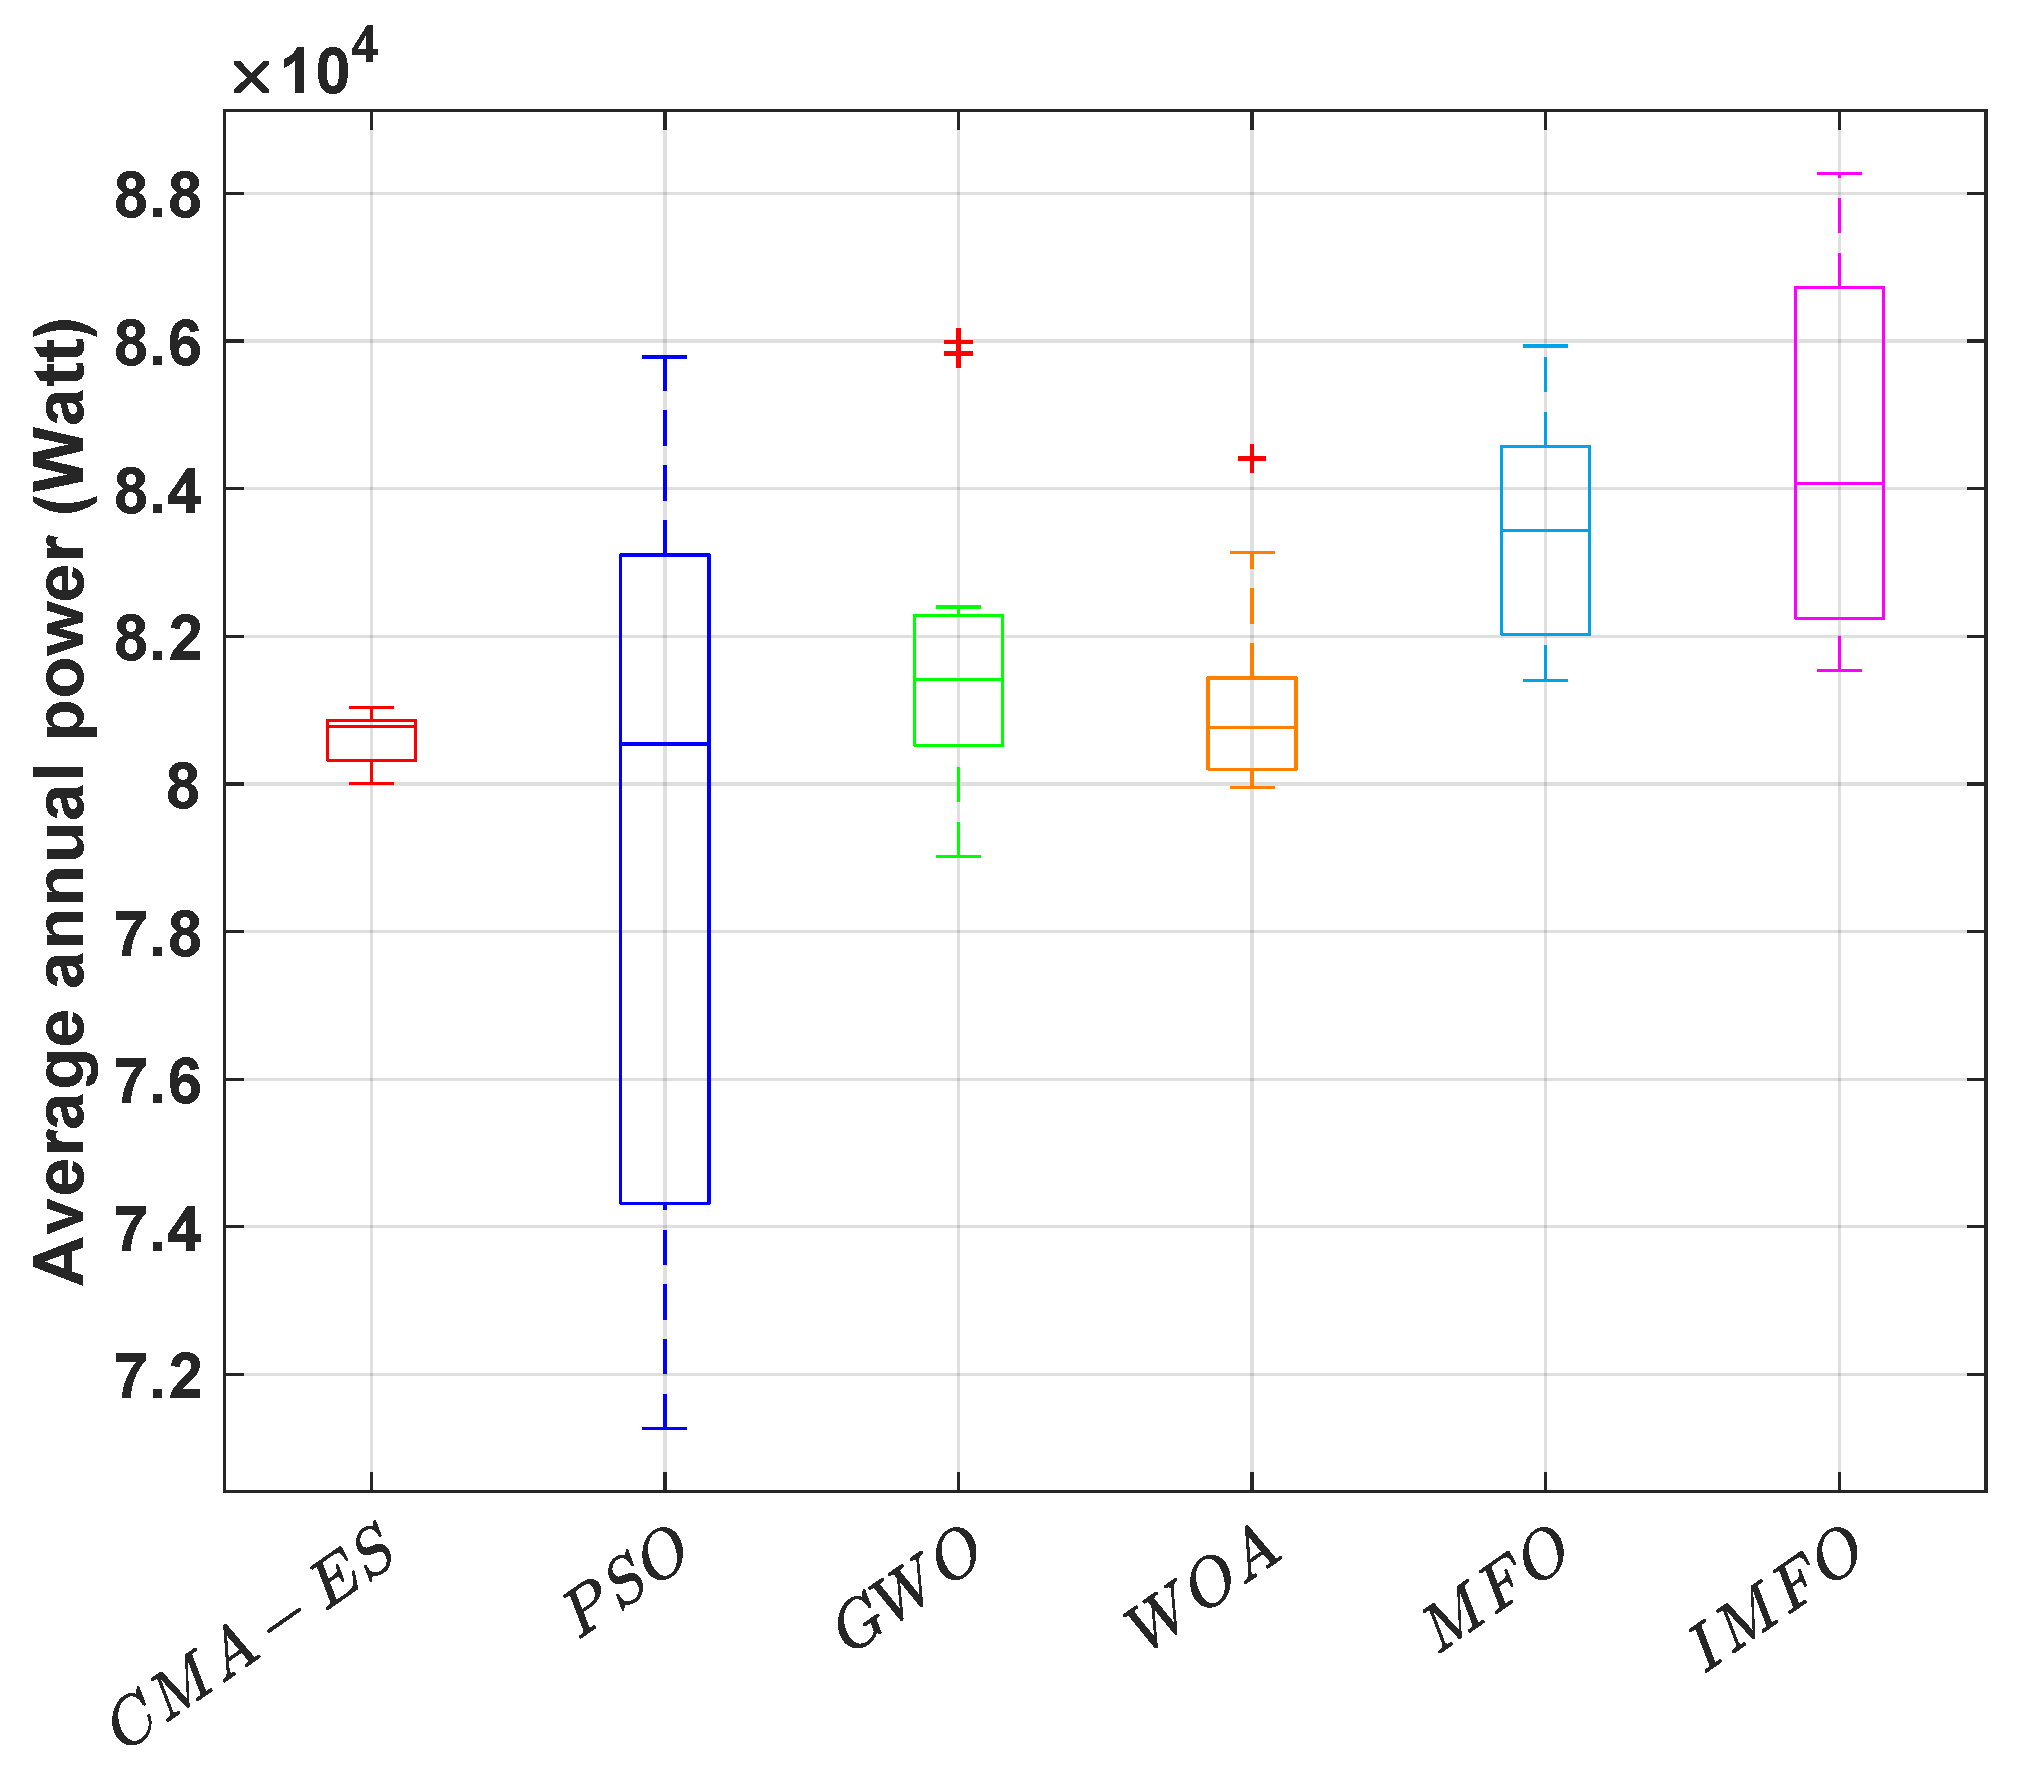
In the first step of this comparison for maximising the absorbed power output of the cylinder, each optimisation method was run ten times and the minimum, maximum and median of the best-found solutions are reported as a box-and-whisker diagram (Figure 4). In Figure 4, we can see that the IMFO could propose the best settings for the cylinder in terms of harnessing sea wave energy. Furthermore, the performance of the standard MFO is competitive and, in the following, the GWO performed better than the WOA, PSO and CMA-ES.
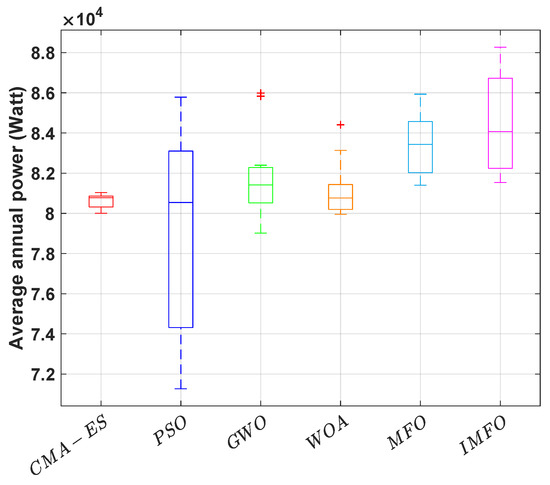
Figure 4.
Statistical optimisation results of the improved MFO (IMFO) and the five other meta-heuristics. Each experiment runs ten times.
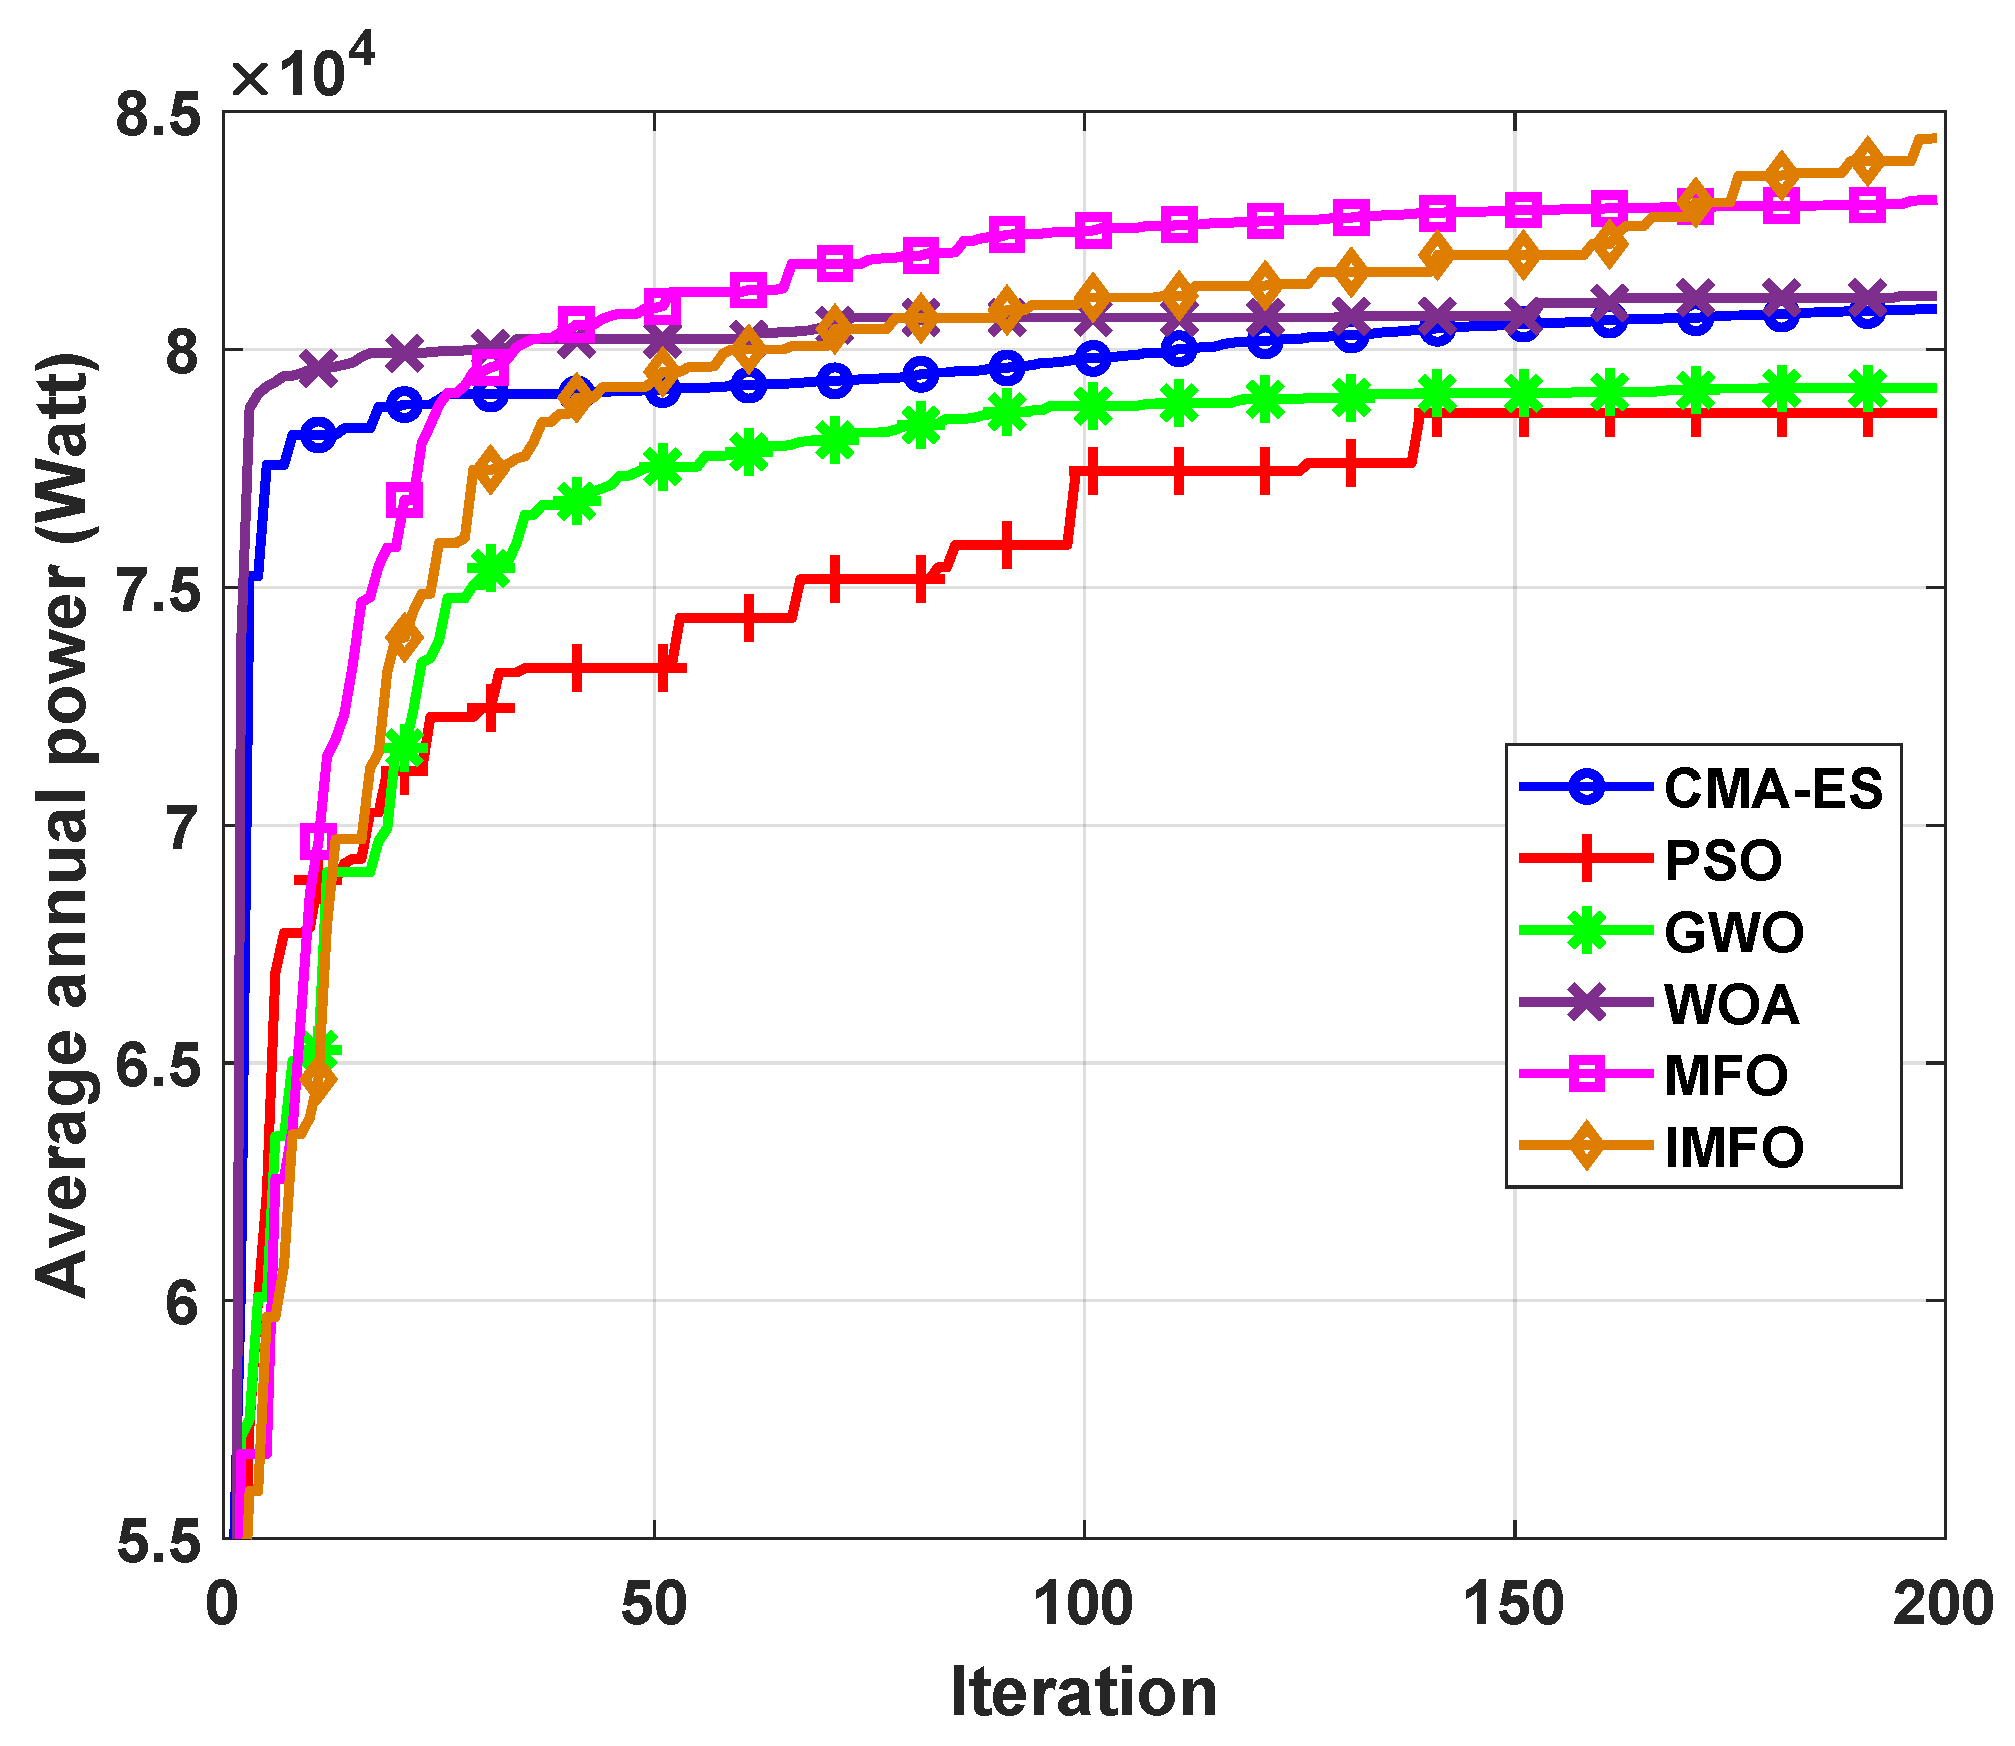
The second comparison metric for the optimisation methods’ performance is the convergence rate. In this study, we set the maximum evaluation number at , which was suggested by a prior study [30]. According to the results represented in Figure 5, it is obvious that the standard WOA could converge substantially faster than the other meta-heuristics. However, WOA could not be released from the local optima and was faced with a premature convergence issue. Interestingly, CMA-ES shows the same convergence behaviour as WOA, but the performance of the WOA method is better than CMA-ES in terms of best-found configurations. In the following convergence trajectories, the original MFO algorithm outperforms both WOA and CMA-ES after consuming only of the whole computational budget, and maintains this superiority over the others until near the last iterations. However, surprisingly, the improved MFO surpasses all optimisation algorithms and can propose better solutions on average. This achievement comes from the high exploration ability, using the proposed diversification strategy.
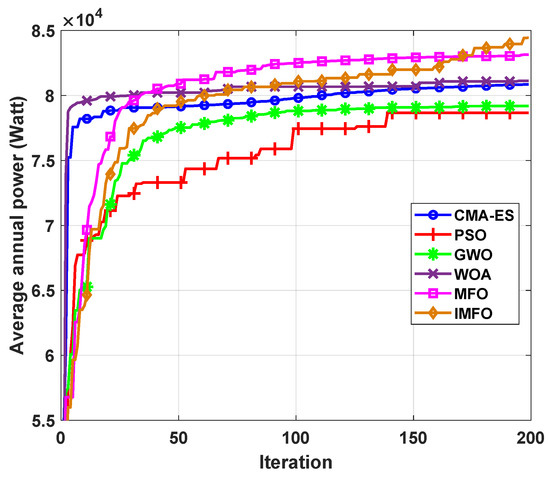
Figure 5.
Convergence speed of the improved MFO (IMFO) and the five other meta-heuristics. The average optimisation results of ten experiments is plotted.
Table 4 presents the average, minimum, maximum and standard deviation of the best-found solutions proposed by the improved MFO and the five other optimisation algorithms. It is noted that IMFO found the best optimisation settings for the cylinder in order to harness the maximum power from the sea wave. Meanwhile, both the GWO and MFO heuristics worked well as the second and third best performing wave power optimisers at finding solutions with the highest absorbed power at 8.5985 × 10⁴ and 8.5933 × 10⁴, respectively.
Table 4.
Optimisation performance of IMFO and the five other optimisation methods based on the best-found configuration per each experiment.
Table 5 shows the list of the best-found design parameters, including the cylinder radius (a), height (H), both tether attachment angles (), the tether inclination angle, () and, finally, the damping-spring PTO values. The first and foremost observation from Table 5 is that both the radius and height values of the best-found solutions are converged to the upper bound, and it is expected that a bigger cylinder can produce more power. However, most of the time the costs of developing, installing and maintaining the large wave converters restricted the developers. Furthermore, it can be seen from Table 5 that the optimised values of the tether angles are within a wide range between 10 and 80. This evidence demonstrates that there is a straightforward method for setting these design parameters. This is mainly because there are strong dependencies between design parameters (tether angles and PTO parameters) and the hydrodynamic model that dominates the power extraction (surge, pitch or heave).
Table 5.
The best-found geometric and PTO settings of the cylinder.
In order to provide deeper insight into the optimisation achievements, we compared the performance of the proposed optimisation method with other meta-heuristics, which can be seen in Table 6. In terms of the average best-found WEC’s settings, IMFO can perform substantially better than PSO by , and the percentage improvements of IMFO can be considerable compared with CMA-ES, WOA and GWO at , and , respectively. Furthermore, according to the best-found optimal WEC’s configurations, IMFO is able to outperform the standard MFO by .
Table 6.
The percentage improvement of the WEC absorbed power using IMFO compared with the other optimisers applied in this study.
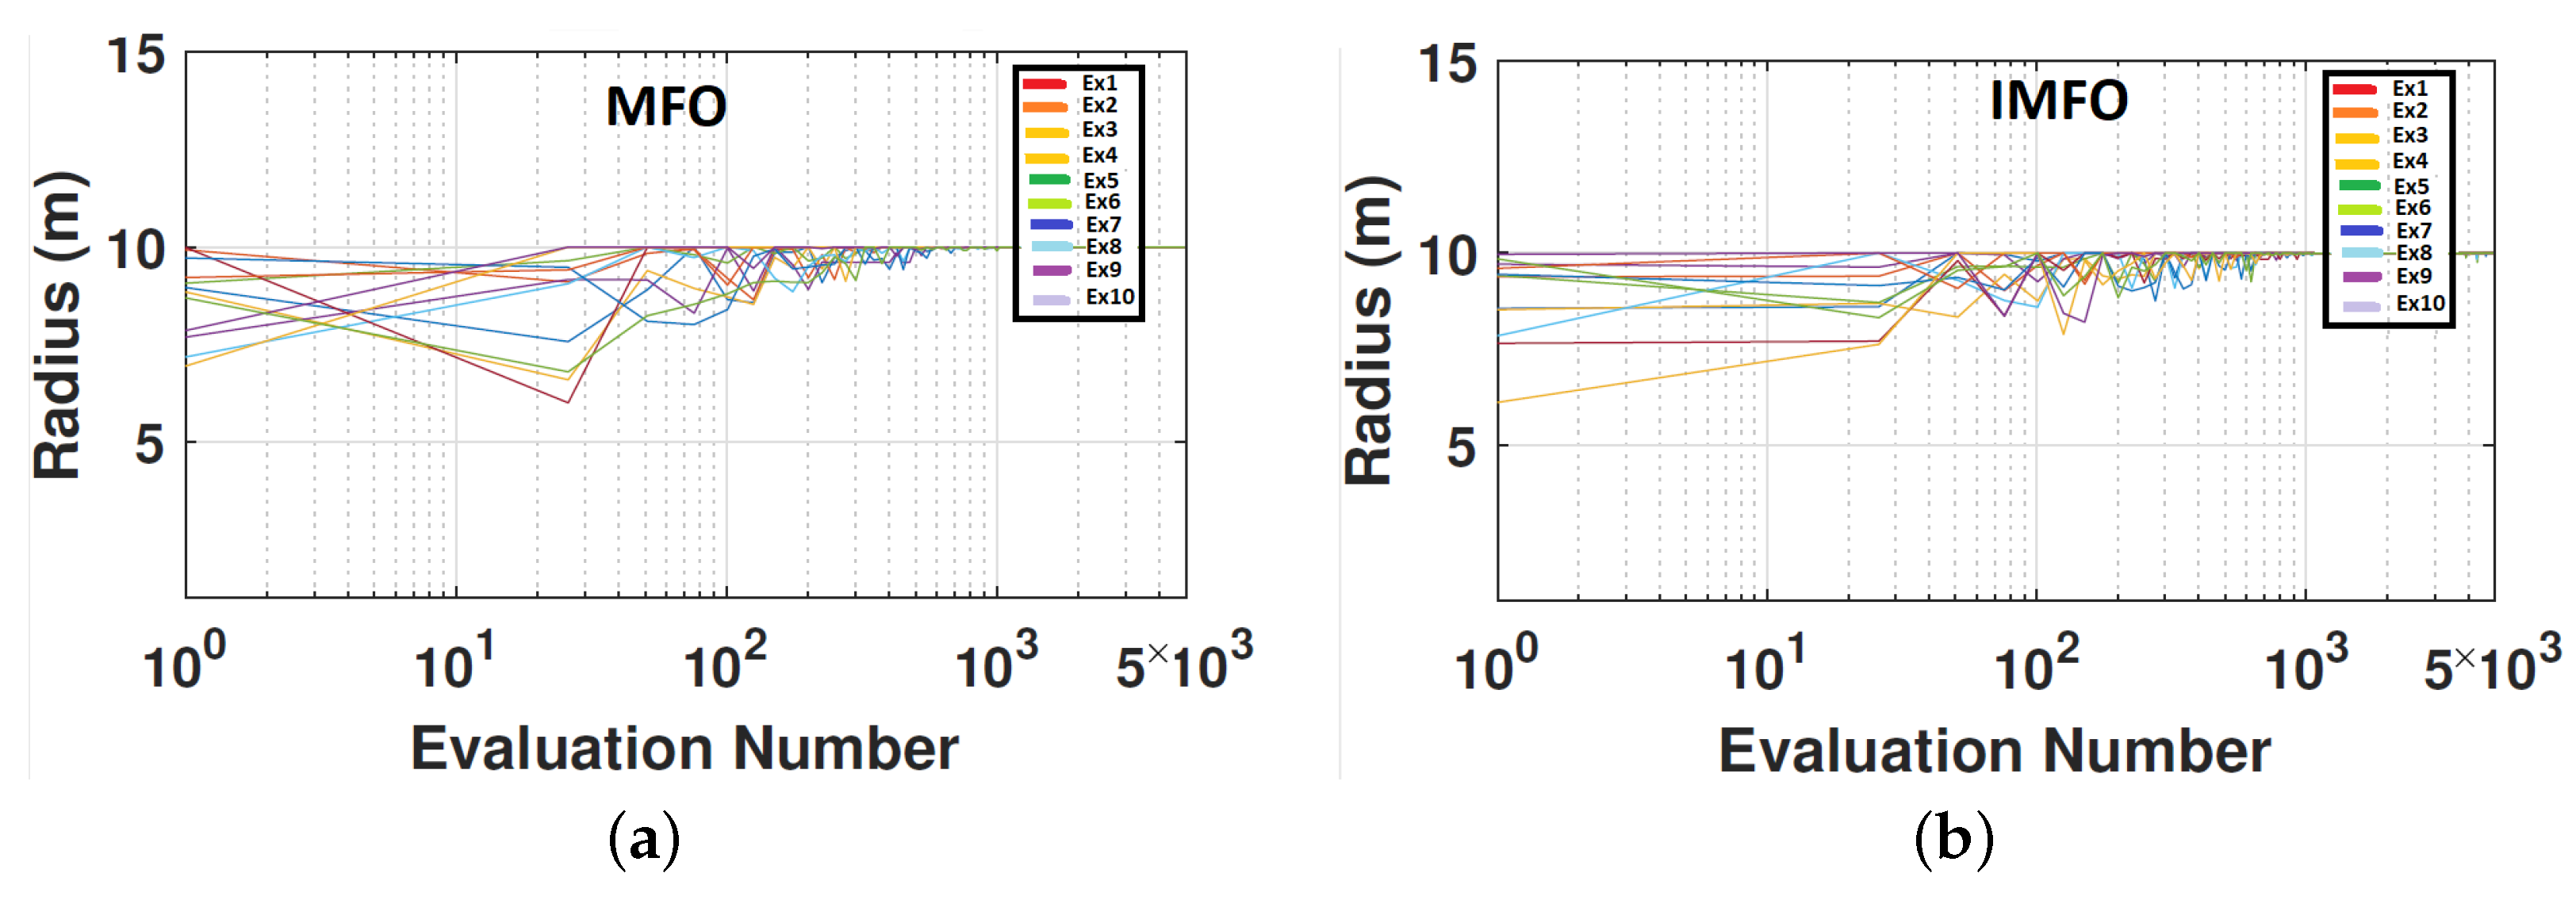
The sizes of the cylinder’s radius and height have a substantial impact on the power conversion from the converter. Figure 6 and Figure 7 show the process of the cylinder size optimisation using (a) the standard MFO and (b) the proposed MFO. Each line represents the search process of the optimisation algorithm, which is repeated ten times. As there is a semi-direct relationship between the radius and height size and the produced power output, both methods could converge rapidly and have approximately the same performance.
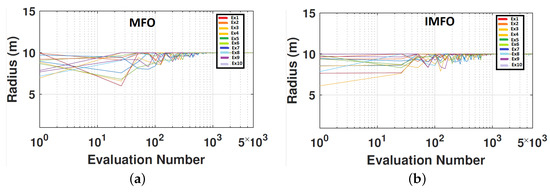
Figure 6.
The historical exploration and exploitation trajectories of the best-found designs per generation in radius for (a) standard MFO; (b) improved MFO. Each line shows an independent run.
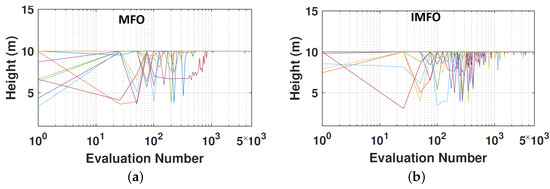
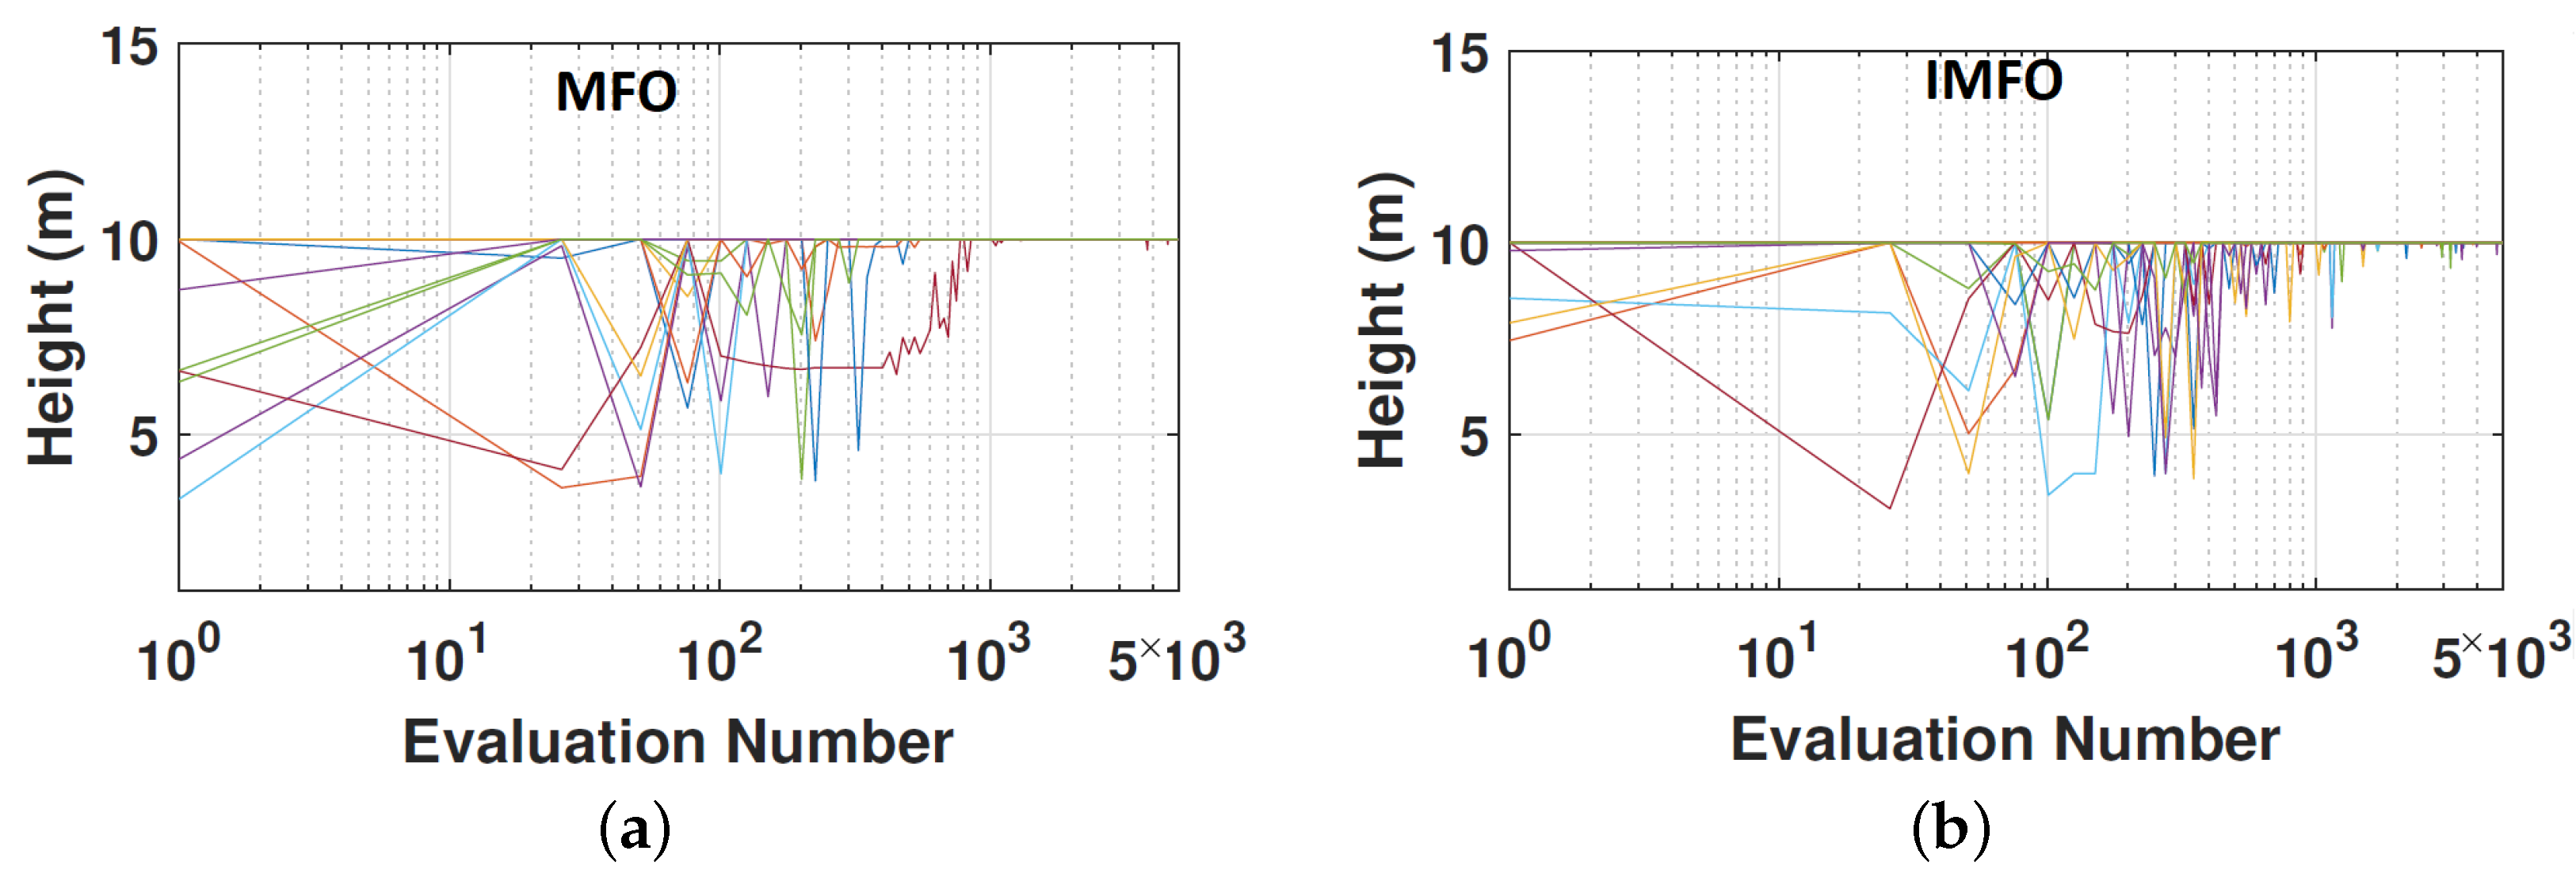
Figure 7.
Trajectory of the best-found solution’s parameters of the (a) MFO and the (b) improved MFO algorithms for height of the converter.
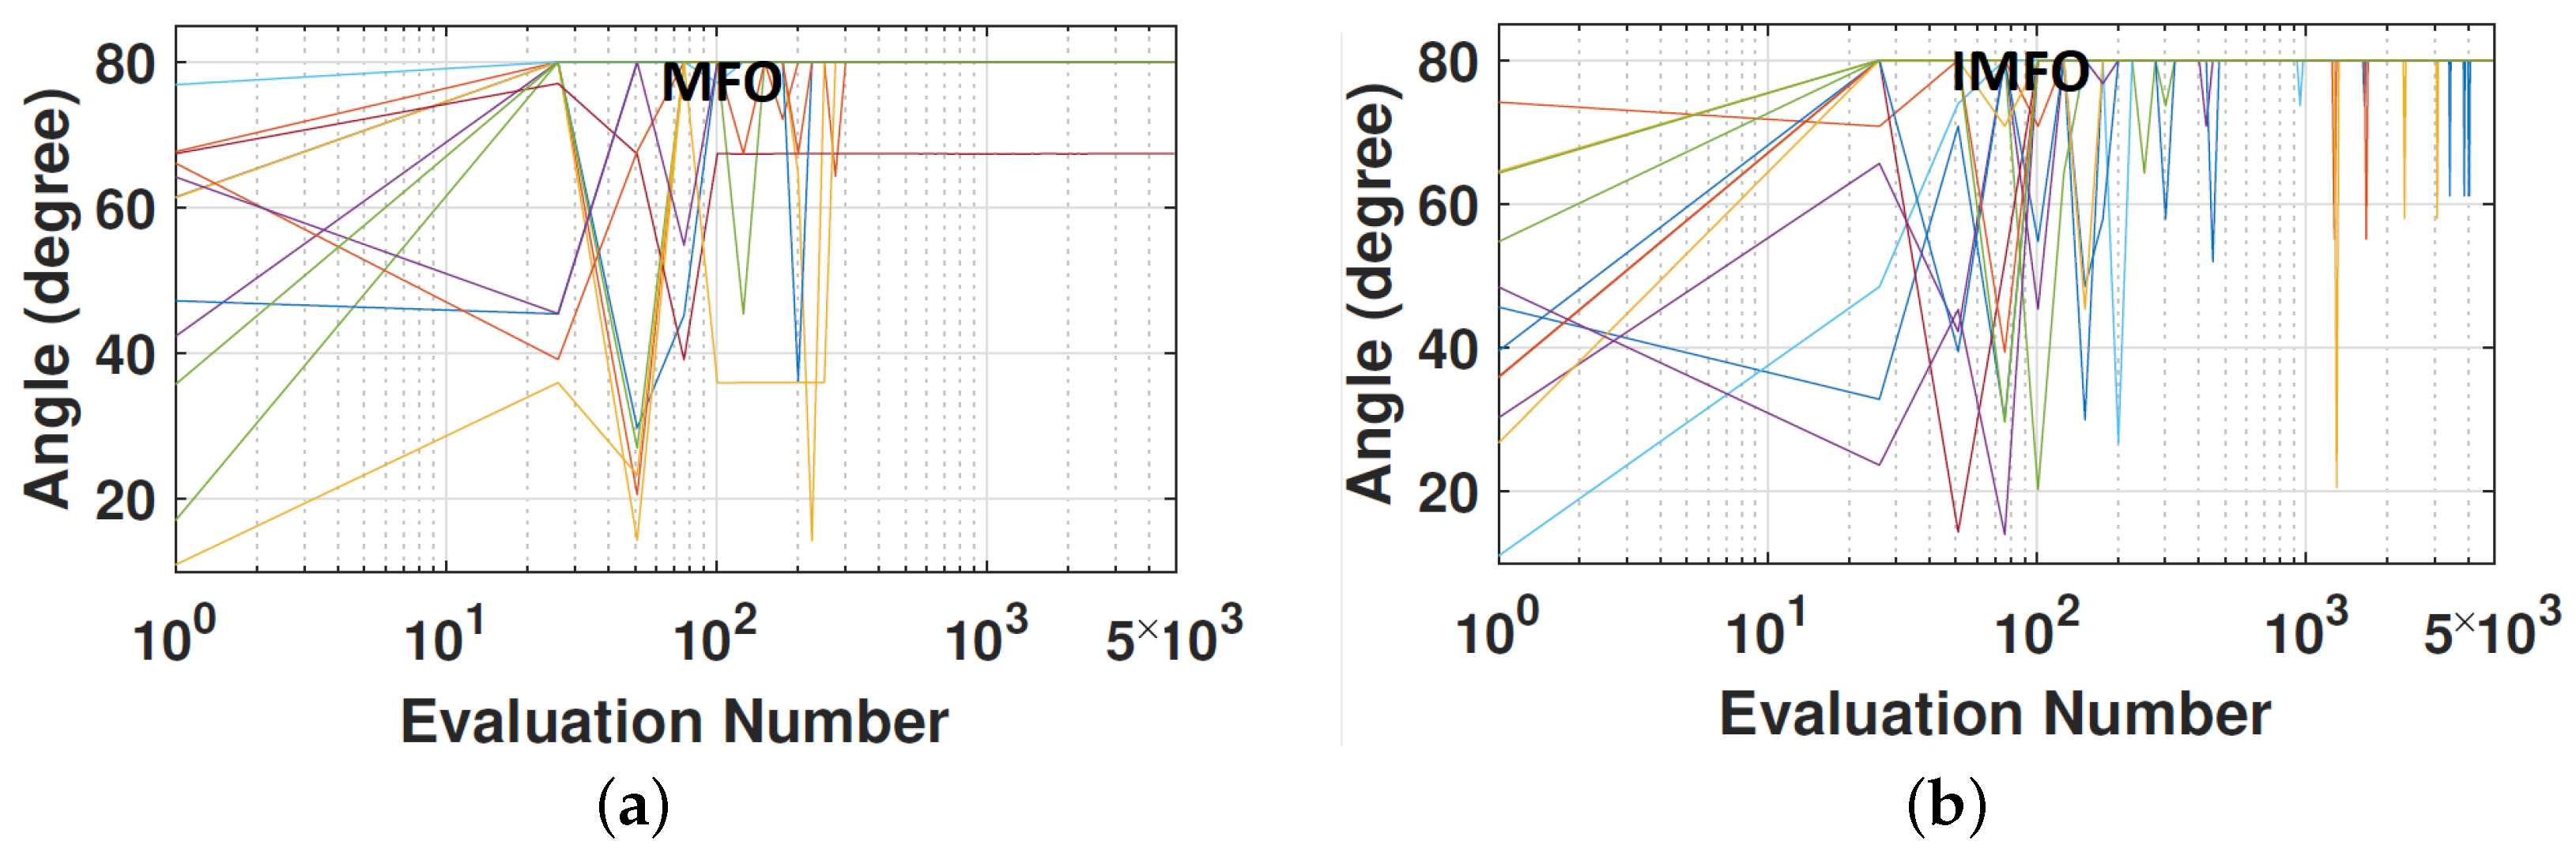
The inclination angle of the tethers () of the developed cylinder can modify the absorbed power of the ocean wave. As the tether angle cannot be adjusted after installing the converter, optimising this parameter plays an important role in the average performance of the cylinder during its lifetime. As a result, for more powerful sea states, it is suggested that the tether angles be larger because more power will be absorbed from the surge than the heave of the incident wave. The comparison of both optimisation methods—(a) MFO and (b) IMFO—in order to explore the best configurations of the inclination and attachment angles can be seen in Figure 8 and Figure 9, respectively.
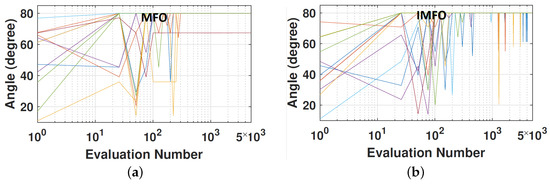
Figure 8.
The searchability of (a) MFO and (b) IMFO in order to find the best inclination angle of the tethers ().
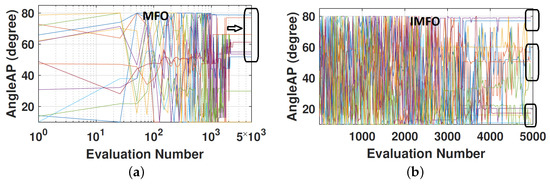
Figure 9.
A performance comparison between MFO and IMFO in terms of exploration and exploitation ability.
Furthermore, from Figure 8, we can observe that for both MFO and IMFO methods, after exploring the search space of the tether’s inclination angle (), most of the experiments are converged to the upper bound in order to absorb the maximum level of wave energy. It can be seen in Figure 8a that the standard MFO rapidly converged to a specific range (perhaps a local optimum) and was not able to keep the exploration ability. However, the proposed MFO kept its exploration searchability even among the last iterations (Figure 8b).
Figure 9 demonstrates the trajectory of the (a) MFO and (b) IMFO methods to optimise the attachment angles of the three tethers. According to the optimisation results, MFO proposed a specific range of angles from 50 to 80 for ten independent runs. However, we can see that the IMFO algorithm suggested a different range of attachment angles during the optimisation process, with a higher exploration ability compared to the MFO method.
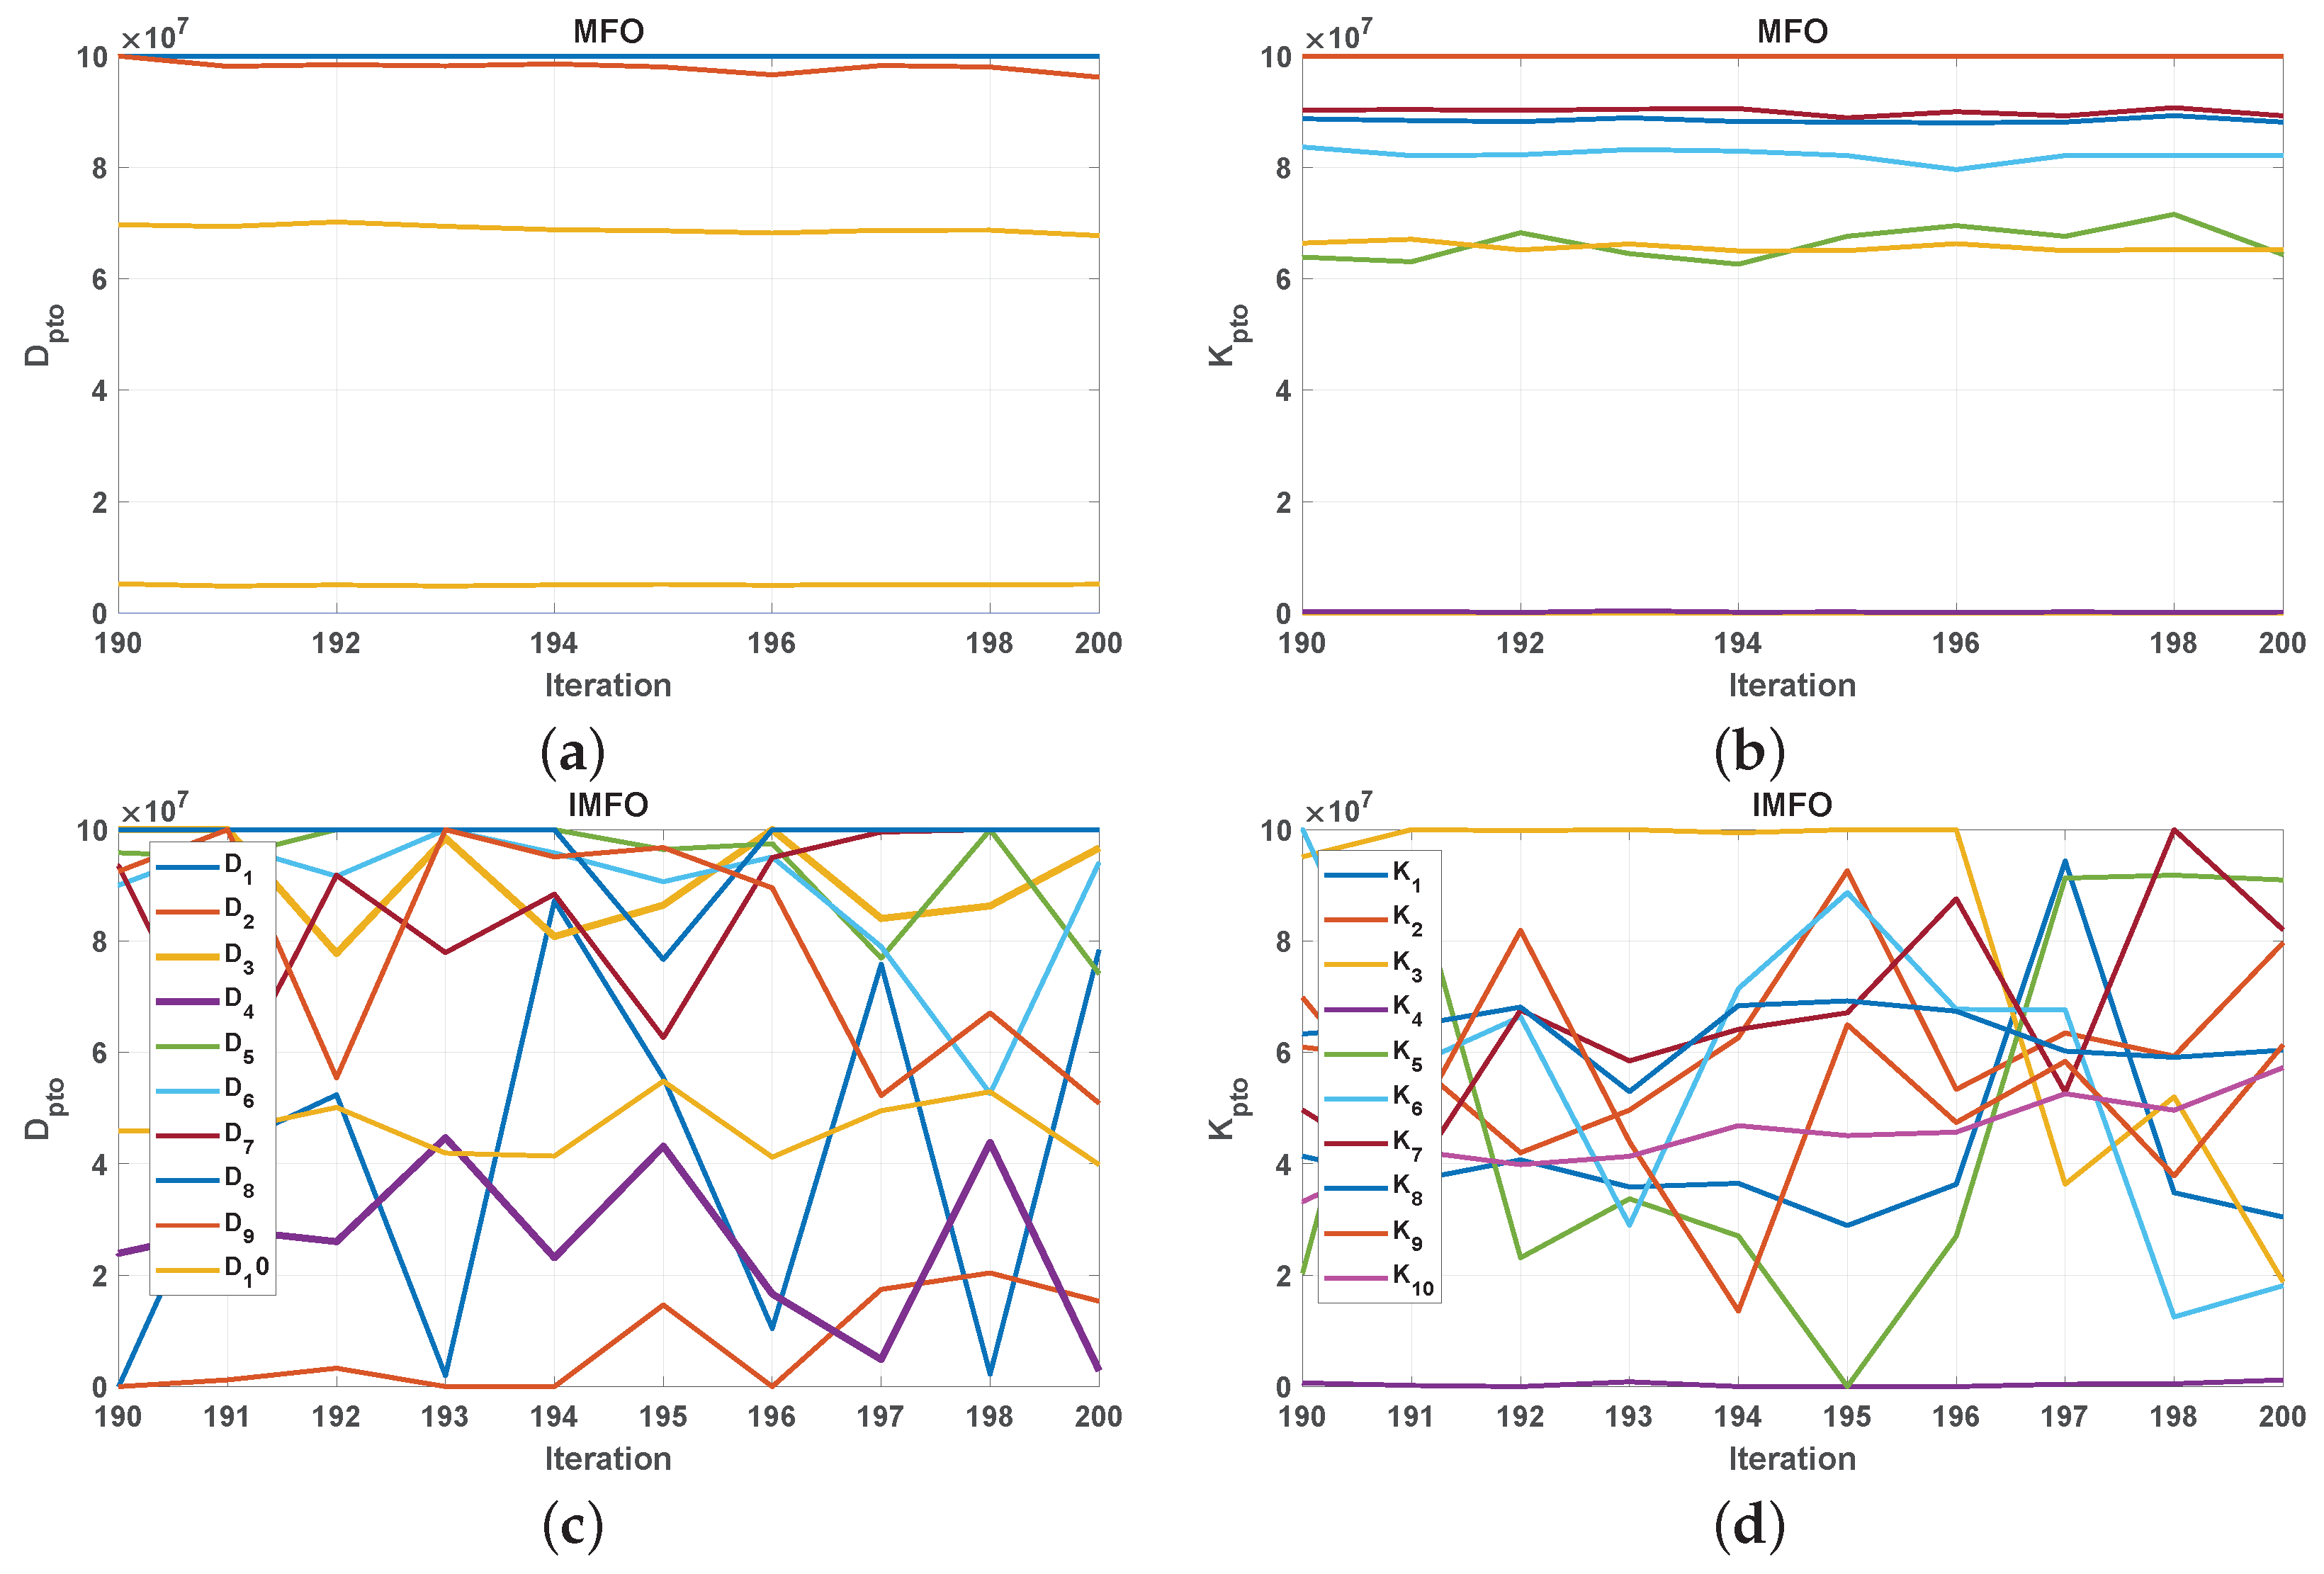
In Figure 10, we can see clearly that the best-found Kpto parameters using the MFO method are converged to less than . Nevertheless, IMFO proposed the values of Kpto in a wide range of search domains. As a result, these found Kpto configurations can produce more power compared with the MFO performance. Additionally, Figure 10b shows that the search space of the PTO parameters is multi-modal with highly dynamic behavior.
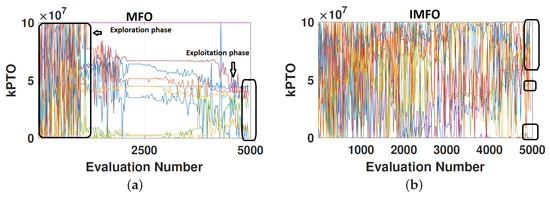
Figure 10.
The ten best-found Kpto values per generation during the optimisation process using MFO (a) and IMFO (b).
In order to clarify and provide an observable comparative landscape for both MFO and IMFO, Figure 11 is presented. To study the exploration and exploitation abilities of IMFO carefully and in great detail, the last ten iterations of the proposed method are plotted. We can notice clearly that the best-found configurations for both Kpto and Dpto using IMFO are distributed throughout the search space; however, the proposed settings of MFO are concentrated in a narrow range.
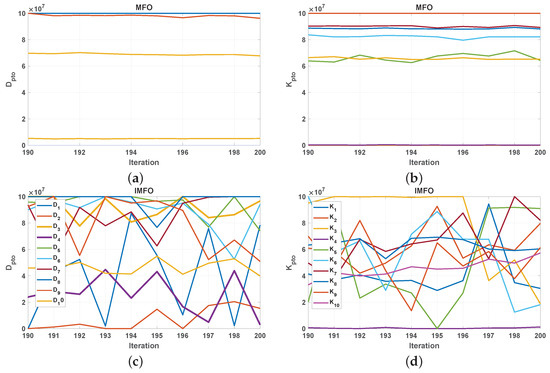
Figure 11.
The search pattern of (a,b) standard MFO, and (c,d) improved MFO for damping-spring settings.
Moreover, we can see that it is more challenging to find the optimal values for the tether angles than for the radius and height values. Finally, it seems that the most challenging part of the optimisation is related to finding the appropriate values for the PTO parameters.
7. Conclusions
In this study, an improved Moth–Flame Optimisation Algorithm is proposed for the purpose of enhancing the power output extracted from ocean waves by a fully-submerged, cylindrical wave energy converter with three tethers. The applied wave climate in this optimisation work was a Mediterranean sea site that is located in Sicily, Italy. As optimising the shape features, PTO parameters and tether angles simultaneously is a complex and time-consuming optimisation problem, we proposed a robust and reliable development of the Moth–Flame Optimisation (MFO) Algorithm using a diversification strategy. With regard to evaluating the developed method’s effectiveness, we take into account five state-of-the-art swarm and evolutionary optimisation algorithms for comparison. According to the findings, the improved MFO method is able to outperform recent meta-heuristic methods in terms of the absorbed power output of the best-found WEC configurations. In order to develop the current method in terms of dealing with multi-directional wave conditions, in the future we will focus on the adaptive and self-adaptive meta-heuristics to achieve a good search balance that will result in a fast and effective wave energy converter optimiser. Future plans also include considering whether the speed of the convergence rate can be beneficial in terms of saving on computational costs.
Author Contributions
Conceptualization, M.N., S.M., G.P. and D.A.G.; Data curation, M.M.N.; Formal analysis, M.N. and N.Y.S.; Investigation, N.Y.S., S.M., G.P. and D.A.G.; Methodology, M.N., N.Y.S. and S.M.; Project administration, S.M.; Resources, M.M.N.; Software, M.N., N.Y.S. and M.M.N.; Supervision, S.M., G.P. and D.A.G.; Visualization, M.N.; Writing—original draft, M.N. and N.Y.S.; Writing—review and editing, M.N., N.Y.S., S.M., M.M.N., G.P. and D.A.G. All authors have read and agreed to the published version of the manuscript.
Funding
This research received no external funding.
Conflicts of Interest
The authors declare no conflict of interest.
Abbreviations
The following abbreviations are used in this manuscript:
| WEC | Wave energy converters |
| PTO | Power take-off |
| PSD | Power spectral density |
| MFO | Moth Flame Optimisation |
| EAs | Evolutionary algorithms |
| SI | Swarm intelligence |
| CMA-ES | Covariance matrix adaptation evolution strategy |
| PSO | Particle Swarm Optimisation |
| GWO | Grey Wolf Optimiser |
| WOA | Whale Optimisation Algorithm |
| LSHADE-EpSin | Self-adaptive version of differential evolution |
References
- Newell, R.G.; Raimi, D. Global Energy Outlook Comparison Methods: 2020 Update. Available online: https://www.rff.org/publications/reports/global-energy-outlook-comparison-methods-2020 (accessed on 10 June 2020).
- Murdock, H.E.; Gibb, D.; André, T.; Appavou, F.; Brown, A.; Epp, B.; Kondev, B.; McCrone, A.; Musolino, E.; Ranalder, L.; et al. Renewables 2019 Global Status Report. Available online: https://www.ren21.net/wp-content/uploads/2019/05/gsr-2019-full-report-en.pdf (accessed on 15 July 2020).
- Aderinto, T.; Li, H. Ocean wave energy converters: Status and challenges. Energies 2018, 11, 1250. [Google Scholar] [CrossRef] [Green Version]
- Falnes, J. A review of wave-energy extraction. Mar. Struct. 2007, 20, 185–201. [Google Scholar] [CrossRef]
- Astariz, S.; Iglesias, G. Wave energy vs. other energy sources: A reassessment of the economics. Int. J. Green Energy 2016, 13, 747–755. [Google Scholar] [CrossRef]
- Wen, Y.; Wang, W.; Liu, H.; Mao, L.; Mi, H.; Wang, W.; Zhang, G. A Shape Optimization Method of a Specified Point Absorber Wave Energy Converter for the South China Sea. Energies 2018, 11, 2645. [Google Scholar] [CrossRef] [Green Version]
- Alamian, R.; Shafaghat, R.; Safaei, M.R. Multi-Objective Optimization of a Pitch Point Absorber Wave Energy Converter. Water 2019, 11, 969. [Google Scholar] [CrossRef] [Green Version]
- Esmaeilzadeh, S.; Alam, M.R. Shape optimization of wave energy converters for broadband directional incident waves. Ocean. Eng. 2019, 174, 186–200. [Google Scholar] [CrossRef] [Green Version]
- Wang, L.; Ringwood, J.V. Geometric optimization of a hinge-barge wave energy converter. In Proceedings of the 13th European Wave and Tidal Energy Conference, Napoli, Italy, 1–6 September 2019; p. 1389. [Google Scholar]
- Garcia-Teruel, A.; Forehand, D.I.M.; Jeffrey, H. Metrics for wave energy converter hull geometry optimisation. In Proceedings of the 13th European Wave and Tidal Energy Conference, EWTEC, Napoli, Italy, 1–6 September 2019. [Google Scholar]
- Sergiienko, N.Y.; Neshat, M.; da Silva, L.S.; Alexander, B.; Wagner, M. Design optimisation of a multi-mode wave energy converter. In Proceedings of the ASME 2020 39th International Conference on Ocean, Offshore and Arctic Engineering (OMAE2020), Fort Lauderdale, FL, USA, 28 June–3 July 2020; ASME: New York, NY, USA, 2020. [Google Scholar]
- Abdelkhalik, O.; Zou, S.; Robinett, R.D.; Bacelli, G.; Wilson, D.; Coe, R.G.; Korde, U.A. Multiresonant Feedback Control of a Three-Degree-of-Freedom Wave Energy Converter. IEEE Trans. Sustain. Energy 2017, 8, 1518–1527. [Google Scholar] [CrossRef]
- Neshat, M.; Alexander, B.; Sergiienko, N.; Wagner, M. A Hybrid Evolutionary Algorithm Framework for Optimising Power Take Off and Placements of Wave Energy Converters. arXiv 2019, arXiv:1904.07043. [Google Scholar]
- Sharp, C.; DuPont, B. Wave energy converter array optimization: A genetic algorithm approach and minimum separation distance study. Ocean Eng. 2018, 163, 148–156. [Google Scholar] [CrossRef]
- Fang, H.W.; Feng, Y.Z.; Li, G.P. Optimization of Wave Energy Converter Arrays by an Improved Differential Evolution Algorithm. Energies 2018, 11, 3522. [Google Scholar] [CrossRef] [Green Version]
- Neshat, M.; Alexander, B.; Wagner, M.; Xia, Y. A detailed comparison of meta-heuristic methods for optimising wave energy converter placements. In Proceedings of the Genetic and Evolutionary Computation Conference, Kyoto, Japan, 15–19 July 2018; ACM: New York, NY, USA, 2018; pp. 1318–1325. [Google Scholar]
- Neshat, M.; Alexander, B.; Sergiienko, N.Y.; Wagner, M. Optimisation of Large Wave Farms Using a Multi-Strategy Evolutionary Framework. In Proceedings of the 2020 Genetic and Evolutionary Computation Conference, GECCO’20, Cancun, Mexico, 8–12 July 2020; Association for Computing Machinery: New York, NY, USA, 2020; pp. 1150–1158. [Google Scholar]
- Giassi, M.; Castellucci, V.; Göteman, M. Economical layout optimization of wave energy parks clustered in electrical subsystems. Appl. Ocean Res. 2020, 101, 102274. [Google Scholar] [CrossRef]
- Bouali, B.; Larbi, S. Contribution to the geometry optimization of an oscillating water column wave energy converter. Energy Procedia 2013, 36, 565–573. [Google Scholar] [CrossRef] [Green Version]
- Kramer, M.V.; Frigaard, P. Efficient wave energy amplification with wave reflectors. In Proceedings of the Twelfth International Offshore and Polar Engineering Conference, Kitakyushu, Japan, 26–31 May 2002. [Google Scholar]
- Mirjalili, S.; Mirjalili, S.M.; Lewis, A. Grey wolf optimizer. Adv. Eng. Softw. 2014, 69, 46–61. [Google Scholar] [CrossRef] [Green Version]
- Mirjalili, S.; Lewis, A. The whale optimization algorithm. Adv. Eng. Softw. 2016, 95, 51–67. [Google Scholar] [CrossRef]
- Mirjalili, S. Moth–Flame optimization algorithm: A novel nature-inspired heuristic paradigm. Knowl. Based Syst. 2015, 89, 228–249. [Google Scholar] [CrossRef]
- Poli, R.; Kennedy, J.; Blackwell, T. Particle swarm optimization. Swarm Intell. 2007, 1, 33–57. [Google Scholar] [CrossRef]
- Hansen, N.; Müller, S.D.; Koumoutsakos, P. Reducing the time complexity of the derandomized evolution strategy with covariance matrix adaptation (CMA-ES). Evol. Comput. 2003, 11, 1–18. [Google Scholar] [CrossRef]
- Vantorre, M.; Banasiak, R.; Verhoeven, R. Modelling of hydraulic performance and wave energy extraction by a point absorber in heave. Appl. Ocean Res. 2004, 26, 61–72. [Google Scholar] [CrossRef]
- Goggins, J.; Finnegan, W. Shape optimisation of floating wave energy converters for a specified wave energy spectrum. Renew. Energy 2014, 71, 208–220. [Google Scholar] [CrossRef]
- Hager, R.; Fernandez, N.; Teng, M.H. Experimental study seeking optimal geometry of a heaving body for improved power absorption efficiency. In Proceedings of the Twenty-second International Offshore and Polar Engineering Conference, International Society of Offshore and Polar Engineers, Rhodes, Greece, 17–22 June 2012. [Google Scholar]
- McCabe, A. Constrained optimization of the shape of a wave energy collector by genetic algorithm. Renew. Energy 2013, 51, 274–284. [Google Scholar] [CrossRef]
- Neshat, M.; Sergiienko, N.Y.; Amini, E.; Majidi Nezhad, M.; Astiaso Garcia, D.; Alexander, B.; Wagner, M. A New Bi-Level Optimisation Framework for Optimising a Multi-Mode Wave Energy Converter Design: A Case Study for the Marettimo Island, Mediterranean Sea. Energies 2020, 13, 5498. [Google Scholar] [CrossRef]
- Awad, N.H.; Ali, M.Z.; Suganthan, P.N.; Reynolds, R.G. An ensemble sinusoidal parameter adaptation incorporated with L-SHADE for solving CEC2014 benchmark problems. In Proceedings of the 2016 IEEE congress on evolutionary computation (CEC), Vancouver, BC, Canada, 24–29 July 2016; pp. 2958–2965. [Google Scholar]
- Iuppa, C.; Cavallaro, L.; Vicinanza, D.; Foti, E. Investigation of suitable sites for Wave Energy Converters around Sicily (Italy). Ocean Sci. Discuss. 2015, 12, 543–557. [Google Scholar] [CrossRef] [Green Version]
- Fairley, I.; Lewis, M.; Robertson, B.; Hemer, M.; Masters, I.; Horrillo-Caraballo, J.; Karunarathna, H.; Reeve, D.E. A classification system for global wave energy resources based on multivariate clustering. Appl. Energy 2020, 262, 114515. [Google Scholar] [CrossRef]
- Lavelle, J.; Kofoed, J. Representative Spectra of the Wave Resource from Real Sea Wave Measurements. In Proceedings of the European Wave and Tidal Energy Conference (EWTEC 2013), Aalborg, Denmark, 2–5 September 2013. [Google Scholar]
- Silva, L.; Sergiienko, N.; Pesce, C.; Ding, B.; Cazzolato, B.; Morishita, H. Stochastic analysis of nonlinear wave energy converters via statistical linearization. Appl. Ocean Res. 2020, 95, 102023. [Google Scholar] [CrossRef]
- Scruggs, J.; Lattanzio, S.; Taflanidis, A.; Cassidy, I. Optimal causal control of a wave energy converter in a random sea. Appl. Ocean Res. 2013, 42, 1–15. [Google Scholar] [CrossRef]
- Jiang, S.C.; Gou, Y.; Teng, B.; Ning, D.Z. Analytical solution of a wave diffraction problem on a submerged cylinder. J. Eng. Mech. 2014, 140, 225–232. [Google Scholar] [CrossRef]
- Jiang, S.C.; Gou, Y.; Teng, B. Water wave radiation problem by a submerged cylinder. J. Eng. Mech. 2014, 140, 6014003. [Google Scholar] [CrossRef]
- The Specialist Committee on Waves. Final Report and Recommendations to the 23rd ITTC. In Proceedings of the 23rd International Towing Tank Conference, Venice, Italy, 8–14 September 2002; Volume II, pp. 505–736. [Google Scholar]
- Hansen, N. The CMA evolution strategy: A comparing review. Towards a New Evolutionary Computation; Springer: New York, NY, USA, 2006; pp. 75–102. [Google Scholar]
- Eberhart, R.; Kennedy, J. A new optimizer using particle swarm theory. In Proceedings of the Sixth International Symposium on Micro Machine and Human Science, MHS’95, Nagoya, Japan, 4–6 October 1995; pp. 39–43. [Google Scholar]
- Alzaqebah, M.; Alrefai, N.; Ahmed, E.A.; Jawarneh, S.; Alsmadi, M.K. Neighborhood search methods with Moth Optimization algorithm as a wrapper method for feature selection problems. Int. J. Electr. Comput. Eng. 2020, 10, 3672. [Google Scholar] [CrossRef]
- Fakhouri, S.N.; Hudaib, A.; Fakhouri, H.N. Enhanced optimizer algorithm and its application to software testing. J. Exp. Theor. Artif. Intell. 2020, 32, 885–907. [Google Scholar] [CrossRef]
- Mehne, S.H.H.; Mirjalili, S. Moth–Flame optimization algorithm: Theory, literature review, and application in optimal nonlinear feedback control design. Nat. Inspired Optim. 2020, 811, 143–166. [Google Scholar]
- Ghobaei-Arani, M.; Souri, A.; Safara, F.; Norouzi, M. An efficient task scheduling approach using Moth–Flame optimization algorithm for cyber-physical system applications in fog computing. Trans. Emerg. Telecommun. Technol. 2020, 31, e3770. [Google Scholar] [CrossRef]


Publisher’s Note: MDPI stays neutral with regard to jurisdictional claims in published maps and institutional affiliations. |
© 2021 by the authors. Licensee MDPI, Basel, Switzerland. This article is an open access article distributed under the terms and conditions of the Creative Commons Attribution (CC BY) license (https://creativecommons.org/licenses/by/4.0/).