Article

Research on Temperature Monitoring Method of Cable on 10 kV Railway Power Transmission Lines Based on Distributed Temperature Sensor

1
China Railway Siyuan Survey and Design Group CO., LTD., Wuhan 430063, China
2
School of Electrical and Electronic Engineering, Huazhong University of Science and Technology, Wuhan 430074, China
*
Author to whom correspondence should be addressed.
Energies 2021, 14(12), 3705; https://doi.org/10.3390/en14123705
Submission received: 26 April 2021 / Revised: 11 June 2021 / Accepted: 18 June 2021 / Published: 21 June 2021
(This article belongs to the Topic Innovative Techniques for Smart Grids)

Abstract

:
Railway power transmission lines (RPTL) are power lines that provide nontraction power supply for railways, such as communications and signals along the railway. With the advancement of technology, power cables are being used more and more widely. Operational experience has shown that during the operation of power cables, abnormal heat is often caused by fault factors such as poor joint crimping and severe partial discharge caused by insulation defects, leading to cable burns in extreme cases. Distributed temperature sensors (DTS), a kind of spatial continuous temperature sensor using sensing optical fiber, can measure the temperature along the cable and are expected to realize on-line monitoring and positioning of cable heating faults. This paper first builds a finite element model of the cable under various faults to calculate the distribution characteristics of the temperature field of the faulty cable. Then the results are verified through experiments with the external sensing fiber and the artificially manufactured heating points of the cable. The conclusions show that it is feasible to use a distributed sensing fiber to monitor and locate the heating fault of power cable.

1. Introduction

With the increasing density of the high-speed railway network in China, the reliability of the power supply of communication and signal equipment along the railway will directly affect the railway traffic safety. To improve the reliability of the power supply of RPTL, more and more railway through lines use all-cable lines.
In general, RPTL are buried directly in the soil, through a pipe, or along cable trenches. The laying condition along the line is changeable, and numerous loads are distributed along the line. Factors such as inherent defects and external force damage may cause cable failures, primarily when the cable works in a plateau area for a very long time, unfavorable factors such as low air pressure and high cold will reduce the insulation strength of the cable and accelerate the aging of the insulating medium [1,2]. In addition, the location and identification of faults in these cables are even trickier due to the complexity of the power supply network and the invisibility of cable faults. Therefore, it is urgent and significant to keep cables under on-line monitoring to ensure the stable and reliable operation of the RPTL and the ability to quickly and accurately locate the fault point and promptly eliminate the fault after its occurrence [3,4].
Partial discharge, grounding current, temperature rise, etc., are usually used as evaluating indicators for on-line monitoring to assess the condition and predict the life of cables [5,6]. Among various cable on-line monitoring methods, temperature monitoring is the most direct method to reflect the condition of the cable. Many incipient failures, such as severe partial discharge at the joint, poor crimping, etc., are often accompanied by abnormal temperature rise. Enormous efforts have been made to build up precise and accurate equivalent thermal circuit models (ETCM), finite element models (FEM), etc., to simulate the heat transfer process of the cable in various circumstances [7,8,9,10]. Up to now, there is little literature targeted on the abnormal heat of the cables used in the RPTL. However, a certain amount of cable ignition accidents is still recorded in the field survey along the electrified railway every year.
Temperature sensors can be divided into noncontact sensors and contact sensors according to the deployment manner, dot-shaped sensors, and line-shaped sensors according to the continuity of sensing parameters. Infrared radiometer (IRR) temperature sensing is widely used in various systems of environmental temperature monitoring [11]. In the transmission and distribution network, IRR is mainly used to diagnose key parts such as cable terminals [12]. However, it can only measure the surface temperature, and the temperature measurement result is greatly affected by the environment and the measured object. For instance, the measurement of IRR is often seriously affected by partial discharge signals. Therefore, there have been many types of research to denoise the infrared imaging of the cable terminal and get accurate temperature information [13]. Thermocouples and thermistors are two kinds of the most commonly-used contact sensors. Still, they are greatly affected by electromagnetic interference, and a large number of signal leads need to be led out to the demodulator. The fiber Bragg grating (FBG) sensor can avoid the influence of electromagnetic interference, but the measurement is discontinuous, and the temperature measurement result is affected by stress [14]. Distributed temperature sensing (DTS) via optical fiber has the advantages of antielectromagnetic and mechanical interference and space continuous measurement, which is suitable for temperature monitoring of long-distance cable in RPTL. DTS has been developing rapidly these days, divided into Rayleigh scattering type, Raman scattering type, and Brillouin scattering type according to the different kinds of demodulated light [15,16,17,18]. At present, the most widely-used temperature measurement system is the Raman-based optimal time domain reflection (R-OTDR) [19]. With the enhancement of the measurement accuracy and spatial resolution of the DTS and the progress of the composite technology of the cable and the optical fiber, now the optical fiber can be implanted into the sheath of the cable. Optical fiber composite cable (OFCC) is a composite structure of optical fiber and cable, which has the advantages of compact structure and high mechanical strength. These will make the DTS monitor the temperature of the cable more effectively [20,21,22,23]. Moreover, through the feature extraction and analysis of the vibration signal along the optical fiber, the security status of the cable can be monitored in real time, and the cable intrusion prevention alarm system based on the phase-sensitive optical time domain reflection (Φ-OTDR) technology can be established [24,25].
In this paper, to eliminate the maloperation brought by the environment temperature and the measurement error of DTS, an algorithm of distributed optical fiber for online monitoring and fault location of cable is proposed for the first time. To focus on the change process of temperature field during cable fault heating, taking 10 kV crosslinked polyethylene (XLPE) cable as an example, a FEM for cable fault heating calculation is introduced, and the multiscene thermal analysis of the power through line cable is carried out for the first time. Furthermore, to test the monitoring performance of DTS on cable heating fault, the artificial heating cable is designed. The temperature of the cable is monitored by arranging optical fiber and a thermocouple, and the temperature measurement effect between them is compared.

2. Proposed Scheme

The distributed optical fiber is deployed in the cable to monitor the temperature state of the cable in real time. Once the abnormal temperature rise occurs, the distributed optical fiber can detect the location of the abnormal hot spot and send out the corresponding alarm signal to prompt the maintenance personnel to replace the cable in time to prevent the deterioration of the cable fault. If the incipient fault does not cause apparent temperature rise, or the thermal effect is in the blind area of DTS, the fault gradually deteriorated into a short circuit, and the short-circuit current will be conducted in the shielding layer from the cable core through the insulation breakdown area, and generate certain Joule heat in the cable shielding layer, which will cause the increase of cable temperature rise and be perceived by the distributed optical fiber laid nearby so that the insulation breakdown point can be located. The DTS monitoring scheme is divided into two parts: online monitoring and fault location. Online monitoring focuses on detecting the incipient fault of the cable, and fault location focuses on calculating the distance from the insulation breakdown point to the temperature sensing host when a short circuit fault occurs.

2.1. On-Line Monitoring
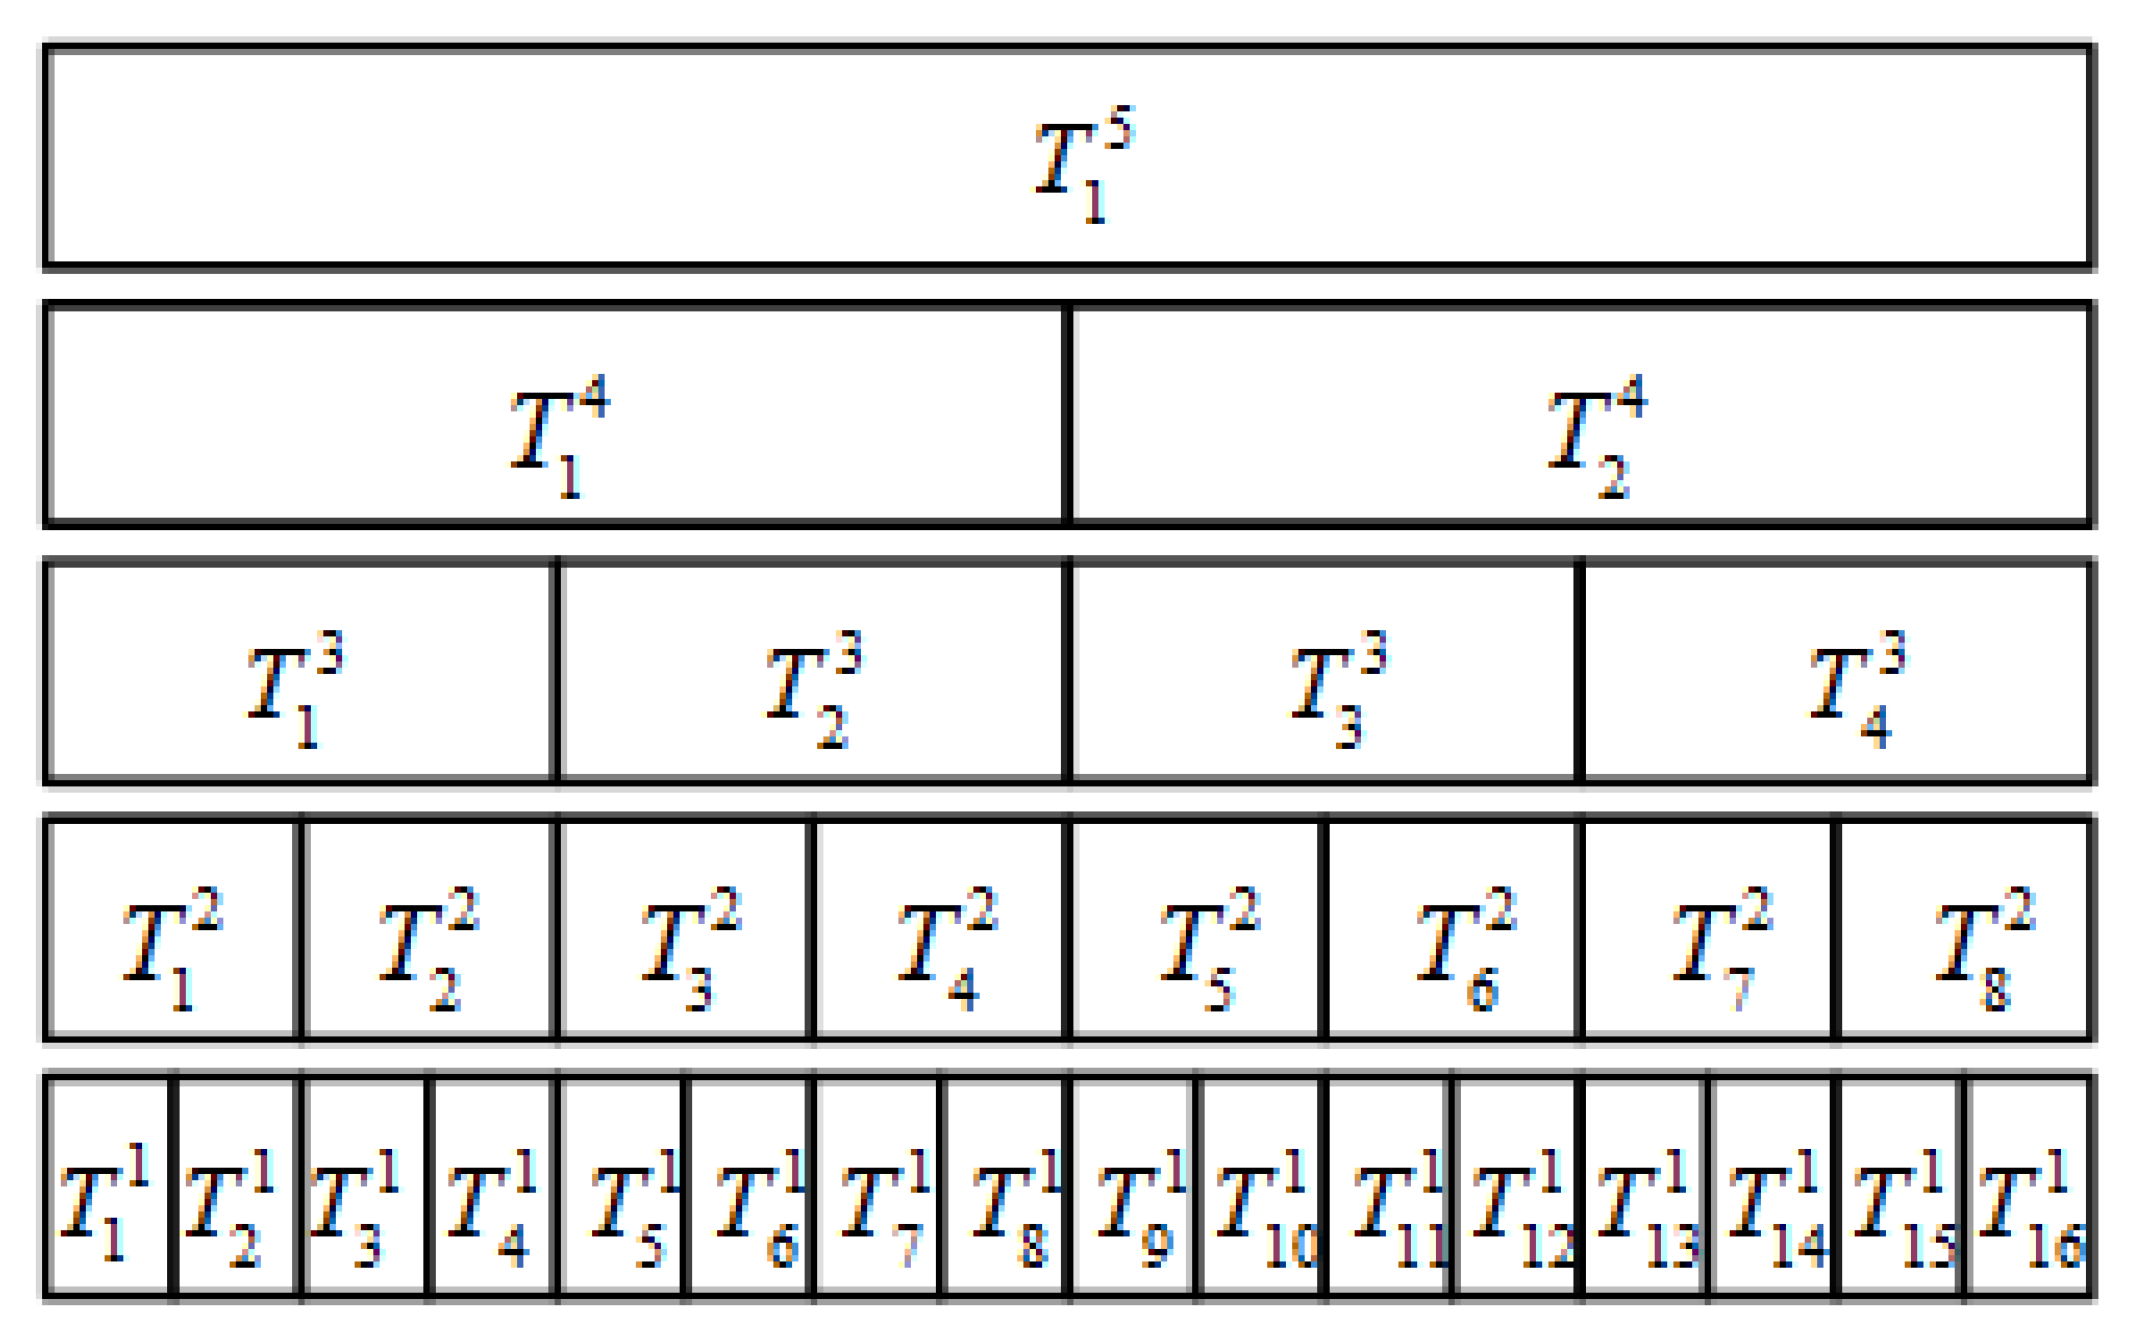
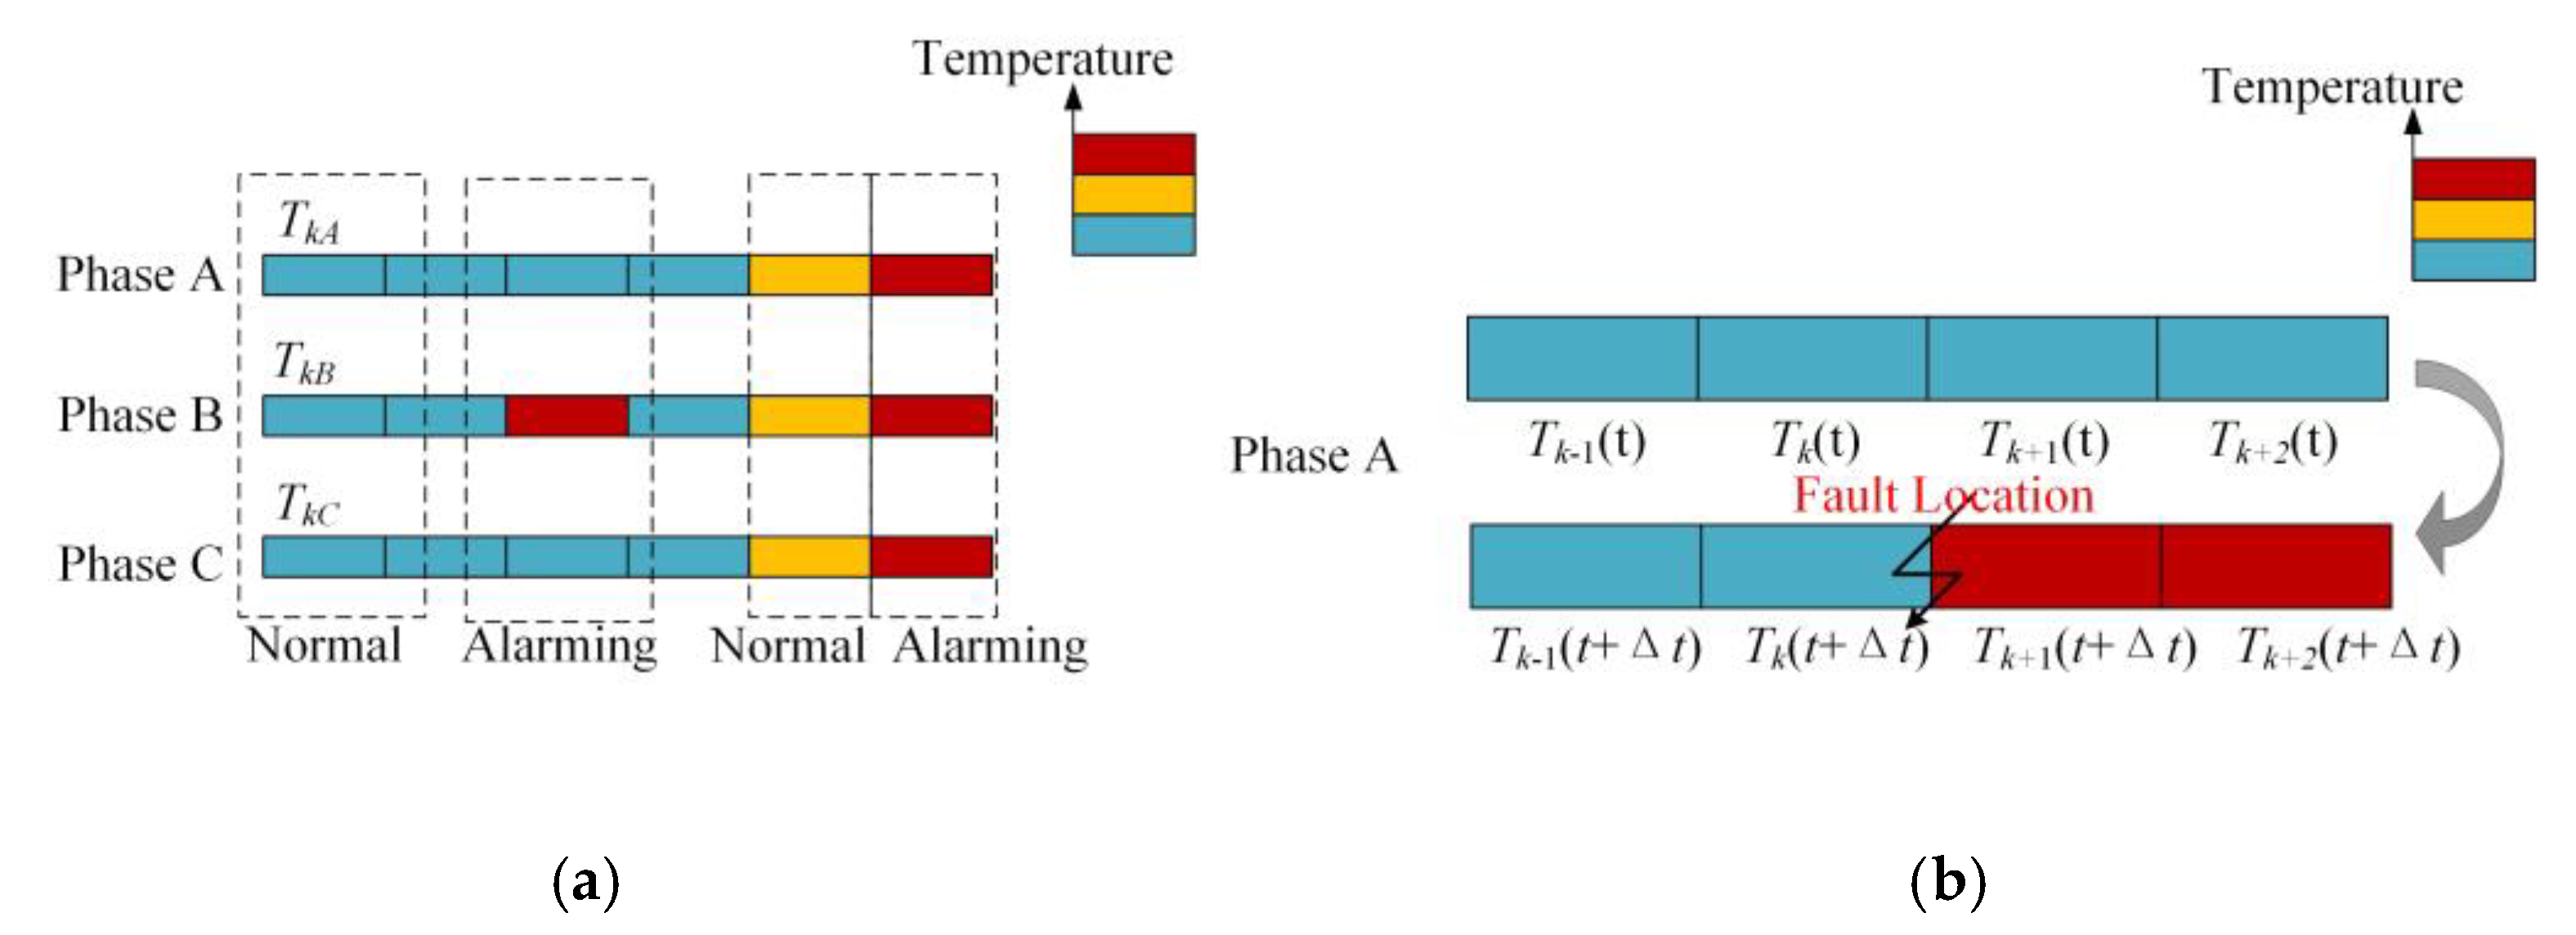
Since the thermal effect caused by the incipient fault of the cable is weak, the signal to noise ratio (SNR) of the measurement system is low. Therefore, considering the reliability principle, it is necessary to eliminate the influence of irrelevant factors out of the original temperature measurement data before judging the alarm conditions and determining the fault location.
(1) Elimination method for environmental impact based on three phase temperature comparison
Due to the different environments of the area along the cable, the temperature profile measured by DTS will fluctuate with the position to a certain extent, so it is necessary to perform some processing on the temperature measurement value of each point to eliminate the influence of the environment. Figure 1a is the schematic diagram of the temperature along the three-phase single-core cables. Every block represents a single spatial interval of sampling, and the relative value of temperature measurement is expressed in different colors. By monitoring the cable temperature of phase A, B and C simultaneously, the change of temperature measurement results caused by environmental changes can be eliminated. When there are apparent differences in the three-phase temperature measurement values, the fault can be detected without misjudgment. The alarm conditions can be expressed by Equations (1)–(3).
T k ¯ = ( T k A + T k B + T k C ) 3 > T t o t · a b n
D T k [ T k A , T k B , T k C ] > δ T
max { T k A , T k B , T k C } > T i n d · a b n
In Formula (1): T k ¯ is the mean value of the cable temperature of phase A, B, and C at the k-th temperature measurement point along the axial direction of the cable, T k A , T k B , T k C are the cable temperature of each phase at the k-th temperature measurement point, when the mean value exceeds the allowable upper threshold T t o t · a b n , an alarm is activated. In Formula (2): D T k [ T k A , T k B , T k C ] is cable temperature variance of three phases at the k-th temperature measurement point, and δ T is the preset three-phase temperature variance upper threshold, unless the threshold δ T is reached, the single-phase fault alarm program at the k-th temperature measurement point is locked. In Formula (3): T i n d · a b n is the allowable upper threshold value of the single-phase temperature of the cable.
(2) Elimination method for error influence based on multilevel partition temperature comparison
DTS outputs a new temperature profile in every sampling period. Although the environment temperature remains stable, the temperature profile inevitably fluctuates with time due to the existence of random measurement errors. Once the fluctuation exceeds the preset alarm threshold, the misjudgment of the supervisory control and data acquisition (SCADA) will occur. Therefore, an alarm criterion based on the multilevel partition is proposed as followed.
Figure 2 is a schematic diagram of the multilevel partition of the cable temperature monitoring. Here, 2 < k < 6 is illustrated as an example. For practical applications, k can be given according to the monitoring requirements. Increasing the number of partitions can improve the system’s robustness, but the consumption of the computing memory will also increase. T i k represents the i -th temperature measurement point of the k -level partition, the length of the k -level partition satisfies:
{ T I 1 = x 0 T i k = 2 k 1 · x 0 , k 2
where x 0 is the spatial resolution of DTS, which represents the minimum recognizable spatial interval of DTS. The optimal spatial resolution should be chosen according to the dynamic range (DR) of DTS before the whole upper system is established. DR means that there is a minimum allowable SNR in DTS. Therefore, the raw data of the light intensity signal needs to be averaged to reduce its fluctuation range, limiting the sampling period of DTS. When the sampling period is determined, the smaller the spatial resolution is, the larger the random error of temperature measurement is. In a word, the spatial resolution should not be too small. Otherwise, the alarm threshold will be difficult to determine. At the same time, it should not be too large to ensure sensitivity.
The temperature value of each measurement point of each level of partition is averaged by the two temperature values of the next layer of the layer, which can be expressed as:
T i k + 1 = T 2 i 1 k + T 2 i k
For the k -level partition, the alarm conditions are:
τ [ t , t + m k Δ t ] , T i k > δ i k
where: Δ t is the sampling period of DTS, m k is the number of early warning periods in the k -level partition, and δ i k is the upper temperature setting threshold of the i -th temperature measurement point in the k level partition. For the same level of partitions, different temperature measurement points can be set with different upper temperature setting thresholds.
The setting parameters of each layer should meet a certain relationship in order to achieve good cooperation. The warning time from the lower layer to the upper layer is reduced in sequence, and the upper threshold value is reduced in sequence, which can be expressed as:
{ m 1 > m 2 > > m k > m k + 1 δ 1 > δ 2 > > δ k > δ k + 1
For those incipient cable failures accompanied by continuous heating, the temperature of the cable rises from the beginning of the fault and finally reaches a stable value. Assuming that the heating fault is at the i -th temperature measurement point of the first level partition, only when the conditions of the corresponding Equation (7) are met in all partitions including the first measuring point, an alarm will be given that there is an abnormal heating point at the first temperature measurement point. In this way, the alarm threshold will be a variable varying with the space size, which ensures the flexibility of the whole scheme. At the same time, strict alarm conditions also provide the reliability of the scheme. By taking the temporal and spatial average of the temperature value, the alarm misjudgment caused by the random error of the measurement can be effectively avoided.

2.2. Fault Location

Figure 1b shows the temperature profile of a faulty cable. As shown in this figure, when the cable short-circuit fault occurs between the k-th measuring point and the (k + 1)-th measuring point, the temperature at two measuring points appears different. All the temperature measuring points downstream of the fault point, including the (k + 1)-th and (k + 2)-th temperature measuring points, can perceive noticeable temperature change when the short circuit occurs. If it is a broken line fault and the temperature measuring optical fiber is not damaged, the result can be similar. By monitoring the temperature of A, B and C three-phase cable at the same time, the change of temperature measurement result caused by environmental change can be eliminated. When there is an obvious difference in three-phase temperature, it can be judged as a fault to prevent misjudgment. Taking the single-phase grounding fault of cable as an example, the algorithm is as followed:
Δ T k ( t ) = T k + 1 ( t ) T k ( t ) > τ k
Δ T t ( k ) = T k ( t + Δ t ) T k ( t ) > τ t
In Equation (8): Δ T k ( t ) is the temperature gradient of the k-th measuring point at time t, T k ( t ) , T k + 1 ( t ) is the temperature of the k-th and (k + 1)-th measuring points at time t, τ k is the preset lower limit threshold of temperature gradient. When the gradient of the k-th measuring point at time t exceeds the threshold, it is determined that the fault occurs at the k-th measuring point. In Equation (9): Δ T t ( k ) is the rate of temperature change of the k-th measuring point at time t, T k ( t ) , T k ( t + Δ t ) is the temperature of the k-th measuring point at time t and t + Δt, Δt is the sampling period of DTS, and τ t is the preset lower threshold of the rate of temperature change. When the rate of temperature change of the k-th measuring point at time t exceeds the threshold, it is determined that the fault occurs at the k-th measuring point.

3. Numerical Simulation

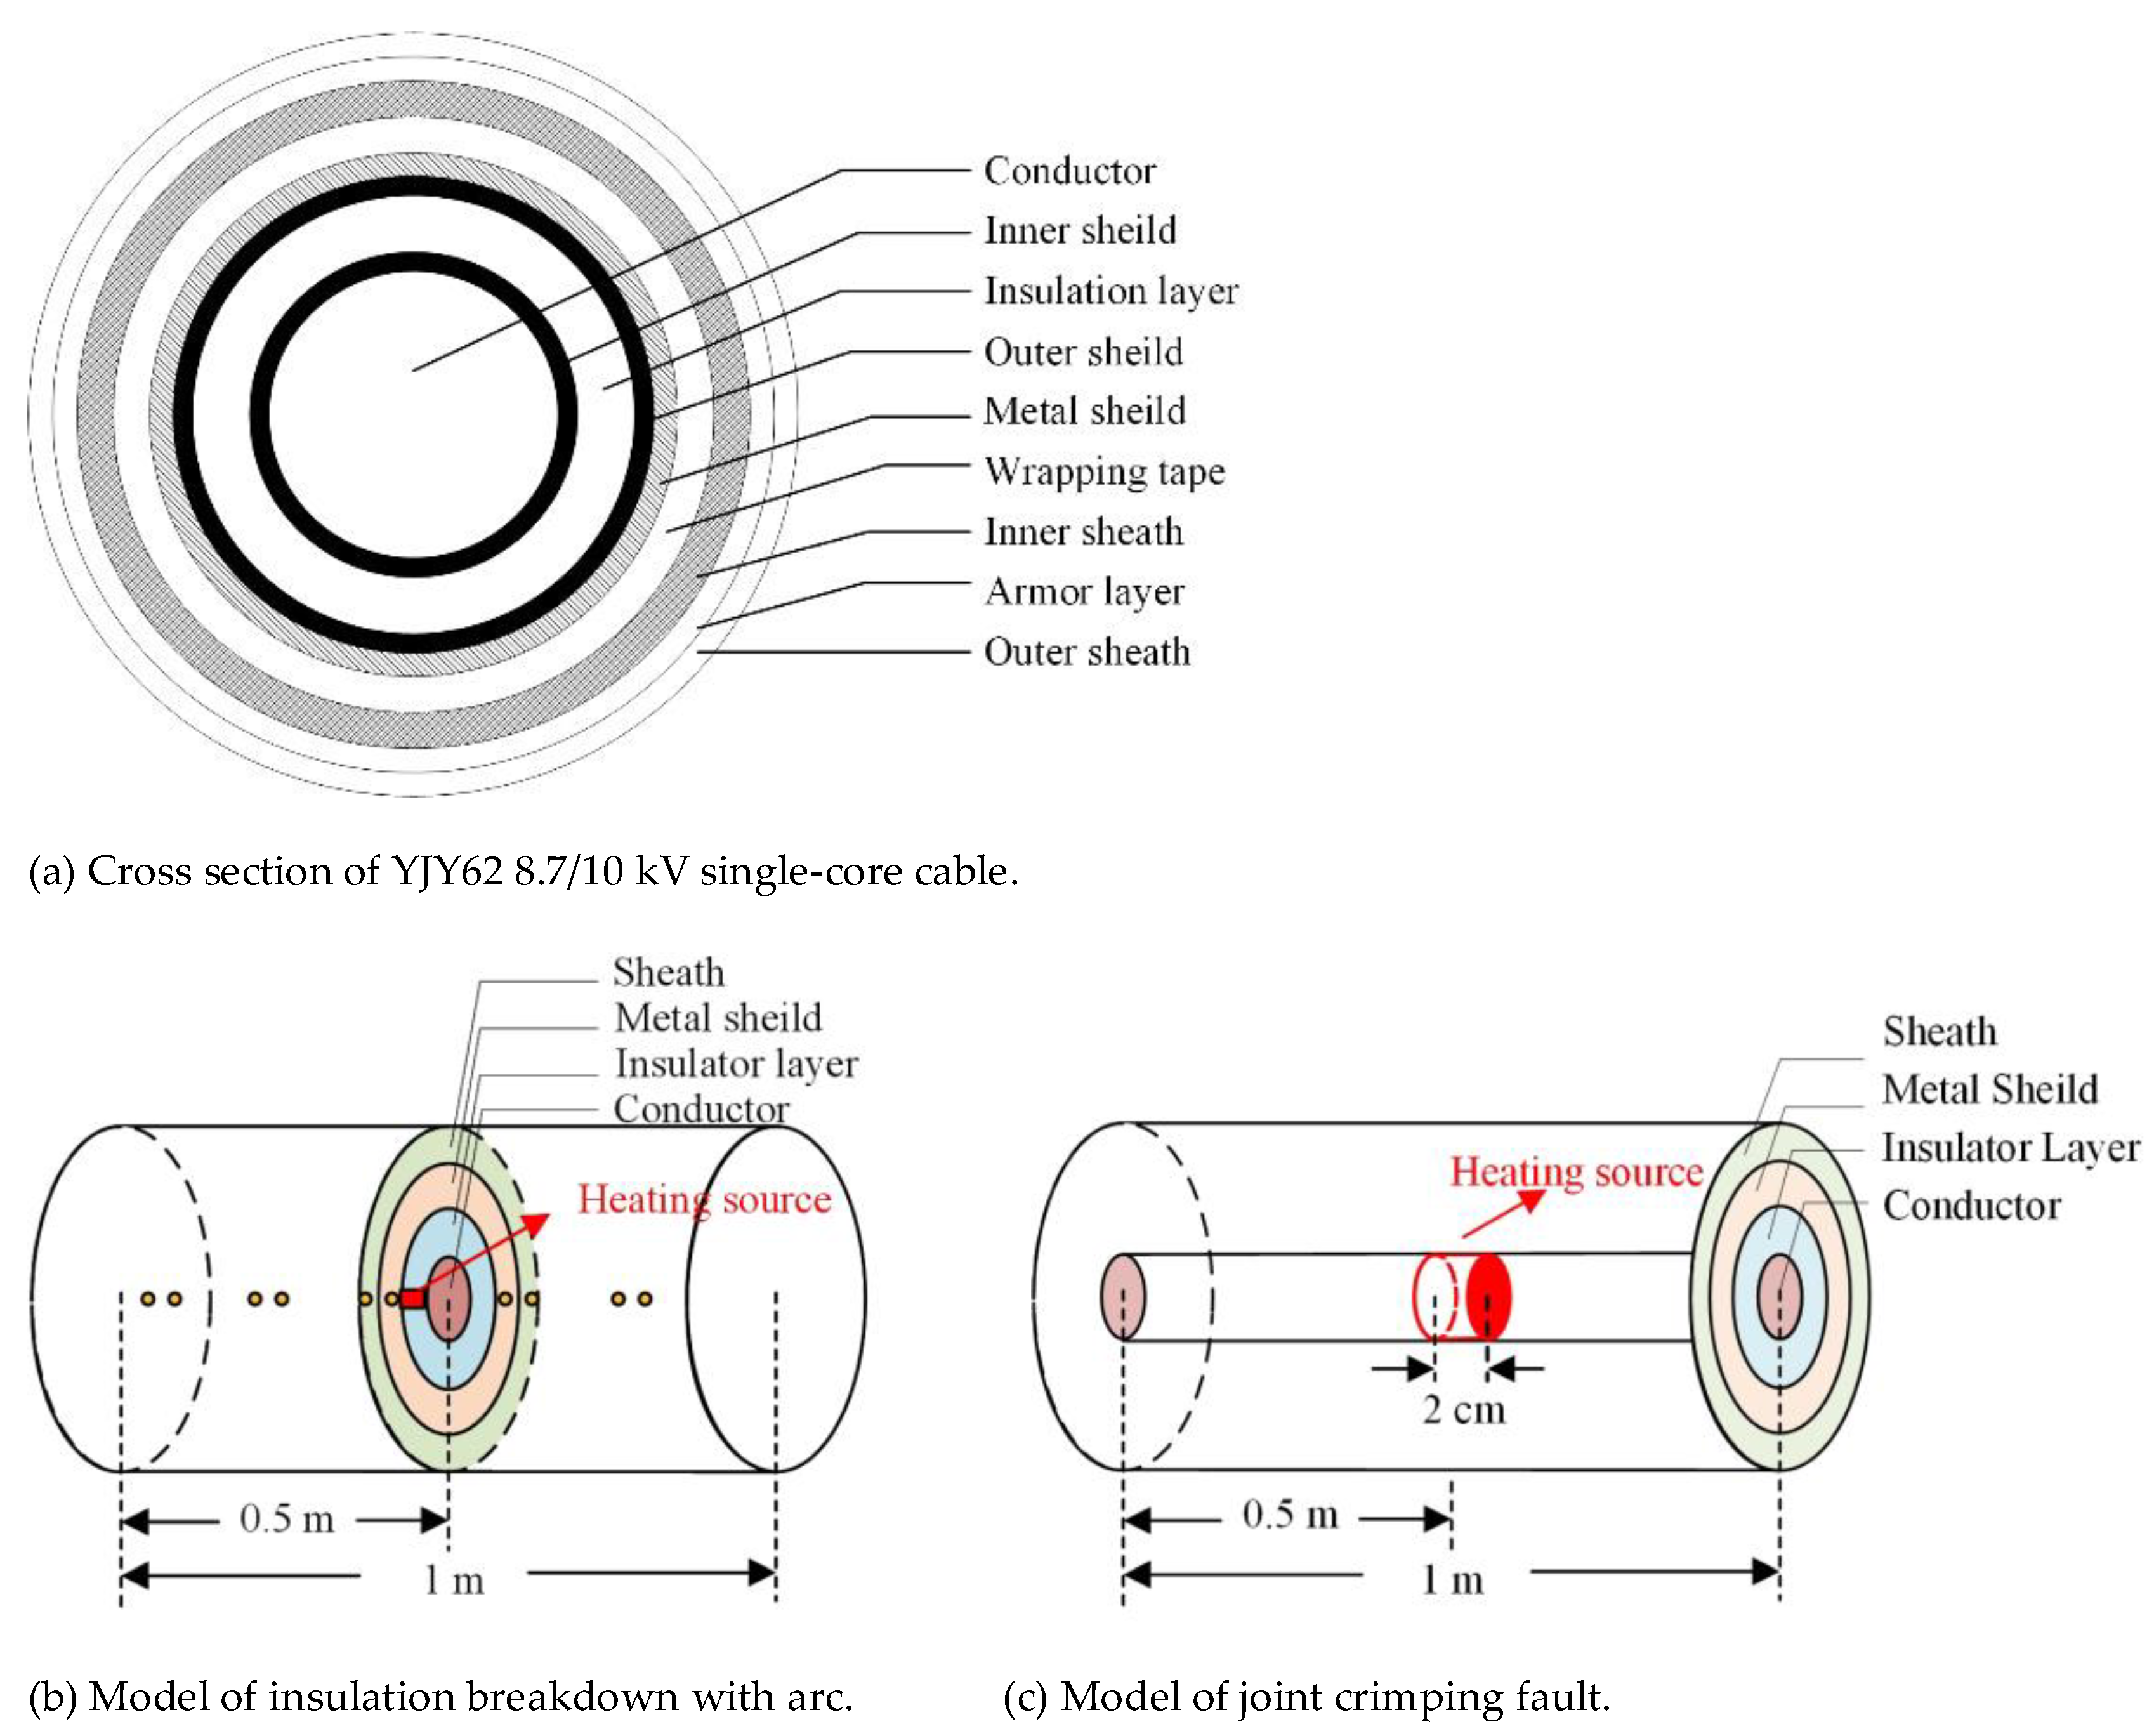
3.1. Structure and Thermal Parameters of the Cable

In the simulation, type YJY62 8.7/10 kV cable was studied as a typical example, which is a kind of single-core cable widely used in 10 kV RPTL. The cross-section and specific parameters of the cable are shown in Figure 3a and Table 1, respectively. In order to simplify the simulation, the inner shield and the outer shield of the cable, which are thin enough to omit, are incorporated into the insulation layer.

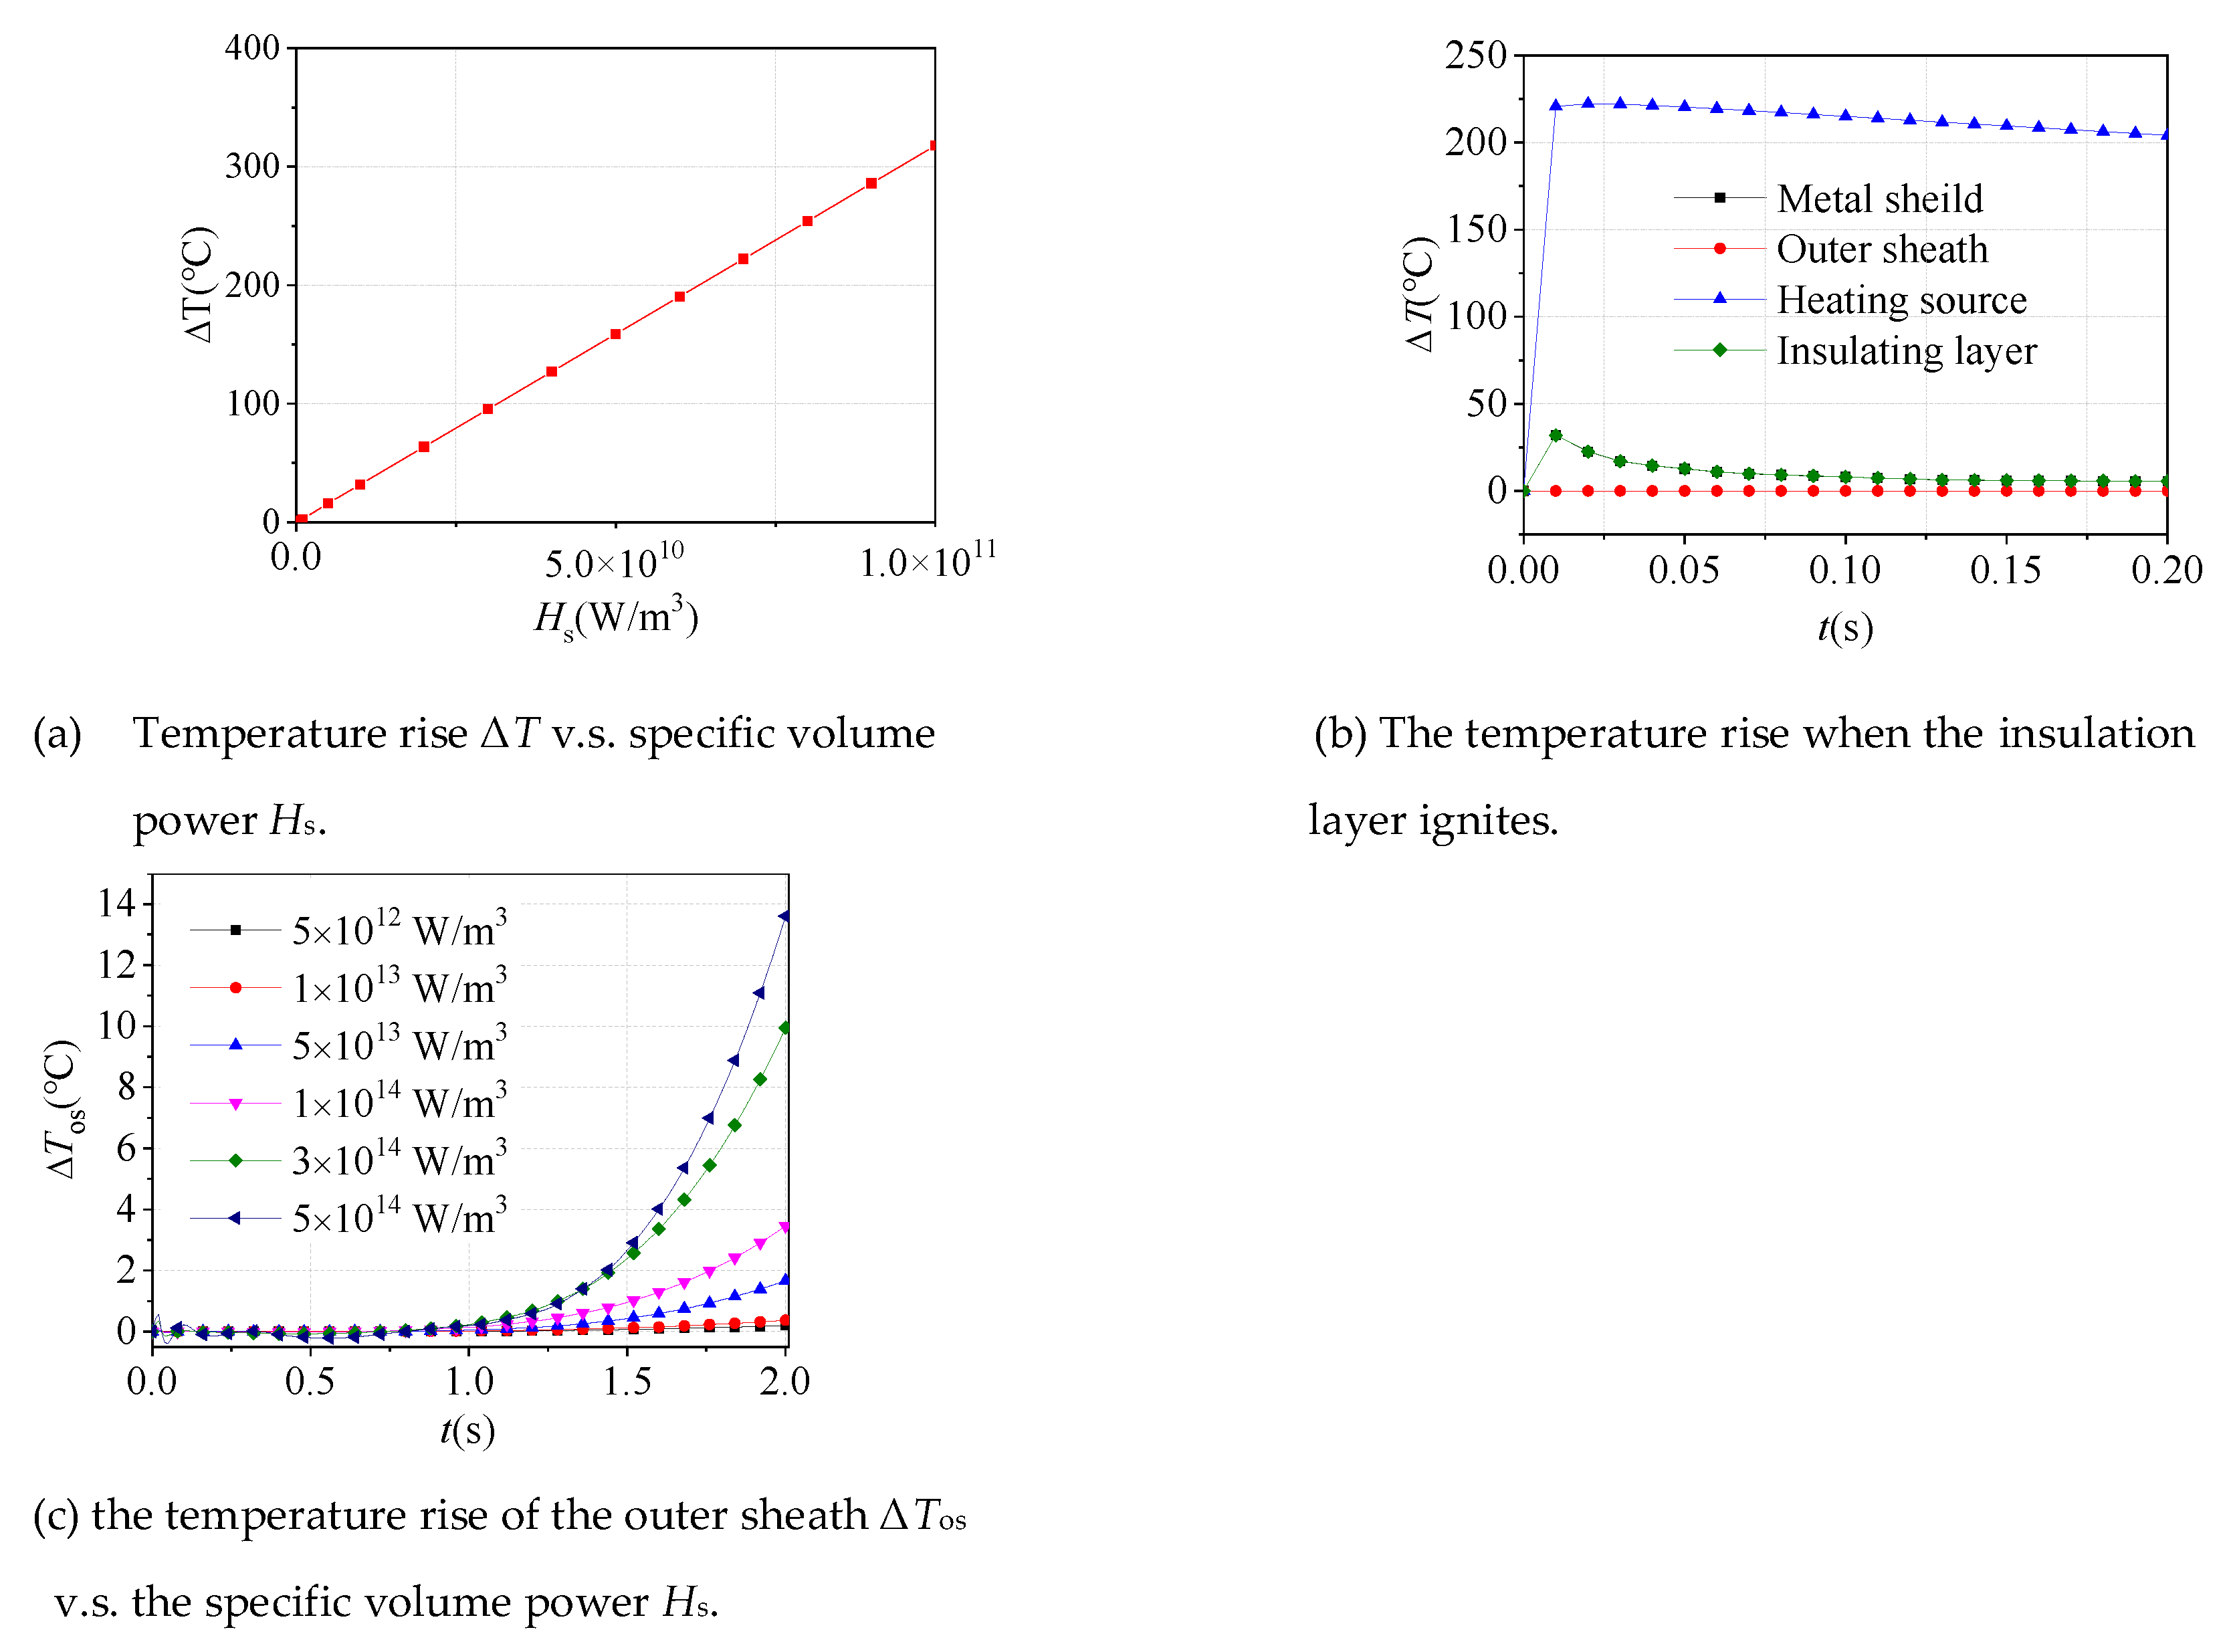
3.2. The Temperature Field of the Cable under Arc Discharge

When laid beneath the ground, the cable can easily produce electrical branches under the disadvantaged environment of humidity, high temperature, etc. Once the branches penetrate the main insulation of the cable, a large amount of heat will be generated in a short time, which may lead to the ignition of the cable. Figure 3b shows the model of the cable insulation breakdown arc. Assuming that the cable main insulation arc discharge duration is 0.01 s, the arc discharge is equivalent to a line-shaped heat source, located at the insulation layer.
The relationship between the maximum temperature rise at the heat source and its specific volume power is shown in Figure 4a. It can be seen that when the unit volume thermal power of the heat source Hs is about 7 × 10¹⁰ W / m3, the cable insulation layer has reached the temperature condition of ignition. In that situation, the temperature rise of each layer is shown in Figure 4b. It can be seen that the maximum temperature rise of the shielding layer is 31.89 °C when the cable insulation layer is burned while there is almost no temperature rise in the outer sheath. The result indicates the fact that the DTS will obtain a more excellent fault perception with the implantation of the optical fiber in the metal shield.
In order to investigate the magnitude of the thermal effect of arc when the outer sheath has a considerable temperature rise, a series of simulations are carried out. The relation between the temperature rise of the outer sheath and the specific volume power is shown in Figure 4c. The results show that when the specific volume power reaches 1 × 10¹³ W/m3, the temperature rise of the outer sheath is as obvious as about 0.2 °C. The conclusion can be drawn that even in the case of more extreme and lower probability failures, the temperature rise in the outer sheath is extremely limited.

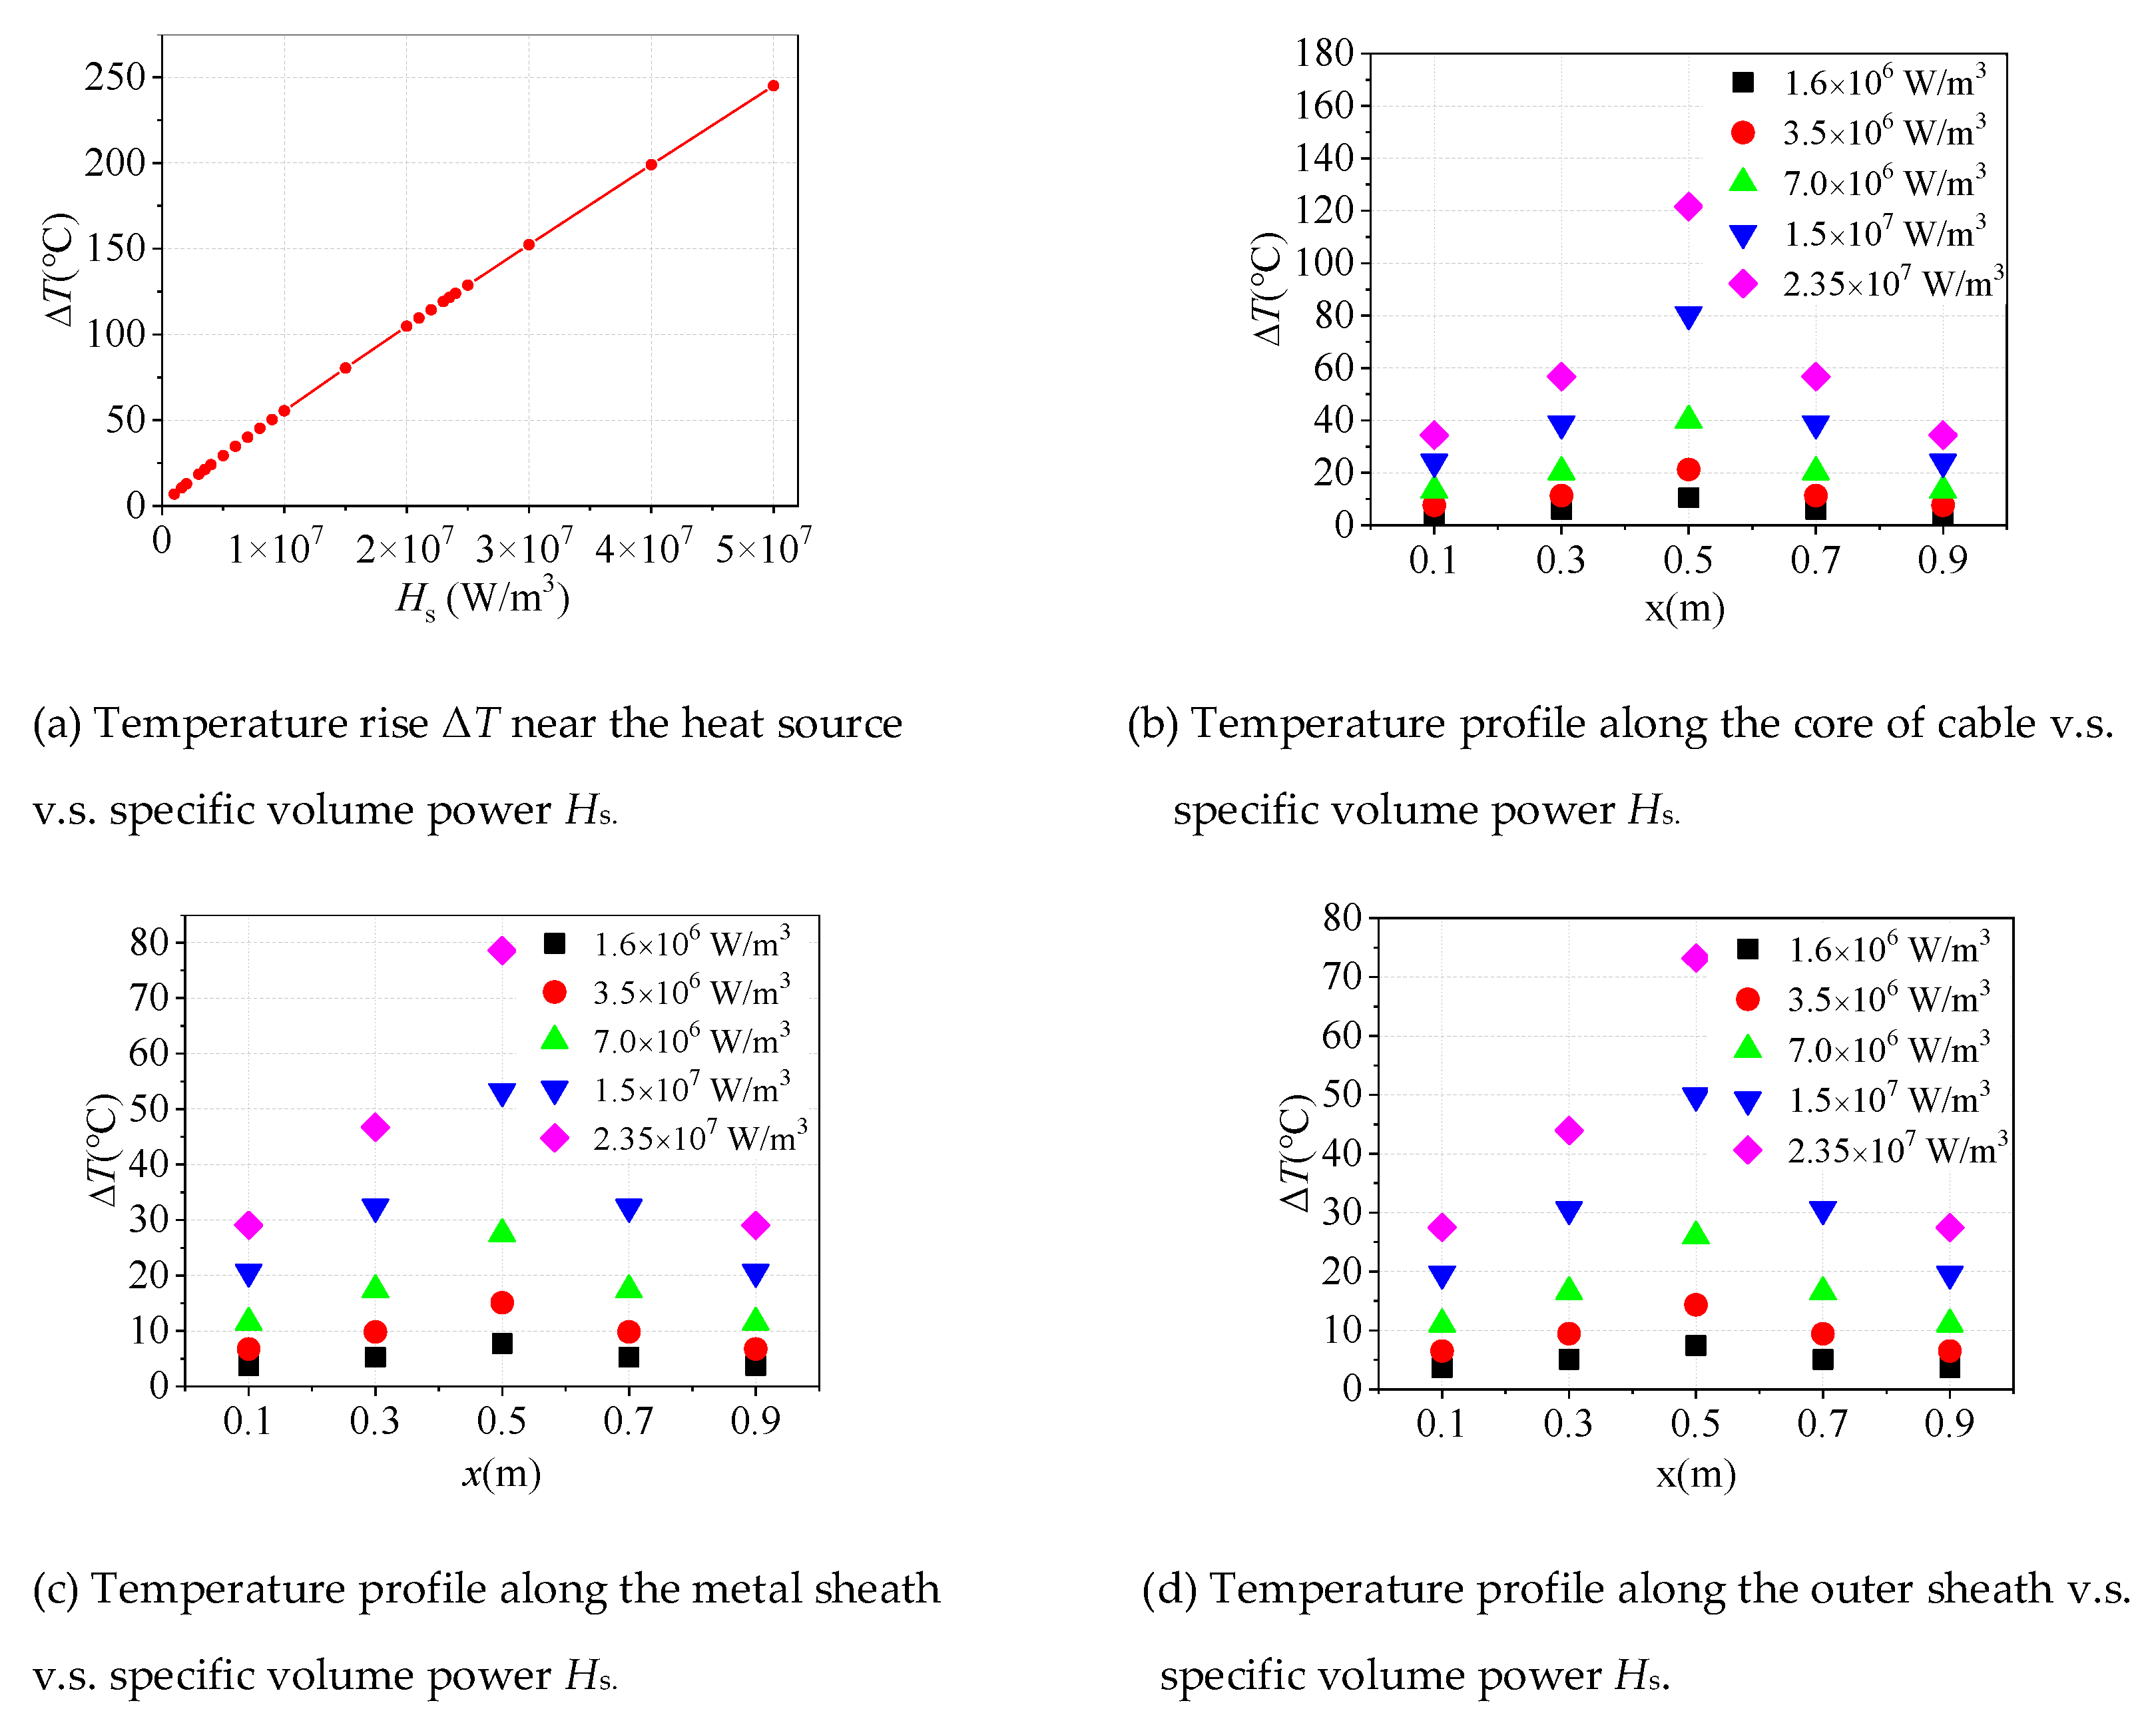
3.3. The Temperature Field of the Cable under Poor Crimping

As shown in Figure 3c, the model of joint crimping fault is established, using COMSOL finite element (FEM) software to model and calculate the joint heating fault caused by cable joint crimping failure. The heat source is set as a length of 2 cm, and the heat source is located at 0.5 m of the conductor. The temperature probes are arranged along the conductor, metal shielding and outer sheath to calculate the temperature rise of each layer of the cable when the temperature rise near the core is 10 °C, 20 °C, 40 °C, 80 °C and 120 °C.
The relationship between the temperature rise at 0.5 m of the cable core and the specific volume power of the heat source is shown in Figure 5a. It can be seen from the figure that when the specific volume power is 1.6 × 10⁶ W/m3, 3.5 × 10⁶ W/m3, 7 × 10⁶ W/m3, 1.5 × 10⁷ W/m3 and 2.35 × 10⁷ W/m3 respectively, the temperature rise near the core reaches 10 °C, 20 °C, 40 °C, 80 °C and 120 °C as shown in Figure 5b.
The temperature rise at different positions of shielding layer and outer sheath is shown in Figure 5c,d respectively. When the temperature rise near the core (0.5 m) is 40 °C the specific volume power of the heat source is 7 × 10⁶ W/m3. Meanwhile, the temperature rise of the shielding layer (0.5 m) is 27.49 °C and the temperature rise of the outer sheath (0.5 m) is 25.9 °C. With the comparison between the temperature rise of the same axial coordinates in different layers, it can be seen that the temperature rise of the shielding layer closest to the off-line core layer is the largest, and the temperature rise of the outer sheath is also obvious.

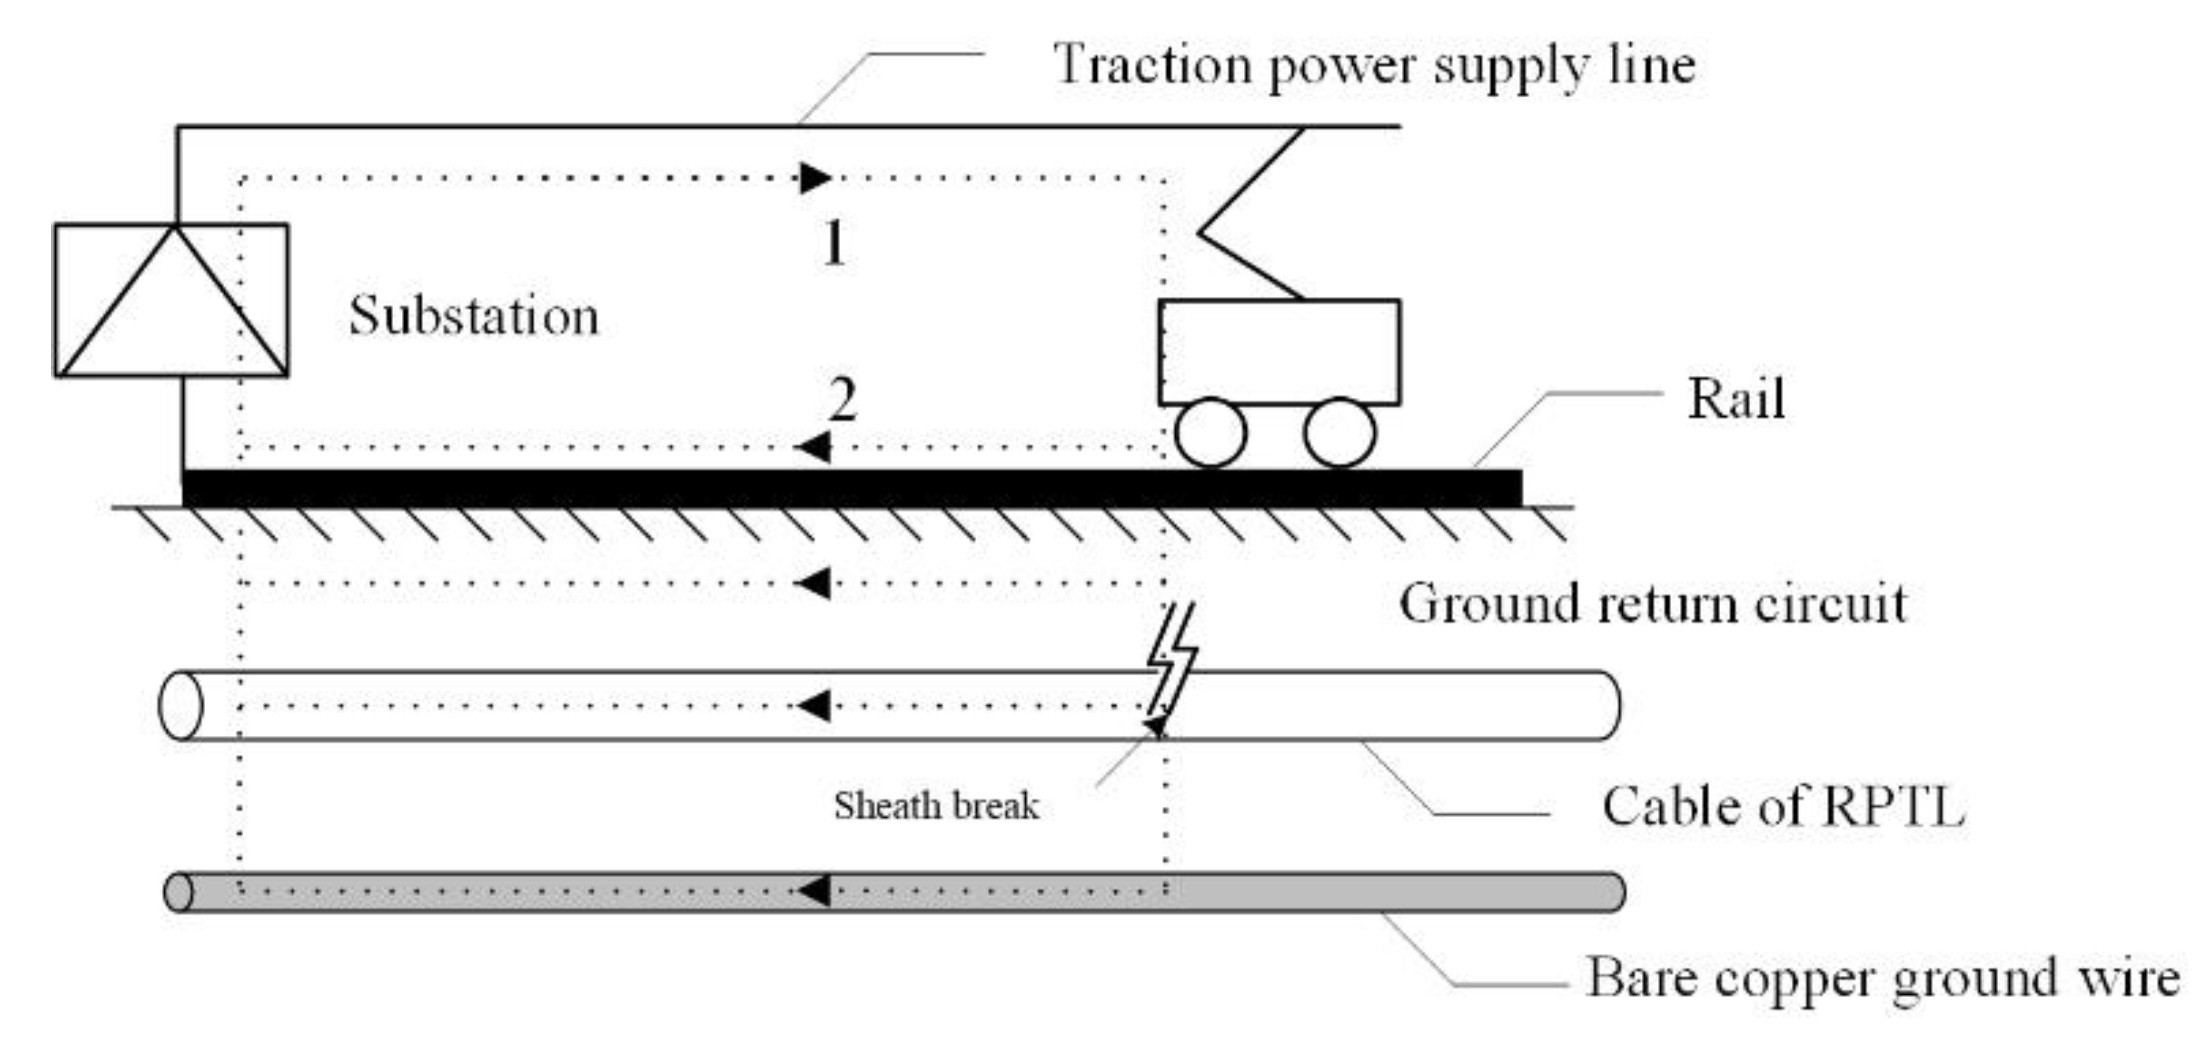
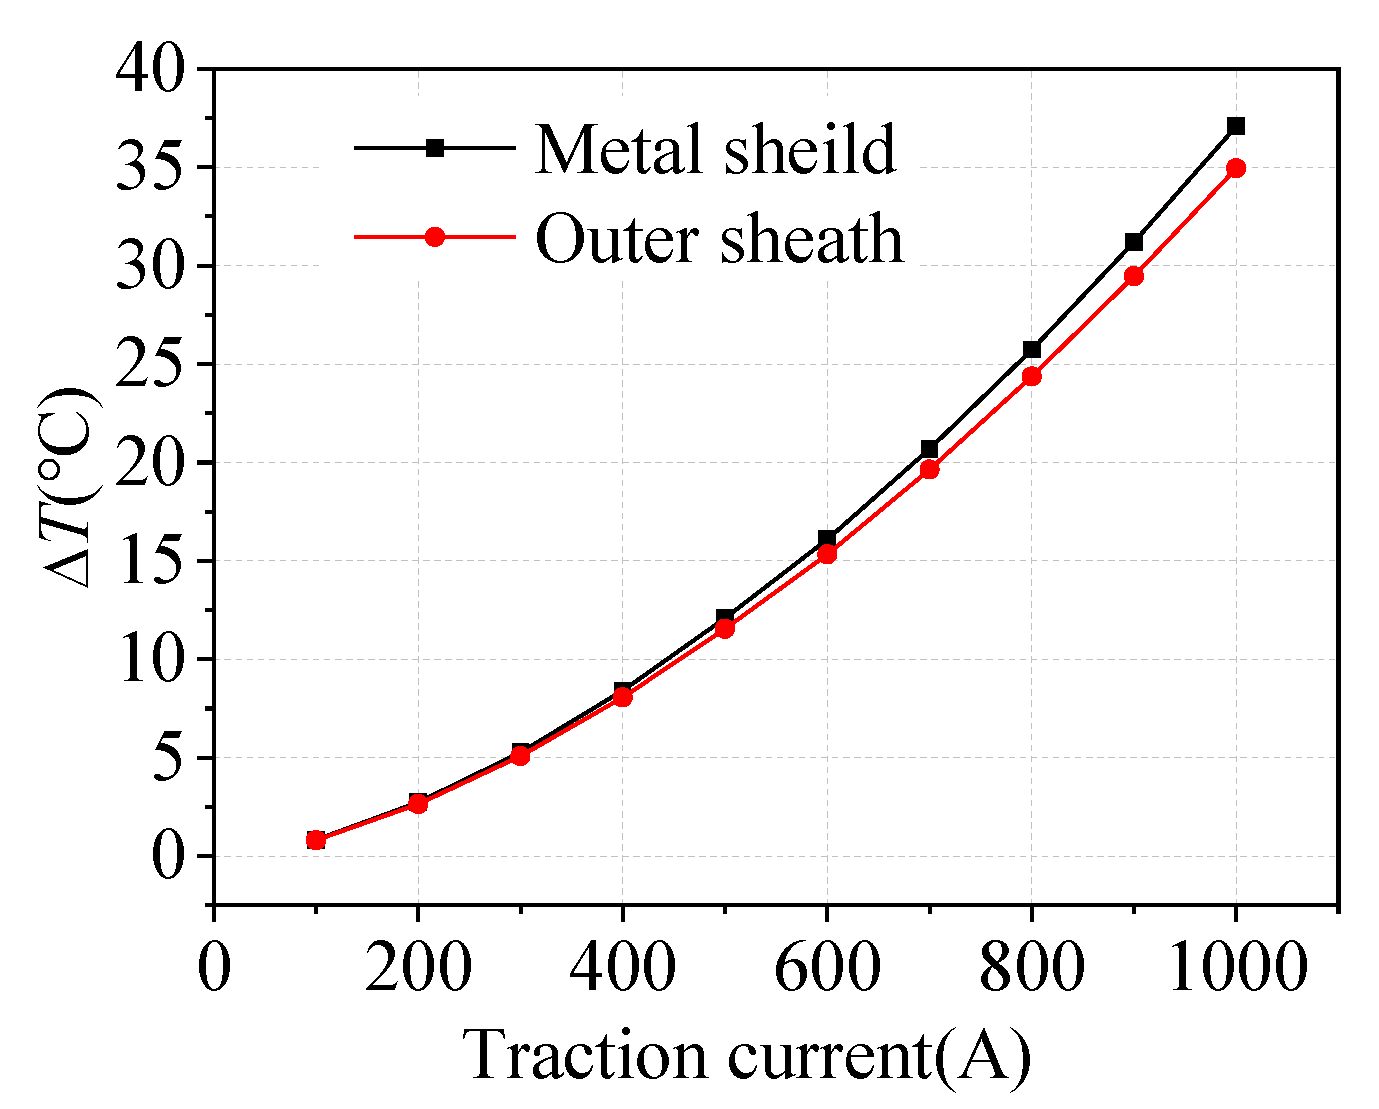
3.4. The Temperature Field of the Cable under Traction Return Fault
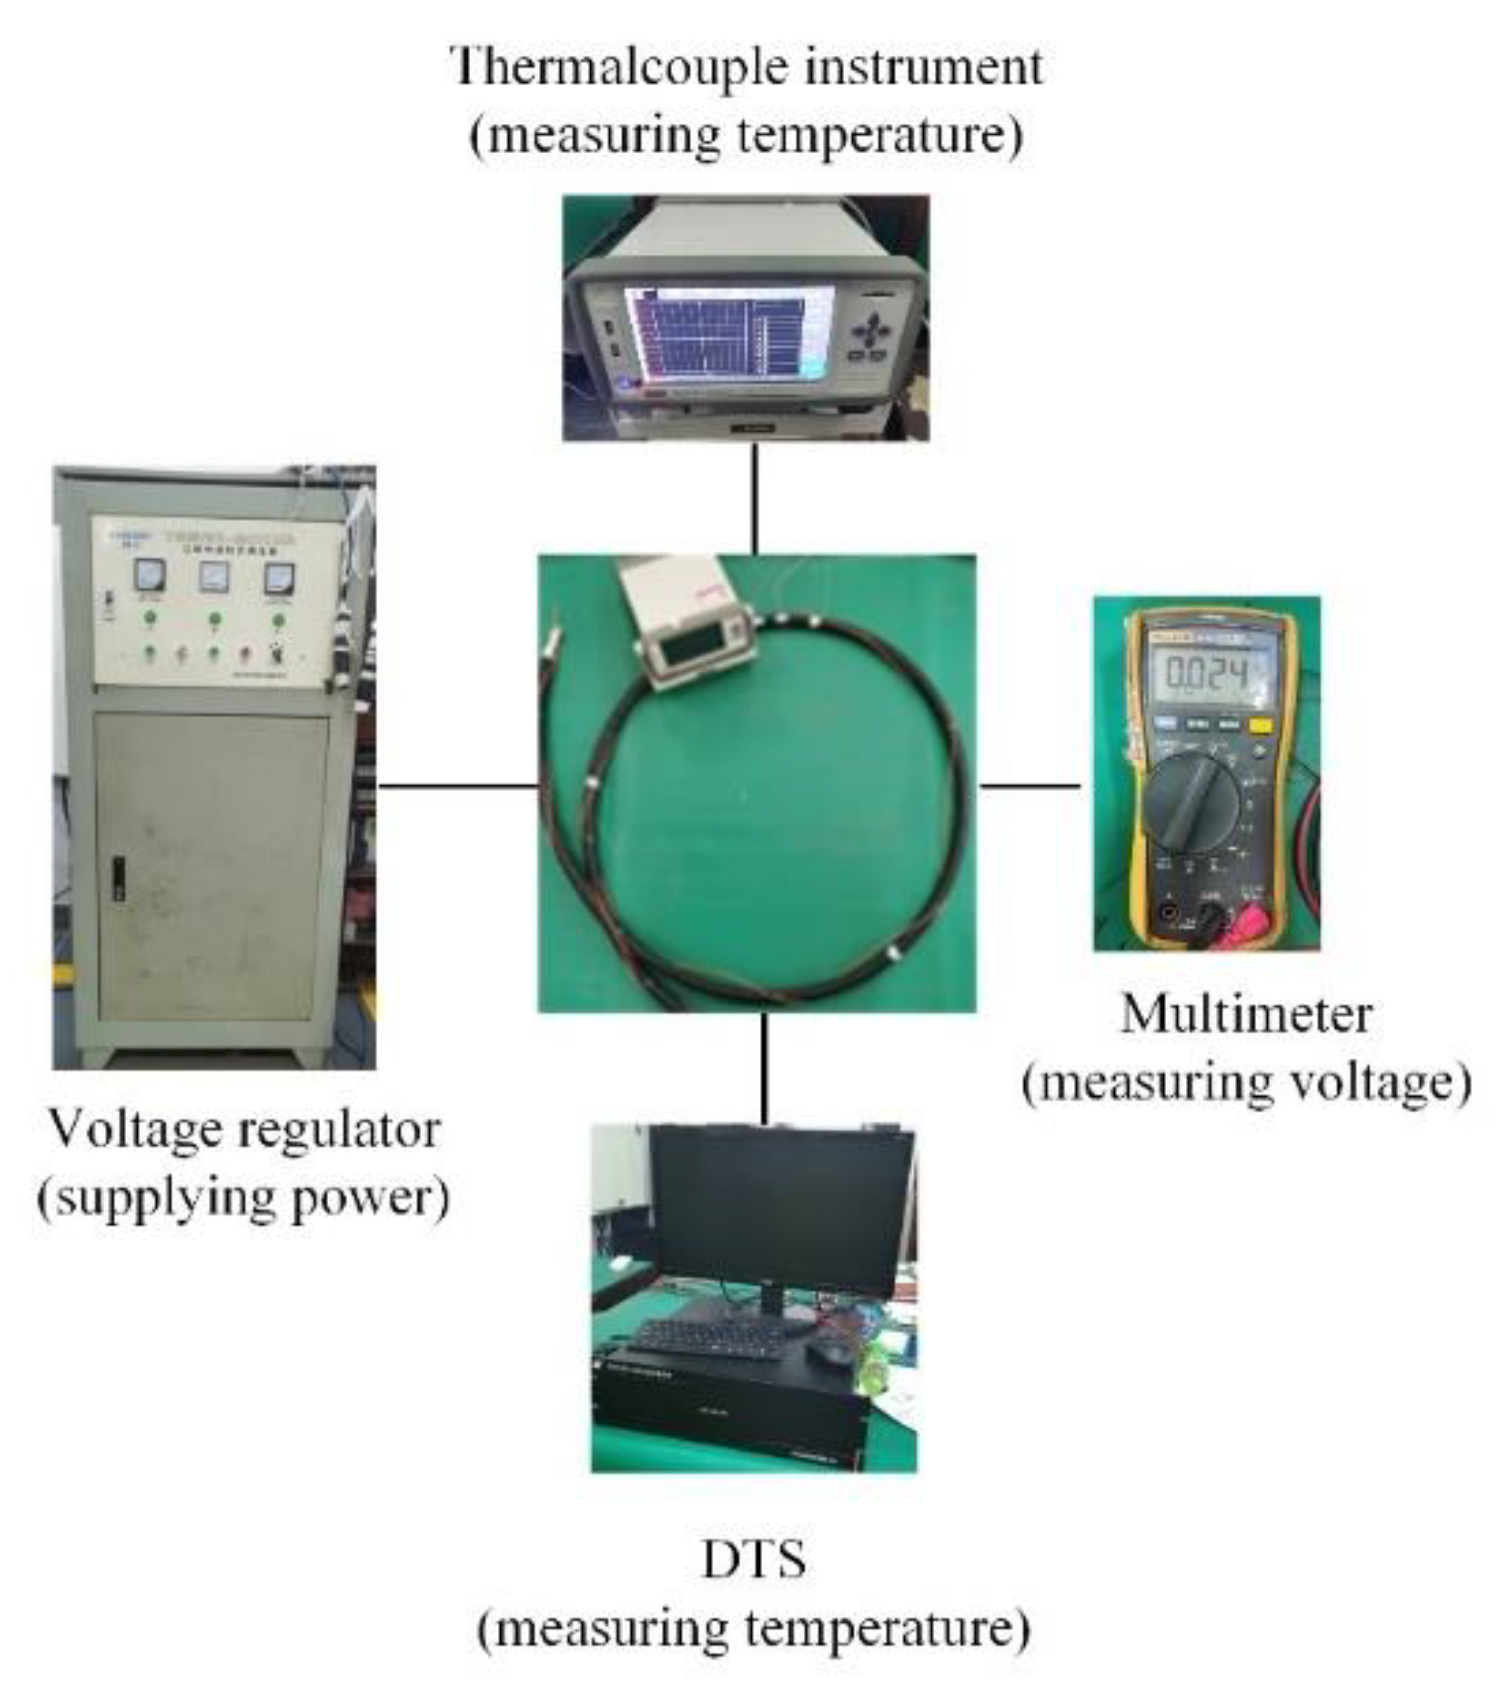
Generally, the traction return current and signal current can be conducted by the rail, the ground return circuit and the bare copper ground wire. Because of the rise of traction return, the signal equipment and track bed structure of track circuit is easily affected and may cause excessive rail potential damage to the insulation of RPTL cables, which threatens the safety of transportation. Unbalanced rail current affects the regular operation of the track circuit, and a high level of medium current will induce potential on the cable, which will affect the normal operation of signal equipment, and the high rail potential will also affect the operation performance of RPTL.
Compared with the normal-speed railway, the RPTL of a high-speed railway has the characteristics of large traction current, large short circuit current of traction network and high rail leakage resistance to ground. These factors lead to a much larger traction return and a lot higher rail potential than that of the normal speed railway. In a traction power supply system, traction current flows out of substation, provides power to locomotive through the feeder and contact network, and then returns to substation along rail, earth and return line. The circuit of the traction network can be simplified to form one loop between catenary and earth and another circuit between orbit and ground, as shown in Figure 6. When the external insulation of the cable is damaged, the shielding layer will share the part of the current in the railway power supply and return system for the earth. Therefore, it is necessary to simulate the temperature rise of the shield and outer sheath when the shield is under the current of this part.
The steady-state current of the core is 10 A. Taking the typical shielding layer shunt situation for calculation, when the traction current is 400 A, the current flowing through the shielding layer is 59.04 A. The temperature rise of the metal shielding layer and the outer sheath is obtained by setting different traction returns, as shown in Figure 7.
It can be seen from Figure 7 that the temperature rise of the metal shielding layer and the outer sheath appears quadratic relations with the magnitude of traction current. When the long-term current of the traction network is 400 A, the current flowing through the shielding layer is 59.04 A, the temperature rise of the metal shielding layer and the outer sheath is about 8 °C.

4. Experiments

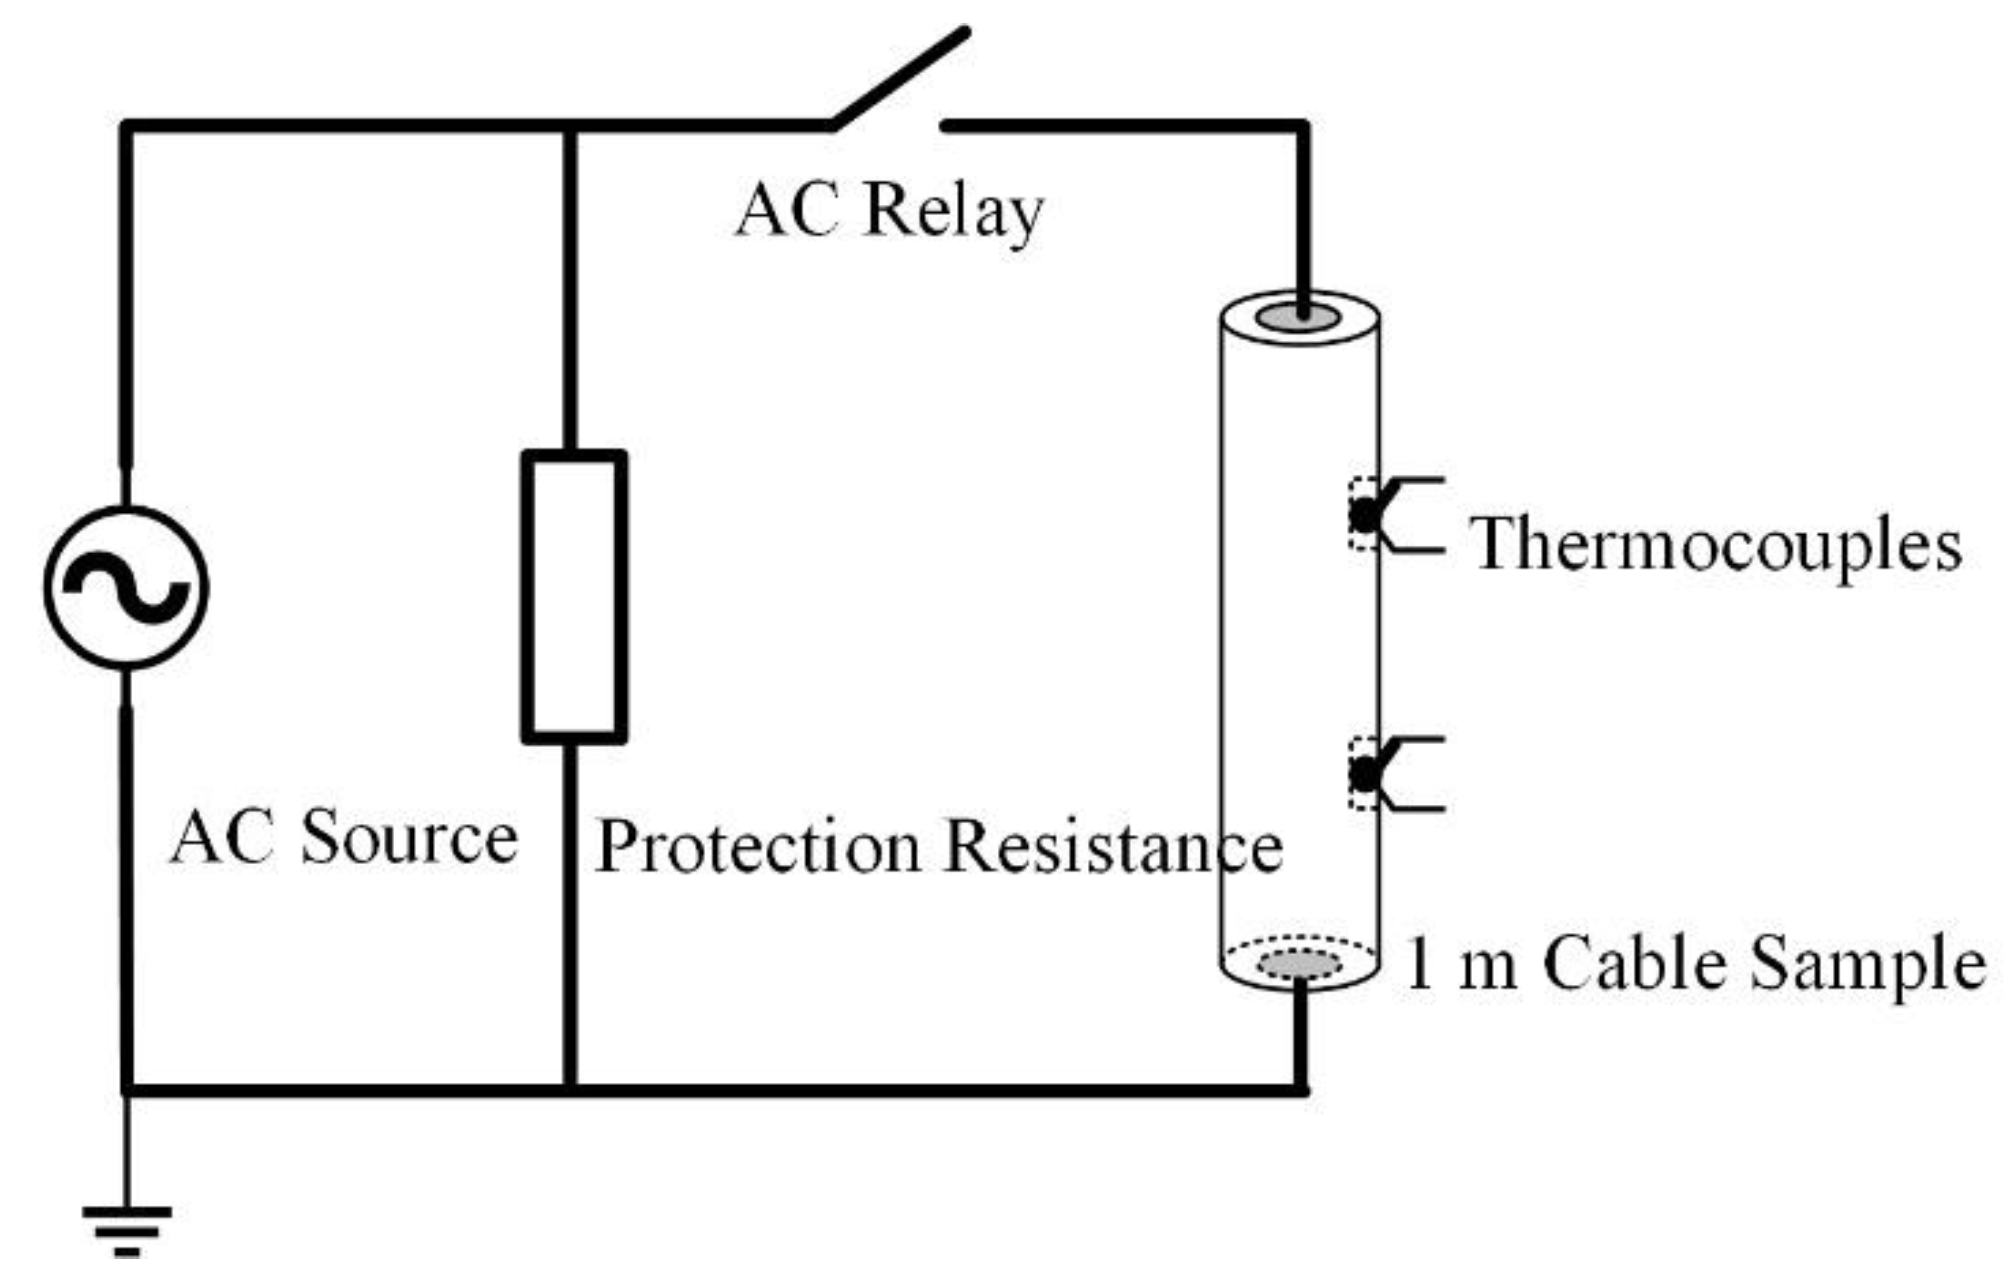
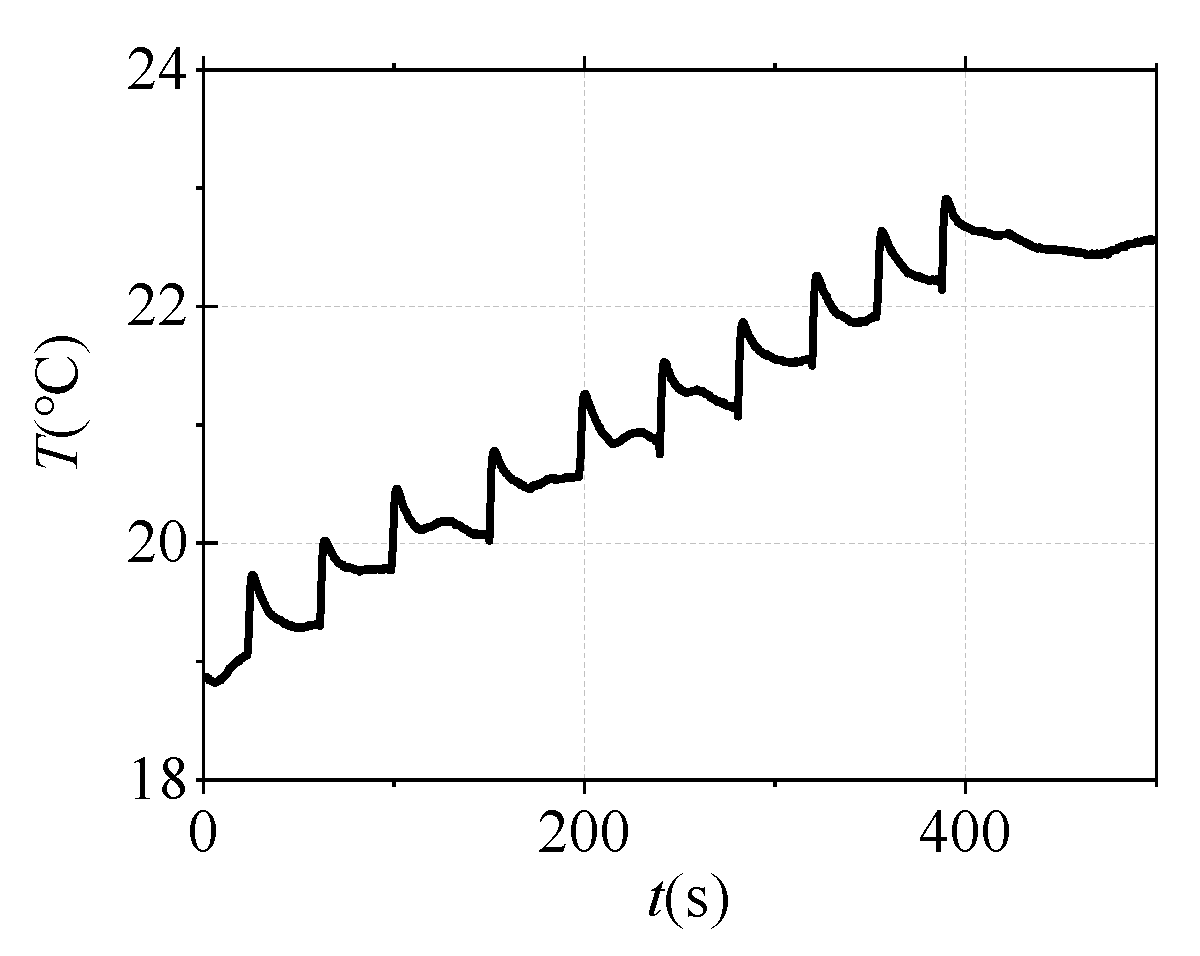
4.1. Temperature Rise Test of Cable Shield under Impulse Current

The experimental circuit is designed to simulate the short-circuit current flowing through the cable shielding layer, as shown in Figure 8. Both ends of the shield layer of the 1 m cable short sample and the AC relay were connected to the current source. 51 Single-Chip Microcomputer (51-SCM) are used to control the on-off of the AC relay so that the current through the cable shielding layer can be held for 0.5 s. The switch is pressed every 40 s ten times, and the output current of the current source is set to 500 A. Three thermocouples are embedded in the shielding layer to measure the temperature change before and after the short-circuit current is applied. The temperature measurement results are shown in Figure 9. It can be seen that the average temperature rise of the shielding layer is about 0.7 °C each time when a single short-circuit impact is applied, which is near the temperature resolution of the DTS. If the contact between the sensor and the cable is not close enough, the performance of DTS could be greatly reduced.

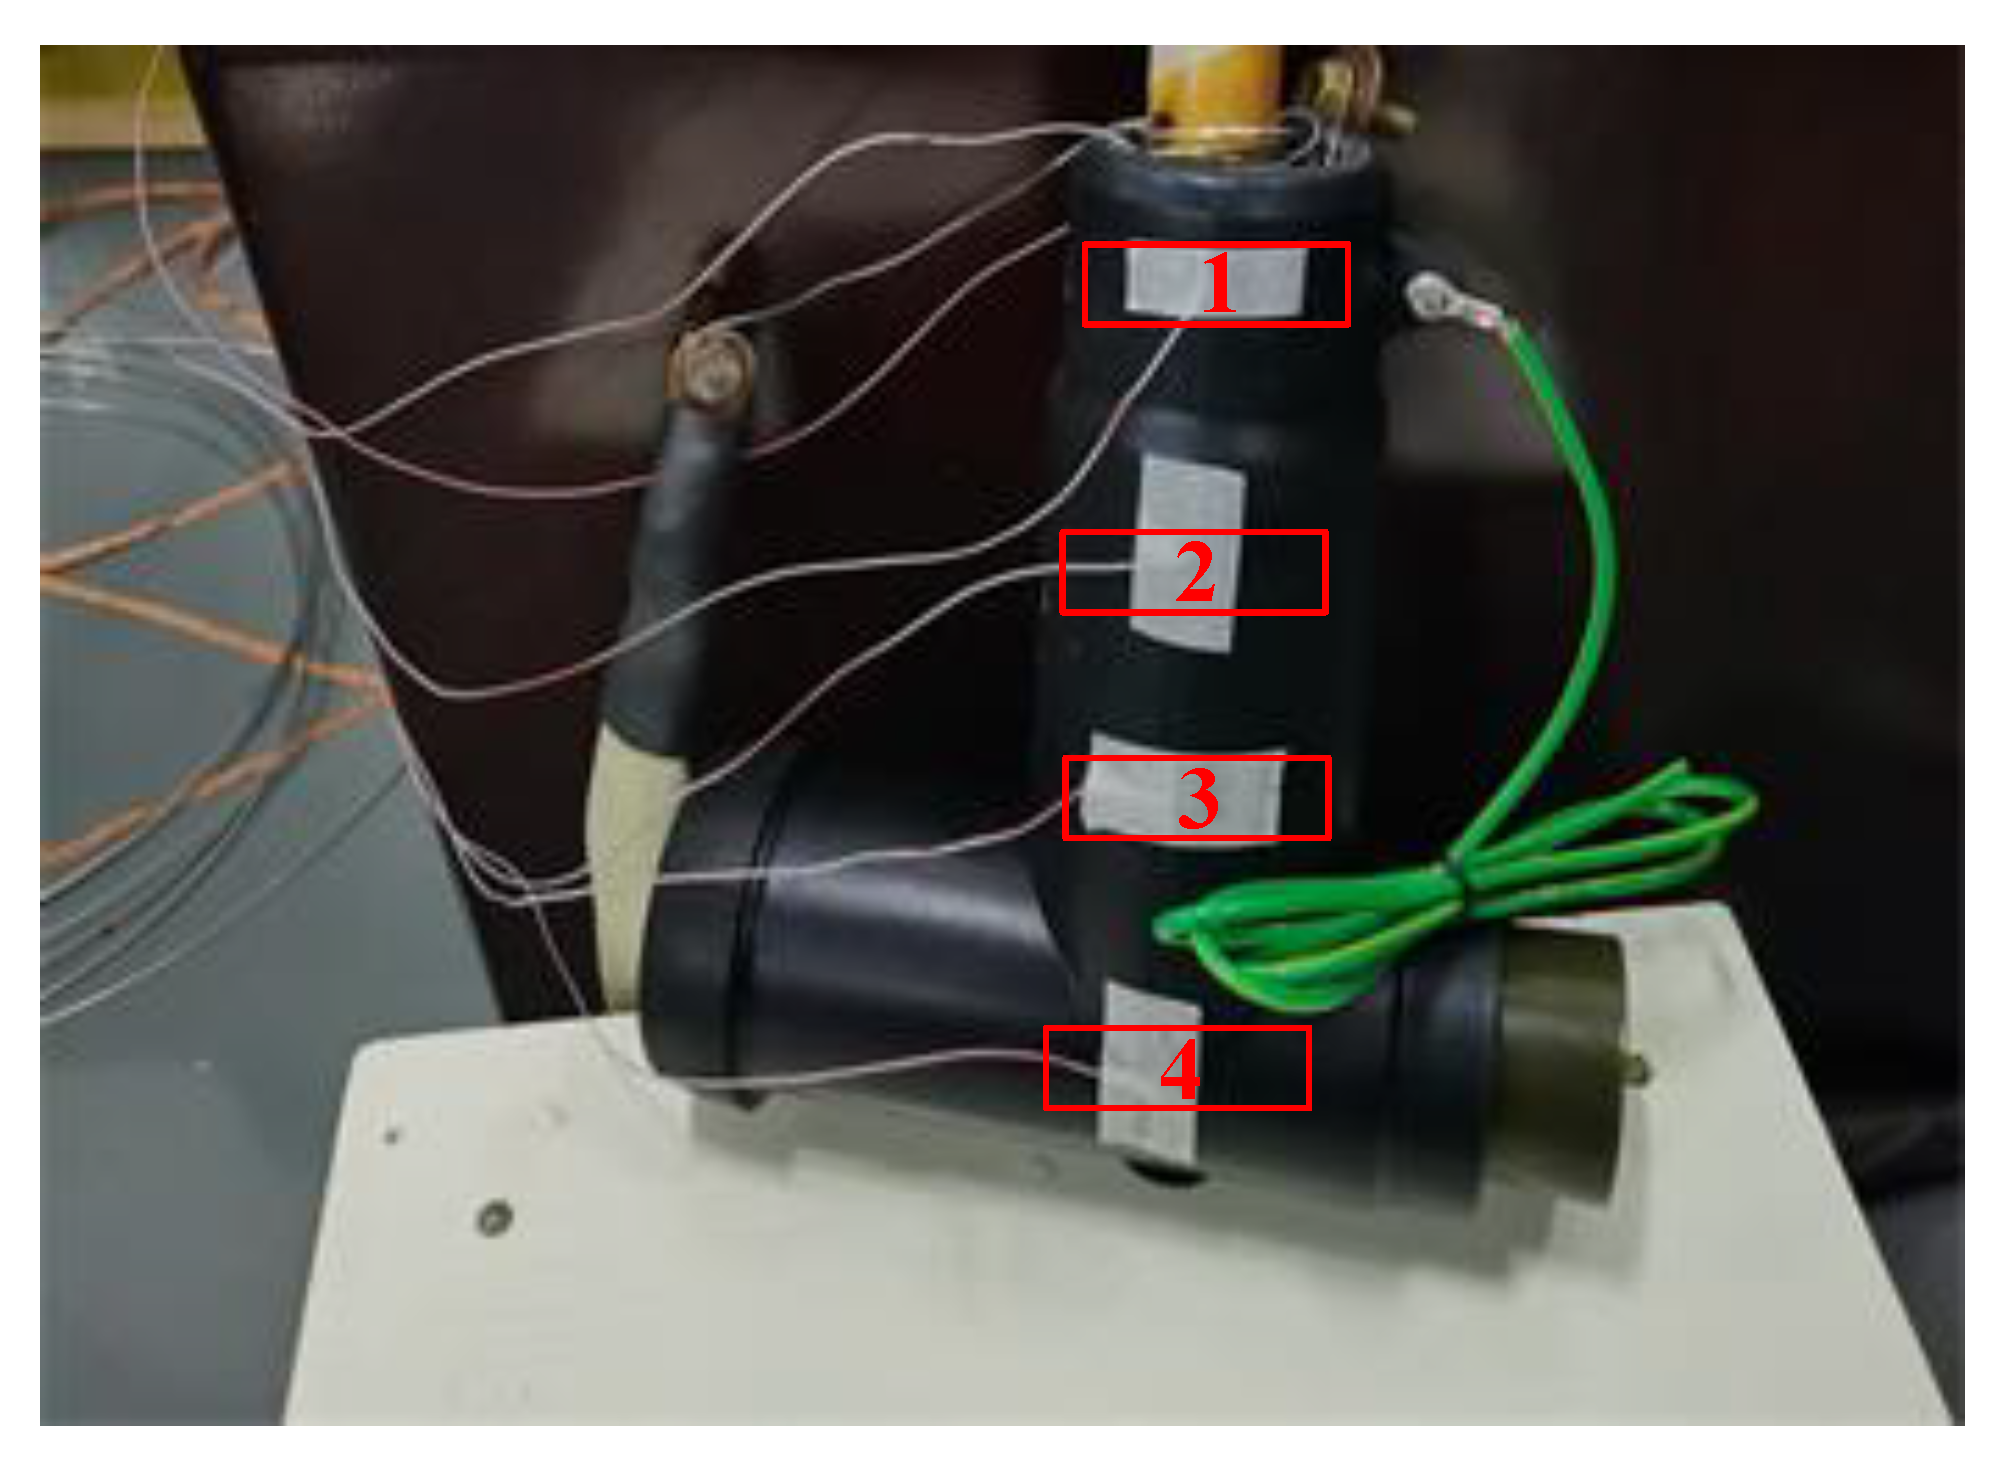
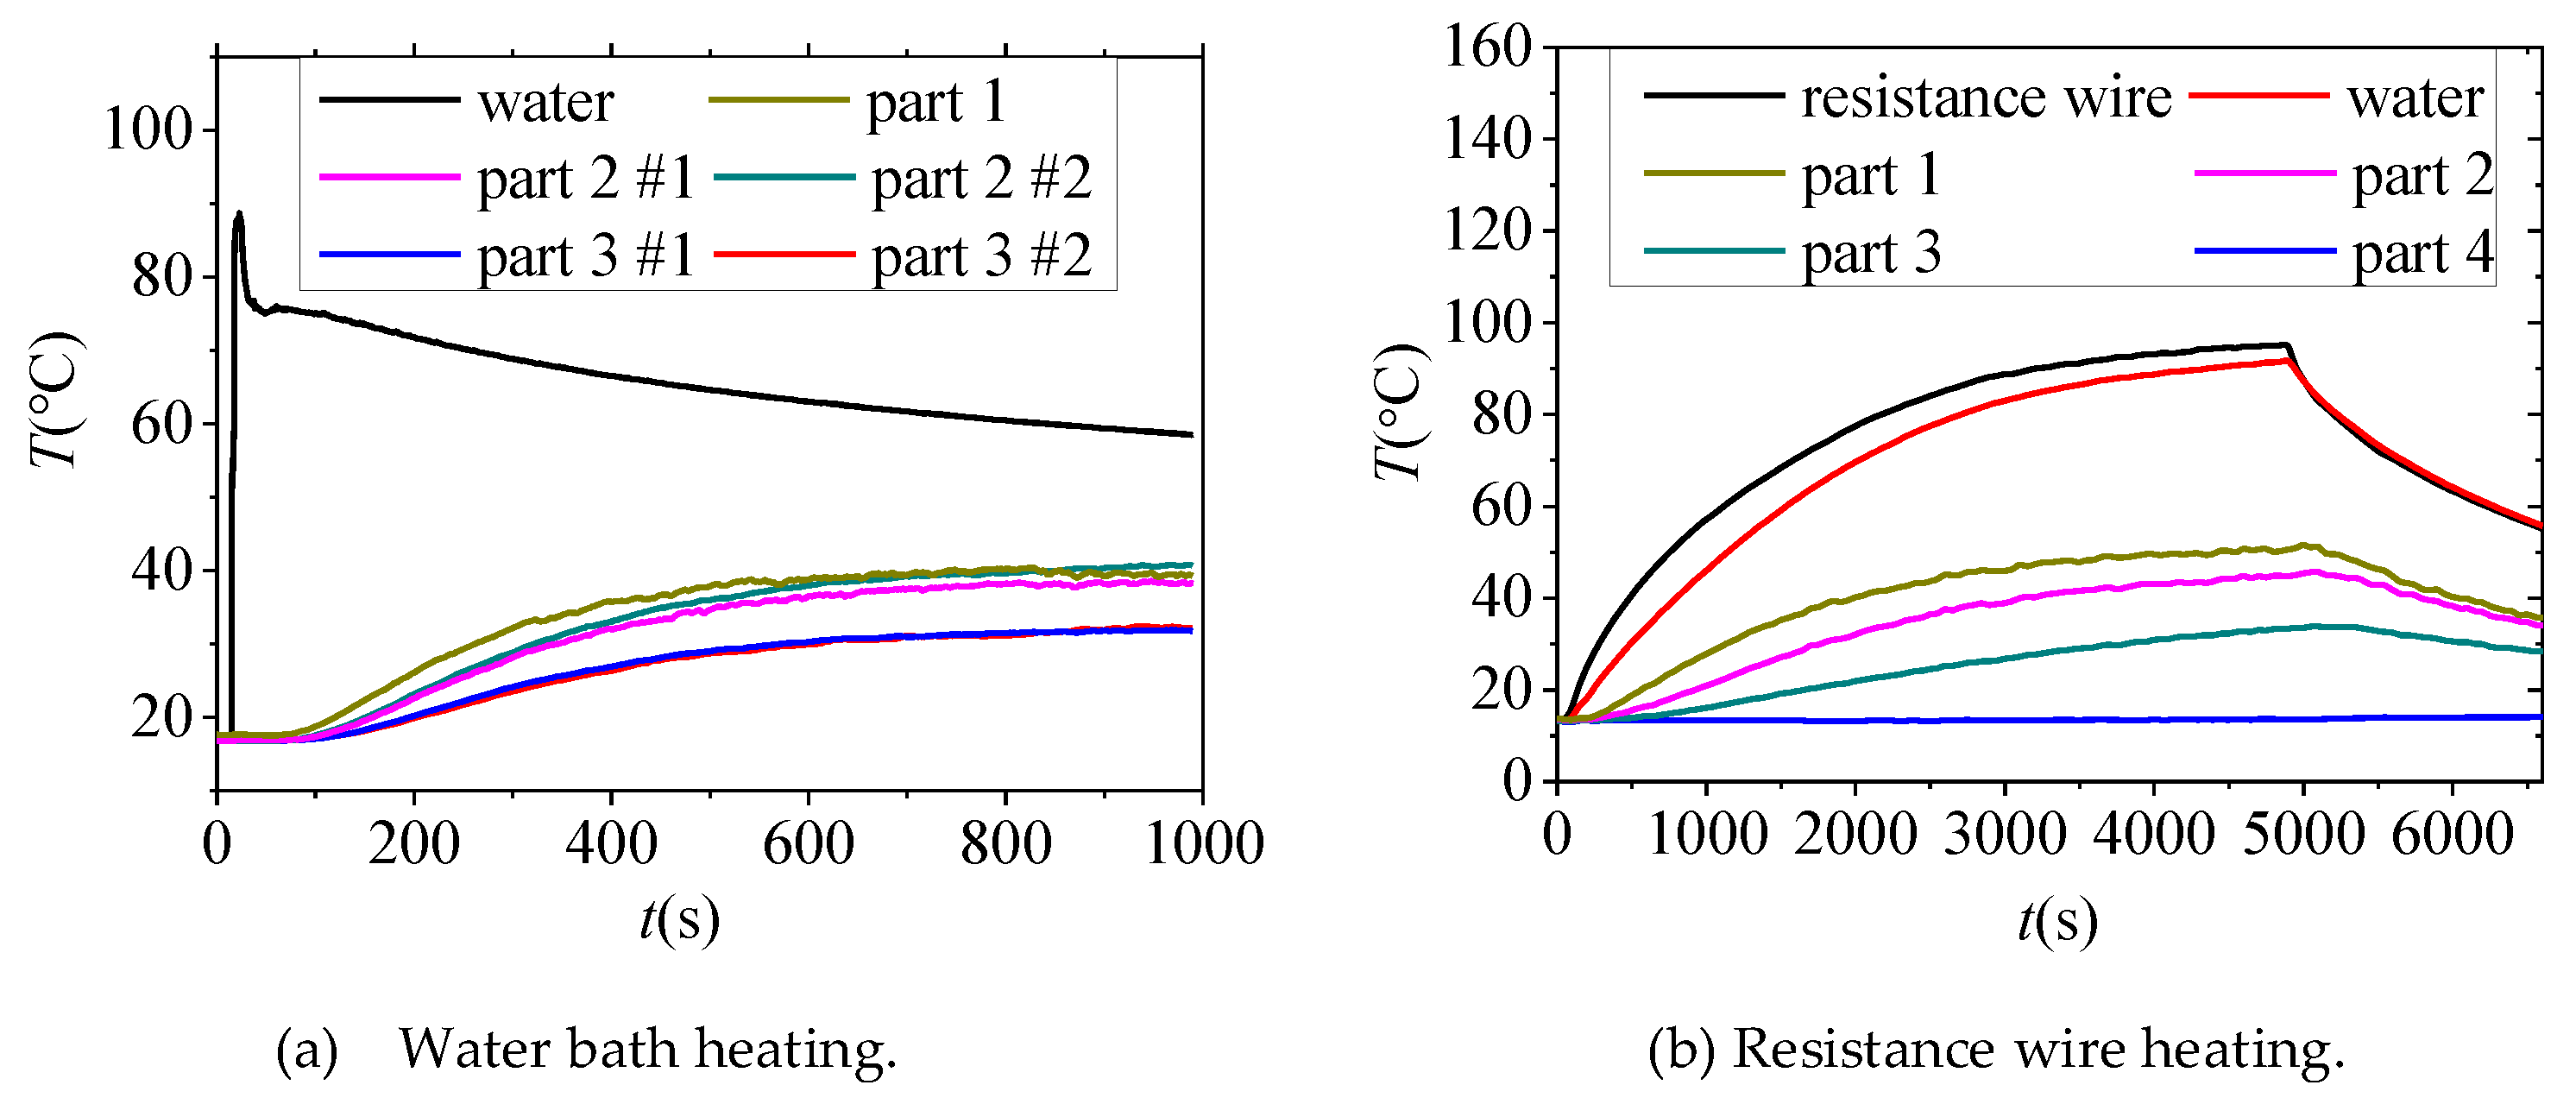
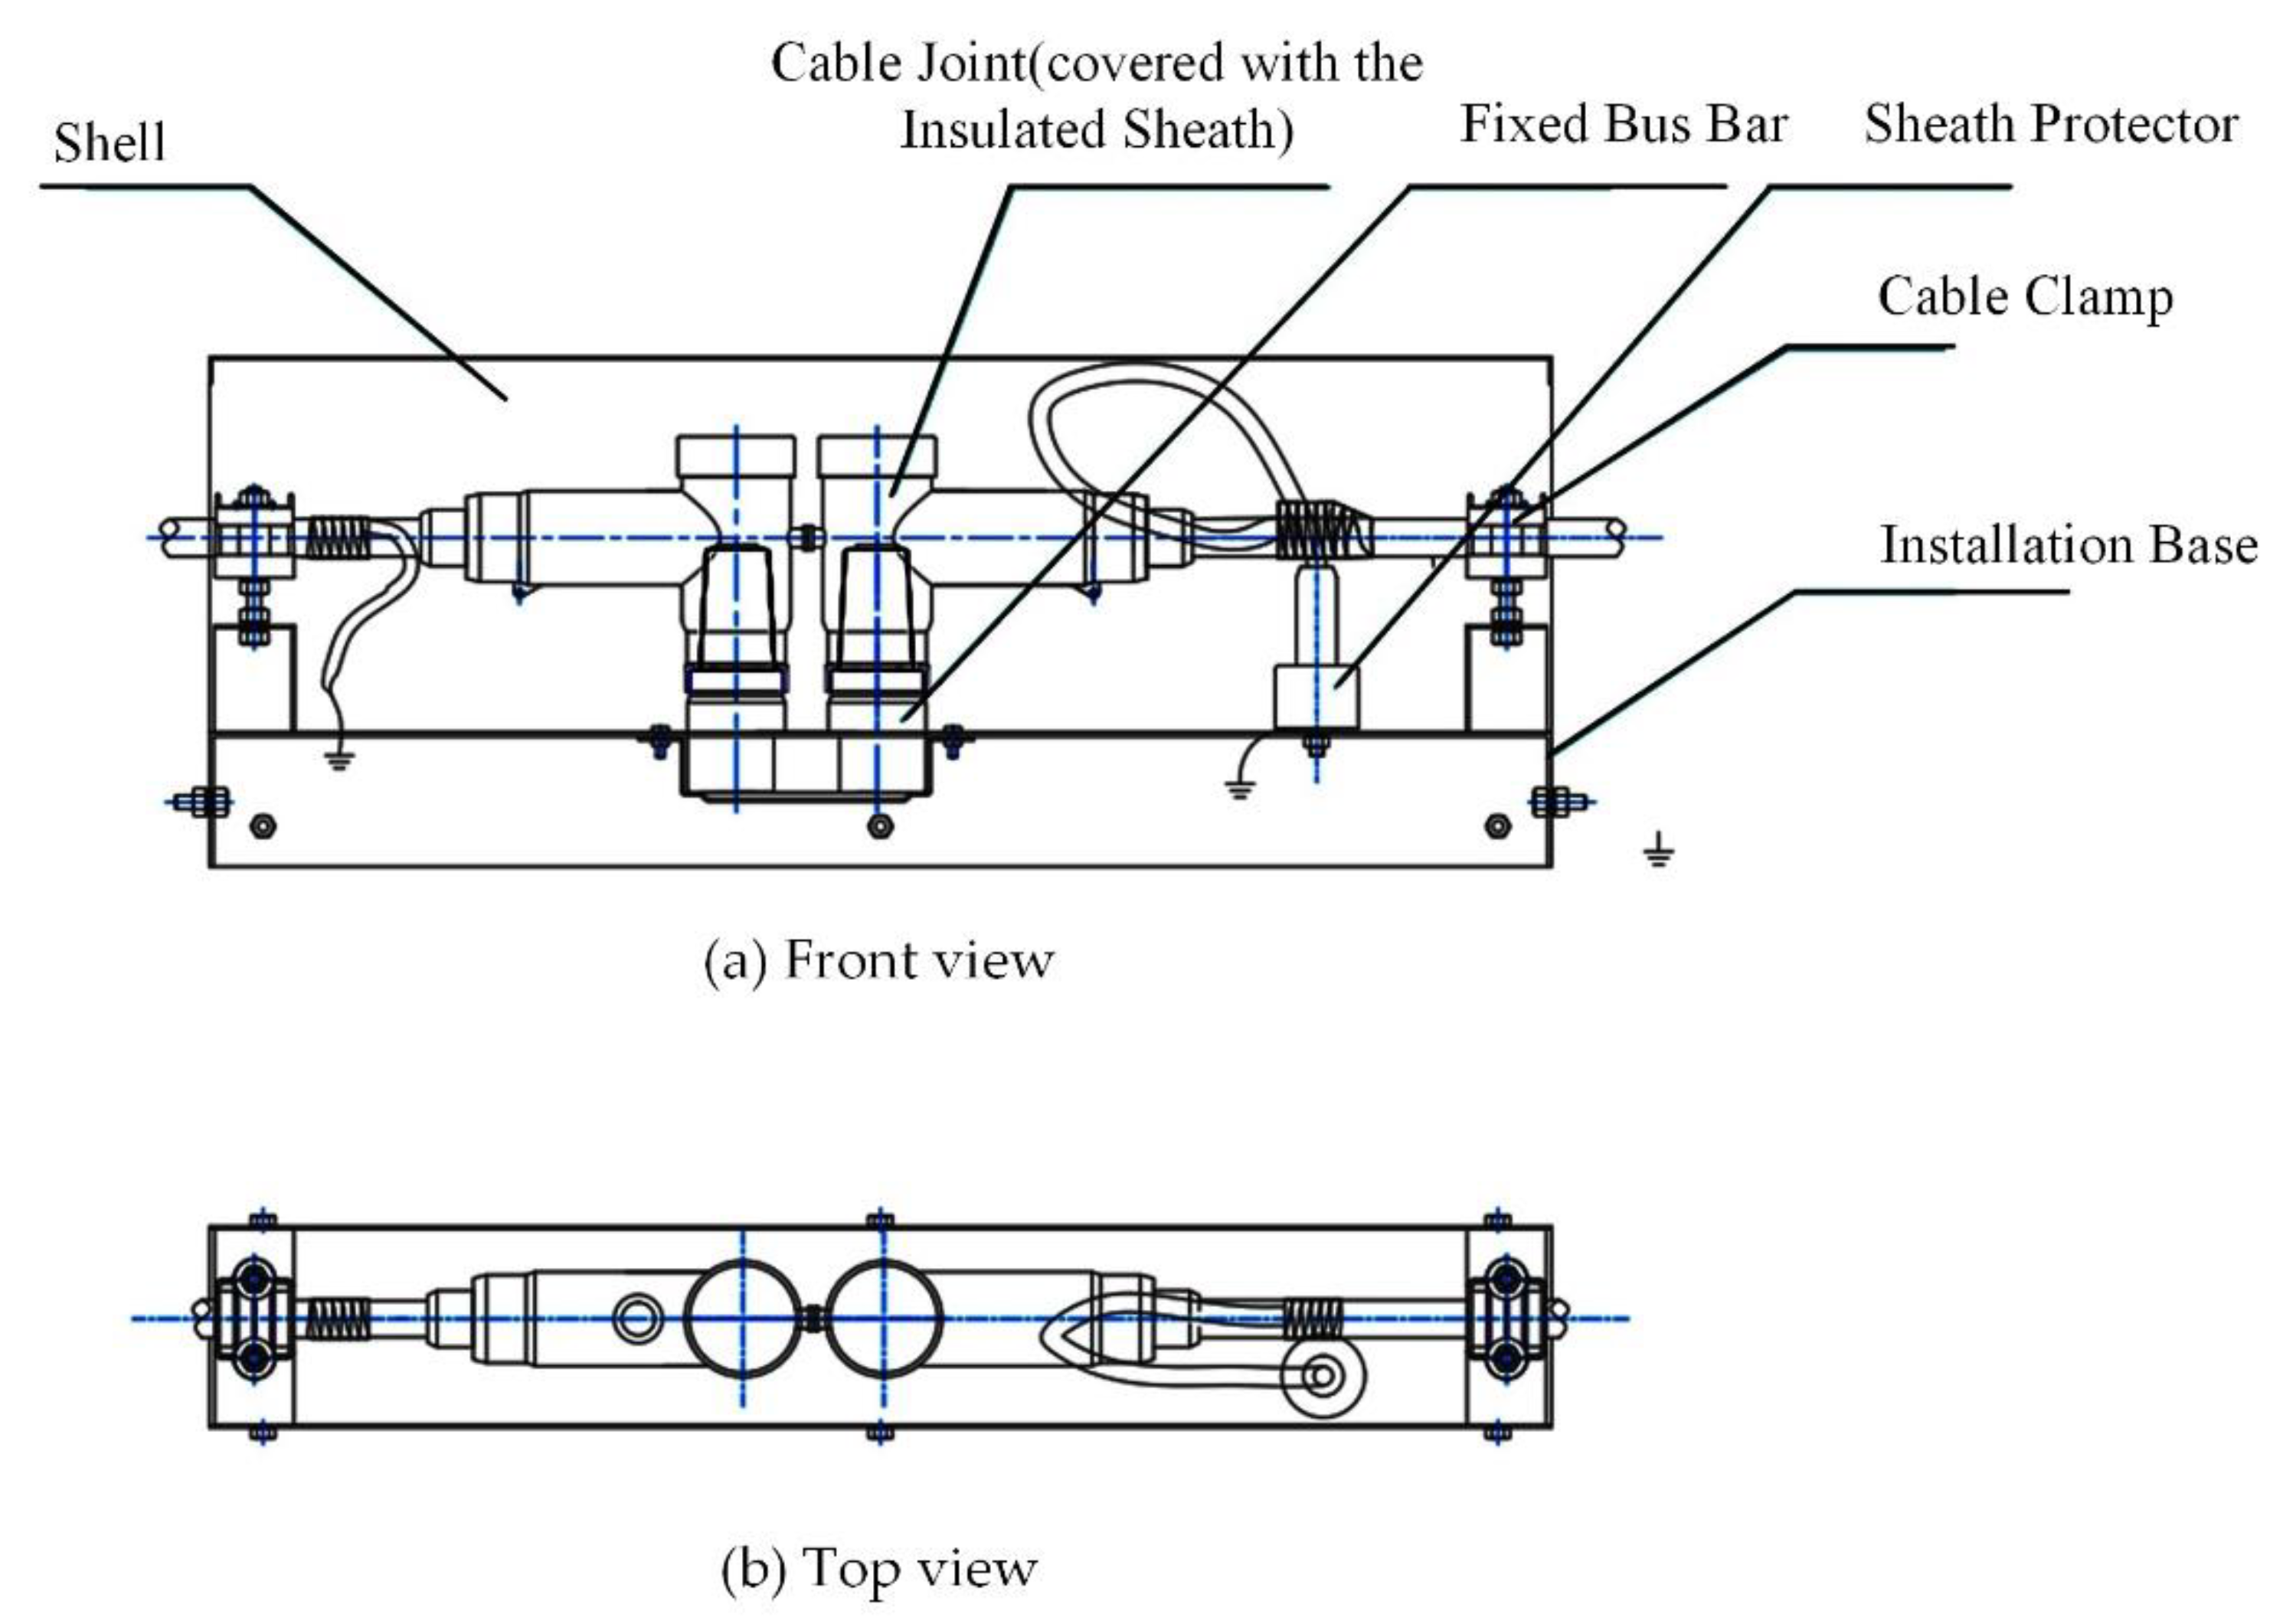
4.2. Heat Transfer Test of Cable Joint

In the RPTL, the prefabricated integrated cable joint box (PICJB) is a commonly used connection equipment for power cables, whose configuration is shown in Figure 10. The structure shown in the figure can realize the connection, fixation, and single-end shield grounding of two sections of cable and avoid the concentration of electromagnetic stress. Loose crimping at the cable joint will lead to local heating, and there is a thick outer protective sheath at the cable joint, which makes the temperature difference between the inner cable and the outer area of the sheath larger and affects the judgment of the fault situation. In order to verify the monitor performance of the temperature sensors on the surface of the outer sheath, it is proposed to apply heat source inside the protective sheath to simulate the temperature rise at the joint, and thermocouples were arranged at the heat source and outside the sheath respectively. The photos of the experimental object are shown in Figure 11. The red numbers represent the insulation parts 1 (the thinnest), 2, 3 and 4 (the thickest).
The sheath is heated by a water bath or resistance wire to simulate the heating conditions of constant energy and constant power respectively. During the experiment, the temperature measurement of the thermocouple arranged on the sheath of the joint is shown in Figure 12a,b.
When hot water is used to heat the middle sheath, an insulating cover was put on the top of the sheath to isolate convection between hot water and outside air. It can be seen from Figure 12a that the temperature inside the sheath increases sharply immediately when hot water is added, and then the temperature decreases with the cooling of the water temperature, and the temperature of other points increases obviously. Finally, the temperature of each point tends to be stable, and the temperature rise of part 1 is the largest, about 20 °C. The temperature rise is negatively correlated with the insulation thickness.
The heating power of the sheath heated by resistance wire is about 32 W. It can be seen from Figure 12b that although the temperature of the outer sheath rises slowly during heating on the whole, with the increase of heating time, the temperature of part 1, 2 and 3 increase significantly, while the temperature of part 4 does not appear to change.

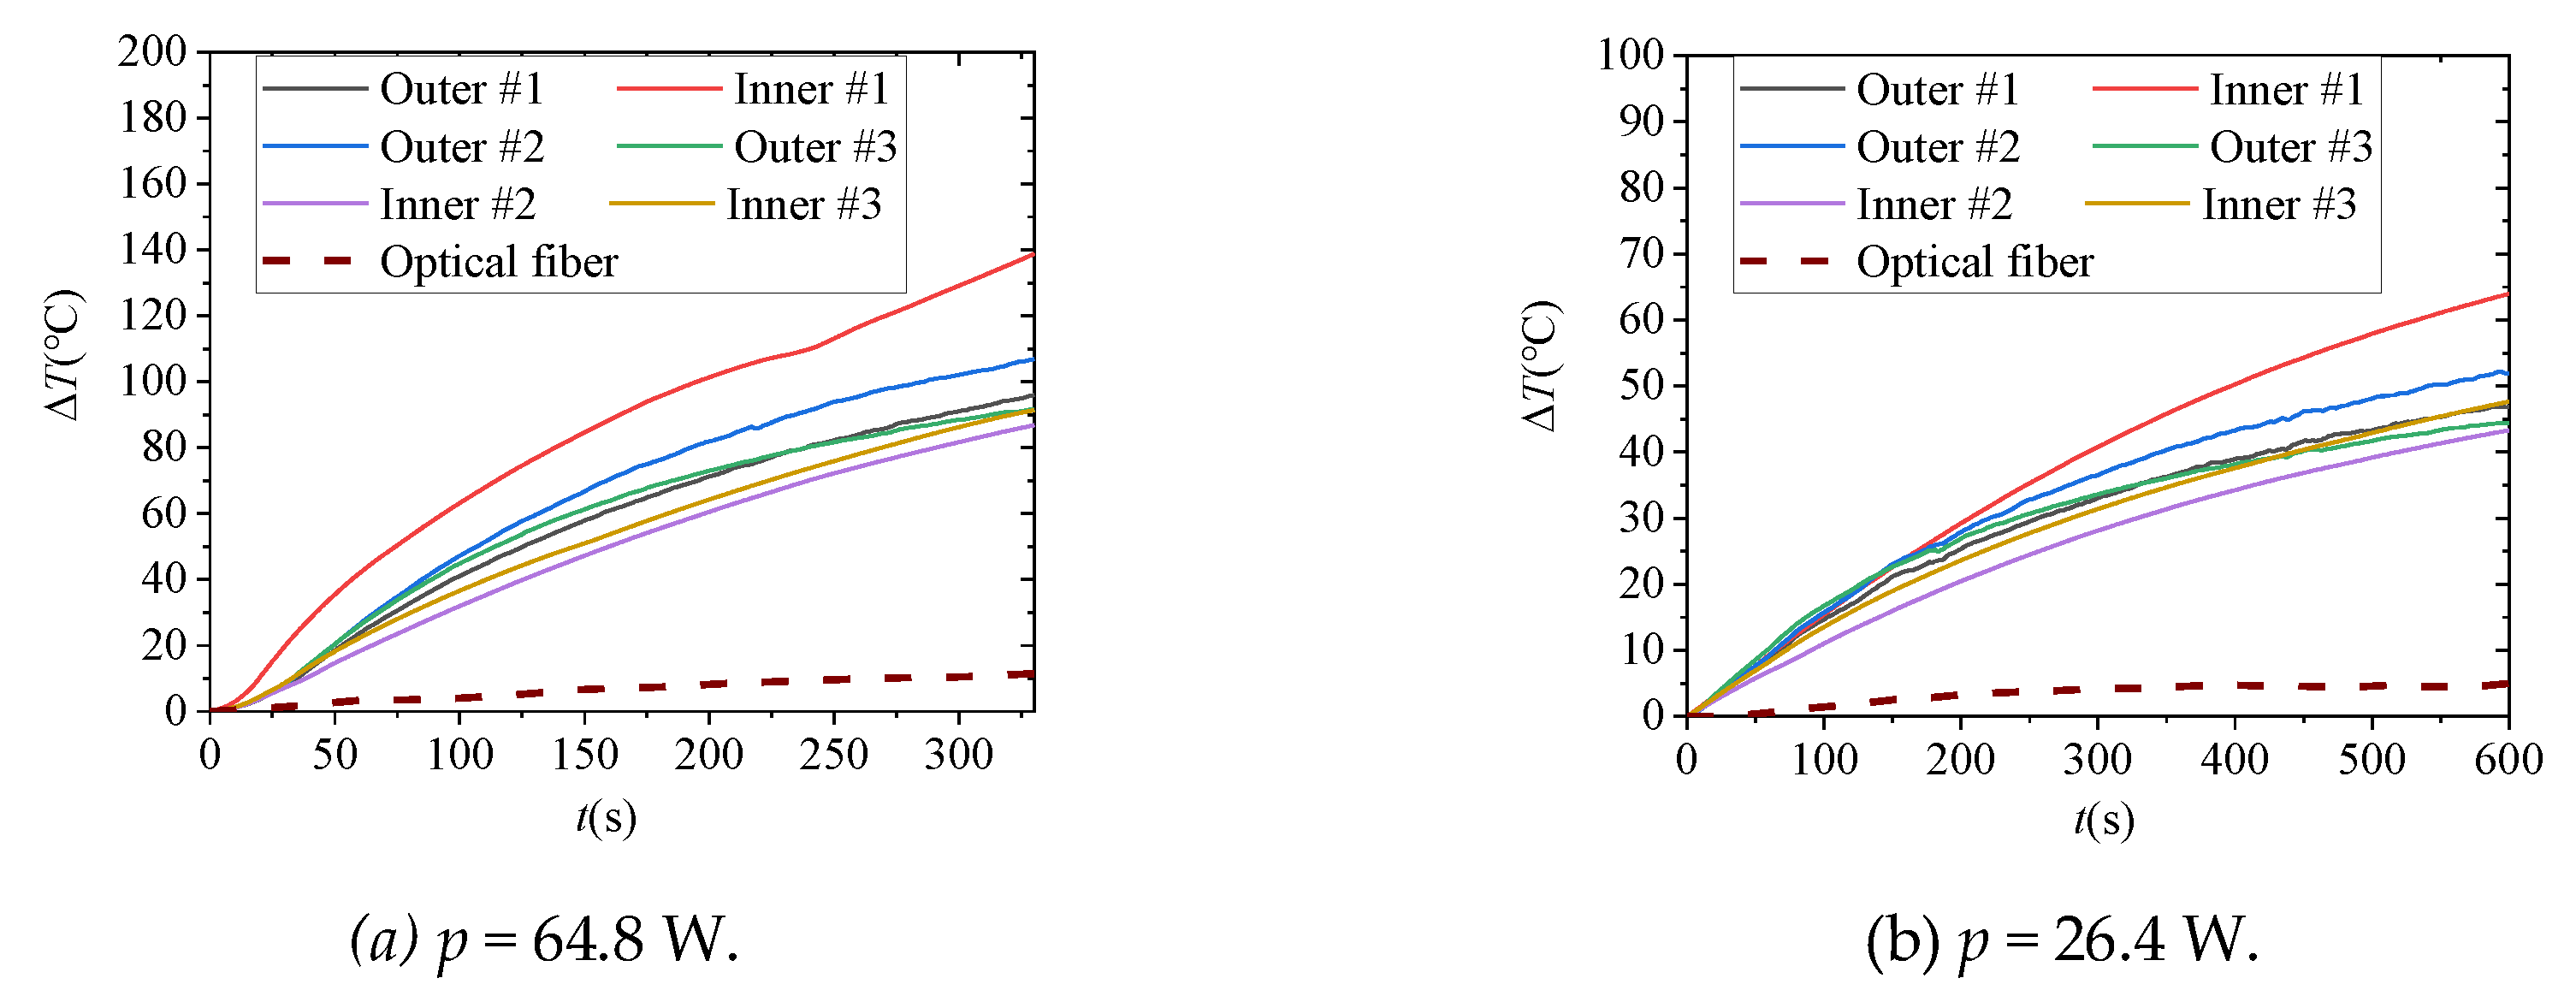
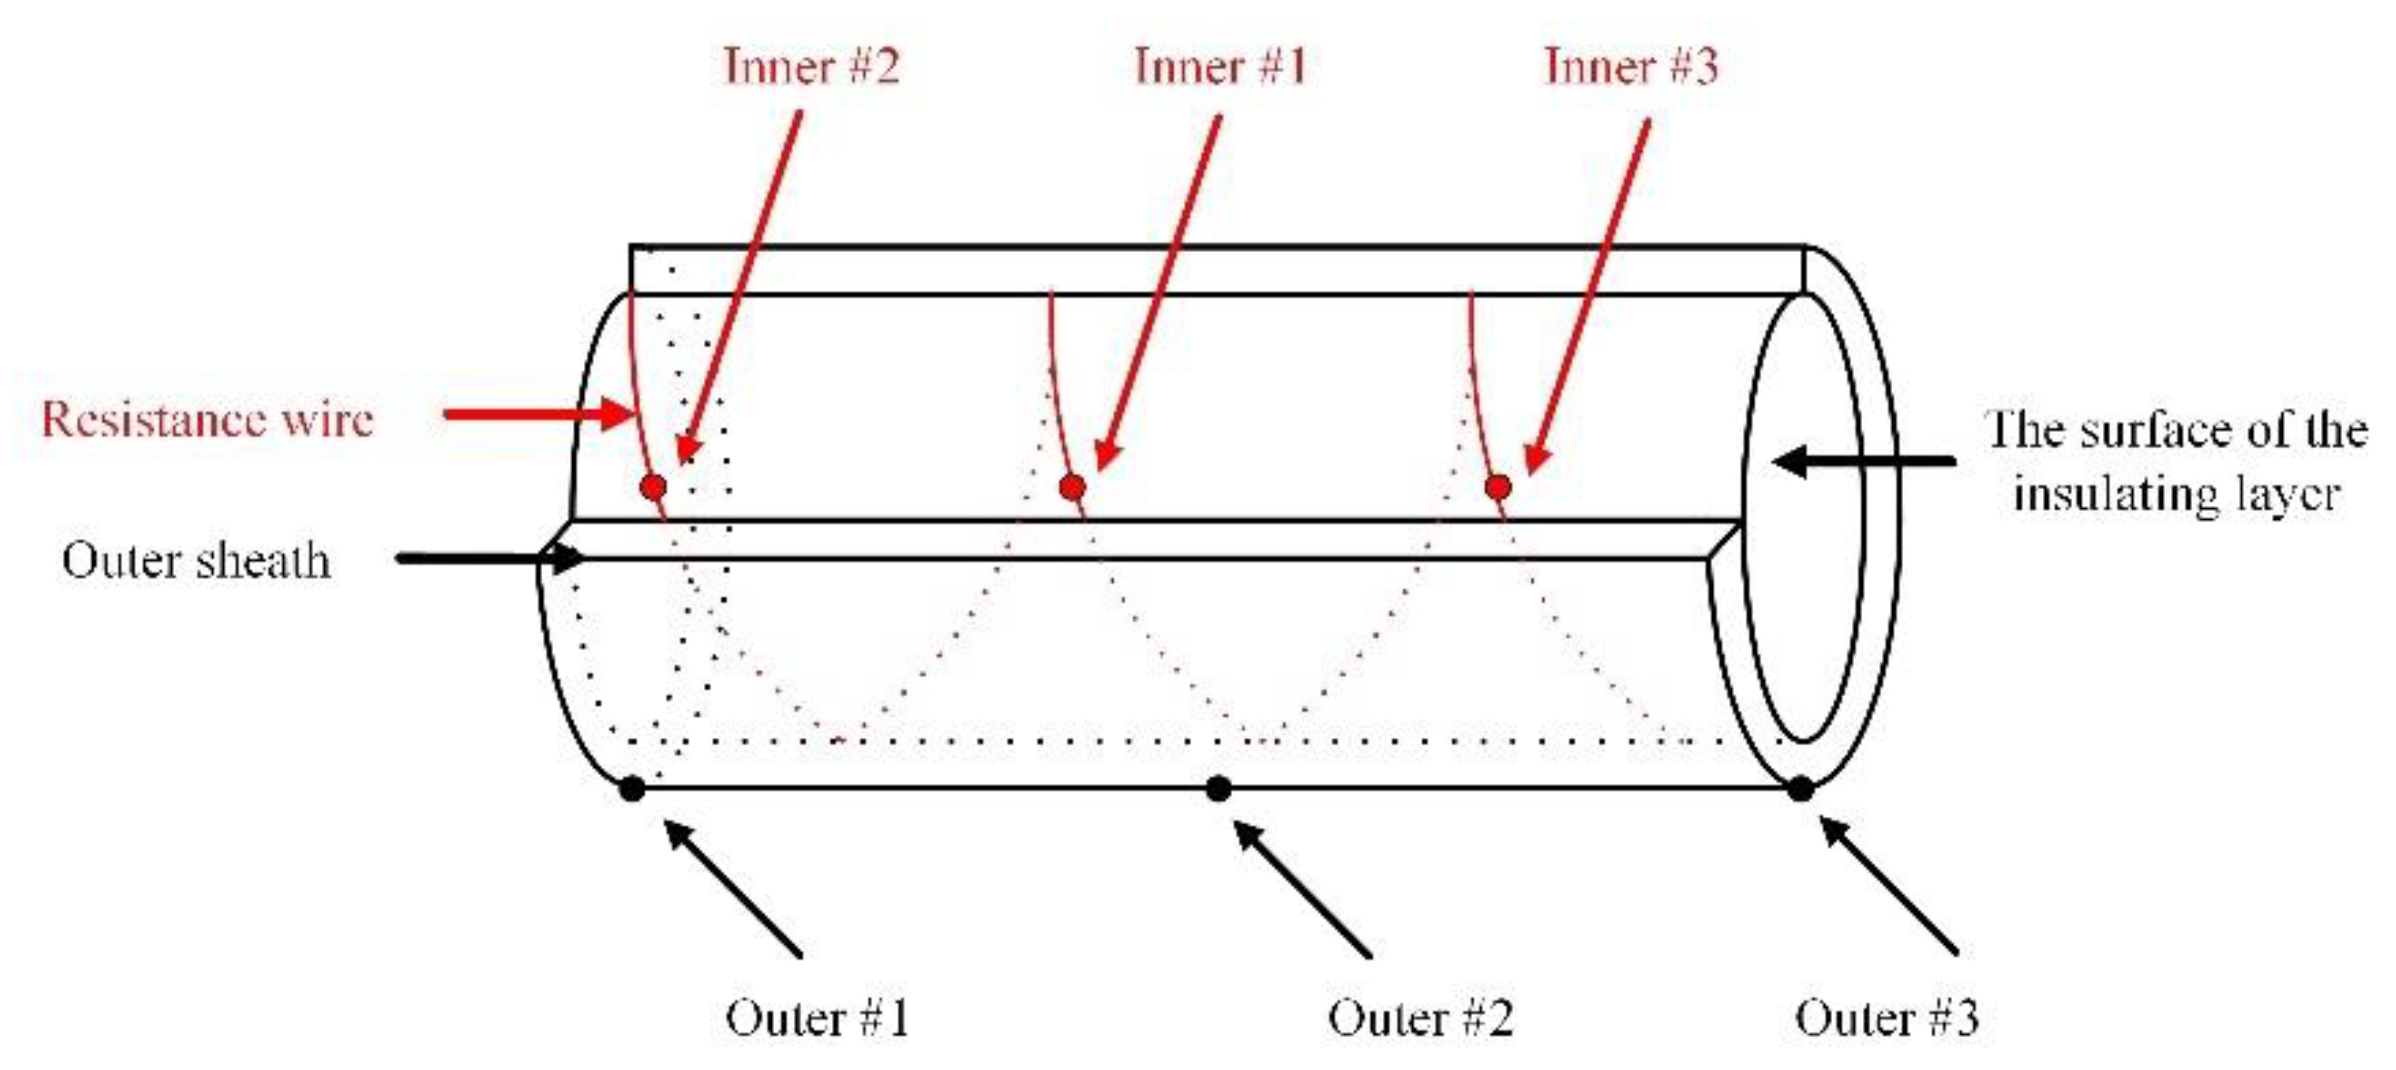
4.3. Experiment on Measurement Effect of the Optical Fiber Deployed Outside the Cable

Compared with implantation, it is less difficult to lay the optical fiber directly on the outer surface of the cable, but the sensitivity to cable heating is still unknown. In this experiment, DTS is used to measure the local temperature rise of the cable, while the thermocouples are used as a reference, the sensitivity of the temperature measurement system can be obtained by changing the voltage of the resistance wire inside the cable to adjust its heating power and comparing the temperature measurement values of the DTS and thermocouple. The photos of the experimental device are shown in Figure 13, in which the effective length of the heating part is 0.2 m. The optical fiber is in direct contact with the cable in parallel, and the contact part is fixed with polyimide material. The spatial resolution of the DTS is 0.4 m. The heating resistance wire is bent and wound inside the cable insulation sheath to simulate the heating process of constant power inside the cable.
Six thermocouples are deployed both inside and outside the outer sheath of the cable at intervals of 0.1 m as counterparts of the DTS, shown in Figure 14. For the three thermocouples (red dots) placed inside the outer sheath, they are near the center core wire. The middle (Inner #1) of the three thermocouples is designated as the heat source whereas the other three thermocouples (black dots) are placed outside the outer sheath.
The heating power of the resistance wire in Figure 15a,b is 64.8 W and 26.4 W, respectively. It can be seen that compared with the inner and outer thermocouple temperature measurement results, there are great differences in the amplitude and the rate of temperature rise, which is attributed to the poor thermal conductivity of insulating materials. The temperature measurement of the DTS reflects the attenuation and delay of temperature rise in the internal fault of the cable due to both the low contact coefficient and the limit size of the heating area compared with the spatial resolution of the DTS. In this experiment, the heating size (0.2 m) is half of the spatial resolution of the DTS (0.41 m), maximum temperature rise along the fiber is about 11 °C for p = 64.8 W and about 7 °C for p = 26.4 W. It can be estimated that if the volume of heat source is not far greater than the spatial resolution of the DTS, it will make the fault identification difficult.

5. Conclusions and the Further Research Plan

This paper studies the distribution of temperature rise caused by the heating of RPTL under various faults. The simulation model of temperature field under various faults of RPTL cable was built, and the heating experiment of the short sample cable was designed to simulate the actual situation, and test the practical application effect of temperature monitoring based on DTS. More specific conclusions are listed below:
  • For the long-term heating cases caused by poor crimping, traction return flowing through the shield by mistake, etc., the heating power is too small, but the process is accumulative. After processes like the comparison among the temperature of three phases and the multilevel partition judgment, the errors can be considerably eliminated. The sensing fiber is expected to be able to detect the long-term heating fault of the cable with a considerable sensible area.
  • For the transient heating cases caused by the breakdown of cable insulation, although the heating power is large, the transient thermal effect caused by the short-circuit current is not enough to be perceived by the sensing fiber due to the current short-circuit current level of 10 kV RPTL and the protection time of circuit breaker action, and it is strongly related to the location of optical fiber. To enhance the comprehensiveness of the SCADA system, as a recommendation, the fault location method oriented for cables should be supplemented, for example, by the impedance method, traveling wave method etc.
  • According to the current application of DTS, whether the sensing fiber can sense the heating fault of the cable or not is related to the size, the power level and the duration of the heating process. Due to the limited spatial resolution of the DTS and the deploying effectiveness, there may be some false negatives caused by insufficient heating power. The effects of other factors such as spatial resolution, ambient temperature and surface contact coefficient on the overall system sensitivity need to be further studied.

Author Contributions

Conceptualization, Y.Y., K.C. and Y.T.; formal analysis, Y.Y., K.C. and Y.T.; methodology, Y.Y., K.C. and Y.T.; project administration, K.C.; funding acquisition, K.C.; investigation, Y.Y., K.C.; supervision, K.C. and Y.T.; validation, Y.Y., K.C.; visualization, Y.Y., K.C.; writing—original draft, Y.Y., K.C.; writing—review and editing, Y.T. All authors have read and agreed to the published version of the manuscript.

Funding

The research received no external funding.

Institutional Review Board Statement

Not applicable.

Informed Consent Statement

Not applicable.

Data Availability Statement

The data presented in this study are available on request from the corresponding author. The data are not publicly available due to the confidentiality requirements of the project.

Conflicts of Interest

The authors declare no conflict of interest.

References

  1. Sundararajan, R.; Nowlin, R.W. Effect of altitude on the flashover voltage of contaminated insulators. In Proceedings of the Conference on Electrical Insulation and Dielectric Phenomena—CEIDP ‘96, Millbrae, CA, USA, 23 October 1996; pp. 433–436. [Google Scholar]
  2. Zhao, X.; Zhang, S.; Lin, C.S.; Yang, Z.; Li, Z.; Han, T. Characterization of Electrical Treeing in XLPE versus Temperature Gradients. In Proceedings of the 2020 IEEE 3rd International Conference on Dielectrics (ICD), Valencia, Spain, 5–31 July 2020; pp. 25–28. [Google Scholar]
  3. Ismail, M.M.; Hassan, M.M. Distance relay protection for short and long transmission line. In Proceedings of the International Conference on Modelling, Identification and Control (ICMIC 2013), Cairo, Egypt, 31 August–2 September 2013; pp. 204–211. [Google Scholar]
  4. Eboule, P.S.P.; Hasan, A.N.; Twala, B. The Use of Multilayer Perceptron to Classify and Locate Power Transmission Line Faults. In Artificial Intelligence and Evolutionary Computations in Engineering Systems; Dash, S.S., Naidu, P.C.B., Bayindir, R., Das, S., Eds.; Springer: Berlin/Heidelberg, Germany, 2018; pp. 51–58. [Google Scholar]
  5. Cheng, Y.; Zhao, L.; Wu, X.; Ni, H.; Ding, P.; Li, X.; Zhou, X. Statistical Analysis of Partial Discharge Faults of HV Cables. In Proceedings of the 2020 IEEE Electrical Insulation Conference (EIC), Knoxville, TN, USA, 22 June–3 July 2020; pp. 422–425. [Google Scholar]
  6. Wang, K.; Li, Z.; Zhang, B. A novel method of power cable fault monitoring. In Proceedings of the 2016 IEEE PES Asia-Pacific Power and Energy Engineering Conference (APPEEC), Xi’an, China, 25–28 October 2016; pp. 738–742. [Google Scholar]
  7. Bragatto, T.; Cerretti, A.; D’Orazio, L. Thermal Effects of Ground Faults on MV Joints and Cables. Energies 2019, 12, 3496. [Google Scholar] [CrossRef] [Green Version]
  8. Enescu, D.; Colella, P.; Russo, A. Thermal Assessment of Power Cables and Impacts on Cable Current Rating: An Overview. Energies 2020, 13, 5319. [Google Scholar] [CrossRef]
  9. Ocłoń, P.; Pobędza, J.; Walczak, P.; Cisek, P.; Vallati, A. Experimental Validation of a Heat Transfer Model in Underground Power Cable Systems. Energies 2020, 13, 1747. [Google Scholar] [CrossRef] [Green Version]
  10. Liu, G.; Lei, M.; Ruan, B.; Zhou, F.; Li, Y.; Liu, Y. Model Research of Real-time Calculation for Single-core Cable Temperature Considering Axial Heat Transfer. High Volt. Eng. 2012, 38, 1877–1883. [Google Scholar]
  11. Thiyagarajan, K.; Kodagoda, S.; Ranasinghe, R.; Vitanage, D.; Iori, G. Robust Sensing Suite for Measuring Temporal Dynamics of Surface Temperature in Sewers. Sci. Rep. 2018, 8, 16020. [Google Scholar] [CrossRef] [PubMed] [Green Version]
  12. Selim, F.; Bedir, I.; Desuoki, H.E. Power cable inspections using Matlab graphical user interface aided by thermal imaging. In Proceedings of the Malaysian Conference in Software Engineering, Johor Bahru, Malaysia, 13–14 December 2011; pp. 263–268. [Google Scholar]
  13. Wu, J.Z.; Lin, J.J.; Gao, Z.J.; Lin, H.H.; Li, Q.Q.; Zhang, C.C. A Hybrid Fourier-wavelet Denoising Method for Infrared Image of Porcelain Sleeve Cable Terminal Using GSM Model for Wavelet Coefficients. In Proceedings of the International Conference on Power System Technology (POWERCON), Guangzhou, China, 6–8 November 2018; pp. 1919–1923. [Google Scholar]
  14. Wang, Z.; Cao, M.; Wang, D.; Zhang, S.Q.; Li, C.; Li, Y.N.; Li, X.L. On-Line Monitoring of Cable Trench and Cable Pit by Using Metal Armored FBG Temperature Sensors. Int. J. Smart Grid Clean Energy 2013, 2, 119–124. [Google Scholar] [CrossRef] [Green Version]
  15. Loranger, S.; Gagné, M.; Lambin-Iezzi, V.; Kashyap, R. Rayleigh scatter based order of magnitude increase in distributed temperature and strain sensing by simple UV exposure of optical fibre. Sci. Rep. 2015, 5, 11177. [Google Scholar] [CrossRef] [PubMed]
  16. Parker, T.R.; Farhadiroushan, M.; Handerek, V.A.; Roger, A.J. A fully distributed simultaneous strain and temperature sensor using spontaneous Brillouin backscatter. IEEE Photonics Technol. Lett. 1997, 9, 979–981. [Google Scholar] [CrossRef]
  17. Chen, Y.; Wang, S.; Hao, Y.; Yao, K.; Li, H.; Jia, F.; Shi, Q.; Yue, D.; Cheng, Y. The 500 kV Oil-filled Submarine Cable Temperature Monitoring System Based on BOTDA Distributed Optical Fiber Sensing Technology. In Proceedings of the International Conference on Sensing, Measurement & Data Analytics in the Era of Artificial Intelligence (ICSMD), Xi’an, China, 15–17 October 2020; pp. 180–183. [Google Scholar]
  18. Amira, Z.; Bouyahi, M.; Ezzedine, T. Measurement of Temperature through Raman Scattering. Procedia Comput. Sci. 2015, 73, 350–357. [Google Scholar] [CrossRef] [Green Version]
  19. Rui, Y.; Hird, R.; Yin, M.; Soga, K. Detecting changes in sediment overburden using distributed temperature sensing: An experimental and numerical study. Mar. Geophys. Res. 2018, 40, 261–277. [Google Scholar] [CrossRef] [Green Version]
  20. Lee, C.H.; Kwon, J.J.; Byoun, J.H.; Wee, D.Y.; Nam, S.H.; Lee, J.H.; Sohn, K.I.; Cho, J.T.; Kim, J.Y. Medium voltage optical fiber composite power cable system for Smart Grid. In Proceedings of the 22nd International Conference and Exhibition on Electricity Distribution (CIRED 2013), Stockholm, Sweden, 10–13 June 2013; pp. 1–4. [Google Scholar]
  21. Luo, J.; Hao, Y.; Ye, Q.; Hao, Y.; Li, L. Development of Optical Fiber Sensors Based on Brillouin Scattering and FBG for On-Line Monitoring in Overhead Transmission Lines. J. Lightwave Technol. 2013, 31, 1559–1565. [Google Scholar] [CrossRef]
  22. Barrias, A.; Casas, J.R.; Villalba, S. A Review of Distributed Optical Fiber Sensors for Civil Engineering Applications. Sensors 2016, 16, 748. [Google Scholar] [CrossRef] [PubMed] [Green Version]
  23. Xie, K.; Zhao, Y.; Zhang, H.; Zhao, Z.; Lu, Z.; Chai, Q.; Zhang, J. Practice of optical fiber sensing technologies in power transmission lines and towers. In Proceedings of the 2018 International Conference on Power System Technology (POWERCON), Guangzhou, China, 6–8 November 2018; pp. 3912–3918. [Google Scholar]
  24. Shi, Y.; Feng, H.; An, Y.; Feng, X.; Zeng, Z. Research on wavelet analysis for pipeline pre-warning system based on phase-sensitive optical time domain reflectometry. In Proceedings of the 2014 IEEE/ASME International Conference on Advanced Intelligent Mechatronics, Besacon, France, 8–11 July 2014; pp. 1177–1182. [Google Scholar]
  25. Li, Q.; Zhang, C.; Li, C. Fiber-Optic Distributed Sensor Based on Phase-Sensitive OTDR and Wavelet Packet Transform for Multiple Disturbances Location. Optic 2014, 125, 7235–7238. [Google Scholar] [CrossRef]
Figure 1. Schematic diagram of temperature along the cable. (Every block represents a single spatial interval of sampling and the relative value of temperature measurement is expressed in different colors; (a) is the comparison of three phases at the same time and location, and (b) is the comparison of single phase at different time and locations).
Energies 14 03705 g001
Figure 2. The multilevel partition (for every single-phase cable).
Energies 14 03705 g002
Figure 3. The model of the cable. (a) is a cross section of a specific type of cable. (b) is an established partial model with a total length of 1 m, the thermal effect of the arc discharge is simplified as a line-shaped heat source located at the insulation layer, which is marked as a red zone, and the thermal insulation condition is adopted at both ends of the model. (c) is an established partial model with a total length of 1 m, the thermal effect of the poor crimping is simplified as a cylinder heat source located at the conducting part, and the thermal insulation condition is adopted at both ends of the model.
Energies 14 03705 g003
Figure 4. The temperature rise of the cable under arc charge.
Energies 14 03705 g004
Figure 5. The temperature rise of the cable under poor crimping.
Energies 14 03705 g005
Figure 6. Schematic diagram of power supply return for high speed railway.
Energies 14 03705 g006
Figure 7. Temperature rise ΔT under different traction currents.
Energies 14 03705 g007
Figure 8. Circuit diagram of cable shielding current experiment.
Energies 14 03705 g008
Figure 9. Change of temperature measurement with time.
Energies 14 03705 g009
Figure 10. Internal structure of the PICJB.
Energies 14 03705 g010
Figure 11. Arrangement of heat source and temperature probes.
Energies 14 03705 g011
Figure 12. The temperature changes while heating the insulated sheath in PICJB.
Energies 14 03705 g012
Figure 13. Display of main experimental devices.
Energies 14 03705 g013
Figure 14. The diagram of thermocouple layout. (The solid dots represent the six thermocouples).
Energies 14 03705 g014
Figure 15. The results of temperature measurement. (Here, the temperature measurement values of thermocouples and the DTS under different heating power are present).
Energies 14 03705 g015
Table 1. Parameters of each layer of the cable.
LayerDensity (kg/m3)Thermal Resistance Factor (K·m/W)Specific Heat Capacity (J/kg·K)External Diameter (mm)
Conductor89001/4003908.35
Insulation layer9203.5220018.6
Metal sheild89001/40039020.2
Wrapping tape14006140020.85
Inner sheath9402.5230122.95
Armor layer22001/1750023.75
Outer sheath15501.58255326.75
Publisher’s Note: MDPI stays neutral with regard to jurisdictional claims in published maps and institutional affiliations.

