Article

Rooftop PV: Potential and Impacts in a Complex Territory

by
Diana Bernasconi
1 and
Giorgio Guariso
2,*
1
Prysmian Group, 20126 Milan, Italy
2
Dipartimento di Elettronica, Informazione e Bionngegneria (DEIB), Politecnico di Milano, 20133 Milan, Italy
*
Author to whom correspondence should be addressed.
Energies 2021, 14(12), 3687; https://doi.org/10.3390/en14123687
Submission received: 16 May 2021 / Revised: 16 June 2021 / Accepted: 18 June 2021 / Published: 21 June 2021

Abstract

:
When developing a sustainability plan in a complex and heavily urbanized territory, one of the most relevant options available is installing rooftop photovoltaic (PV) panels. Thus, it is essential to determine the amount of available surface and the potential impact of such installations on the energy and emission budget of the area. Instead of processing remotely sensed imagery, which is a long process and does not allow considering the buildings’ ownership, this study develops an approach based on a cluster analysis of the urban/morphological characteristics of the municipalities. Once a clear group diversification is obtained, the roof surface of the center of gravity of each cluster is extrapolated to all similar settlements. This, together with the information of local solar irradiation, allowed us to compute each cluster’s potential solar energy production and its capability to respond to the local energy demand, a key parameter to decide about the possibility of a local smart electricity network. Finally, the emissions avoided thanks to solar PV development are computed in terms of carbon dioxide and other relevant pollutants. This approach is applied to the residential rooftop of Lombardy, a Northern Italy region with a wide variety of urban morphologies and landscapes. The potential production of rooftop PV exceeds the estimated electricity consumption of residential buildings and would allow sparing almost 4 M ton of CO2 equivalent or 5% of the overall regional emissions.

Graphical Abstract

1. Introduction

According to the latest IPCC report [1], energy use is responsible for about two-thirds of global greenhouse gas emissions. The situation is even worse at the European level, accounting for 3348 million kg of CO2eq emissions from combustion for energy production, about 75% of the total emissions [2]. Therefore, when developing a strategic and sustainable plan on a large scale, one cannot avoid considering the implementation of energy efficiency measures and, above all, the transition to renewable energy sources. As outlined by the Exponential Roadmap 2019 [3], solutions to halve energy sector emissions by 2030 are available, and the transition has already begun.
As the world becomes more urban, with 54% of the population living in metropolitan areas [4] responsible for 60 to 70% of anthropogenic greenhouse gas emissions [5], cities themselves must become sustainable in their resources and demands. With limited available installation space, renewable energy generation within urban areas poses particular challenges [6].
One key solution to attain the established energy and environmental objectives is photovoltaics (PV), which has evolved rapidly and has ample room for growth [7]. The faster and broader expected growth of PV compared to other energy sources is primarily due to the accessibility of the resource, the solar radiation [8], and, second, to a unique advantage over other RES systems: solar systems can be installed decentralized on a small scale. Electricity consumers can self-generate at least some of the electricity they use, making this technology an attractive solution for private owners. In addition, while, initially, the cost balance between installing a PV system and the energy produced made this technology uncompetitive, these costs have reduced significantly over time. The price of energy from PV has fallen below grid parity in much of the world: this means that, on average, over the lifetime of the PV system, the electricity it generates is cheaper than the electricity from the grid [8,9].
Numerous studies have been conducted analyzing the factors and context that affect the performance of PV systems. Some are location-specific, such as solar irradiance, air temperature, and wind speed. Others depend on the type of technology used, such as the angle of reflection and module efficiency, and finally economic factors, such as the demand for electricity, its grid price, and the cost of materials [10,11,12]. As the sector developed, those papers have also been complemented by studies regarding the potential and capability of PV systems [13,14,15,16,17,18,19,20,21,22,23,24,25,26,27,28,29]. Most current studies on the performance of PV systems base the analysis on building’s models or remotely sensed imagery to obtain the rooftop area and digital spatial information. They elaborate statistical data sets of building-related information, such as floor area, number of floors, total number of buildings, with big geo-data of solar irradiation, through GIS software. Enongene et al. [13], for example, compute the PV potential of Lagos City in Nigeria starting from the analysis and modelling of typical buildings. Peng and Lu [14], following previous work by Gutschner et al. [15], estimated the PV-suitable rooftop area in Hong Kong from a buildings’ ground floor area by using factors of solar suitability and architectural suitability. Hong et al. [16] propose a method for estimating the rooftop solar PV potential by analyzing the available rooftop area through Hillshade analysis. Hofierka and Kanuk [17] and Bergamasco and Asinari [18] both assess the PV potential computing rooftop area through a 3D modeling of the urban area developed from orthophoto analysis. Brito et al. [19] and Jakubiec and Reinhart [20] both utilized LiDAR technology to develop a 3D model of a city to be combined with solar radiation data through GIS software. Kodysh et al. [21] perform a similar application over a larger area (Knox County, TN, USA) using LiDAR information and radiation maps to compute individual building radiation values. On a national scale, Miranda et al. [22] assess the technical-economic potential of installing PV in the Brazilian residential sector combining simulation tools of socio-economics characteristics and geographical information system. Rosas-Flores et al. [23] performed an energy savings analysis in urban and rural homes in Mexico by using an interconnected photovoltaic system network at a large scale, showing an achievable energy savings of 39,750 GWh, which would mean a 3% reduction of the annual Mexican CO2eq emissions. Finally, Bodis et al. [24] developed an assessment of the potential PV electricity production across the European Union, estimating 680 TWh of solar electricity annually.
All these studies originated from the awareness of the significant contribution this system can have on meeting the world’s energy needs and the complicated economic, political, and strategic challenges brought about by its implementation. The majority of these potential assessment studies focuses on urban scale or specific building types in order to maintain the high level of accuracy given by the previously mentioned methodology. On the other hand, it is necessary to address this topic and plan on a large-scale basis coping with increasing computation difficulties. Clearly, as the study area becomes larger, the detailed techniques of remote sensing imagery come with also with a heavy and time-consuming computational process and high demand of data: for example, the LiDAR analysis over Knox County, an area of 1362 km2, performed by Kodysh et al. [21] resulted in a corresponding DEM file size of 10 gigabytes. Another issue that prevents the implementation of rooftop PV assessments based on extrapolated values of a single building or neighborhood detailed analysis is the complexity that comes with a larger territory. This often means going beyond the classical definition of complex terrain used in meteorology or air pollution modelling, and addressing, besides geographical differences with various elevation and expositions, diverse urban morphology, sparse and concentrated settlements, and, most of all, different housing typology. All factors resulting in lower precision and accuracy the more complex the territory where the extrapolation is assumed.
The present study develops an alternative methodology to assess PV potential on a large and complex territory, proposing a less computationally intensive process based on cluster analysis of the building stock characteristics. This procedure allows us to overcome the computational burden of large-scale/high-accuracy methods. Indeed, it allows, once the clusters are identified, to focus the computation of the characteristics (roof area, energy demand, emissions,…) only on a few representative settlements and to extrapolate the outcomes to the whole territory only in the end. The choice to implement a mathematical classification based on easily accessible data of the urban morphology and characteristics of the studied area enables a good level of accuracy to be maintained even on a large territorial scale, going beyond the purely administrative division in municipalities or provinces.
It has been chosen to develop this approach on the residential sector of the Lombardy region in Italy, which is undergoing a significant change due to the current policies on energy efficiency in buildings (zero energy or zero power buildings [30,31]). It presents a highly diversified territory and urban morphology and characteristics of population and energy demand that can represent the whole country. After an illustration of the cluster approach, in the next section, we present a detailed analysis of the region’s demographic, geographic, and morphological characteristics. Then, we proceed by computing the available residential rooftop area through the application of the cluster analysis to the municipalities and the extrapolation of the center of gravity values. The power produced by the typical PV system was obtained using the online software PVGIS [32] and used in Section 3 to show the capability to satisfy the energy demand of the region and produce a consistent social-environmental benefit in terms of emissions saving. The outcomes are finally compared, in Section 4, with other studies and the advantages and limitations of the approach are discussed.

2. Materials and Methods

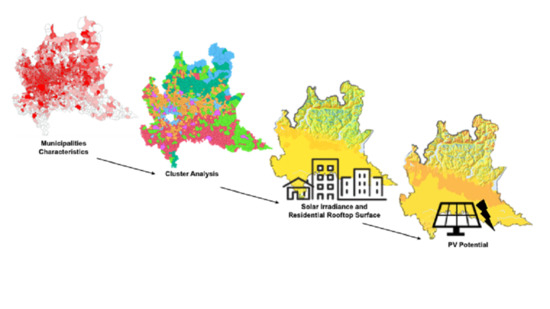
2.1. The Cluster Approach

As presented, the proposed method aims at finding a partition of territorial entities (municipalities, in the following case study) that are characterized by a strong diversification in terms of the resident population, altitude, and urbanized area. This variety is reflected in a set of structural data that represent the settlements’ morphology, such as those characterizing the residential building stock in terms of number of houses, age of construction, and number of residents.
Leveraging this type of data, the cluster analysis allows a non-trivial simplification of the subsequent steps to evaluate the potential PV energy. It allows extrapolating the common urban characteristics identified for each cluster’s centroid to the whole territory, disregarding the traditional classifications based on territorial proximity or administrative subdivisions. To reach this goal with a reasonable computational burden, the proposed procedure goes through the following steps:
  • A linear correlation between couples of attributes (each value representing a characteristic of the settlement) allows to exclude features that are strongly correlated and thus do not provide significant new information.
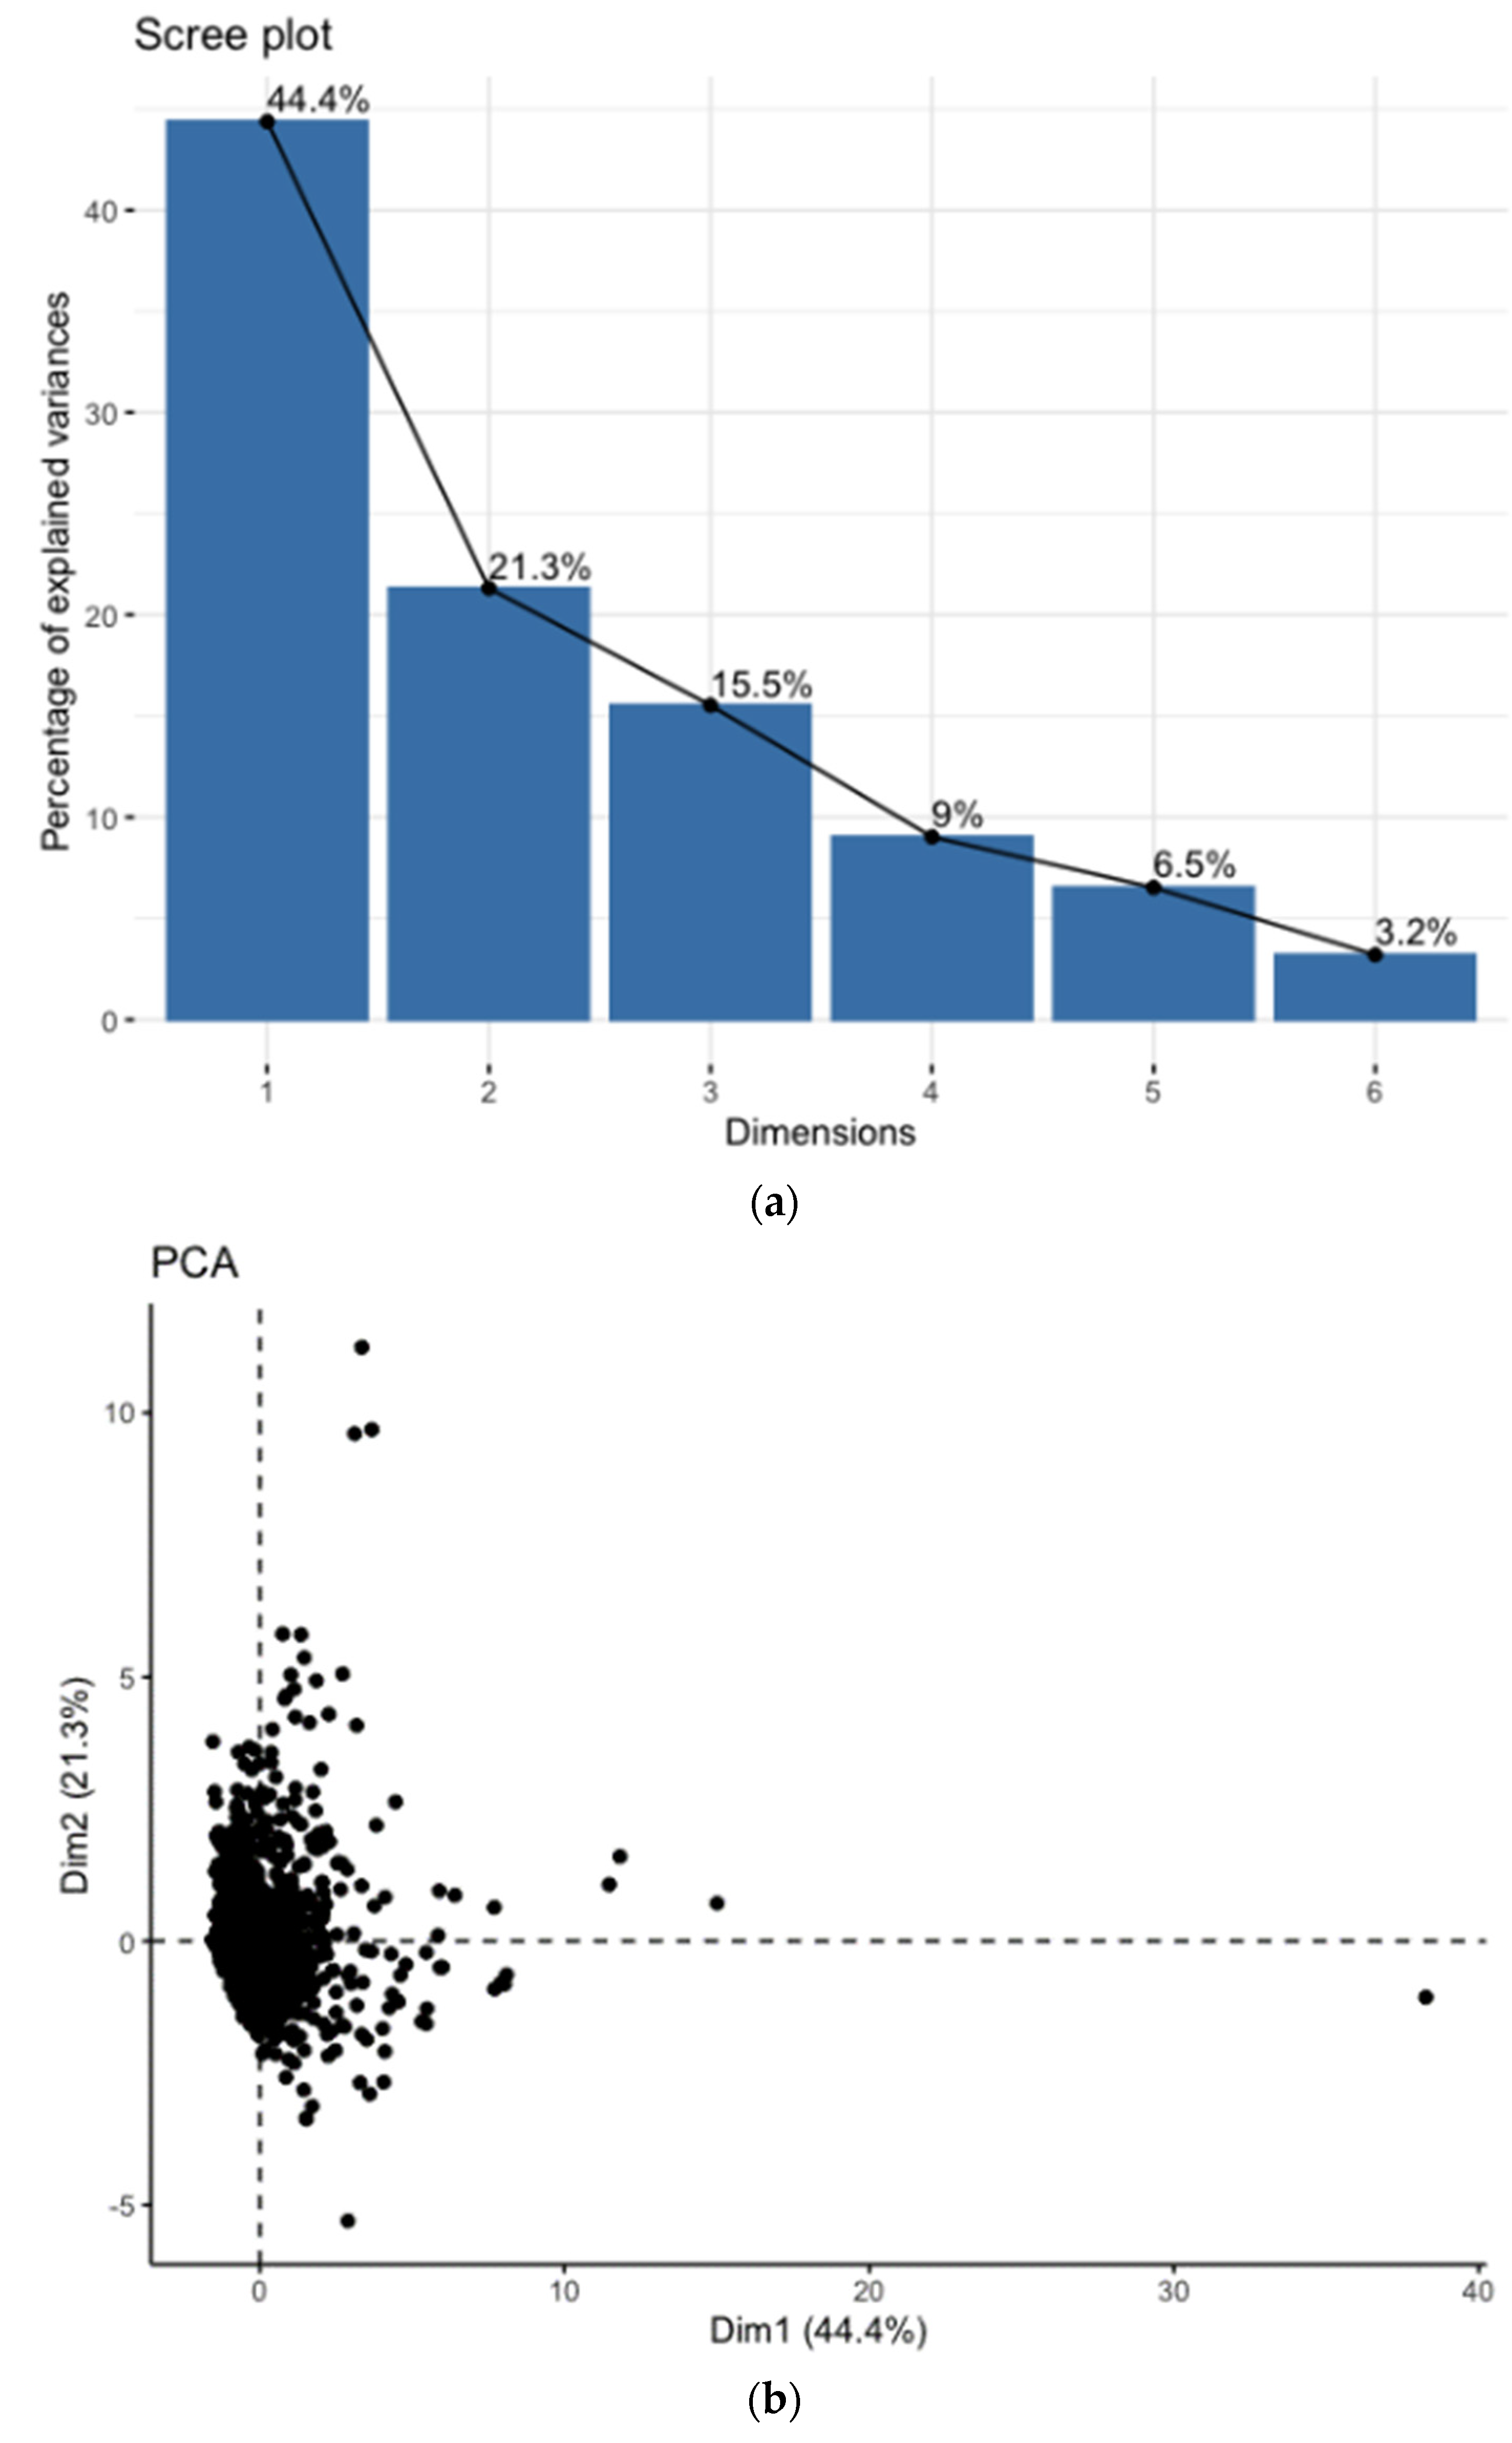
  • A principal component analysis (PCA) determines whether linear relationships between all attributes exist and points out peculiar individual situations.
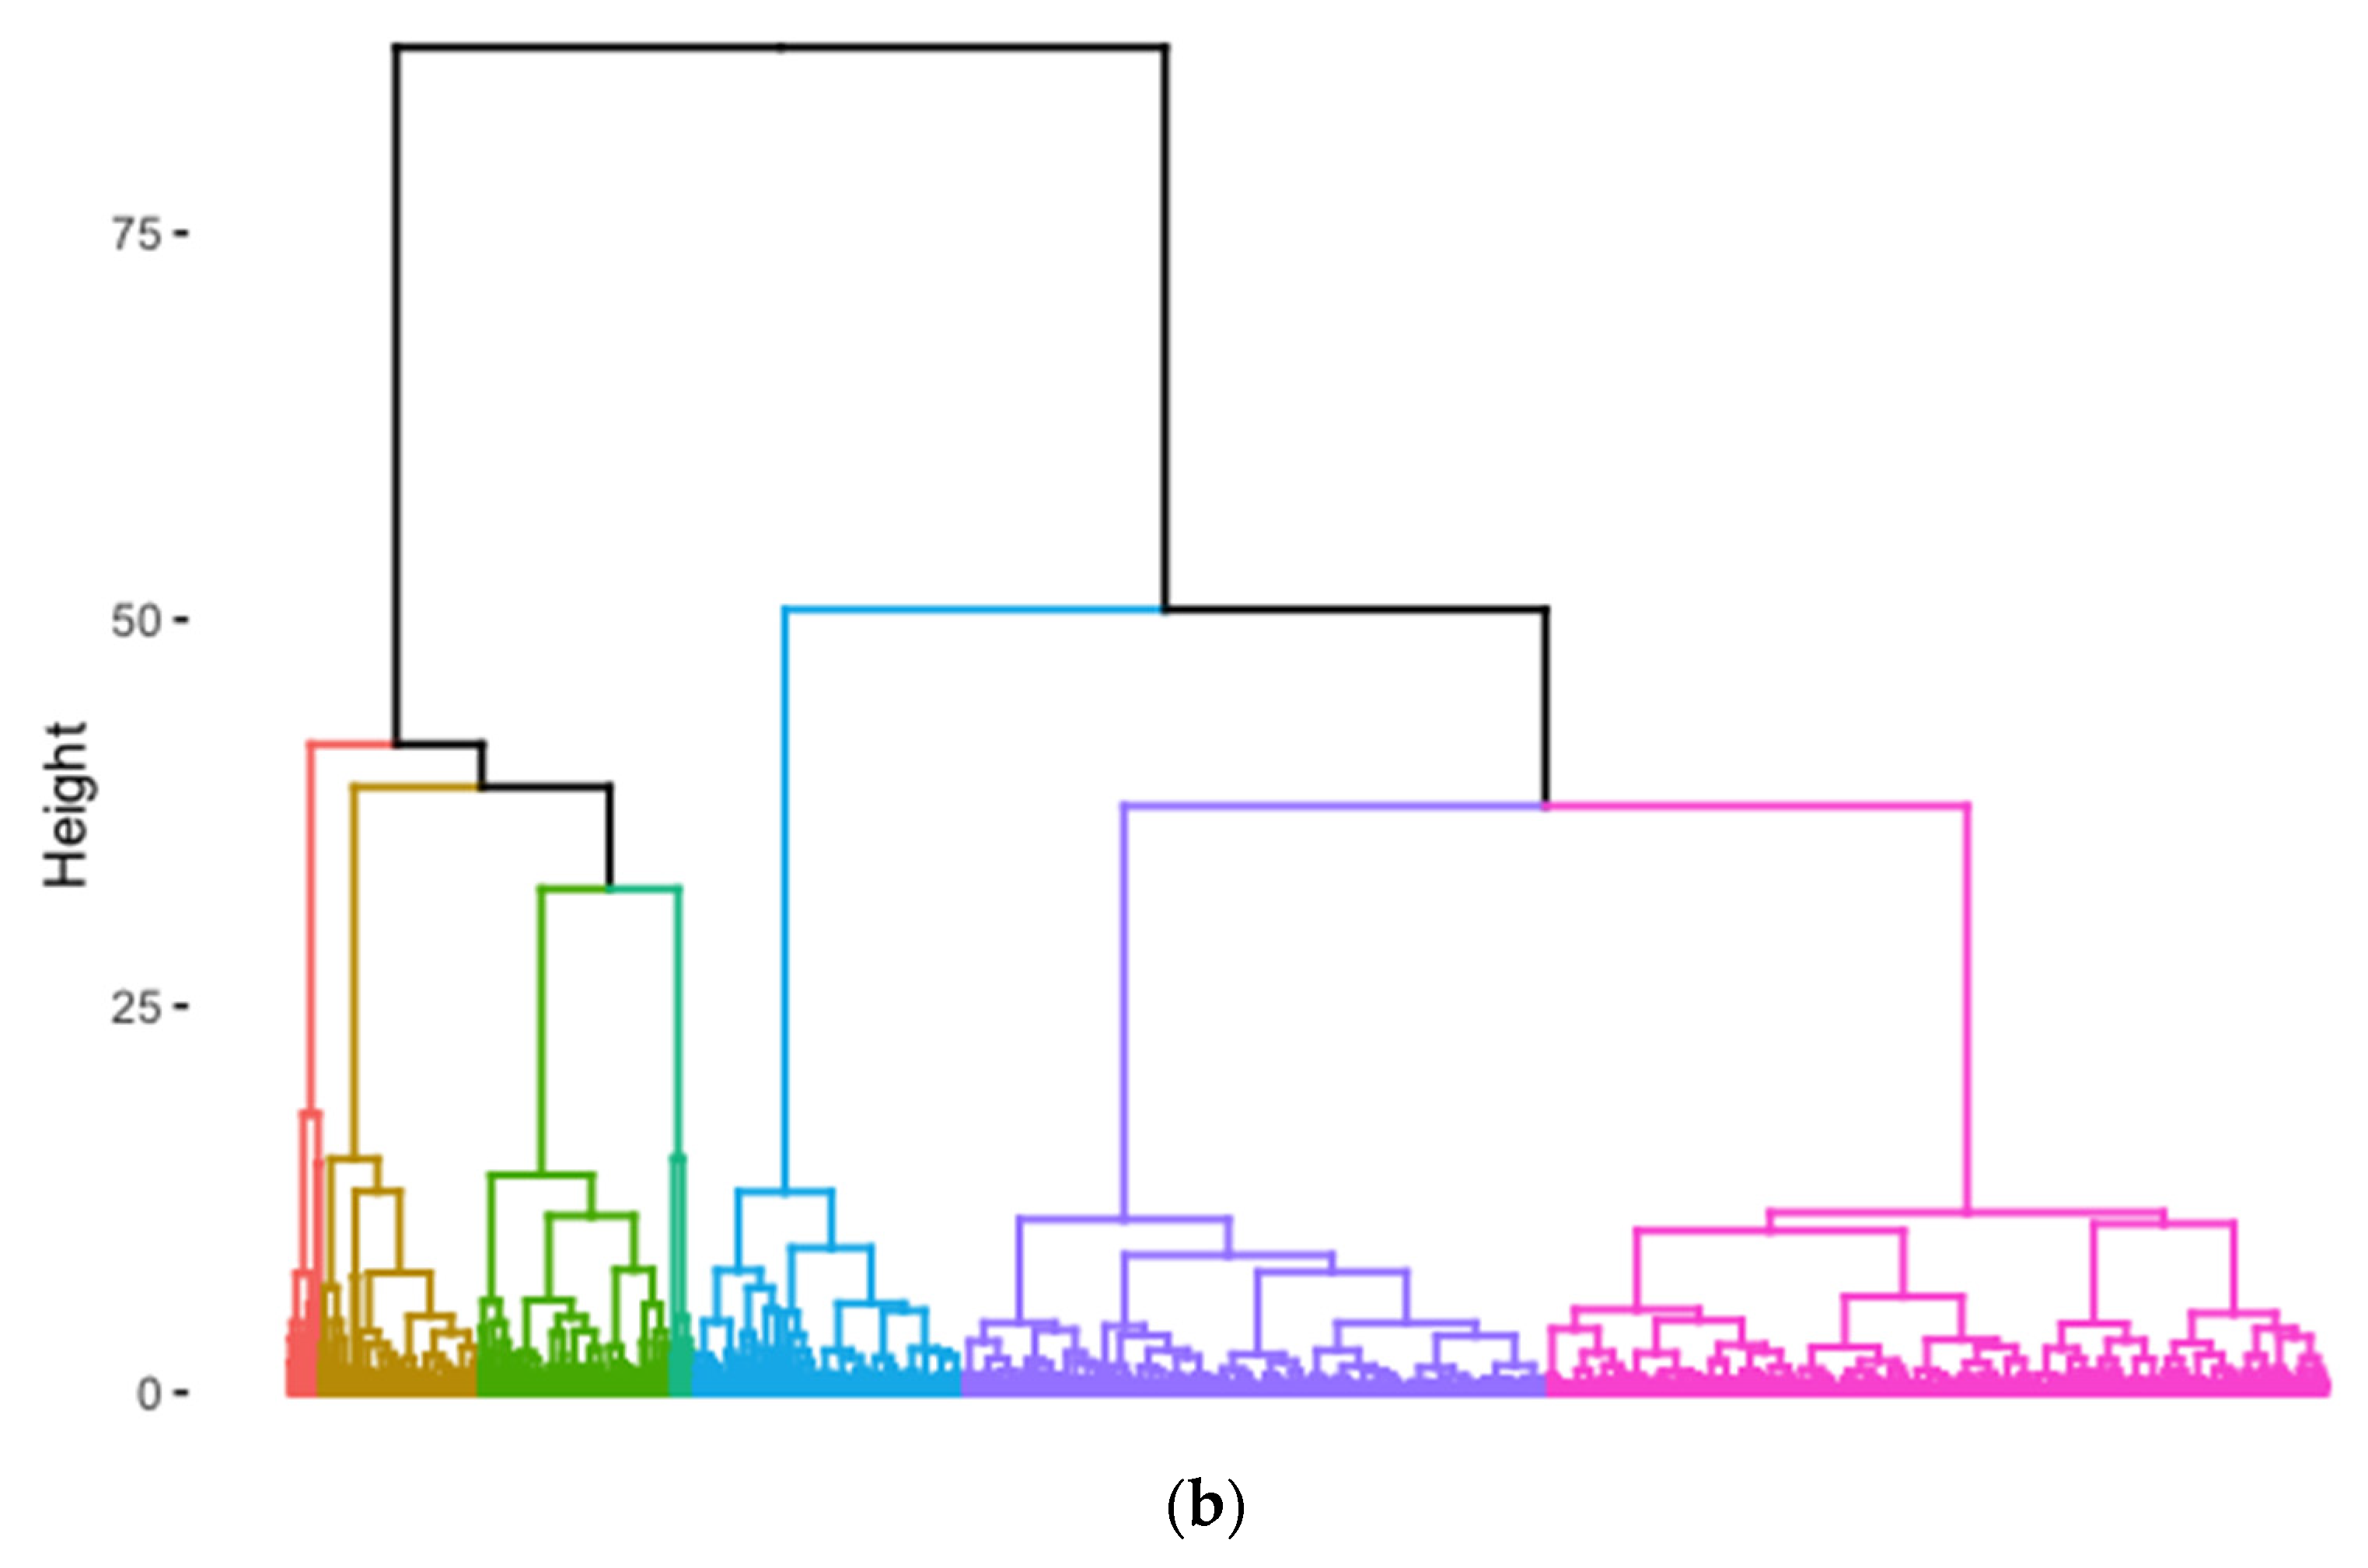
  • The clustering of remaining data partitions the settlements into sets with very similar urban (and, thus, energy) features.
  • The settlement closest to the center of gravity of each cluster is examined in depth to determine its key features (in the case at hand, the available roof surface and its potential productivity).
  • The results obtained for this “central” settlement are extrapolated to its entire cluster, using the most significant attribute.
Despite the simplicity, and thus the general applicability, of such an approach, it must be noted that it implies a few “subjective” choices. They include: the value of the correlation that represents a “strong” link between features that allows discarding some of them; the variance explained by the first principal components that express a “sufficient” linear relation; the clustering algorithm itself and the measures that determine the optimal number of clusters. As in most statistical approaches, this type of choices can be reasonably made only with reference to the specific application domain. It is also important to remember that the approach is intended to provide a first estimate of the potential PV energy (and consequently of the reduced emission) in a large territory where there are significant differences of the urban structures and, on the other side, field data on the roof surface are either unavailable or require a high computational effort. Therefore, a precise validation of the model is not possible and only some comparisons can be made. Following these comparisons, one still has the choice of determining the precision threshold that makes the model acceptable. Notwithstanding these limitations, the approach may be useful not only to determine the potential roof surface and the consequent PV energy but also to extrapolate other energy characteristics of the residential buildings (e.g., the total energy use, the fuel type and amount, the use of hot water,…) that are closely linked to the urban features.

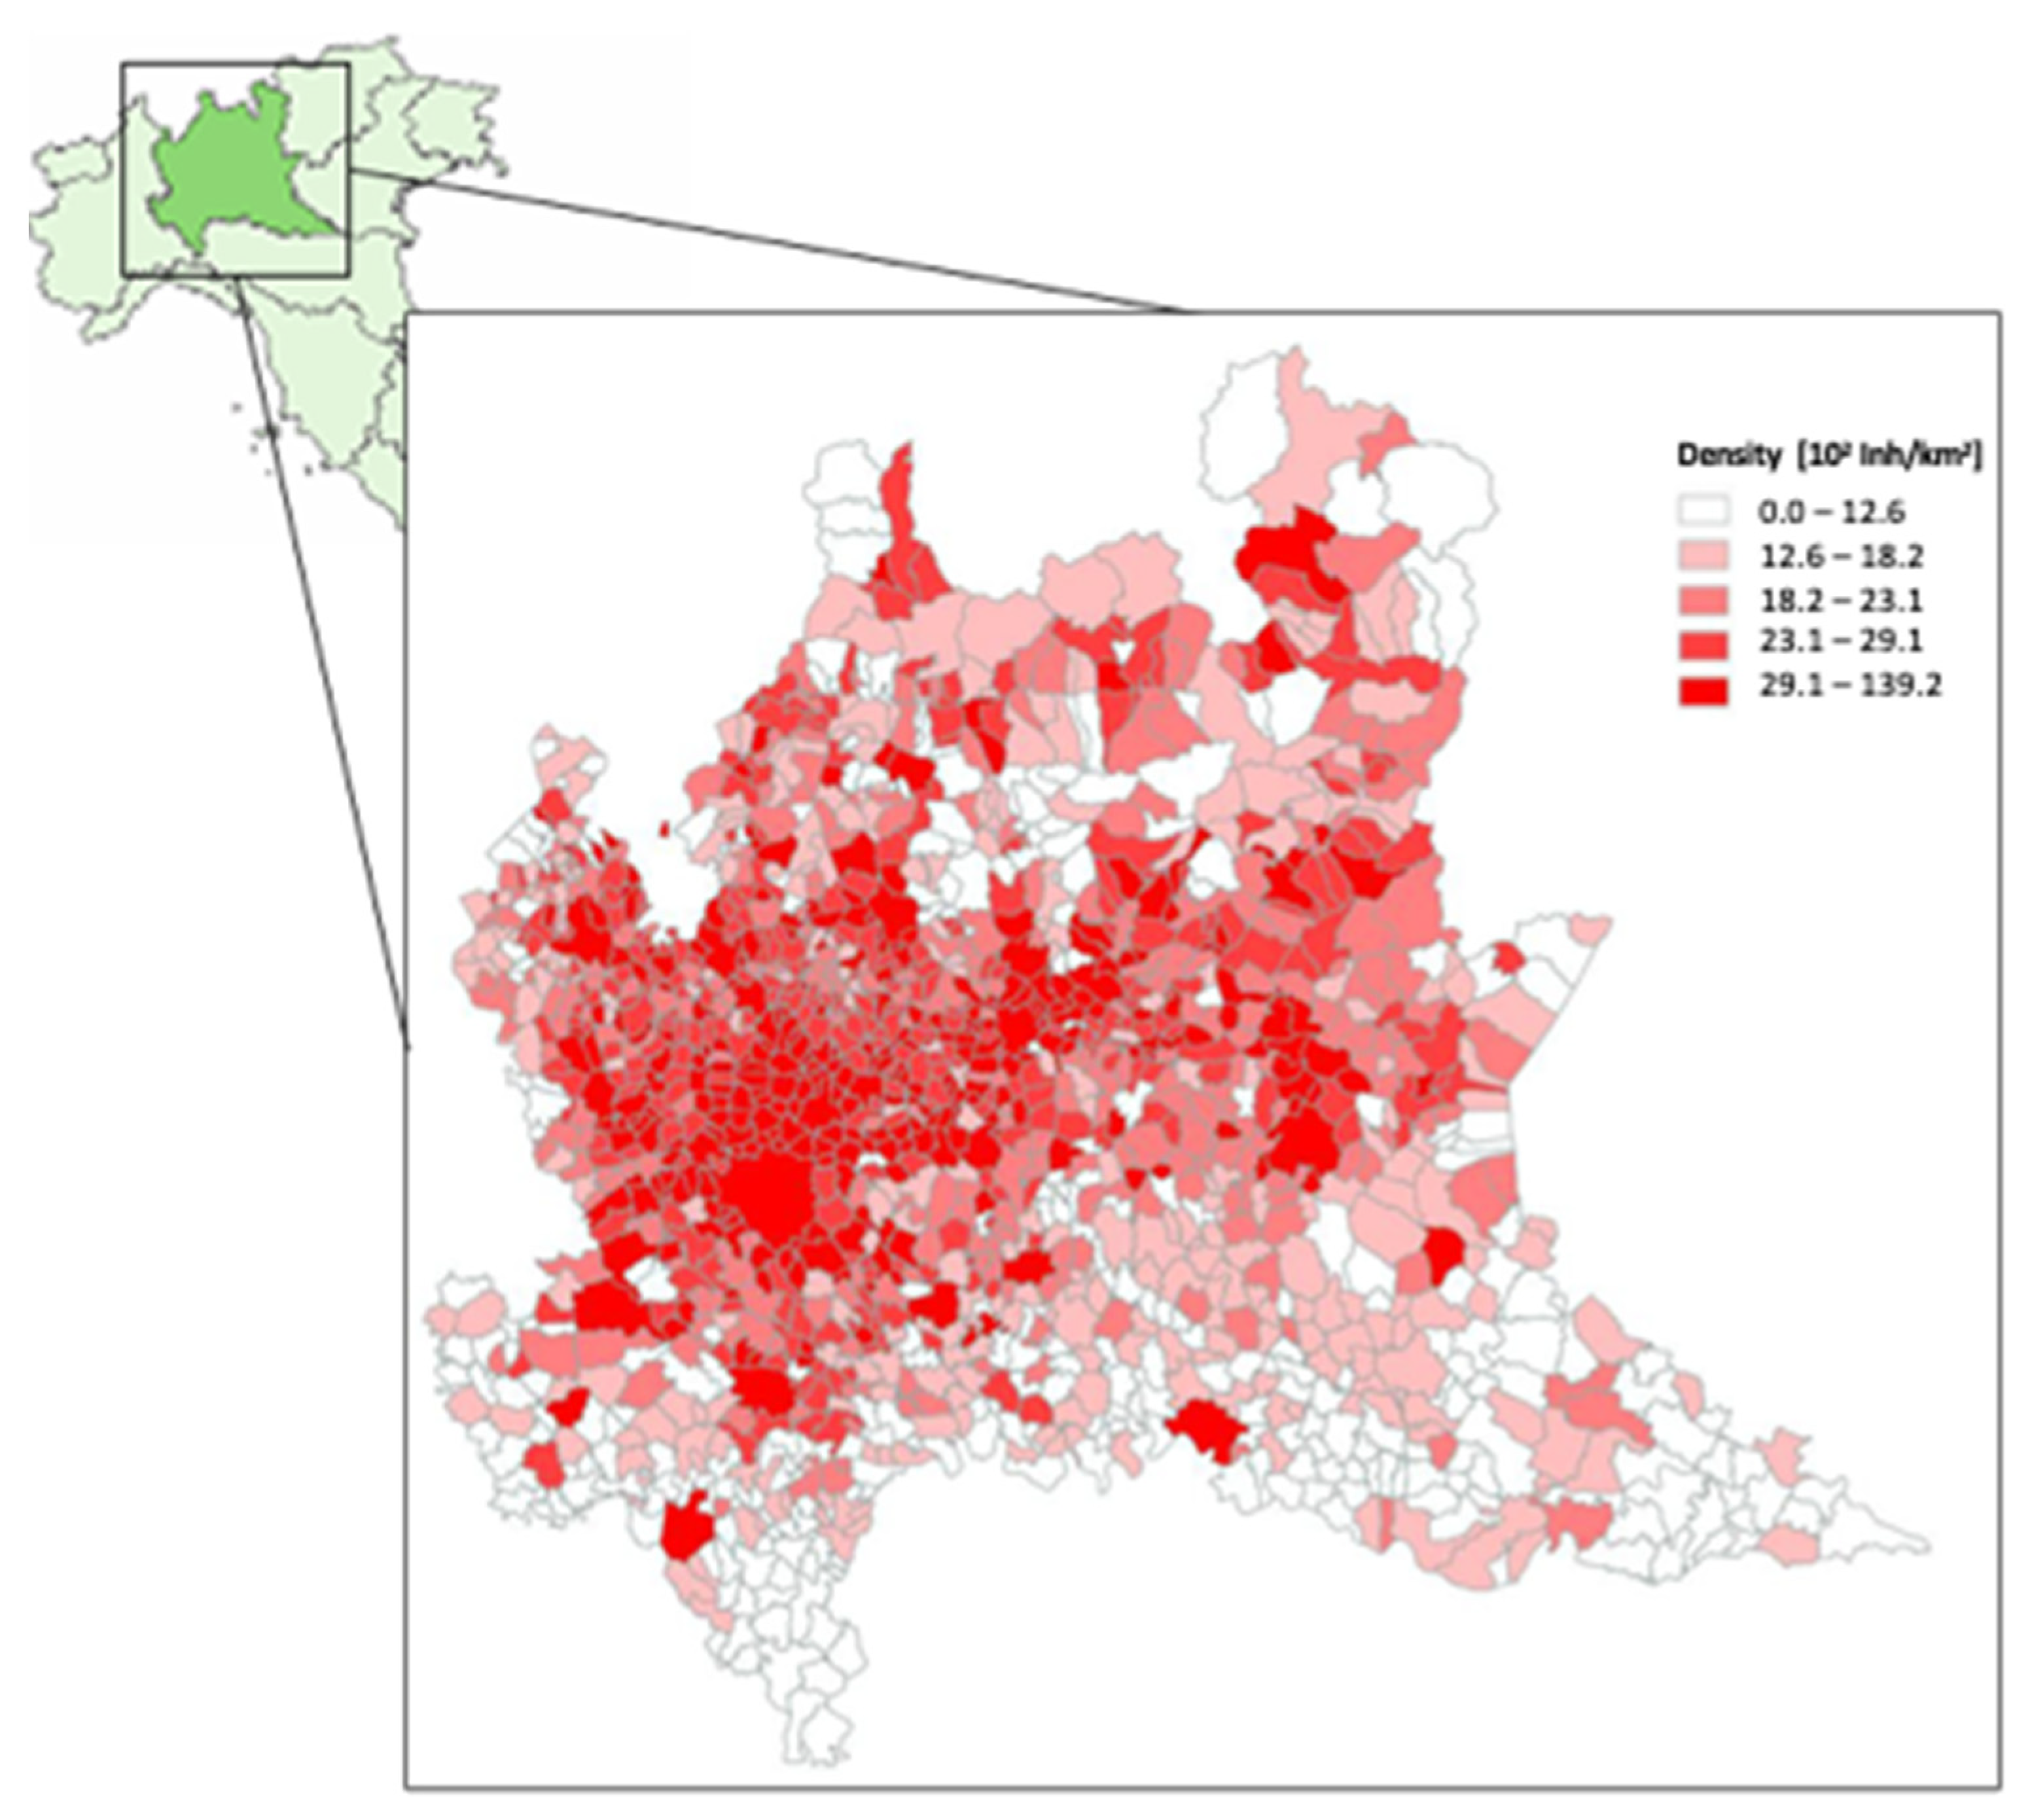
2.2. Application to Lombardy

Lombardy is a Northern Italian region with a surface area of around 24,000 km2 and a population close to 10 million inhabitants. It is characterized by a high number of municipalities with quite different housing typology. Its territory can be subdivided into a northern mountainous area representing about 40% of the surface (maximum elevation at 4000 m a.s.l.) and a central flat agricultural area (the Padana plain) that represents another 40% of the region. In between, there is a hilly territory rich in rivers and the largest Italian lakes, with the foothills of the Apennines mountain range at the South. The average elevation of the region is around 280 m a.s.l. This highly varied physical territory determined, along the history, the development of small municipalities in the mountainous area and much larger urban centers in the plain. A consistent urban sprawl is still taking place. Overall, the region is subdivided into about 1500 municipalities, as shown in Figure 1. This number has been changing in recent history due to the aggregation of some very small adjacent administrations. Figure 2a shows how these municipalities are distributed in various parts of the region. It represents the number of municipalities whose centers lies in a specific elevation range. Almost half of the municipalities are in the plain area, but several tens are located at more than 1400 m of altitude. Most municipalities are small. As shown in Figure 2b, about 600 have less than 500 residential buildings, and only one, the capital city of Milan has more than 40,000.
Another interesting piece of information is provided by Figure 2c, which shows the distribution of the average number of residents per building (from which the average size of the buildings can be inferred). In about 60% of the municipalities, the average number of residents per building is five or fewer. In all the region, the number of residents per building is 10 or less, with only very few exceptions. A clear sign that most buildings are small with just one or two dwellings.
A further interesting feature of these residential buildings is portrayed in Figure 2d, which shows the distribution of the building ages across the municipalities. Very few settlements are recent, and most have an average building age of 60–70 years. The boom of construction was around the sixties of the past century, simultaneously with a strong growth of the general economy.
However, at that time, the norms about energy saving in residential buildings were much less stringent than today’s ones. Indeed, the analysis of the data in CENED2 [34], an extensive database of the energy performance of about one million individual dwellings, shows that the average total energy consumption went from 340 kWh m−2y−1 for houses built before 1960 to 287 for those of the period 1961–1992, to 215 in 1993–2005, and to 161 kWh m−2y−1 for those built afterwards [35]. This corresponds to a parallel decrease of CO2 emissions as well as those of traditional pollutants such as NOx and PM.
Presently, about 87% of the heating systems in the region use methane and other portions are covered by wood (7.1%), gas oil (3.3%), and liquefied petroleum gas (LPG) (1.5%). Solar energy enters the energy budget of the households for the production of hot water but covers just 0.8% of the dwellings.
Figure 1 also displays another relevant characteristic of Lombardy municipalities: the density computed as the ratio of resident population over the urban area. The land surface is not always explanatory of the extent of the settlement over the different municipalities of the region. In mountainous municipalities and in the cities of lower Lombardy strongly marked by agriculture, there are many concentrated urban centers much smaller than the territorial surface, with the remaining part of the land used for fields, pastures, or forest. This motivates the choice of including this parameter in the following analyses. It was calculated from the data available in the multi-temporal geographic databank Destination of Agricultural and Forest Land Use (DUSAF) [33], which classifies the territory based on the main types of land cover and land use, available for download on the Geoportal of the Lombardy Region. This density is an insightful proxy for the municipality’s urban morphology: high values of density are expected in those cities with a high concentration of multi-family buildings. The map shows the significant variability in Lombardy, ranging from a density of 0.013 inhabitants/km2 (San Giorgio di Bigarello, Mantua Province) to a maximum of 1.39 inhabitants/km2 (San Giorgio di Lomellina, Pavia Province), where a population of 11,873 is concentrated on an urban surface of only 0.85 km2. This makes the density value higher than the big Lombardy cities, where there are much higher numbers of residents and urbanized surfaces of at least an order of magnitude larger, and demonstrates, once again, the peculiarities of the territory under analysis.
The reference dataset for the analysis was constructed on readily available structural data showing the key characteristics of the region from a demographic, geographic, and urban/morphologic point of view. They derive from the 15th General Census of Population and Housing 2011 [36], the 6th General Census of Agriculture 2010 [37], and the Annual Statistics provided by the National Statistical Institute [38]. The overall data matrix was composed of 1507 rows, each corresponding to a municipality, and 11 columns of attributes, representing:
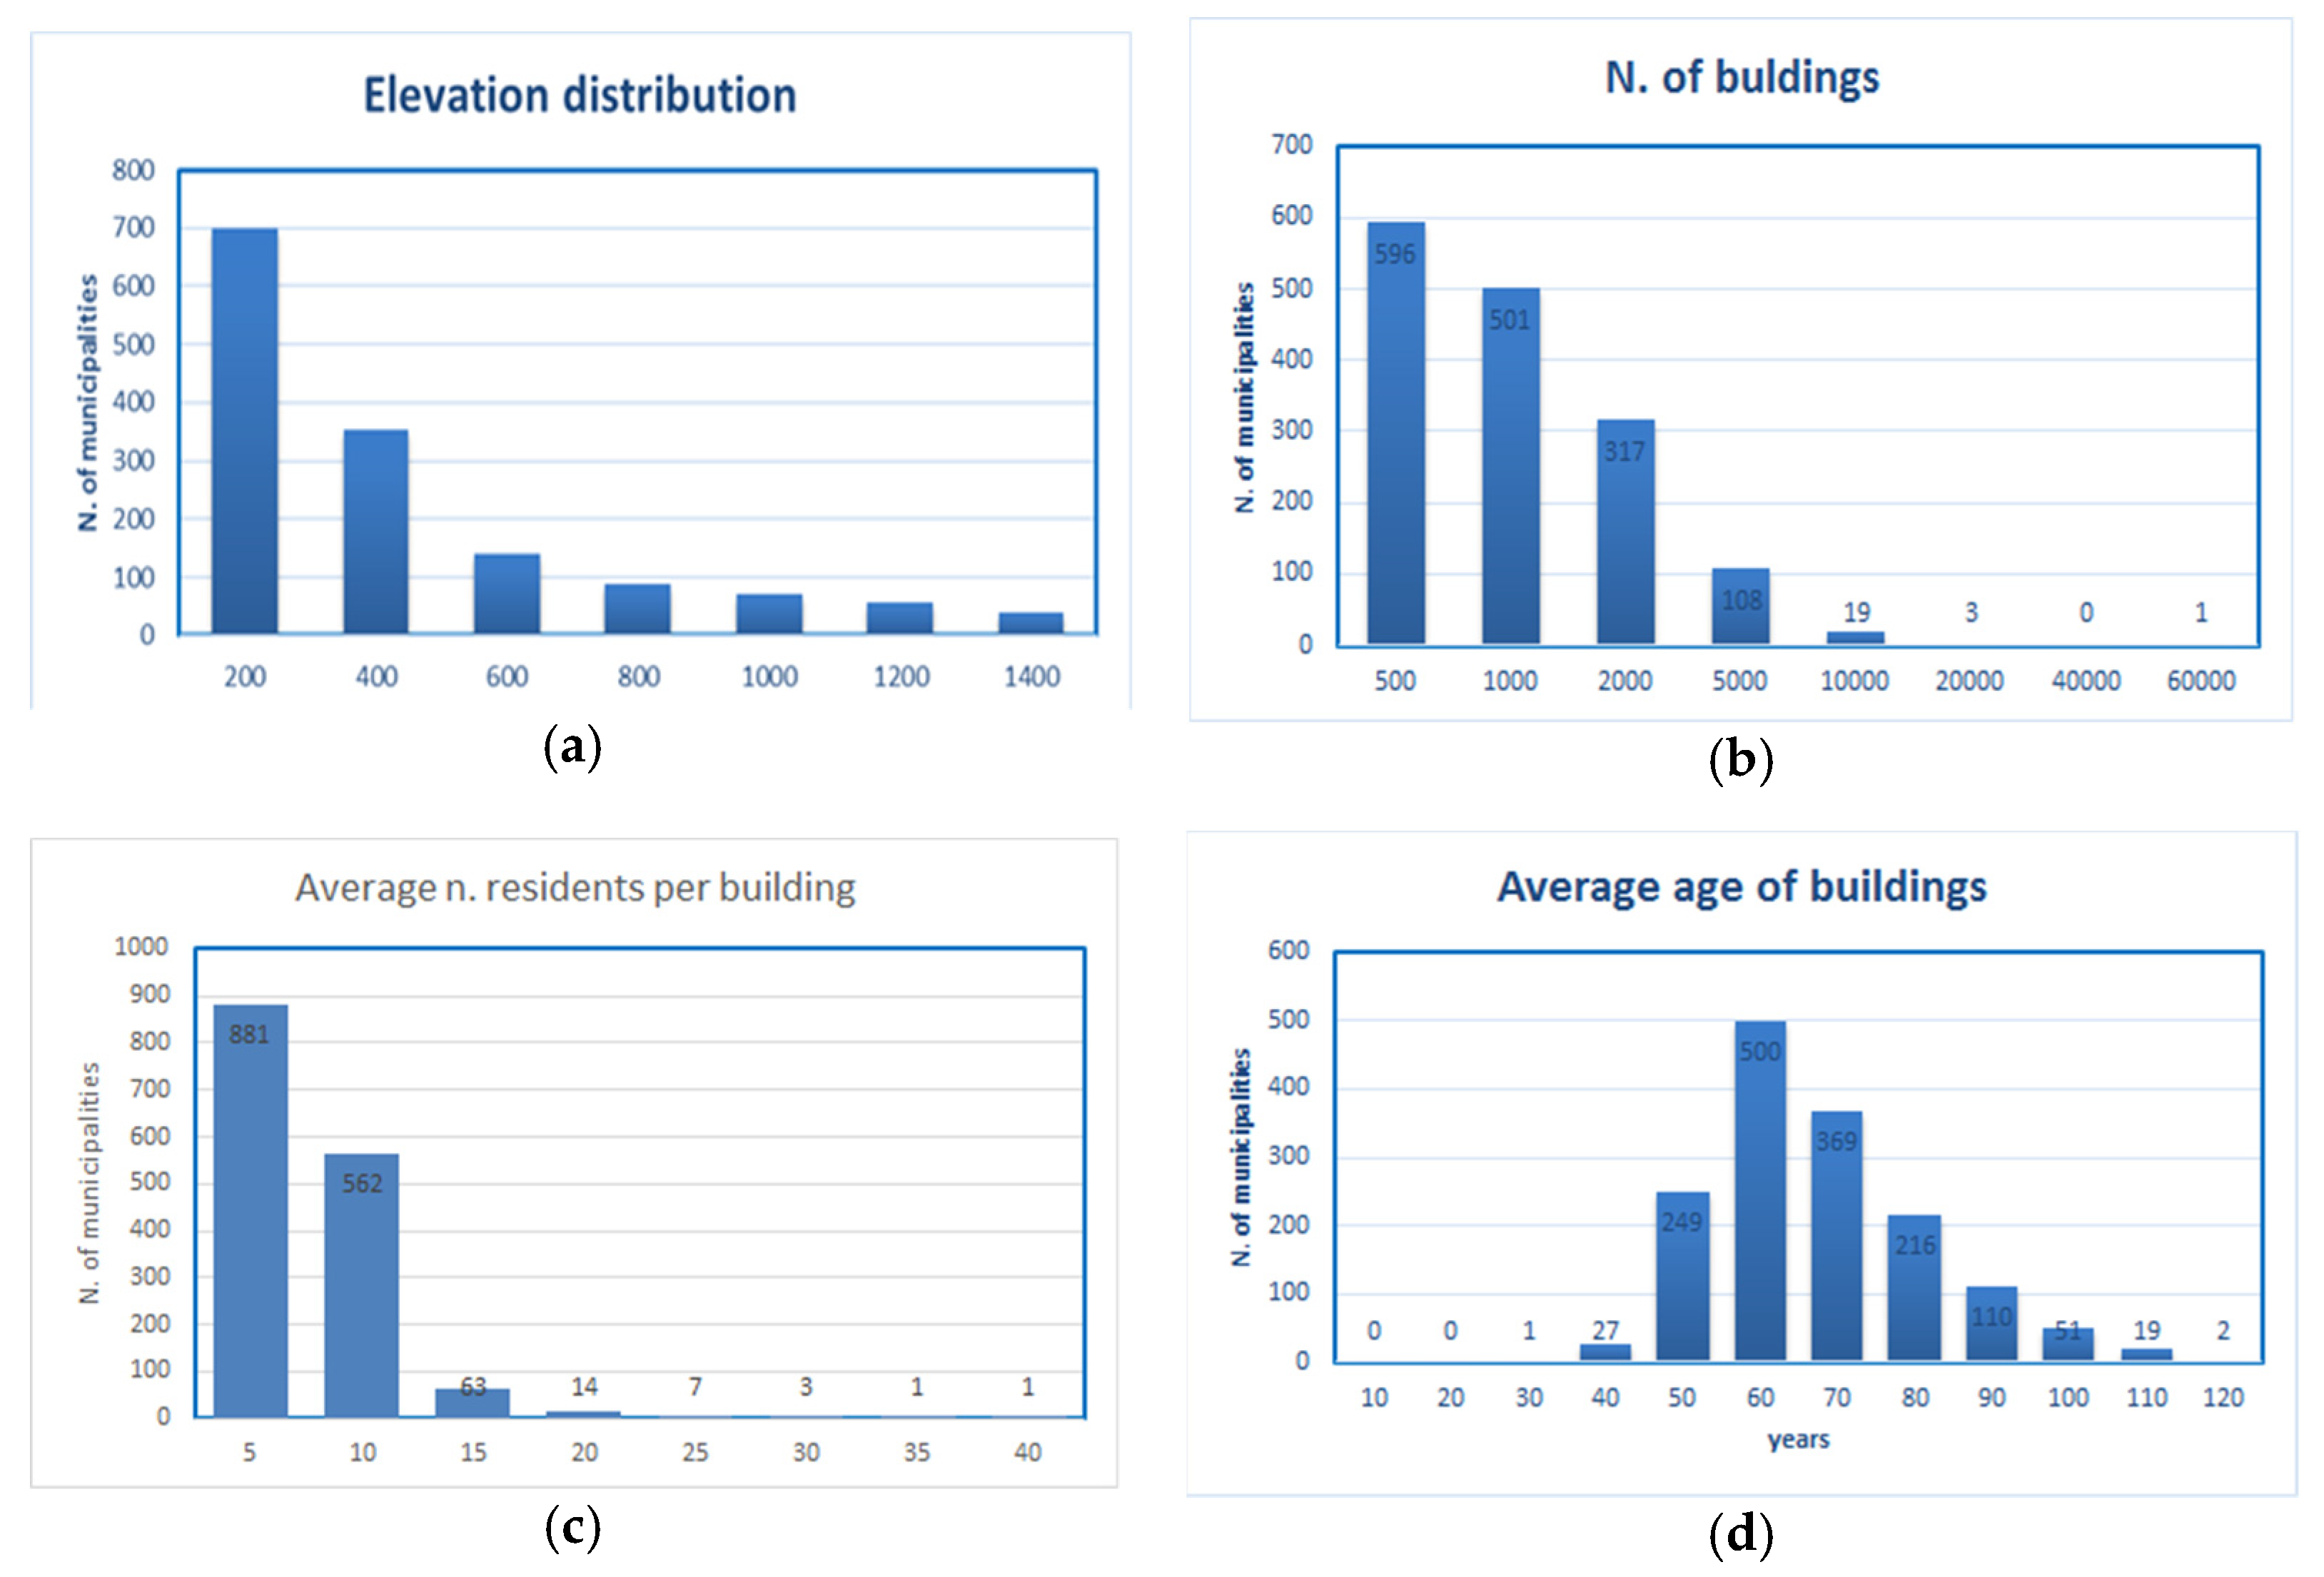
  • Population (number);
  • Altitude of the urban center (m a.s.l.);
  • Land area (km2);
  • Urban surface area (km2);
  • Density of the urban area (inhabitants per square km–inh km−2;
  • Six classes of the number of dwellings per building (one—Class 1, two—Class 2, three or four—Class 3, five to eight—Class 5, nine to 15—Class 9, 16 or more—Class 16).
The results of the correlation analysis are presented in Table 1, where low correlated attributes (i.e., with all coefficients lower than 0.80) are shown on white filling. They indicate that urban areas and some classes of the number of buildings can be discarded because they are strongly correlated with the population or other building classes.
The PCA was performed on the six remaining uncorrelated attributes, which also allowed a graphical representation of any possible grouping in the domain of the first two principal components. The analysis results (performed using R programming language using the library functions stat and factoextra) are reported in Figure 3.
The graph on the left shows the percentage of the variance of the data explained by each principal component (PC). The first two components explain together about 65% of the variability in the data, while 80% is reached also considering the third PC. The first PC mainly weights data about population and number of buildings, while the second elevation and land area. The graph on the right represents the scatterplot of the data in the space of the first two PCs. It makes evident the relevant difference of the single observation on the right with respect to the rest of the data. This point is the capital city of Milan, which presents characteristics strongly out of scale compared to the remaining municipalities in the region and not even in line with the remaining main towns. For this reason, the capital city has been excluded from the clustering analysis and all the subsequent evaluations. Additionally, the graph shows that other municipalities are not aligned along either PC, and thus that a more sophisticated analysis is necessary to partition them correctly.
The cluster analysis was then carried out again using R programming language and environment, after standardization of the data to make variables comparable. The hybrid hierarchical-K-means clustering algorithm [39] was adopted since it combines the classical K-means and the hierarchical clustering, coping with their main drawbacks. The procedure was applied recursively to improve its identifying power. Each iteration involved four steps:
(1)
The most reasonable number of clusters was identified, comparing the values of 30 indices of distance in the data (R function NbClust). Then the hybrid clustering algorithm was applied (hkmeans function) using NbClust results as input;
(2)
The resulting clusters were validated using internal measures to evaluate the goodness of the partitioning obtained. These measures, formulated to reflect the compactness, connectedness, and separation of the obtained partitions, use internal information from the clustering process (e.g., minimum or maximum distance between objects or between clusters) to evaluate the goodness of fit of the clusters without referring to a priori or external information.
Such measures were:
  • The average distance within each cluster M of m elements, which must be as small as possible:
    d . w i t h i n = 2 i = 1 m j = 1 m ( x i x j ) 2 m ( m 1 )   with   i j ; x M ;
  • The average distance between each couple of clusters M and P (of m and p elements, respectively), which must be as large as possible:
    d . b e t w e e n = j = 1 m k = 1 p ( x j y k ) 2 m p   with   x M ;   y P ;
  • The average silhouette width of the cluster measures how similar an object i is to other objects in its cluster compared to those in the neighboring cluster. Its value is between 1 and −1, with a value of 1 indicating a perfect partition. The average silhouette width of the observation i is defined by the formula:
    S i = ( b i a i ) / max ( b i , a i )
    where a i   is the average dissimilarity between i and all other points of the cluster to which it belongs and b i is the dissimilarity between i and its “neighbor” cluster.
(3)
Finally, the outermost cluster has been graphically identified and excluded from the sample data to be processed in the following iteration.
Six iterations were performed, obtaining a partition of the region’s municipalities into seven clusters (plus the city of Milan constituting an eighth separate cluster). The results of each iteration in terms of validating measures demonstrate the appropriateness of the iterative process and the correctness of the clusterization results. In particular, the ratios of average within distances are always half of the between distances and the Silhouette Index is positive, which indicates a good performance, and increases its value from 0.29 to 0.35 through the iterations. Figure 4 displays the seven clusters in the space of the first two PCs (a) and as a dendrogram (b).
The centroid municipalities were identified as those closest to the center of gravity of each cluster. By reducing the study area to the centroids only, it was possible to perform an accurate calculation of the residential rooftop area, ultimately extrapolated to the whole settlements based on the key hypothesis of similarity of objects in the same cluster. This roof surface estimate was computed by detailing the number of buildings of a certain age of construction and a certain number of dwellings, then defining each class’s typical value of rooftop area.
These values have been obtained from the TABULA European project [40,41,42], which determined the structural and energy characteristics of prototypical buildings in many European countries. For Italy, the Polytechnic of Turin carried out the study and identified 32 archetypal building categories based on their age and size. The estimation was also compared with the Database Topografico Regionale (DBTR) [43], a geo-referenced database describing topographic objects of the territory. Such a database, which does not cover the entire region, provides another approximation of the roof surface.
The roof surface estimation obtained on the centroids was then extrapolated to the entire clusters using the urban density as an independent variable: this proved to be the approach providing the most similar results (a deviation around 7%) on several other municipalities randomly sampled from the DBTR.
Finally, for the calculation of the rooftop PV potential in the region, an online software made available by the European Commission, PVGIS [32], was used. It allows calculating the energy produced, considering the available roof area and the internal relationships between the different components that affect the output of PV (system losses, orientation, location...). Seven separate evaluations were performed on PVGIS, one for each cluster, entering as study coordinates those of the centroid municipalities. As for the parametrization, it was chosen to define the PV plants considering the inclination and orientation that generally give the highest production yield, 45° South, and only 25% of the total available roof surface was considered [44], since obviously not all the roof area has these characteristics. This assumption is supposed to include the effect of shading and obstruction by mountains and other buildings. Still, any variation of this ratio would simply imply a proportional change of all the following results. The efficiency was set on the average market value of crystalline silicon PV modules, 17.53%. Finally, the system loss value was set to 25%, a standard value that allows the calculation to be carried out with safety without overestimating the power produced.

3. Results

The clustering analysis returns seven clusters, the meaning of which can be better understood by studying the results both quantitatively, by analyzing the data of the attributes summarized in Table 2, and spatially, by graphically representing the clusters in geographic terms, as displayed in Figure 5.
From the geographic viewpoint, the clusters are as follows.
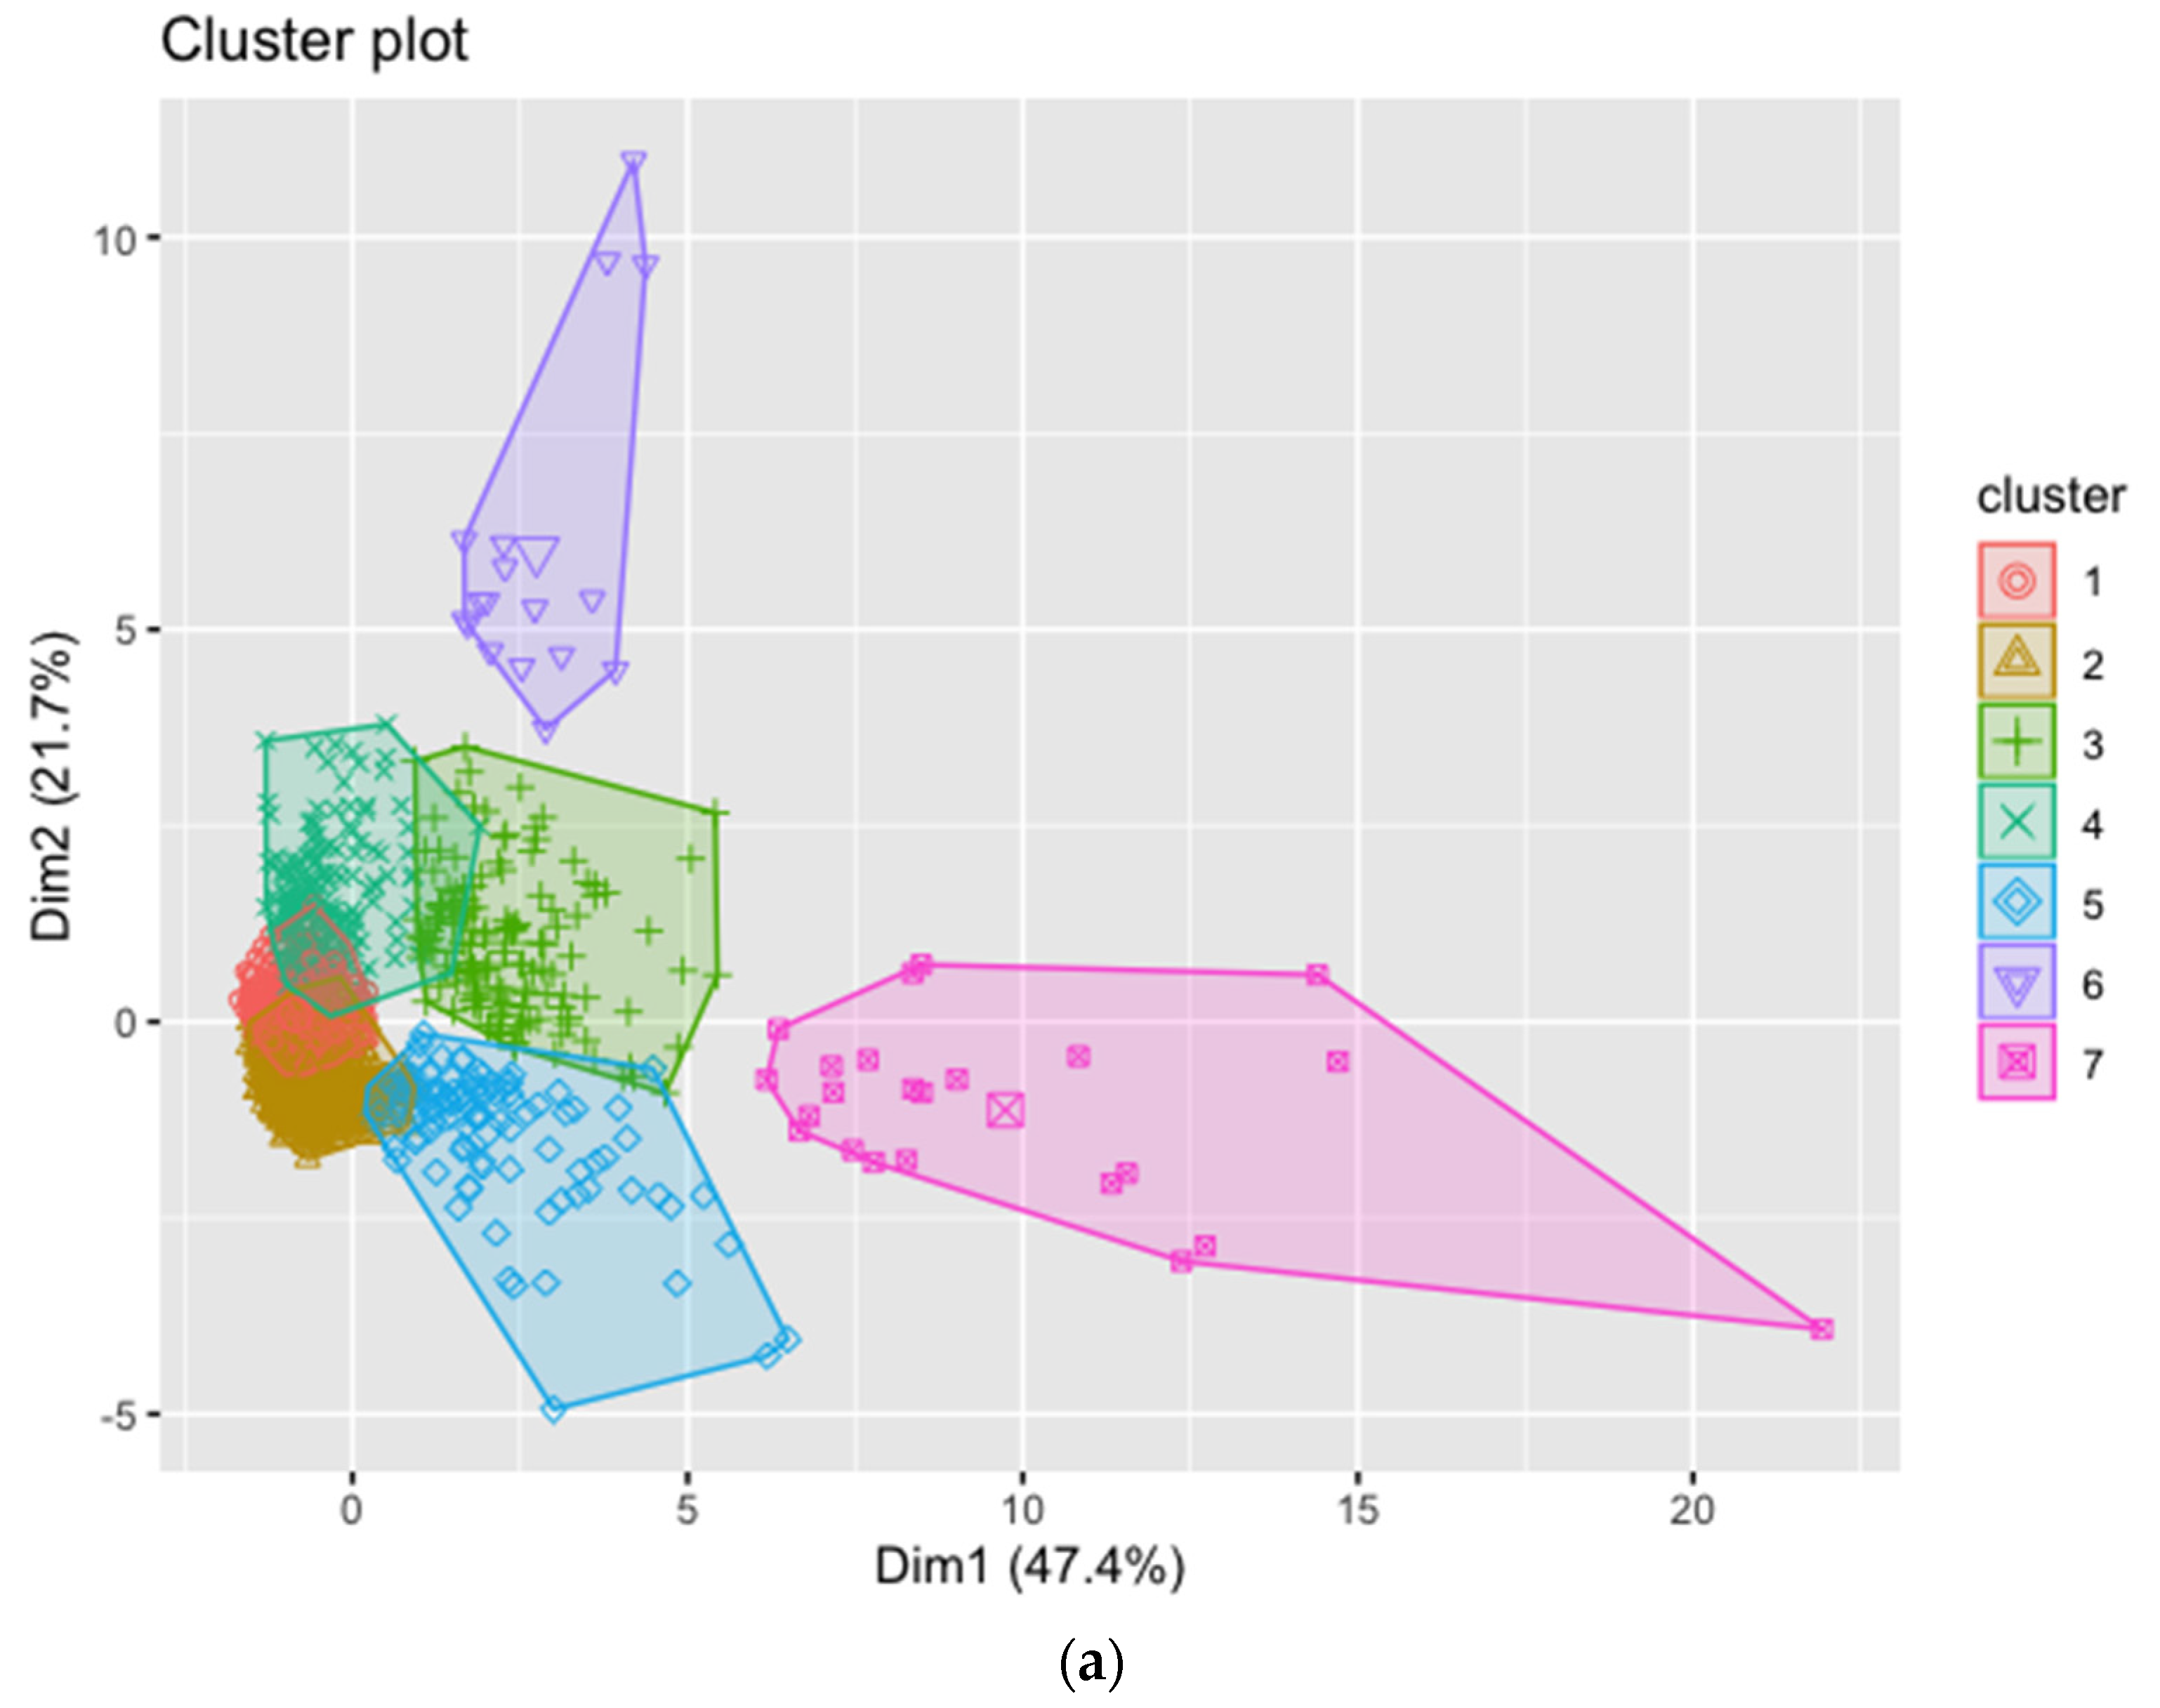
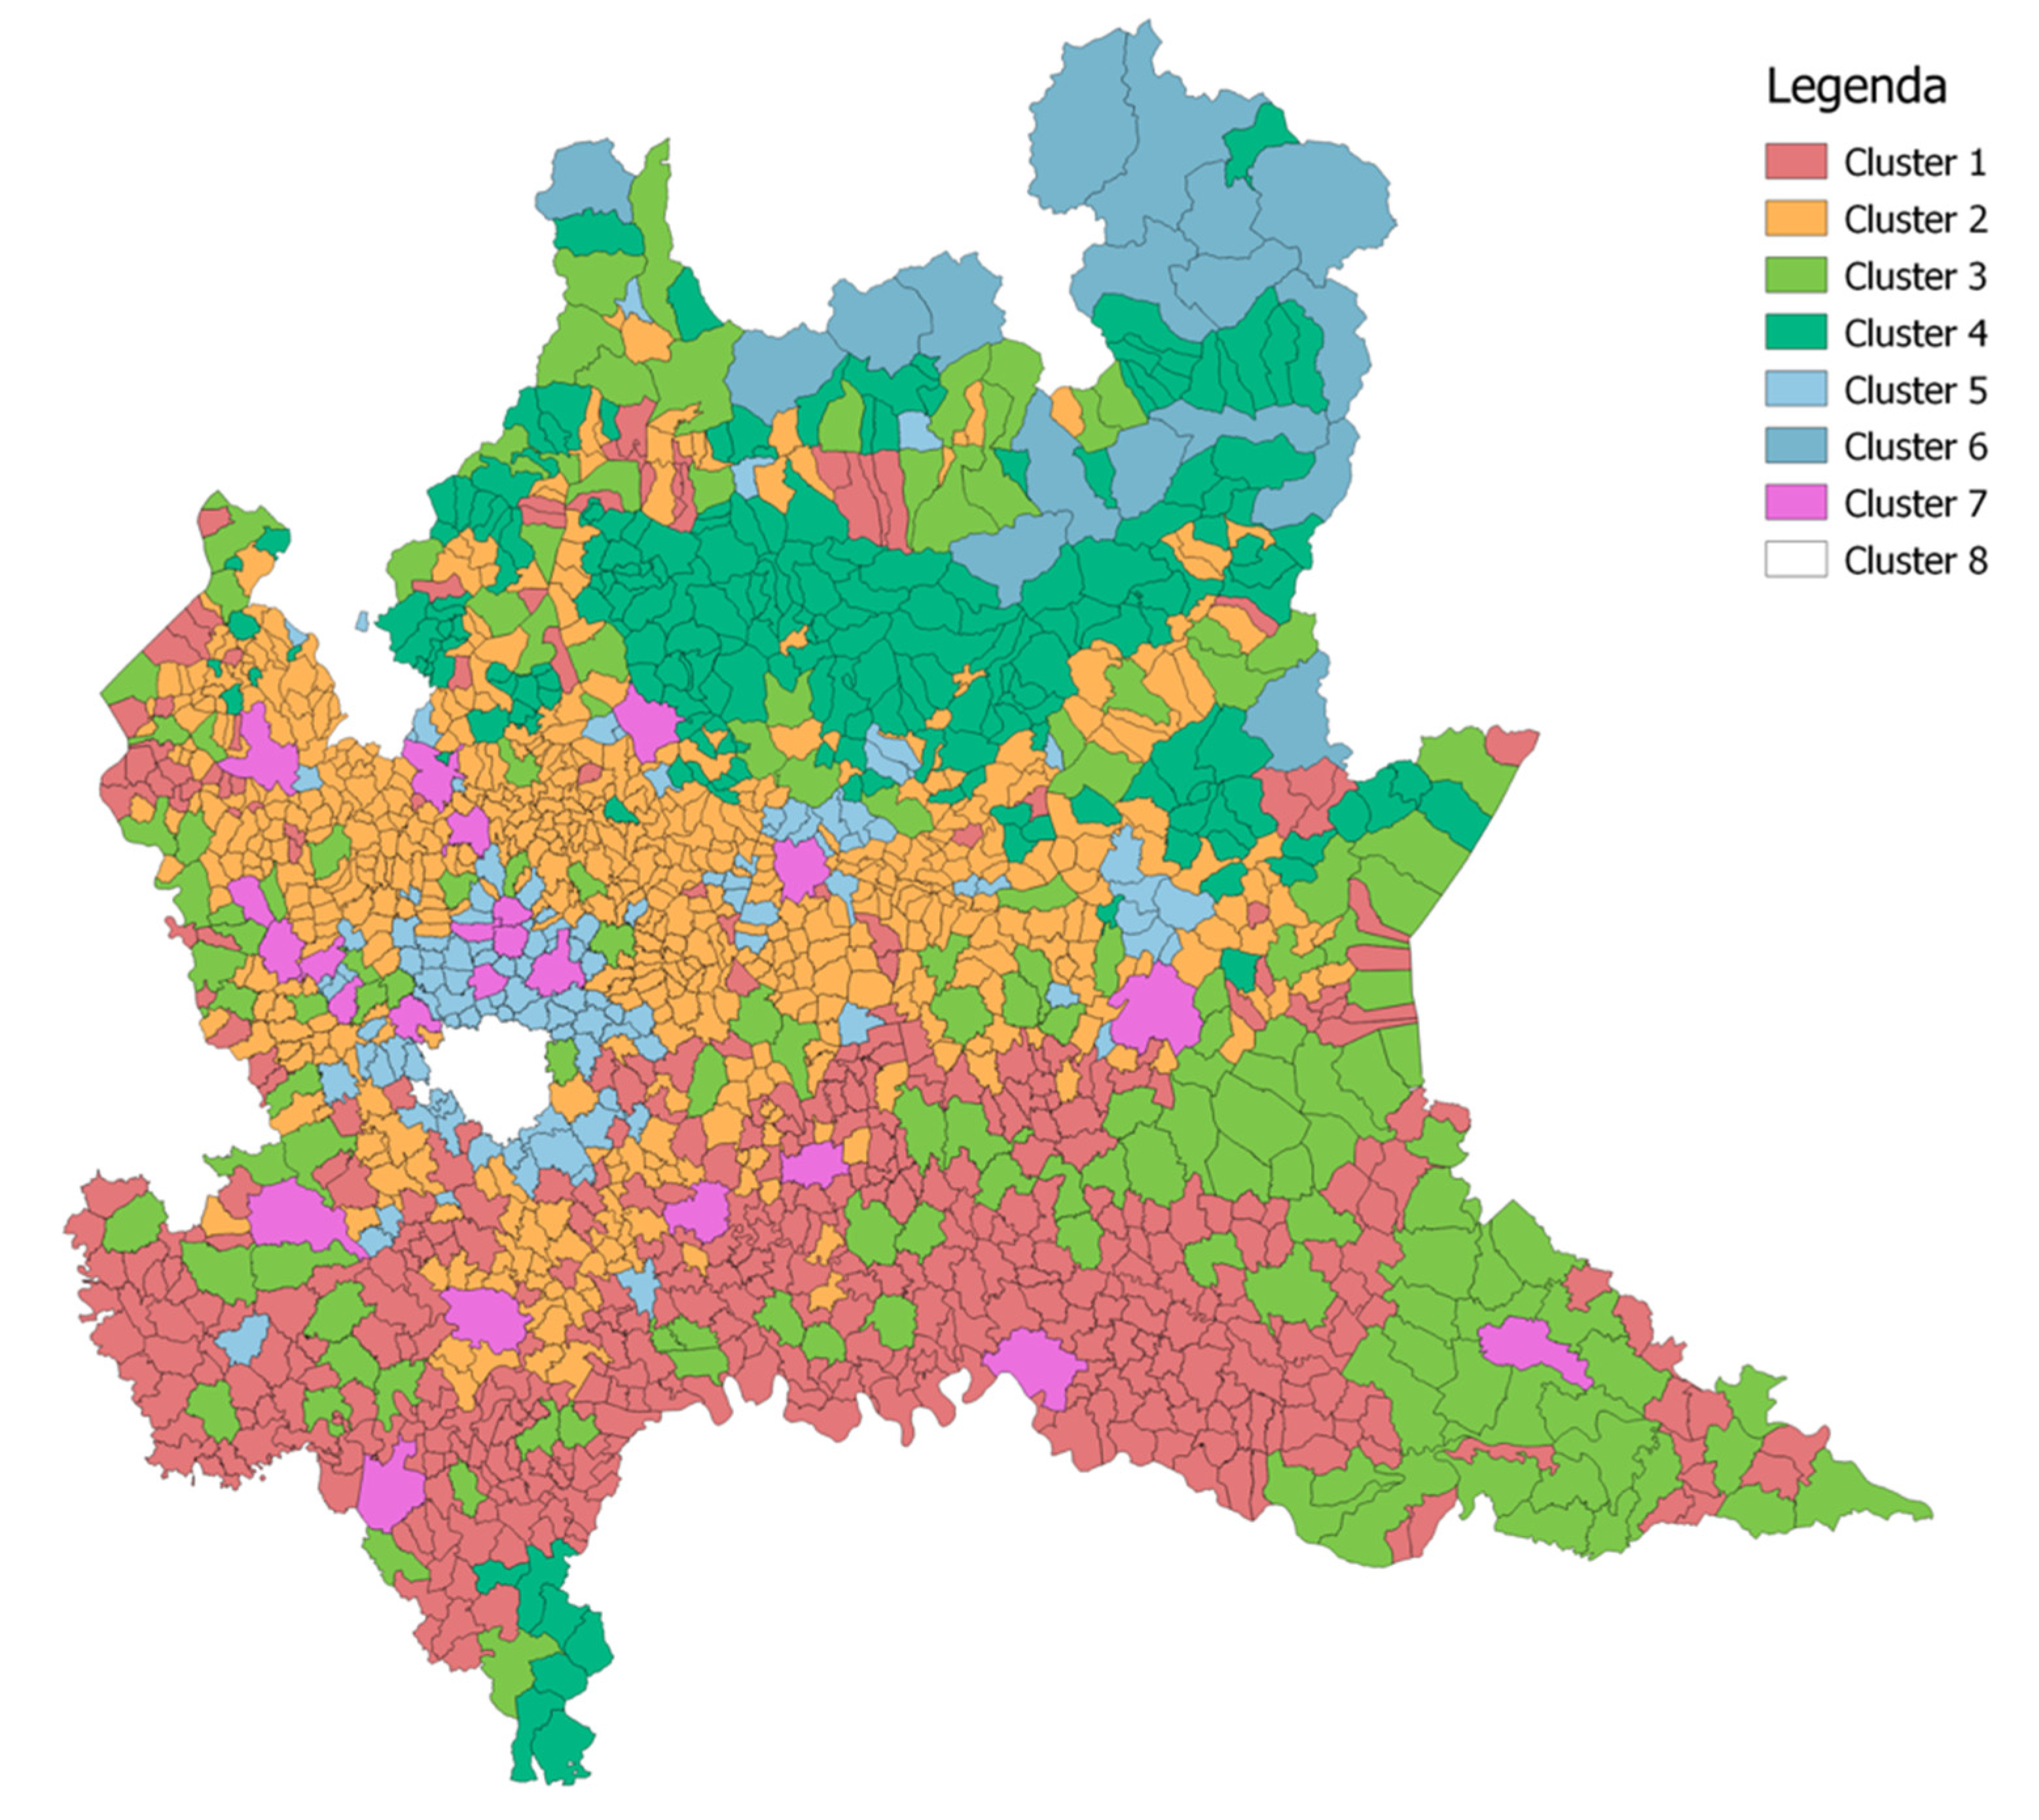
  • Cluster 7 contains the most populated cities with medium-to-large land area and diverse housing types with numerous vertical buildings.
  • Cluster 6 comprises municipalities in high mountains, not necessarily of small size, but mainly characterized by low density and a very large land area. The prevailing building typology are single family or duplex;
  • Cluster 5 contains the cities belonging to metropolitan areas, similar to those in Cluster 7 but with a much smaller land area;
  • Cluster 4 groups the remaining sparsely populated mountain communities which differ from Cluster 6 in population and land area;
  • Cluster 3 contains municipalities of the low hilly territory predominantly in southern-eastern Lombardy, which have a highly populated, concentrated and diverse urban area over a very large land extension;
  • Cluster 2 is predominantly characterized by average size municipalities with mostly single or two-family housing type;
  • Cluster 1 comprises the remaining municipalities of medium size, both in terms of inhabitants and extension, with quite inhomogeneous housing types.
The roof surface estimated with the procedure described above resulted to be around 250 km2, determining a useful surface estimation of 62.5 km2. This means the possibility of installing a peak power of slightly less than 11 GWp for a total potential production of 12.1 TWh. The computed value of energy would represent an amount five times the 2019 solar production (2.36 TWh) [45]. Note that the current total PV production in Lombardy comprises all plants and not just rooftop ones. The difference between current and potential PV production, here evaluated only in the residential sector, becomes then even more relevant. Comparing the potential production obtained with the regional consumption of electricity of 11.46 TWh per year in the residential sector [46], it becomes apparent that the demand can be fully covered. It is, therefore, clear that self-production and self-supporting electric energy in the residential sector are achievable objectives. It is, however, conceivable that the characteristics of the house strongly influence the ability to respond to the electricity demand. For example, a system on a multi-family building can hardly support the individual electric energy demands. This problem is further amplified if one considers the temporal distance over the day between peaks of consumption and production. Therefore, self-sufficiency on a large scale becomes feasible only considering the possibility of electrical exchange on the grid and the potential overproduction by PV systems on single-family houses. Without this hypothesis, it is impossible to reach the complete satisfaction of domestic demand on a general level, while this is possible for individual houses or limited districts by adopting suitable storage.
The seven clusters identified are not only important from the point of view of territorial characterization, but also allowed to identify the existing relationship with the production capacity of photovoltaics and the convenience of the technology in these areas. By comparing the electricity consumption per cluster with the potential production from PV obtained from the analysis, it is possible to report the regional study at the scale of the clusters, highlighting the urban and territorial differences that characterize them. These same characteristics influence the potential production of the PV systems in these areas. Looking at Table 3, the highly anthropized and densely populated municipalities, characterized by a less homogeneous housing morphology and with a clear presence of multi-family dwellings are not very convenient for the implementation of the photovoltaic technology. Here, the area available for rooftop panels is significantly reduced and consequently also the potential electricity production. This happens in Cluster 7, which contains the largest towns, Cluster 5, which contains the municipalities of metropolitan areas, and Cluster 3, consisting of municipalities in the Padana plain with a large land area and a highly concentrated urbanized area, therefore with density and housing morphology characteristics like the other two clusters.
On the contrary, clusters 1, 2, 4, and 6 could produce more than the local demand and are remarkably compact from the geographic viewpoint (see again Figure 5). This suggests the possibility of effectively implementing local smart grids or energy communities to exchange locally produced electricity.
The annual electricity production value was contextualized at the regional level computing the social benefit in terms of emission reduction. This saving share (i.e., the emissions that would have been determined by the production with the existing energy plants spared with PV implementation) was evaluated using the emission factors determined by the Italian Institute for Environmental Protection (ISPRA) [47,48]. Given the average CO2eq intensity of Italy’s electricity production of 312 g/kWh, the complete implementation of the PV plan over the whole of Lombardy would reduce the regional greenhouse gas emissions by 3.8 Mt CO2 equivalent per year. Such an amount represents 27% of 2018 emissions for energy production in the region, according to the INEMAR emission inventory of the Regional Environmental Agency [49,50]. With respect to the total GHG emission, the percentage is almost 5%. The relatively large proportion of the emission of the energy sector is because a large portion of the electric energy supply of the region is imported and thus generates emissions somewhere outside the territory under consideration.
In the same way, one can compute the potential impact of PV rooftop installations for the other pollutants involved in the production of electric energy. Table 4 shows the emission factors of the main air pollutants and overall emission that could be spared by fully exploiting the computed residential roof surface. The reduction can be huge for nitrogen oxides, given that the most significant portion of the Italian power plants are fueled by methane. The annual emission reduction of 2750 ton of NOx represents 33% of the regional energy-related emissions, but just 2.5% of the total emissions, since almost 50% of NOx is attributed to traffic. Similarly, the reduction of sulfur oxides is about 22%, considering the energy sector only, and 7% of the overall emissions. The reduction of non-methane volatile organic compounds (NMVOC) would be even larger than the regional energy emission, but a tiny 0.4% of the total, which is primarily due to the use of solvents and agriculture. This is again due to the peculiar electric energy structure of Lombardy, which locally produces electricity with a large use of hydropower and gas-powered stations, but imports electricity that must be considered with the average emission factors of the Italian plants, which use also coal, biomass, oil, and urban wastes.

4. Discussion

PV’s potential production was compared with two studies at European level that use methodologies more computationally intensive than those implemented in this work:
  • The paper by Bodis et al. [24] combines statistical (Eurostat) and satellite data (European Settlement Map-ESM) to quantify the rooftop area available for PV systems and assesses the technical potential for rooftop photovoltaic electricity production by applying PVGIS, at a spatial resolution of 100m across the European Union.
  • ENergy Systems Potential Renewable Energy Sources (ENSPRESO) [28] provides a report of potential energy values implemented for three different solar plant capacities (low 85 kW/m2, medium 170 kW/m2, high 300 kW/m2) processed through JRC-EU-TIMES model at national (NUTS1) and regional (NUTS2) levels for the period 2010–2050.
The study by Bodis et al. confirmed the PVGIS parameterization used to compute the PV potential and can be compared only on a national scale. For Italy, the PV production potential was found to be 88.65 TWh per year, whereas the current production from photovoltaics was 22.65 TWh in 2018 [51]. This 400% increase represents a 20% underestimation with respect to the present study. Still, it must be considered that a 100 m resolution may be insufficient to detect many single-family houses, which constitute the largest portion of the Lombardy regional building stock.
A more detailed comparison of the potential electricity production result was made with the ENSPRESO values. Assuming a medium plant production, the overall result for Lombardy is only 3% above the estimate presented here. A more precise validation of the results is impossible given that a complete “ground truth” is not available. According to the latest statistics, the 2.4 GWp of all PV panels present in Lombardy in 2019 produced about 2359 GWh, which means an average of 1000 MWh/kWp. This efficiency is just 10% different from the result of PVGIS but one must consider that not all the panels were in operation at the beginning of the year and some panels are already old and thus with less efficient technologies and higher losses than modern plants.
This study only investigated residential installations, the sector that is expanding more rapidly due to the lower technical and bureaucratic barriers. The 12 TWh found is a gross underestimate of total potential: considering industrial buildings, generally with roof areas much larger than the average house, the potential production of the PV system in Lombardy would be definitely greater. Additionally, new engineering techniques, such as facade systems (vertical systems on the walls of buildings) and PV windows (highly transparent plexiglass panels able to generate a peak power of 20 W per square meter) will further expand the potential of solar installations. This confirms the wide margin of growth that PV technology still has and highlights the potential outcomes of its implementation on a national level.
The practical implementation of the above results will be determined mainly by its cost and benefit balance. On the one side, one must consider the cost of installing the plant, which can probably be discounted over 20 or more years, and, on the other side, the reduced energy costs and the value of the reduced emissions. Presently, the return time of a rooftop PV installation in Italy is around nine years, just considering the reduced energy bill. Still, this time may significantly reduce if one considers the value of the emission reduction. As of spring 2021, the cost of CO2 emission allowances on the European market is slightly more than 50 € per ton [52]. This would mean a value of the reduced annual emissions of about 200 M €, which will probably increase significantly in the future.
On the contrary, an economic evaluation of the emission reduction of other traditional pollutants is much more difficult. The emission would, in fact, be reduced in power plants that may be outside the region or even outside the country and thus an evaluation of the effects of the emission reduction with the traditional impact pathway approach (i.e., mainly determining the reduction of impact on human health) becomes impossible. Additionally, since a relevant portion of Italian electricity is still produced by gas-powered plants, with high stacks and far from urban centers, the overall impact of the reduced emissions appears to be relatively low.
The current study just considers some main aspects of the technical potential of regional rooftop PV energy. A more detailed study on the applicability of a PV plan should necessitate a complete life-cycle analysis (LCA), considering all the energy and the emissions from the construction of PV panels and energy storage to their decommissioning several years later. Such an analysis, though roughly feasible, implies several assumptions regarding the necessity and availability of suitable storage, the evolution of energy prices, and related emissions. Even the last term is difficult to assume since it depends on the evolution of the energy mix, which depends precisely on adopting development plans like the one under consideration. A further difficulty is to define a suitable term of comparison: the LCA of existing energy plants is almost impossible since, as already pointed out, it is unclear to which (national and international) power stations it should be referred.
Another important factor that determines the actual implementation of a PV plan is related to the grid issues, including the possible distortions introduced by distributed production plants and their inverters. These and other related problems were studied for instance in the PVupscale, Intelligent Energy Europe project [53], but only with reference to relatively homogeneous urban contexts.

5. Conclusions

The study demonstrates the high potential of using rooftop PV in a complex and highly diverse urbanized context. The urban morphology has been categorized using easily accessible structural data, and this approach allowed extrapolating to the entire region few specific studies on a limited number of municipalities. The extrapolation, based on cluster analysis, may be used to determine the roof surface and electricity consumption, and other interesting characteristics such as the type of heating and the energy mix. All these values are instrumental to develop a regional energy and environment plan by the institutions in charge.
This study just looks at one of the prerequisites to develop such a plan, which is the availability of roof surface and the corresponding solar radiation. These are used to compute a reference energy value and the consequent reductions of air pollutants and GHG emissions. Many other technical and economic factors will play a role in the actual diffusion of rooftop PV systems. Certainly, state incentives had a major role in the recent years, but we believe that the real driver for the extended adoption of PV systems, and renewable energy sources in general, will be the increased consciousness of environmental problems by individuals and society more than a strict economic convenience.

Author Contributions

Conceptualization, G.G.; methodology and software, D.B.; writing, G.G. and D.B. Both authors have read and agreed to the published version of the manuscript.

Funding

This research received no external funding.

Data Availability Statement

All data used in the study are publicly available. The repositories are refenced in the text.

Conflicts of Interest

The authors declare no conflict of interest.

References

  1. Intergovernmental Panel for Climate Change. Summary for Policymakers. Global Warming of 1.5 °C. In An IPCC Special Report on the Impacts of Global Warming of 1.5 °C above Pre-Industrial Levels and Related Global Greenhouse Gas Emission Pathways, in the Context of Strengthening the Global Response to the Threat of Climate Change, Sustainable Development, and Efforts to Eradicate Poverty; IPCC: Geneva, Switzerland, 2018; ISBN 978-92-9169-151-7. [Google Scholar]
  2. European Commission. EU Energy in Figures: Statistical Pocketbook 2018; EC: Luxemburg, 2018; ISBN 978-92-79-88735-2. [Google Scholar]
  3. Falk, J.; Gaffney, O.; Bhowmik, A.K.; Bergmark, P.; Galaz, V.; Gaskell, N.; Henningsson, S.; Höjer, M.; Jacobson, L.; Jónás, K.; et al. Exponential Roadmap 1.5. Future Earth; Exponential Roadmap Initiative: Stockholm, Sweden, 2019. [Google Scholar]
  4. United Nation Department of Economic and Social Affairs, Population Division. World Urbanization Prospect: The 2014 Revision; UN: New York, NY, USA, 2014. [Google Scholar]
  5. United Nation Human Settlements Program. Cities and Climate Change: Policy Directions; UN: New York, NY, USA, 2011. [Google Scholar]
  6. Kammen, D.; Sunter, D. City-integrated renewable energy for urban sustainability. Science 2016, 352, 922–927. [Google Scholar] [CrossRef] [Green Version]
  7. Ekins-Daukes, N.J. Solar Energy for Heat and Electricity: The Potential for Mitigating Climate Change; Briefing Paper N.1; Grantham Institute for Climate Change: London, UK, 2009. [Google Scholar]
  8. Jäger, K.; Isabella, O.; Smets, A.H.M.; van Swaaij, R.A.C.M.M.; Zeman, M. Solar Energy—Fundamentals, Technology and Systems; Delft University of Technology: Delft, The Netherlands, 2014. [Google Scholar]
  9. Jäger-Waldau, A. PV Status Report 2019; EUR 29938 EN; JRC118058; Publications Office of the European Union: Luxembourg, 2019; ISBN 978-92-76-12608-9. [Google Scholar] [CrossRef]
  10. Huld, T.; Amillo, A.M.G. Estimating PV Module Performance over Large Geographical Regions: The Role of Irradiance, Air Temperature, Wind Speed and Solar Spectrum. Energies 2015, 8, 5159–5181. [Google Scholar] [CrossRef] [Green Version]
  11. Hosenuzzaman, M.; Rahim, N.A.; Selvaraj, J.; Malek, A.B.M.A.; Nahar, A. Global prospects, progress, policies, and environmental impact of solar photovoltaic power generation. Renew. Sustain. Energy Rev. 2015, 41, 284–297. [Google Scholar] [CrossRef]
  12. Chow, T.T. A review on photovoltaic/thermal hybrid solar technology. Appl. Energy 2010, 87, 365–379. [Google Scholar] [CrossRef]
  13. Enongene, K.E.; Abanda, E.H.; Otene, I.J.J.; Obi, S.I.; Okafor, C. The potential of solar photovoltaic systems for residential homes in Lagos city of Nigeria. J. Environ. Manag. 2019, 244, 247–256. [Google Scholar] [CrossRef]
  14. Peng, J.; Lu, L. Investigation on the development potential of rooftop PV system in Hong Kong and its environmental benefits. Renew. Sustain. Energy Rev. 2013, 27, 149–162. [Google Scholar] [CrossRef]
  15. Gutschner, M.; Nowak, S.; Ruoss, D.; Toggweiler, P.; Schoen, T. Potential for Building Integrated Photovoltaics. 2002. Available online: https://iea-pvps.org/wp-content/uploads/2020/01/rep7_04.pdf (accessed on 19 June 2021).
  16. Hong, T.; Leee, M.; Koo, C.; Jeong, K.; Kim, J. Development of method for estimating the rooftop solar PV potential by analyzing the available rooftop area using Hillshade analysis. Appl. Energy 2017, 194, 320–332. [Google Scholar] [CrossRef]
  17. Hofierka, J.; Kanuk, J. Assessment of photovoltaic potential in urban area using open-sorce solar radiation tools. Renew. Energy 2009, 34, 2206–2214. [Google Scholar] [CrossRef]
  18. Bergamasco, L.; Asinari, P. Scalable methodology for the photovoltaic solar energy potential assessment based on available roof surface area: Further improvements by otho-image analysis and application to Turin (Italy). Sol. Energy 2011, 85, 2741–2756. [Google Scholar] [CrossRef] [Green Version]
  19. Brito, M.C.; Gomes, N.; Santos, T.; Tenedorio, J.A. Photovoltaic potential in a Lisbon suburb using LiDAR data. Sol. Energy 2012, 86, 283–288. [Google Scholar] [CrossRef]
  20. Jakubiec, J.A.; Reinhart, C.F. A method for predicting city-wide electirsity ganes from photovoltaic panels based on LiDAR and GIS data combined with hourly Daysim simulations. Sol. Energy 2013, 93, 127–143. [Google Scholar] [CrossRef]
  21. Kodysh, J.B.; Omitaomu, O.A.; Bhaduri, B.L.; Neish, B.S. Methodology for estimating solar potential on multiple building rooftops for photovoltaic systems. Sustain. Cities Soc. 2013, 8, 31–41. [Google Scholar] [CrossRef]
  22. Miranda, R.F.C.; Szklo, A.; Schaeffer, R. Techinical-economic potential of PV system on brazilian rooftops. Renew. Energy 2015, 75, 694–713. [Google Scholar] [CrossRef]
  23. Rosas-Flores, J.A.; Zenon-Olvera, E.; Galvez, D.M. Potential energy saving in urban and rural households of Mexico with solar photovoltaic system using geographical information system. Renew. Sustain. Energy Rev. 2019, 116, 109412. [Google Scholar] [CrossRef]
  24. Bodis, K.; Kougias, I.; Jager-Waldau, A.; Taylor, N.; Szabo, S. A high-resolution geospatial assessment of the rooftop solar photovoltaic potential in the European Union. Renew. Sustain. Energy Rev. 2019, 114, 109309. [Google Scholar] [CrossRef]
  25. Mangiante, M.J.; Whung, P.; Zhou, L.; Porter, R.; Cepada, A.; Campirano, E.J.; Lincon, D.J.; Lawrence, R.; Torres, M. Economic and technical assessment of rooftop solar photovoltaic potential in Brownsville, Texas, USA. Comput. Environ. Urban Syst. 2020, 80, 101450. [Google Scholar] [CrossRef]
  26. Muller, J.; Trutnevyte, E. Spatial projections of solar PV installations at subnational level: Accuracy testing of regression models. Appl. Energy 2020, 265, 114747. [Google Scholar] [CrossRef]
  27. Zhang, Y.; Ren, J.; Pu, Y.; Wang, P. Solar energy potential assessment: A framework to integrate geographic, technological and economic indices for a potential analysis. Renew. Energy 2020, 149, 577–586. [Google Scholar] [CrossRef]
  28. Ruiz, P.; Nijs, W.; Tarvydas, D.; Sgobbi, A.; Zucker, A.; Pilli, R.; Jonsson, R.; Camia, A.; Thiel, C.; Hoyer-Klick, C.; et al. ENSPRESO—An open, EU-28 wide, transparent and coherent database of wind, solar and biomass energy potentials. Energy Strategy Rev. 2019, 26, 100379. [Google Scholar] [CrossRef]
  29. Castellanos, S.; Sunter, D.; Kammen, D. Rooftop solar photovoltaic potential in cities: How scalable are assessment approach? Environ. Res. Lett. 2017, 12, 125005. [Google Scholar] [CrossRef]
  30. ENEA. Rapporto Annuale Efficienza Energetica—Analisi e risultati delle policy di efficienza energetica del nostro Paese. In Agenzia Nazionale per le Nuove Tecnologie, l’energia e lo Sviluppo Economico Sostenibile; ENEA: Rome, Italy, 2019; ISBN 978-88-8286-382-2019. (In Italian) [Google Scholar]
  31. Regione Lombardia. Programma Energetico Ambientale Regionale (PEAR). Available online: https://regione.lombardia.it (accessed on 23 May 2020). (In Italian).
  32. PVGIS. Photovoltaic Geographical Information System. 2017. Available online: https://ec.europa.eu/jrc/en/pvgis (accessed on 23 March 2021).
  33. DUSAF. Destination of Agricultural and Forest Land Use, Geoportale Lombardia—Download Dati. Available online: http://www.geoportale.regione.lombardia.it (accessed on 1 December 2019).
  34. CENED. Available online: http://www.cened.it/opendata-cened-2.0 (accessed on 20 February 2020).
  35. Guariso, G.; Sangiorgio, M. Multi-objective planning of building stock renovation. Energy Policy 2019, 130, 101–110. [Google Scholar] [CrossRef]
  36. ISTAT. Censimento Popolazione e Abitazioni 2011. Available online: http://dati-censimentopopolazione.istat.it/Index.aspx (accessed on 2 December 2020).
  37. ISTAT. Censimento Agricoltura 2010. Available online: http://dati-censimentoagricoltura.istat.it/Index.aspx (accessed on 1 December 2019).
  38. ISTAT. Statistiche Annuali. Available online: http://dati.istat.it (accessed on 2 December 2020).
  39. Kassambara, A. Practical Guide to Cluster Analysis in R—Unsupervised Machine Learning. 2017. Available online: http://www.stdha.com (accessed on 6 June 2021).
  40. EPISCOPE e TABULA Online Webtool 2018. Available online: http://webtool.building-typology.eu (accessed on 10 February 2020).
  41. Corrado, V.; Ballarini, I.; Corgnati, S.P. Building Typology Brochure—Italy. In Fascicolo Sulla Tipologia Edilizia Italiana; Politecnico di Torino: Torino, Italy, 2014; ISBN 978-88-8202-065-1. [Google Scholar]
  42. Corrado, V.; Ballarini, I.; Corgnati, S.P.; Talà, N. National Scientific Report on the TABULA Activities in Italy; Politecnico di Torino: Torino, Italy, 2012; ISBN 978-88-8202-039-2. [Google Scholar]
  43. DBTR. Database Topografico Regionale, Geoportale Lombardia—Download Dati. Available online: http://www.geoportale.regione.lombardia.it (accessed on 20 December 2019). (In Italian).
  44. ENEA. Progettare e Installare un Impianto Fotovoltaico; ENEA: Rome, Italy, 2008. (In Italian)
  45. GSE. Statistiche Regionali 2019; Gestore Servizi Energetici: Rome, Italy, 2020. (In Italian) [Google Scholar]
  46. Agrillo, A.; Surace, V.; Liberatore, P. Rapporto Statistico—Solare Fotovoltaico 2019; GSE: Rome, Italy, 2020. (In Italian) [Google Scholar]
  47. ISPRA. Emissioni Nazionali di gas Serra: Indicatori di Efficienza e Decarbonizzazione nei Principali Paesi Europei; Rapporti 295/2018; ISPRA: Rome, Italy, 2018; ISBN 978-88-448-0914-0. (In Italian)
  48. ISPRA. Fattori di Emissione Atmosferica di Gas a Effetto Serra nel Settore Elettrico Nazionale e nei Principali Paesi Europei; Rapporti 303/2019; ISPRA: Rome, Italy, 2019; ISBN 978-88-448-0945-4. (In Italian)
  49. INEMAR. Inventario Emissioni Aria. 2018. Available online: http://www.inemar.eu (accessed on 6 March 2020). (In Italian).
  50. SIRENA. Sistema Informativo Regionale ENergia Ambiente. 2018. Available online: http://sirena20.energialombardia.eu (accessed on 6 March 2020).
  51. TERNA. Contesto ed Evoluzione del Sistema Elettrico; TERNA: Rome, Italy, 2019. (In Italian) [Google Scholar]
  52. EMBER. EUA (EU ETS) Futures Price. 2021. Available online: https://ember-climate.org/data/carbon-price-viewer/ (accessed on 16 June 2021).
  53. PV Upscale—Urban Scale Photovoltaic Systems. Intelligent Energy Europe. Available online: https://pvupscale.org (accessed on 20 June 2021).
Figure 1. Municipalities of the Lombardy region: colors represent the density of the population in their urban area calculated from regional land use [33] and census [34] data.
Energies 14 03687 g001
Figure 2. Lombardy’s municipalities characteristics: the histograms represent the distribution of the elevation of the urban centers (a); of the number of buildings (b), of the number of residents per building (a) proxy of the building size (c), and of the average building age (d).
Energies 14 03687 g002
Figure 3. Explained variance of the PCs (a) and municipalities’ data in the space of the first two PCs (b).
Energies 14 03687 g003
Figure 4. The first step of clustering in the space of the first two PCs (a) and as a dendrogram (b).
Energies 14 03687 g004aEnergies 14 03687 g004b
Figure 5. Geographical output of the cluster analysis with 7 clusters and the regional capital of Milan (cluster 8).
Energies 14 03687 g005
Table 1. Correlation between the structural variables of the municipalities.
PopulationAltitudeLand AreaUrban AreaDensityClass 1Class 2Class 3Class 5Class 9Class 16
POPULATION1
ALTITUDE−0.061
LAND AREA0.270.221
URBAN AREA0.91−0.160.391
DENSITY0.31−0.06−0.120.301
CLASS 10.47−0.130.430.680.241
CLASS 20.48−0.130.380.730.390.861
CLASS 30.66−0.040.400.830.440.730.901
CLASS 50.88−0.060.350.940.390.630.730.901
CLASS 90.98−0.050.290.930.320.510.540.730.931
CLASS 160.99−0.030.250.860.250.380.370.570.820.961
Table 2. Summary of cluster characteristics. Average values of cluster features and the total output values of residential rooftop surface and as percentage of the land surface.
PopulationAltitudeLand SurfaceDensity over Urban AreaBuildings Class 1Buildings Class 3Residential RooftopPV Area over Land Area
[inh] [m a.s.l.][km2] [inh/km2] ##[km2] %
CLUSTER 1193011513.6212762795737.670.4%
CLUSTER 245062617.88257129113180.561.3%
CLUSTER 310,50116238.351994101331434.260.2%
CLUSTER 496175718.1417042519210.960.1%
CLUSTER 517,2121999.32454053931245.721.1%
CLUSTER 628941058122.6915504553123.180.02%
CLUSTER 766,15517539.1939802836116237.551.0%
Table 3. Energy balance of the residential sector at the cluster level.
PV Production
[TWH]
Consumption
[TWH]
Coverage
%
CLUSTER 11.860.95196%
CLUSTER 23.883.42113%
CLUSTER 31.642.0281%
CLUSTER 40.520.25208%
CLUSTER 52.212.5985%
CLUSTER 60.150.06237%
CLUSTER 71.832.0191%
TOTAL12.1111.46
Table 4. Emission factors and total reduced emissions for the main pollutants of Italian power plants.
Emission Factors
[MG/KWH]
Emissions Reduction
[TON]
NITROGEN OXIDESNOx227.42752.8
SULFUR OXIDESSOx63.6769.9
NON-METHANE VOLATILE ORGANIC COMPOUNDSNMVOC83.81014.4
AMMONIANH30.56.05
PARTICULATE MATTERPM105.465.4
Publisher’s Note: MDPI stays neutral with regard to jurisdictional claims in published maps and institutional affiliations.

