1. Introduction
Climate change is one of the most important challenges today. To stay below 2 °C of warming, the target agreed by countries in the Paris agreement, global carbon emissions need to decrease as fast as possible. Transport must have a key role in this decarbonisation effort, as it accounts for 24% of the world’s carbon emissions from fossil fuels [
1]. For this reason, a fast and radical shift towards sustainable modes of transport is needed, with a decrease in energy consumption and emissions, and a shift from private cars to more efficient forms of transport [
2,
3,
4].
At the same time, the electricity sector would also need to rapidly decarbonise by deploying renewable energy at an unprecedented scale. All 2 °C pathways target over 50% penetration of renewable energy in the world’s electricity grids by 2050, and some up to 85% [
2] or 100% [
4]. In all these scenarios, the majority of renewable energy would come from solar and wind power. Reaching this level of penetration of intermittent energy sources will require vast increases in grid storage and demand response. The electrified transport sector will play a central role in this context, given its higher flexibility (thanks to the batteries in each vehicle) and its scale of electricity consumption. On the other hand, uncoordinated EV charging may reduce grid stability; increase grid congestion and peak load; and increase grid costs and carbon emissions.
Shared forms of transport, such as car-sharing and ride-hailing, are particularly promising for the decarbonisation of the sector, since their centralised control could speed up electrification and simplify their coordinated charging. Electrified shared transportation would also have a large positive impact on urban mobility, liveability, and sustainability. This is because these forms of on-demand transport can be one of the options in a more multi-modal and sustainable mobility system, enabling a wider use of public transport, electric micromobility, cycling, and walking. In fact, many people today are forced to buy cars just to serve their mobility needs (e.g., for longer trips or trips to locations not served by public transport). If these trips can be served by on-demand mobility, car ownership would not be necessary for most people.
On-demand transport could become more popular with the introduction of autonomous driving, which would make ride-hailing much cheaper. This would speed up its adoption in the form of autonomous taxis [
5], also known as shared autonomous electric vehicles (SAEVs). Ride-hailing services with completely autonomous vehicles are already commercially operated by Waymo in Phoenix, United States [
6], and by Autox in Shenzhen, China [
7]. The introduction of SAEVs has also other benefits, such as reducing parking needs, emissions, noise, and waste associated with private vehicles’ production and disposal.
In summary, the future integration of the transport sector (in the form of SAEV) with the electricity grid is essential to enable a shift to renewable energy sources and to avoid the enormous costs associated with uncoordinated charging. In this work, we present a flexible, practical, and scalable framework for the operation of shared autonomous vehicle fleets with charging optimisation and vehicle-to-grid (V2G) service. The framework includes a SAEV simulation model, a relocation optimisation module, and a charging and discharging optimisation module based on electricity price and/or carbon emissions. We present extensive results with large real-world datasets that demonstrate the potential for this system to reduce costs and emissions, while implicitly balancing intermittent renewables. The modules presented here are “plug and play”, and can be adapted to more complex simulations or to real-world operations.
The rest of the work is organised as follows. In
Section 2 we briefly summarise the relevant related literature. In
Section 3 we describe the proposed methodology. In
Section 5 we compare the proposed model with a benchmark and we test it with a case study based on New York data. In
Section 6 we discuss our conclusions and future work.
2. Related Work
There is extensive literature on the sustainable implementation of shared autonomous electric mobility, and on the various operational and planning challenges of these systems, such as fleet sizing, trip dispatching, vehicle rebalancing, and charging scheduling. Here we discuss the most relevant previous studies, and we highlight the main differences with the solution provided in this work.
2.1. SAEVs in the Context of Sustainable Cities
Shared autonomous electric vehicles with scheduled charging are part of the wider trend towards smart mobility and sustainable cities, allowing more efficient, clean, and multi-modal transportation as opposed to private cars [
8,
9]. Studies also show that electrified mobility can be effectively coupled with sustainable energy in realistic scenarios [
10]. One of the issues related to the introduction of autonomous vehicles is their interaction with normal traffic. This issue is explored in [
11], finding that autonomous vehicles may actually increase road capacity when managed efficiently.
2.2. Fleet Rebalancing
One line of related work focuses on the design of proactive fleet rebalancing schemes for shared mobility systems, namely, vehicle dispatching algorithms that attempt to satisfy the expected trip requests [
12,
13]. In [
14], a model for predictive control based on a mixed-integer linear program (MILP) was used for optimal routing and relocation of autonomous vehicles. An alternative fluid-based approach was proposed in [
15], which models the SAEV system as an abstract queuing network. In [
16] we have also proposed a modular and multi-stage approach for fleet rebalancing in car-sharing systems that is highly scalable and robust against demand uncertainty. However, the solution in [
16] does not account for electric vehicles.
2.3. Charging Optimisation of Shared Fleets
Most of the research focusing on the optimisation of the recharging processes of electric vehicles targets private vehicles [
17,
18,
19]. However, as the critical issue of energy demand due to vehicle dispatching is not considered in these existing methods, they are not applicable to SAEVs. Another line of work that is orthogonal to our paper focuses on planning and investment decisions for SAEV systems, such as charging station positioning and vehicle battery sizing [
20,
21,
22,
23,
24]. Among them, [
21,
25] built a multi-agent simulation framework to calculate the battery capacities and number of charging stations to satisfy the requirements of demanded trips, using the same trip data from the city of New York that we used in the present study.
Less attention has been paid to the joint optimal routing and charging problem for SAEVs with dynamic electricity pricing. For instance, [
14] introduced charging constraints when modelling the rebalancing of SAEVs under the assumption that vehicles recharge at a fixed and constant rate independently of the power grid conditions. A review of the research on the integration of SAEVs with the power grid is presented in [
26], which highlights smart charging strategies as one of the major interaction points. A comprehensive mathematical model is proposed in [
27] to minimise the electricity cost of autonomous electric vehicles, the degradation of the charging station batteries, and the user dissatisfaction due to additional delay with the constraint of satisfying a given demand for V2G services. This work assumes that vehicles stop during ongoing trips at intermediate charging stations for recharging, whereas in this study we assumed that charging occurs only at the end of a trip without causing any discomfort to passengers, as detouring was not allowed. The same assumption of in-route charging was also adopted in [
28,
29].
A simulation model and a heuristic-based charging strategy based on electricity price signals from the grid are described in [
30] for a SAEV system that also provides power grid services (operating reserve). However, this model does not consider proactive relocation. The work in [
31] also considers optimised SAEV charging in the context of a virtual power plant, but only considers aggregate charging and relocation requirements, without explicitly solving the charging and routing problem for each vehicle. A preliminary model for the joint optimisation of routing, relocation, and charging with V2G services was developed in [
32]. Specifically, two model-predictive control optimisation algorithms are solved in parallel: the first one solves the charging problem over longer time scales with the goal of minimising electricity costs; and the second one solves the routing and relocation problems at shorter time scales to minimise waiting times, with the results of the long-time-scale optimisation as charging constraints. However, the computational complexity of this formulation limits the feasibility to relatively small systems. In our previous work [
33] we extended the approach of [
32] by using an aggregation procedure at the charging layer to cope with the dimensionality of the operational problem.
In [
34], an optimal SAEV dispatch method during power outages was presented. They found that grid services can become a large source of revenue for a SAEV system during extreme grid outage events. The work in [
35] presents a queueing theoretical approach to charge scheduling in one-way car-sharing systems. The impacts and integration of SAEVs with grid distribution networks were analysed in [
36]. The work in [
37] is also an extension of [
15,
32] to incorporate more realistic grid constraints and passenger behaviour. While the proposed model still relies on a MILP optimisation, they also developed a myopic version of the method to deal with larger problem sizes. They presented results for a fleet of 500 to 5000 vehicles with 12 nodes and 5 charging hubs.
2.4. Contributions
In this work, we propose a new integrated simulation and optimisation framework which is robust to uncertainty and scalable to very large systems.
We developed a new simulation model for a SAEV system which periodically optimises relocation and charging. We integrated into the simulation the relocation optimisation we developed in [
16], generalising it to electric vehicles. The simulation model also includes a charging optimisation model. This model is a generalisation and improvement of the charging policy described in [
33]. Specifically, we adopted a more accurate and realistic estimation of the total distance covered by relation trips, which accounts for a maximum length of individual relocation trips. We also formulated a more robust charging optimisation problem that can deal with cases of low energy availability. These cases are common in practice (for example, during days of high transport demand), so this extension is essential to obtain more realistic results.
To integrate these optimisation models, we have developed new algorithms for assigning vehicles to relocation tasks and passengers which allow one to effectively decouple the problems and lead to a far more tractable solution.
To the best of our knowledge, this is one of the first large scale SAEV simulation studies to incorporate smart charging optimisation and to present extensive simulation results with real data on a large scale system with optimised charging with V2G and dynamic electricity prices.
3. Optimisation Modules
We consider an autonomous mobility on demand (AMoD) service using a fleet of V electric vehicles. We partition the operational area of the system into regions, and we cluster the origin/destination points of trips within each region into its centroid (or node). We assume that each node has a charging station with unlimited capacity. The transportation demand is modelled as a set of tuples representing a trip starting at time from origin node i to destination node j.
We aim to optimise the routing, relocation, and charging of the fleet of SAEVs to provide the lowest waiting times to passengers while minimising charging costs considering a time-varying cost of electricity. A challenge is that the charging and relocation processes have very different time requirements. Electric vehicle charging typically needs to be optimised over control horizons of several hours due to: (i) relatively slow variability in electricity demand and energy production of renewable sources, such as wind and solar, for which the natural time frames of variability can be several hours; and (ii) short charging and discharging phases can cause battery degradation and inefficiencies. On the other hand, vehicle relocation for fleet rebalancing is generally optimised with a horizon of 15–30 min [
14,
38] because the average duration of car-sharing trips is usually shorter than 30 min [
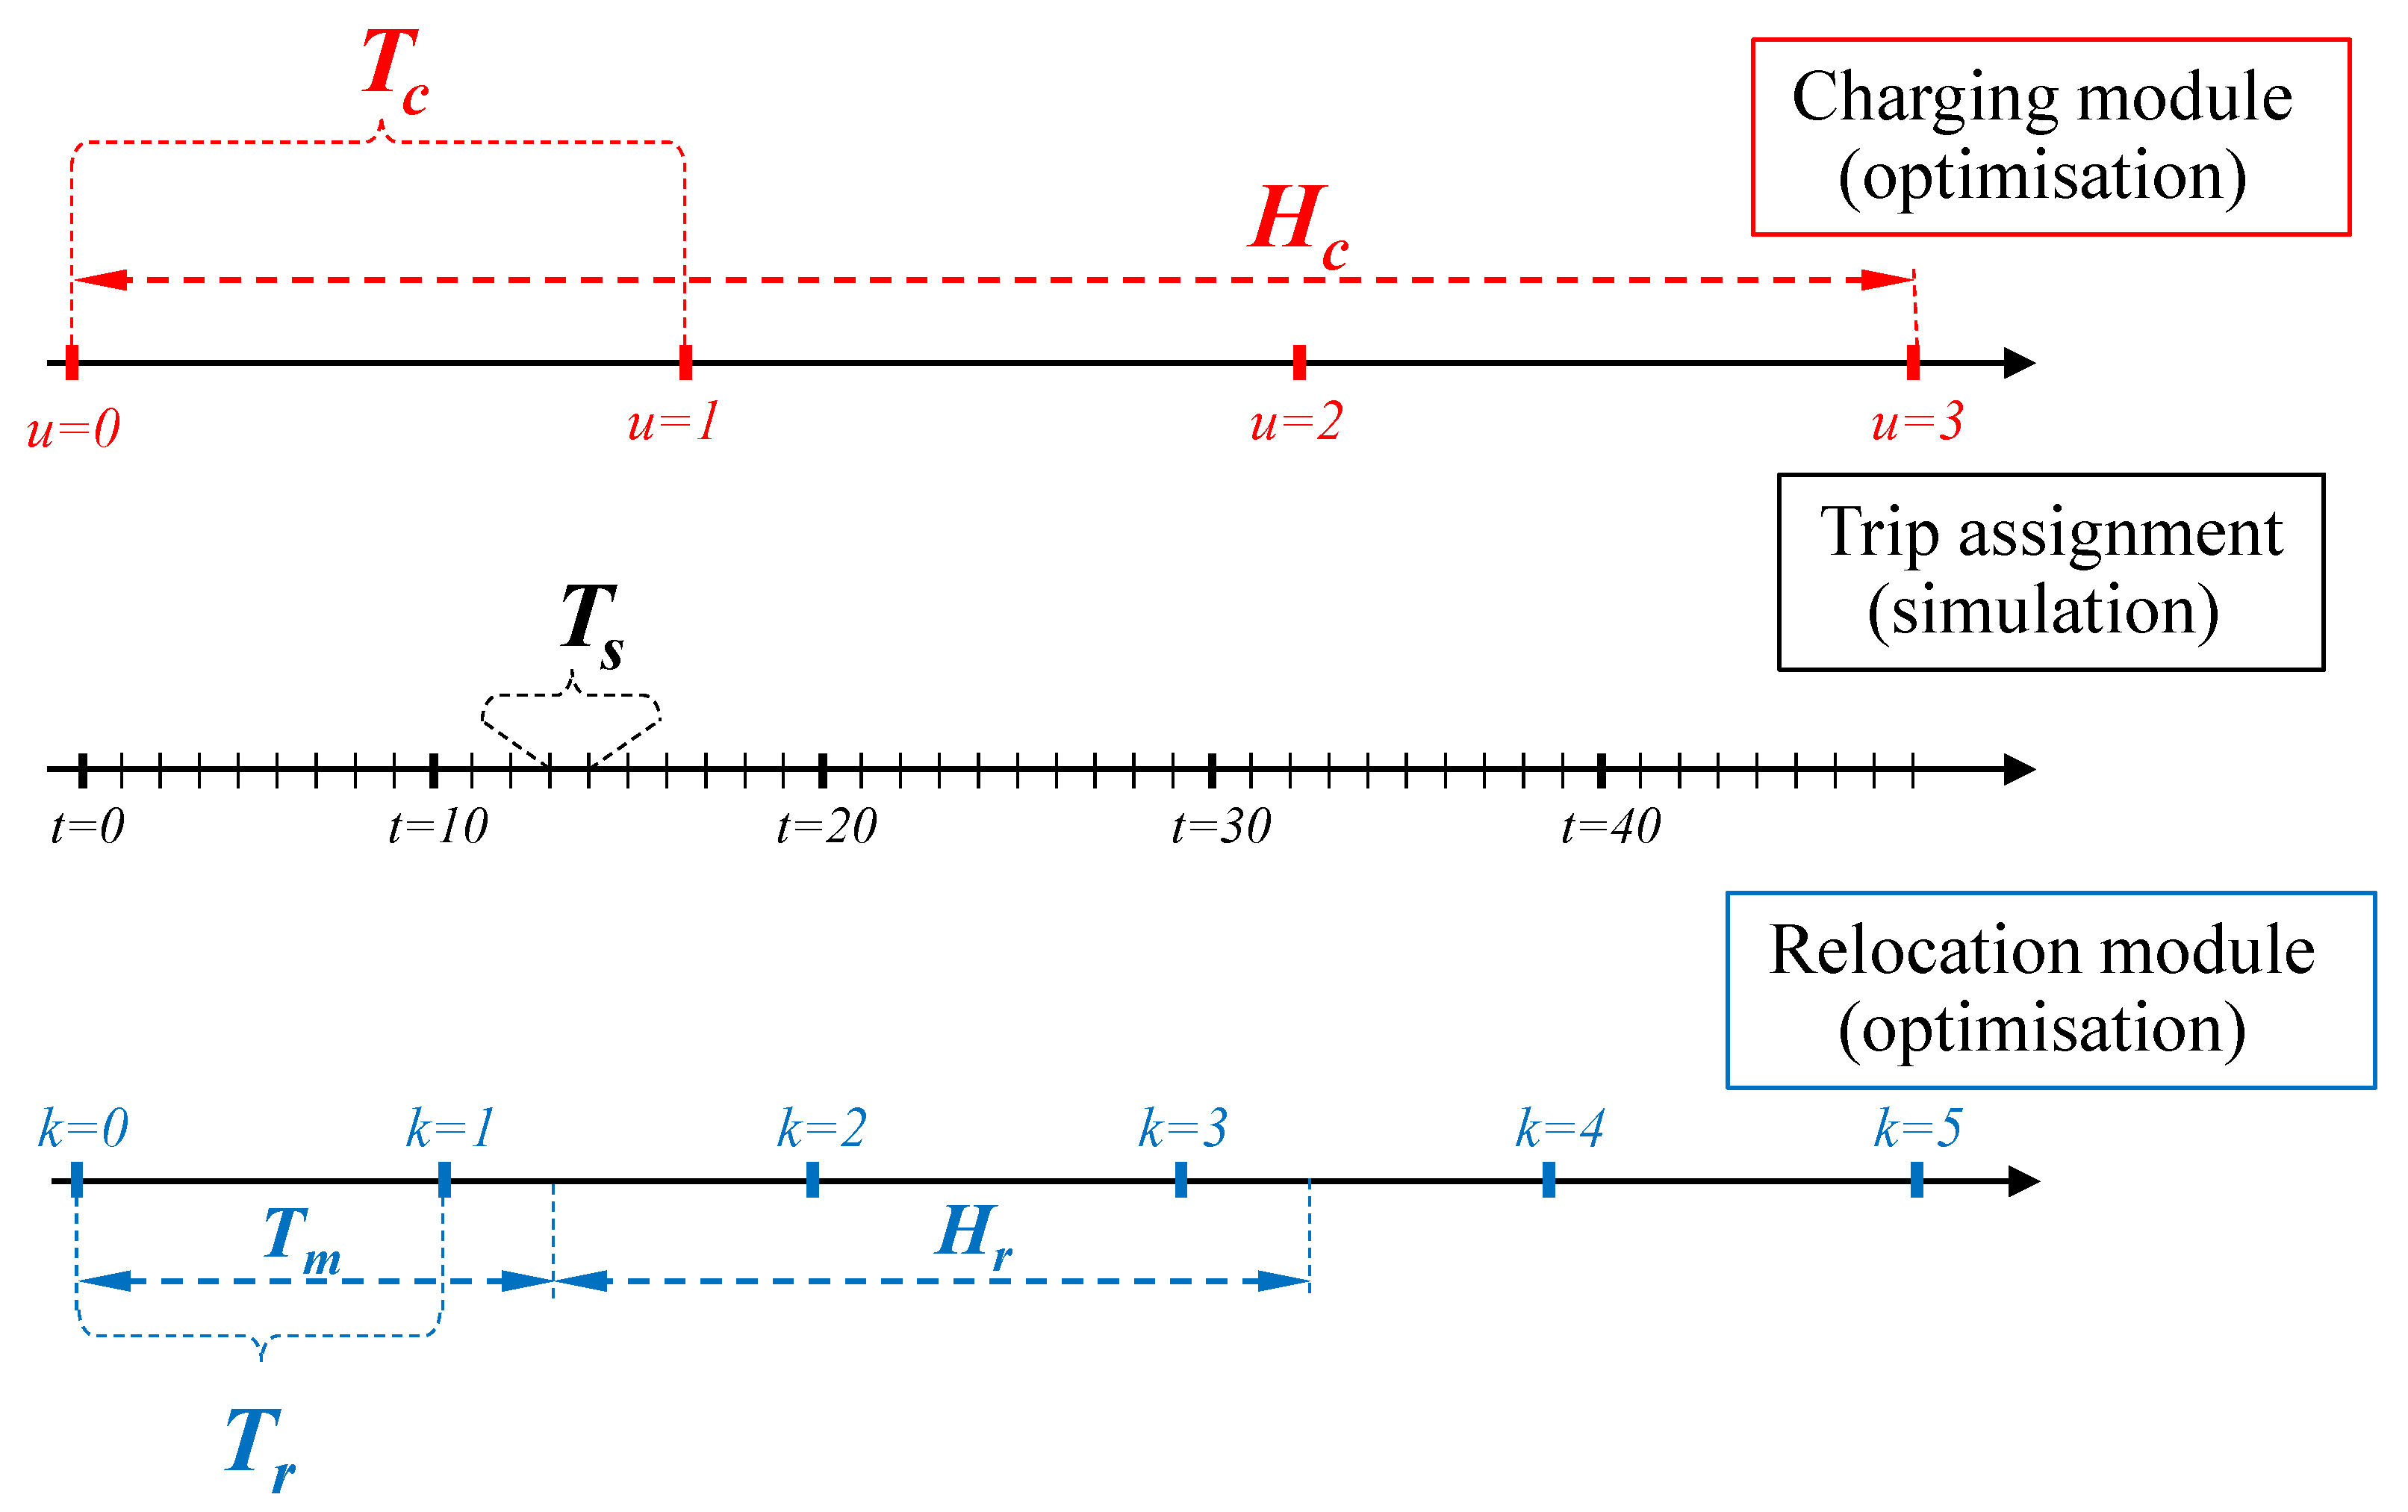
39]. To cope with modelling complexity, our framework decouples the original problem into three separate sub-problems: (1) charging decisions; (2) relocation decisions; and (3) assignment of vehicles to passengers and relocation tasks. Each of these problems adopts a different timeline, with a higher time resolution for vehicle assignment and lower time resolutions for charging and relocation. The different sub-problems only exchange input and output variables through well-defined interfaces at specific synchronisation time instants.
Figure 1 presents an outline of the different timelines used in our framework. The notation will be explained in the following sections. A summary of the notation can also be found in
Table 1.
Another challenge is that the joint problem is intrinsically nonlinear and non-convex, which makes it very difficult or impossible to find a global optimal solution with online, real-time algorithms for relevant problem sizes. To cope with such model complexity, we leverage a hierarchical aggregation model for state variables (such as battery state of charge) so that control modules with lower time resolution use simplified representations of those state variables, and the effects of more complex dynamics are taken into account by the simulation model.
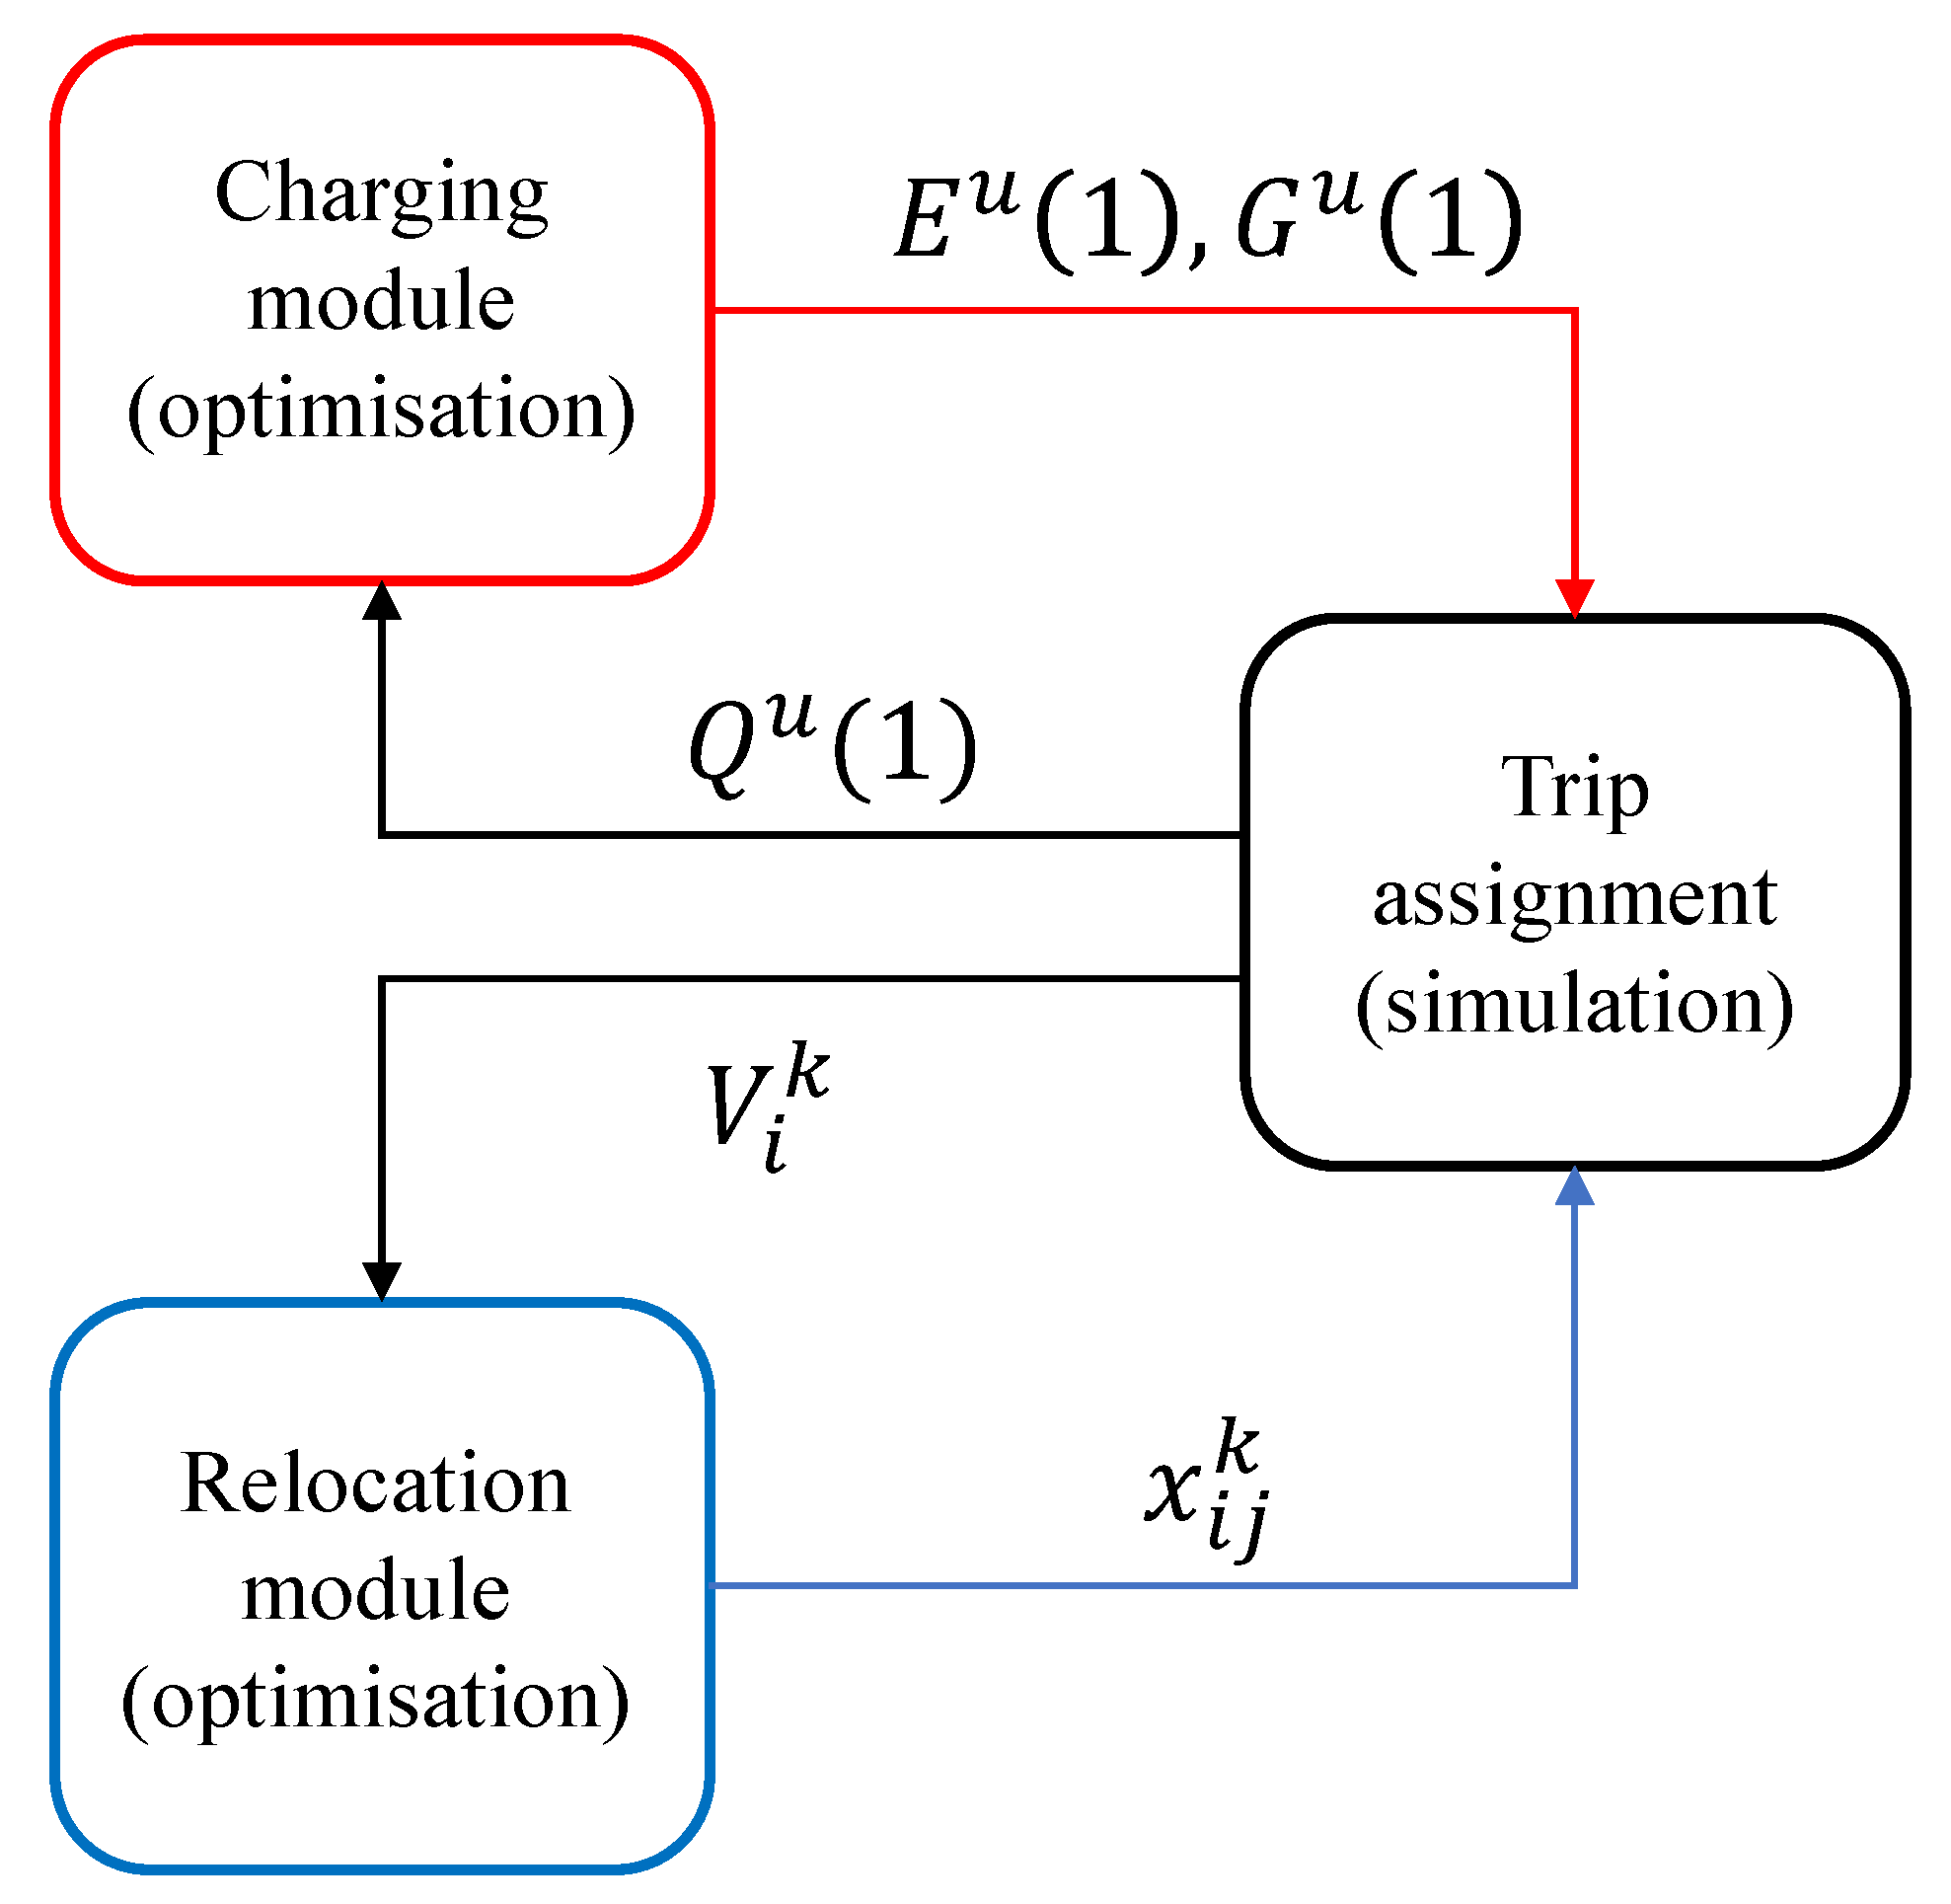
Figure 2 shows the interfaces between the framework components and the input/output variables that they exchange, and
Figure 3 is a simplified flowchart of the framework. In the following sections, we present the design and algorithms of each module in detail.
3.1. Relocation Optimisation Module
The relocation optimisation module is invoked by the simulation model with a period
(i.e., every
time steps). We denote with
k the sequence number of each execution of the relocation module. We use a relocation algorithm from our previous work [
16]. The algorithm consists of two steps. In the first step, we calculate the expected vehicle imbalance between nodes during a future interval. In the second step, we find the best vehicle routing that eliminates or reduces the imbalance while minimising distances travelled by vehicles during relocation operations. We use a “worst-case” estimate of vehicle imbalance, which is the most robust and requires the least prior information, while showing good performance. For details on the relocation algorithm, refer to [
16].
3.2. Charging Optimisation Module
The charging module implements a model predictive control (MPC) method to optimise the charging process. MPC is a control scheme based on an iterative solution of a constrained optimisation problem over a finite horizon. The module is invoked periodically by the simulation with a period
(i.e., every
simulation time steps). We denote with
u each sequential module invocation. This module solves an optimisation problem over the control horizon, which consists of
time intervals of duration
(see
Figure 1). Each of these time intervals is indexed using
m (with
).
We assume that the charging process can be approximated using the aggregate state of charge (SoC) of the fleet of SAEVs. We denote with the total energy that is stored in the SAEVs’ batteries at time . Then, we compute a cost-minimising control strategy for the future interval , with the optimisation horizon.
The decision variables of the optimisation are: (1)
, the total amount of energy that is used (bought) by the fleet during the
m-th time interval to charge their batteries, and (2)
, the total amount of energy that is transferred (sold) by the fleet to the grid. We assume that the electricity price
(
$/kWh) is constant during the
m-th time interval of the control horizon. The charging module determines the total flows of energy that should be exchanged by the fleet and the power grid. The simulation model is then tasked with translating this aggregate variables into energy exchanges of individual vehicles on a far finer time scale (see
Section 4.4).
The following sections describe the operation of the charging module during each module call u; therefore, we omit superscript u for notation readability and to avoid ambiguity.
3.2.1. Estimates of Travelled Distance and Vehicle Utilisation
To understand how much energy is needed by vehicles, and how many vehicles are available to charge, we need approximate estimates of vehicle travel time and utilisation. Vehicles can move either to transport passengers or to relocate. In principle, to determine the exact distance that vehicles shall travel during each time interval, we need accurate predictions of the routing and relocation activities up to the planning horizon. This is generally computationally prohibitive and subject to large uncertainties. For this reason, we use an approximate estimate of the relocation distance needed, using an algorithm inspired by Problem 1 described in [
16]. We recall that the formulation in [
16] is only valid for vehicles that are allowed to drive an unlimited distance. Thus, it is not readily applicable to electric vehicles.
We modify the problem to express the approximate total travel time that must be travelled by vehicles for relocation operations during the
m-th time interval as follows (we omit the index
m common to all variables):
The objective function (Equation (
1)) maximises the total relocated vehicles, giving priority to relocation actions between close nodes. The decision variable
is the number of vehicles that should be relocated from
i to
j.
is the travel time between nodes and
is the maximum allowed time for relocation. A travel time between nodes
i and
j higher than
would make the corresponding coefficient for
negative; thus,
would be set to zero. Equation (
2) constraints the total number of vehicles to be relocated from nodes with positive imbalances to be lower than the imbalances at said nodes. Similarly, Equation (
3) sets a limit on the total vehicles relocated to a node with a negative imbalance to be less or equal than the absolute imbalance. Constraint (
4) ensures no vehicles are relocated from nodes with negative imbalances. Equation (
5) is an estimate of the imbalance in each time interval, with
and
being the expected number of passengers arriving to and leaving from node
i during time interval
m, respectively. Equation (
6) is the total distance travelled by vehicles for relocation.
The equality constraint (
7) determines the maximum exchangeable energy during interval
m as the difference between the total available time (calculated as fleet size
V times the period length
) and the total travel time for passenger trips (denoted by
) and for relocation. The term in parentheses represents the total time during which vehicles are neither serving passengers nor relocating; thus, we assume that the vehicle is parked at a station and potentially connected to the power grid.
is the charging/discharging rate of each vehicle (kW). The problem in (
1)–(
8) is a convex mixed-integer linear problem (MILP), which can be solved relatively easily with MILP solvers such as MATLAB’s built-in
intlinprog function, which was used in our implementation. This formulation requires the assumption that trip requests are uniformly distributed during the period, which is generally a reasonable assumption for large systems and for periods that are not too long (e.g., half an hour).
3.2.2. Charging Optimisation Formulation
Once we have calculated the maximum exchangeable energy
during each period
m of the charging optimisation horizon, we can formulate the charging optimisation as follows:
The objective Function (
9) minimises the charging cost over the optimisation horizon, including the costs associated with carbon emissions and the battery cycling costs. The constant
M in the last term of (
9) is a big enough value to ensure that vehicles have as much charge as possible at the end of the optimisation horizon while not enforcing a minimum SoC. This is necessary to avoid the charging policy completely depleting the batteries at the end of the optimisation horizon. Equation (
10) defines the evolution of the energy stored in the equivalent virtual battery formed by the aggregate fleet. Constraint (
11) enforces the minimum and maximum SoC.
B is the battery capacity of an individual vehicle (assumed equal for each SAEV). Since the charging module uses aggregate and average variables, a constant
is added to the
value to reduce the probability of energy under-provisioning. Equations (12) and (13) set the charging and V2G discharging limits. The problem in (
9)–(
14) is a convex linear optimisation problem that can be solved easily with linear solvers such as MATLAB’s built-in
linprog function, which was used in our implementation.
Once the optimal charging and discharging control policies are found, the charging module passes only the first values of the computed control sequences (
and
) to the simulation model. These values are used by the simulation model as constraints to control the amounts of energy to transfer between individual vehicles and the grid (Equations (
19) and (
20)). For the details of the module integration with the simulation, refer to
Section 4.4 and
Figure 2.
4. Simulation Model
The simulation model adopts a discretised time with a short time step of
minutes, and we use index
t to refer to each of the time steps sequentially (
Figure 1).
The simulation keeps track of each vehicle’s state of charge (SoC), its final destination, the current distance to this final destination, and the current status (charging, moving, or idle). It also periodically exchanges information with the charging and relocation optimisation modules (
Figure 2).
4.1. Vehicle Assignment to Relocation Tasks
We relocate vehicles based on the plan formulated by the relocation module (
Section 3.1). The module only specifies the total number of vehicles to relocate between each node, so we use Algorithm 1 to decide which specific vehicles to relocate among those available at the node. On Line 5 we create the set of vehicles that can perform the relocation. These each need to satisfy three conditions: (1) the final destination
is the relocation start node
i; (2) the travel time to destination
plus the expected relocation travel time
is individually less than the maximum relocation travel time
; and (3) the SoC is enough to complete the total trip. While there are still relocation tasks to perform between the considered origin and destination, we assign the available vehicle with the highest SoC (to have a lower dispersion of the SoC across the fleet) to the task by updating its final destination and the travel time to final destination. Finally, we remove the vehicle from the pool of available vehicles and we decrease the outstanding relocation tasks by 1. If there are no vehicles available we exit the while loop and we proceed to consider the next destination
j.
| Algorithm 1 Assignment of vehicles to relocation tasks for k-th call to relocation module. |
- 1:
all variables are for time - 2:
for each node i do - 3:
for each j, ordered by longest , do - 4:
- 5:
- 6:
while do - 7:
if then - 8:
select - 9:
- 10:
- 11:
- 12:
- 13:
else - 14:
break - 15:
end if - 16:
end while - 17:
end for - 18:
end for
|
4.2. Vehicle Assignment to Passengers
The trip assignment algorithm is reported in Algorithm 2. We define the set of passenger trip requests to satisfy at time t as . The set includes all the requests arriving during period , and any leftover requests that were unsatisfied at . We remind the reader that each request is defined by a tuple indicating the time of request, the origin, and the destination. We denote each request with . On Line 3 we define the set of vehicles that have enough charge for the specific trip request. For each of these, in Line 6 we define a priority level , and we assign the request to the vehicle with the lowest . Since is always an integer (representing travel time in number of time steps), and , the closest vehicle is always preferred. Given the same travel time, vehicles not connected to the grid are always preferred (since ). Additionally, all else being equal, we select the vehicle with the highest SoC. In line 11 we calculate the waiting time for the satisfied request as the difference between the current time and the request start time plus the time to pick-up. If there are no vehicles with enough SoC to satisfy the request, the request is added to the set of requests for the next time step.
This assignment algorithm always respects the order of trip requests (first-come first-served assignment) unless there is no suitable vehicle available. This strategy is generally considered the most fair, and is also adopted by ride-hailing services such as Uber [
40].
| Algorithm 2 Assignment of vehicles to trip requests at time step t. |
- 1:
for each , ordered by do - 2:
- 3:
- 4:
if then - 5:
for each do - 6:
- 7:
end for - 8:
select vehicle with lowest - 9:
- 10:
- 11:
- 12:
else - 13:
- 14:
end if - 15:
- 16:
end for
|
4.3. Vehicle Status Update
After the assignment, we calculate the travel time to the destination for each vehicle for the next time step:
We also define the states of vehicles as:
and
are state (binary) variables denoting whether vehicle
v is connected to a charging station or moving during time interval
t, respectively. Note that in Equation (
17) we implicitly assume that vehicles that are not moving (
) are connected to charging stations (
). In other words, we assume that a charging port is always available at each parking area used by the system. We think this is a reasonable approximation for a dense system such as the one we are considering here (which allows larger infrastructure investment), especially since we do not assume the use of more expensive fast chargers.
4.4. SoC of Vehicles and an Interface with a Charging Module
Each vehicle’s SoC evolves depending on the vehicle’s movements and charging. The set point for charging (and discharging) a vehicles is determined by the charging module, as detailed in
Section 3.2. At module call
u, the charging module needs as input the amount of energy in the virtual battery (Equation (
10)), which is defined as:
with
being the SoC of vehicle
v at time step
t in the simulation. The charging and discharging for each vehicle are then calculated based on the results of the charging module:
with
and
denoting the energy charged and discharged by vehicle
v during time step
t.
is the minimum SoC that a vehicle must have to be able to sell energy to the grid, to avoid further depleting vehicles with low battery levels.
The evolution of the SoC can then be expressed as:
5. Numerical Simulations
We implemented our proposed simulation-optimisation framework in MATLAB. In this section we present the results of numerical simulations performed with our framework using real-world transport and energy data. We first introduce the data used and our technical assumptions. Then we compare our model to a benchmark from [
33]. Finally, we report the results for different scenarios.
5.1. Transport Data
We used a transport dataset of New York City yellow taxicabs [
41]. This dataset includes the starting and ending times and coordinates of all the trips made by yellow taxis in New York City. We selected all the trips starting and ending in Manhattan during 2016.
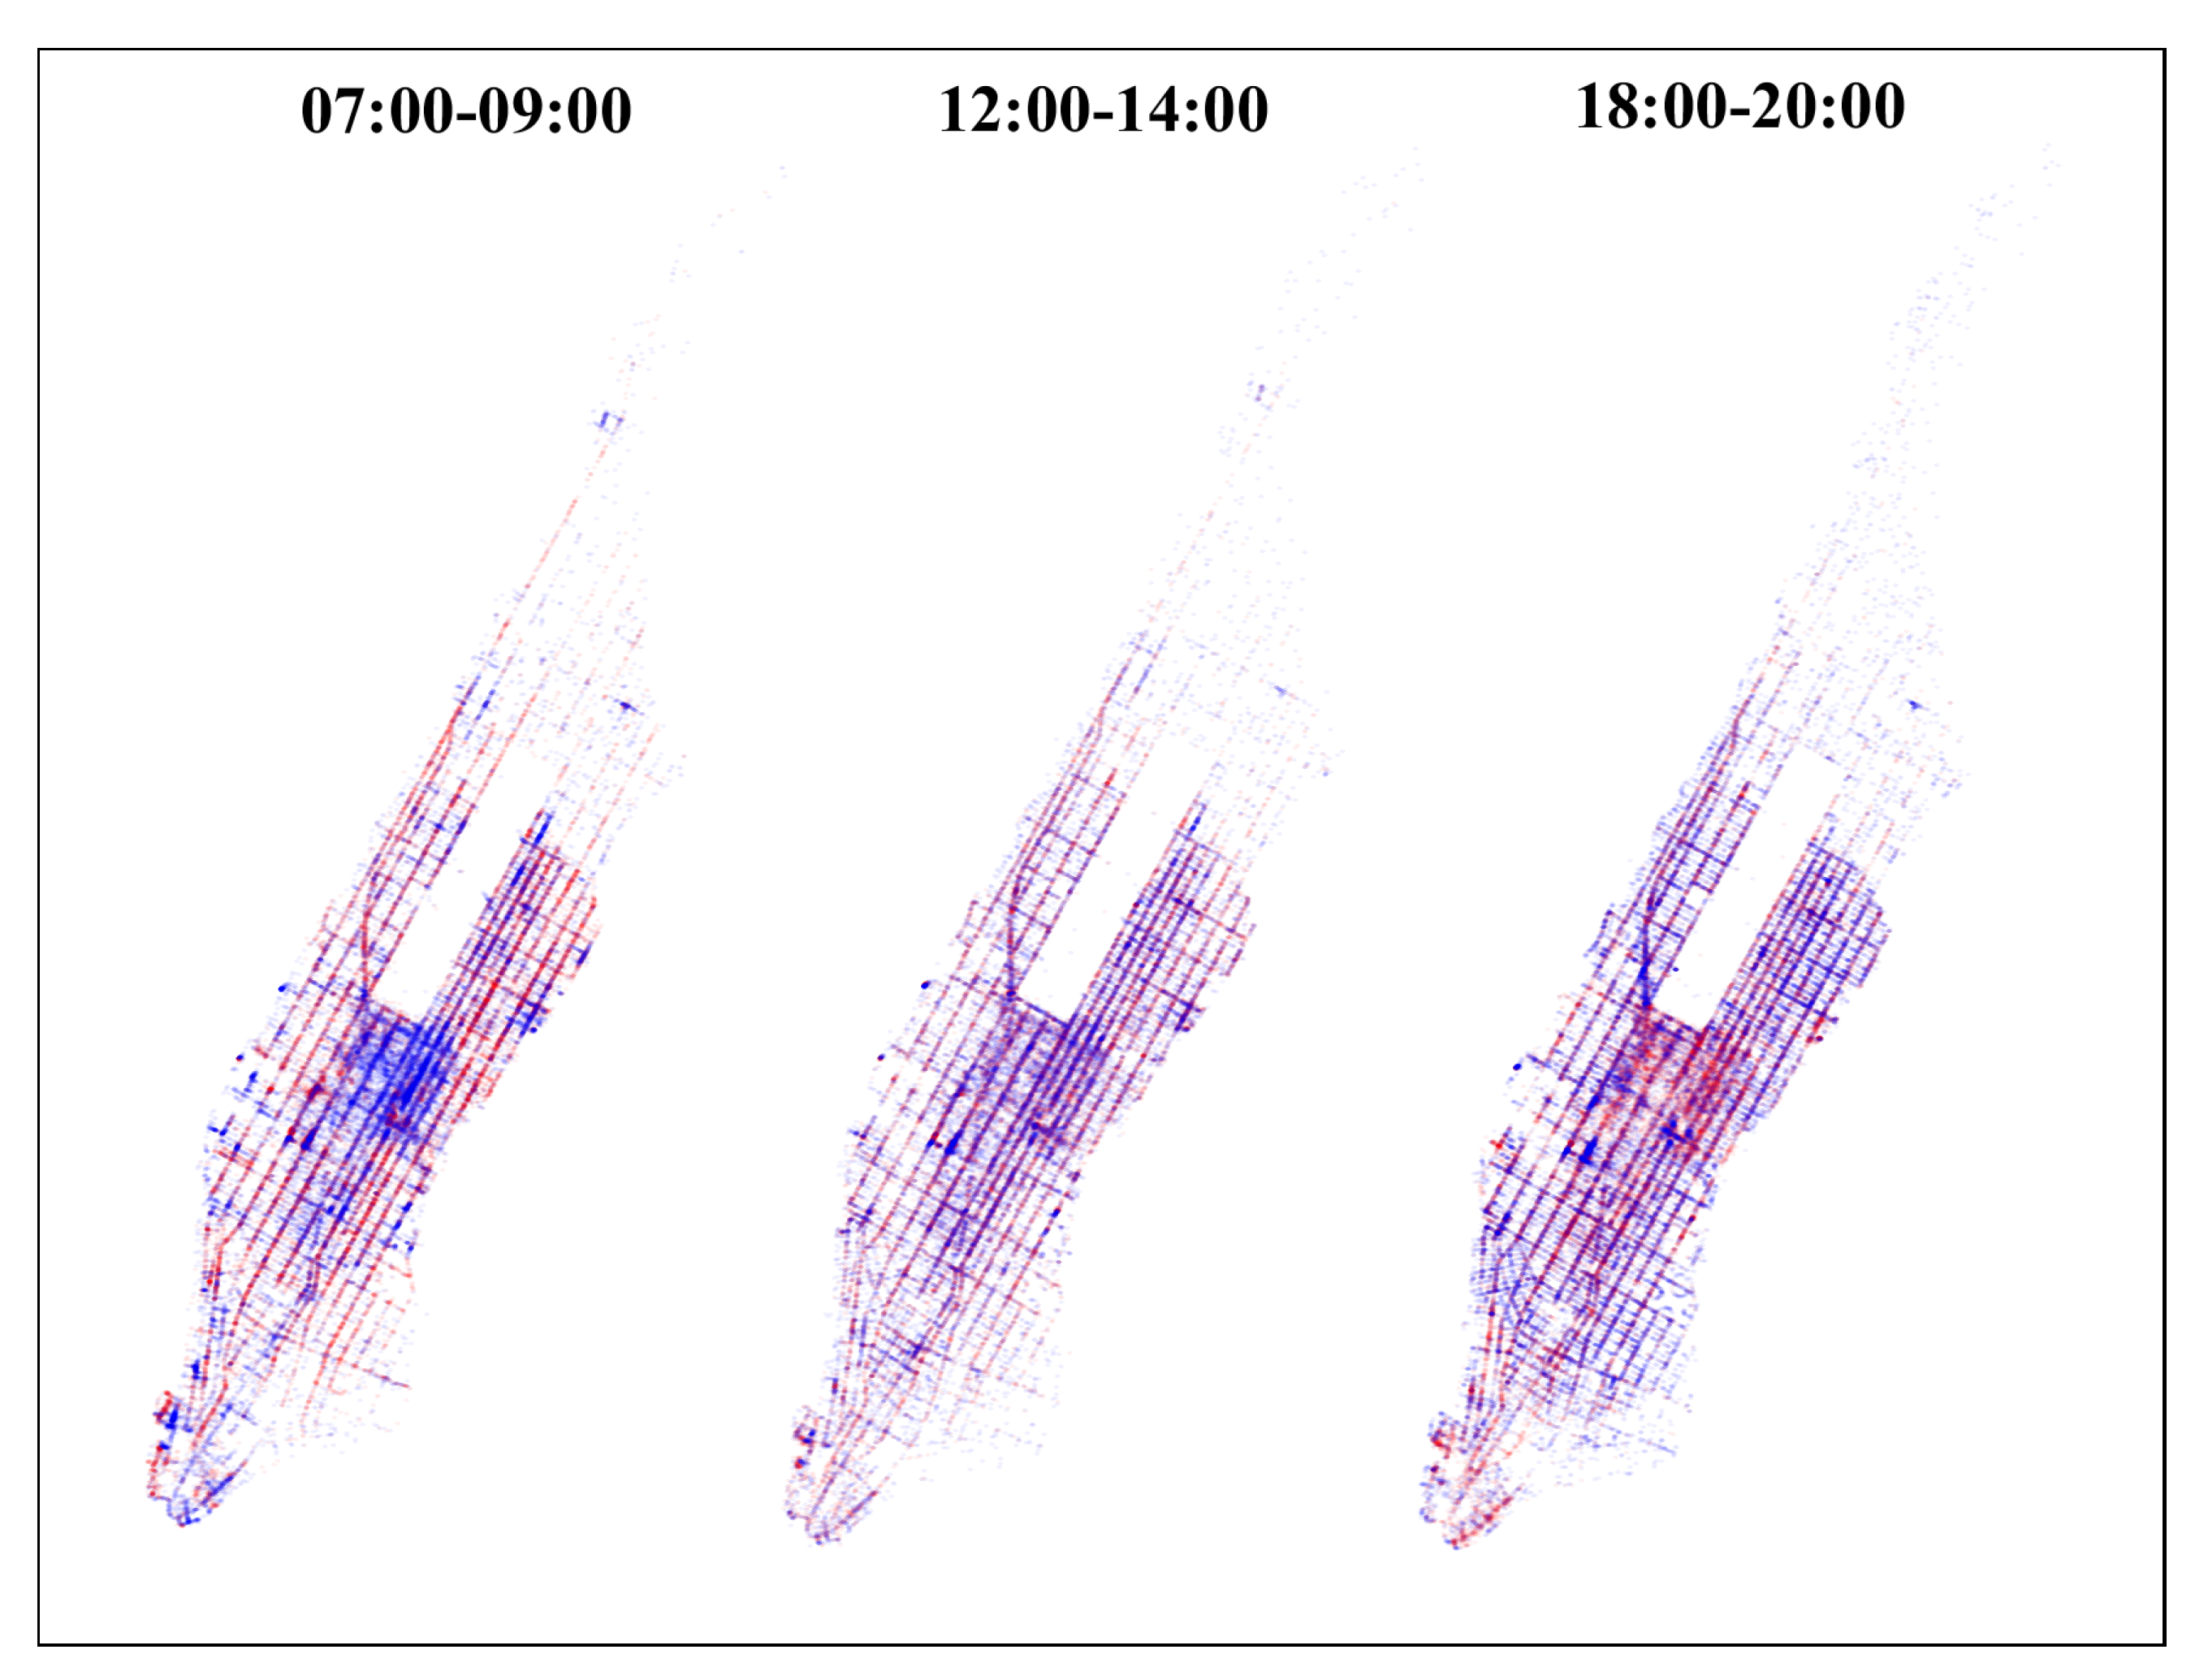
Figure 4 presents an example of the dataset showing the origin and destination locations during three 2-hour periods of the day: morning peak, noon, and evening peak. The asymmetry of the trips is evident: during the morning, trips tend to start in the periphery and end in the centre; the opposite is true in the evening peak. This highlights the importance of vehicle relocation.
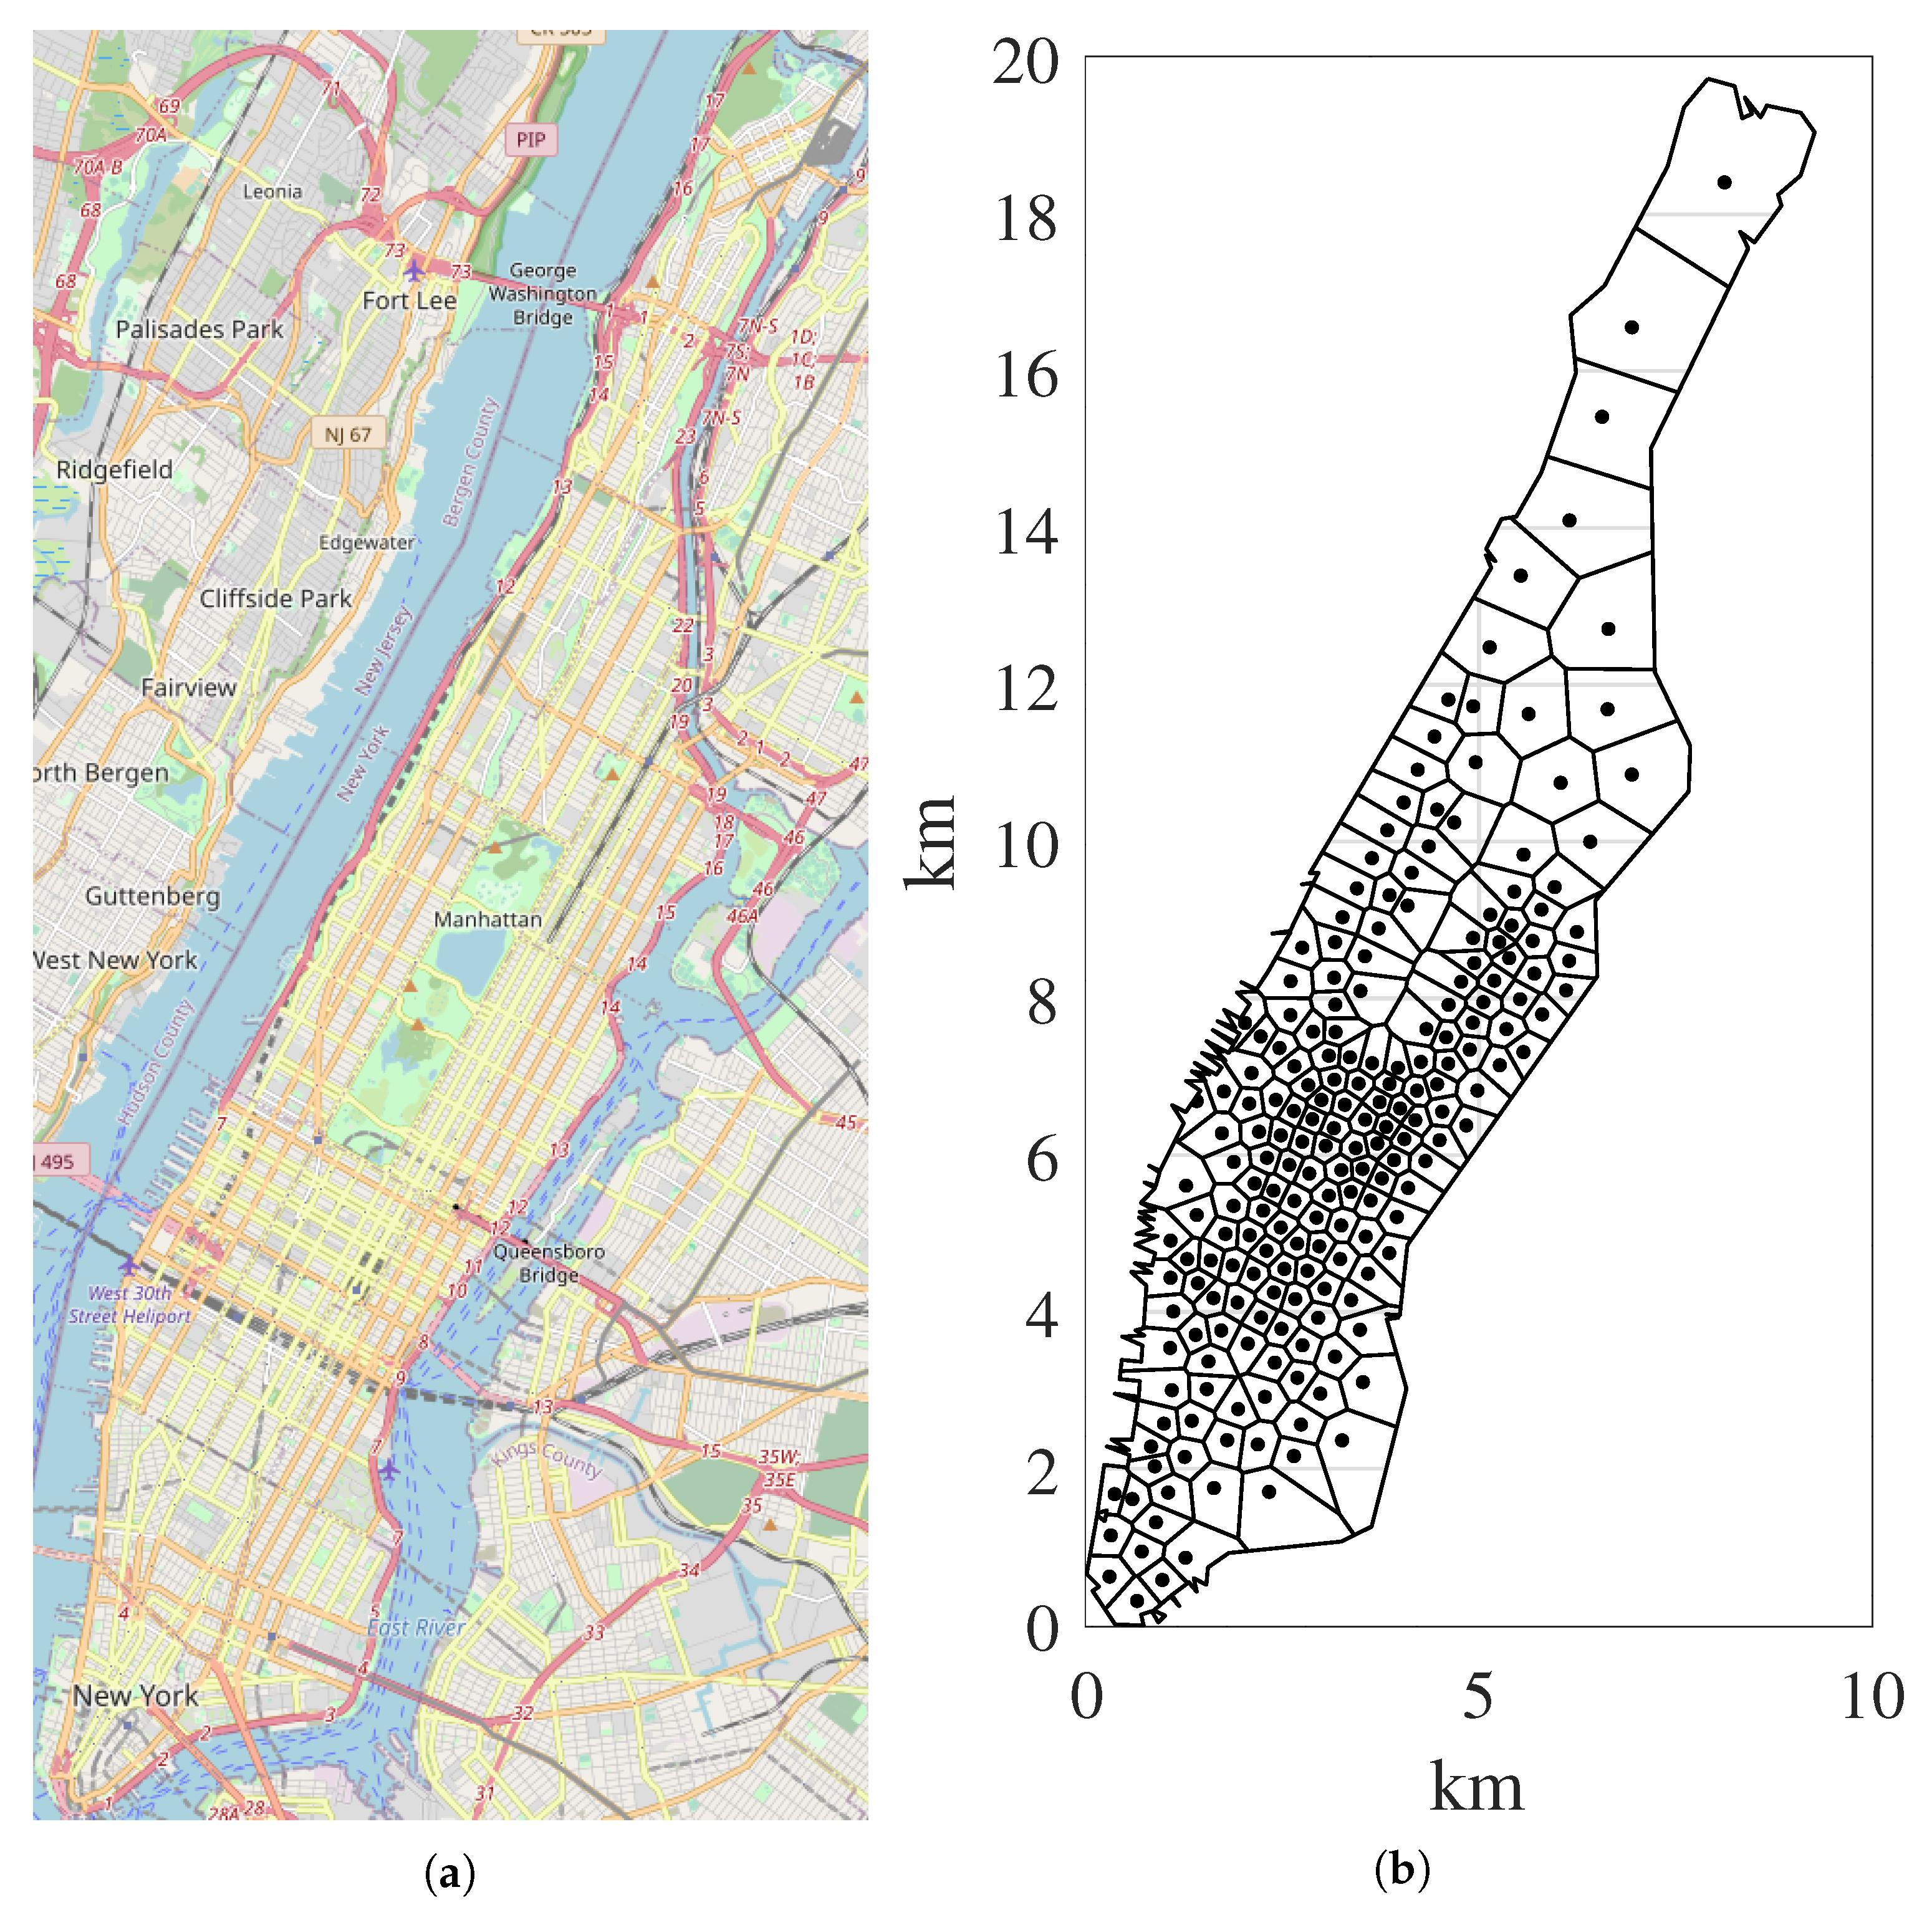
We assume that all these trips must be served by the SAEV fleet. We aggregated origins and destinations locations into 200 nodes using k-means clustering (
Figure 5). We estimated the average travel times between nodes by averaging the actual travel times of trips in the dataset during the morning peak period (7–9 am) on weekdays. As a conservative assumption, we take this travel time as a constant.
5.2. Technical Assumptions
Table 2 presents a summary of the technical assumptions used. Electrical consumption and battery capacity were taken to be similar to those of a standard 2020 Tesla Model 3 moving at an average speed of 30 km/h. The battery cycling cost, at
$0.025 per full cycle, is equivalent to a battery cost of 100
$/kWh working for 4000 cycles. This is reasonable given the recent developments in battery technology and since we do not allow deep discharge of the batteries [
42,
43]. We assume a charging power of 20 kW. This can be obtained with a three-phase AC connection, with much lower capital costs than DC fast charging [
44], and can thus be deployed more easily in more locations. We set the battery round-trip efficiency at 0.9 [
45].
5.3. Electricity Price and Emissions Data
For electricity prices and carbon emissions, we used two datasets from the New York power grid and the German power grid, respectively. The first dataset comprises the New York City day-ahead zonal prices for 2016, taken from the New York Independent System Operator (NYISO) [
46]. These prices correspond to our transport dataset both geographically and temporally.
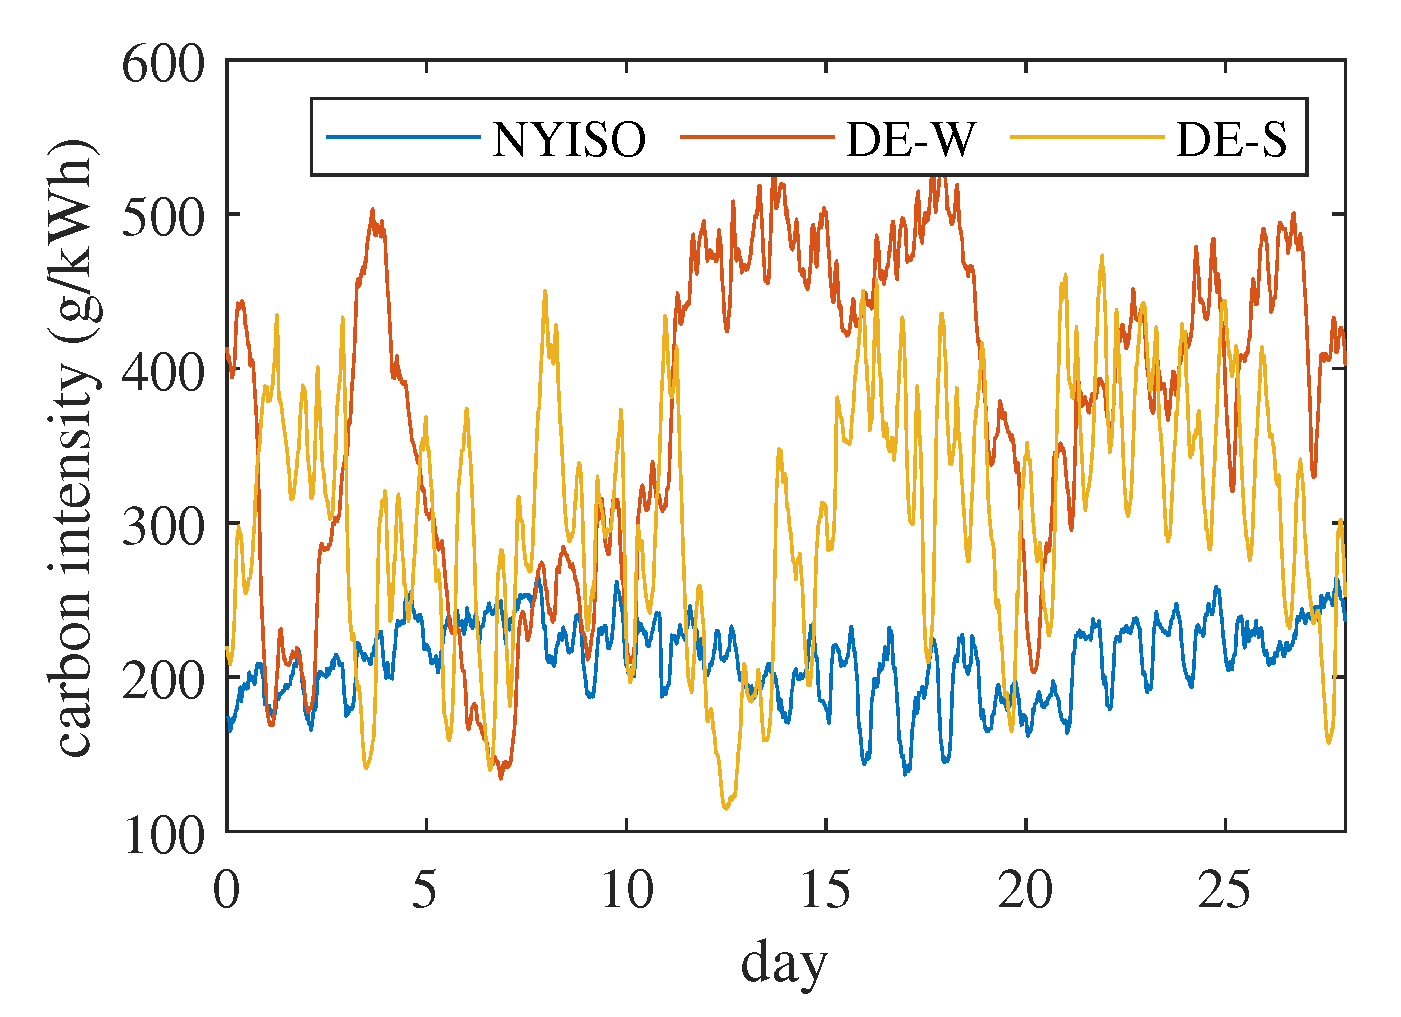
The NYISO grid has a large contribution from nuclear power and dispatchable conventional generators. Therefore, it does not well represent the majority of future grids, where solar and wind are expected to grow more and more important as energy sources. For this reason, we also tested the model with the energy prices and carbon emissions from the German power grid in 2019. The German power grid was chosen because of the high penetration of renewable energy sources, and thus the high variability both in prices and carbon emissions. While this data do not coincide spatially nor temporally with the transport data, we suggest they represent a good first approximation of the potential for this system to provide storage in grids with high penetration of solar and wind power. To have a better approximation, we offset the data to have coinciding days of the week for transport and electricity data. We also tested the model with electricity data in the winter (referred to as DE-W, from Monday, 7 January 2019 to Sunday, 3 February 2019) and the summer (DE-S, from Monday, 27 May 2019 to Sunday, 23 June 2019), to test the influence of high penetration of wind and solar power, respectively. For simplicity, we assumed a 1:1 conversion between Euros and US Dollars, since we are only interested in the relative difference between charging strategies for each scenario.
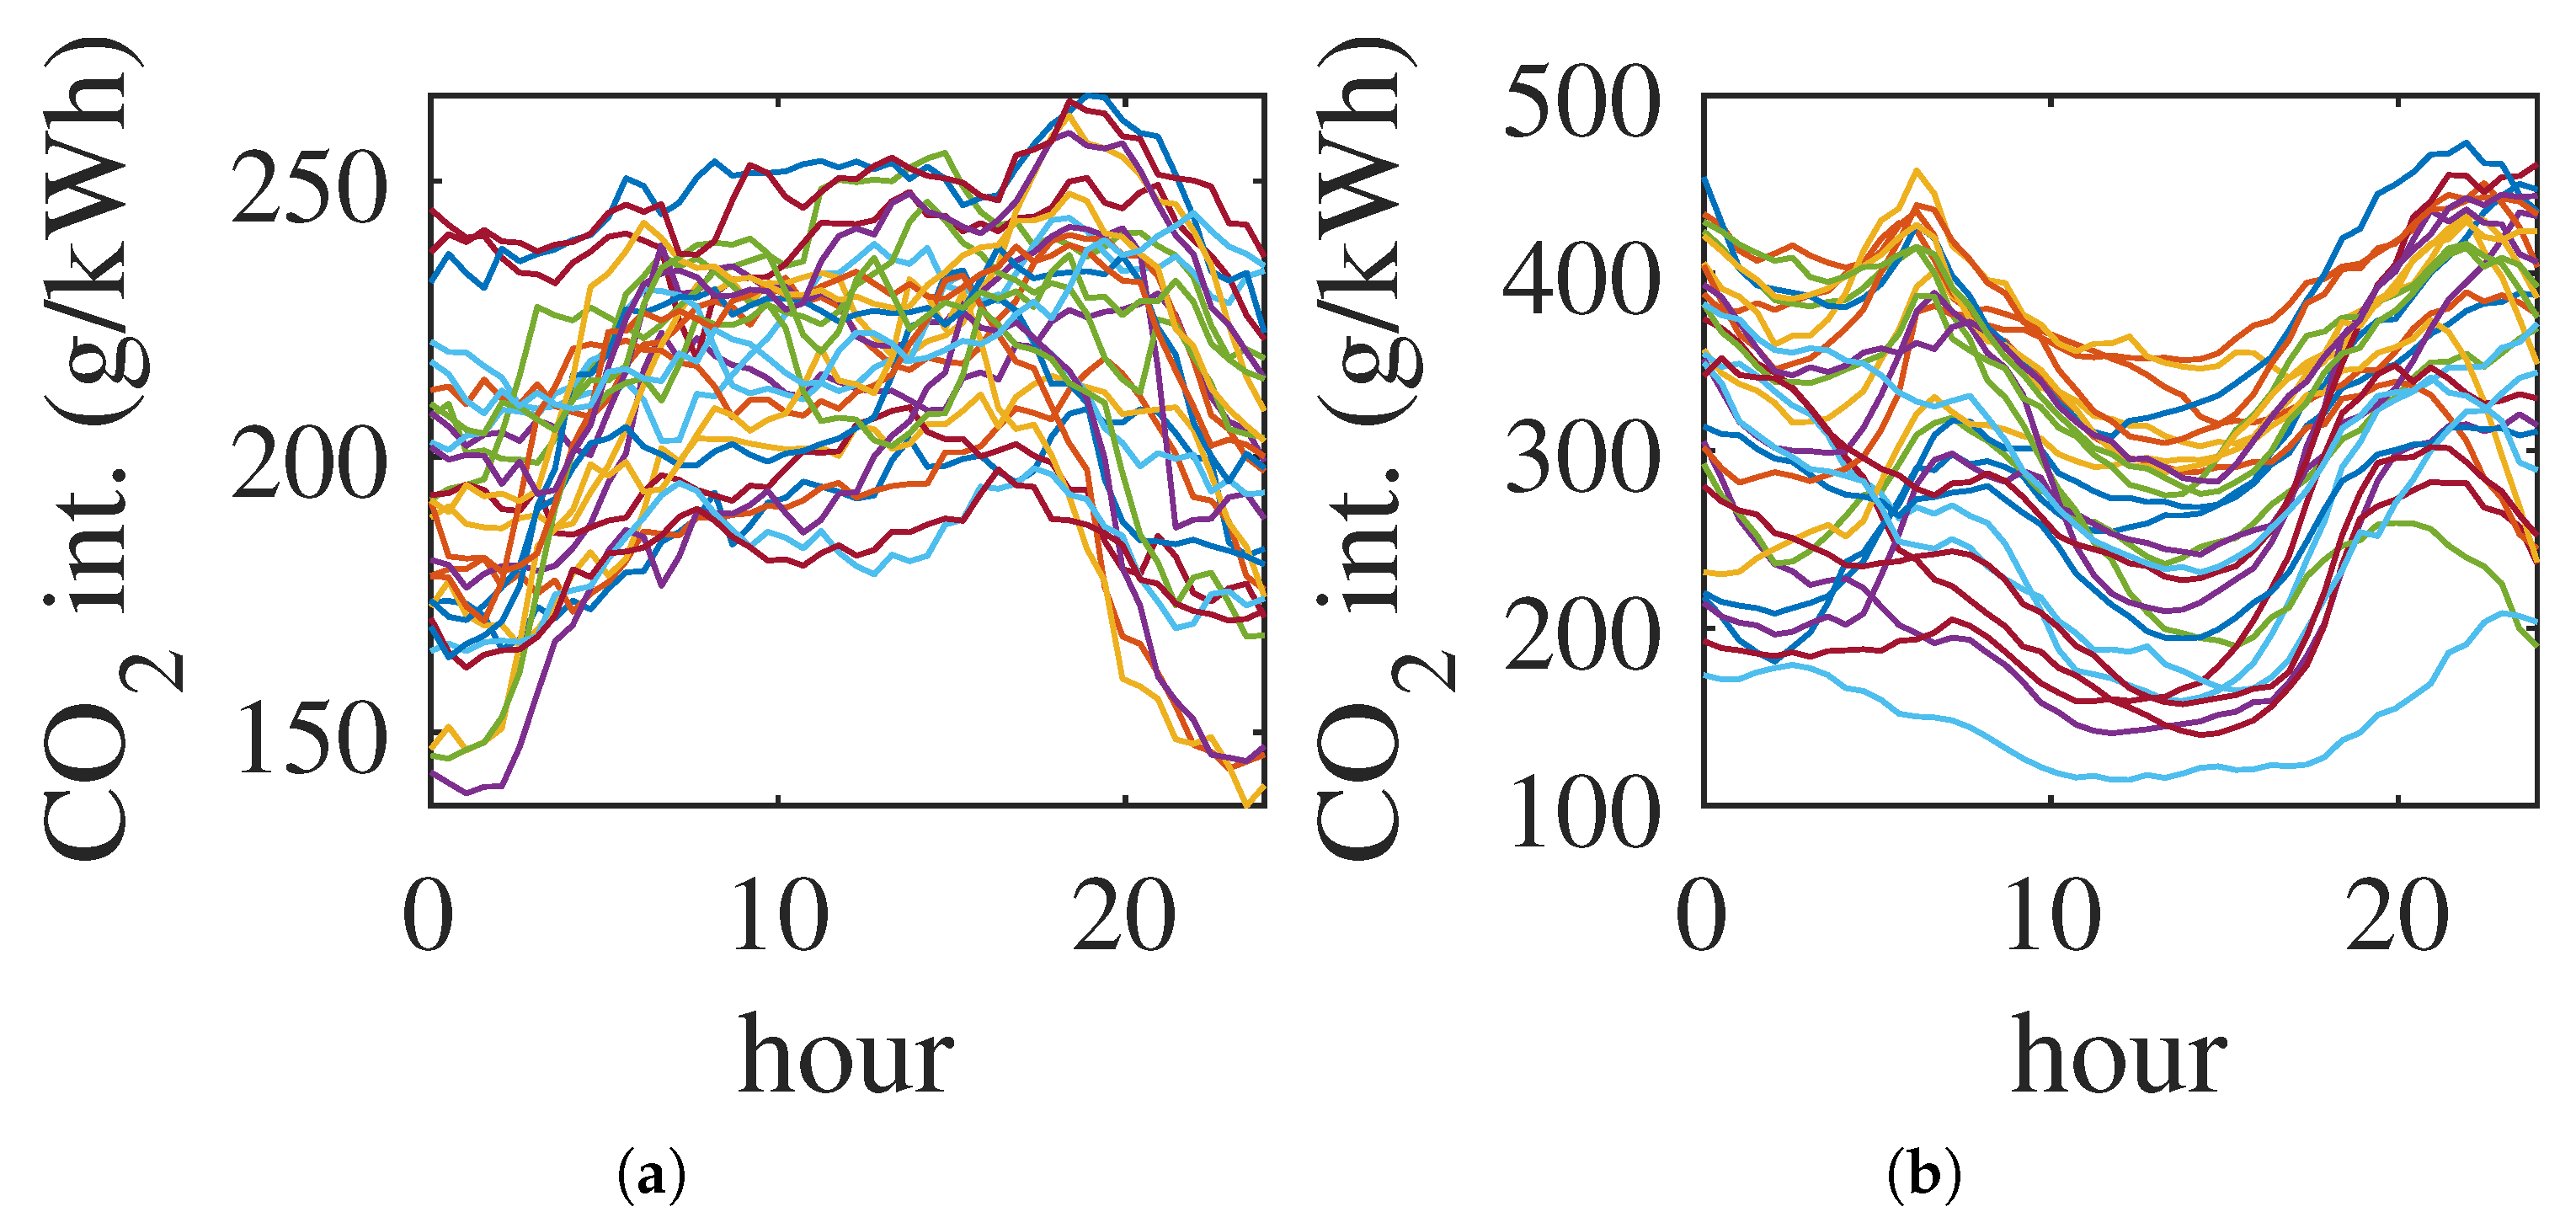
Carbon emissions profiles for the grid scenarios considered are reported in
Figure 6 and
Figure 7.
5.4. Benchmark Comparison
In this section we compare the results with several benchmarks. The first benchmark is a MPC controller for SAEV presented by Zhang et al. in [
14]. This model uses a mixed integer linear program (MILP) with the objective of minimising passengers’ waiting times. This model is the closest to optimality that can be achieved with the information available, assuming a MPC-based system with limited knowledge horizon. We consider the case with perfect information (which we call
Zhang) equivalent to a system strictly based on advanced reservations; and the case with only the expected trip distributions (
Zhang (st.), for stochastic) equivalent to a more realistic system without advanced reservations (similar to most ride-hailing systems today).
The second benchmark is the model in [
33], which includes charge scheduling. We also consider the system with and without reservations (
Iacob. and
Iacob. (st.), respectively).
The
Zhang and
Iacob. models are computationally expensive and their scalability is limited. For this reason we selected a subset of the trips, limited to a 5 × 5 km area of Manhattan (on the bottom left corner of
Figure 5b) and a fleet size of 30 vehicles. We randomly selected subsets of the trips in this area during 5 consecutive weekdays (25–29 January 2016). We also aggregated origins and destinations into 10 nodes with k-means clustering.
The results are shown in
Figure 8 for different demand levels. Note that for
Iacob. the last demand level was infeasible due to restrictive charging constraints and high vehicle usage. With perfect knowledge, the benchmark models produced almost zero average waiting times: a vehicle was almost always already present at the node when a trip was requested. Our proposed model produced higher mean wait times due to the aggregate trip prediction. We recall that
Zhang is the theoretical optimal model in this case; thus, it should be considered an absolute lower bound. No model can perform better with the same information and with perfect advanced knowledge through reservations.
In the case without reservations (i.e., with uncertainty about future demand), our model performs better than both benchmarks. This is a more realistic case, and is more similar to how current ride-hailing systems operate. Moreover, our model also has far lower peak wait times, thanks to the first-come first-served strategy.
In terms of charging costs, our model produced very similar results to Iacob., and produced strategies with far lower costs compared to the unscheduled model of Zhang.
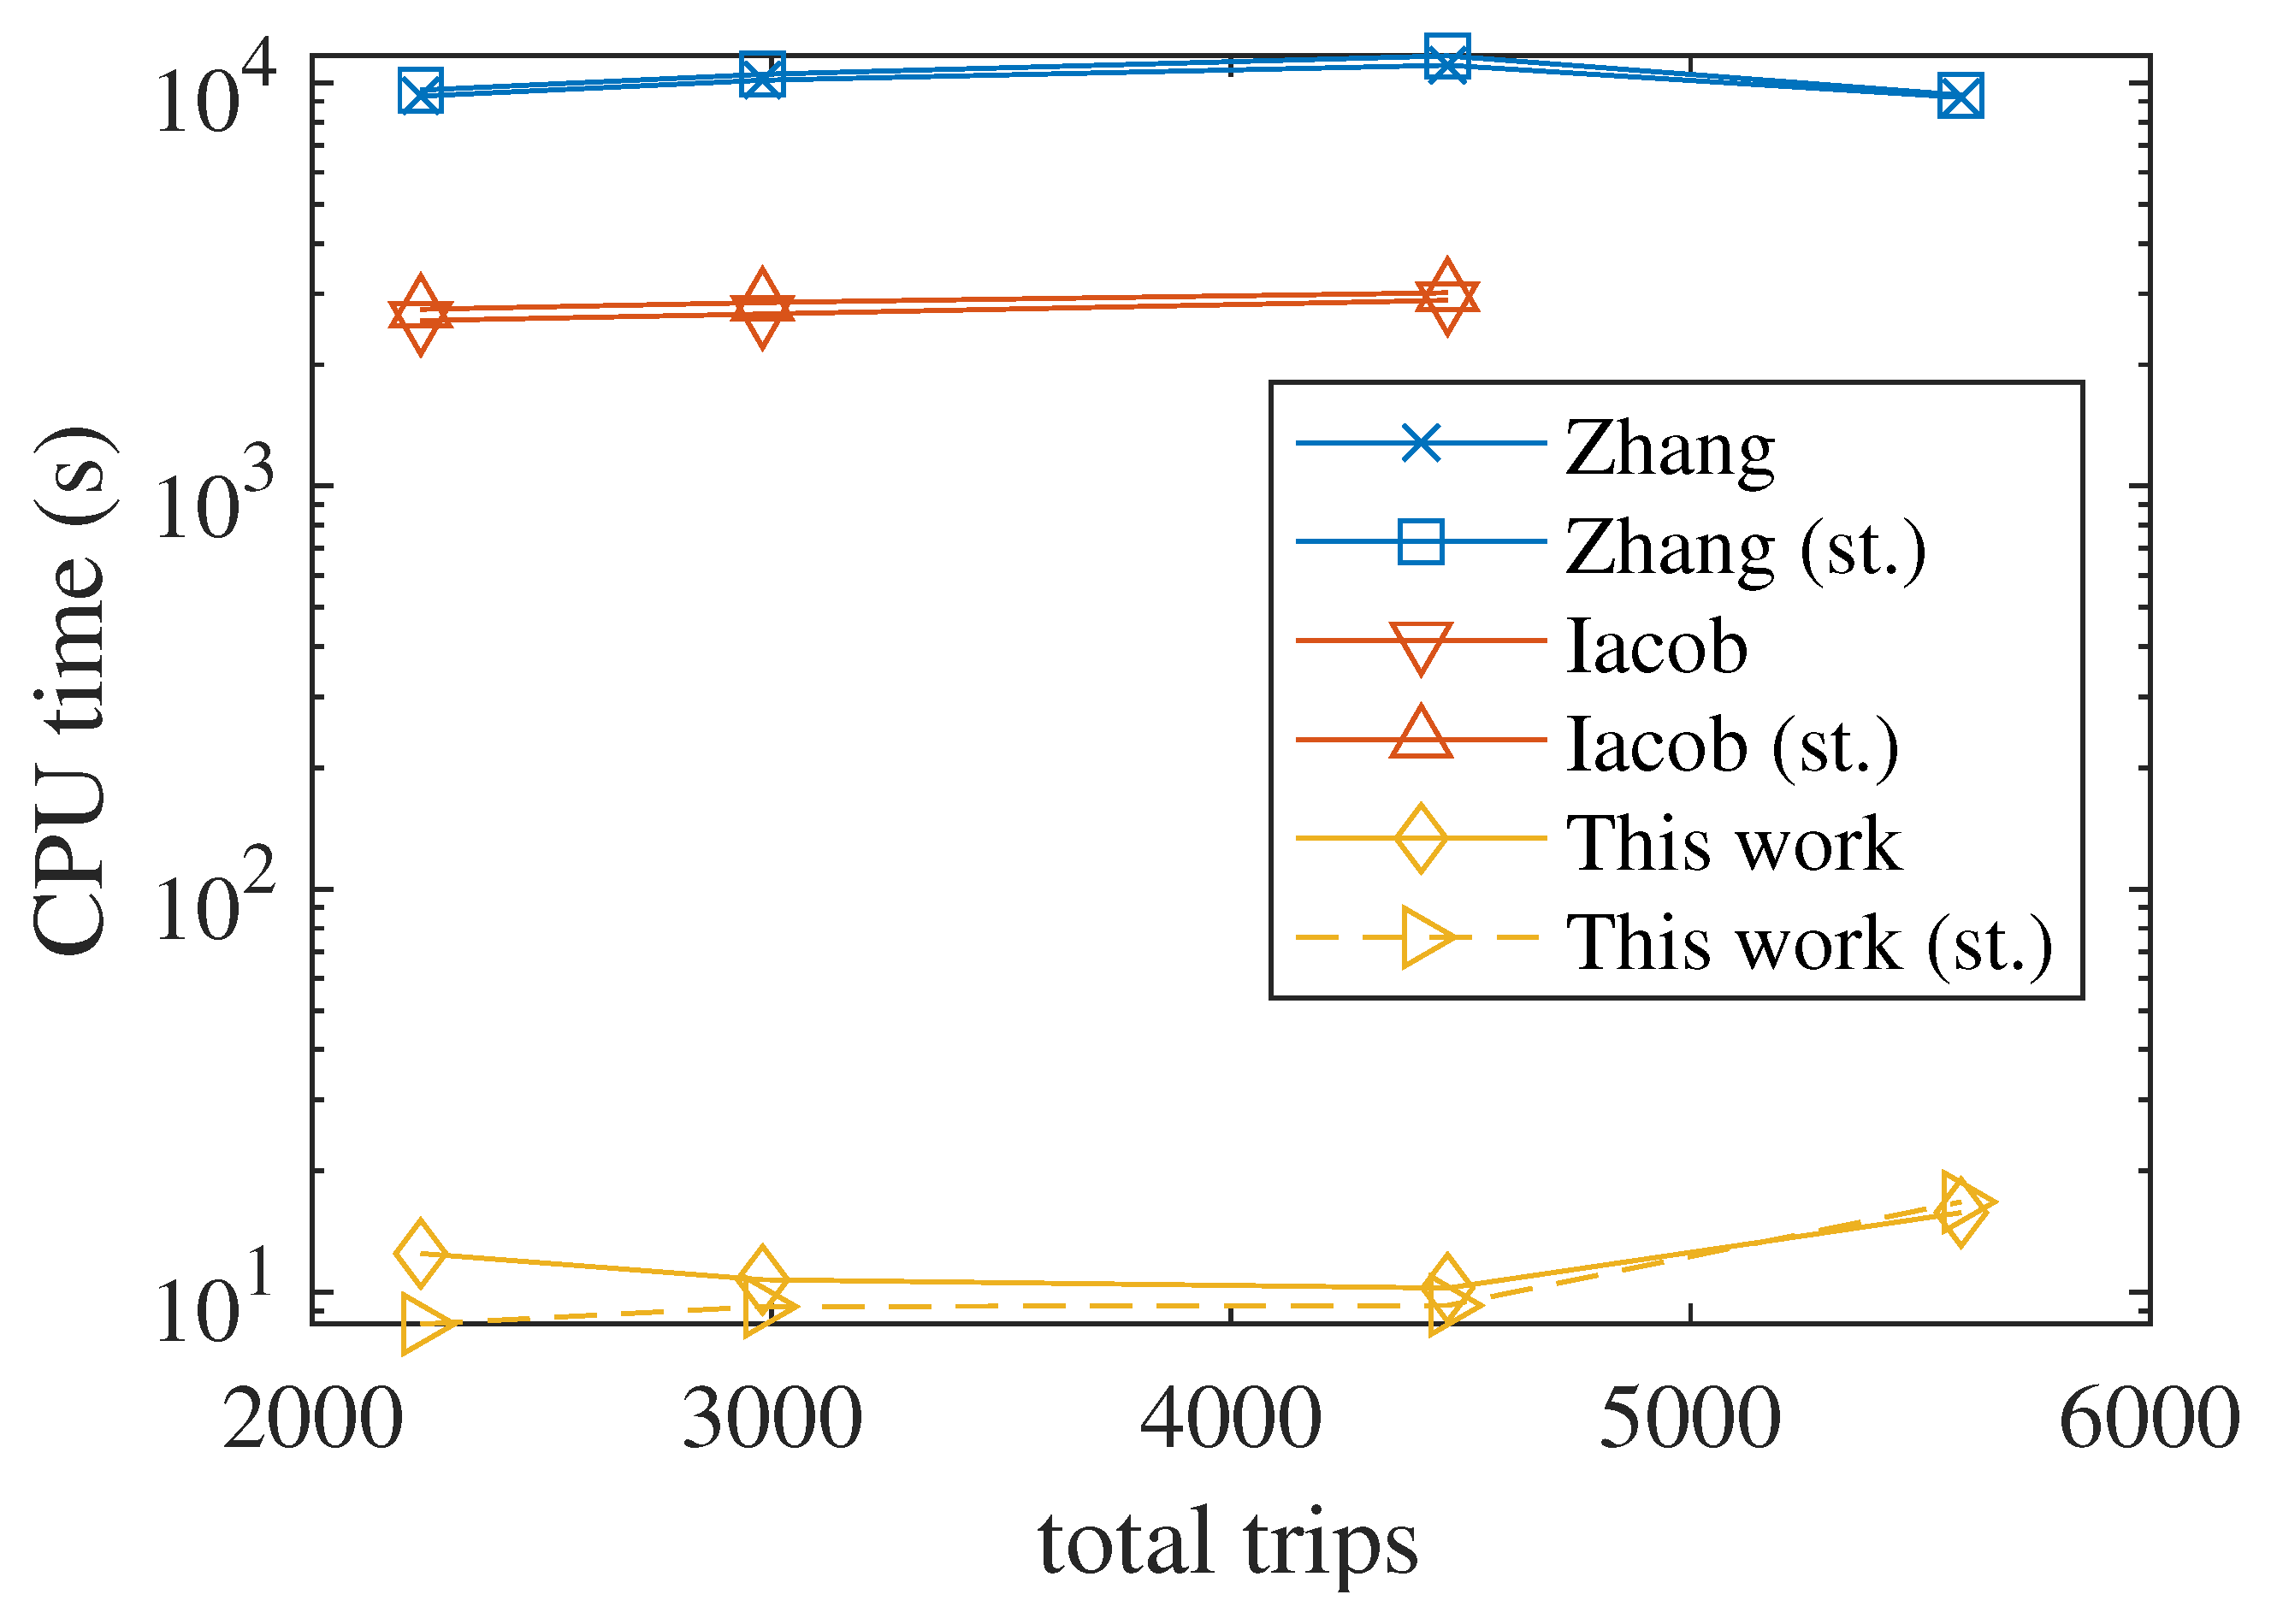
Figure 9 reports the results in terms of CPU time, which shows that our model is about three orders of magnitude faster than the benchmarks. The benchmark models are also effectively limited to about 30–40 vehicles and 10–20 nodes. For far larger simulations, the computational complexity becomes intractable. Thanks to the lower computational complexity, our proposed model can instead be scaled to very large systems, as detailed in the next section.
In summary, our model performed better than all the benchmarks presented in the case without reservations and with uncertain future demand, which is the case for almost all real ride-hailing systems today. Moreover, it is orders of magnitude faster to run and can be scaled to much larger systems, thereby offering the possibility of practical implementation.
5.5. Full-Scale Results
In this section we report the results with the full model, using all trips in Manhattan and 200 nodes. We used a temporal resolution of 1 min () and a fleet size of 10,000 vehicles. This was chosen in order to have very low waiting times to approximate the service of the taxis that actually served these passengers.
We ran simulations for four weeks at the beginning of the year, from Monday, 18 January 2016 to Sunday, 14 February 2016. This period included about 8.7 million trips. We considered the three grid scenarios introduced in
Section 5.3. We ran simulations assuming three charging strategies:
- 1.
Night: vehicles are charged at night between midnight and 5 am, and during the day only when the SoC is below 60%.
- 2.
On-demand: the fleet is charged continuously during the day as soon as possible.
- 3.
Scheduled: the fleet is charged according to our proposed charging strategy.
The proportion of passengers waiting and their average waiting time did not change significantly with the charging strategy. This was a result of always giving priority to transport service over charging. For example, vehicles can always stop charging to pick-up a passenger if their current SoC is enough for the trip. In the case of scheduled charging, the rolling horizon charging strategy ensures that vehicles have always enough charge available to serve the demand. We found that in all cases, about 96.9% of passengers found a vehicle at their node, without any waiting time. The peak waiting time during the four weeks was 11 min—the same for all scenarios.
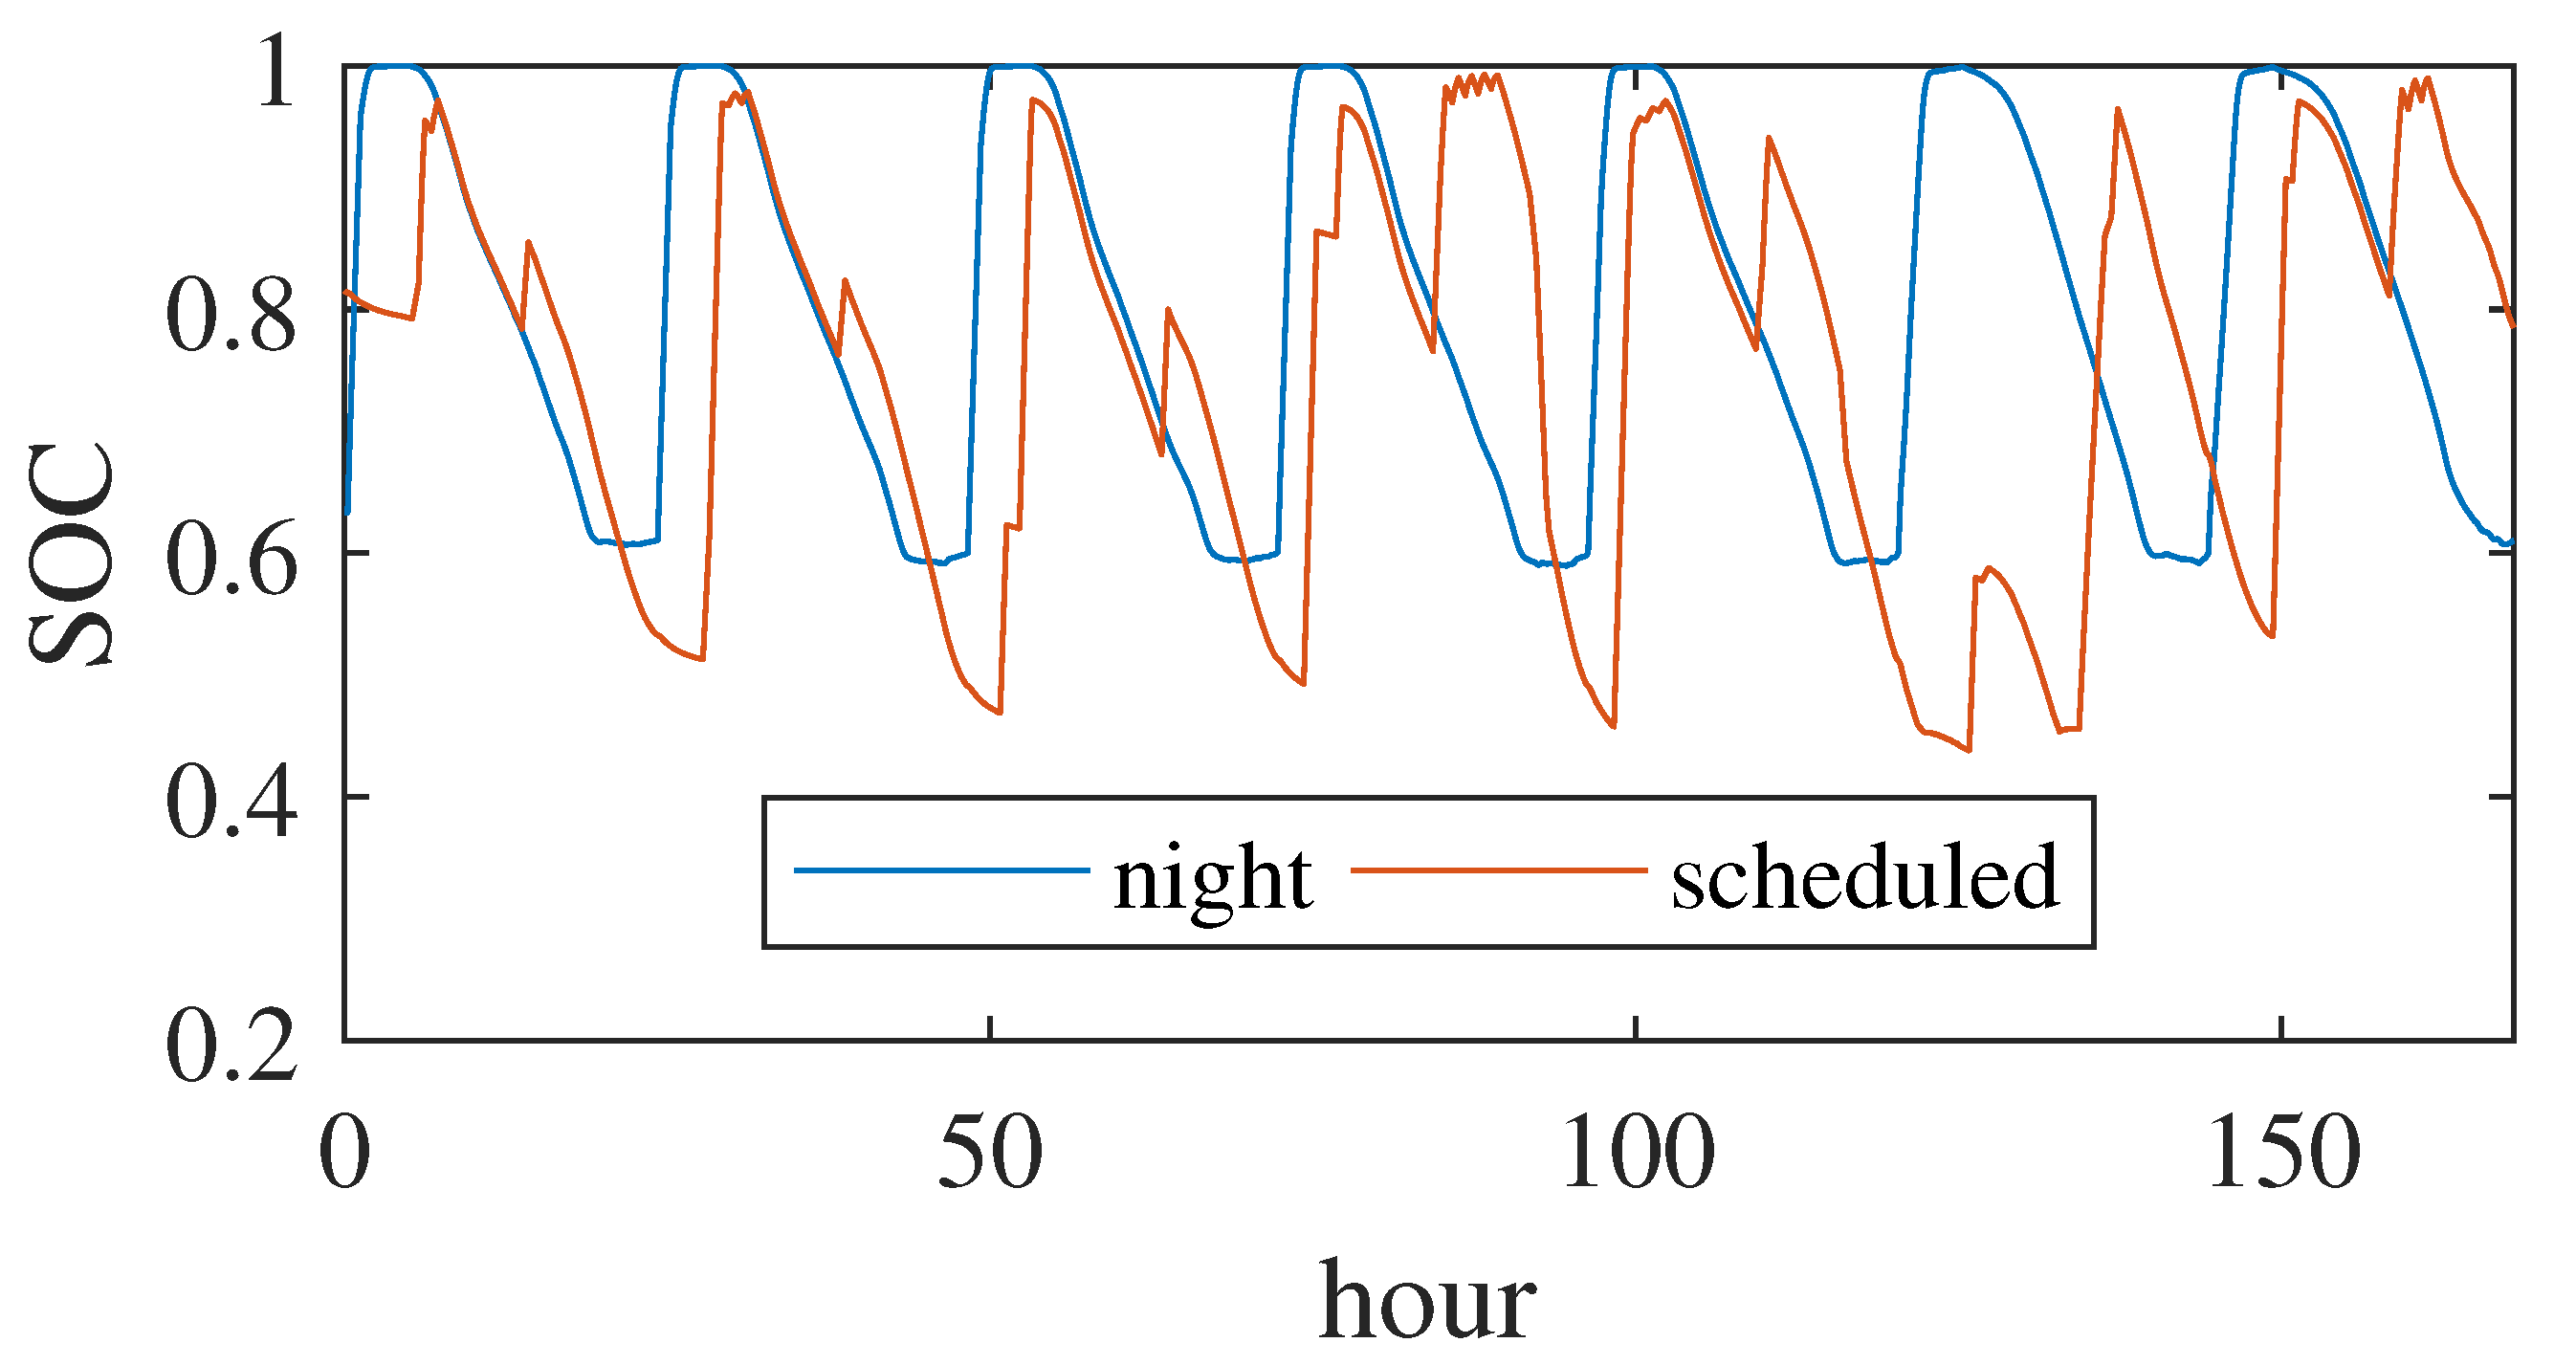
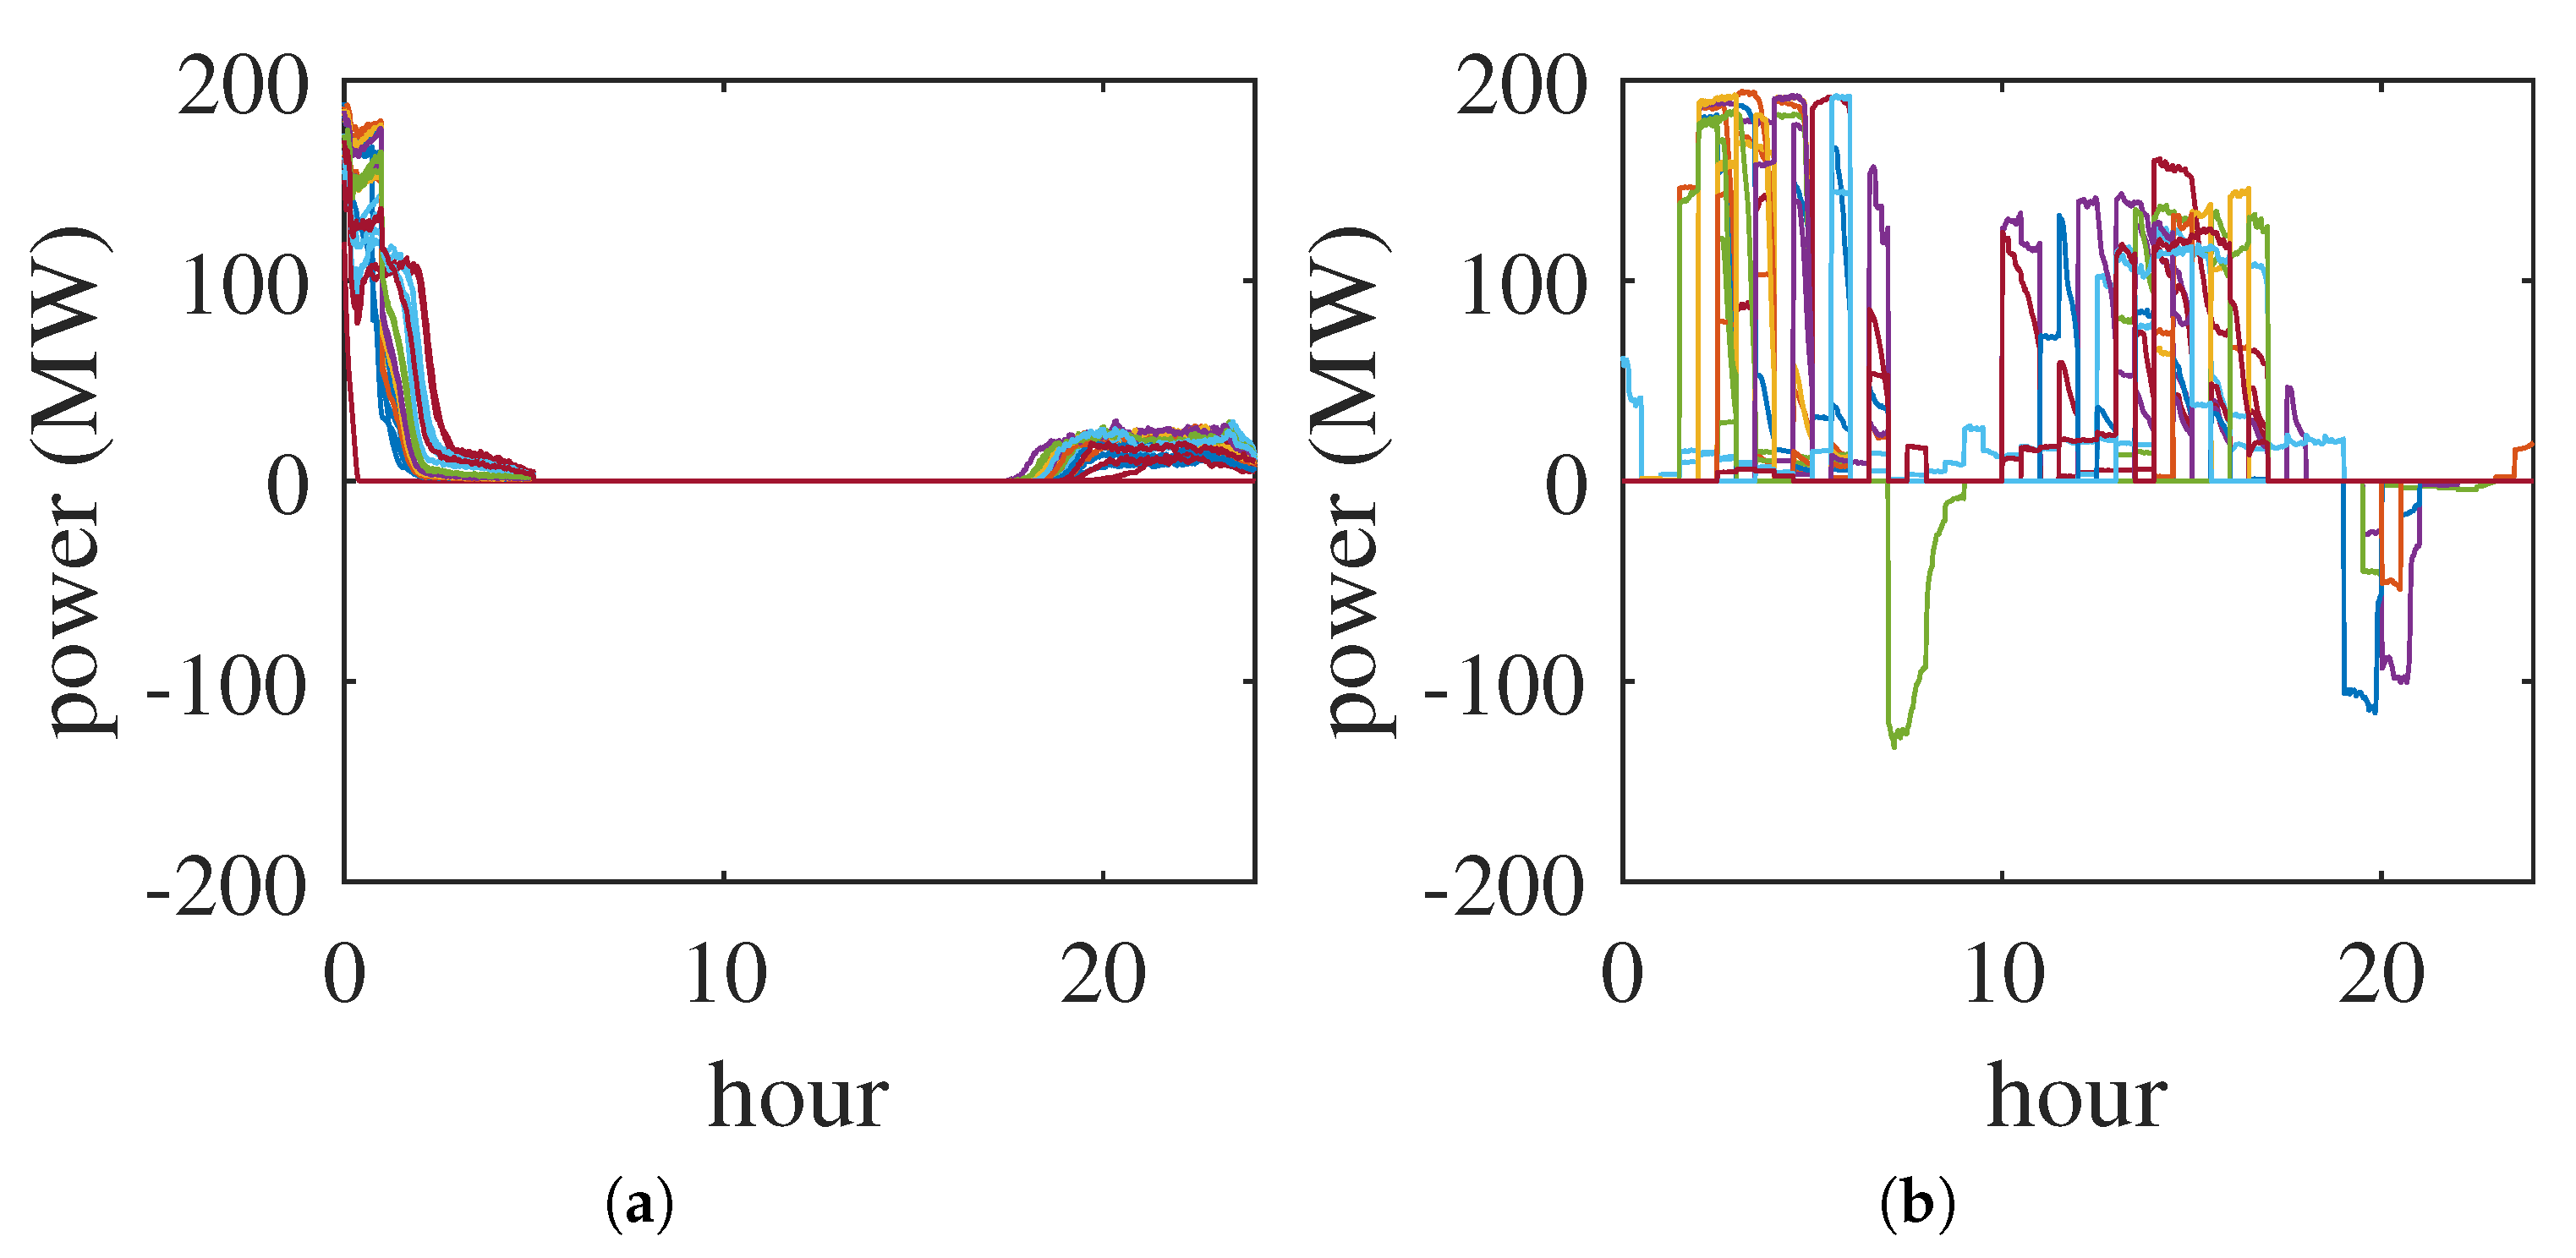
Table 3 reports the charging costs and emissions for each scenario. Our scheduled charging always obtained much lower charging costs than both naive charging strategies. The biggest gains were found in the case of the German grid in the summer (DE-S). This is because of the large contribution of solar power in the grid, which significantly reduces prices during the day. Our charging strategy is able to take advantage of this by charging during periods of maximum solar power production. This is beneficial from the standpoint of the grid, since it would allow a higher penetration of solar power before curtailment becomes necessary. This effect is evident in
Figure 10, which reports the average SoC of the fleet in the DE-S scenario for the cases with night charging and with our scheduling strategy. The fleet tends to charge during the day, taking advantage of abundant solar power generation.
Carbon emissions trends are less clear. In the New York grid, our strategy produces higher emissions than the night charging. A carbon price of
$50/ton would not significantly change the results (less than 1% difference), since it is not enough to compensate for lower charging rates at periods of higher emissions. However, the differences were small. The largest impact of our strategy was in the German grid in the summer, again because of the large contribution of solar power. The effect of solar power generation in this case can be seen in
Figure 7b. Our strategy not only cut costs by about 52% compared to the night charging and 55% compared to the on-demand charging, but carbon emissions were also down by about 16–21%. The carbon price further reduced emissions, for a total decrease of 23–27%. In the German case, minimising charging costs was highly correlated with the minimisation of carbon emissions, because low-carbon renewable energy and nuclear power enter the market at zero marginal cost and generally reduce electricity prices. This is clearly visible in
Figure 11b. The fleet absorbed solar power during the day, and tended to sell to the grid during morning and evening peaks, when solar power was not available.
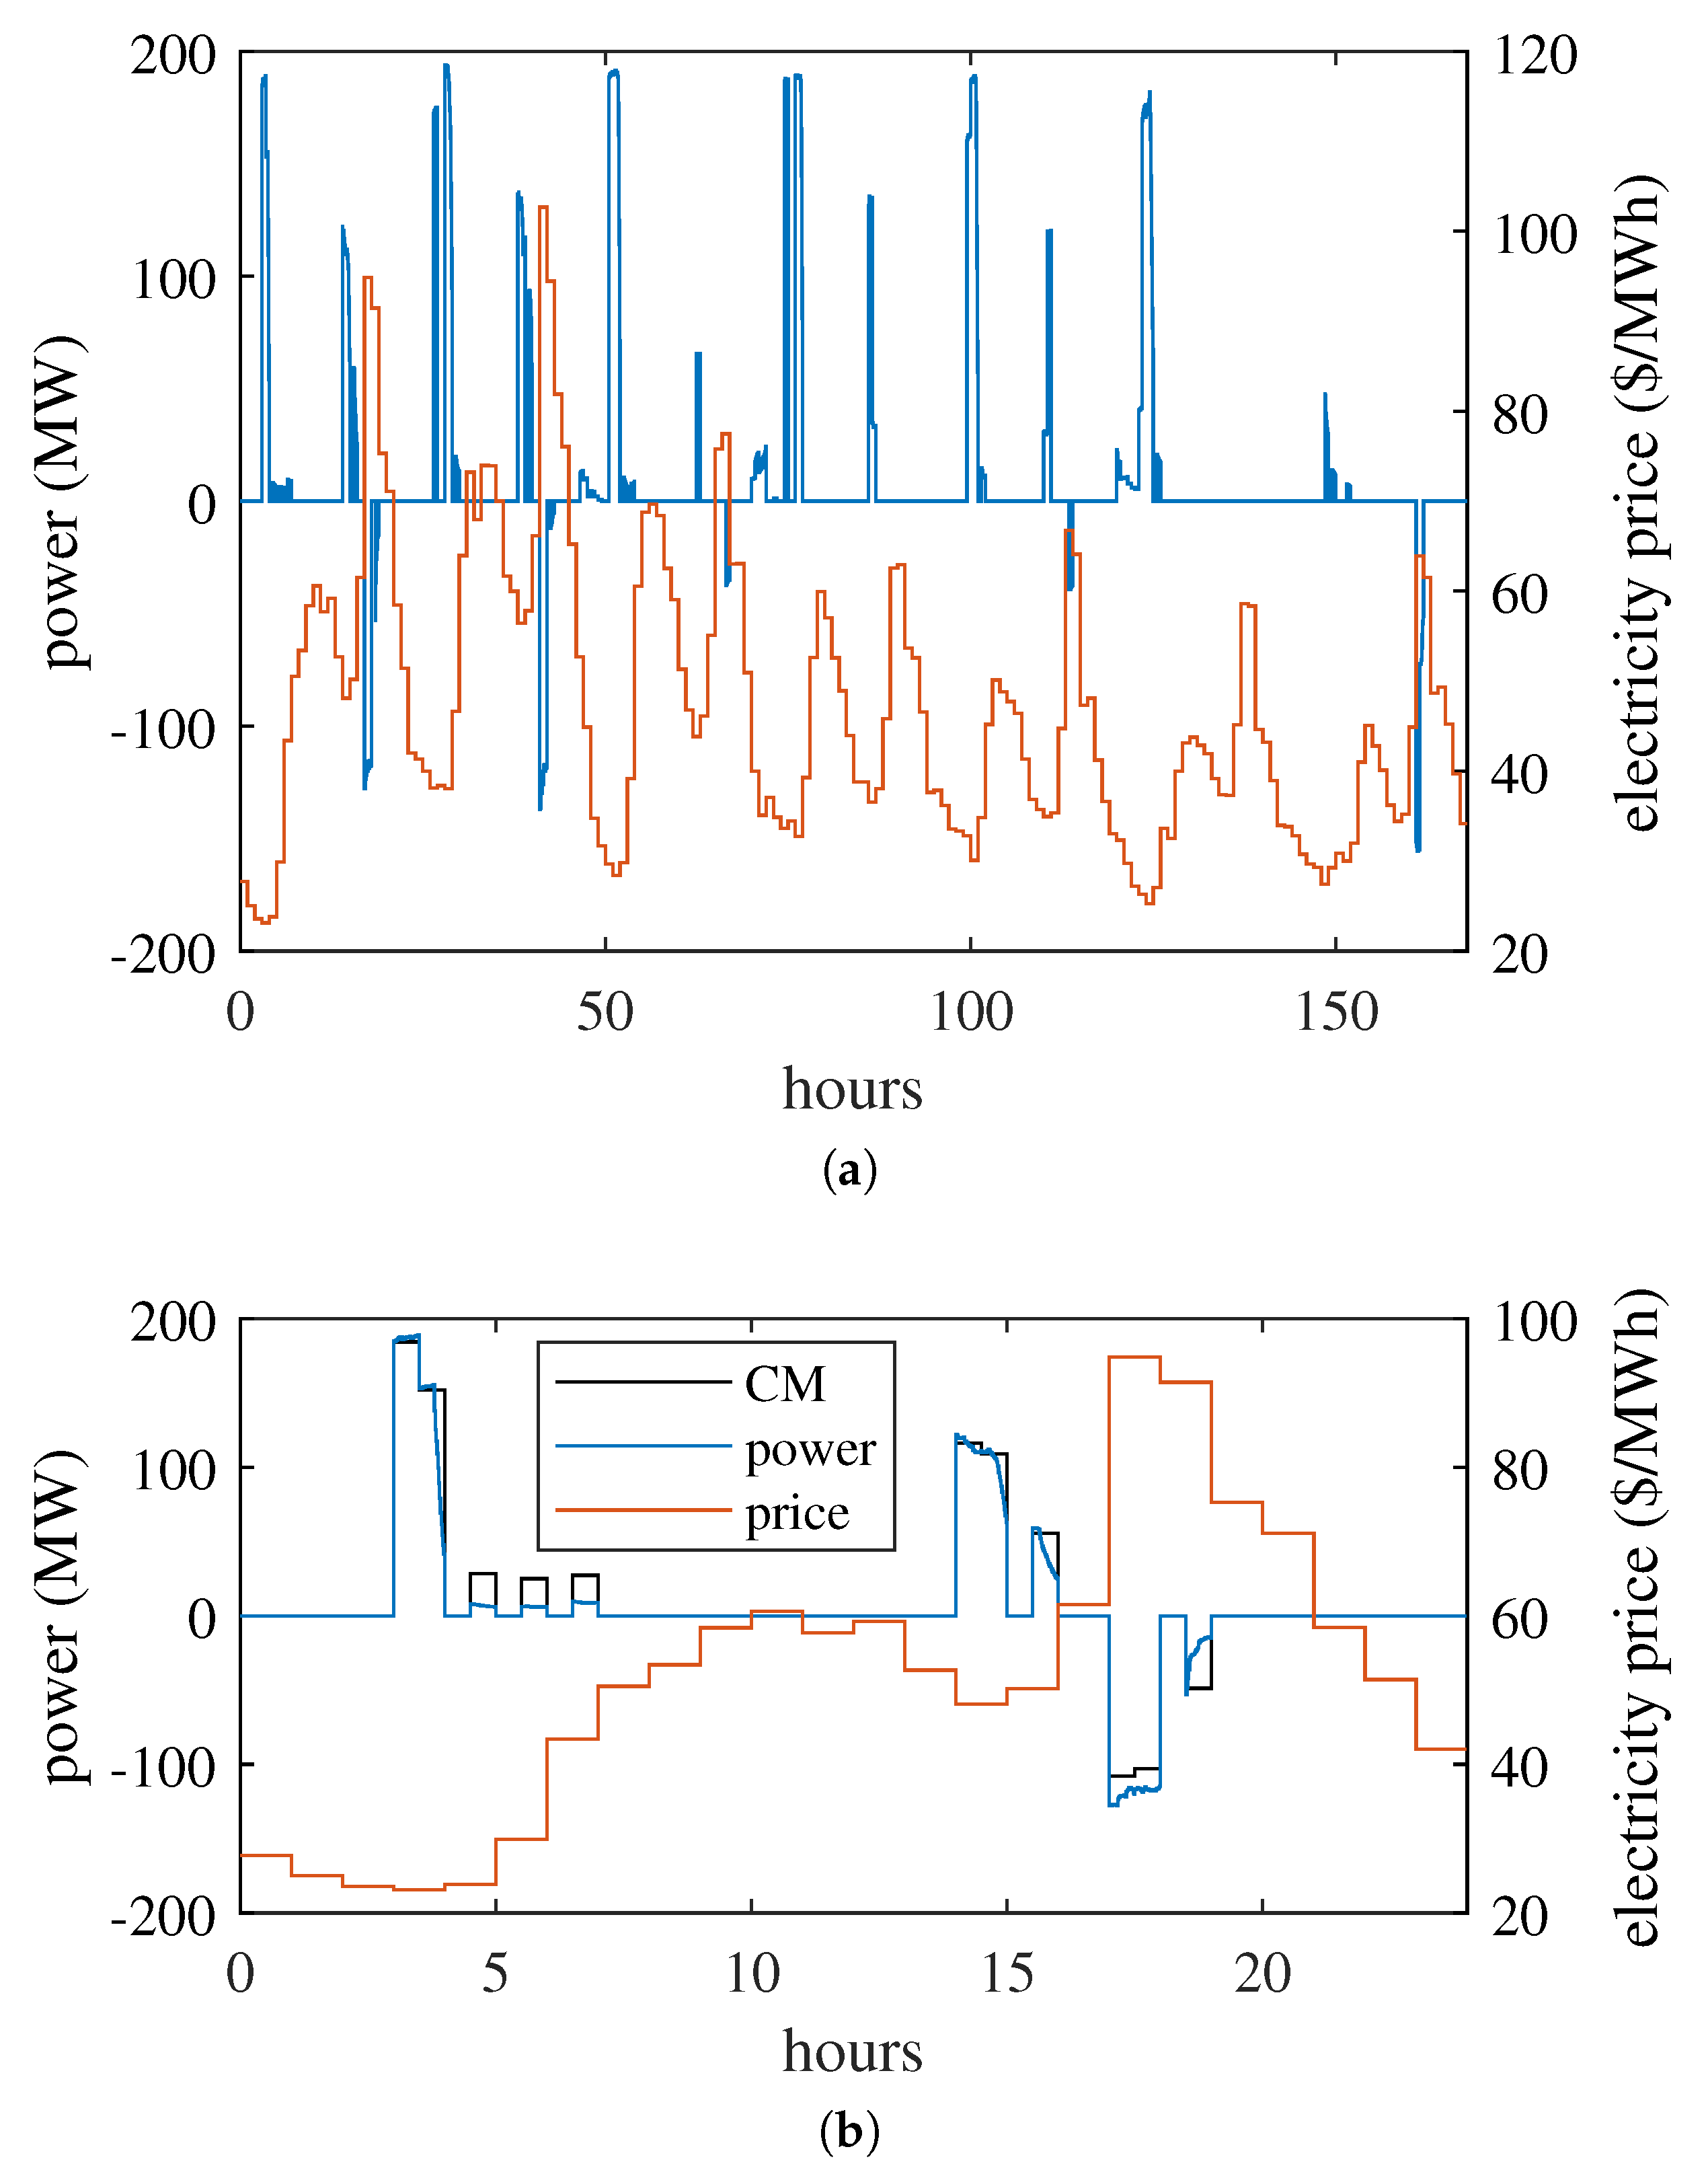
Figure 12 reports the power exchanged during a week in the NYISO scenario. The fleet tended to charge when electricity prices were lowest, and sell back power to the grid when prices were higher.
Figure 12b is a zoom on the first day. The fleet tends to charge in accordance with the set points chosen by the charging module. However, this is not always possible due to constraints related to the real-time positions of vehicles. This is especially true when vehicle utilisation rates are higher, such as during the evening peak. In this case, the actual power exchanged may vary quite substantially due to the fast dynamics of the fleet. However, thanks to the MPC control, the charging module can continuously adapt their set points to account for the evolving situation. Each day of simulation took about 4 min (single core) on a Intel Core i9 3.6 GHz CPU.
5.6. The Impact of Charging on Optimal Fleet Size
We tested the influence of fleet size on the results during the first week of the simulation period with the NYISO scenario.
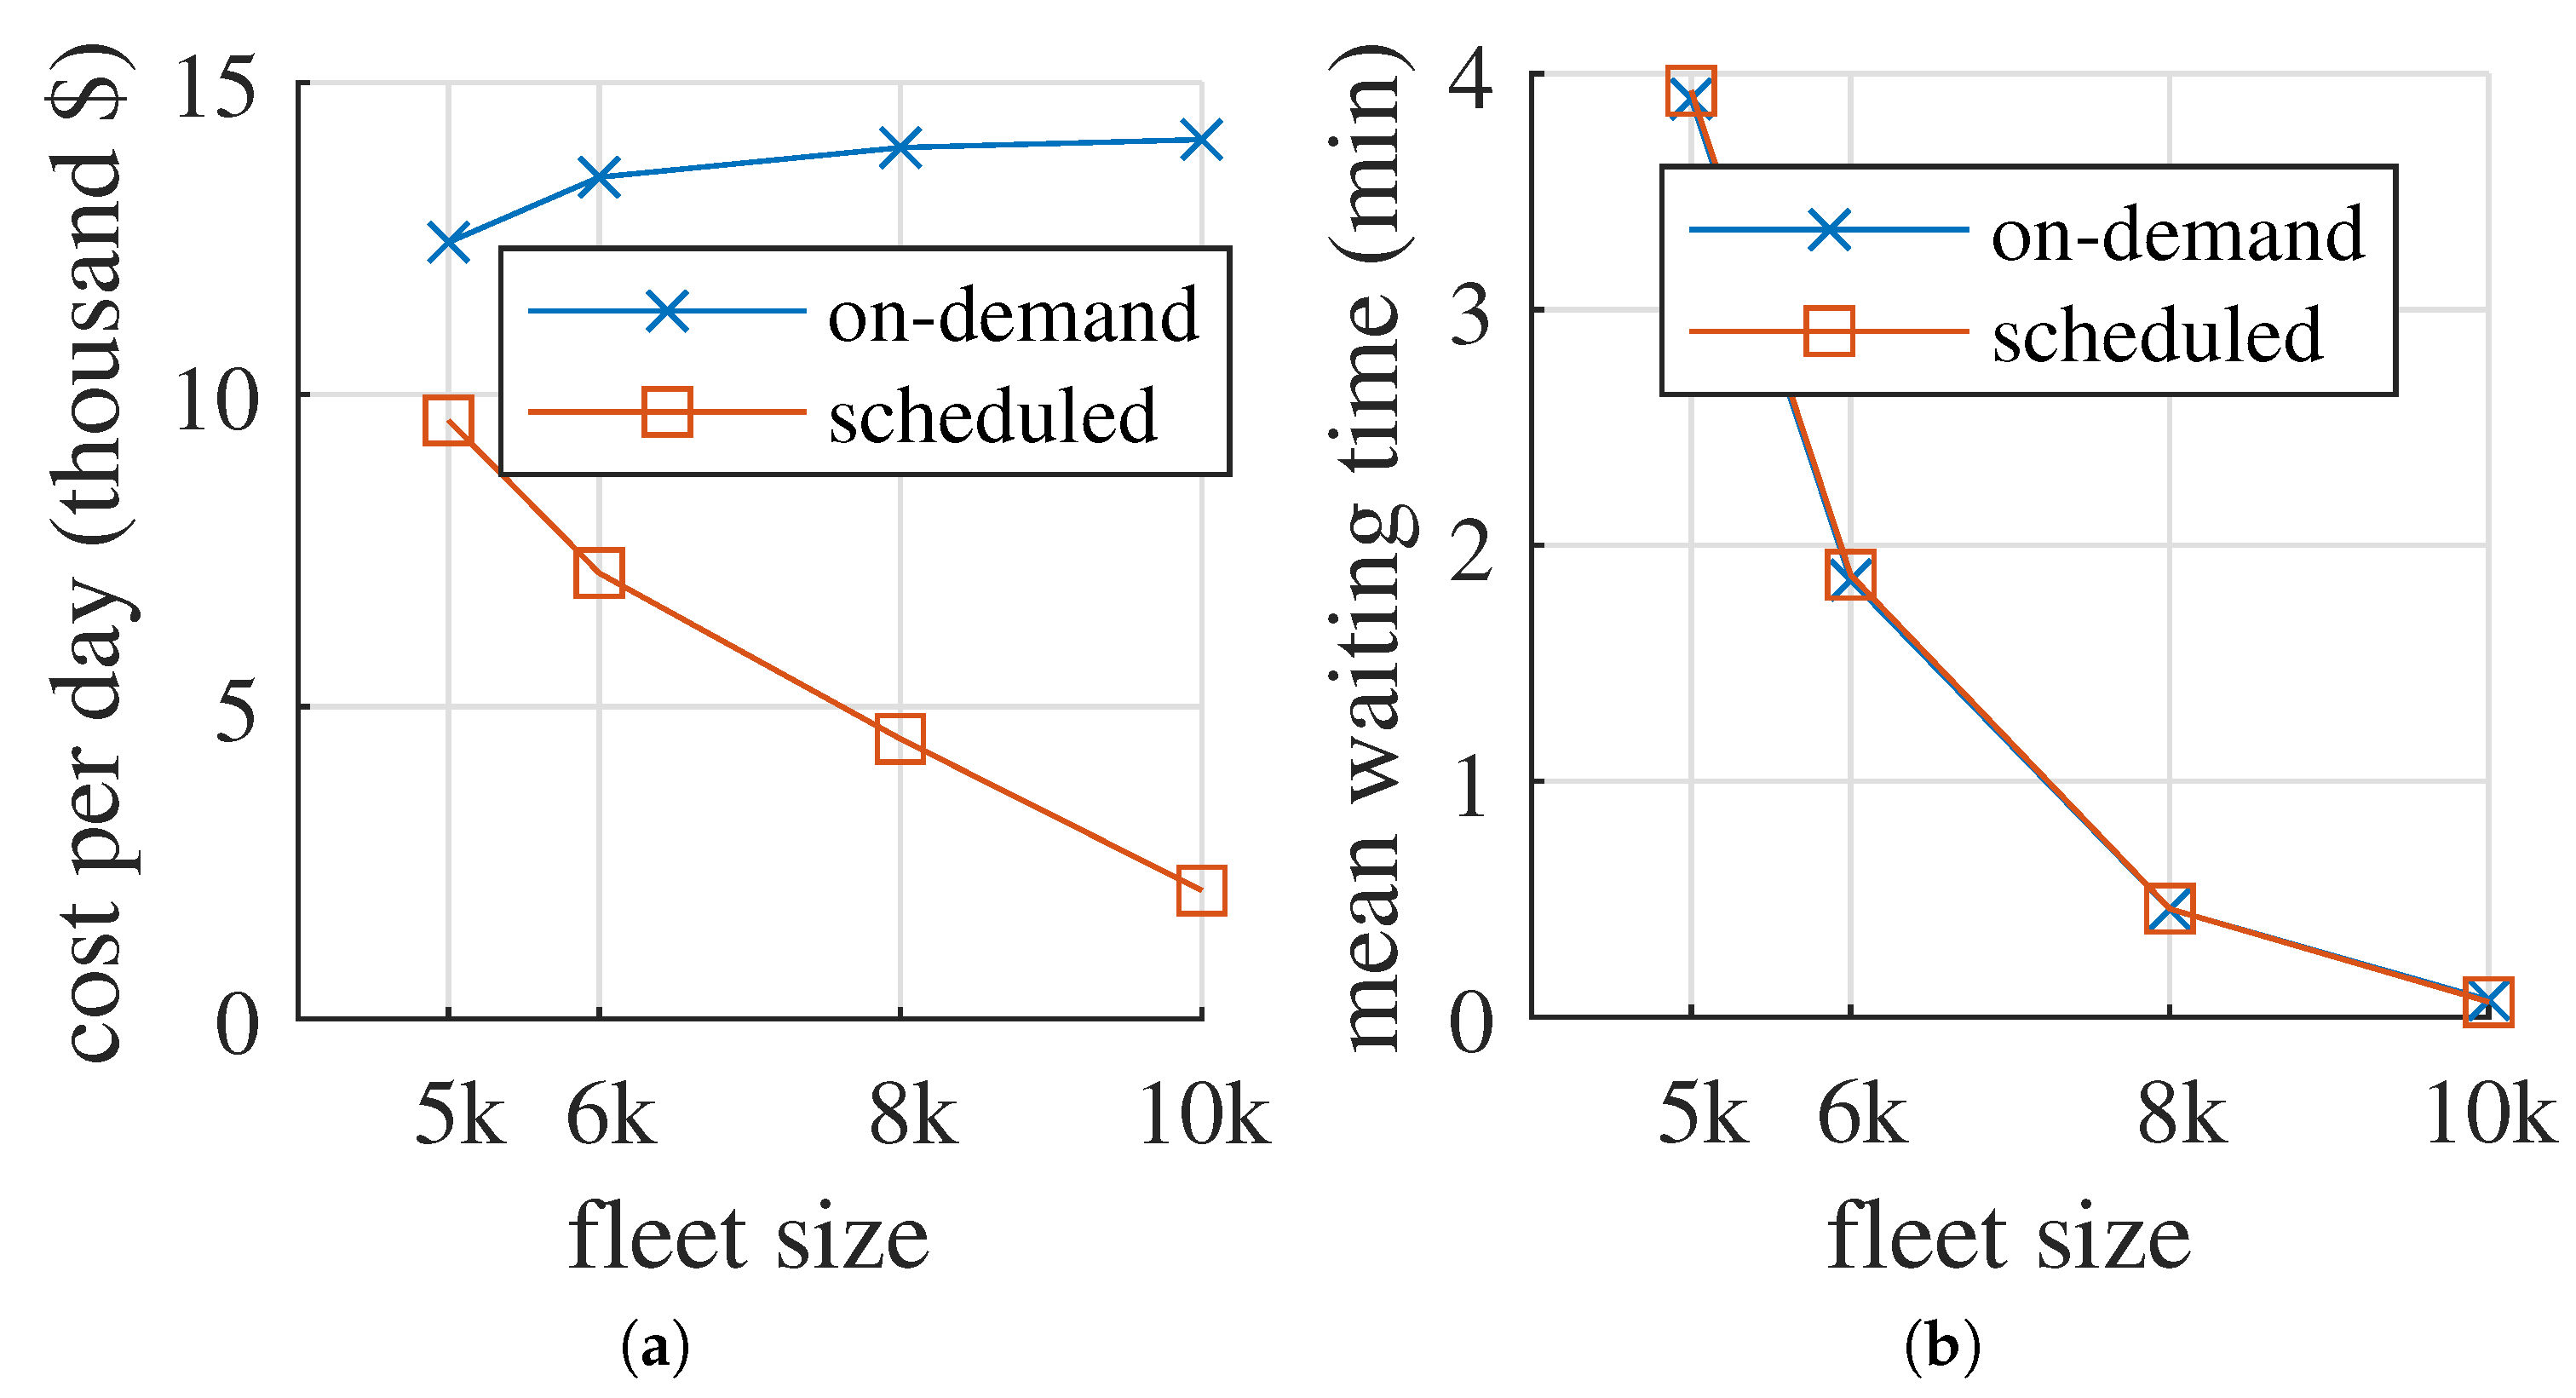
Figure 13 shows that, as expected, waiting time decreased quickly with larger fleets, and the charging scheduling had no effect on the waiting times, even for smaller fleets. Charging costs were always lower for our proposed scheduled charging, and got lower as the fleet size increased. This was because vehicles have more freedom to charge at moments of lower electricity prices. As the fleet got larger, it increasingly behaved as a stationary battery. This suggests that the optimal fleet size may be also influenced by the electricity prices. In particular, higher and more variable prices may induce fleet operators to have more vehicles, so that charging is cheaper. This has a positive effect on transport service too, decreasing waiting times for passengers.
6. Conclusions
We developed a scalable and simply integrated optimisation-simulation framework for the operation of shared autonomous electric vehicles. The framework optimises both real-time relocation and vehicle charging based on dynamic electricity price signals. We ran our model on a large dataset of taxi trips in New York City over four weeks, with a total of about 8.7 million trips. In our simulations, our proposed charging strategy significantly decreased charging costs and carbon emissions, especially in grids with high penetration of renewable energy. These results are promising for the future integration of the transport system and the electricity system in view of the shift towards a clean energy system.
The framework is quite general, and can also be applied to a conventional electric taxi fleets with drivers. Moreover, thanks to its scalability and speed, our framework can be used to evaluate infrastructure and investment decisions in more realistic settings by running simulations.
A limitation of our model is that we assume that each node has a charging station with unlimited capacity. In future work, we plan to relax this assumption, and study the optimal charging station positioning and sizing. We also assumed a static demand that does not depend on the transport service or price. By allowing a responsive demand, the model could incorporate dynamic pricing for trips, depending on the current transport demand, fleet status, and electricity prices. This is an interesting avenue for future extension of this model, as dynamic pricing can significantly increase the efficiency of ride-hailing systems [
47].
Furthermore, there are clearly a range of other future work directions that could be pursued. For example, we discussed the trade-off between fleet size and service quality, but also trade-offs between (types of) charging infrastructure and vehicle costs can be investigated. Our work suggests that the trade-off will also likely depend on the expected time-of-day energy prices.
Author Contributions
Conceptualization, R.I. and R.B.; methodology, R.I.; software, R.I.; validation, R.I., R.B. and J.-D.S.; formal analysis, R.I.; investigation, R.I.; resources, R.I. and J.-D.S.; data curation, R.I.; writing—original draft preparation, R.I. and R.B.; writing—review and editing, J.-D.S.; visualization, R.I.; supervision, J.-D.S.; project administration, J.-D.S.; funding acquisition, J.-D.S. All authors have read and agreed to the published version of the manuscript.
Funding
We acknowledge the financial support of JSPS project 19F19768 that allowed us to conduct this research.
Data Availability Statement
Conflicts of Interest
The authors declare no conflict of interest.
References
- IEA. CO2 Emissions from Fuel Combustion 2018; International Energy Agency: Paris, France, 2018. [Google Scholar]
- IRENA. Global Energy Transformation: A Roadmap to 2050; International Renewable Energy Agency: Paris, France, 2018. [Google Scholar]
- Vuuren, D.P.V.; Stehfest, E.; Gernaat, D.E.H.J.; Berg, M.V.D.; Bijl, D.L.; Boer, H.S.D.; Daioglou, V.; Doelman, J.C.; Edelenbosch, O.Y.; Harmsen, M.; et al. Alternative pathways to the 1.5 °C target reduce the need for negative emission technologies. Nat. Clim. Chang. 2018, 8, 391. [Google Scholar] [CrossRef]
- Ecofys. Energy Transition Within 1.5 °C—A Disruptive Approach to 100% Decarbonisation of the Global Energy System by 2050; Navigant Consulting: Chicago, IL, USA, 2018. [Google Scholar]
- Fagnant, D.J.; Kockelman, K.M. The travel and environmental implications of shared autonomous vehicles, using agent-based model scenarios. Transp. Res. Part C Emerg. Technol. 2014, 40, 1–13. [Google Scholar] [CrossRef]
- White, J. Waymo Opens Driverless Robo-taxi Service to the Public in Phoenix. Reuters 2020. Available online: https://www.reuters.com/article/us-waymo-autonomous-phoenix-idUSKBN26T2Y3 (accessed on 13 December 2019).
- Silver, D. AutoX Launches Driverless Robotaxis to the Public in Shenzhen. Forbes 2021. Available online: https://www.forbes.com/sites/davidsilver/2021/01/27/autox-launches-driverless-roboaxis-in-shenzhen/?sh=18a542417d2a (accessed on 13 December 2019).
- Kon, F.; Braghetto, K.; Santana, E.Z.; Speicys, R.; Guerra, J.G. Toward smart and sustainable cities. Commun. ACM 2020, 63, 51–52. [Google Scholar] [CrossRef]
- Acheampong, R.A.; Cugurullo, F.; Gueriau, M.; Dusparic, I. Can autonomous vehicles enable sustainable mobility in future cities? Insights and policy challenges from user preferences over different urban transport options. Cities 2021, 112, 103134. [Google Scholar] [CrossRef]
- Dispenza, G.; Antonucci, V.; Sergi, F.; Napoli, G.; Andaloro, L. Development of a multi-purpose infrastructure for sustainable mobility. A case study in a smart cities application. Energy Procedia 2017, 143, 39–46. [Google Scholar] [CrossRef]
- Santana, E.F.Z.; Covas, G.; Duarte, F.; Santi, P.; Ratti, C.; Kon, F. Transitioning to a driverless city: Evaluating a hybrid system for autonomous and non-autonomous vehicles. Simul. Model. Pract. Theory 2021, 107, 102210. [Google Scholar] [CrossRef]
- Illgen, S.; Höck, M. Literature review of the vehicle relocation problem in one-way car sharing networks. Transp. Res. Part B Methodol. 2019, 120, 193–204. [Google Scholar] [CrossRef]
- Narayanan, S.; Chaniotakis, E.; Antoniou, C. Shared autonomous vehicle services: A comprehensive review. Transp. Res. Part C Emerg. Technol. 2020, 111, 255–293. [Google Scholar] [CrossRef]
- Zhang, R.; Rossi, F.; Pavone, M. Model predictive control of autonomous mobility-on-demand systems. In Proceedings of the 2016 IEEE International Conference on Robotics and Automation (ICRA), Stockholm, Sweden, 16–21 May 2016; pp. 1382–1389. [Google Scholar] [CrossRef]
- Zhang, R.; Pavone, M. Control of robotic mobility-on-demand systems: A queueing-theoretical perspective. Int. J. Robot. Res. 2016, 35, 186–203. [Google Scholar] [CrossRef]
- Iacobucci, R.; Bruno, R.; Boldrini, C. A Multi-Stage Optimisation Approach to Design Relocation Strategies in One-Way Car-Sharing Systems with Stackable Cars; Consiglio Nazionale delle Ricerche: Pisa, Italy, 2020. [Google Scholar]
- Mukherjee, J.C.; Gupta, A. A Review of Charge Scheduling of Electric Vehicles in Smart Grid. IEEE Syst. J. 2015, 9, 1541–1553. [Google Scholar] [CrossRef]
- Liu, L.; Kong, F.; Liu, X.; Peng, Y.; Wang, Q. A review on electric vehicles interacting with renewable energy in smart grid. Renew. Sustain. Energy Rev. 2015, 51, 648–661. [Google Scholar] [CrossRef]
- Richardson, D.B. Electric vehicles and the electric grid: A review of modeling approaches, Impacts, and renewable energy integration. Renew. Sustain. Energy Rev. 2013, 19, 247–254. [Google Scholar] [CrossRef]
- Chen, T.D.; Kockelman, K.M.; Hanna, J.P. Operations of a shared, autonomous, electric vehicle fleet: Implications of vehicle & charging infrastructure decisions. Transp. Res. Part A Policy Pract. 2016, 94, 243–254. [Google Scholar] [CrossRef]
- Bauer, G.S.; Greenblatt, J.B.; Gerke, B.F. Cost, Energy, and Environmental Impact of Automated Electric Taxi Fleets in Manhattan. Environ. Sci. Technol. 2018, 52, 4920–4928. [Google Scholar] [CrossRef] [PubMed]
- Loeb, B.; Kockelman, K.M.; Liu, J. Shared autonomous electric vehicle (SAEV) operations across the Austin, Texas network with charging infrastructure decisions. Transp. Res. Part C Emerg. Technol. 2018, 89. [Google Scholar] [CrossRef]
- Vosooghi, R.; Puchinger, J.; Bischoff, J.; Jankovic, M.; Vouillon, A. Shared autonomous electric vehicle service performance: Assessing the impact of charging infrastructure. Transp. Res. Part D Transp. Environ. 2020, 81, 102283. [Google Scholar] [CrossRef]
- Zhang, H.; Sheppard, C.J.; Lipman, T.E.; Zeng, T.; Moura, S.J. Charging infrastructure demands of shared-use autonomous electric vehicles in urban areas. Transp. Res. Part D Transp. Environ. 2020, 78, 102210. [Google Scholar] [CrossRef]
- Bauer, G.S.; Phadke, A.; Greenblatt, J.B.; Rajagopal, D. Electrifying urban ridesourcing fleets at no added cost through efficient use of charging infrastructure. Transp. Res. Part C Emerg. Technol. 2019, 105, 385–404. [Google Scholar] [CrossRef]
- Pruckner, M.; Eckhoff, D. Shared Autonomous Electric Vehicles and the Power Grid: Applications and Research Challenges. In Proceedings of the 2020 IEEE PES Innovative Smart Grid Technologies Europe (ISGT-Europe), Delft, The Netherlands, 26–28 October 2020; pp. 1151–1155. [Google Scholar] [CrossRef]
- Cao, Y.; Li, D.; Zhang, Y.; Chen, X. Joint Optimization of Delay-Tolerant Autonomous Electric Vehicles Charge Scheduling and Station Battery Degradation. IEEE Internet Things J. 2020, 7, 8590–8599. [Google Scholar] [CrossRef]
- Pourazarm, S.; Cassandras, C.G.; Wang, T. Optimal routing and charging of energy-limited vehicles in traffic networks: Optimal routing and charging of energy-limited vehicles in traffic networks. Int. J. Robust Nonlinear Control 2016, 26, 1325–1350. [Google Scholar] [CrossRef]
- Ammous, M.; Belakaria, S.; Sorour, S.; Abdel-Rahim, A. Joint Delay and Cost Optimization of In-Route Charging for On-Demand Electric Vehicles. IEEE Trans. Intell. Veh. 2020, 5, 149–164. [Google Scholar] [CrossRef]
- Iacobucci, R.; McLellan, B.; Tezuka, T. Modeling shared autonomous electric vehicles: Potential for transport and power grid integration. Energy 2018, 158, 148–163. [Google Scholar] [CrossRef]
- Iacobucci, R.; McLellan, B.; Tezuka, T. The Synergies of Shared Autonomous Electric Vehicles with Renewable Energy in a Virtual Power Plant and Microgrid. Energies 2018, 11, 2016. [Google Scholar] [CrossRef]
- Iacobucci, R.; McLellan, B.; Tezuka, T. Optimization of shared autonomous electric vehicles operations with charge scheduling and vehicle-to-grid. Transp. Res. Part C Emerg. Technol. 2019, 100, 34–52. [Google Scholar] [CrossRef]
- Iacobucci, R.; Bruno, R. Cascaded Model Predictive Control for Shared Autonomous Electric Vehicles Systems with V2G Capabilities. In Proceedings of the 10th IEEE International Conference on Communications, Control, and Computing Technologies for Smart Grids (SmartGridComm 2019), Beijing, China, 21–23 October 2019. [Google Scholar] [CrossRef]
- Sheppard, C.; Dunn, L.N.; Bae, S.; Gardner, M. Optimal Dispatch of Electrified Autonomous Mobility on Demand Vehicles during Power Outages. arXiv 2020, arXiv:2001.07612. [Google Scholar]
- Guo, G.; Xu, T. Vehicle Rebalancing With Charging Scheduling in One-Way Car-Sharing Systems. IEEE Trans. Intell. Transp. Syst. 2020, 1–10. [Google Scholar] [CrossRef]
- Estandia, A.; Schiffer, M.; Rossi, F.; Luke, J.; Kara, E.C.; Rajagopal, R.; Pavone, M. On the Interaction between Autonomous Mobility on Demand Systems and Power Distribution Networks—An Optimal Power Flow Approach. arXiv 2021, arXiv:1905.00200. [Google Scholar]
- Melendez, K.A.; Das, T.K.; Kwon, C. Optimal operation of a system of charging hubs and a fleet of shared autonomous electric vehicles. Appl. Energy 2020, 279, 115861. [Google Scholar] [CrossRef]
- Spieser, K.; Treleaven, K.; Zhang, R.; Frazzoli, E.; Morton, D.; Pavone, M. Toward a Systematic Approach to the Design and Evaluation of Automated Mobility-on-Demand Systems: A Case Study in Singapore. In Road Vehicle Automation; Meyer, G., Beiker, S., Eds.; Springer International Publishing: Cham, Switzerland, 2014; pp. 229–245. [Google Scholar]
- Boldrini, C.; Bruno, R.; Laarabi, M.H. Weak signals in the mobility landscape: Car sharing in ten European cities. EPJ Data Sci. 2019, 8, 7. [Google Scholar] [CrossRef]
- Castillo, J.; Knoepfle, D.T.; Weyl, E.G. Surge Pricing Solves the Wild Goose Chase. SSRN Electron. J. 2017. [Google Scholar] [CrossRef]
- City of New York. TLC Trip Record Data. Available online: https://www1.nyc.gov/site/tlc/about/tlc-trip-record-data.page (accessed on 7 June 2019).
- Harlow, J.E.; Ma, X.; Li, J.; Logan, E.; Liu, Y.; Zhang, N.; Ma, L.; Glazier, S.L.; Cormier, M.M.E.; Genovese, M.; et al. A Wide Range of Testing Results on an Excellent Lithium-Ion Cell Chemistry to be used as Benchmarks for New Battery Technologies. J. Electrochem. Soc. 2019, 166, A3031–A3044. [Google Scholar] [CrossRef]
- BNEF. Electric Vehicle Outlook 2020. 2019. Available online: https://about.newenergyfinance.com/electric-vehicle-outlook/ (accessed on 13 December 2019).
- Chen, T.; Zhang, X.P.; Wang, J.; Li, J.; Wu, C.; Hu, M.; Bian, H. A Review on Electric Vehicle Charging Infrastructure Development in the UK. J. Mod. Power Syst. Clean Energy 2020, 8, 193–205. [Google Scholar] [CrossRef]
- Lazzeroni, P.; Olivero, S.; Repetto, M.; Stirano, F.; Vallet, M. Optimal battery management for vehicle-to-home and vehicle-to-grid operations in a residential case study. Energy 2019, 175, 704–721. [Google Scholar] [CrossRef]
- NYISO. Energy Market & Operational Data. Available online: https://www.nyiso.com/energy-market-operational-data (accessed on 13 December 2019).
- Iacobucci, R.; Schmöcker, J. Dynamic pricing for ride-hailing services considering relocation and mode choice. In Proceedings of the 7th IEEE International Conference on Models and Technologies for Intelligent Transportation Systems (MT-ITS 2021), Online, 16–17 June 2021. [Google Scholar]
Figure 1.
An outline of the timeline for the integrated simulation and optimisation framework.
Figure 1.
An outline of the timeline for the integrated simulation and optimisation framework.
Figure 2.
Functional architecture of the proposed framework.
Figure 2.
Functional architecture of the proposed framework.
Figure 3.
Simplified flowchart of the framework.
Figure 3.
Simplified flowchart of the framework.
Figure 4.
A map of the origin and destination locations of trips in the dataset during three 2-h periods on Wednesday, 20 January 2016. Red dots represent origins; blue dots represent destinations.
Figure 4.
A map of the origin and destination locations of trips in the dataset during three 2-h periods on Wednesday, 20 January 2016. Red dots represent origins; blue dots represent destinations.
Figure 5.
A map of (a) Manhattan; (b) the 200 zones and their centroids, in which we aggregated the trip origin and destination locations.
Figure 5.
A map of (a) Manhattan; (b) the 200 zones and their centroids, in which we aggregated the trip origin and destination locations.
Figure 6.
Carbon intensity for the three scenarios considered.
Figure 6.
Carbon intensity for the three scenarios considered.
Figure 7.
Daily profiles of carbon intensity for scenarios (a) NYISO and (b) DE-S. The influence of solar generation is clearly visible in the German case.
Figure 7.
Daily profiles of carbon intensity for scenarios (a) NYISO and (b) DE-S. The influence of solar generation is clearly visible in the German case.
Figure 8.
Total charging costs and mean waiting times for the benchmark models and the proposed model. Results are for the scaled-down scenario with 10 nodes over 5 days.
Figure 8.
Total charging costs and mean waiting times for the benchmark models and the proposed model. Results are for the scaled-down scenario with 10 nodes over 5 days.
Figure 9.
Computational time (log scale) for the benchmark models and the proposed model.
Figure 9.
Computational time (log scale) for the benchmark models and the proposed model.
Figure 10.
Average SoC of the fleet during a week in scenario DE-S for the night charging strategy and the proposed scheduled strategy.
Figure 10.
Average SoC of the fleet during a week in scenario DE-S for the night charging strategy and the proposed scheduled strategy.
Figure 11.
Daily charging profiles for (a) night charging and (b) scheduled charging in scenario DE-S. Each line represents one day. The influence of solar generation on the scheduling is clearly visible, as is the V2G during morning and evening peak grid times.
Figure 11.
Daily charging profiles for (a) night charging and (b) scheduled charging in scenario DE-S. Each line represents one day. The influence of solar generation on the scheduling is clearly visible, as is the V2G during morning and evening peak grid times.
Figure 12.
(a) The power exchanged by the fleet and the electricity price during a week for the NYISO scenario with scheduled charging; (b) zoom on the first day, also showing the charging module set point (CM).
Figure 12.
(a) The power exchanged by the fleet and the electricity price during a week for the NYISO scenario with scheduled charging; (b) zoom on the first day, also showing the charging module set point (CM).
Figure 13.
Effects of fleet size on: (a) average charging costs and (b) mean waiting times for different charging strategies.
Figure 13.
Effects of fleet size on: (a) average charging costs and (b) mean waiting times for different charging strategies.
Table 1.
Notation.
| Indexes and Sets |
| i,j | nodes |
| v | vehicle |
| t | time step |
| k | relocation module invocation |
| u | charging module invocation |
| m | charging optimisation time intervals () |
| model variables |
| imbalance at node i |
| no. of passengers with origin i |
| no. of passengers with destination i |
| vehicles to be relocated from i to j |
| energy charged by vehicle v during time step t |
| energy discharged to grid by vehicle v during t |
| state of charge (SoC) of vehicle v at start of t |
| state variable to denote v is grid-connected during t |
| state variable to denote v is moving during t |
| destination of vehicle v at t |
| distance to destination |
| maximum energy transferable by fleet during m |
| aggregate energy to charge during m |
| aggregate energy to discharge during m |
| aggregate energy stored in fleet at start of m |
| aggregate relocation time during m |
| aggregate trip time during m |
| model parameters |
| V | number of vehicles |
| length of simulation time interval |
| relocation module period |
| charging module period |
| max. time for relocating activities |
| relocation prediction horizon |
| charging optimisation horizon |
| travel time between nodes (in time steps) |
| minimum SoC |
| minimum SoC for discharging to grid |
| extra SoC for charging module |
| electricity price during m ($/kWh) |
| carbon intensity (g/kWh) |
| carbon price during m ($/g) |
| vehicle technical parameters |
| See Table 2 |
Table 2.
Technical assumptions.
Table 2.
Technical assumptions.
| Variable | | Value | Unit |
|---|
| consumption | 0.075 | kWh/min |
| battery cycling cost | 0.025 | $/kWh |
| B | battery capacity | 50 | kWh |
| power connection | 20 | kW |
| round-trip efficiency | 0.9 | – |
Table 3.
Results over 4 weeks.
Table 3.
Results over 4 weeks.
| Scenario | | Cost per Day ($) | Ton CO2 per Day |
|---|
| NYISO | night | 9953 | 57.8 |
| on-demand | 11,940 | 65.1 |
| scheduled | 7385 | 58.9 |
| DE-W | night | 13,639 | 111.6 |
| on-demand | 17,289 | 119.3 |
| scheduled | 11,136 | 104.5 |
| DE-S | night | 9890 | 100.1 |
| on-demand | 10,567 | 94.2 |
| scheduled | 4785 | 78.8 |
| Publisher’s Note: MDPI stays neutral with regard to jurisdictional claims in published maps and institutional affiliations. |
© 2021 by the authors. Licensee MDPI, Basel, Switzerland. This article is an open access article distributed under the terms and conditions of the Creative Commons Attribution (CC BY) license (https://creativecommons.org/licenses/by/4.0/).
