Article

Analysis of the Velocity Distribution in the Plenum Box with Various Entries

1
Faculty of Civil Engineering and Resource Management, AGH University of Science and Technology, al. Mickiewicza 30, 30-059 Kraków, Poland
2
Faculty of Energy and Fuels, AGH University of Science and Technology, al. Mickiewicza 30, 30-059 Kraków, Poland
*
Author to whom correspondence should be addressed.
Energies 2021, 14(12), 3630; https://doi.org/10.3390/en14123630
Submission received: 28 May 2021 / Revised: 14 June 2021 / Accepted: 16 June 2021 / Published: 18 June 2021
(This article belongs to the Special Issue Ventilation and Building Energy Systems)

Abstract

:
The ventilation system plays a crucial role in every building. Proper design and optimization of its operation increase the comfort of users due to efficient air exchange and at the same time control its velocity in the rooms. The aim of this paper is the analysis of the effect of plenum box entry on the velocity profile concerning the diffuser face panel. This issue may sometimes be ignored at the design stage but can significantly affect the airflow from the diffuser and consequently increase the risk of draft. The results of the PIV experimental measurements and numerical simulations concerning various entries of the plenum box (top and side) were investigated in this study. The measurements were used to develop the mathematical and numerical models, which were then used to assess the effect of localization of the spigot of the plenum box on its operation. The numerical analysis was carried out on plenum boxes with the air diffuser with a face panel composed of square grid perforations. Analyses show that the entries significantly affect both the way of air distribution inside the plenum box and the profile of the airflow and its velocity under the simulated air diffuser.

Graphical Abstract

1. Introduction

The main task of any ventilation and air-conditioning system in rooms is to maintain suitable air quality and ensure optimum conditions for the occupants. Depending on the function of the building and the activity of people inside, the supply air parameters are determined to guarantee the thermal comfort of users. Thermal comfort is defined as conditions in which people do not feel excessively cool or hot. In addition to the basic parameters of temperature and humidity, many other aspects determine the satisfaction of occupants concerning the ambient conditions. These include air velocity, asymmetries of temperature distribution in the room, and thermal radiation of surfaces [1,2,3]. The first two factors are directly related to the ventilation system used, the air distribution, and the diffusers used. Since the air motion in a room is influenced by a balance of inertia, buoyancy, and viscosity, the air velocity has the most impact. Depending on the diffuser type, a distinction can be made between axisymmetric, flat, radial, and vortex airflow. The selection, location, number, and types of supply diffusers are essential to achieve suitable air quality and optimal thermal condition in the ventilated space [4,5].
The most important role of the ventilation system includes avoiding drafts and uncomfortable local turbulence and ensuring a uniform temperature distribution. Air velocities in the occupied zone should not exceed the design values, providing the comfort of users. In the literature, many recommendations for maximum velocity can be found. According to the American Society of Heating Refrigerating and Air-Conditioning Engineers (ASHRAE) [6], air velocities in the occupied zone should remain below 0.25 m/s, assuming that the occupied zone is any place where there are people. In general, the occupied zone is defined as the volume of the room between floor level and 1.8 m above the floor. In heating, ventilation, and air-conditioning (HVAC) systems, it is recommended to limit the air motion in the occupied zone to less than 0.2 m/s to minimize the risk of draft [1]. In ventilation system design practice, this velocity is usually treated as a limit value.
Air is usually supplied to a room through diffusers located on the ceiling or wall. The way air is distributed into the room is closely related to the construction of the air diffuser. A number of research studies on air distribution from diffusers can be found in the literature [7,8], including those using a numerical calculation [9,10]. Yao and Lin [11] analyzed the effect of air terminal types on the performance of stratum ventilation with four types of air terminals devices using experimental and numerical methods. The study showed that the type of diffuser has little impact on the temperature distribution in the room but significantly affects the airflow in the room. The results of experimental and numerical studies were also compared by the authors Martinez-Almansa et al. [12], where a wall diffuser was analyzed. The method proposed by the authors made it possible to obtain a very accurate model reflecting the real conditions. On this basis, the characteristic parameters, throw and drop of the diffuser, as well as pressure drop of the terminal device used in the design ventilation systems, were determined. On the other hand, Noncente et al. [13] performed the optimization of diffuse ceiling ventilation. The study included different configurations, a full ceiling panel distribution, and a chessboard distribution. Jaszczur et al. [14] used experimental and numerical methods to study the flow characteristic from a four-way square ceiling diffuser. Authors have shown the relationship between the range of the stream defined as the distances in which the air velocity is 0.5 m/s and the volume flow of supply air by the diffuser. The analysis of the vortex, round, and square ceiling diffusers conducted by Aziz et al. [15] showed that the velocity decay coefficient of the vortex diffuser is 2.6 times smaller than that of the other types. Therefore, vortex diffusers are recommended for high buildings as well as require less energy input to the fan. In the literature, many studies can be found that investigated vortex diffusers, which properties provide a very unusual air distribution in the room. Srebric and Chen [16] demonstrated that the distance at which the vortex airflow loses its tangential component depends on the velocity of the flowing air and the geometry of the diffuser. In similar studies, Shakerin and Miller [17] showed that isothermal flow from vortex diffusers rotates at the outlet, but at a distance of three diffuser diameters, the air disperses in a radial direction. In [18,19] Borowski et al. presented a comparison of experimental results obtained using PIV measurements with numerical results. The authors studied the air distribution for different Reynolds numbers. The topic of vortex diffusers was also addressed by Sajadi et al. [20]. The results show that the efficiency of the diffuser and the resulting distribution of the airflow in the rooms depend to a large extent on the angle of the blades. According to the analysis, the optimum blade angle is 32 degrees, and when changing the angle in the range of 30–35 degrees, very large differences in flow distribution are observed.
The diffusers are usually connected to the installation by using a plenum box. Both plenum boxes with side and top entry (see Figure 1) are widely used. The plenum boxes are equipped with perforated panels, which should ensure proper and uniform distribution of the air stream.
When designing ventilation systems, designers usually follow the technical data of air terminals devices, which are provided by manufacturers. Among the available information, one may find data on the range of the diffuser, but very often, there is no information on how to mount the diffuser for which properties are valid. One of the factors which significantly affects the distribution of the velocity of the air flowing through the diffuser is the type of plenum box used. The experimental analysis presented by Hongze et al. [21] showed that the airflow from the plenum box with side entry is highly asymmetrical. The elements that significantly affect the shape of the stream flowing out of the diffuser are the blades, their shape, and their placement. The work carried out by Villafruela et al. [22] focuses on the effect of plenum box on airflow from vortex diffusers. The authors presented the results of both experimental measurements and numerical simulation. The study showed that simulations of a simplified plane in place of the plenum box with an air diffuser, where the velocity components and the position of the slots are determined by a specified boundary condition, properly reflect the results obtained using simulations of the full diffuser geometry including the plenum box. In addition, an analysis of the airflow from the diffusers using both types of boxes has been carried out. It has been found that the velocity distribution from the diffuser is uniform for the top entry plenum box, while for the box with the side entry, asymmetry is visible. Numerical simulations were carried out using ANSYS Fluent software. During the analysis, the authors used three plenum box models, with side entry, top entry, and modeled as a simplified plane and applied the RNG k-ε turbulence model. Smoljan and Balen [23], on the other hand, show that in both boxes with and without perforations, the airflow is asymmetric, but in the case of a diffuser with a perforated panel, the symmetry of the airflow is improved. An extensive analysis of the effect of plenum boxes and their geometry was presented in the paper of Vasic et al. [24]. The authors proposed additional perforated alignment surfaces mounted inside the box at an estimated angle. Optimization included panels with different clearance surfaces, including those with air guidance blades. The investigation has shown that the use of an air guidance blade solution ensures greater airflow uniformity and symmetry of the airflow coming out of the diffuser. At the same time, the proposed solution does not increase the pressure drop compared to a typical perforated panel.
As shown in the literature, the impact of the plenum box on ventilation system operation has been mainly investigated using numerical analysis. Furthermore, there are no results of experimental measurements presenting the velocity distribution inside the plenum box that might facilitate the verification of the numerical analyses. Therefore, in this work, the airflow inside the plenum box is presented. The differences in the airflow on the diffuser panel using a plenum box with a side and top entry are determined and assessed. In addition to the experimental measurements using the PIV method, the numerical model is investigated and validated. The paper is divided into five Sections, which describe the procedure and the results obtained. This Section was intended to introduce the subject of numerical simulations used for the evaluation and optimization of ventilation systems and previous research on plenum boxes. Section 2 describes the methodological approach both during the experimental investigations and during the numerical calculations. Section 3 presents the results obtained, which are then analyzed in Section 4. Section 5 presents the main conclusions.

2. Materials and Methods

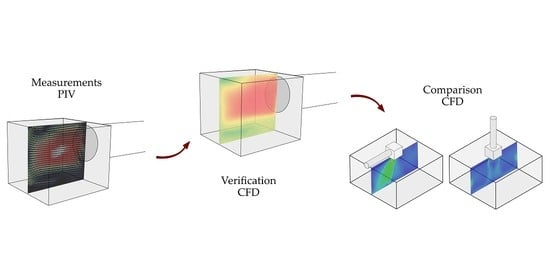
2.1. Experimental Measurement

In order to determine the distribution of velocity components in the test plenum box, the particle image velocimetry method by means of 2D PIV was selected. This method is used to measure the air velocity field and is an optical and non-invasive research method. In this method, a tracer is injected into the flowing air, and its movement is recorded using a fast dual-CCD 2048 × 2048 pixels camera (see Figure 2). The camera was equipped with a Canon lens with a focal length of 50 mm and a minimum aperture value of 1.8. During the calculations, the size of interrogation windows that exhibit satisfying results was set to 64 × 64–32 × 32 pixels. On the basis of statistical analysis, at least 250 uncorrelated dual images of the same exposure were taken at specific time intervals in order to evaluate proper accuracy for the velocity magnitude and direction of air motion. The velocity measurement is performed in the whole plane illuminated by the double-pulse YAG:Nd laser by Litron Lasers of energy of about 60 mJ per pulse. Images were recorded with a frame rate of 4 Hz, which resulted in an overall time of one measure of around 1 min. Time ∆t between two subsequent frames varied from about 100 to 500 µs depends on flow velocity. Before performing the measurements, it is necessary to carry out a calibration of the measurement system to avoid optical distortion. During this calibration, using special calibration panels, the distance between the control points is determined, which facilitates establishing the scale factor necessary to determine the velocity [25,26]. The PIV measurement system has been manufactured by LaVision company. The frame analysis and post-processing were performed using Davis software, version 7.2.
A photo of the test stand, including the calibration plate, is shown in Figure 3a. Tests were conducted for a plenum box with a side entry. The dimensions of the box were: 370 mm × 370 mm × 330 mm, as shown in Figure 3b. The spigot was 200 mm in diameter, and its axis was located at the central point of the box width, 120 mm from the top edge of the plenum box. Inside the plenum box, 50 mm from its outlet, a mounting bracket designed for installing the diffuser in the box was fixed. To evaluate the velocity field inside the box, it was made of transparent material. Polymethylmethacrylate plexiglass was used.
The tests were carried out for the measuring plane passing through the axis of the plenum box connection, conventionally designated as Z-Y (Figure 3b). As the 2D PIV method was used for the measurements, it was decided to select the plane where the highest intensity of movement in the direction of the analyzed axes was expected, i.e., Z and Y. Based on preliminary analyses, it was concluded that for this plane the movement along the X-axis can be considered as not relevant. The measurement was carried out for isothermal conditions for a velocity at the spigot of 2.3 m/s, i.e., for a flow rate equal to 260 m3/h. Assuming that the characteristic dimension is the diameter of the plenum box connection, it gives the Reynolds number around 30 530. For pipes, this value of Reynold number indicates the turbulent flow.

2.2. Numerical Analyses

Fluid flow was modeled based on three-dimensional, steady-state continuity and momentum equations. The RANS (Reynolds-averaged Navier–Stokes equation) equation for the incompressible fluid can be written as [27,28]:
U i x i = 0
U i t + U j U i x j = 1 ρ P x i + x j ( ν t U i x j u i u j ¯ )
u i u j ¯ = ν t ( U i x j + U j x i ) 2 3 ρ k δ i j
where U —velocity, ρ —density, P —pressure, ν t —turbulent viscosity, k —kinetic energy, and δ i j —Kronecker delta.
Considering the importance of the turbulence models for numerical simulations and the accuracy of the obtained results, three different turbulence models were tested, namely SST k − ω, k − ϵ RNG, and k − ϵ Realizable [29,30].
ν t = { C μ k 2 ε     k ε   m o d e l s α * k ω     k ω   m o d e l s
where ω is dissipation per unit turbulence kinetic energy, ε is dissipation rate,   C μ and α * constant.
In this research study, numerical simulation of the airflow inside the plenum box was carried out using the CFD modeling method and the ANSYS Fluent solver. The carried out calculations were divided into two stages. The first was to verify the mathematical and numerical model, and the results obtained from the calculations were compared with the measurements. The experimental measurements were used to verify the computational model. The second stage was the calculations, with the setup developed at the earlier stage. The numerical model was used in a comparative analysis between a plenum box with side and top entry.

2.2.1. Verification of Computational Models

For the numerical calculations, a 3D geometry was prepared using Design-Modeler. The computational domain comprised the plenum box with its side entry and its surroundings area formed by a 2000 mm × 2000 mm × 1000 mm cuboid (Figure 4). The dimensions of the plenum box were an accurate representation of the box used in the current measurements. Inside it, an accurate representation of the mounting bracket was also created. In the analysis carried out, the plenum box was located in the central part of the ceiling.
The spigot of the plenum box, which was given the condition velocity inlet on the two opposite side walls pressure outlet, was set at 0 Pa. The dimensions of air outlets from the room were 200 mm × 200 mm. They are located 900 mm below the outlet from the plenum box and halfway along the wall, as shown in Figure 4. As the determination of the shape of the entry airflow into the room was not the focal point of the analysis, the assumed dimensions of the surroundings were taken as sufficient to consider the lack of influence of the walls and outlets on the results of the analyzed parameters. The connection, plenum box walls, and room walls, including the ceiling and floor, were given the condition wall. The coordinates (0, 0, 0) were assumed for the center of the connection to the plenum box at the point of contact with the box wall. Positive Y-values indicate heights above the center line of the plenum box spigot, and negative values indicate heights below. Positive Z-values represent the displacement from the spigot to the plenum box wall.
The simulation began with mesh sensitivity analysis, starting with a very general computational network, improving it gradually to find the best balance between accuracy and computational effort. Simulations were performed for six different meshes. The summary for meshes is presented in Table 1.
For all simulations, the mesh was generated using tetrahedral cells. The growth rate factor was set as 1.2. The curvature normal angle was set at 10°. The view of variants of the computational networks used is shown in Figure 5.
An analysis for different turbulence models was performed in the next stage. The turbulence models used were: k − ϵ RNG, k − ϵ Realizable, and SST k − ω. The simulations were performed for the solver setup shown in Table 2.
To avoid any uncertainty concerning the assumed mesh density for the target analysis, due to the use of a diffuser during their calculations, the calculations were performed again, taking into account the diffuser panel in the discretization but modeling it as an interior. An additional edge sizing equal to 0.0015 m was applied to the diffuser panel.

2.2.2. Comparative Analysis for Plenum Box with Side and Top Entry

The calculations were carried out for the model developed for the setup verification. In the case of the analysis for the plenum box with a top entry, the dimensions of the box were maintained. Only the location of the entry was changed to central at the top of the box (Figure 6). The dimensions of the room, where the air is supplied, do not directly affect the airflow in the plenum box. However, to allow the free outflow from the diffuser, it is necessary to provide the appropriate height of the room. The dimensions of the room have been selected to allow both efficient calculations with high accuracy and the comparison of the air distribution below the diffuser.
The analysis was carried out for plenum boxes with the air diffuser with a perforated face panel with 10 mm square meshes, uniformly distributed over the diffuser surface with 20 mm spacing between the meshes (Figure 7). The selection of this geometry was dictated by the need to assess the influence of the different locations of the plenum box entry on the airflow while minimizing the influence of the diffuser itself. According to the authors, the type of diffuser and its design is very sensitive to the differences in the spigot location in the plenum box. The design of the diffuser may limit the influence of the location of the plenum box connection spigot. The purpose of the study was to determine whether the location of the connection duct impact significantly flow distribution.
The mesh used for the calculations concerning the discretization method was as described for M6, with identical densities on the surface of the diffuser, as was the case when the setup was verified. The models, including the diffuser with plenum box with side and top entry each, had about 5 million cells. The solver setup was as shown in Table 2.

3. Results

3.1. Experimental Results

The measurement results for the plenum box with side entry show that air entered the box at the highest velocity along its axis. Figure 8 shows the air velocity vector field in the plenum box in the plane passing through the center of the spigot. As one might see in the figure, that the high-velocity air reaches the wall of the plenum box opposite to the spigot.
As the air hits the wall, it begins to flow over the surface of the wall, and some air also flows toward the top of the plenum box. A recirculation zone is created in its top corner. The resulting air motion affects the change of position of isotach. At a height of approximately Y = −160 mm, a line of change in airflow direction can be observed. At this point, the air flowing along the box wall hits the mounting bracket and, losing velocity, flows along with a distance of about 200 mm. The results of the measurements also facilitated the determination of the average velocity in the cross-section of the analyzed plenum box (Figure 9).
The highest average velocity magnitude from the analyzed Z-Y plane might be noted, as in the case of the velocity vector field, in the outlet of the spigot. An increase in average velocity might also be observed due to the formation of turbulence in the corner of the box as well as at the mounting bracket.

3.2. Numerical Analyses

3.2.1. Verification of Computational Models

The validity was established by comparing the results from the numerical analyses to the experimental results. The key point was the comparison of the results for two lines Y = 0 mm (along the axis of the spigot) and Z = 350 mm, as shown in Figure 10.
Figure 11a,b presents the results of the numerical analysis for the six variants of the computational meshes and compared them to the experimental results. Among the meshes used for the analysis, two of them, M1 and M2, have resolutions that did not allow for an accurate representation of the flow velocity inside the plenum box. Based on the comparison of the results for the M4 and M5, it was concluded that for the case under study, it is more important to increase the density of the mesh across the plenum box domain than the local increase in density at the wall surface.
Based on the calculations carried out, it was found that for the purposes of further analysis, the mesh resolutions of M5 and M6 are sufficient. This decision was issued based on the most accurate convergence from the meshes analyzed but also by the computation time and the convergence levels obtained during the computation. Further calculations were performed using only the M5 and M6 to select the remaining model setup. Further calculations were more accurate (solver setup shown in Table 2).
Based on the analyses with different turbulence models for meshes M5 and M6, it was found that satisfactory convergence and results were obtained for the k − ϵ Realizable turbulence model. Figure 12 presented the results for mesh M5 for different turbulence models. The k − ϵ RNG and SST k − ω models achieved a worse agreement with experimental results than k − ϵ Realizable. For the M5 mesh, the results obtained for convergence 10−4 and 10−5 were compared. The model accuracy for both of the convergence was similar. Therefore, for further analysis, a sufficient level of convergence at 10−4 was assumed.
For the k − ϵ Realizable turbulence model using M5 and M6 meshes, the analysis was repeated with increasing the density of the mesh as in the analysis with the air diffuser. In this investigation, the diffuser had no wall condition. Better convergence, including the air diffuser, was achieved for the model with the M6; hence, it was selected for the comparative analysis. Visualizations of the distribution of velocity components in the X, Y, Z directions in the plane passing through the center of the plenum box with side entry for the analysis with the air diffuser as the interior surface are shown in Figure 13.
A comparison of the results for the final model setup in reverence to the experimental research is shown in Figure 14. The results are presented in corresponding sections for the verification of the computational mesh M6.
In the Z direction for Y = 0 mm, the velocity components obtained from experimental measurements in the distance 50–250 mm from the spigot outlet, on average, is about 7% higher than that from numerical analysis. For the larger distance, the results from measurements and simulations are very similar. In the Y direction for Z = 350 mm, the velocity obtained from experimental measurements differs only for the distance Y = −120 mm to the plenum box outlet and is higher than that estimated using numerical analysis by about 0.4 m/s. The simulation results obtained were found to be satisfactory, and a further step was taken.

3.2.2. Comparative Analysis for Plenum Box with Side and Top Entry

Figure 15a,b shows a comparison of the numerical results for the plenum box with top and side entry. The results show the distribution of the average velocity in the cross-section X-Z and plane of the perforated panel of the diffuser mounted to both types of the plenum box. The average velocity in the outlet plane of the diffuser is about 2.6 m/s. In the case of the plenum box with side entry, the velocity is distributed asymmetrically. For this type of plenum box, the air, after reaching the wall opposite to the spigot, flows down its surface, which results in the highest velocity on the diffuser panel in the vicinity of this wall. The lowest velocity occurs on the panel near the spigot. In the case of the plenum box with a top entry, the velocity from the spigot flows evenly over the diffuser panel.
The results shown in Figure 16a–d further emphasize the lack of symmetry in the diffuser’s operation due to the location of the spigot. The air flowing out of the plenum box with side entry directs the air so that it is discharged in the direction of the spigot. The use of a perforated panel should ensure airflow toward the floor without any side direction being imparted. The diffuser panel used for the analysis should, with an adequate inflow of air onto its surfaces, set the direction of the airflow as for the plenum box with top entry.
The location of the spigot in the plenum box has a significant impact on the air discharge profile of the air diffuser. In the case of the plenum box with side entry, the airflow on the surface of the diffuser panel is uneven. The dimensions of the plenum box do not allow for leveling velocity profile inside the box. The use of taller plenum boxes with side entry should be considered. The comparison of the distribution of velocity components in the Z direction for Y = 0 mm for a plenum box with side entry without the air diffuser, obtained using experimental measurement and numerical simulation in the same plenum box but with the air diffuser applied, is shown in Figure 17.
As the figure shows, the value of the velocity component vz for the plenum box with the air diffuser is slightly lower. Comparing the results of numerical simulations and experimental measurements for a box without the air diffuser, it is noticeable that the differences are particularly apparent for a distance of 200 mm from the spigot toward the opposite wall of the plenum box.

4. Discussion

This paper presents numerical simulations of plenum boxes with top and side entry equipped with a perforated face panel. Based on the analysis and comparison of the airflow inside the plenum box with top and side entry, one might see the differences and the key role of the plenum box inlet configuration due to the asymmetric airflow after the diffuser in the case of the plenum box with side entry. As shown by the comparison of numerical and experimental results, the proposed model describes the real conditions with sufficient accuracy. The model validation is based on the results of experimental research carried out with the PIV method on a plenum box with side entry. The numerical modeling carried out was divided into two stages, the validation of the model in regard to the measurement data obtained and the airflow analysis using different methods of plenum box entry, respectively. As mentioned in the previous section, the 2D PIV method for the experimental measurements in the Z-Y plane was used. The selection of this approach was based on the secondary importance of the velocity component vx for the presented analysis. The numerical simulation results show that the flow in the X direction can be neglected. As presented in Figure 13, the velocity component vx in the X direction is very low. The numerical results prove that for the analyzed problem and analyzed plane, the measurement method was selected correctly.
The numerical model used in the calculations was verified concerning the velocity distribution in the cross-section along the plenum box axis. Verification was performed along two lines crossing the aforementioned plane: along the axis of the air supply connection and along a vertical section 20 mm from the opposite wall to the plenum box spigot. Figure 11 shows the results carried out for six different meshes. Mesh M5 and M6 with 1,285,344 and 3,679,285 number of elements, respectively, were used as the most accurate. Three turbulence models were used in numerical analysis: k − ϵ RNG, k − ϵ Realizable, and SST k − ω. The simulations carried out for the M5 and M6 with these three turbulent models showed that the results similar to the experimental ones can be obtained using mesh M6 and the k − ϵ Realizable turbulence model. Such a setup was implemented in further analysis.
Figure 15 shows the velocity distribution in the plane of the face panel for both the plenum box with side and top entry. As can be seen, the top entry ensures more regular airflow, mainly in the central part. The side entry, on the other hand, is characterized by asymmetry, and the highest velocities in this plane are obtained at the edge of the wall opposite to the plenum box spigot. The asymmetry of the airflow is clearly visible in Figure 16, where the airflow into the room domain is shown. Based on the analysis and comparison of the airflow inside the plenum box with top and side entry, one might see the differences and the key role of proper installation method due to highly asymmetric airflow on the diffuser in the case of the plenum box with side entry. As shown by the comparison of numerical and experimental results, the presented model reflects the real conditions with sufficient accuracy.

5. Conclusions

Test results show that the plenum box entry has a very significant effect on the dispersion of the air flowing out of the air diffuser. A plenum box with a top entry has a more symmetrical discharge pattern, but due to space constraints, designers prefer plenum boxes with side entries. However, fluid flow asymmetry can be compensated by using perforation panels inside the boxes. The diffuser used for the simulation resembles the perforations that some manufacturers install in plenum boxes parallel to the diffuser panel to even out the airflow. The results obtained may suggest that the use of perforations in the plenum box may help to slow down the velocity vz, but this effect may not be fully satisfactory. Surely, the location of such a perforation and its clearance is not without significance. It should also be emphasized that the use of additional elements, e.g., deflectors or plates, can increase pressure drop as well as generate additional noise. Prepared mathematical and numerical models can be successfully used to extend the analysis for other dimensions for the plenum boxes. The authors consider extending the scope of the analysis to determine the influence of the height of the box with side entry on the alignment of the flow concerning the air diffuser.

Author Contributions

Conceptualization, M.B. and M.J.; methodology, M.J.; software, J.H.; validation, J.H., K.Z., and M.J.; formal analysis, M.B. and M.J.; investigation, M.B. and M.J.; resources, K.Z.; data curation, J.H.; writing—original draft preparation, J.H. and K.Z.; writing—review and editing, M.B. and M.J.; visualization, J.H.; supervision, M.B. and M.J.; project administration, J.H. and K.Z.; funding acquisition, M.B. All authors have read and agreed to the published version of the manuscript.

Funding

The article was supported by the program “Excellence initiative—research university” for the AGH University of Science and Technology.

Institutional Review Board Statement

Not applicable.

Informed Consent Statement

Not applicable.

Data Availability Statement

Data available on request due to privacy restrictions.

Conflicts of Interest

The authors declare no conflict of interest.

References

  1. ANSI/ASHRAE. Thermal Environmental Conditions for Human Occupancy. In Refrigerating and Air-Conditioning Engineers; Standard 55 2017; American Society of Heating: Atlanta, GA, USA, 2017. [Google Scholar]
  2. ISO 7730. EN ISO 7730: 2005 Ergonomics of the Thermal Environment—Analytical Determination and Interpretation of Thermal Comfort Using Calculation of the PMV and PPD Indices and Local Thermal Comfort Criteria; International Standardisation Organisation: Geneve, Switzerland, 2005. [Google Scholar]
  3. Jones, W.P. Air Conditioning Engineering, 5th ed.; Butterworth-Heinemann: Oxford, UK, 2001; pp. 80–103. [Google Scholar]
  4. Khalil, E.E. Air Distribution in Buildings; CRC Press: Boca Raton, FL, USA, 2017; pp. 1–20. [Google Scholar]
  5. Navvab, M. HVAC ventylation strategies: The contribution for thermal comfort, energy efficiency, and indoor air quality. Green Build. 2007, 2, 131–150. [Google Scholar] [CrossRef]
  6. American Society of Heating Refrigerating and Air-Conditioning Engineers, Inc. ASHRAE Handbook—Heating, Ventilating, and Air-Conditioning Applications, SI ed.; American Society of Heating Refrigerating and Air-Conditioning Engineers, Inc.: Washington, DC, USA, 2015. [Google Scholar]
  7. Li, A.; Yang, C.; Ren, T.; Bao, X.; Qin, E.; Gao, R. PIV experiment and evaluation of air flow performance of swirl diffuser mounted on the floor. Energy Build. 2017, 156, 58–69. [Google Scholar] [CrossRef]
  8. Hurnik, M.; Kaczmarczyk, J.; Popiolek, Z. Study of Radial Wall Jets from Ceiling Diffusers at Variable Air Volume. Energies 2021, 14, 240. [Google Scholar] [CrossRef]
  9. Jaszczur, M.; Madejski, P.; Kleszcz, S.; Zych, M.; Palej, P. Numerical and experimental analysis of the air stream generated by square ceiling diffusers. E3S Web Conf. 2019, 128, 08003. [Google Scholar] [CrossRef]
  10. Szczepanik-Scislo, N.; Antonowicz, A.; Scislo, L. PIV measurement and CFD simulations of an air terminal device with a dynamically adapting geometry. SN Appl. Sci. 2019, 1, 370. [Google Scholar] [CrossRef] [Green Version]
  11. Yao, T.; Lin, Z. An experimental and numerical study on the effect of air terminal types on the performance of stratum ventilation. Build. Environ. 2014, 82, 431–441. [Google Scholar] [CrossRef]
  12. Martinez-Almansa, J.J.; Fernandez-Gutierrez, A.; Parras, L.; del Pino, C. Numerical and experimental study of a HVAC wall diffuser. Build. Environ. 2014, 80, 1–10. [Google Scholar] [CrossRef]
  13. Nocente, A.; Arslan, T.; Grynning, S.; Goia, F. CFD Study of Diffuse Ceiling Ventilation through Perforated Ceiling Panels. Energies 2020, 13, 1995. [Google Scholar] [CrossRef]
  14. Jaszczur, M.; Madejski, P.; Borowski, M.; Karch, M. Experimental analysis of the air stream generated by square ceiling diffusers to reduce energy consumption and improve thermal comfort. Heat Transfer. Eng. 2021. [Google Scholar] [CrossRef]
  15. Aziz, M.A.; Gad, I.A.M.; Mohammed, E.S.F.A.; Mohammed, R.H. Experimental and numerical study of influence of air ceiling diffusers on room air flow characteristics. Energy Build. 2012, 55, 738–746. [Google Scholar] [CrossRef]
  16. Chen, Q.; Srebric, J. Simplified Diffuser Boundary Conditions for Numerical Room Airflow Models; Final Report for ASHRAE RP-1009; ASHRAE: Atlanta, GA, USA, 2000; pp. 96–107. [Google Scholar]
  17. Shakerin, S.; Miller, P. Experimental study of Vortex Diffusers. ASHRAE Trans. 1996, 102, 340–346. [Google Scholar]
  18. Borowski, M.; Jaszczur, M.; Branny, M.; Karch, M. Experimental analysis of the velocity field of the air flowing through the swirl diffusers. In Proceedings of the 7th European Thermal-Sciences Conference, Kraków, Poland, 19–23 June 2016. [Google Scholar]
  19. Borowski, M.; Karch, M.; Łuczak, R.; Życzkowski, P.; Jaszczur, M. Numerical and experimental analysis of the velocity field of air flowing through swirl diffusers. E3S Web Conf. 2019, 128, 05003. [Google Scholar] [CrossRef]
  20. Sajadi, B.; Saidi, M.H.; Mohebbian, A. Numerical investigation of the swirling air diffuser: Parametric study and optimization. Energy Build. 2011, 43, 1329–1333. [Google Scholar] [CrossRef]
  21. Hongze, R.; Bin, Z.; Xianting, L.; Hongming, F.; Xudong, Y. Influence of Diffuser Jet Characteristics on Indoor Air Distribution under Actual Connecting conditions. J. Archit. Eng. 2003, 9, 141–144. [Google Scholar]
  22. Villafruela, J.M.; Sierra-Pallares, J.B.; Castro, F.; Álvaro, A.; Santiago-Casado, P. Experimental and numerical study of the influence of the plenum box on the airflow pattern generated by a swirl air diffuser. Exp. Therm. Fluid Sci. 2018, 99, 547–557. [Google Scholar] [CrossRef] [Green Version]
  23. Smoljan, D.; Balen, I. Influence of a Plenum Box Design on Uniformity of the Radial Air Jet Issuing from a Vortex Diffuser. Strojarstvo 2010, 52, 379–386. [Google Scholar]
  24. Vasic, M.; Stevanovic, V.D.; Zivkovic, B. Uniformity of air flow from the ceiling diffuser by an advanced design of the equalizing element in the plenum box with side entry. Sci. Technol. Built Environ. 2020, 26, 676–686. [Google Scholar] [CrossRef]
  25. Product Manual for DaVis 7.2; La Vision GmbH: Gottingen, Germany, 2011.
  26. Abdulwahab, M.R.; Ali, H.Y.; Habeeb, F.J.; Borhana, A.A.; Abdelrhman, A.M.; Al-Obaidi, S.M.A. A review in particle image velocimetry techniques (developments and applications). J. Adv. Res. Fluid Mech. Therm. Sci. 2020, 65, 213–229. [Google Scholar]
  27. Ferziger, J.H. Large Eddy Simulation. In Simulation and Modeling of Turbulent Flows; Gatski, T.B., Hussaini, M.Y., Lumley, J.L., Eds.; Oxford University Press: New York, NY, USA, 1996; pp. 109–116. [Google Scholar]
  28. Gunzburger, M.D. Navier-Stokes equations for incompressible flows: Finite-element methods. In Handbook of Computational Fluid Mechanics; Peyret, R., Ed.; Academic Press: London, UK, 1996; pp. 28–35. [Google Scholar]
  29. Argyropoulosa, C.D.; Markatos, N.C. Recent advances on the numerical modelling of turbulent flows. Appl. Math. Model. 2015, 39, 693–732. [Google Scholar] [CrossRef]
  30. Pope, S.B. Turbulent Flows; Cambridge University Press: Cambridge, UK, 2001; pp. 358–385. [Google Scholar]
Figure 1. Plenum box with (a) side entry; (b) top entry.
Energies 14 03630 g001
Figure 2. Diagram of the measurement section used for the measurements.
Energies 14 03630 g002
Figure 3. The tested plenum box with (a) the calibrated plate; (b) the marked plane Z-Y on which measurements were taken.
Energies 14 03630 g003
Figure 4. The computational domain used in the verification of mathematical and numerical models (a) domain withmodeled surrounding; (b) the plenum box with coordinate system.
Energies 14 03630 g004
Figure 5. The computational mesh on the wall of the plenum box for (a) variant M4; (b) variant M6.
Energies 14 03630 g005
Figure 6. Computational domain for the analysis of plenum box with (a) side entry; (b) top entry.
Energies 14 03630 g006
Figure 7. Air diffuser panel (a) real view; (b) used for calculation.
Energies 14 03630 g007
Figure 8. Air velocity vector field in the plenum box at Z-Y plane passing through the center of the spigot.
Energies 14 03630 g008
Figure 9. Averaged air velocity field in the plenum box from air motion along the Y-axis and Z-axis in the Z-Y plane passing through the center of the plenum box spigot.
Energies 14 03630 g009
Figure 10. The comparison between numerical results and experimental results was made for line (a) Y = 0 mm; (b) Z = 350 mm.
Energies 14 03630 g010
Figure 11. Distribution of velocity components in plenum box with side entry (a) in the Z direction for Y = 0 mm; (b) in the Y direction for Z = 350 mm.
Energies 14 03630 g011
Figure 12. Distribution of vz velocity component in plenum box with side entry in the Z direction for Y = 0 mm for variant M5 using different turbulent models.
Energies 14 03630 g012
Figure 13. Distribution of vx, vy, and vz velocity components in the Z-Y plane passing through the center of the spigot of the plenum box with side entry (X = 0 mm) (a) in the Z direction; (b) in the Y direction; (c) in the X direction; and (d) in the X direction with limited scale of velocity.
Energies 14 03630 g013
Figure 14. The comparison of vz and vy velocity components distribution in plenum box with side entry, between numerical results and experimental results, (a) in the Z direction for Y = 0 mm; (b) in the Y direction for Z = 350 mm.
Energies 14 03630 g014
Figure 15. Velocity magnitude v in outlet plane of the air diffuser with plenum box with (a) side entry; (b) top entry.
Energies 14 03630 g015
Figure 16. Velocity magnitude distribution in the plane passing through the center of the spigot of the plenum box with (a) side entry, Z-Y plane, X = 0 mm; (b) side entry, X-Y plane, Z = 0 mm; (c) top entry, Z-Y plane, X = 0 mm; and (d) top entry, X-Y plane, Z = 0 mm.
Energies 14 03630 g016aEnergies 14 03630 g016b
Figure 17. Comparison of the distribution of velocity components in the plenum box with side entry in the Z direction for Y = 0 mm for the experimental results, analysis without the air diffuser (M6), and with the air diffuser (H_1).
Energies 14 03630 g017
Table 1. Summary for meshes used in analysis.
SignNumber of CellsPlenum BoxEntourage
M165,948Body size 0.100 mBody size 0.100 m
M2423,068Body size 0.050 m, face size on the cross bar 0.002 mBody size 0.050 m
M3966,655Body size 0.025 m, face size on the cross bar 0.002 mBody size 0.025 m
M45,081,680Body size 0.025 m, face size on the cross bar and wall 0.002 mBody size 0.025 m
M51,285,344Body size 0.010 m, face size on the cross bar 0.002 m, and wall 0.005 mBody size 0.025 m
M63,679,285Body size 0.005 m, face size on the cross bar 0.002 m, and wall 0.005 mBody size 0.025 m
Table 2. Solver setup and fluid properties used in the analysis.
ParameterSelection
SolverPressure based
Steady-state simulations
Fluid materialAir, Viscosity 1.7894−5 kg/(m∙s),
Density 1.225 kg/m3
Solution MethodsScheme: SIMPLE
Gradient: least squares cell-based
Pressure: second order
Momentum: second order
Publisher’s Note: MDPI stays neutral with regard to jurisdictional claims in published maps and institutional affiliations.

