1. Introduction
Egypt is facing a continuous increase in its population, which is leading to an increase in the electrical power demand. To face this situation, the Ministry of Electricity of Egypt decided to establish new power plants and transmission lines to generate and transfer electrical energy. The extension of the power system may lead to transmission lines overloading, islanding of some parts or even interference of the power system protection system [
1]. Moreover, the share of renewable energies in power systems worldwide is in continuous increase, which leads to an observable reduction in the moment of inertia of the system. The reduction in system inertia leads to additional fluctuations in frequency [
2]. The frequency fluctuations may lead to system black out which has happened several times, for example, in 2019 in the UK due to under-frequency load shedding.
The important role of load frequency control in power system operation has been recognized for several decades [
3,
4,
5,
6,
7,
8,
9,
10]. Different types of control methods have been applied. In [
4], the authors compared between centralized and decentralized PID controllers to control the frequency of the Egyptian grid. In [
5], the authors applied load frequency control in a power system using a coefficient diagram method (CDM) controller. In [
6], the authors performed load frequency regulation on the conventional Egyptian grid using an FOPID controller, but they did not consider the renewable energy systems. In [
7], the authors compared FOPID and PID controllers to regulate a standalone wind–diesel–micro–hydro system, showing the better performance of FOPID control. In [
8], the authors compared NPID, FOPID and NFOPID controllers to control the frequency of a standalone solar biomass energy system, and the results showed a better performance from the NFOPID side. Due to the instantaneous changes in the power system, self-tuning of load frequency controllers has been applied in many research papers. In [
9], the authors used an adaptive fuzzy approach for PID self-tuning to control the frequency of a multi-area power system. In [
10], the authors used model predictive control to control the frequency of a power system, showing that predictive control is very fast acting, but it takes a long time for online calculations. In [
11], the authors compared between different methods to self-tune FOPID controllers using fuzzy logic, showing the optimal method is to optimally change µ and λ. In [
12], Fayek presented an NFOPID controller in a two-area microgrid including 100% renewable power generation for load frequency regulation considering communication delays. In [
13], Fayek et al. presented load frequency control of a wind–tidal wave 100% sustainable microgrid. The regulation is performed using a non-linear fractional integrator as part of the tidal supplementary control.
Several optimization methods have been applied in previous research work to design load frequency controllers. A particle swarm optimization algorithm (PSO) was used in [
14], while the genetic algorithm (GA) was presented in [
15]. Teaching–learning-based optimization (TLBO) was presented in [
16]. In [
17], Kaur et al. proposed the tunicate swarm algorithm for the first time in 2020.
In this paper, the main contributions are as follows:
Presentation of novel central NFOPID control scheme in comparison with FOPID, NPID and PID control schemes which are employed to regulate the Egyptian power system frequency considering the average daily performance, integration and outage of demand and new renewable energy power plants;
Comparison between the new proposed optimization technique, which is tunicate swarm, with other state-of-the-art techniques such as TLBO, PSO and GA to design the controllers;
Comparison between different ways to self-tune the NFOPID controller parameters.
This paper is organized as follows:
Section 2 presents the Egyptian power system overview and model, including renewable energy systems.
Section 3 presents the configuration of each control scheme.
Section 4 presents the design of the controllers using novel tunicate swarm.
Section 5 presents the self-tuning idea of NFOPID.
Section 6 presents the simulation results, while
Section 7 and
Section 8 present the discussions and conclusions, respectively, of the main findings of the paper.
2. Egyptian Power System Description
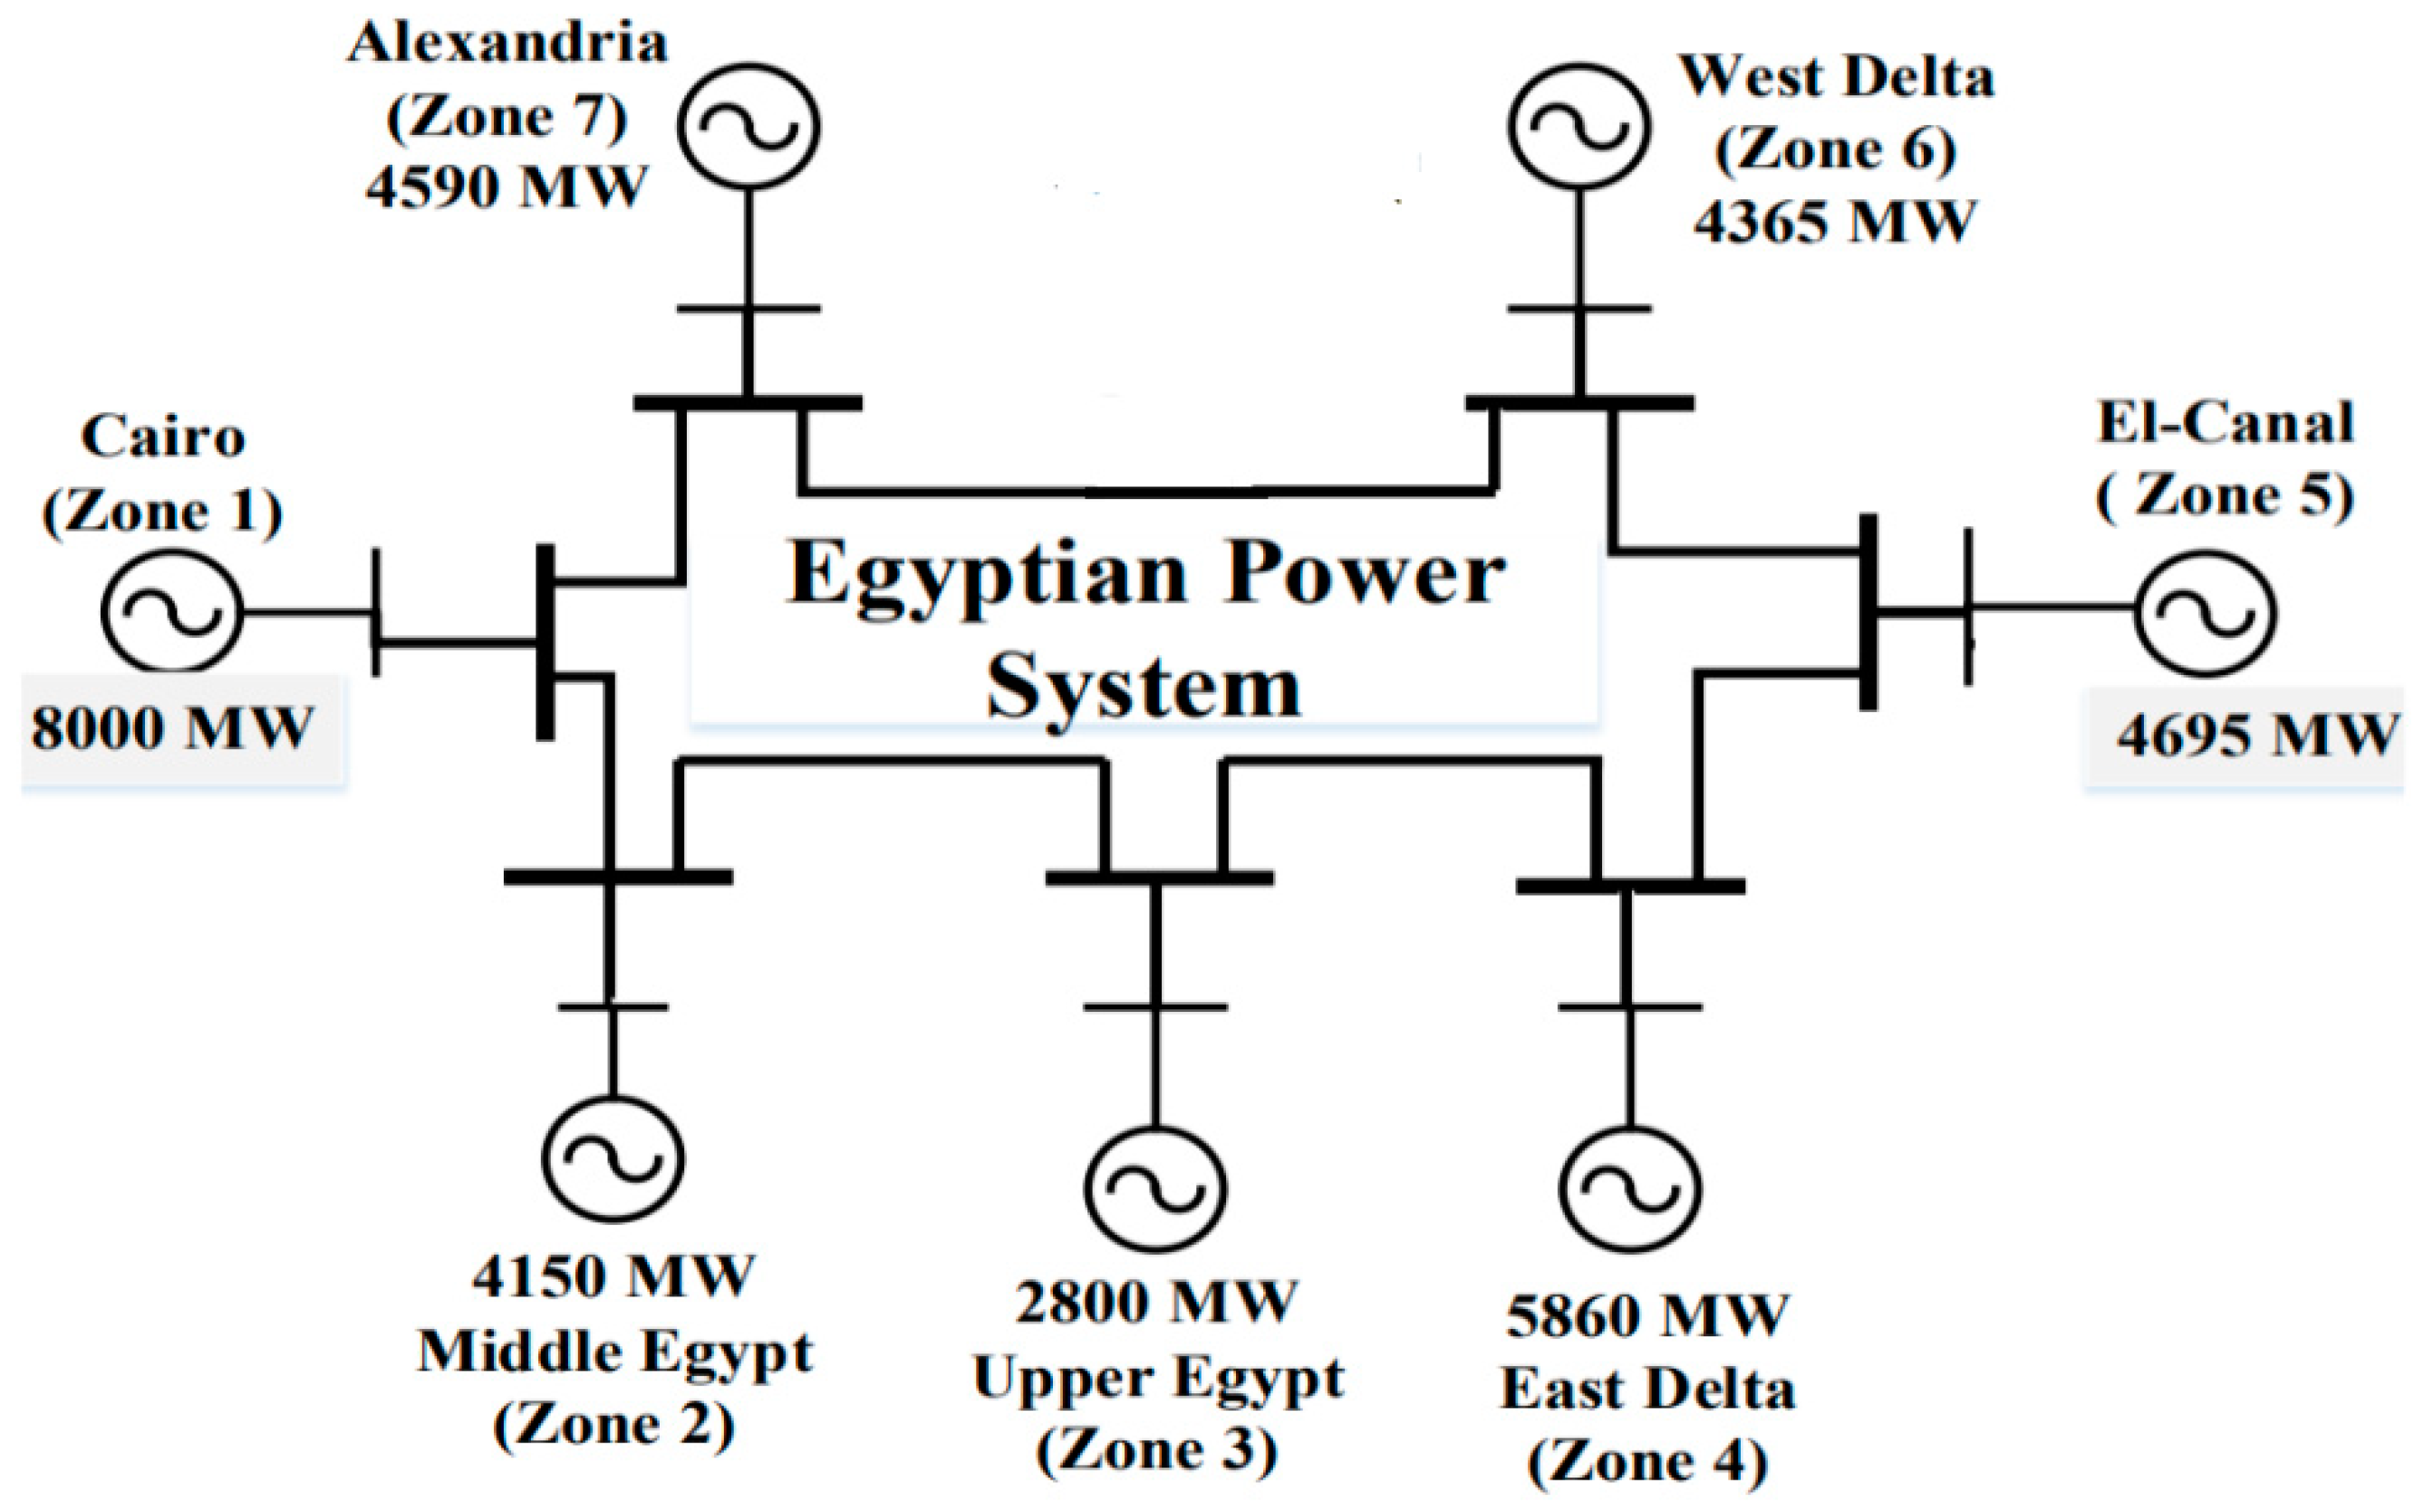
The 2020 Egyptian power system is illustrated in
Figure 1. The grid is divided into seven geographical zones which are: Cairo, Alexandria, Canal, Middle Egypt, Upper Egypt, East Delta and West Delta regions. Each region includes one or more of the following types of power stations as of 2016 [
18]:
Steam or small gas power stations (non-reheat power stations) with total installed capacity of 15,500 MW;
Combined-cycle power stations (reheat power stations) with total installed capacity of 15,000 MW;
Hydro power stations such as High Dam and Aswan Dam which have installed capacities of 2100 MW and 550 MW, respectively;
Zaafarana wind farm (545 MW installed capacity)
Egypt established new renewable and fossil fuel power stations which were integrated into the grid in 2020, which are [
19]:
Benban, the world’s largest photovoltaic farm (1800 MW installed capacity);
GabalZeet wind farm (540 MW);
Three combined-cycle power plants at Burullus, BeniSuef and New Administrative Capital (each with 4800 MW installed capacity).
2.1. Photovoltaic Farm
The power produced from the photovoltaic system (using maximum power point tracking) can be formulated as (1) [
12,
20].
where
is the photovoltaic system output power (Watt),
is the isolation (Watt/m
2),
is the total area (m
2),
is the electricity conversion from the sunlight efficiency and
is the ambient temperature in °C. In this paper, it was assumed that
linearly increases with
. The photovoltaic power stations are modeled in this study as shown in (2).
represents the transfer function of PV generating systems as used in [
12,
20].
where
is the time constant of the photovoltaic system, and its value is shown in
Table 1.
2.2. Wind Farm
A wind farm is composed of wind turbines. The output power of a wind turbine depends on the cubic power of the air velocity, as illustrated in (3) [
19].
where
is the power generated by the wind turbine,
is the air density in kg/m
3,
is the area of the blades in m
2 and
is the power coefficient of the turbine which refers to the fraction of available power that can be produced. In this study, we neglected the non-linearities of the wind turbine and considered its modeling as shown in (4) [
21].
where
is the transfer function of wind farms [
21],
is the change in wind power generated and
is the change in wind power;
is the gain constant of the wind generator, while
is the time constant of the wind farm. The values of
and
are listed in
Table 1.
2.3. Egyptian Grid Dynamic Model
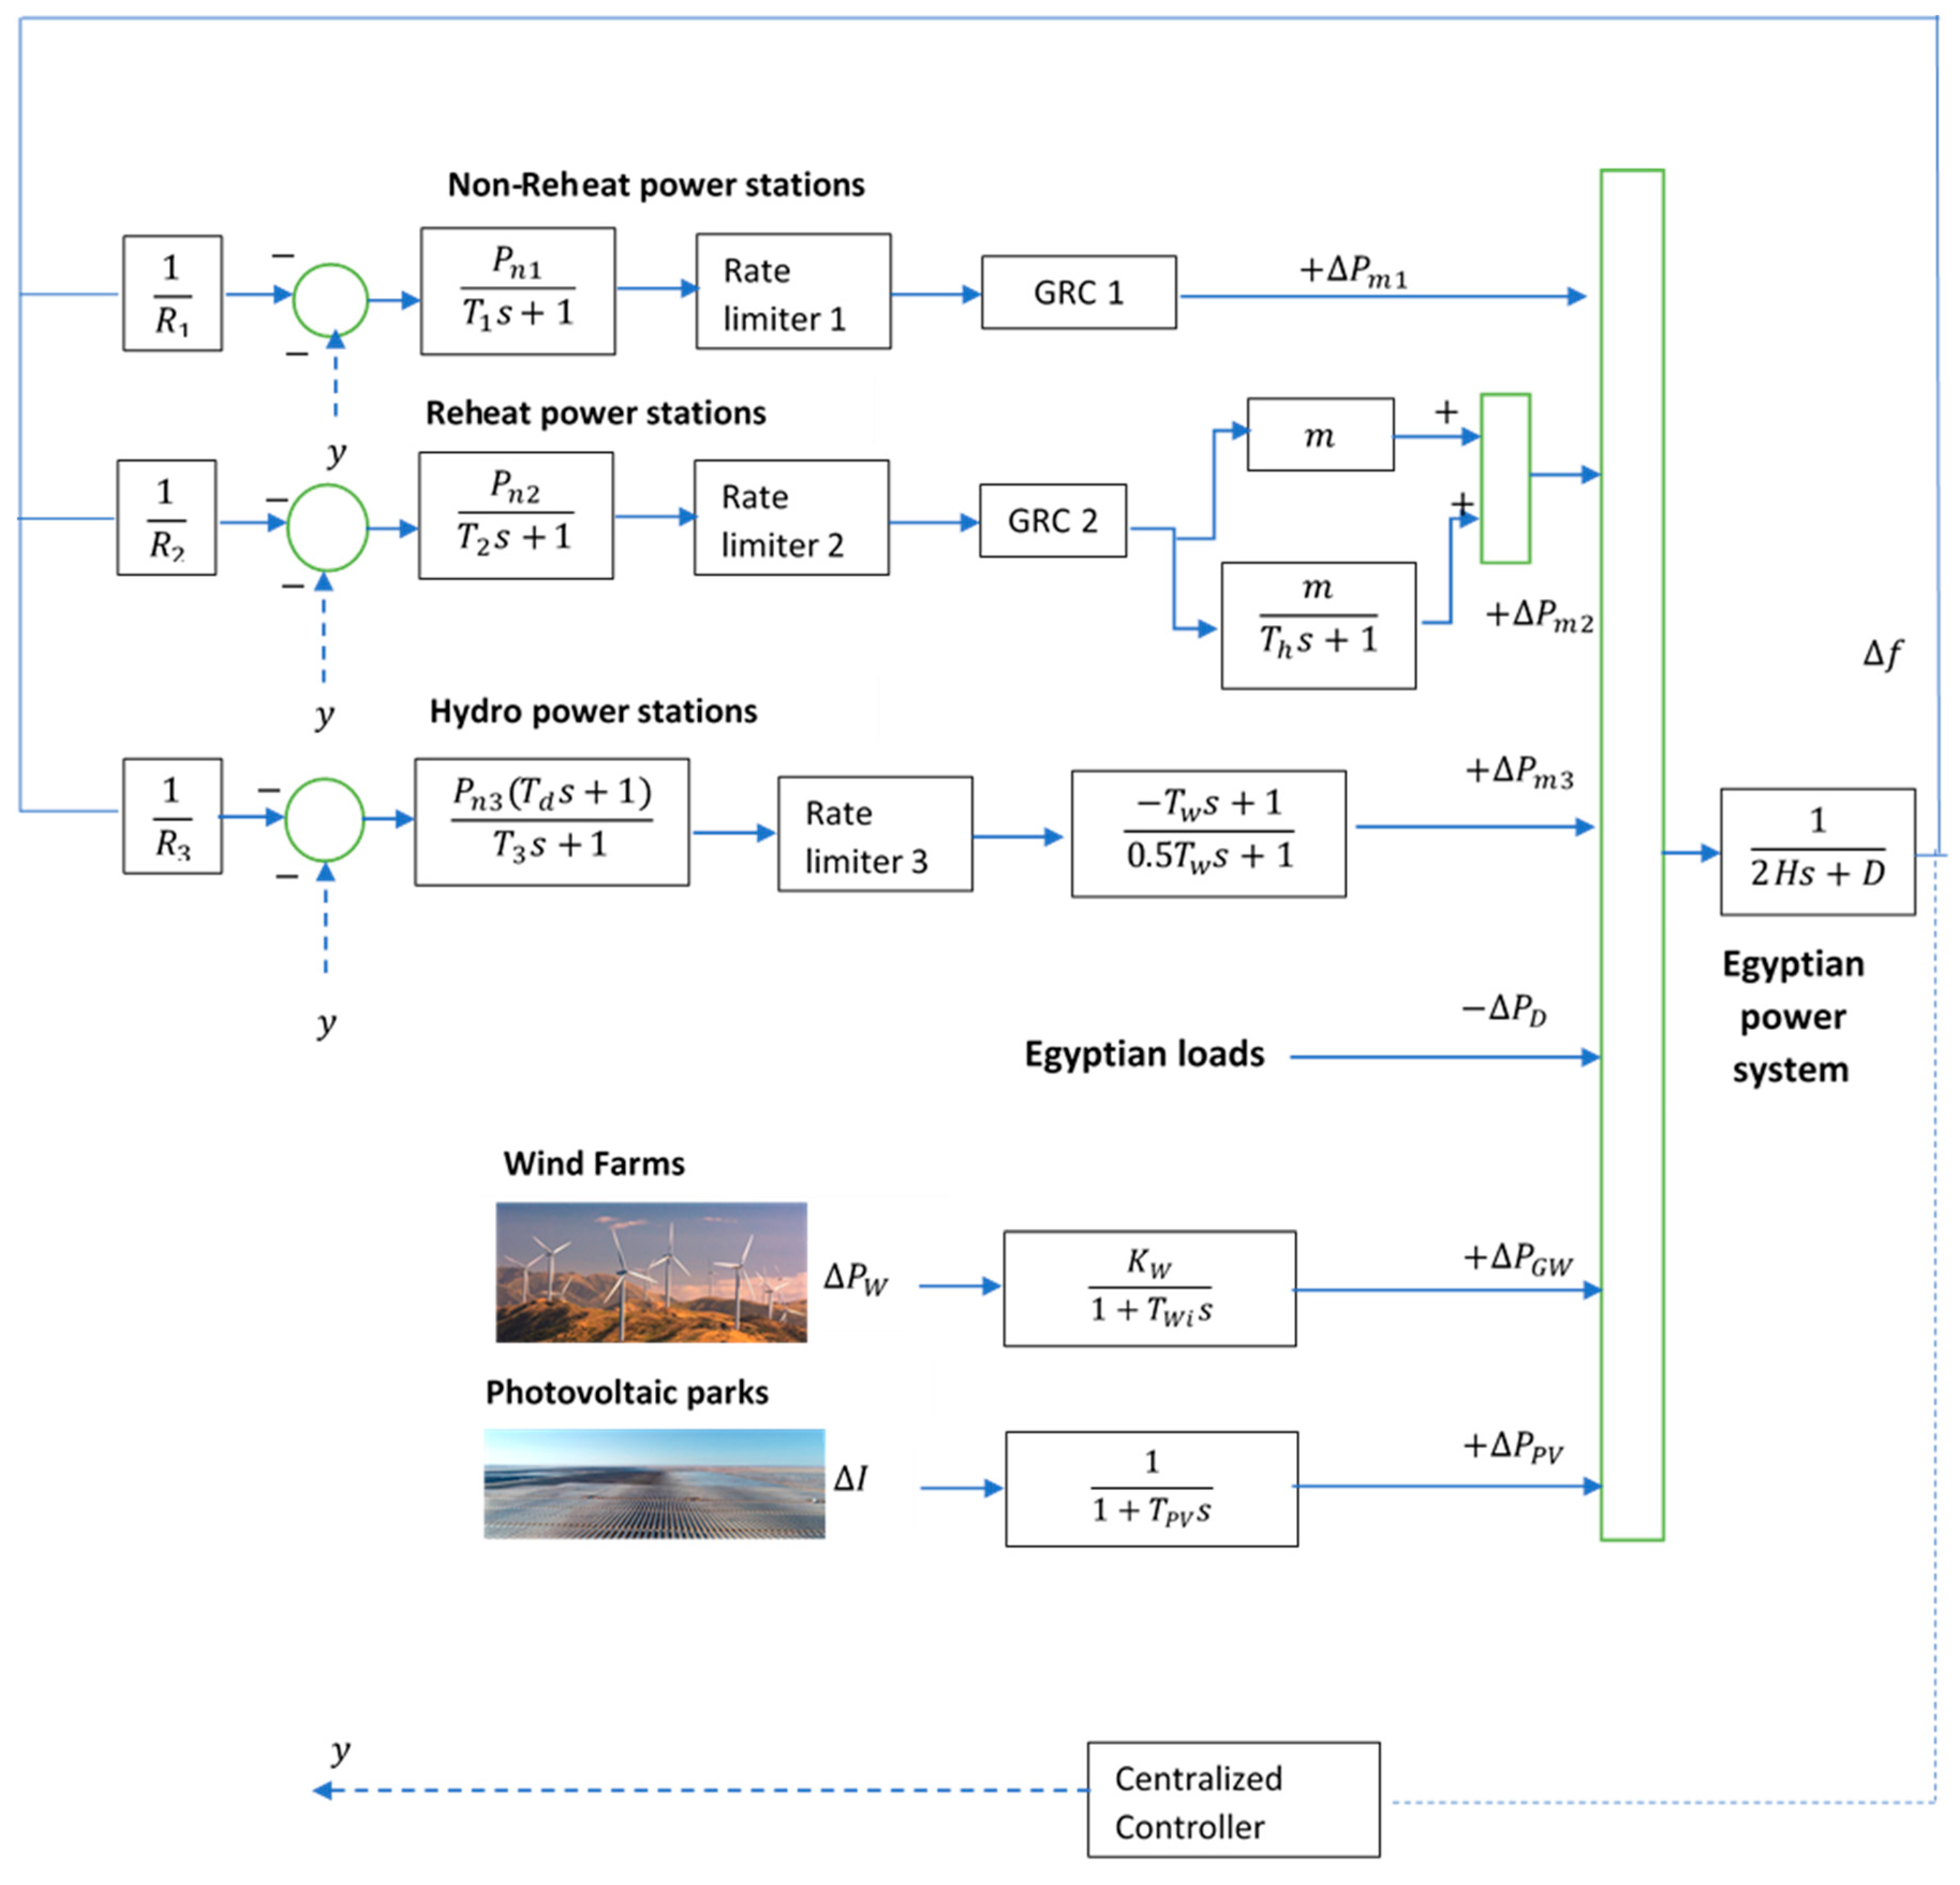
The Egyptian grid consists of five types of power station. The real power equation of the Egyptian grid can be written as shown in (5) and illustrated in
Figure 2.
where
,
and
are the power produced by photovoltaic, wind, non-reheat, reheat and hydro power stations, respectively;
is the demand power;
is the electrical power change.
The overall generator dynamics for the whole system can be illustrated in the transfer function illustrated in (6).
where the change in frequency is
, the damping constant of the power system is
and the equivalent inertia constant of the Egyptian grid is
. The nomenclatures and values of the Egyptian power system parameters of the conventional stations of non-reheat, reheat and hydro power stations are shown in
Table 2. All the values are provided by the control center of Egypt.
3. Control Schemes
3.1. Non-Linear PID Controller
The conventional PID is widely known for its various applications in electrical power systems. In recent years, many modifications have been applied to the traditional PID controller. One of those alterations is the non-linear PID (NPID). The NPID control scheme in comparison with that of the conventional PID has more beneficial impacts on various industrial applications. The NPID has two comprehensive purposes:
The NPID control scheme can usually absorb the non-linearity of highly non-linear systems such as power grids, which is the case in this study;
Additionally, for linear systems, the NPID can drive those systems to better performance in terms of achieving a lower rise time, peak time, steady state error, settling time and maximum overshoot, and also better tracking for a reference and disturbance rejection, which is also considered in this study.
The NPID controller has the benefit of a high initial gain to accomplish a fast dynamic response, continued with a low gain to evade an unstable behavior. The fundamental concept of the NPID is to generate an incessant dynamic non-linear function instead of gain scheduling by designing a non-linear gain function in combination with an error, integration of the error and the error derivative to reach a certain set point [
20].
3.2. FOPID Controller
Unlike the conventional PID control scheme, which includes a single order for both the integrator and differentiator, the fractional-order control system (FOPID) has an order value for and . The value ranges between 0 and 1 for each of them.
Many definitions have been used to describe the fractional-order calculus. The most famous definitions are as follows:
The previous methods are not appropriate in applications which require real-time control [
23]. Oustaloup in [
24] established an approximation for the fractional-order derivative which is used by different researchers in many study fields to employ optimal tuning of the five parameters of the FOPID, such as the works of [
25,
26]. Practically, the approximation invented by Oustaloup is applied to many applications using the CRONE block in MATLAB/SIMULINK such as:
Control of a mechatronics system [
27], where the authors studied the FOPID control of a master slave mechatronics system;
Frequency and power regulation [
28], where the authors studied FOPID automatic generation control of multi-thermal areas including HVDC;
Speed control of machines [
29], where the authors studied FOPID speed control of DC machines;
Maximum power point tracking of a renewable power plant [
30], where the authors studied maximum power point tracking of a renewable energy technology using an FOPID controller.
In this research, the authors applied Oustaloup’s approximation in the modeling of the derivative and integral components of the fractional-order PID. The mathematical approximation for
is illustrated in Equations (7)–(9) [
12].
where
and
are maximum and minimum values for the frequency approximation, respectively, and assumed to be [–1000, 1000] in this study,
is the order of the recursive filter mentioned by Oustaloup, where, in this study,
N is assumed to be 4, and
is a pole, while
is a zero.
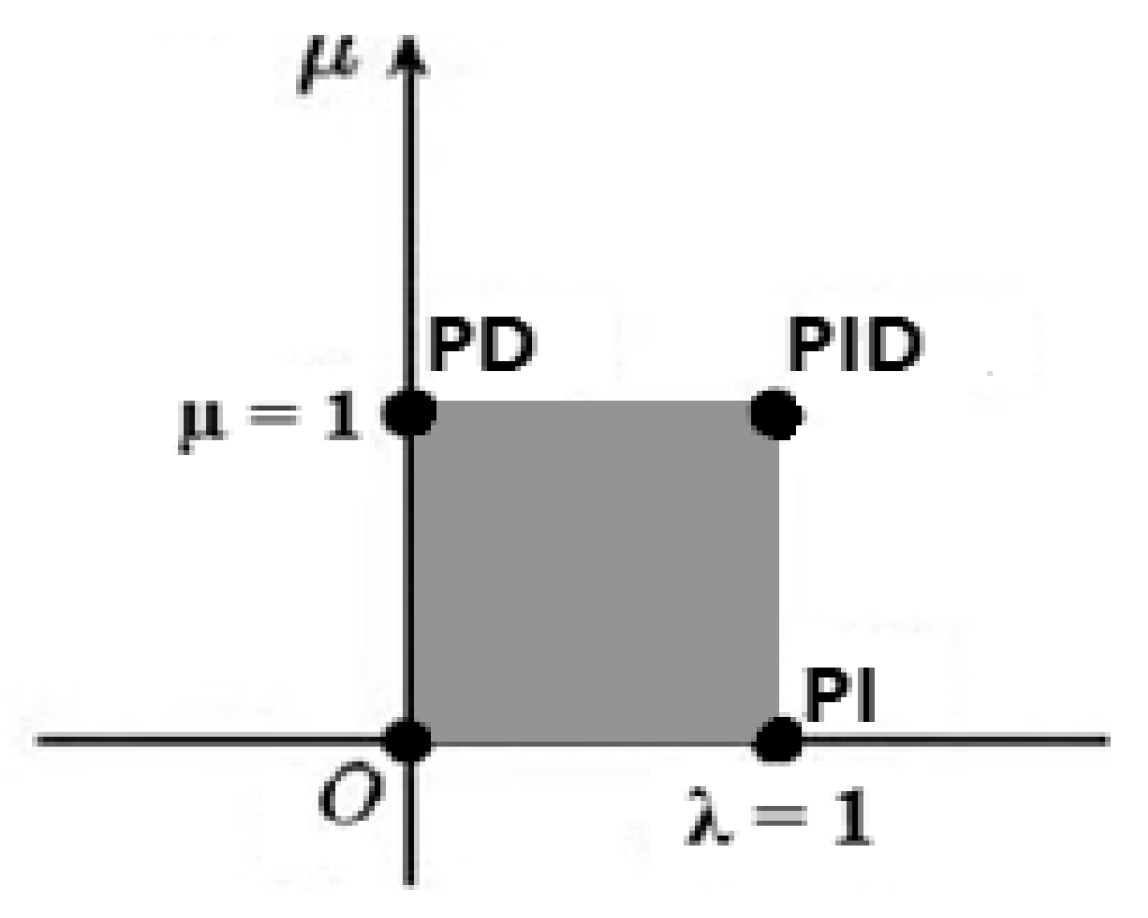
The FOPID control scheme has been widely used over the last twenty years; two variables are added in this control scheme which are (λ and µ) in comparison with the conventional PID which may drive the power system to better performance. The integral differential powers λ and µ determine the operation mode of the controller.
Figure 3 shows the operation modes of the FOPID controller based on λ and µ values. If both powers are set at 1, the FOPID will work as a conventional PID. Many researchers have used the FOPID control scheme in many applications such as voltage and frequency control in power systems, motors, robotics and even vehicles. The FOPID scheme control signal is shown in (10) [
8].
3.3. NFOPID Controller
The NFOPID controller is a novel hybrid controller between NPID and FOPID control schemes. The novel scheme includes six parameters (
,
,
,
G, λ and µ) which enables better system operation and multi-modes. The control action of NFOPID schemes is illustrated in (11). The controller configuration and modes of operation are shown in
Figure 4.
4. Control Scheme Design
4.1. Design Problem Definition
The design of each control scheme was applied at each operation condition separately using different optimization techniques. The design was performed using MATLAB, aiming to reach less possible frequency deviations at each condition. The optimization problem is described as follows:
Objective function: minimizing integration of the square error in frequency (
):
Variables: each control scheme parameter.
Constraints: non-linearity gain (G) limits, and integral and derivative power (λ and µ) limits.
The controller parameters differ from one controller to another. In the NPID control scheme, the controlled parameters are (G, , and ), and the constraint considered in the controller design is 0 ≤ G ≤ 1 only. In the FOPID control scheme, the controlled parameters are (, , , λ and µ), and the constraints considered are 0 ≤ λ ≤ 1 and 0 ≤ µ ≤ 1 only. In the NFOPID control scheme, the six parameters are the controlled parameters and the limits of G, λ and µ are considered as constraints.
The applied optimization techniques are as follows:
- (a)
Tunicate swarm algorithm [
17];
- (b)
Teaching–learning-based optimization (TLBO) [
16];
- (c)
Particle swarm optimization (PSO) [
14];
- (d)
Genetic algorithm (GA) [
15].
The design first took place in an offline environment for the three controllers in the power system at the same time for each case study. After the design was conducted, the controlled system was tested as illustrated in the next section.
4.2. Tunicate Swarm Algorithm
In recent years, there has been a focus on bio-inspired optimization to reach the minimum or maximum objective in terms of controlling the system variables. The tunicate can reach the food source location (optimum solution). In this research, the following behaviors were worked to find the optimum solution: (i) jet propulsion and (ii) swarm intelligence. The jet propulsion can be modeled such that the tunicate can satisfy three conditions: (a) avoiding the conflict between other tunicates (search agents), (b) movement towards the position of the search agent and (c) remaining close to the best search agent. The swarm behavior is responsible for updating the locations of other search agents about the best solution [
17].
4.2.1. Avoiding the Conflict between Other Tunicates (Search Agents)
Figure 5 shows the avoidance between tunicates (search agents). The
vector is nominated to calculate the new search agent location.
where
is the water flow advection in a deep ocean, while
is the gravity force;
,
and
are random numbers lying between [0, 1]. The social forces between search agents are represented as
.
where
is the initial speed with a set value of 1 in this research, while
is the subordinate speed to make a social interaction with a set value of 5 in this work.
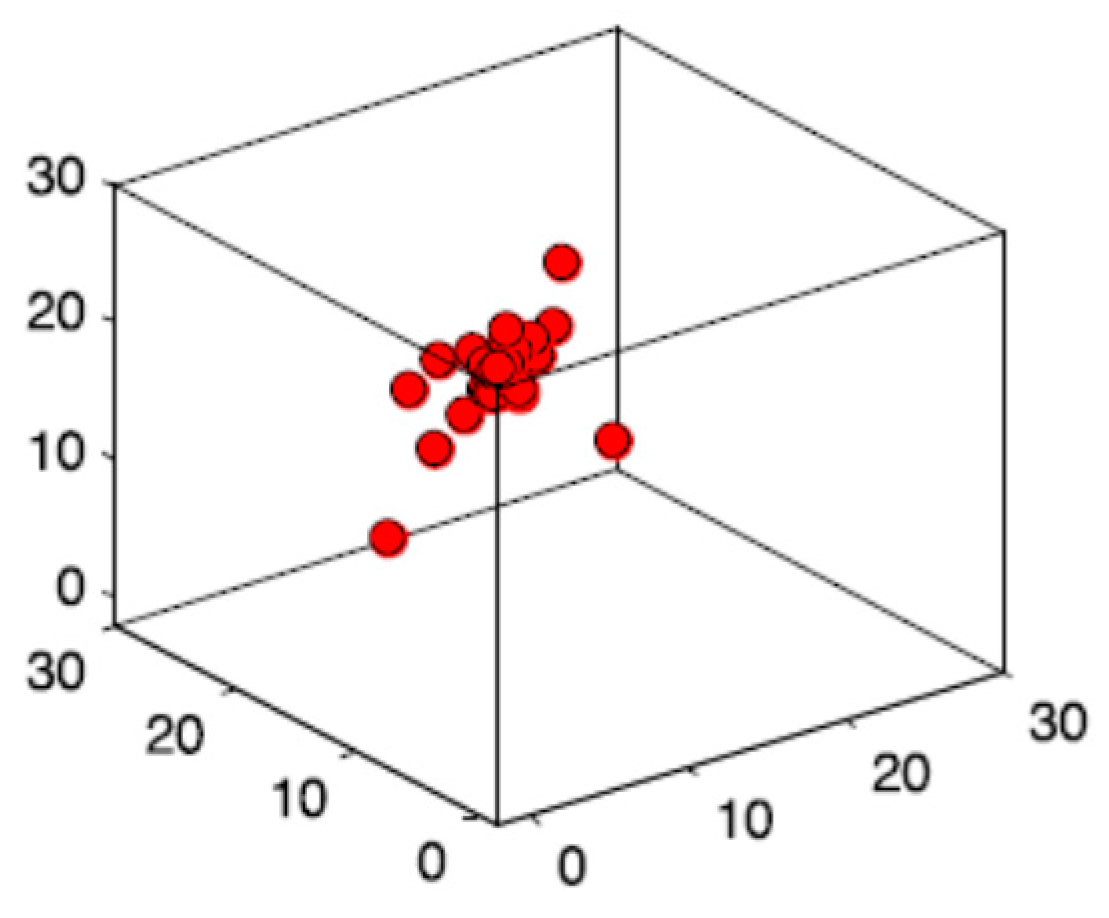
4.2.2. Movement towards the Position of the Search
Since the conflict between neighbors is avoided, the tunicate will move towards the direction of the best neighbor as shown in
Figure 6.
represents the distance between the optimum solution and the tunicate, x is the current iteration, is the location of the optimum solution, is the tunicate location and is a random number lying between [0, 1].
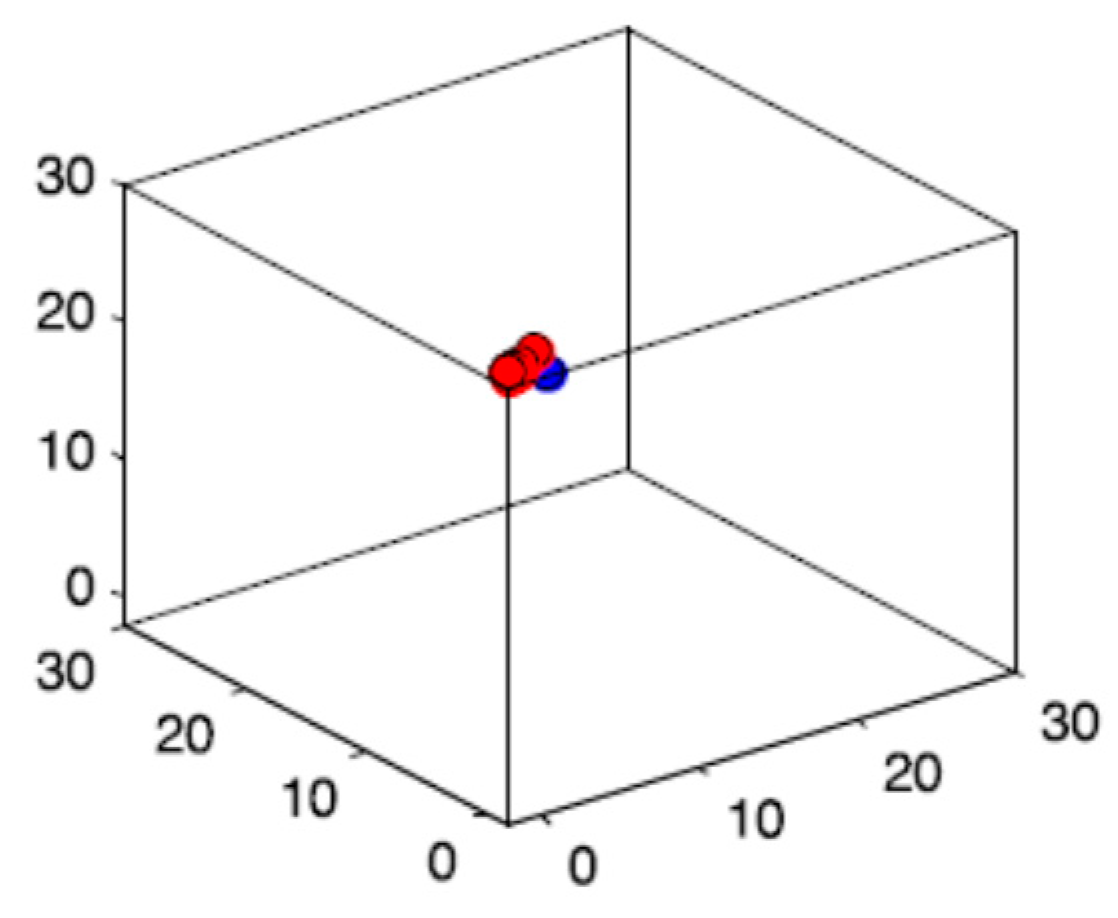
4.2.3. Remaining Close to the Best Search Agent
Figure 7 shows how the search agent can maintain its position towards the optimum solution.
is updated based on the location of the optimum solution.
4.2.4. Swarm Behavior
The swarm behavior of the tunicate was mathematically simulated such that the first two optimal solutions update the location of other search agents with respect to the location of the best search agents. The tunicate swarm behavior is defined in (18).
4.2.5. Convergence
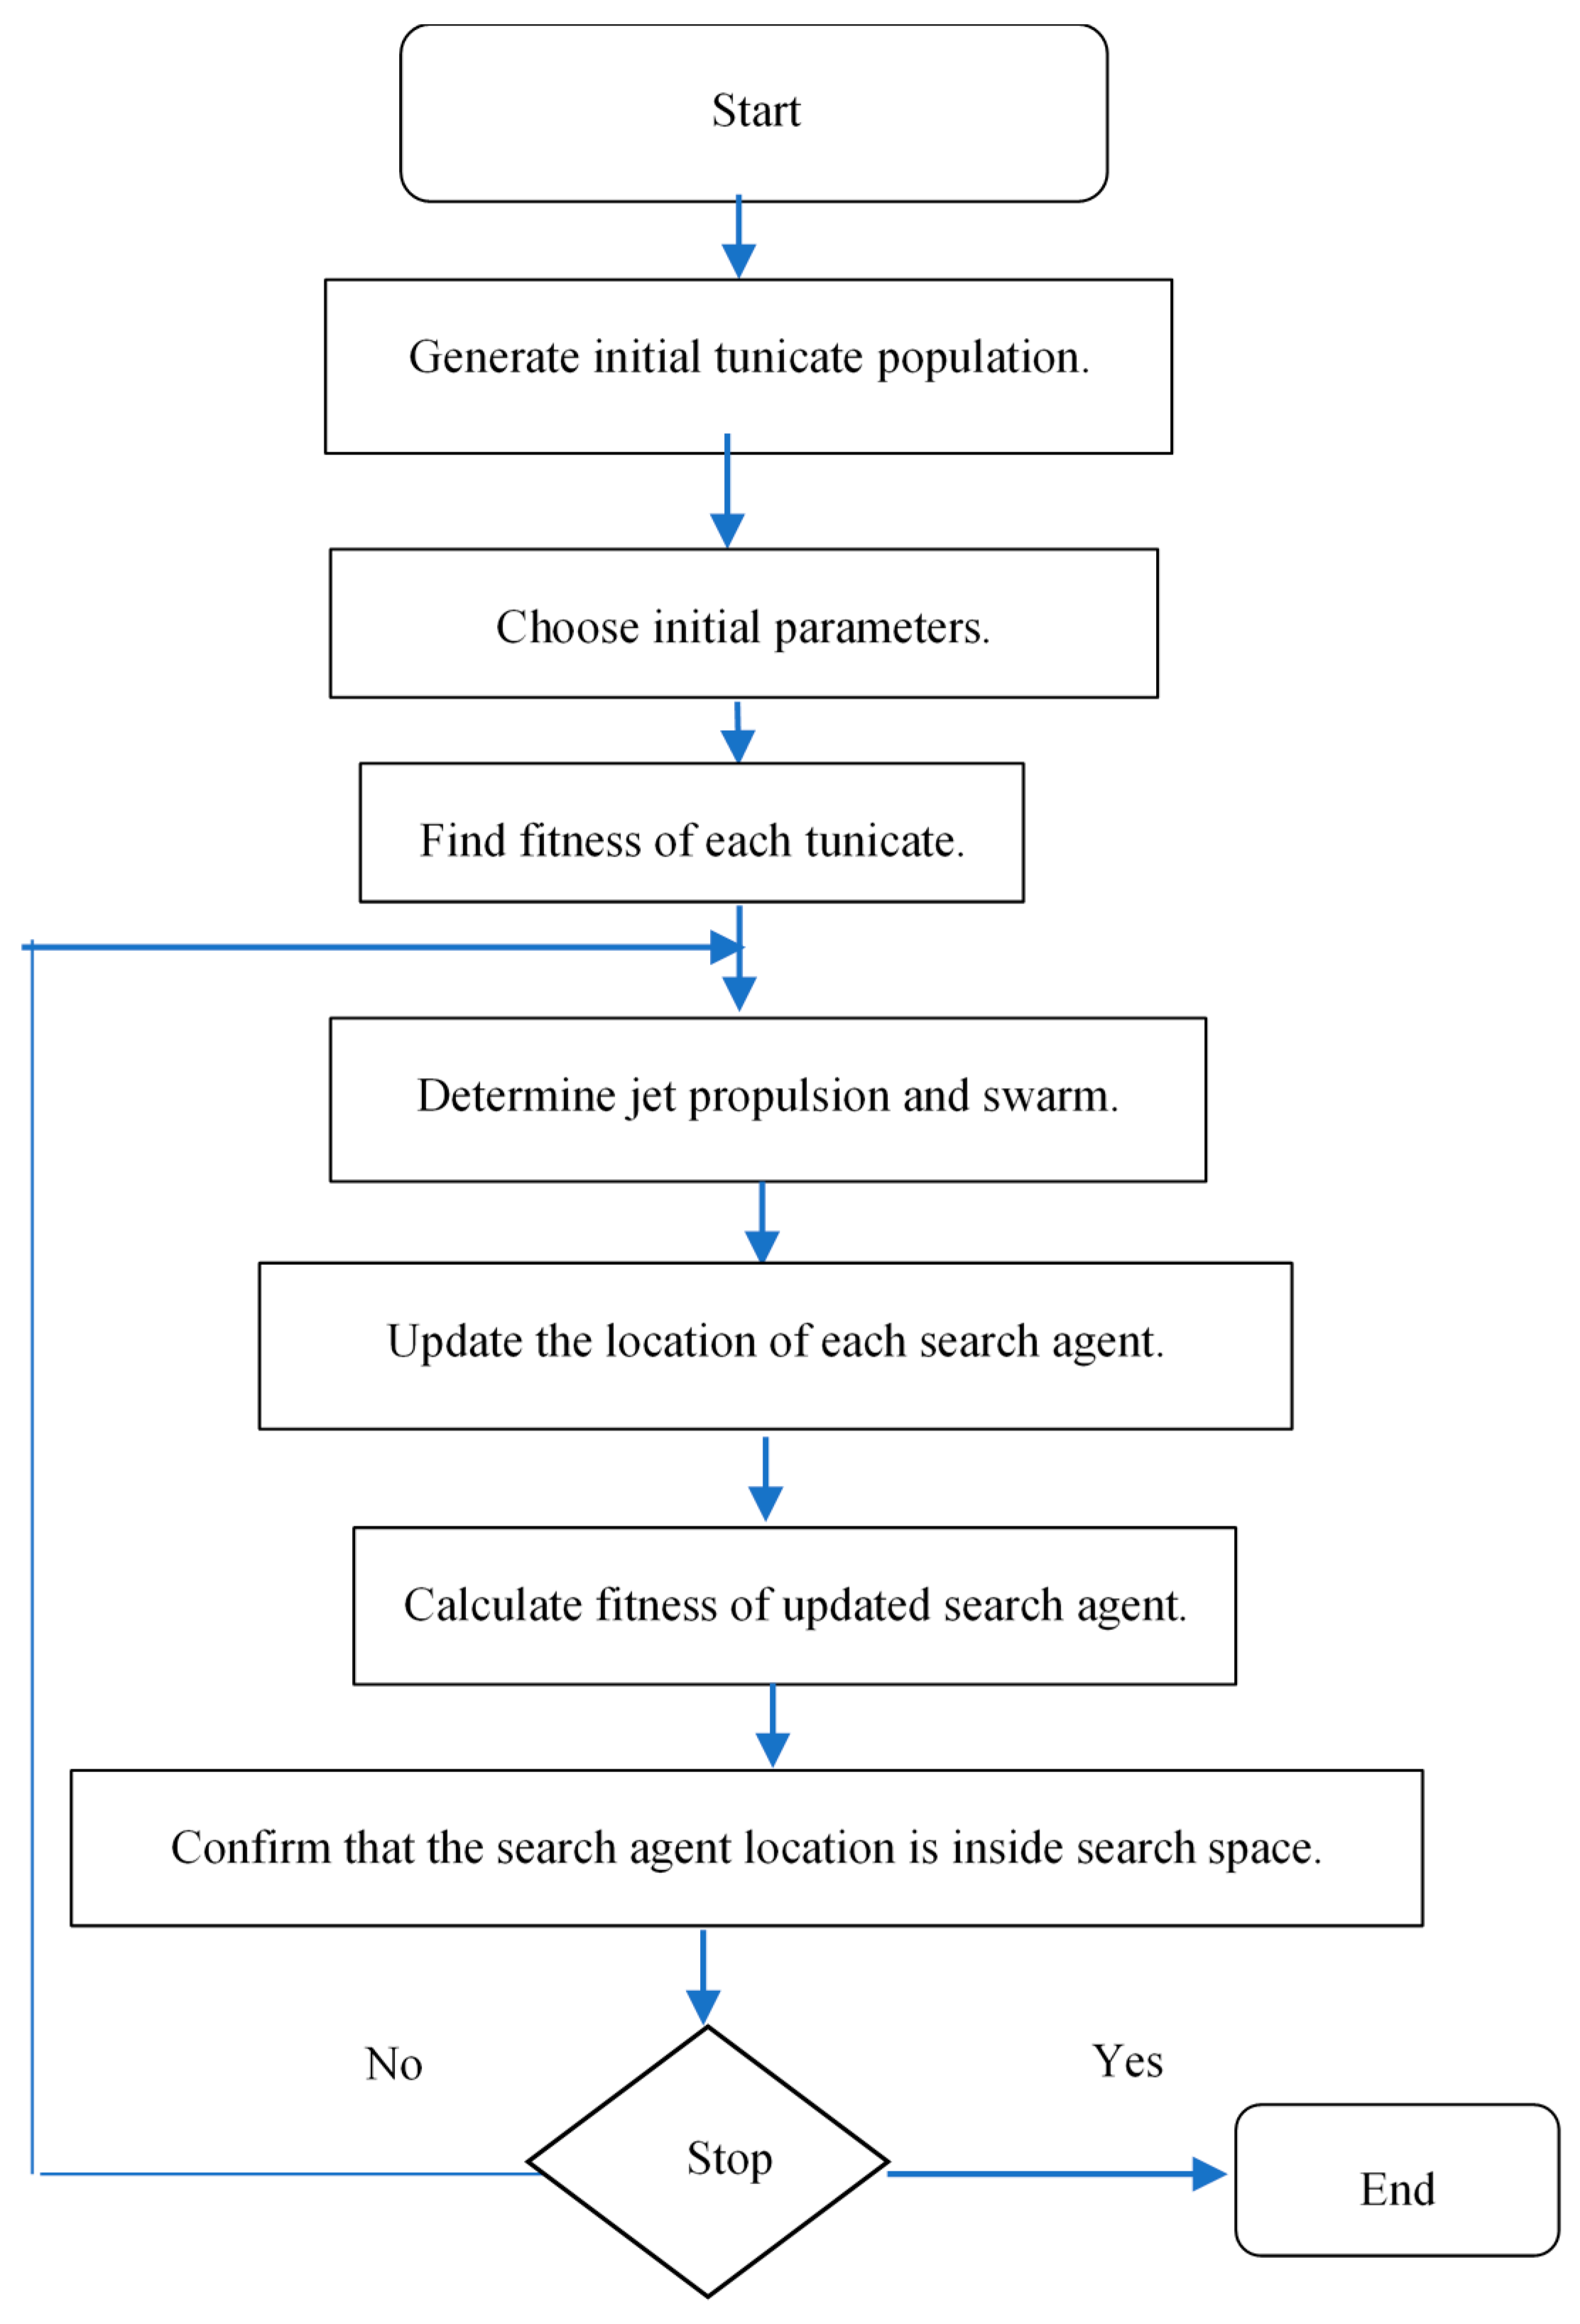
In the proposed algorithm, three stop conditions may be applied: (a) a maximum number of iterations; (b) the objective value is almost constant for many iterations; (c) the required accuracy is achieved.
Figure 8 shows the flow chart of the tunicate swarm algorithm.
Setting parameters:
The following parameters were set in this research to perform the design process:
- (1)
Search agents = 80;
- (2)
= 1;
- (3)
= 4;
- (4)
Number of generations = 1000.
4.2.6. Indicators
The following indicators were used to compare between different optimization techniques and different control schemes:
- i.
Integral absolute error (IAE):
- ii.
Integral time absolute error (ITAE):
5. Self-Tuning of NFOPID Controller
The Egyptian power system has different operating conditions, and for each operating condition, a new design for the centralized controller is required. Since NFOPID has six parameters, the question of what is the optimal way to design the controller arose, and the answer came up with four options of design for each disturbance:
Method 1: Selection of optimal , and only and the rest of the parameters stay constant.
Method 2: Selection of optimal G only and keep the rest of the parameters constant.
Method 3: Selection of optimal G, λ and µ only and keep the rest of the parameters constant.
Method 4: Selection of optimal G, , , , λ and µ.
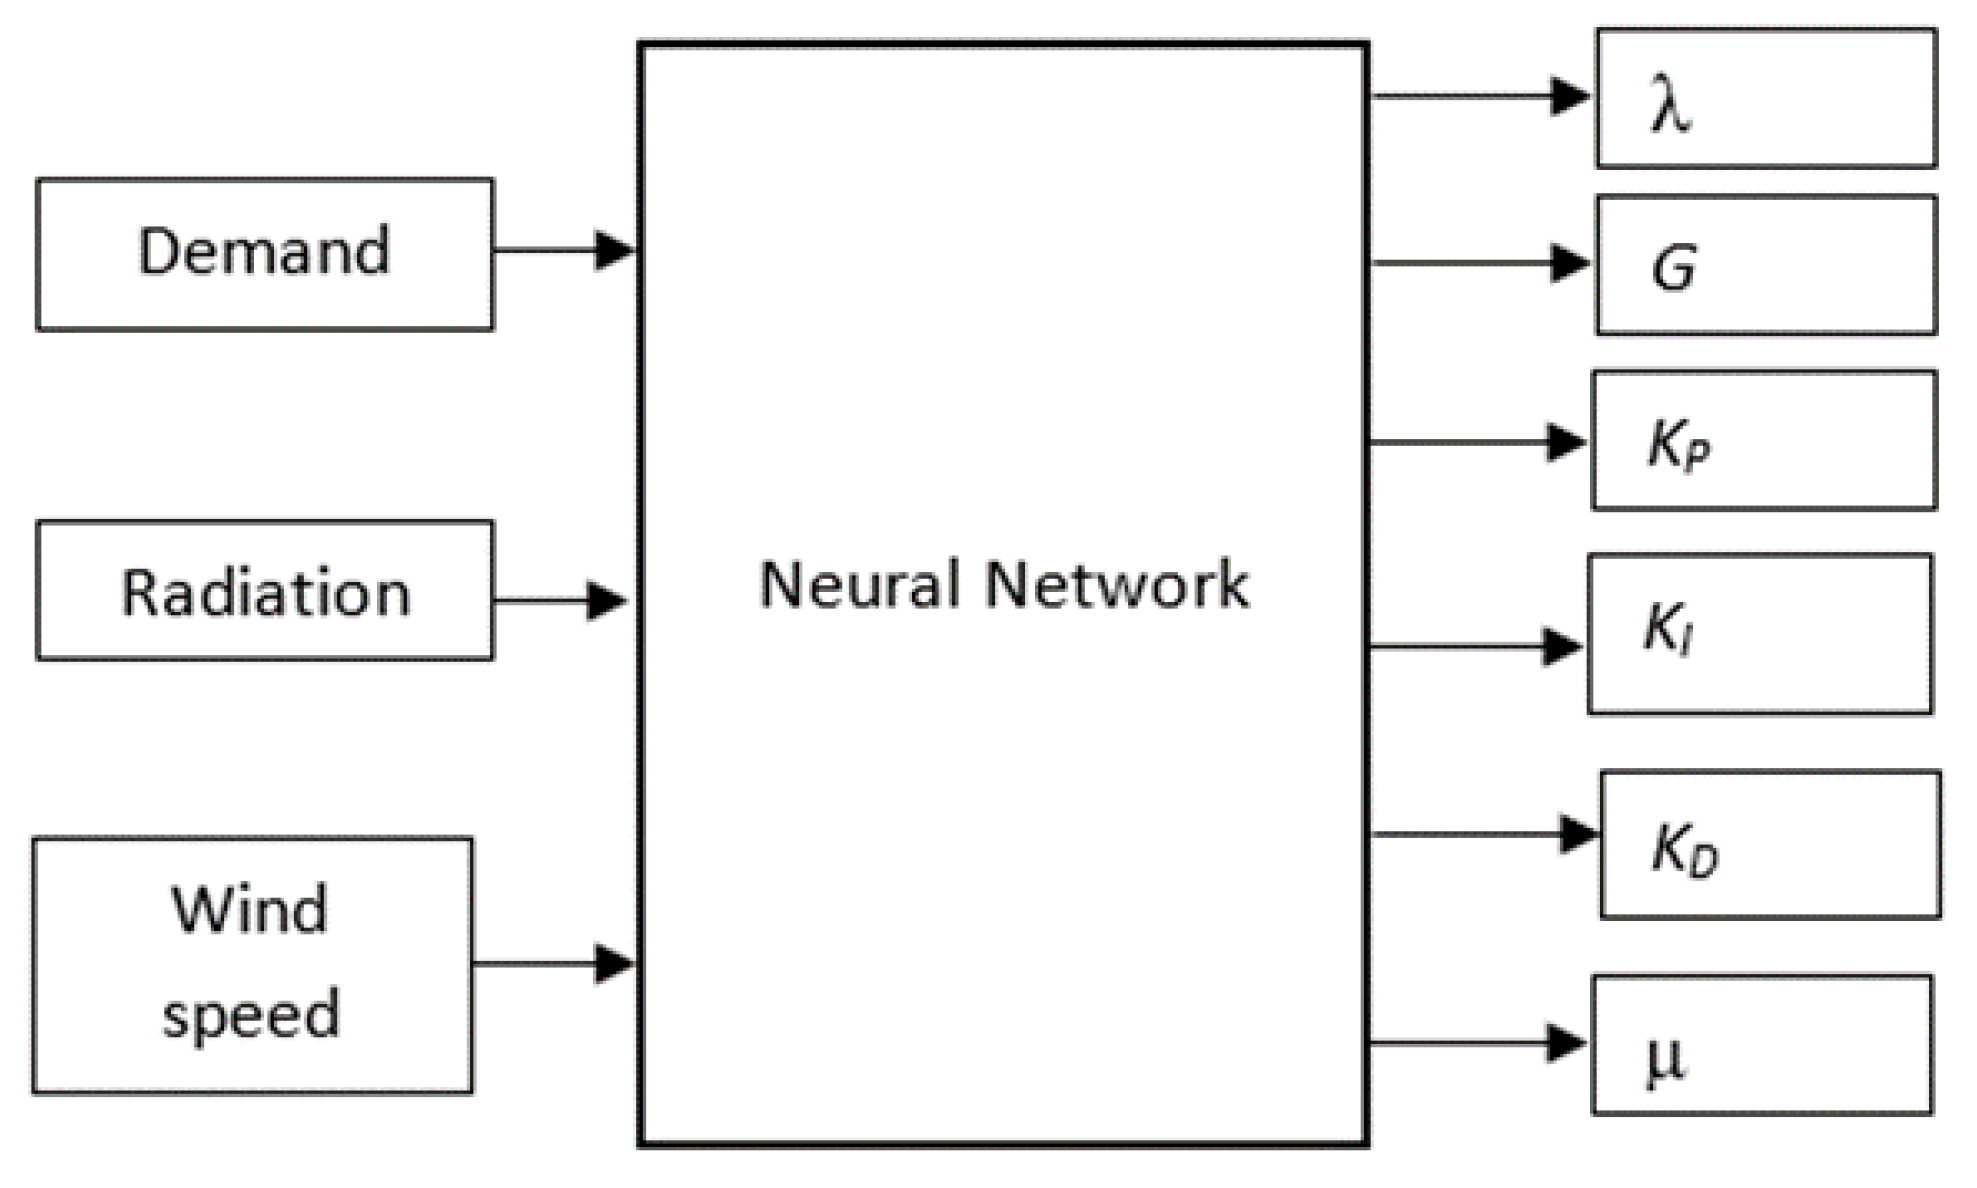
This self-tuning in this study was applied using one of the artificial intelligence techniques which is a neural network (NN) [
11]. The inputs of the NN are the change in the demand power, radiation and wind speed, while the output is the optimal parameters of the NFOPID based on the option of design. The selection will be performed based on the design method (for example, in design method ii, the neural network will select the optimal
G, λ and µ only).
The neural network for self-tuning of the NFOPID controller used in this work is shown in
Figure 9. It consists of three inputs, one to six outputs (depending on the design option) and 10 neuron hidden layers. The network was designed using the well-known Lavenberg–Marquardt backpropagation method [
31,
32].
6. Simulation Results
6.1. Results of Comparison between Different Optimization Techniques
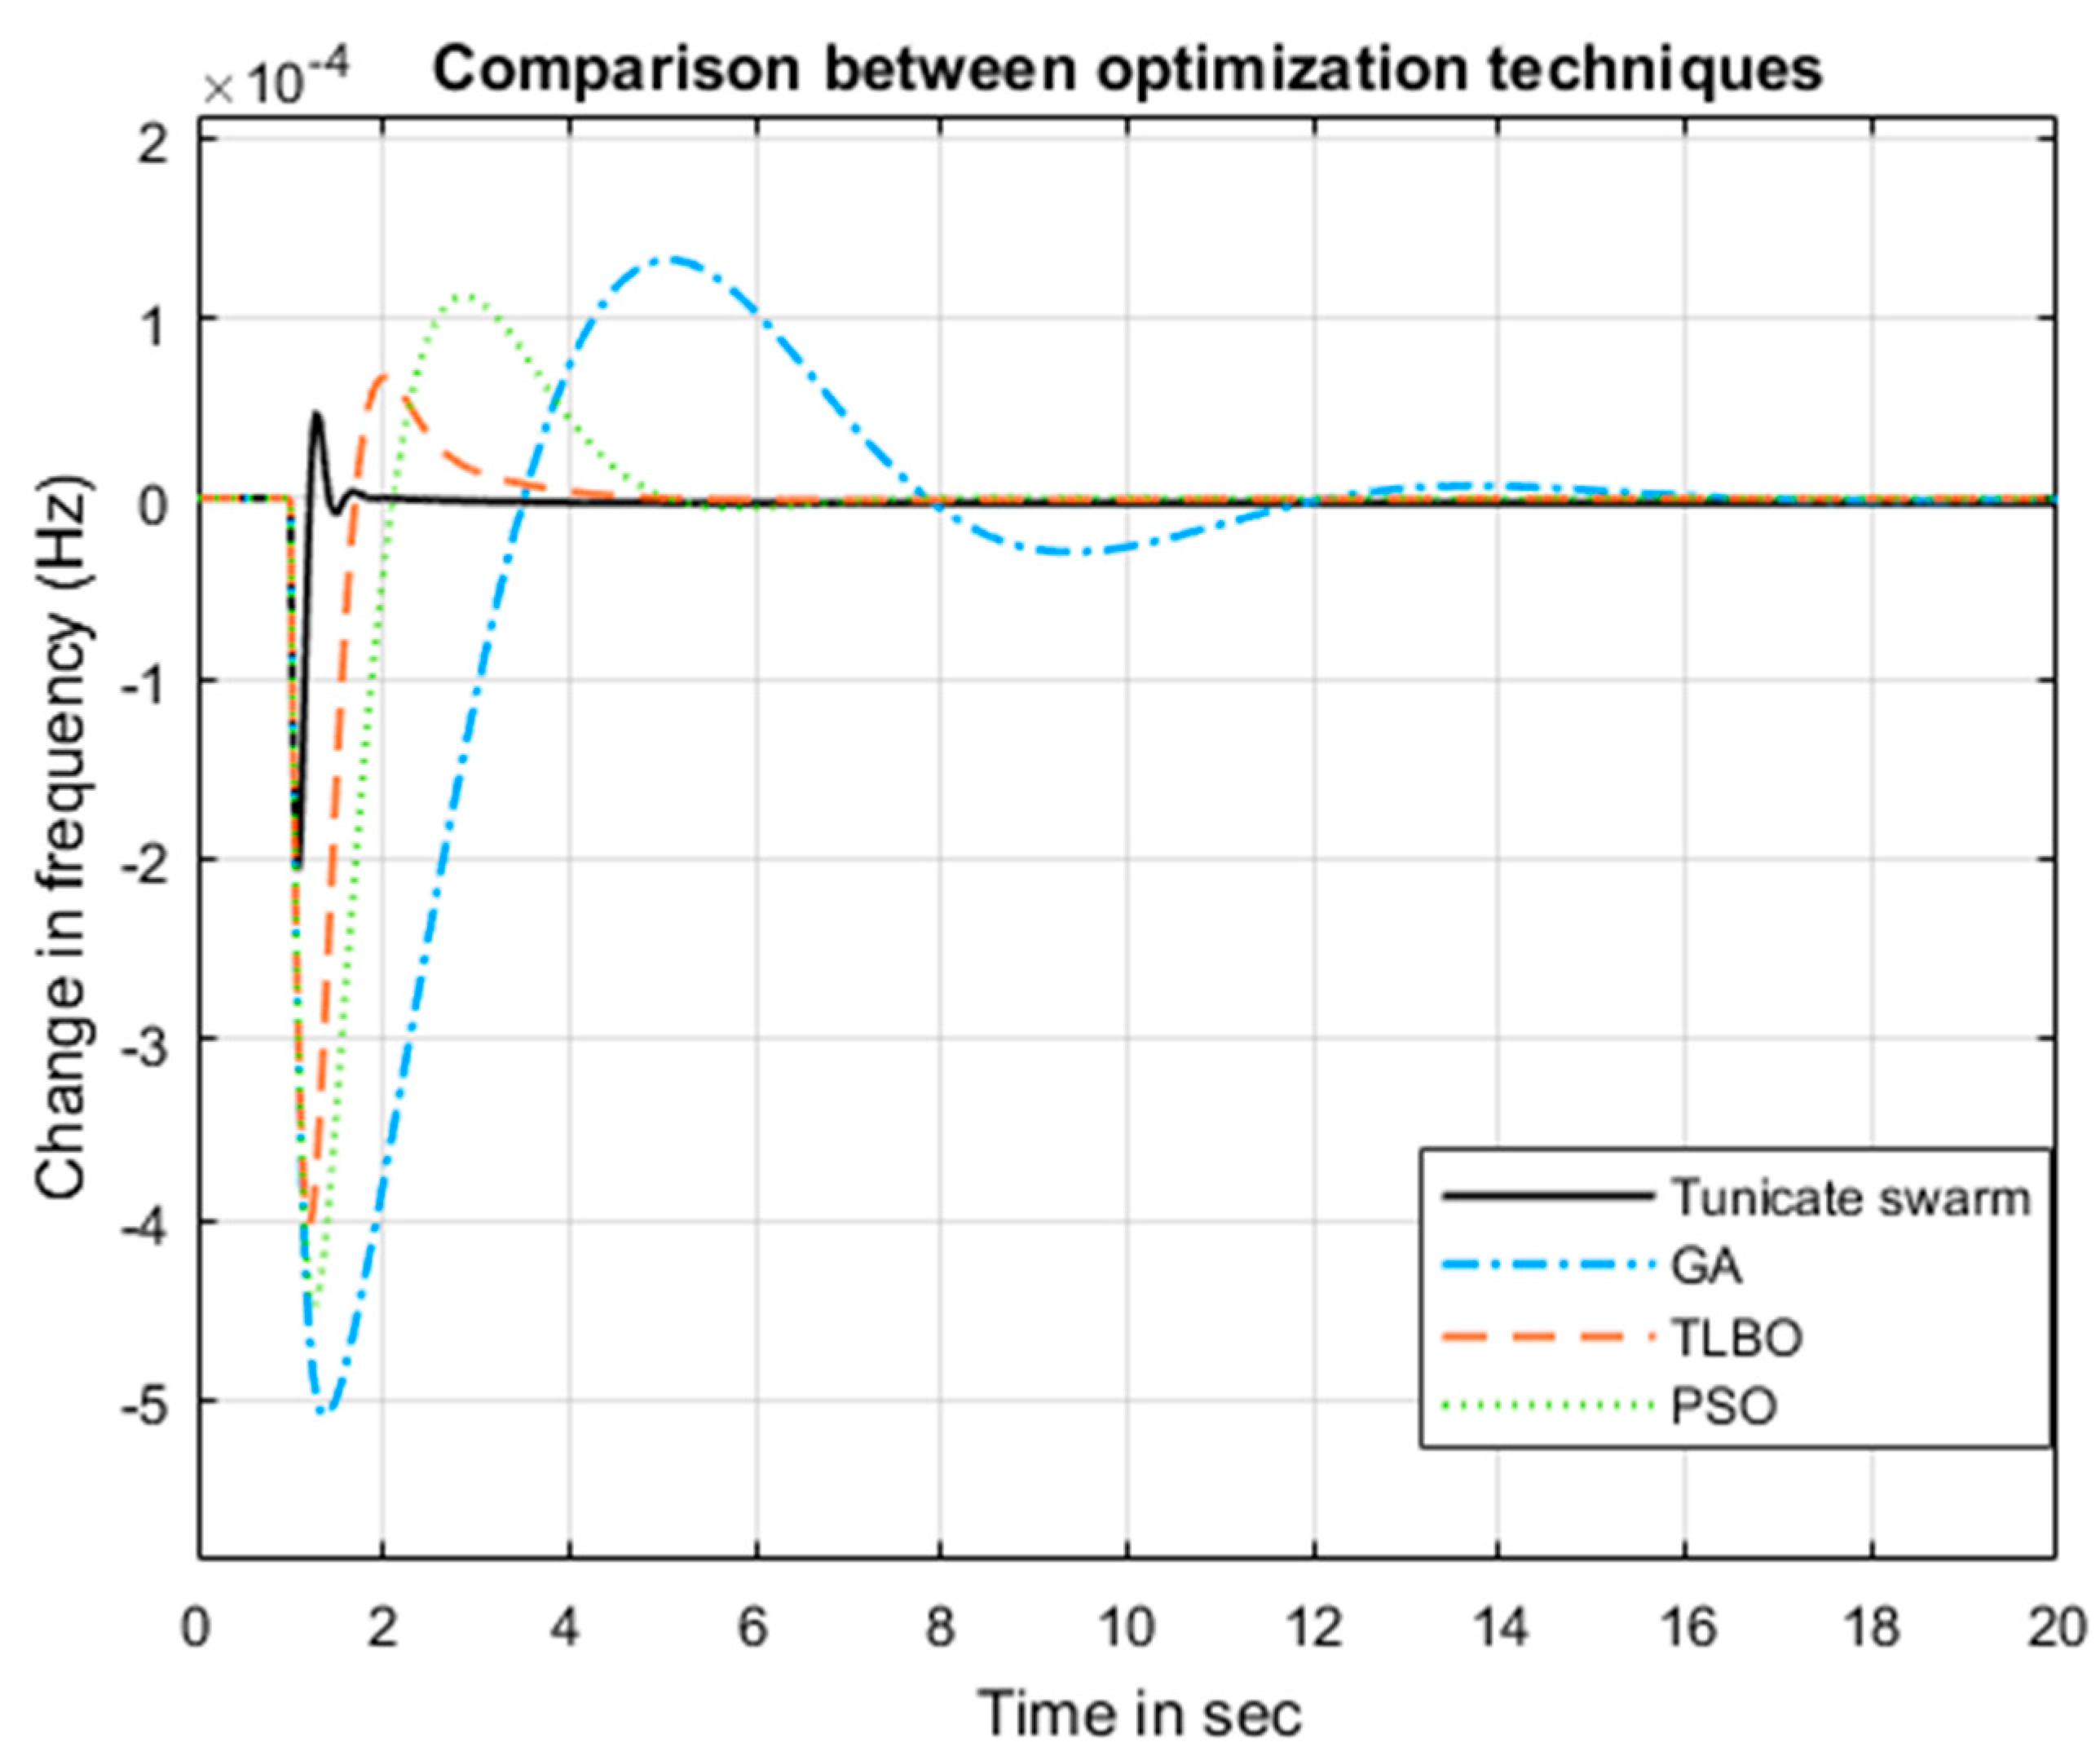
The system was subjected to 1% step load increase, and the grid was assumed to be operated with 100% conventional power generation (no renewables) in this test. The three conventional stations were all assumed to be controlled through a conventional PID controller. The PID controllers were designed using tunicate swarm, TLBO, PSO and GA.
Figure 10 shows a comparison between the effect of the four optimization techniques on the frequency deviation response.
Table 3 shows a comparison between the four optimization techniques. The results show that tunicate swarm has the best performance in terms of ITAE, IAE, minimum number of iterations, maximum overshoot (Osh), maximum undershoot (Ush), peak time (tp) and settling time (ts). The convincing results drive the authors to complete the upcoming study cases using tunicate swarm in controller design.
6.2. Results of Comparison between PID, NPID, FOPID and NFOPID
There are three cases taken into consideration to compare between the controllers.
Case 1: load increase by 10% in the presence of renewables
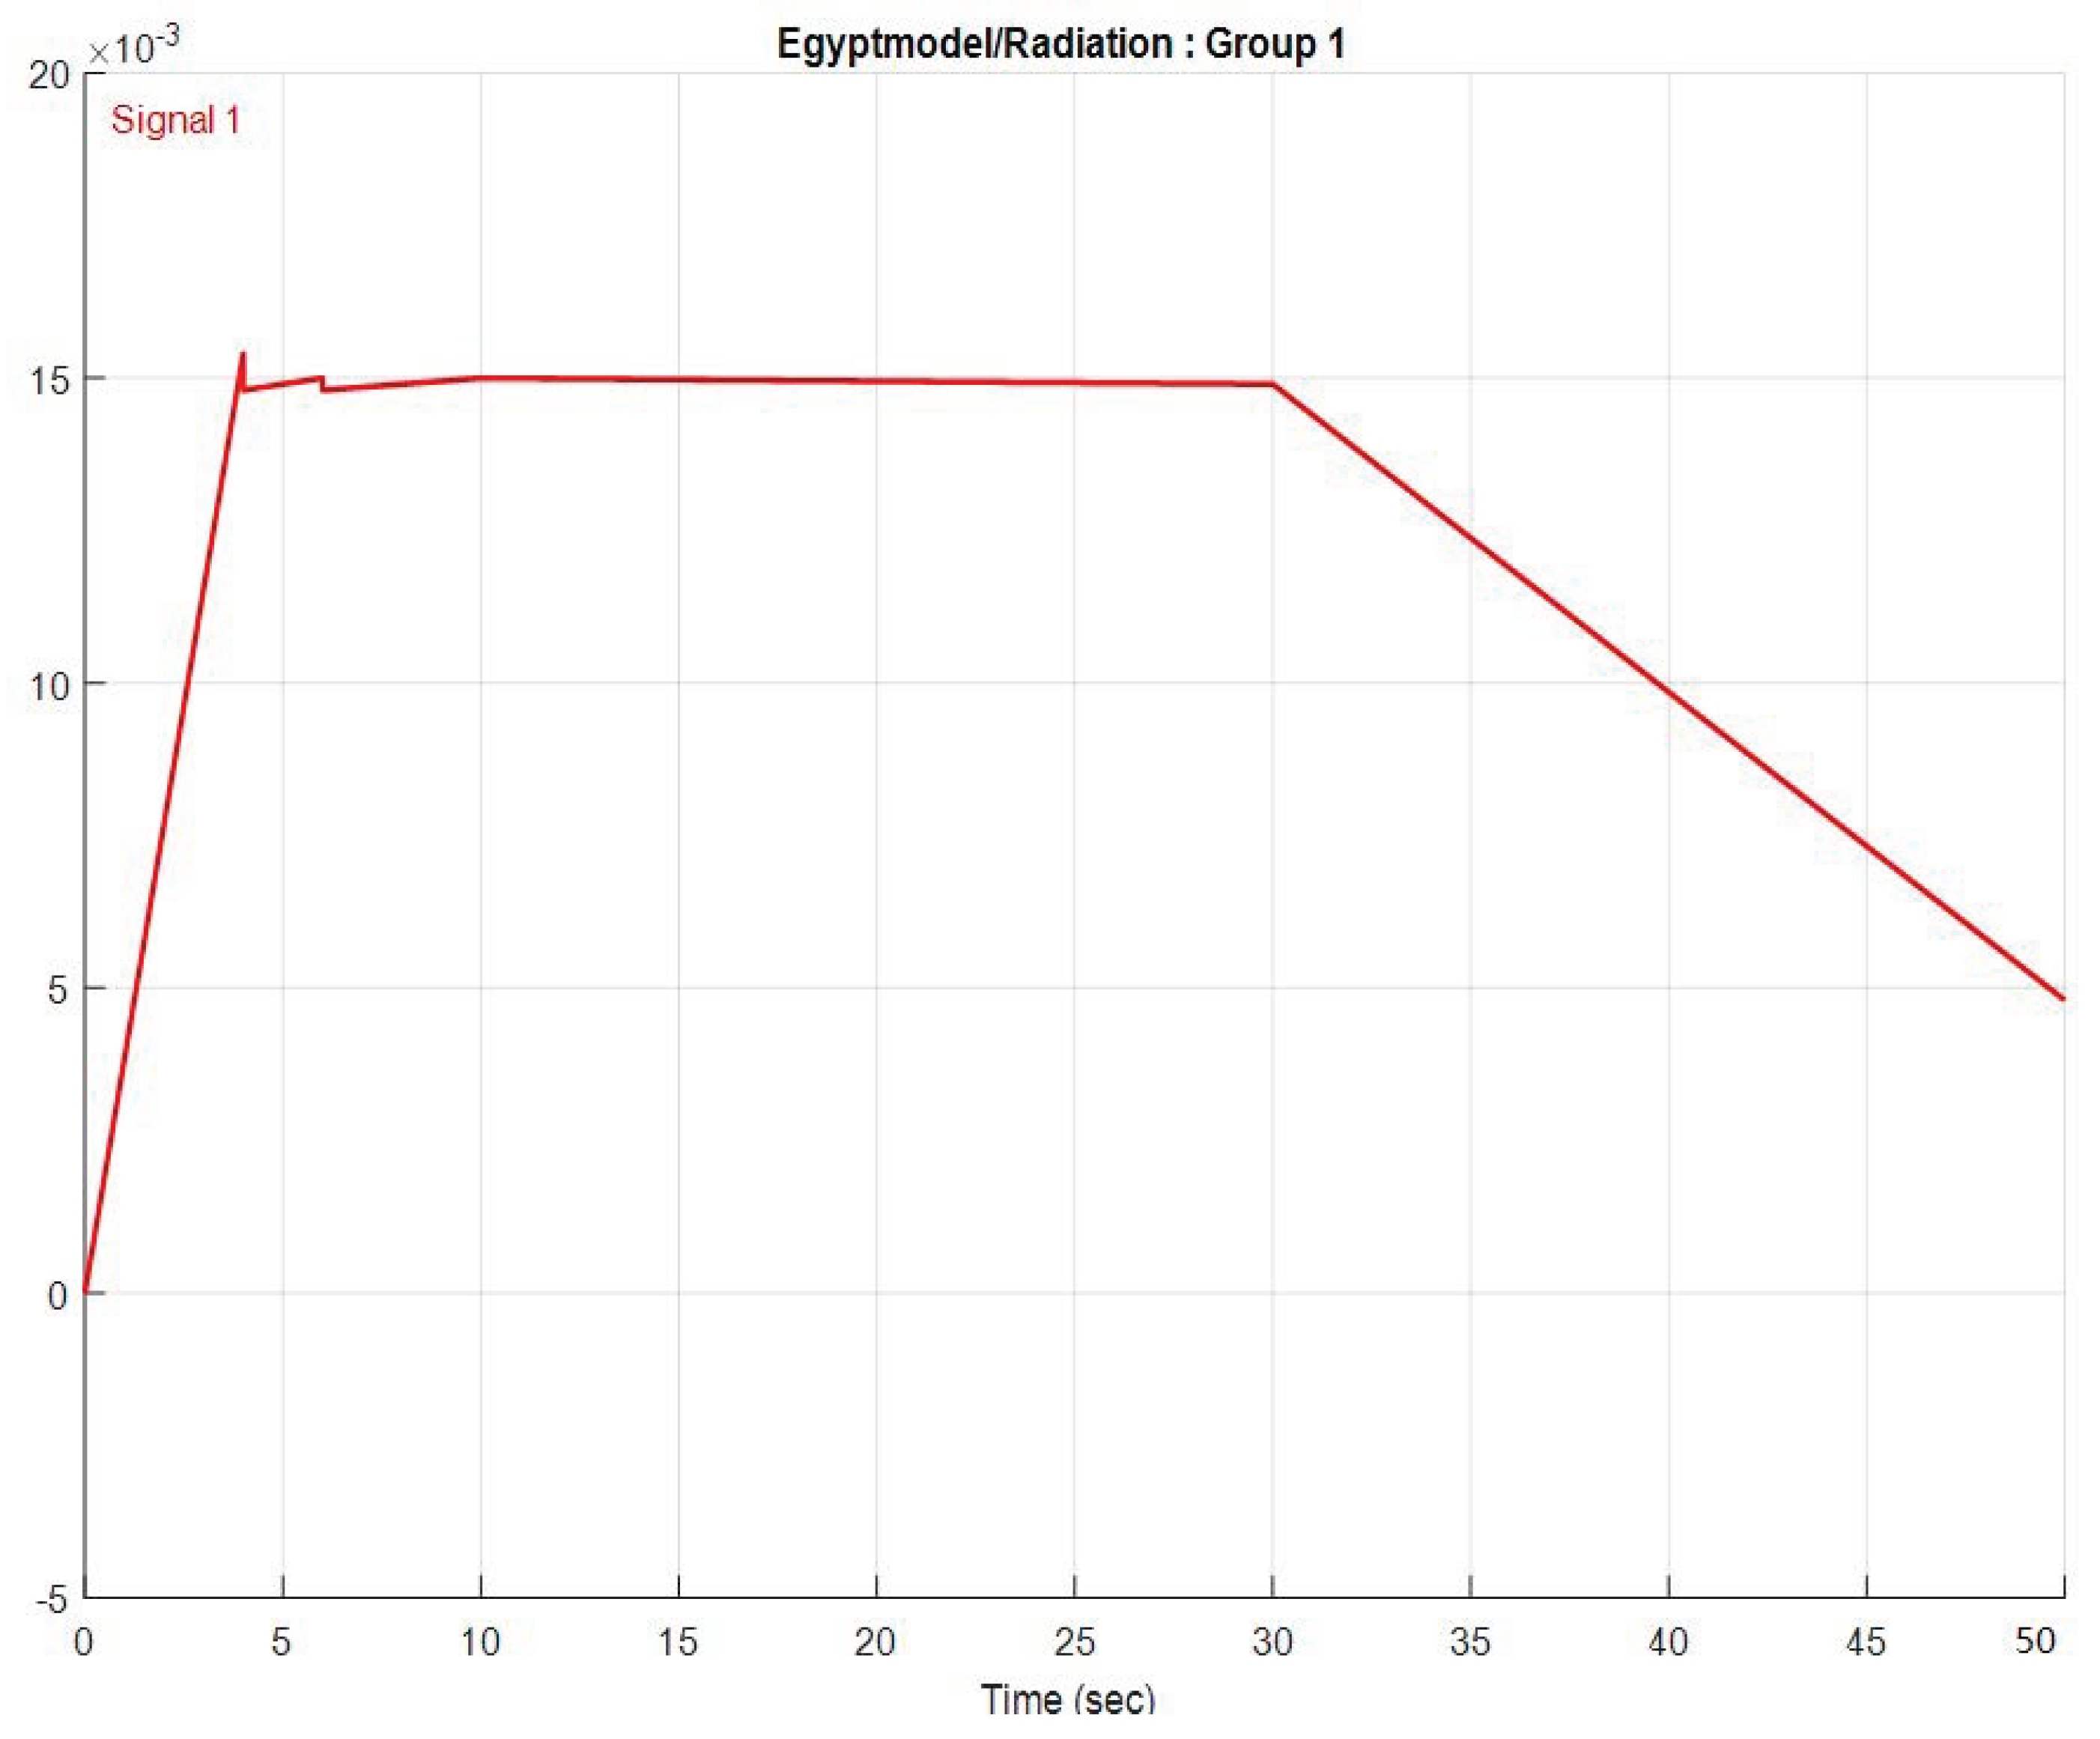
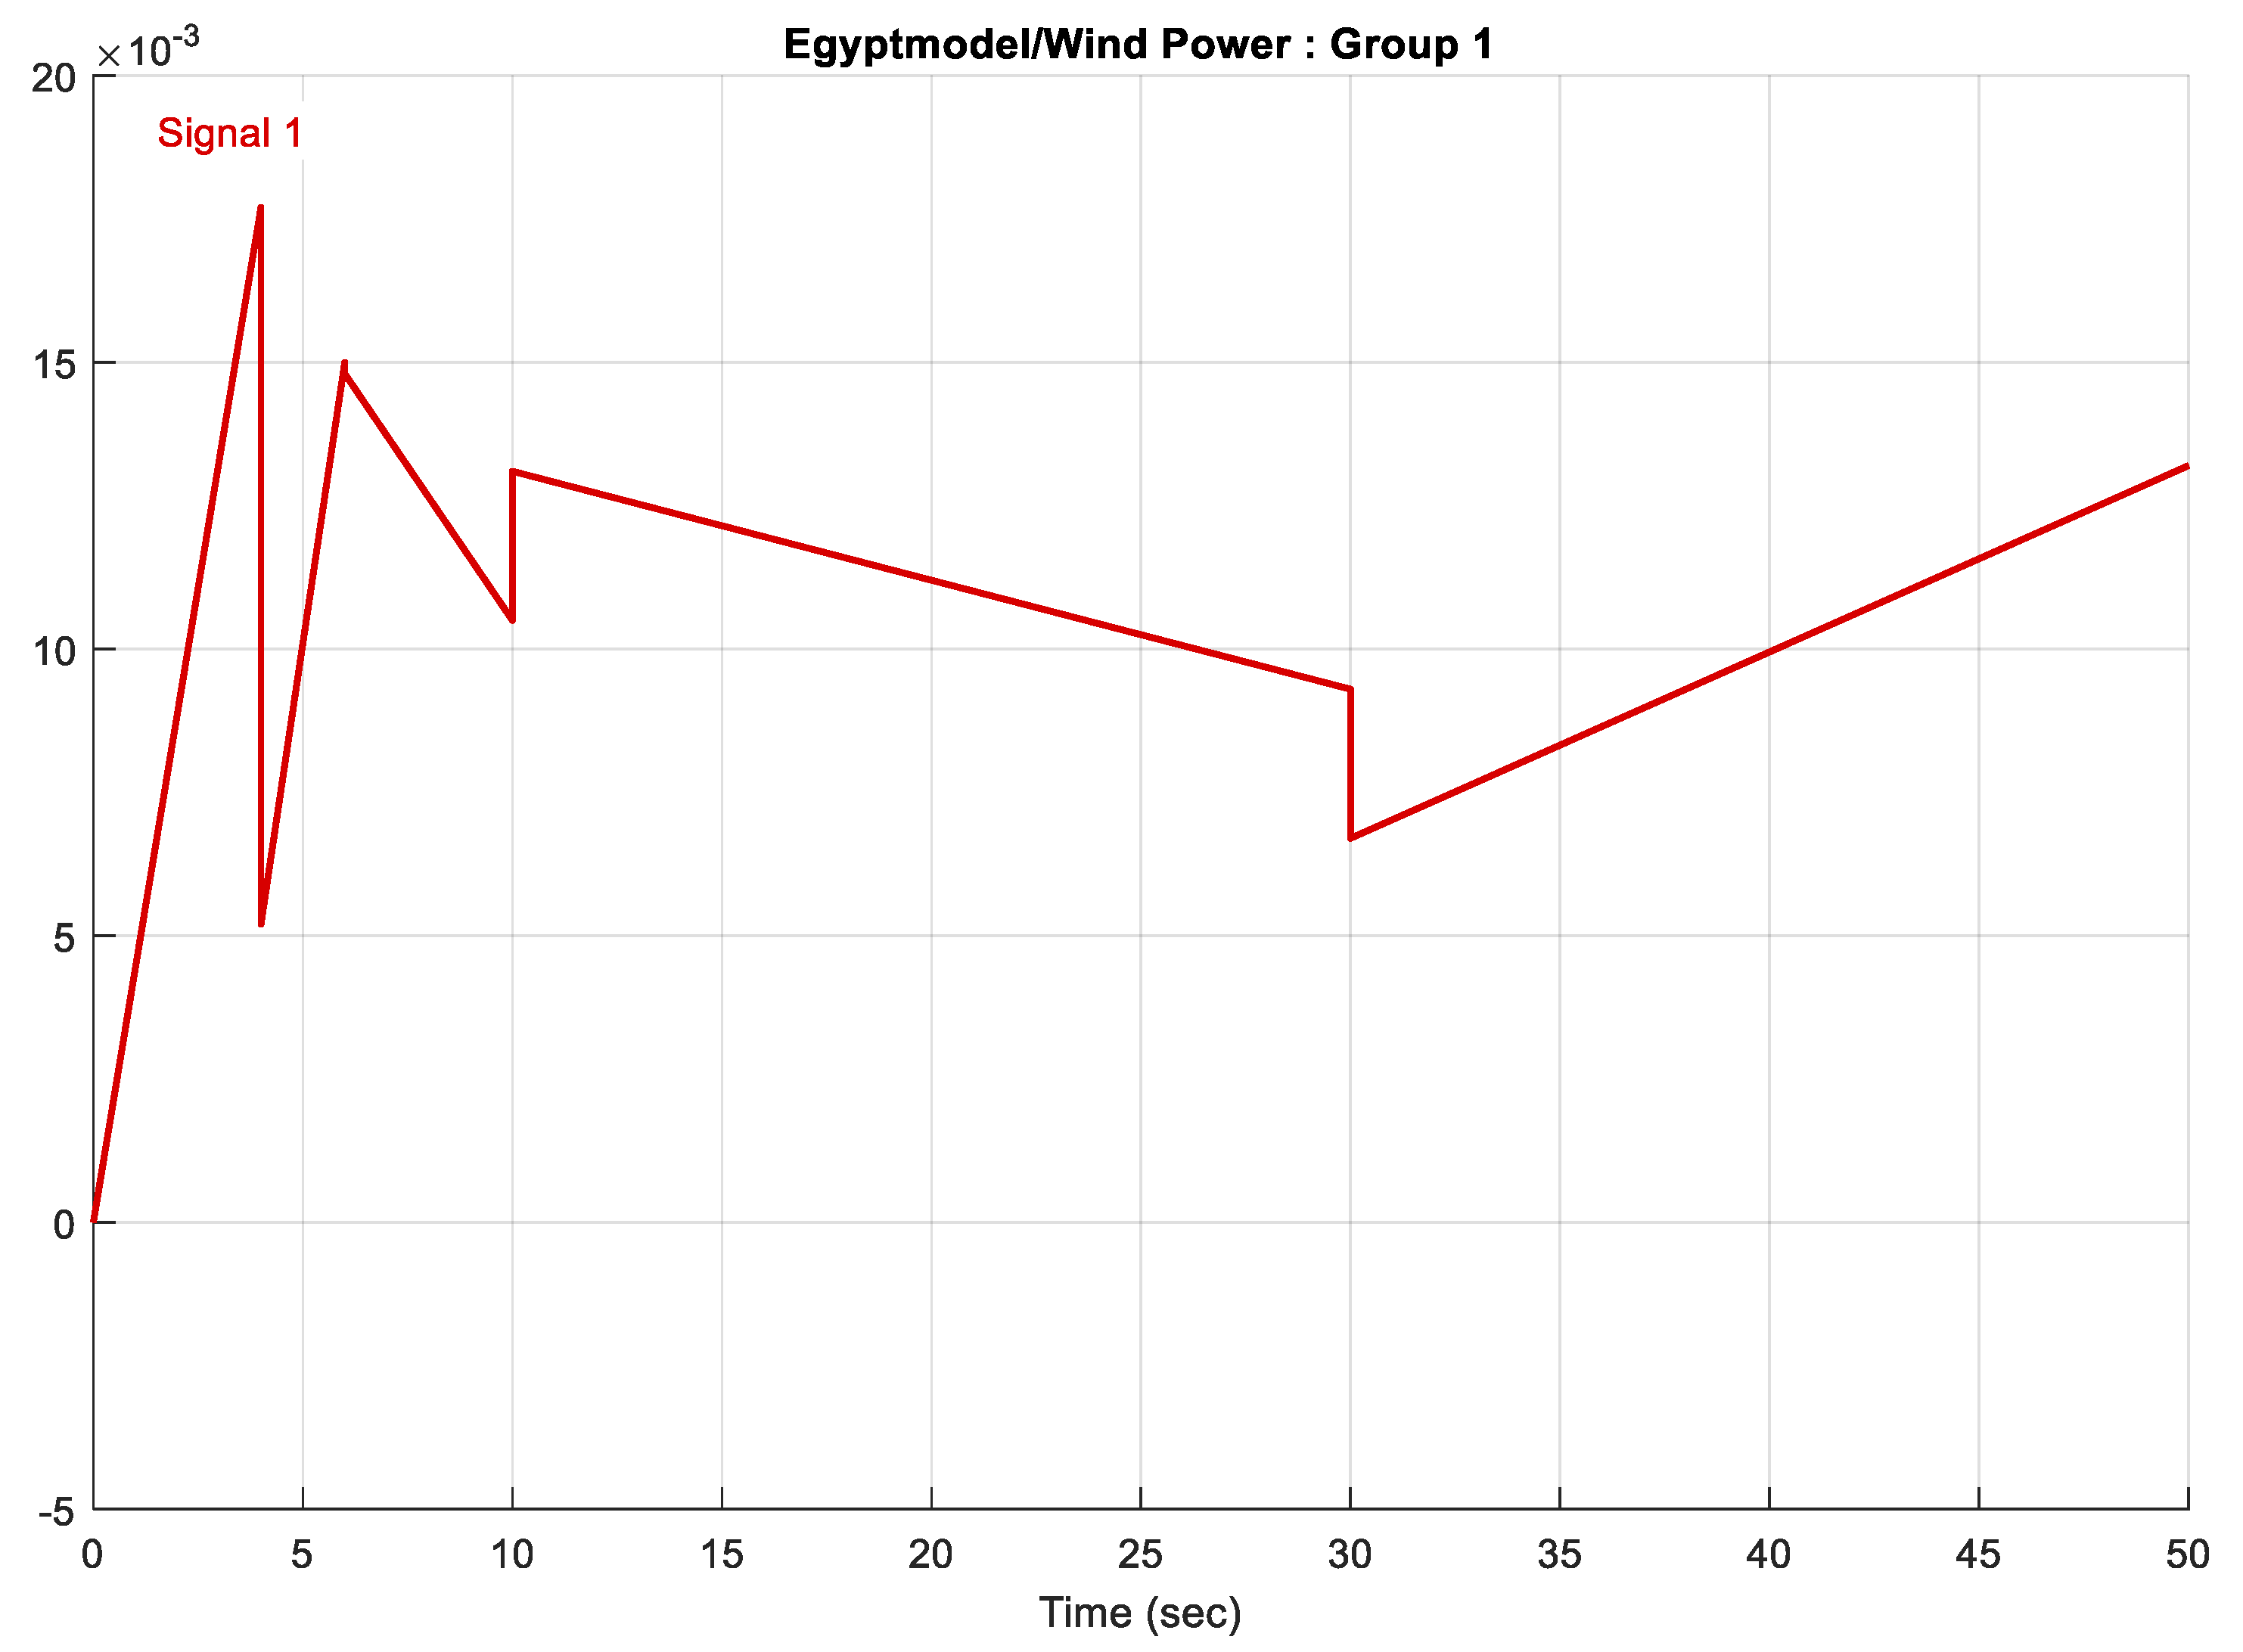
In this case, it was assumed that the load increased by 10% after 1 s (step increase) from starting the simulation. The solar radiation and wind power curves are shown in
Figure 11 and
Figure 12, respectively, and were obtained from Mateo station installed in Suez Governorate.
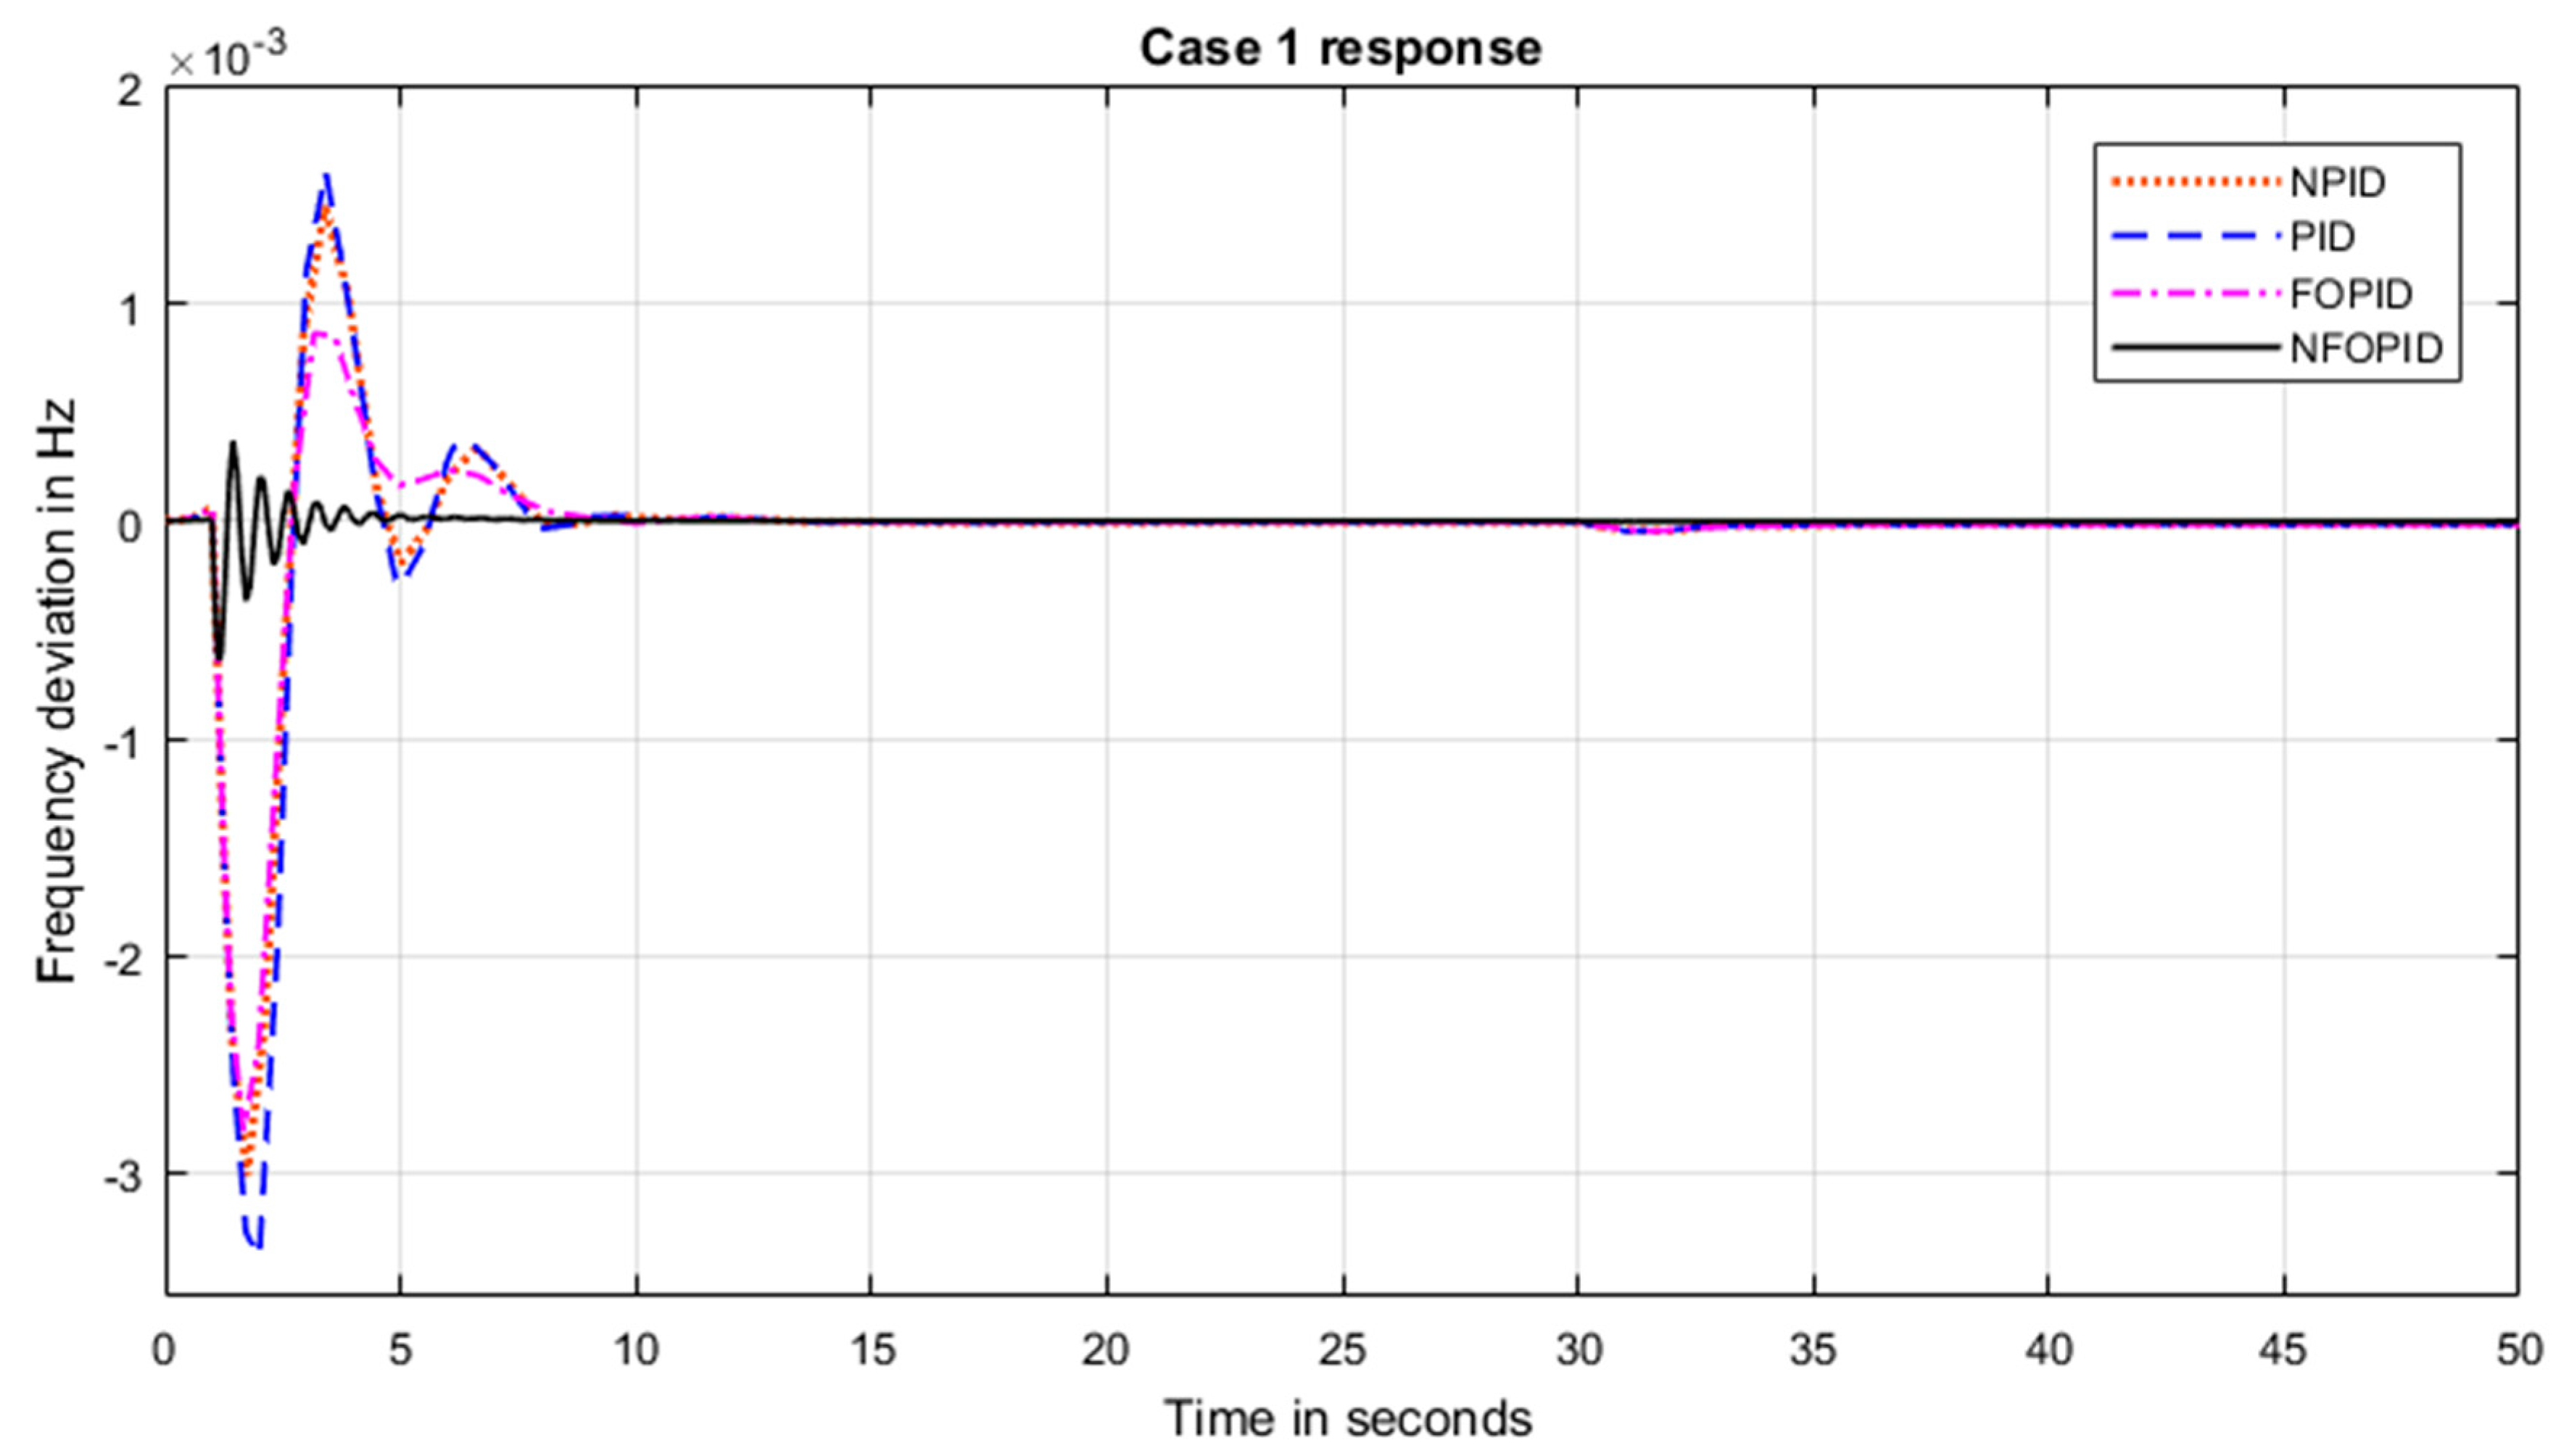
Figure 13 shows the frequency deviation response at this case, where the results show that NFOPID has a better performance than the other three controllers. The results also show that FOPID is better than the NPID controller. A comparison between the four controllers in terms of maximum overshoot, minimum overshoot and settling time is shown in
Table 4. The optimal controller parameters designed by tunicate swarm are also shown in
Table 5. The results also show that the NFOPID controller drives the system to reduce the settling time by 50% compared to the FOPID controller. FOPID reduces the settling time by 20% compared to NPID, which has the same settling time as the PID controller. The system has maximum overshoot using NFOPID, better than of that FOPID by 79%, while FOPID is better than NPID by 50%, and NPID is better than PID by 6%. The system has minimum overshoot using NFOPID, better than that of FOPID by 82%, while FOPID is better than NPID by 7%, and NPID is better than PID by 9%.
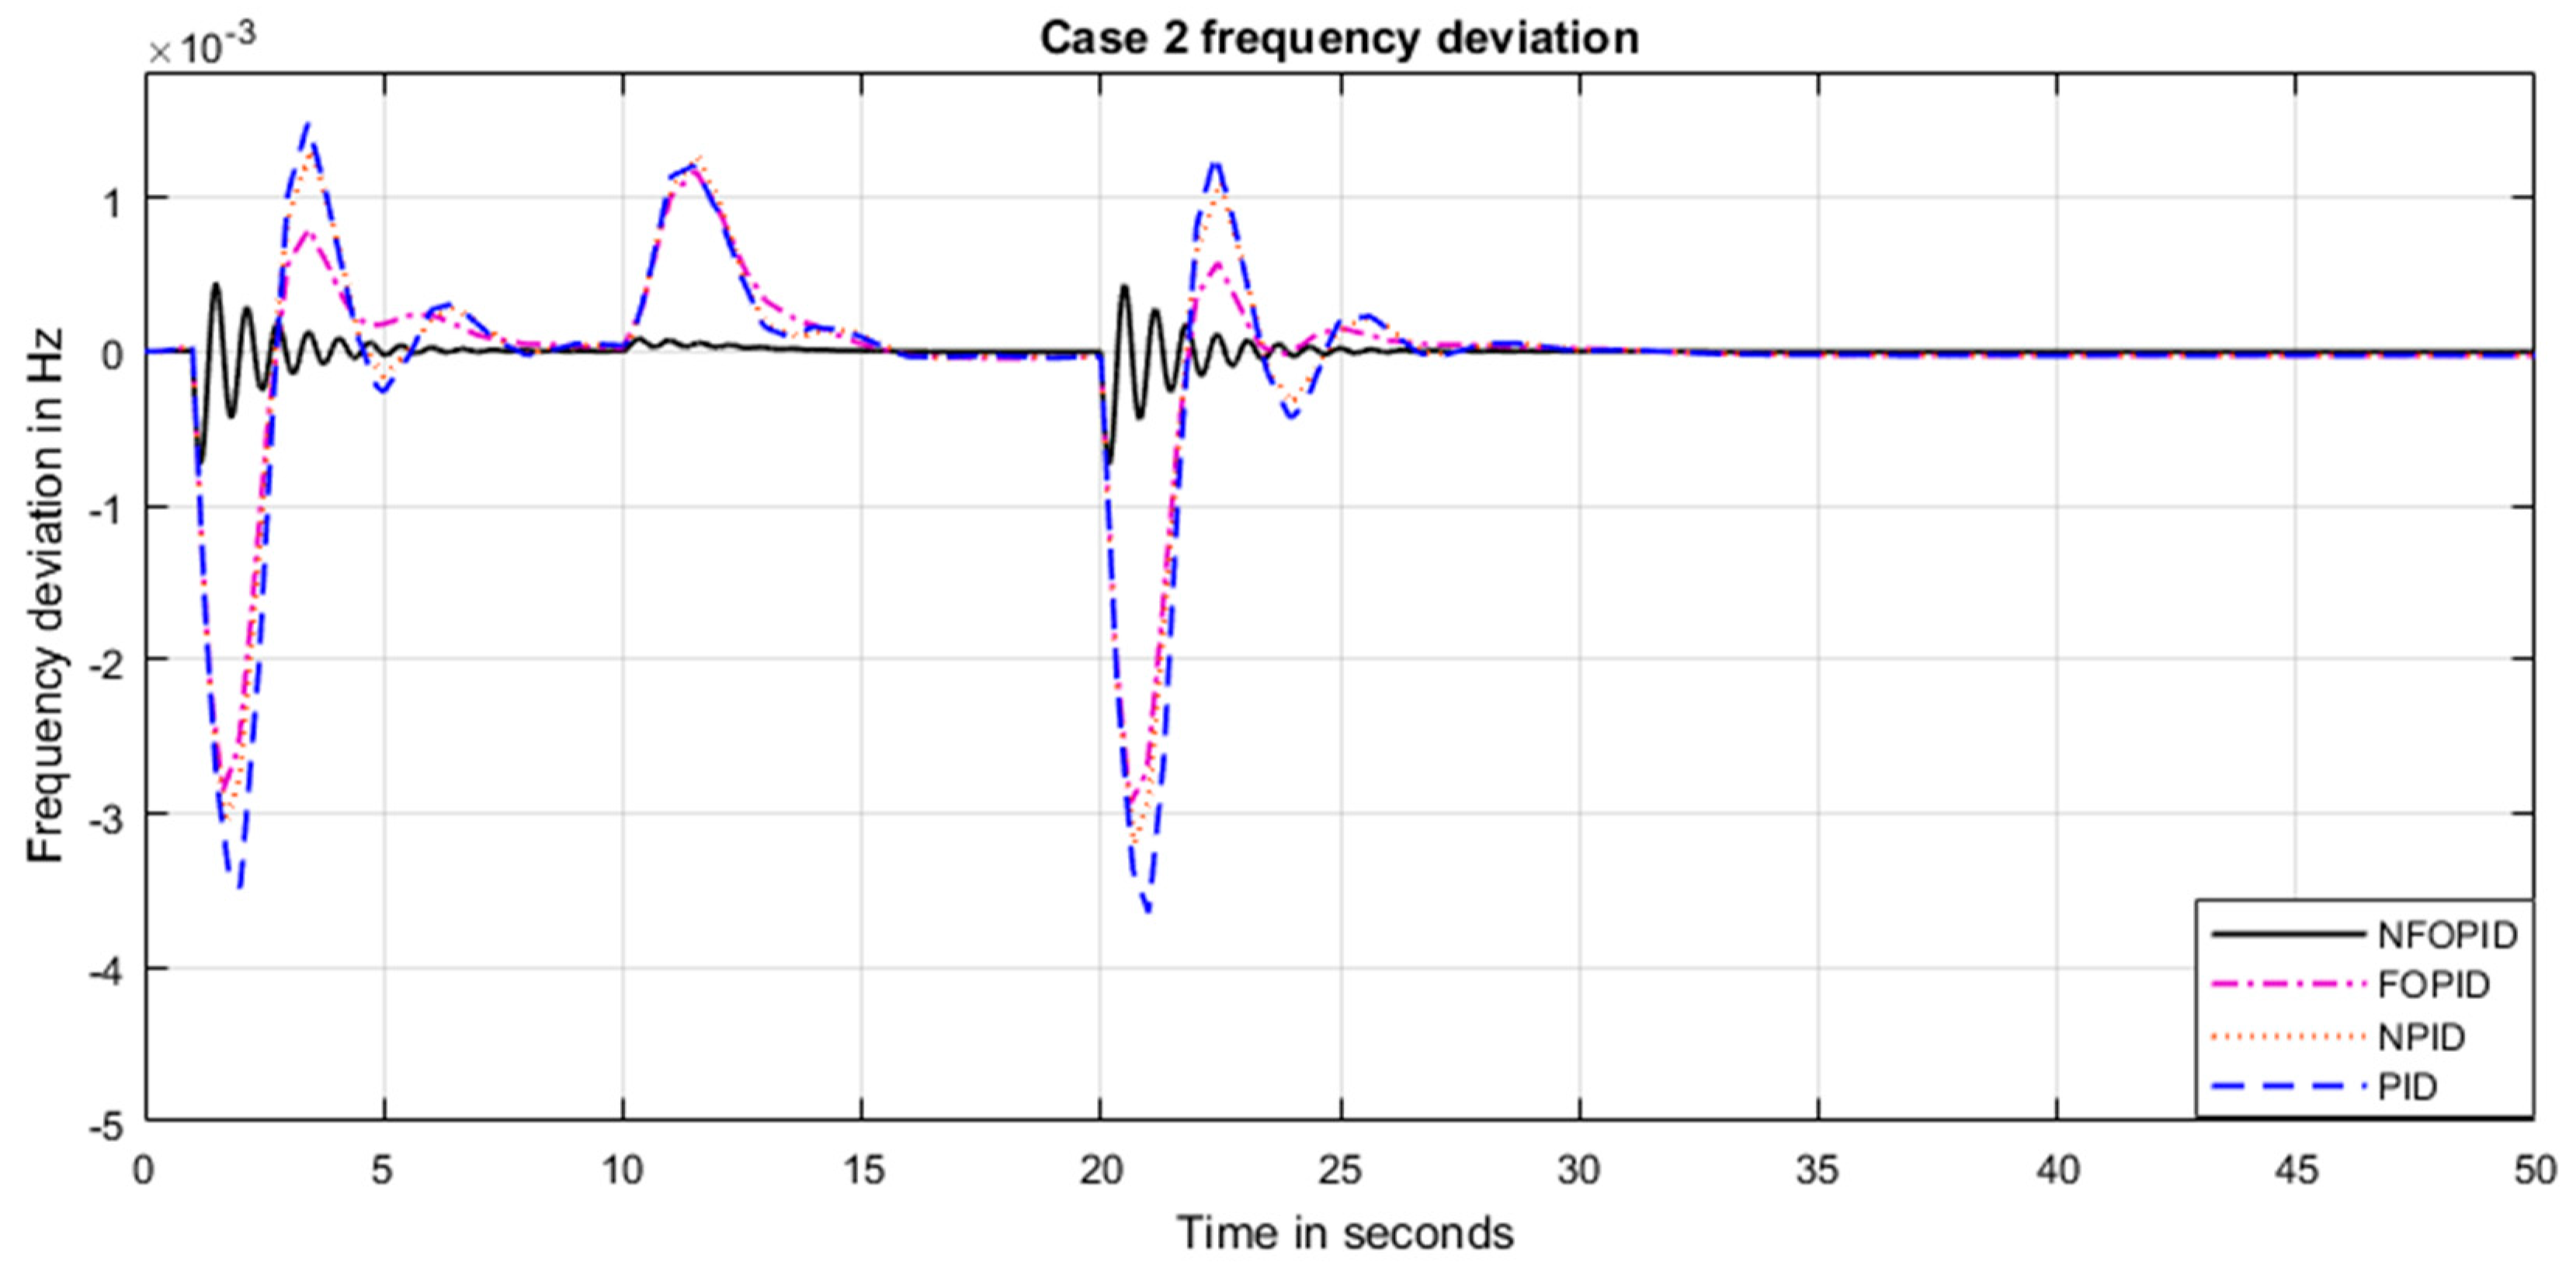
Case 2: load increase by 10%, wind integration and wind outage
In this case, it was assumed that the load is increased by 10% after 1 s from starting the simulation, radiation was assumed to be that shown in
Figure 11 and the wind farm was assumed to be integrated into the grid after 10 s and went out of service after 20 s. The controller’s parameters are the same as those mentioned in case 1.
The results in
Figure 14 show that NFOPID has the best performance in terms of settling time and maximum and minimum overshoot when the wind farm was integrated into the grid and went out of service. FOPID takes second place, while NPID takes third place.
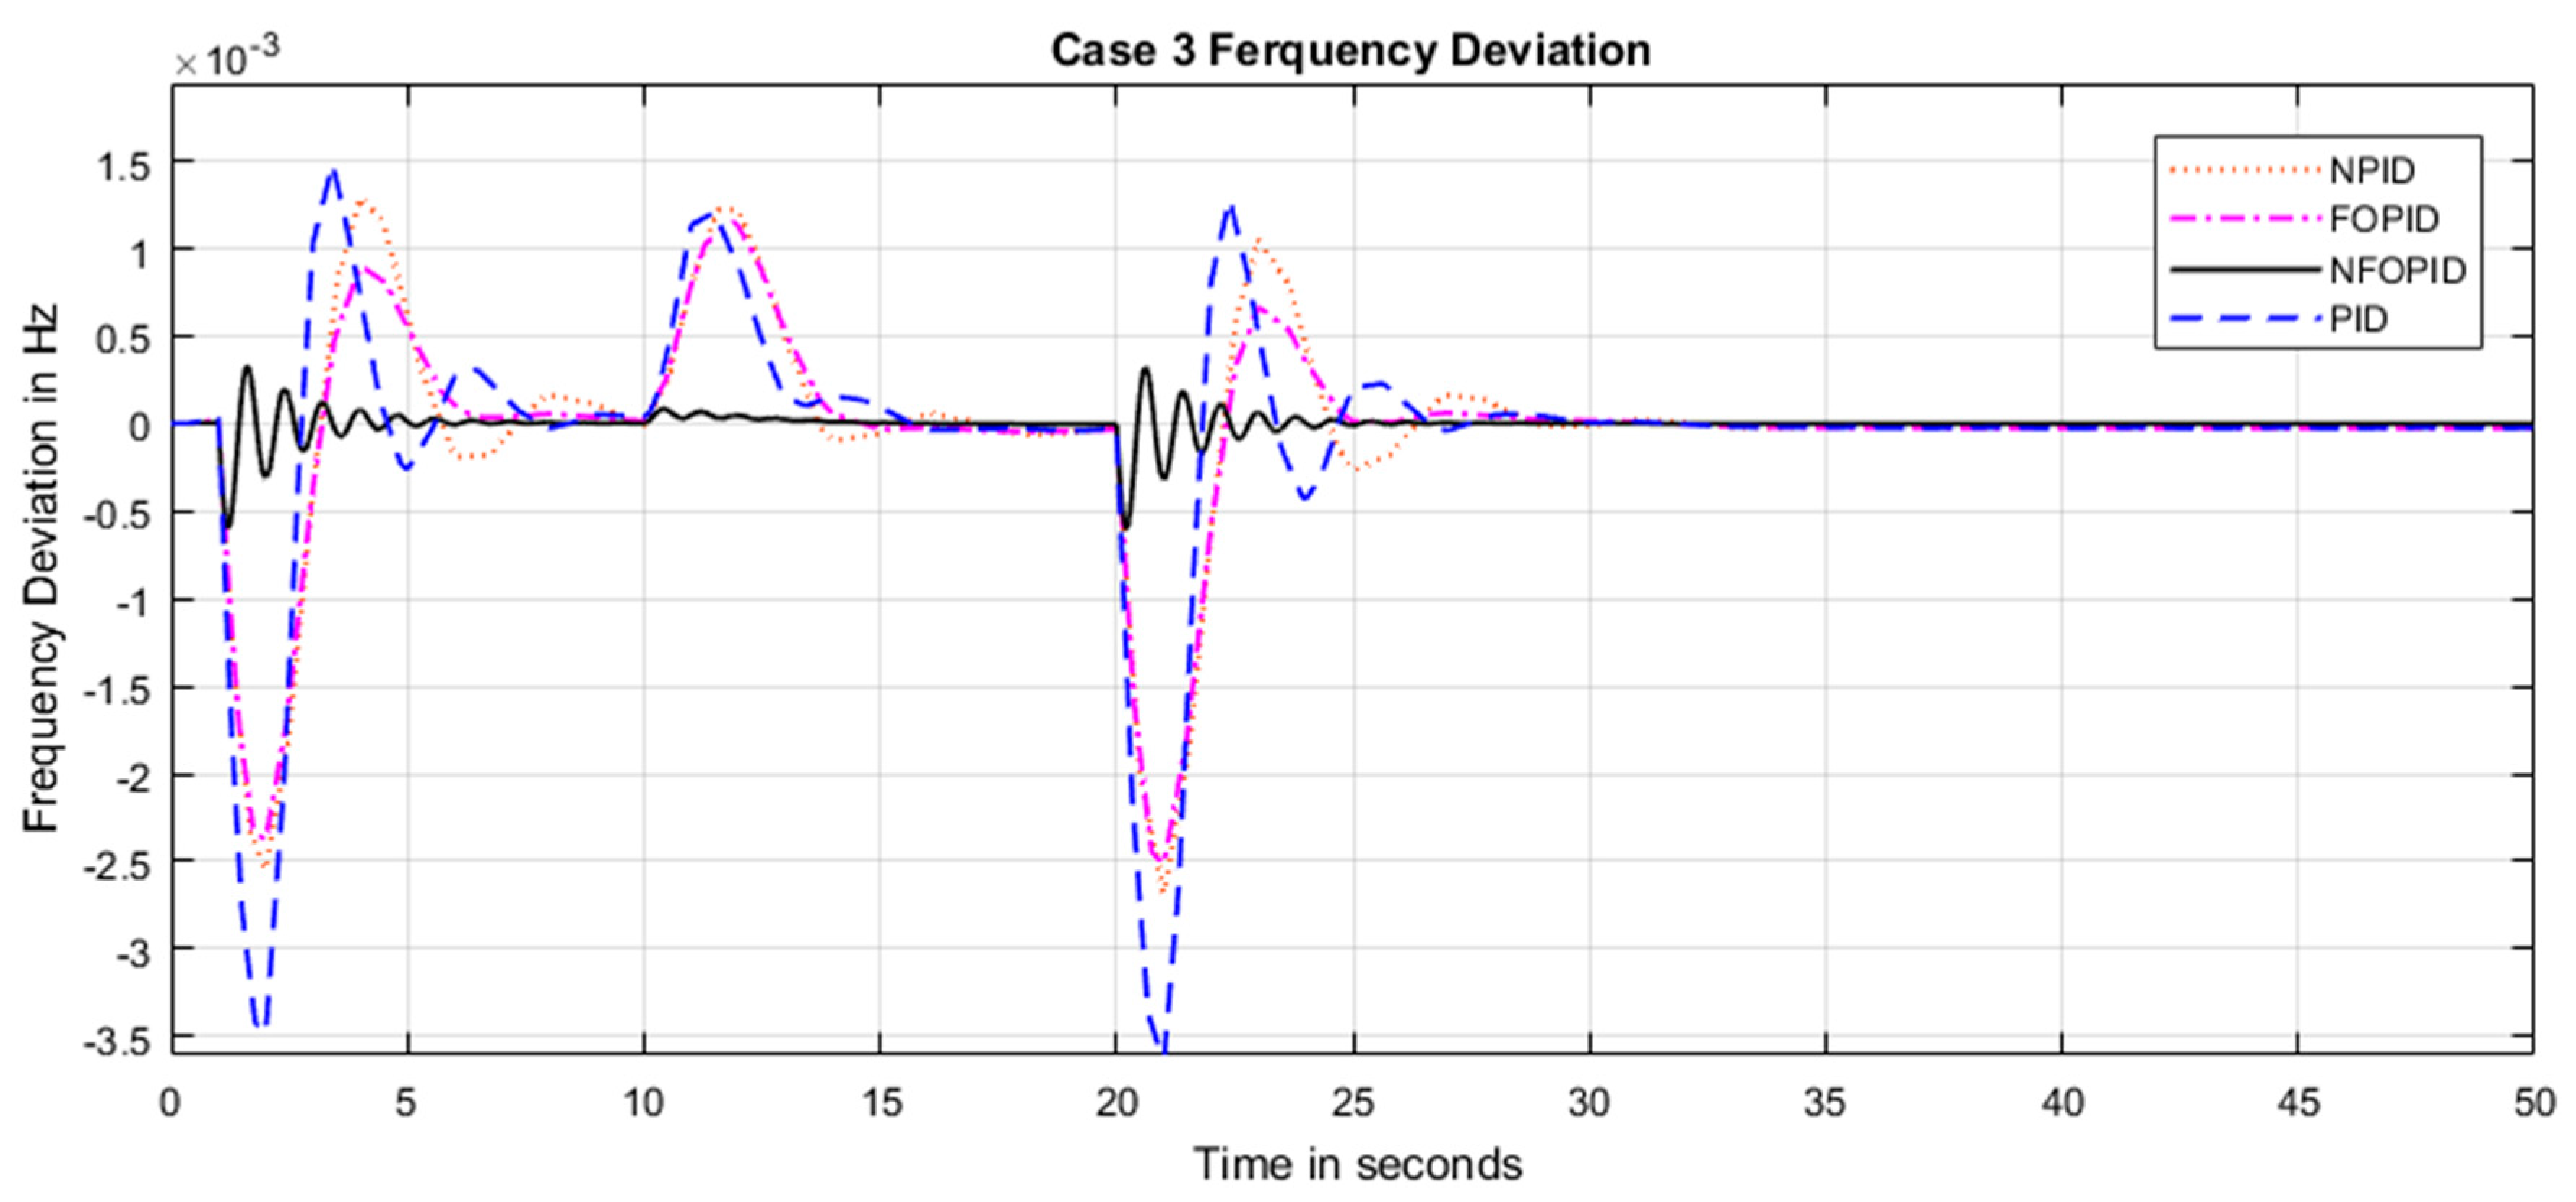
Case 3: parameter variation
In this case, the inertia was assumed to be 20% higher, and the same conditions of case 2 were repeated. The results in
Figure 15 show that NFOPID is the most robust controller followed by FOPID. NPID is more robust than PID.
Case 4: results of comparison between methods of NFOPID self-tuning:
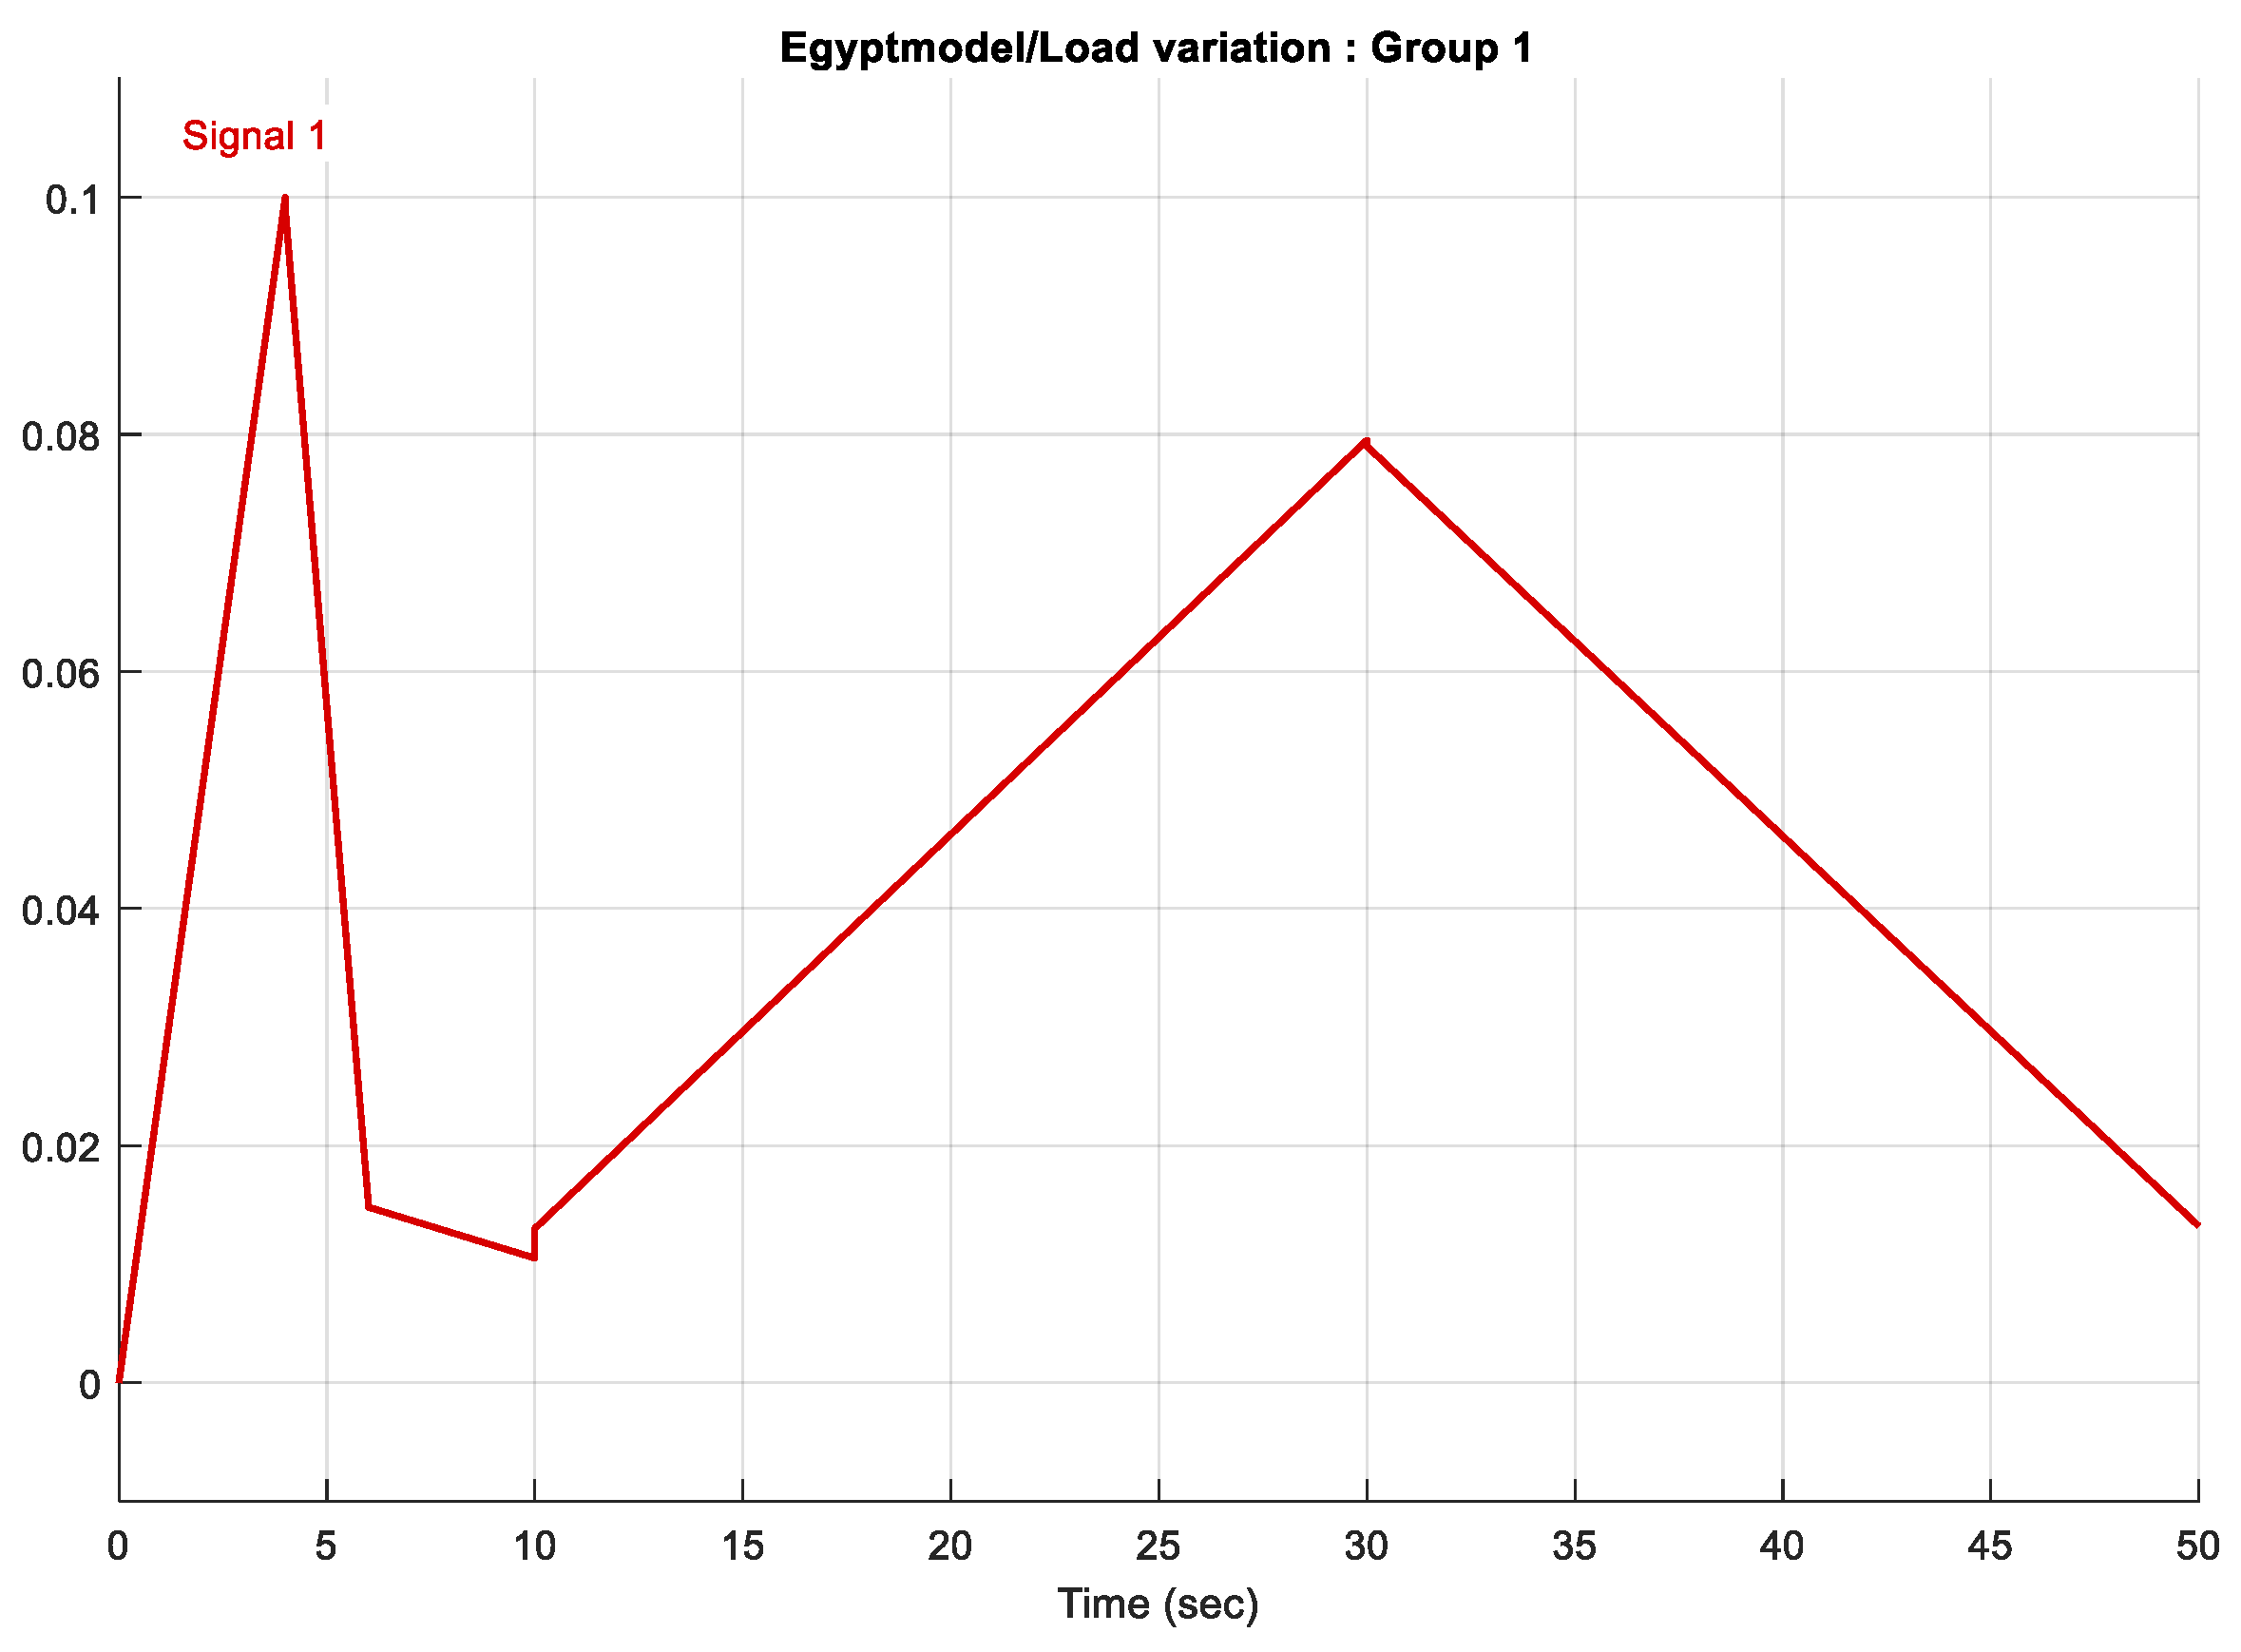
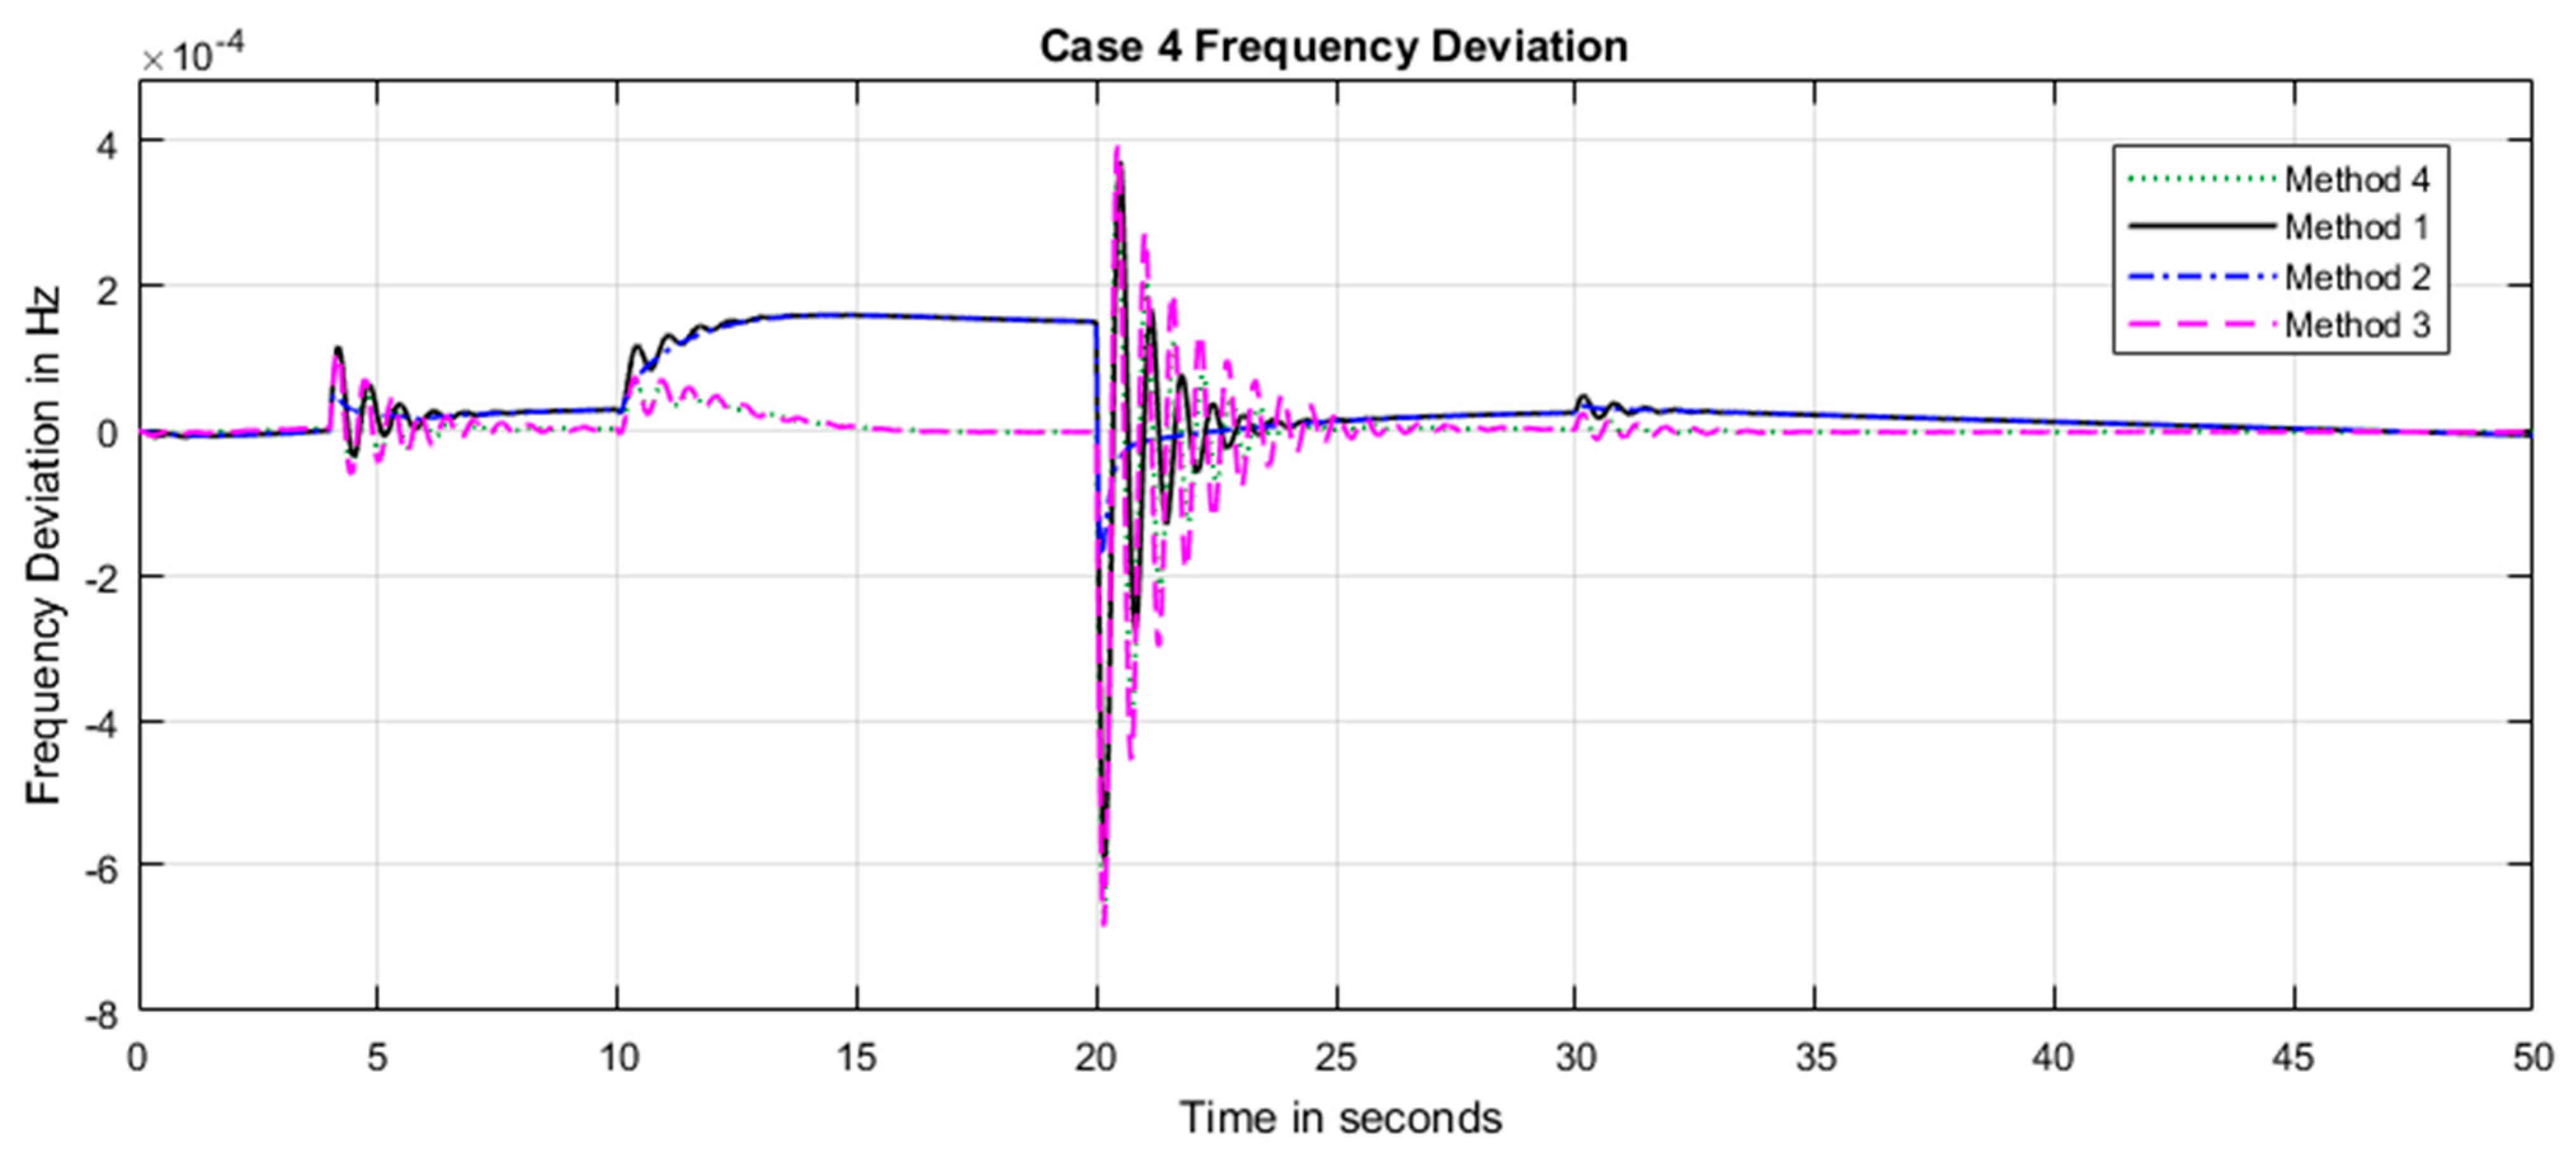
From the results of the previous study cases, NFOPID has the best performance in comparison with the other controllers. In this study, we repeated case 2 again but also considering the load change, as shown in
Figure 16. The results in
Figure 17 show that method 3 and method 4 for tuning the NFOPID controller are better than methods 1 and 2.
Table 5 shows a comparison between methods of self-tunning of NFOPID which confirms that changing all the NFOPID parameters or changing only
G, λ and µ will lead to the same result in terms of ITAE and IAE, which behave better than the other alternatives for changing the parameters.
7. Discussion
This study presented a simple model of the Egyptian power system to study the effect of both demand variation and new renewable energy variations on the frequency of the system. The wind and the photovoltaic farms were modeled as first-order systems following previous studies ([
12,
19,
20,
21]). The outputs of both photovoltaic and wind energy models were compared to typical day data in the Zaafarana area in Egypt. The root mean square error (RMSE) [
33] was calculated for both models and was found to be 0.884 for the wind model and 0.746 for the PV model, values which are acceptable to be used in this study.
A centralized control scheme was assumed in this study to control the frequency of the Egyptian power system. Four optimization techniques are described in
Section 6.1 to design the central PID frequency controller, namely, tunicate swarm, TLBO, PSO and GA. The results show that tunicate swarm achieved a lower ITAE by 17% and IAE by 42% than those of TLBO which was better in performance than PSO and GA.
Four control schemes were proposed and compared to be used as a centralized frequency controller in the Egyptian power system, namely, novel NFOPID, FOPID, NPID and PID control schemes. The tunicate swarm optimization technique was used to design each of these control schemes to face a 10% increase in demand in addition to wind integration and outage. The results show that the NFOPID control scheme achieved a lower ITAE by 61% and a lower IAE by 33% than the FOPID control scheme, which has better performance than the NPID and PID control schemes. Additionally, the same scenario was applied considering a 20% increase in power system parameters as a robustness test for the four control schemes, where the results show that the NFOPID control scheme has better performance than the FOPID, NPID and PID control schemes.
Since NFOPID has the best performance over the other compared control schemes. NFOPID optimal control parameters should be set according to the values of radiation, wind speed and demand. A neural network with radiation, wind speed and demand as inputs and the parameters of the NFOPID controller as outputs was used for this mission. Four design methods were compared in this research, and the results show that the selection of the optimal G, λ and µ, while keeping the rest of the parameters constant, and the selection of the optimal G, , , , λ and µ achieved the same performance in terms of the ITAE and IAE. These are better than the selection of the optimal , and , while the rest of the parameters stay constant, and the selection of the optimal G, while keeping the rest of the parameters constant, by 88% for the ITAE and 71% for the IAE.
To practically apply this study, the central NFOPID control scheme should be operated in the national control center of the Egyptian power system, which is located in the Embaba region, Giza. The demand is already measured there and will be used as an input, while radiation and wind speed data will be imported from weather stations of Aswan Governorate (for the PV power plants) and the Zaafarana area (for the wind farms) to optimally select the parameters of the NFOPID controller using the neural network, which should first be trained on yearly data.
In the future, the renewable energy systems in the Egyptian grid should take part in the frequency support in addition to future storage facilities that will be installed in Egypt. In this direction, frequency forecasting may be used to manage the control of renewables and energy storage systems as in [
34].
8. Conclusions
This paper presented a comparison between different control schemes and optimization techniques to control the Egyptian grid frequency. The results prove that the novel tunicate swarm algorithm has better performance than other optimization techniques in terms of the ITAE, IAE, number of iterations and frequency deviation response. The results also show that NFOPID is more robust than FOPID, while FOPID is more robust than NPID, and NPID is more robust than PID. The results also show that NFOPID deals with the renewable integration and outage better than FOPID, which also deals with these better than NPID. The results also show that the best way to self-tune NFOPID is either by changing the six parameters or by changing only G, λ and µ in terms of the ITAE and IAE. In this study, it was assumed that the photovoltaic and wind power stations do not contribute to the frequency regulation, and their participation will be studied in future research considering the Egyptian grid codes for integrating renewable energies.
Author Contributions
Conceptualization, H.H.F.; methodology, H.H.F.; software, H.H.F.; validation, H.H.F.; formal analysis, H.H.F.; investigation, H.H.F.; resources, H.H.F.; data curation, H.H.F.; writing—original draft preparation, H.H.F. and P.K.; writing—review and editing, P.K.; visualization, P.K. All authors have read and agreed to the published version of the manuscript.
Funding
This research received no external funding.
Institutional Review Board Statement
Not the case, this study does not involve humans or animals.
Informed Consent Statement
Not the case, this study does not involve humans or animals.
Data Availability Statement
No other data available except that mentioned inside the paper.
Conflicts of Interest
The authors declare no conflict of interest.
References
- Surbhi, P.; Kansal, R. Load frequency control of multi area system using integral fuzzy controller. Int. J. Eng. Res. Appl. 2015, 5, 59–64. [Google Scholar]
- Jonglak, P.; Ngamroo, I. Simultaneous control of frequency fluctuation and battery SOC in a smart grid using LFC and EV controllers based on optimal MIMO-MPC. J. Electr. Eng. Technol. 2017, 12, 601–611. [Google Scholar]
- Gaber, M.; Mohamed, E.A.; Shabib, G.; Elbaset, A.A.; Mitani, Y. SMES based a new PID controller for frequency stability of a real hybrid power system considering high wind power penetration. IET Renew. Power Gener. 2018, 12, 1304–1313. [Google Scholar]
- Magdy, G.; Shabib, G.; Elbaset, A.; Kerdphol, T.; Qudaih, Y.; Mitani, Y. Decentralized optimal LFC for a real hybrid power system considering renewable energy sources. J. Eng. Sci. Technol. 2019, 14, 682–697. [Google Scholar]
- Bernard, M.Z.; Garasi, P.; Qudaih, Y.; Mitani, Y.; Mohammed, T. Smoothing Output Fluctuations of Wind Turbines and Enhancing Power System Frequency Using Coefficient Diagram Method. Int. J. Eng. Sci. Appl. 2016, 1, 85–97. [Google Scholar]
- Ghany, M.A.A.; Ghany, A.M.A.; Bensenouci, A.; Bensenouci, M.A. Fractional-Order Fuzzy PID for the Egyptian Load Frequency Control. In Proceedings of the 2016 Eighteenth International Middle East Power Systems Conference (MEPCON), Cairo, Egypt, 27–29 December 2016; pp. 954–961. [Google Scholar]
- Fayek, H.H.; Ghany, A.M.A. Load Frequency Control of a Hybrid Power System Using Frational Order PIΛDM Controller. In Proceedings of the 2014 Sixteenth International Middle East Power Systems Conference (MEPCON), Cairo, Egypt, 23–25 December 2014. [Google Scholar]
- Fayek, H.H. Load Frequency Control of a Power System with 100% Renewables. In Proceedings of the 2019 54th International Universities Power Engineering Conference (UPEC), Bucharest, Romania, 3–6 September 2019; pp. 1–6. [Google Scholar]
- Yousef, H. Adaptive fuzzy logic load frequency control of multi-area power system. Int. J. Electr. Power Energy Syst. 2015, 68, 384–395. [Google Scholar] [CrossRef]
- Kunya, A.B.; Argin, M. Model predictive load frequency control of multi-area interconnected power system. In Proceedings of the 2018 Texas Power, and Energy Conference (TPEC), College Station, TX, USA, 8–9 February 2018; pp. 1–6. [Google Scholar]
- Shamseldin, M.A.; EL-Samahy, A.A.E.; Ghany, A.M.A. Different techniques of self-tuning FOPID control for Brushless DC Motor. In Proceedings of the 2016 Eighteenth International Middle East Power Systems Conference (MEPCON), Cairo, Egypt, 27–29 December 2016; pp. 342–347. [Google Scholar]
- Fayek, H.H. 5G Poor and Rich Novel Control Scheme Based Load Frequency Regulation of a Two-Area System with 100% Renewables in Africa. Fractal Fract. 2020, 5, 2. [Google Scholar] [CrossRef]
- Fayek, H.H.; Mohammadi-Ivatloo, B. Tidal Supplementary Control Schemes-Based Load Frequency Regulation of a Fully Sustainable Marine Microgrid. Inventions 2020, 5, 53. [Google Scholar] [CrossRef]
- Ghoshal, S.P. Optimizations of PID gains by particle swarm optimizations in fuzzy based automatic generation control. Electr. Power Syst. Res. 2004, 72, 203–212. [Google Scholar] [CrossRef]
- Das, D.C.; Roy, A.K.; Sinha, N. GA based frequency controller for solar thermal–diesel–wind hybrid energy generation/energy storage system. Int. J. Electr. Power Energy Syst. 2012, 43, 262–279. [Google Scholar] [CrossRef]
- Rao, R.V.; Savsani, V.J.; Vakharia, D.P. Teaching-learning-based optimization: A novel method for constrained mechanical design optimization problems. Comput. Des. 2011, 43, 303–315. [Google Scholar] [CrossRef]
- Kaur, S.; Awasthi, L.K.; Sangal, A.L.; Dhiman, G. Tunicate Swarm Algorithm: A new bio-inspired based metaheuristic paradigm for global optimization. Eng. Appl. Artif. Intell. 2020, 90, 103541. [Google Scholar] [CrossRef]
- Magdy, G.; Bakeer, A.; Shabib, G.; Elbaset, A.A.; Mitani, Y. Decentralized model predictive control strategy of a realistic multi power system automatic generation control. In Proceedings of the 19th International Middle East Power Systems Conference (MEPCON), Cairo, Egypt, 19–21 December 2017; pp. 190–196. [Google Scholar]
- Abdalla, O.H.; Fayek, H.H.; Ghany, A.M.A. Steady-State and Transient Performances of the Egyptian Grid with Benban Photovoltaic Park. In Proceedings of the Future of Elevtricity Grids: Challenges and Opportunities, Cigre, Egypt, 6–8 March 2019. [Google Scholar]
- Fayek, H.H.; Shenouda, A. Design and Frequency Control of Small Scale Photovoltaic Hydro Pumped Storage System. In Proceedings of the 2019 IEEE 2nd International Conference on Renewable Energy and Power Engineering (REPE), Toronto, ON, Canada, 2–4 November 2019; pp. 32–37. [Google Scholar]
- Lee, D.; Wang, L. Small-Signal Stability Analysis of an Autonomous Hybrid Renewable Energy Power Generation/Energy Storage System Part I: Time-Domain Simulations. IEEE Trans. Energy Conver. 2008, 23, 311–320. [Google Scholar] [CrossRef]
- Shah, P.; Agashe, S. Review of fractional PID controller. Mechatronics 2016, 38, 29–41. [Google Scholar] [CrossRef]
- Ausloos, M.; Dirickx, M. The Logistic Map and the Route to Chaos; Springer: Berlin, Germany, 2006. [Google Scholar]
- Oustaloup, A.; Levron, F.; Mathieu, B.; Nanot, F.M. Frequency-band complex noninteger differentiator: Characterization and synthesis. IEEE Trans. Circuits Syst. I Fundam. Theory Appl. 2000, 47, 25–39. [Google Scholar] [CrossRef]
- Micev, M.; Ćalasan, M.; Oliva, D. Fractional Order PID Controller Design for an AVR System Using Chaotic Yellow Saddle Goatfish Algorithm. Mathematics 2020, 8, 1182. [Google Scholar] [CrossRef]
- Fayek, H.H. Robust Controllers Design of Hybrid System Load Frequency Control. Master’s Thesis, Helwan University, Helwan, Egypt, 2014. [Google Scholar]
- Rashad, S.A.; Sallam, M.; Bassiuny, A.M.; Abdelghany, A.M. Control of Master-Slave System Using Optimal NPID and FOPID. In Proceedings of the 2019 IEEE 28th International Symposium on Industrial Electronics (ISIE), Vancouver, BC, Canada, 12–14 June 2019; pp. 485–490. [Google Scholar]
- Pahadasingh, S.; Jena, C.; Panigrahi, C.K. Load Frequency Control Incorporating Electric Vehicles Using FOPID Controller with HVDC Link. In Innovation in Electrical Power Engineering, Communication, and Computing Technology. Lecture Notes in Electrical Engineering; Sharma, R., Mishra, M., Nayak, J., Naik, B., Pelusi, D., Eds.; Springer: Singapore, 2020; Volume 630. [Google Scholar] [CrossRef]
- Mehra, V.; Srivastava, S.; Varshney, P. Fractional-Order PID Controller Design for Speed Control of DC Motor. In Proceedings of the 2010 3rd International Conference on Emerging Trends in Engineering and Technology, Goa, India, 19–21 November 2010; pp. 422–425. [Google Scholar] [CrossRef]
- Jeba, P.; Selvakumar, A.I. FOPID based MPPT for photovoltaic system. Energy Sources Part A Recover. Util. Environ. Eff. 2018, 40, 1591–1603. [Google Scholar] [CrossRef]
- Fayek, H.H. Voltage and Reactive Power Control of Smart Grid. Ph.D. Thesis, Helwan University, Helwan, Egypt, February 2019. [Google Scholar]
- Abdalla, O.H.; Fayek, H.H.; Ghany, A.M.A. Secondary Voltage Control Application in a Smart Grid with 100% Renewables. Inventions 2020, 5, 37. [Google Scholar] [CrossRef]
- Probst, O.; Minchala, L.I. Mitigation of Short-Term Wind Power Ramps through Forecast-Based Curtailment. Appl. Sci. 2021, 11, 4371. [Google Scholar] [CrossRef]
- Kaufmann, C.; Yáñez, C.C.; Pangalos, G. Fast Power System Frequency Estimation by Shape Class Approximation for Synthetic Inertia Provision by Battery Energy Storage Systems. In Proceedings of the 2020 IEEE 11th International Symposium on Power Electronics for Distributed Generation Systems (PEDG), Dubrovnik, Croatia, 28 September–1 October 2020; pp. 309–314. [Google Scholar] [CrossRef]
Figure 1.
Egyptian power system.
Figure 1.
Egyptian power system.
Figure 2.
SIMULINK model of Egyptian grid for frequency stability and control studies.
Figure 2.
SIMULINK model of Egyptian grid for frequency stability and control studies.
Figure 3.
FOPID controller modes of operation.
Figure 3.
FOPID controller modes of operation.
Figure 4.
NFOPID controller configuration and modes of operation.
Figure 4.
NFOPID controller configuration and modes of operation.
Figure 5.
Avoiding the conflict between other tunicates.
Figure 5.
Avoiding the conflict between other tunicates.
Figure 6.
Movement towards the position of the search.
Figure 6.
Movement towards the position of the search.
Figure 7.
Remaining close to the best search agent.
Figure 7.
Remaining close to the best search agent.
Figure 8.
Tunicate swarm algorithm flow chart (based on [
17]).
Figure 8.
Tunicate swarm algorithm flow chart (based on [
17]).
Figure 9.
Neural network for self-tuning of NFOPID controller.
Figure 9.
Neural network for self-tuning of NFOPID controller.
Figure 10.
Comparison between different optimization techniques.
Figure 10.
Comparison between different optimization techniques.
Figure 11.
Radiation in case 1.
Figure 11.
Radiation in case 1.
Figure 12.
Wind power in case 1.
Figure 12.
Wind power in case 1.
Figure 13.
Change in frequency responses at case 1.
Figure 13.
Change in frequency responses at case 1.
Figure 14.
Change in frequency responses at case 2.
Figure 14.
Change in frequency responses at case 2.
Figure 15.
Change in frequency responses at case 3.
Figure 15.
Change in frequency responses at case 3.
Figure 16.
Change in load at case 4.
Figure 16.
Change in load at case 4.
Figure 17.
Change in frequency responses at case 4.
Figure 17.
Change in frequency responses at case 4.
Table 1.
Renewable energy system parameter values [
20,
21].
Table 1.
Renewable energy system parameter values [
20,
21].
| Parameter | Value |
|---|
| [s] | 1.8 |
| 1 |
| [s] | 0.8 |
Table 2.
Egyptian grid parameters of conventional stations.
Table 2.
Egyptian grid parameters of conventional stations.
| Parameter | Value |
|---|
| Dashpot time constant of hydro plant speed governor, (s) | 5 |
| Time constant of reheat thermal plant, (s) | 6 |
| Water starting time in hydro intake, (s) | 1 |
| Valve time constant of non-reheat plant, (s) | 0.4 |
| Steam valve time constant of reheat plant, (s) | 0.4 |
| Water valve time constant of hydro plant, (s) | 90 |
| Fraction of turbine power (intermediate pressure section), m | 0.5 |
| Governor speed regulation of non-reheat plant, (Hz/pu MW) | 2.5 |
| Governor speed regulation of reheat plant, (Hz/pu MW) | 2.5 |
| Governor speed regulation of hydro plant, (Hz/pu MW) | 1 |
| Equivalent inertia constant, (pu s) | 5.7096 |
| System damping coefficient of the area, D (pu MW/Hz) | 0.028 |
| Nominal rated power output for non-reheat plant, (MW pu) | 0.2529 |
| Nominal rated power output for reheat plant, (MW pu) | 0.6107 |
| Nominal rated power output for hydro plant, (MW pu) | 0.1364 |
Table 3.
Summary of results.
Table 3.
Summary of results.
| Method | ITAE | IAE | ∗ 10−6 | Number of Iterations | |
|---|
| Ush ∗ 10−4 | Osh ∗ 10−4 | ts | tp |
|---|
| Tunicate swarm | 0.0059 | 0.0011 | 0.39 | 15 | −2 | 0.5 | 1.7 | 1.4 |
| TLBO | 0.0071 | 0.0019 | 0.48 | 18 | −4 | 0.7 | 4 | 2 |
| PSO | 0.0085 | 0.0026 | 0.61 | 25 | −4.5 | 1.1 | 5 | 3 |
| GA | 0.0089 | 0.0027 | 0.64 | 23 | −5 | 1.3 | 15 | 5 |
Table 4.
Controller’s parameters, maximum overshoot, minimum undershoot, settling time, ITAE and IAE at case 1.
Table 4.
Controller’s parameters, maximum overshoot, minimum undershoot, settling time, ITAE and IAE at case 1.
| Controller | Parameters | Maximum Overshoot | Minimum
Undershoot | Settling Time (s) | ITAE | IAE |
|---|
| PID | KP = 1.8
KI = 1.12
KD = 0.89 | 0.0017 | −0.0033 | 8 | 0.049 | 0.0061 |
| NPID | KP = 1.7
KI = 1.3
KD = 0.45
G = 0.0051 | 0.0016 | −0.0030 | 7 | 0.0364 | 0.0041 |
| FOPID | KP = 1.4
KI = 0.78
KD = 0.09
λ = 0.77
µ = 0.92 | 0.0008 | −0.028 | 7 | 0.0241 | 0.0039 |
| NFOPID | KP = 1.4
KI = 0.78
KD = 0.09
λ = 0.77
µ = 0.92
G = 0.071 | 0.00017 | −0.0005 | 4 | 0.0095 | 0.0026 |
Table 5.
Comparison between self-tuning methods.
Table 5.
Comparison between self-tuning methods.
| Method ID | ITAE | IAE |
|---|
| 1 | 0.00057 | 0.00008 |
| 2 | 0.00049 | 0.00007 |
| 3 | 0.00006 | 0.00002 |
| 4 | 0.00006 | 0.00002 |
| Publisher’s Note: MDPI stays neutral with regard to jurisdictional claims in published maps and institutional affiliations. |
© 2021 by the authors. Licensee MDPI, Basel, Switzerland. This article is an open access article distributed under the terms and conditions of the Creative Commons Attribution (CC BY) license (https://creativecommons.org/licenses/by/4.0/).
