1. Introduction
The Food and Agriculture Organization (FAO) of the United Nations states that around 33% of the sustenance delivered worldwide for human consumption is being wasted, representing circa 1.3 billion tons of resources [
1]. This is estimated at almost USD 680 billion in industrialized nations and USD 310 billion in developing nations [
1]. Food loss is characterized as a decline in the amount or nature of food [
1]. Food waste is any food, and inedible parts of food, removed from the food supply chain to be recovered or disposed. There are many factors that can lead to food waste along perishable products chain. There are various types of loss concerning fruits and vegetables, which include mechanical damage or spillage during harvest operations, the degradation that occurs during handling, storage and transportation, waste in the market system as well as waste during consumption [
2].
Many products are distributed cold, as they are temperature-sensitive: a reliable cold chain is required to maintain the quality and safety of storage, handling and transport. Around 360 million tons of food are lost on a yearly basis worldwide due to poor refrigeration. Temperature is among the most relevant factor affecting the shelf life of fresh products such as fruits and vegetables, with consequences in the form of biological and physiological changes that compromise product quality [
3]. The most important factors that influence the levels of microorganisms in foods are the temperature in the cold chain, including domestic refrigerators, and the time period for which the food products are stored at this temperature [
4]. Harvested horticultural products are living tissues with continuing metabolism after harvest. They are subject to respiration, water loss and cell softening throughout the postharvest system. The respiration that occurs once the fruits and vegetables are harvested is the main cause of their deterioration [
5]. This process can be delayed if correct measures are applied, with proper postharvest and transportation chain temperatures [
6]. Temperature should be as constant as possible until product consumption. In the last few years, there has been considerably increased interest in studying the storage requirements for fresh fruits and vegetables. This is mainly due to variations in production tendencies and marketing. To increase food accessibility, a partial alternative can be provided by improving storage and conservation as a way of reducing postharvest losses and providing better-quality and more nutritious fruits and vegetables to the consumer.
Many factors affect the cooling process of fruits and vegetables, including the ventilation system characteristics, air-to-product final desired temperature difference, air relative humidity, product geometry, packing configuration, product thermal properties and package vent design, including vent size and shape, vent positions and total vent area [
7].
The shape and characteristics of packaging boxes can play a fundamental role in food characteristics’ conservation. Packaging is one of the main processes by which to ensure the quality of food products during transportation, storage and end use. It slows quality decay and makes distribution and marketing more efficient. Choosing a proper material to ensure that the physical properties of the fresh produce are safe from outside damages is essential, but it is also important to make sure that the material’s properties are suitable due to its role in heat and mass exchange with the external atmosphere, contributing to food quality preservation during storage and extending the food’s shelf life.
The fruit cooling rate and uniformity depend on the airflow rate, air temperature and airflow distribution in the packaging box. Such parameters are conditioned by the geometry within the packaging box, the size of the fruits, its shape, the package itself and its configuration [
8,
9].
This paper proposes three new packaging configurations with the same size but differing in geometry and size of ventilation holes, changing the conditions in which the heat and mass exchange occurs, either during the cooling of produce in the cooling chamber or during the period when packaging is exposed to ambient conditions, outside the cooling chamber. The vent holes’ position, shape and size are very important characteristics since they affect the heat and mass transfer during the cooling process [
10]. As fruits and vegetables are highly perishable, the packaging technology plays a critical role in the whole supply chain [
11], which makes this study highly relevant to the mitigation of food waste worldwide as well as the reduction of energy consumption in providing cold-storage fresh produce [
12]. If this study of new packaging configurations reveals that the proper produce conservation temperature can be achieved faster, then resources can be saved while maintaining the properties of produce.
2. Materials and Methods
2.1. Mathematical Formulation
The optimization of fresh fruit packaging design is a necessity, since reducing energy loss and ensuring fruit quality by promoting more uniform cooling is a general concern, necessary to prevent the effects of chilling damages on produce. The performance of packaging relies on each specific case and is determined by several variables and conditions.
Packaging materials increase cooling airflow resistance and block direct contact between cooling air and fresh produce.
The negative effects significantly affect produce’s cooling time and rates. Quantifying the cooling time is particularly important when evaluating the effectiveness of a package design [
13]. The set of equations that allows the performance of each package to be evaluated is presented below [
14,
15].
The produce cooling is evaluated by the temperature ratio,
Y, given by Equation (1), which is the ratio of the unaccomplished temperature change at any time to the maximum temperature change for a particular cooling condition.
where
Y is the dimensionless temperature,
Tp represents the produce temperature,
Ta represents the ambient temperature inside the cold chamber, and
Tpin represents the initial temperature of produce.
The produce temperature is a function of both time and place. Since the core temperature differs from the surface temperature of the produce during the cooling and heating processes, the history of the temperature can be described by the first term of an infinite series since the Fourier number is great enough (as in this case), so, in every point, the log (
T) time diagram lines are parallel and the temperature variation can be seen as exponential [
16,
17]. Therefore, from Equation (1), by performing a regression analysis (an exponential one), Equation (2) is obtained.
where
j is the lag factor and
C is the cooling coefficient. The cooling time is evaluated from the dimensionless cooling curve (
Y(
t)), as in Equation (3), by determining the half-cooling time, which represents the time required to reduce by half the temperature difference between the produce and the cooling air.
It is well established that the total opening area (TOA) and the airflow rate will affect the half-cooling time (
HCT) [
16,
18]. In this experiment, the airflow rate remains constant throughout the 8 h cooling period, while the TOA varies for each package configuration.
The produce heating is evaluated by the temperature ratio as well as in Equation (1), however, the comparison ratio is between the produce temperature and the temperature that this produce is exposed to. Equation (4) represents the temperature ratio for the heating process.
where
Tatm represents the ambient temperature inside the laboratory, where produce will be exposed after the eight hours of cooling.
The half-heating time (
HHT) is obtained from the same method as the half-cooling time, by performing the regression analysis from Equation (4) and obtaining an exponential equation similar to the one in Equation (2). Finally, the half heating time can be calculated with Equation (5).
Sensors placed at different positions inside the package were used to verify the temperature heterogeneity in each package. Temperature differences between sensors were compared to verify if the cooled air that reaches the produce inside the packages allows an equal cooling rate for all the fruits.
2.2. Experimental Setup
In this paper, a study of 3 packages with fruit models that replicate the properties of real fruits was performed. These three new packages were selected from prior numerical studies [
19,
20].
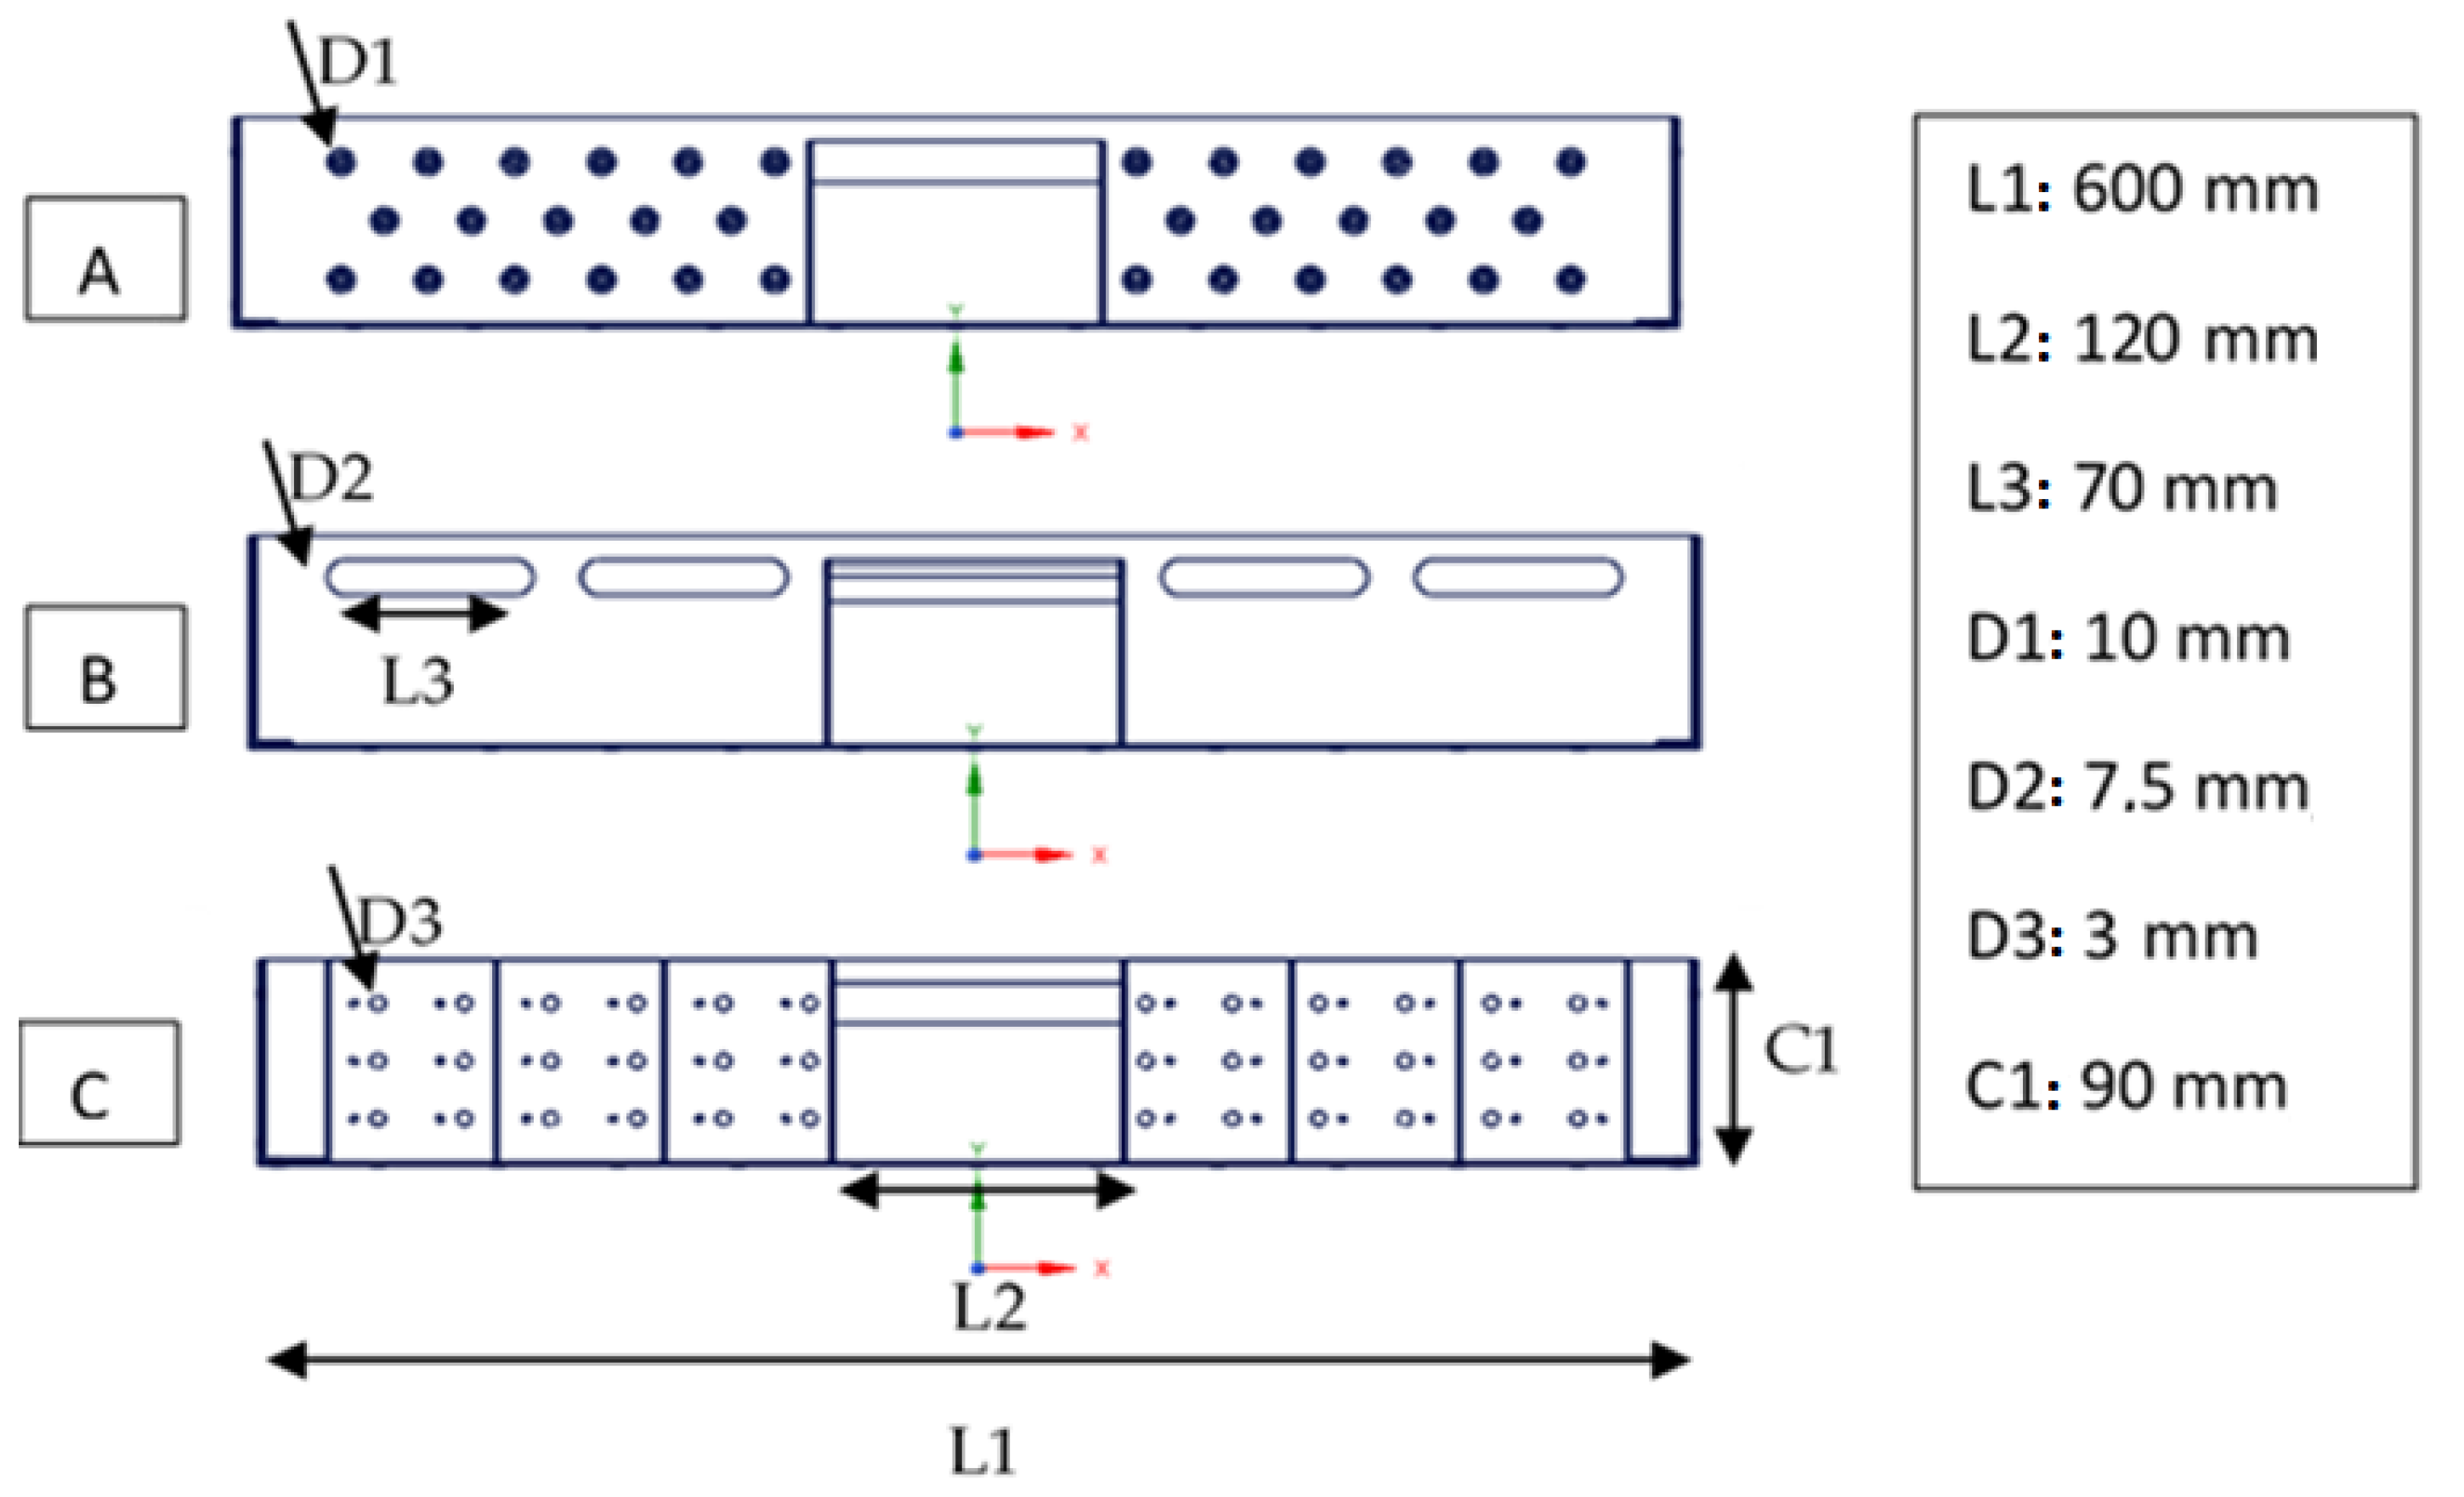
The selected packages are represented by a computational image in
Figure 1. This shows all the different configurations used in the experiment and their dimensions. All the packages have the same external size, and the material of the structure is polypropylene. The differences among packages are the vent holes’ dimensions and format. The handles of the packages are equal for all packages, in terms of dimensions and format.
The total open area varies from package to package. In the package A, there are 17 holes with a diameter of 10 mm. The TOA of this package is 2670.4 mm2. Package B has 8 oval-shaped holes, and the TOA is 4244.2 mm2. Lastly, package C has a TOA of 508.9 mm2.
During the experimental tests, the temperature of the artificial fruits at different positions inside the package was monitored through temperature sensors positioned inside the fruit simulators. The thermal conditions were also monitored, both inside and outside the cooling chamber. Additionally, and for comparative purposes, the thermal behavior of commercial packaging was also evaluated for the same operating conditions in the cooling and heating phases.
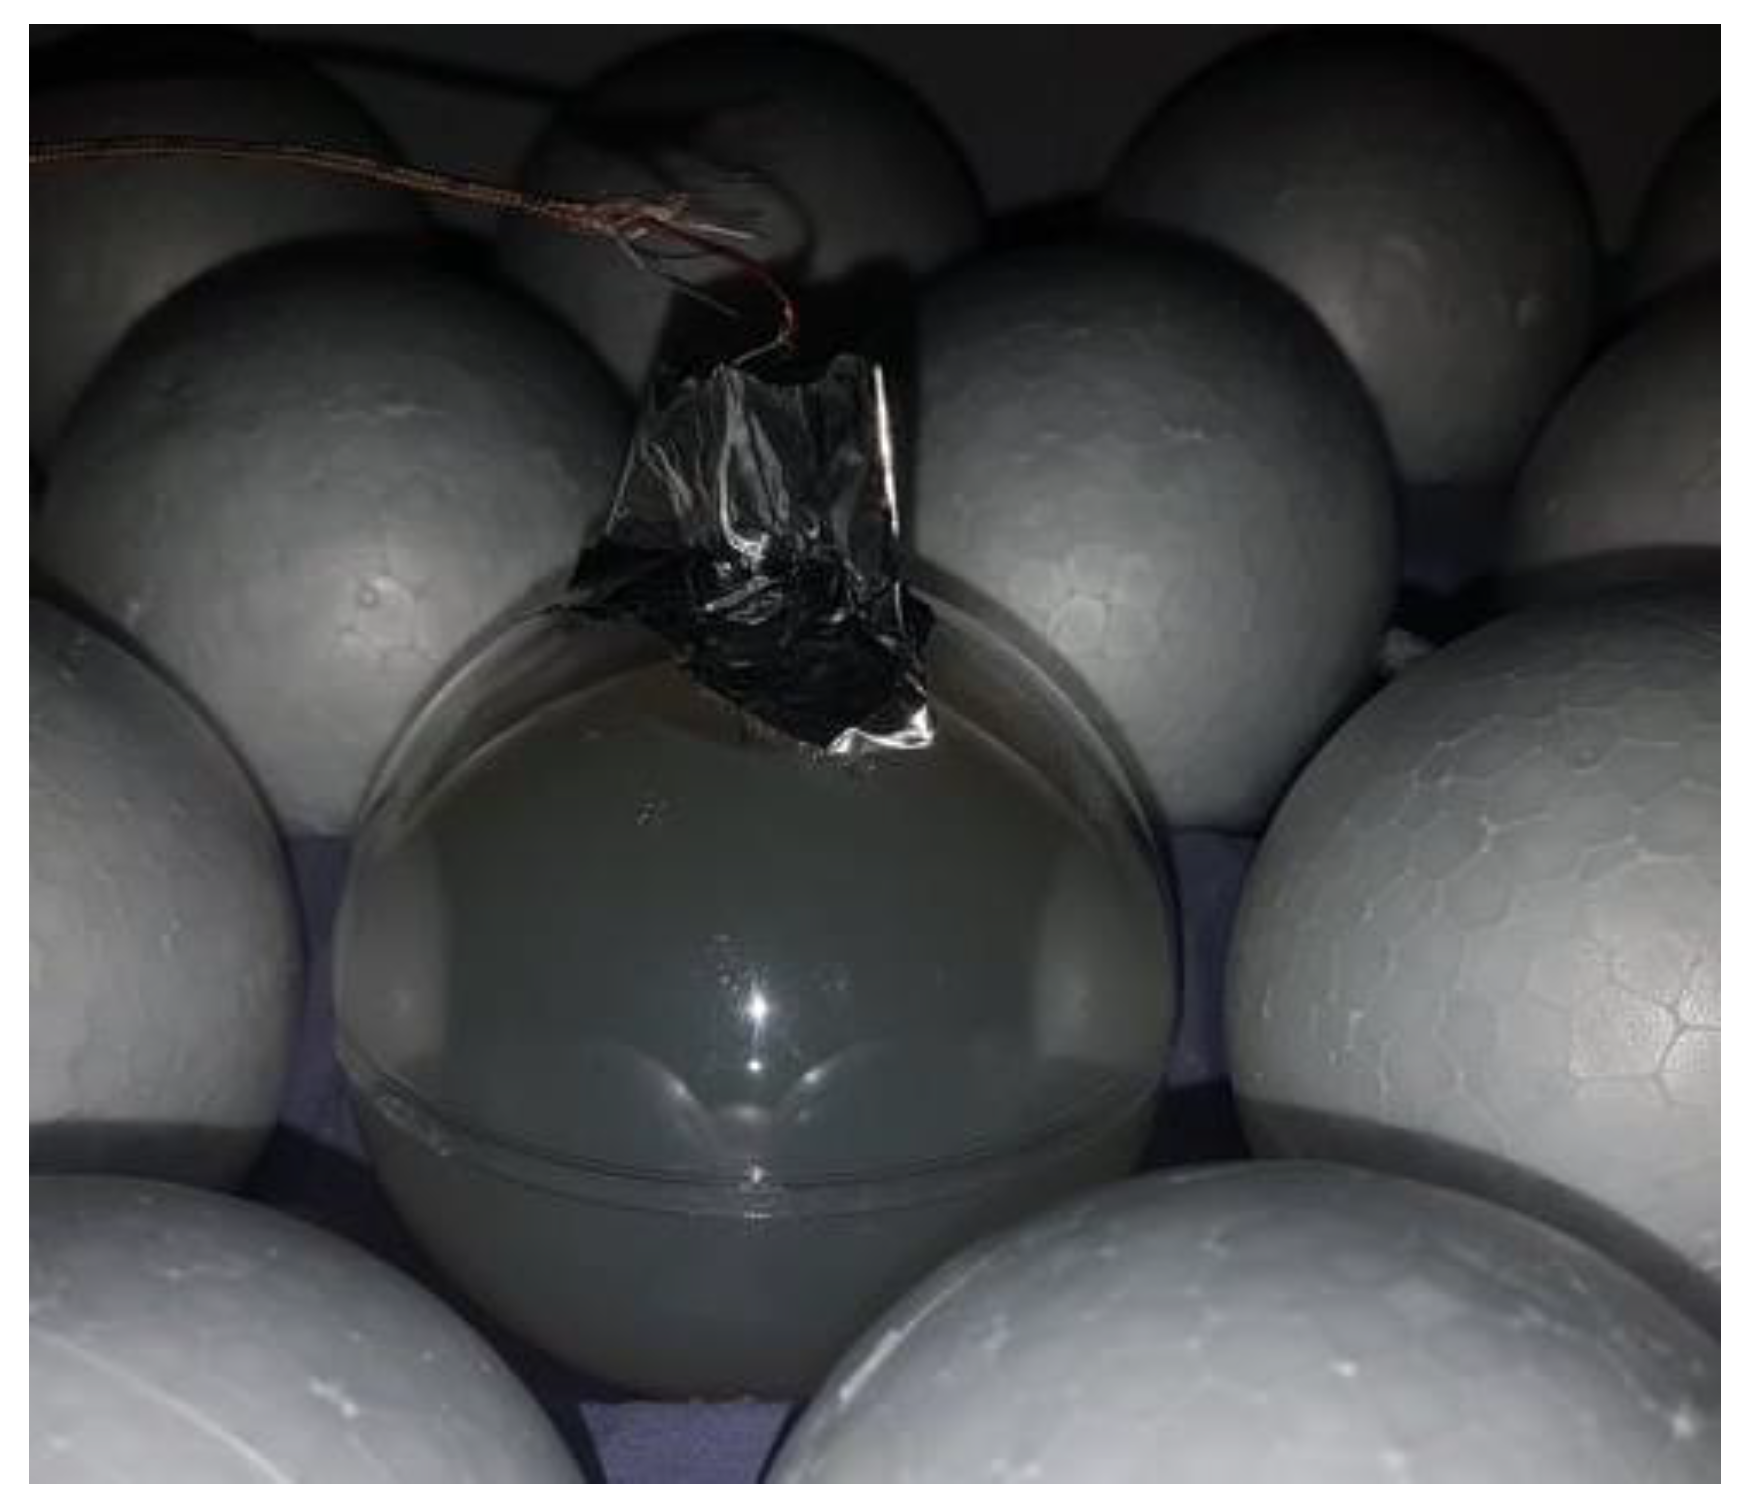
The artificial fruits used in the experiment were made from an agar–water solution with a volumetric concentration of 5% in volume. The solution was heated to its boiling point. Some acrylic balls were filled with this chemical solution and a type T thermocouple was inserted in the center of the ball (
Figure 2). A set of 5 balls to use as artificial peaches was developed.
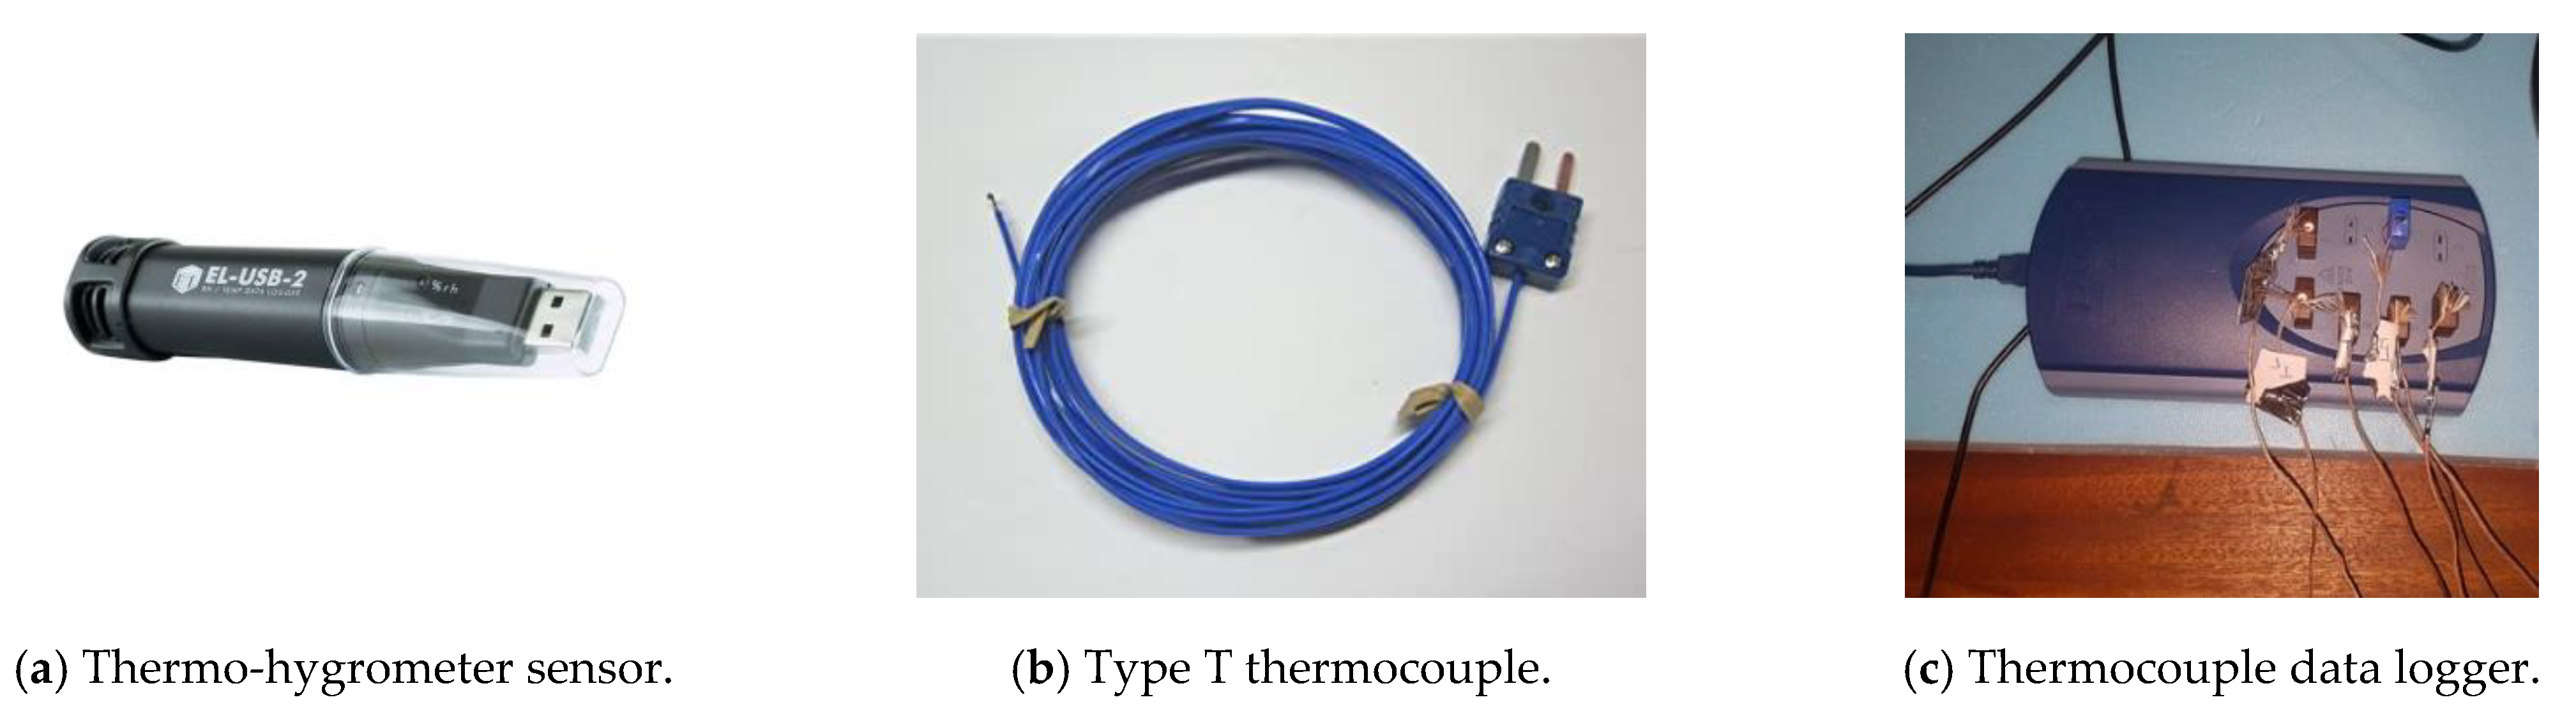
The air temperature and relative humidity were measured by hygrometer sensors, with an accuracy of 0.55 °C for the air temperature and 2.25% for the air relative humidity (
Figure 3a). A type T thermocouple (
Figure 3b) inserted inside the artificial fruits measured their temperatures. Additionally, a type T thermocouple was used to measure the air temperature in the vicinity of the artificial fruits (labeled Air Sensor 6 in
Figure 4). The thermocouples used require a device and a software program to read and allow visual analysis of the results, so a thermocouple data logger was connected to all the thermocouples (
Figure 3c).
In
Figure 4, the exact positions of all the sensors in the different packages are shown.
The technical information about the properties of the materials used in the experiment is shown in
Table 1 together with real fruit properties (peach) for comparison.
To perform the experiment, a cold chamber was used (
Figure 5), where the artificial fruits in the different packages were tested.
A schematic of the experimental setup used to perform the experiment is shown in
Figure 6. This setup was used in previous work [
21]. Besides the cold chamber mentioned before, the components of the refrigeration circuit included a heat exchanger section with an axial fan, a refrigerant pump, a tank with the cooling liquid and a chiller.
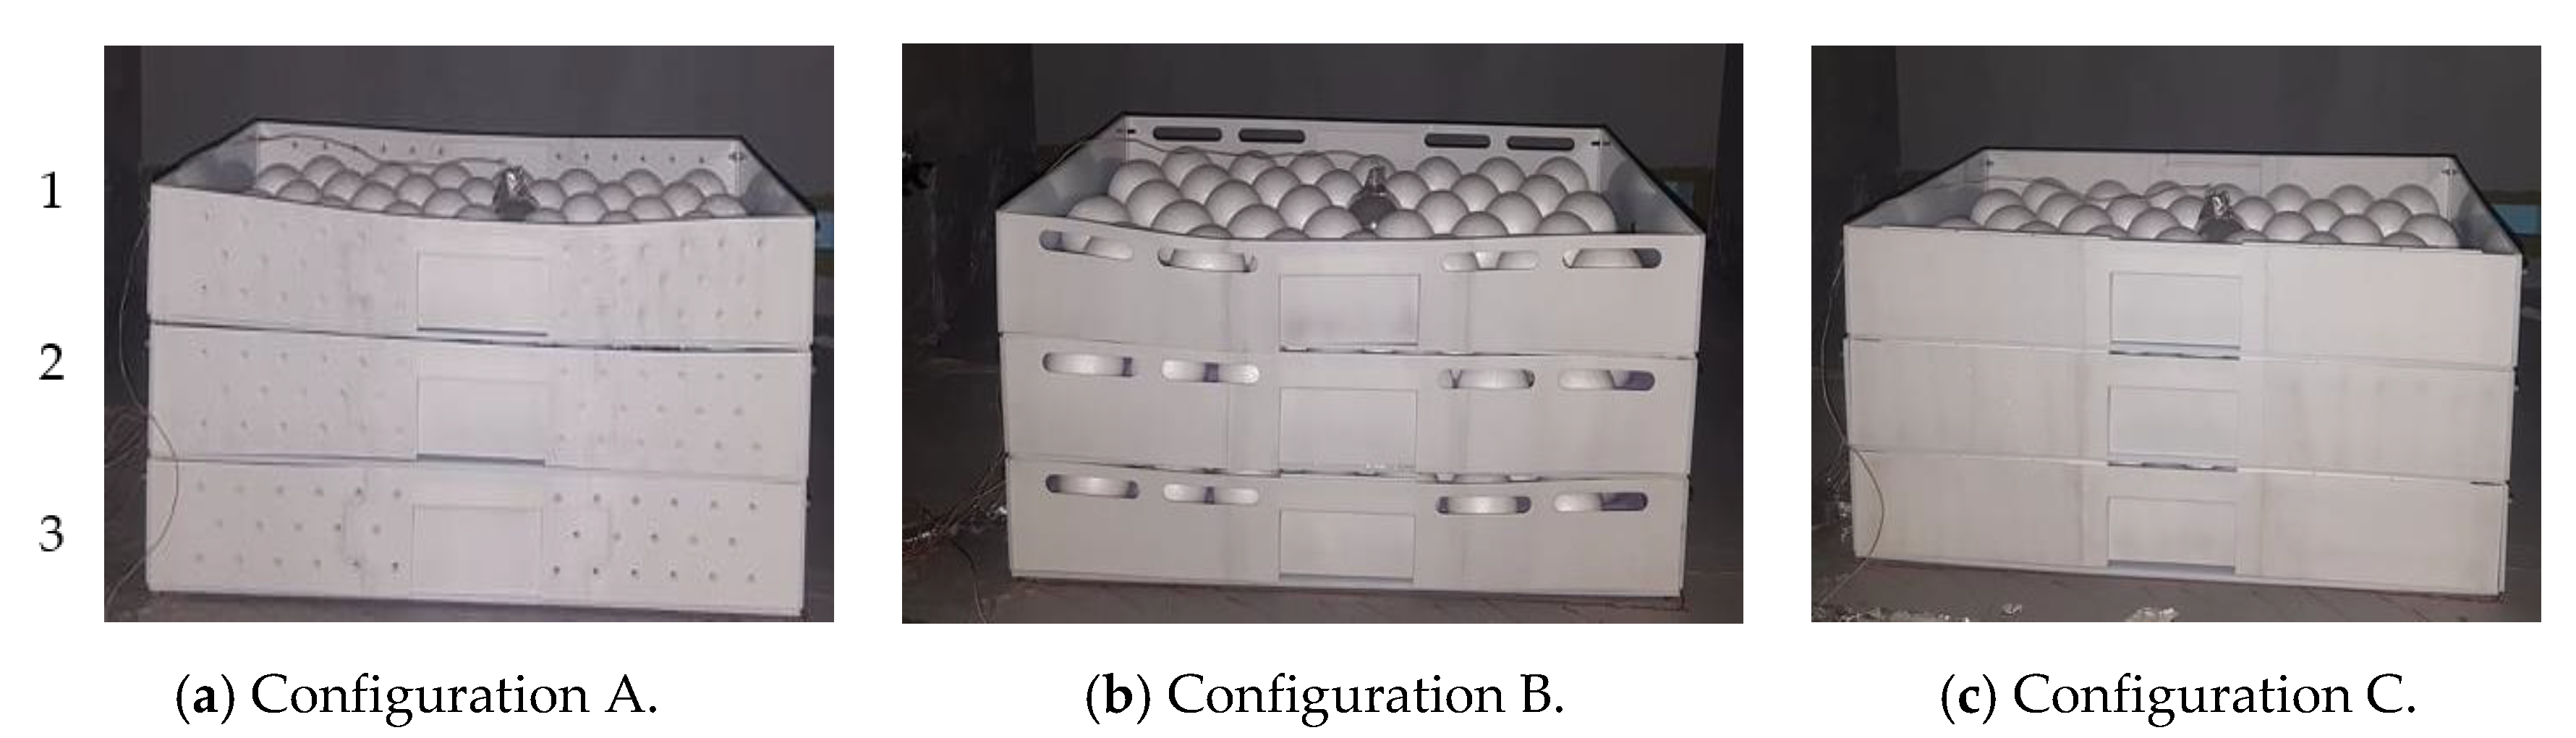
All the packages were tested (
Figure 7a–c). The experiments were performed starting with the package type A, in experiment 1, and the procedures were completed in a similar way for the other packages. Each package was tested for 8 h for cooling purposes and for 10 h for the heating process. For each configuration, three experiments were completed, with the average of the three used for analysis.
3. Results and Discussion
The experiments were carried out using a conventional package as a reference. This package was tested too, and its behavior was analyzed in both the cooling and heating processes. The results are presented for both the cooling and heating processes, starting with the configuration A, B, C, and lastly the reference configuration.
The total open area (TOA) of each package will influence the thermal behavior. It will allow, or not, the heat exchange between the produce inside the packages and the cooled air. The heat exchange behavior in each package will allow the produce to refrigerate faster or slower depending on how the interactions between the cooled air and the produce take place.
All the packages have holes in their structure, varying in position, number and size.
All the temperatures for each configuration were measured for the heating and cooling time.
With the recorded temperatures, the temperature ratio was evaluated for each set of package data. Equations (3) and (4), for either the cooling or heating process, respectively, were used to calculate the half-cooling time and the half-heating time, as shown in
Table 2 for each configuration tested.
The purpose of packaging should be kept in mind to properly analyze the obtained values. In the past few years, packaging and suitable refrigeration conditions have been a major topic of study worldwide. It is known that a package is responsible for properly allowing refrigeration and maintaining the temperature for as long as possible, even when the process of cooling is interrupted for some reason. The decision regarding the best packaging option has to agree with the package that takes the minimum time possible to allow the produce inside it to cool, minimizing the time that the produce is kept at a non-ideal temperature. Another important aspect is the temperature stability when the refrigeration is cut off. An ideal package should keep the internal temperature almost constant for a long period of time. The food chain is built on many important and essential steps, and some of the operations cannot be performed with a cooling source. The package is responsible for maintaining the temperature and reducing damage to the produce caused by temperature variations.
Regarding this experiment, due to the conditions of the cold chamber and its cooling method, the better package to evaluate is the one positioned in the middle. Some conclusions can be obtained by analyzing the half-cooling time for the various packages in package position 2 for the various configurations. The best value is represented by the reference package, followed by package B. The difference between these two packages is small, and, compared to packages A and C, package B presents better results.
It is important to mention that during the tests of package B and the reference package, the ambient temperature of the laboratory was around 3 °C higher when compared to the other tests.
All the temperatures were measured daily in the morning (9:00 a.m.), at mid-day (12:00 a.m.), in the afternoon (17:00 p.m.) and in the evening (19:00 p.m.).
Another important aspect that should be analyzed is the behavior of the temperature throughout the package itself. This study evaluates the time and spatial profile of the cooling of fruits inside a package.
3.1. Configuration B
In this configuration, the TOA is composed of four geometric figures that can be decomposed into four circles with 7.5 mm diameter and four rectangles (7.5 mm × 60 mm). The handle of the package is also an airflow canal.
3.1.1. Cooling Process
Figure 8 shows the thermal behavior of artificial fruits with sensors placed in the middle sections of packages 1 to 3 during the cooling process.
In this configuration, the starting temperature was kept almost constant in all the packages (1 to 3), with some slight variations. After this, the temperature decreased in all of them at a different ratio. Package 1 was completely exposed to the cooled air, allowing the temperature in the Fruit T. 5 sensor to drop faster. The temperature varied from around 23 °C in all the packages (at the beginning of the experiment) to 7.8 °C, in package 1, 9.2 °C in package 2 and 11.5 °C in package 3. Some differences were observed in the temperature values when comparing this configuration with the others, but the behavior was quite similar for the other packages. Option B allowed faster cooling, when compared with configurations A and C, but the trend of the thermal behavior of these configurations was quite similar.
It is also worth analyzing the temperature behavior inside the middle package.
Figure 9 highlights the heterogeneity of package B, by comparing the temperature of the fruits at each side of the package as well in the middle.
Analyzing
Figure 9, it can be observed that the lines corresponding to the fruits on the left and right sides of the package are colinear. There is almost no variation in the fruits’ temperatures in these two areas. The temperature varies mostly in the fruit positioned in the middle of the package, with a variation of around 1 °C between the middle position and the side ones.
When comparing this package (B) to the other configurations, it could be verified that the temperature reached in the sides of package B, measured by sensors 3 and 4 (
Figure 4), was minor when compared to the temperature in the middle section of package B as measured by sensor 2 (
Figure 4). The other packages have a lower temperature in the middle section. This happens because, despite the airflow canal in the hand hole, the preferred air channel flows are the remaining holes from the package B design, meaning that most of fruits cools at the same ratio. Concerning the other packages, A and C, the preferred air channel flow is the hand hole, allowing the middle section of these packages to cool faster, with a temperature difference of around 1 °C. For example, after 4 h of cooling, there is a temperature difference between fruit sensor 2 and fruit sensor 3 of −1 °C. The preferred channel allowing the airflow is the hand hole, with a minor area inside the package with a minor temperature.
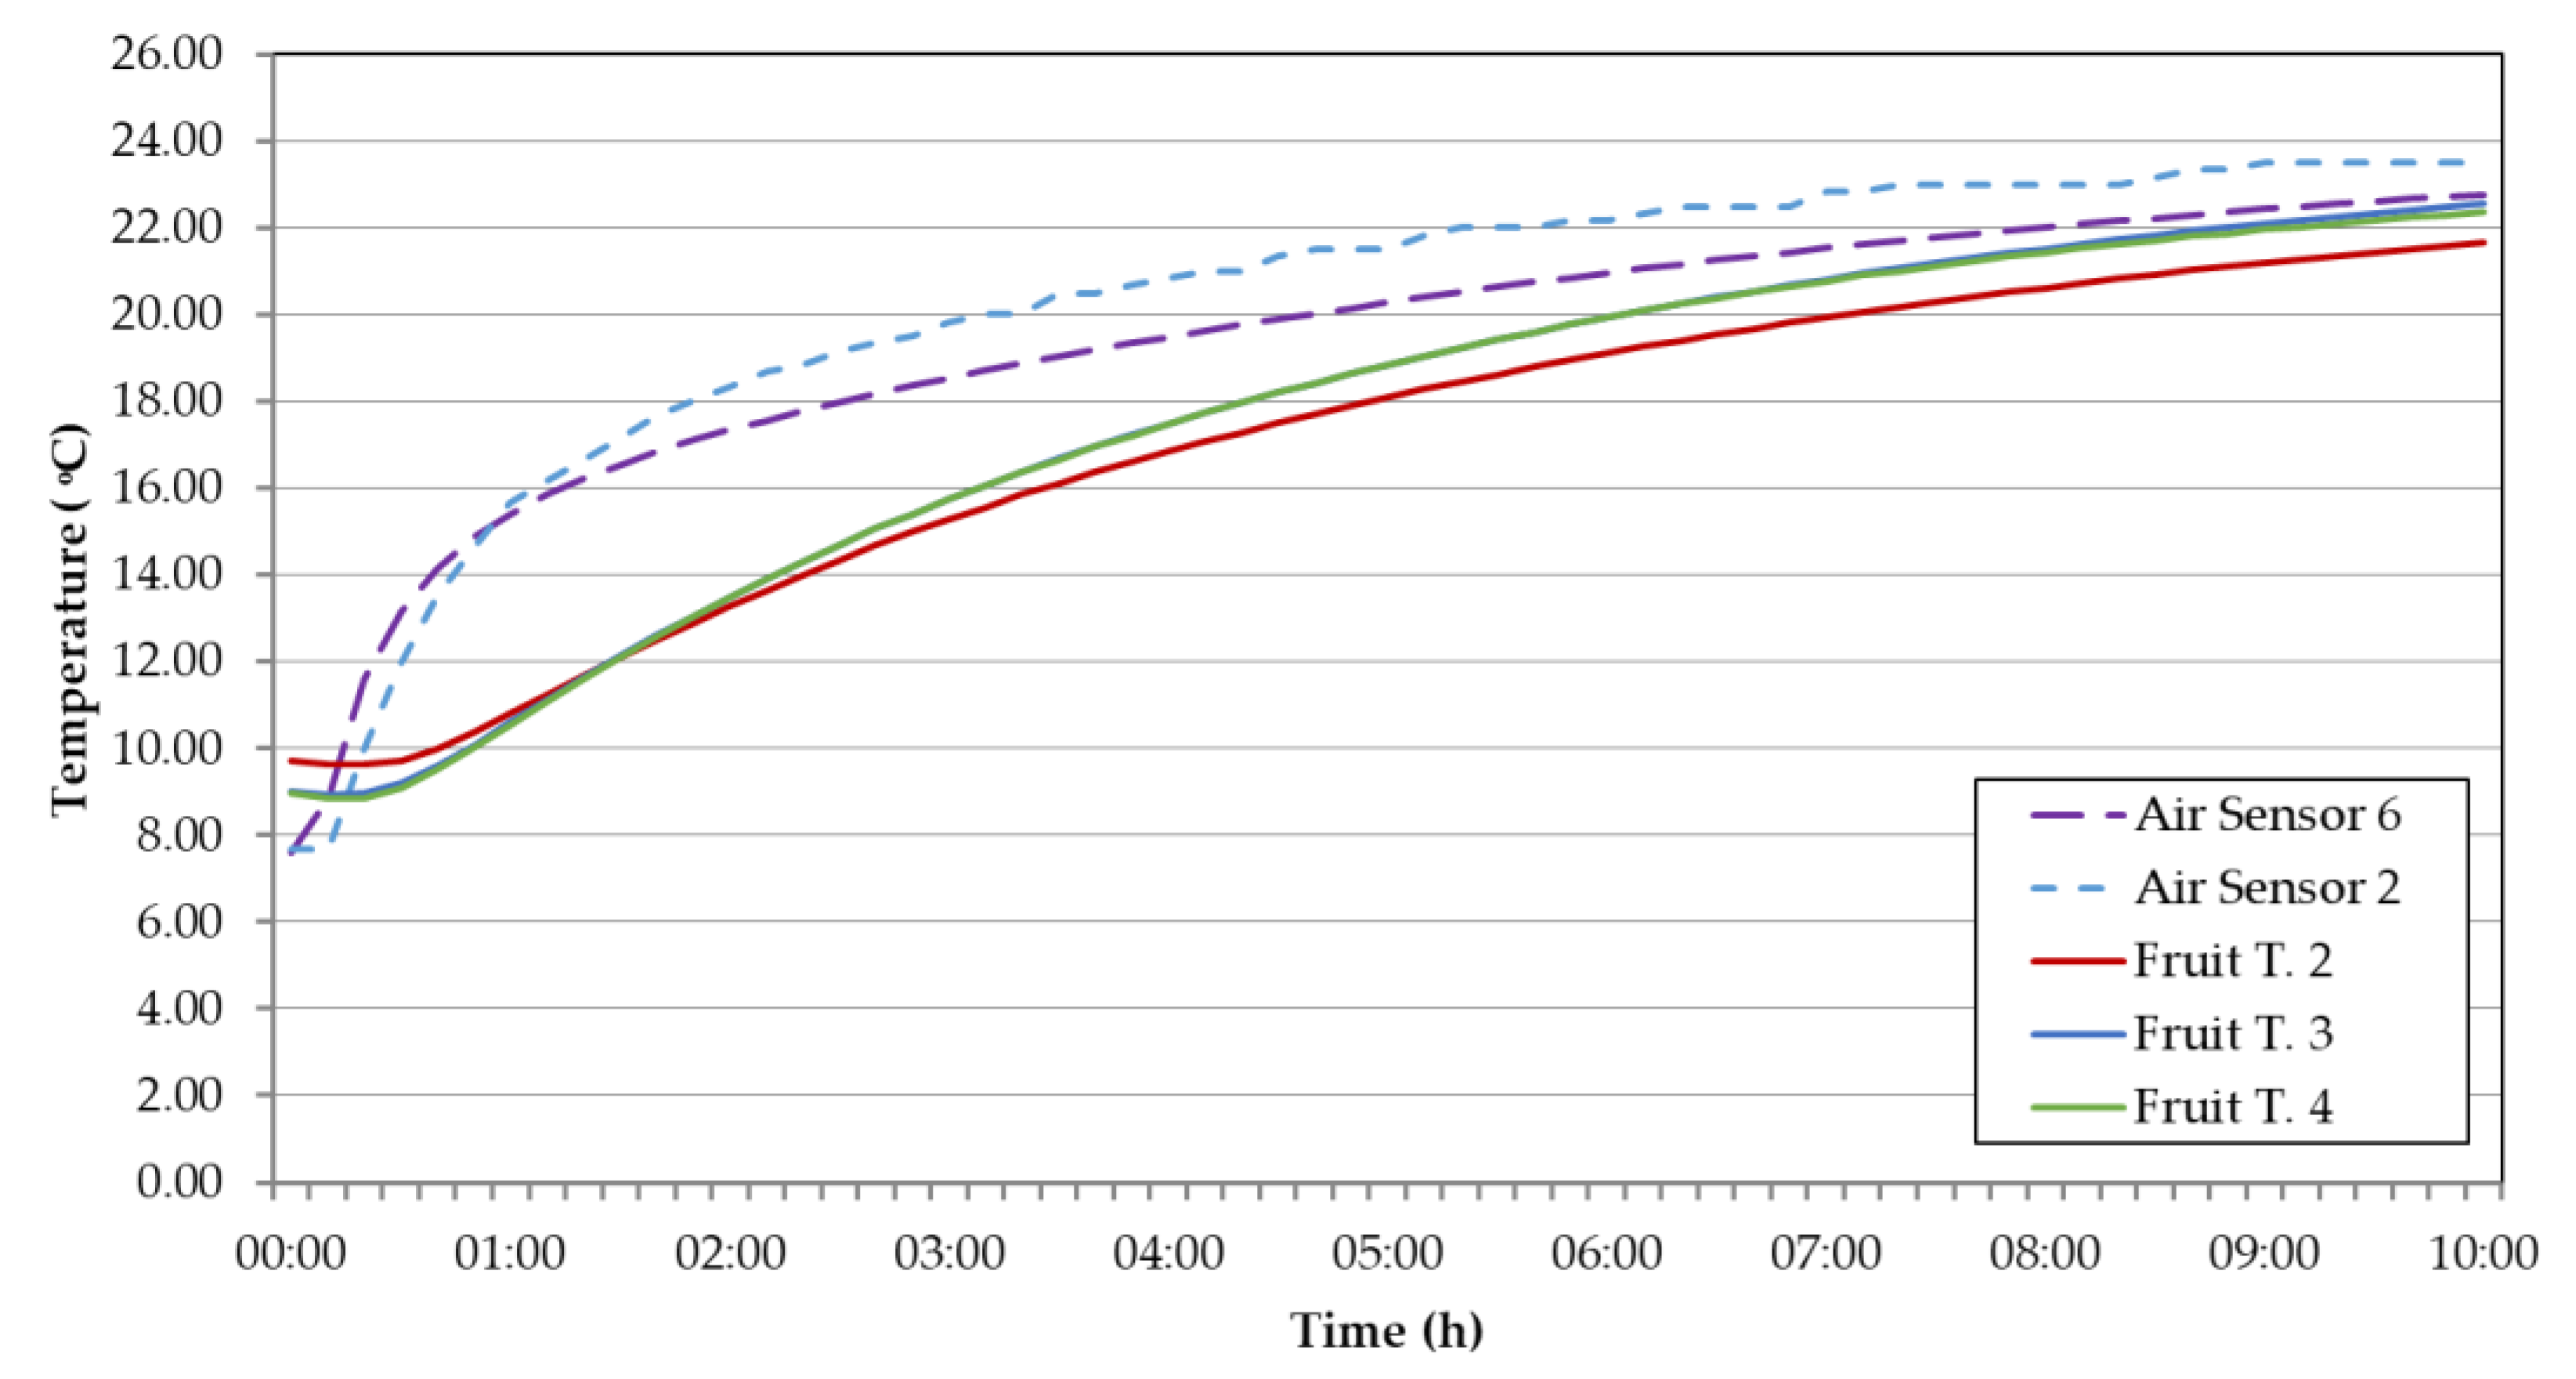
Another conclusion can be drawn by comparing the air sensors 2 and 6. It can be verified in
Figure 9 that there is initially a difference between their values, but, over time, the difference diminishes and, at some point, the value of the air temperature is similar in both of them, showing no heterogeneity at the end of the cooling process in package B.
3.1.2. Heating Process
After an eight-hour cooling process, the packages were exposed to the thermal conditions of the laboratory for ten hours. The laboratory temperature was measured throughout the test. All the temperature changes were recorded and are represented in
Figure 10, where the evolution of the temperature in packages 1 to 3 is compared.
The initial temperatures in each package mirror those at the end of the cooling process. At the end of the heating process, package 1 had the highest temperature, at 23.2 °C, followed by package 2, at 21.7 °C, and package 3 with the lowest temperature, at 20.7 °C.
Figure 10 shows some identical behavior in package 2 and 3, very different from package 1. As package 1 is directly exposed to the ambient temperature, this implies that the temperature rises faster than in the packages below, since the exposed area allows better heat exchange between the cooler air and fruits.
Some interesting conclusions can be made by analyzing
Figure 11, which shows the temperature behavior in the middle package (configuration B) during the heating process. For instance, the change in the air temperature in the middle box is almost uniform over time throughout the whole package. In the first 2 h of the experiment, the air temperature sensors 6 and 2 present the same behavior, as well as the fruit temperature sensors 2, 3 and 4. This thermal uniformity is a clear advantage of package B. The same behavior is not detected in the remaining packages (A and C). This is important in the fruit industry, because, for real-world applications, the packaging provide protection of the produce throughout almost the entirety of the food chain. If the packages demonstrate uniformity in both the cooling and heating processes, the risks of damage in the fresh produce are reduced.
The
HHT from
Table 2 indicates the clear advantage of package B, even in comparison to the reference package, as it takes longer to reach the half-heating time. This value means that the Δ
T inside the package is minor, and this is a highly relevant factor for the fruit industry, because the lower the Δ
T in the heating process, the lower the exposure to microbial damage in the produce.
The problems associated with fresh produce are mostly related to the non-ideal storage temperatures, allowing faster microbial growth and causing damage to perishable products. If different temperatures are detected in different parts of the packaging, the areas with a higher temperature risks the integrity of the fruits in the entire package and in the surrounding packages. A balanced cooling and heating period is important for maintaining the fresh products’ integrity and delivering high-quality produce to the final consumer. Nowadays, the consumption of fresh fruit is rising, since more people are adopting healthier lifestyles, the basis of which is a good diet. The fresh industry must make some changes in order to be able to deliver enough produce to satisfy demand. The damages that occur in food during the food chain can be a problem in achieving this goal.
4. Conclusions
Packaging was recently identified as an essential element in addressing the key challenge of sustainable food consumption and is gaining interest among researchers.
The main purpose of this paper was to evaluate different package designs. Three new designs were tested, designs A, B and C. The analysis of experimental tests aims determining the best package among the three options and comparing them with the most common packaging used nowadays, the reference package. The dimensions of the packages were the same. The only differences were related to the total open area (TOA) on the side of each package. The packages had different air vent holes, which changed the behavior of the inlet air in the package. After analyzing the three options, the best one was compared with the traditional and most used packaging in the supermarkets (reference package). Two main stages involved in the handling of fresh produce were studied: the cooling process, where the packages were exposed to cooled air for eight hours, and the heating process, where the refrigeration system was turned off and the packages were exposed to the temperature of the laboratory. The parameters of the half-cooling time and half-heating time were calculated for each package typology and compared with the reference one.
Since refrigeration entails high energy consumption, it is important to achieve the ideal storage temperature for perishable food products as quickly as possible, and it is also very important to maintain it for as long as possible, even when produce are subjected to non-ideal conditions. With the results obtained, it is possible to verify that package B reaches the half-cooling time faster when compared to the other packages, with significantly better results when compared to the remaining boxes tested.
The other relevant factor is the temperature uniformity inside the package. By considering the temperature difference inside the package it could be concluded that all the packages allow temperature uniformity. In addition, while in packages A and C, the temperature in the middle section is lower than in the sides, package B displayed a lower temperature at the sides, allowing more efficient cooling when compared to the other configurations.
Analyzing the heating behavior by considering all the stages that fresh produce must undergo before reaching the final consumer, a lot of temperature variations were observed. Reasons for these variations include precooling activity, the weighing and calibration of the produce, and even its transportation to the supermarket, which can all reduce it quality before reaching the final consumer. Thus, the objective is to obtain an ideal package that allows produce to cool quickly, so it can reach the ideal temperature to be best conserved and maintain it properties. Additionally, this package must allow produce to remain at a low temperature for a longer period of time, when there is no access to refrigeration. The results of the half-heating time show the advantage of using package B, which requires a longer period of time to reach this half value compared to any other package. During the heating time, package B also shows uniform heating throughout the middle package, which is advantageous for the fresh produce industry.
Package B represents the best balance, even when compared to the reference package, allowing the produce to remain at a lower temperature for a longer period of time (as observed in the analysis of the HHT). This can be crucial in ensuring the quality and freshness of the delivered produce.
Author Contributions
Conceptualization, P.D.S. and P.D.G.; methodology, P.D.S. and P.D.G.; validation, P.D.S. and P.D.G.; formal analysis, F.L., P.D.S. and P.D.G.; investigation, F.L.; resources, P.D.S., P.D.G. and D.D.; data curation, F.L., P.D.S. and P.D.G.; writing—original draft preparation, F.L., P.D.S. and P.D.G.; writing—review and editing, P.D.S., P.D.G. and L.C.P.; visualization, F.L.; supervision, P.D.S. and P.D.G.; project administration, D.D., P.D.S. and P.D.G. All authors have read and agreed to the published version of the manuscript.
Funding
This study was conducted within the activities of project “Pack2Life—High performance packaging”, project IDT in consortium n.° 33792, call n.° 03/SI/2017, Ref. POCI-01-0247-FEDER-033792, promoted by COMPETE 2020 and co-funded by FEDER within Portugal 2020. The authors are grateful for the opportunity and financial support to continue this project to Fundação para a Ciência e a Tecnologia (FCT) and R&D Unit “Centre for Mechanical and Aerospace Science and Technologies” (C-MAST), under project UIDB/00151/2020.
Conflicts of Interest
The authors declare no conflict of interest.
References
- Gustavsson, J.; Cederberg, C.; Sonesson, U.; van Otterdijk, R.; Meybeck, A. Global Food losses and Food Waste e-Extent, Causes and Prevention; Food and Agriculture Organization of the United Nations (FAO): Rome, Italy, 2011. [Google Scholar]
- Kummu, M.; De Moel, H.; Porkka, M.; Siebert, S.; Varis, O.; Ward, P.J. Lost food, wasted resources: Global food supply chain losses and their impacts on freshwater, cropland, and fertiliser use. Sci. Total Environ. 2012, 438, 477–489. [Google Scholar] [CrossRef]
- Goswami, T.K. Comparative performance of precooling methods. J. Food Process Eng. 2008, 31, 354–371. [Google Scholar] [CrossRef]
- Olaimat, A.N.; Holley, R.A. Factors in fl uencing the microbial safety of fresh produce: A review. Food Microbiol. 2012, 32. [Google Scholar] [CrossRef]
- Caleb, O.J.; Mahajan, P.V.F.; Al-Said, A.; Opara, U.L. Modified Atmosphere Packaging Technology of Fresh and Fresh-cut Produce and the Microbial Consequences—A Review. Food Bioprocess Technol. 2013, 6, 303–329. [Google Scholar] [CrossRef] [PubMed]
- Brosnan, T.; Sun, D. Precooling techniques and applications for horticultural products—A review. Int. J. Refrig. 2001, 24, 154–170. [Google Scholar] [CrossRef]
- Opara, U.L. From hand holes to vent holes: What’s next in innovative horticultural packaging. In Inaugural Lecture; Stellenbosch University: Stellenbosch, South Africa, 2011; 24p. [Google Scholar]
- Anderson, B.A.; Sarkar, A.; Thompson, J.F.; Singh, R.P. Commercial-scale forced-air cooling of packaged strawberries. Trans. ASAE 2004, 47, 183–190. [Google Scholar] [CrossRef]
- Delele, M.A.; Tijskens, E.; Atalay, Y.T.; Ho, Q.T.; Ramon, H.; Nicolaï, B.M.; Verboven, P. Combined discrete element and CFD modelling of airflow through random stacking of horticultural products in vented boxes. J. Food Eng. 2008, 89, 33–41. [Google Scholar] [CrossRef]
- Pathare, P.B.; Opara, U.L.; Vigneault, C.; Delele, M.A.; Al-Said, F.A.-J. Design of packaging vents for cooling fresh horticultural produce. Food Bioprocess Technol. 2012, 5, 2031–2045. [Google Scholar] [CrossRef]
- Vigneault, C.; Thompson, J.; Wu, S.; Hui, K.P.C.; LeBlanc, D.I. Transportation of fresh horticultural produce. Postharv. Technol. Hort. Crop. 2009, 2, 1–24. [Google Scholar]
- Morais, D.; Gaspar, P.D.; Silva, P.D.; Andrade, L.P.; Nunes, J. Energy consumption and efficiency measures in the Portuguese food processing industry. J. Food Process. Preserv. 2020. [Google Scholar] [CrossRef]
- Dincer, I. Air Flow Precooling of Individual Grapes. J. Food Eng. 1995, 26, 243–249. [Google Scholar] [CrossRef]
- Defraeye, T.; Cronjé, P.; Berry, T.; Opara, U.L.; East, A.; Hertog, M.; Verboven, P.; Nicolai, B. Towards integrated performance evaluation of future packaging for fresh produce in the cold chain. Trends Food Sci. Technol. 2015, 44, 201–225. [Google Scholar] [CrossRef]
- Zhao, C.-J.; Han, J.-H.; Yang, X.-T.; Qian, J.-P.; Fan, B.-L. A review of computational fluid dynamics for forced-air cooling process. Appl. Energy 2016, 168, 314–331. [Google Scholar] [CrossRef]
- Castro, L.R.; Vigneault, C.; Cortez, L.A.B. Container opening design for horticultural produce cooling efficiency. Food Agric. Environ. 2004, 2, 135–140. [Google Scholar]
- Dincer, I.; Yildiz, M.; Loker, M.; Gun, H. Process parameters for hydrocooling apricots, plums, and peaches. Int. J. Food Sci. Technol. 2007, 27, 347–352. [Google Scholar] [CrossRef]
- Ferreira, J.; Silva, P.D.; Pires, L.C.; Gaspar, P.D.; Nunes, J. Peach efficient cooling at post-harvest phase: A comparative study between air-cooling and hydro-cooling processes. In Proceedings of the +AGRO 2018—International Congress on Organizational Management, Energy Efficiency and Occupational Health and Safety in Agrifood Industry, Castelo Branco, Portugal, 3–4 October 2018. [Google Scholar]
- Ilangovan, A.; Silva, P.D.; Gaspar, P.D. Airflow and thermal behavior within Peachs packaging box using Computational Fluid Dynamics—A preliminary study. KnE Eng. 2020, 5, 222–231. [Google Scholar] [CrossRef]
- Ilangovan, A.; Gaspar, P.D.; Silva, P.D.; Gonçalves, A.R.; Sampaio, A.M.; Pontes, A.J.; Alves, N. CFD parametric study of. thermal performance of different fruit packaging box designs. In Proceedings of the AIP Conference Proceedings, 15th International Symposium on Numerical Analysis of Fluid Flows, Heat and Mass Transfer-Numerical Fluids 2020 (ICNAAM 2020), Rhodes, Greece, 17–23 September 2020. [Google Scholar]
- Madham, S.K.; Leitão, F.; Silva, P.D.; Gaspar, P.D.; Duarte, D. Experimental tests of the thermal behaviour of new sustainable bio-packaging food boxes. Procedia Environ. Sci. Eng. Manag. 2021, 8, 215–223. [Google Scholar]
| Publisher’s Note: MDPI stays neutral with regard to jurisdictional claims in published maps and institutional affiliations. |
© 2021 by the authors. Licensee MDPI, Basel, Switzerland. This article is an open access article distributed under the terms and conditions of the Creative Commons Attribution (CC BY) license (https://creativecommons.org/licenses/by/4.0/).


