1. Introduction
Road traffic safety (RTS) studies conducted in many countries have shown for many years that among the three main elements of the RTS system, i.e., human, vehicle, and environment, it is the human that contributes to the largest number of accidents. Therefore, the studies aimed at improving road safety concern mostly the human driver: his or her personality, behavior on the road, attitudes, emotional tension, knowledge, experience, and many other factors. The studies have a cognitive nature, and simply stated, it can be said in straightforward terms that they are devoted to identifying the reasons and circumstances of particular behaviors on the road.
From a practical viewpoint of, for example, people dealing in driver training, the police dealing in traffic congestion prevention, or insurance companies that determine vehicle insurance premium amounts, it is important to be able to evaluate driver skills in terms of safety. Motor vehicle operation has a widespread activity, which is why road traffic includes people who are driving very well and comply strictly with the road traffic regulations, but also people who devalue and ignore them. For the aforementioned persons and institutions, it is important to be able to evaluate driving techniques as safe or unsafe to various degrees, based on measurable vehicle movement parameters during vehicular operation rather than after a collision or accident. Therefore, due to the very high number of factors that may determine driver behavior on the road, the undertaking of such studies is both timely and of critical importance.
There is a very high number of papers published in the specialist literature in which the authors attempt to determine the driver’s profile, his or her personality traits and predisposition (intellectual and psychomotor) with respect to vehicle operation. Many publications refer to specific traits, such as the drivers’ physical or mental fitness as well as knowledge and skills, including attitudes and motivations. For cognitive purposes, but also due to the very high practical relevance, frequently discussed topics include the driver reaction time [
1,
2,
3,
4,
5], studying the selection and execution of their preferred defensive maneuvers [
6,
7] as well as the driver’s perception of the environment. The analysis covers vision after dark and sensitivity to glare. An important feature is the driver’s hand-eye coordination, depending on various factors such as time of day, cognitive efficiency, and fatigue from a long day at work [
8,
9].
The aforementioned diversity of the papers results not only from the phenomenon’s complexity and the large number of factors contributing to it, but also from the use of various research methods to study and analyze the vehicle driving process. Studies of the aforementioned driver features and behaviors can be conducted in various research environments: actual road or test sections and virtual-simulators and testing stations [
10]. An increase in the elderly population, especially in well-developed countries, contributes to an increasing number of tests on drivers with various dysfunctions caused by mental diseases presenting at this age [
11], or other diseases typical for this age, such as Alzheimer’s or Parkinson’s disease [
12]. This is highly relevant during the development of new assistance systems dedicated to this specific group of drivers to limit their social exclusion constituting the effect of various dysfunctions related to such diseases.
A large problem in many countries is driving under the influence of alcohol or psychoactive substances (mainly drugs), which is why studies regarding their impact on driver behavior are conducted continuously in many centers [
13,
14]. In paper [
15], the authors proposed a system aimed at analyzing driver behavior to be able to identify drivers who have consumed alcohol. The system, based on the use of a mobile phone and an acceleration sensor, enables evaluation of driver action by comparing the manner of executing typical maneuvers with the driver’s activity patterns.
Many papers present studies aimed at identifying and sometimes evaluating the driving technique (style). Simple or more advanced tools to determine the driver’s type based on certain indicators and evaluation of their mental inclination towards specific, negative behaviors are being developed. A very interesting and prospective trend is research aimed at recognizing the driver’s intentions [
16,
17,
18].
Simple measurable indicators are quite often used to evaluate the driver’s actions [
19,
20]. These may include, e.g., vehicle position, vehicle speed [
21], or longitudinal and lateral acceleration [
22,
23,
24]. A radically different approach was provided in the paper [
25], which presents a concept of continuous driver profiling by signals from the vehicle’s built-in sensors via use of the machine learning method [
26]. A set of 51 various data sets downloaded from the vehicle’s CAN bus (acquired from 10 different controllers) was considered. The evaluation of the proposed method was conducted based on tests implemented by 10 drivers driving an identical vehicle on four different routes with a total length of 46 km. The drivers were driving the vehicle on, among others, an urban road, a motorway, and in a parking lot during working days at similar times.
The complexity of the developed driver driving method (driving style, technique, driver profile specification) evaluation algorithms depends largely on the main objective of the given studies. A simple method of evaluating the driver’s driving method is presented in the paper [
27]. The applied method, based on recording selected driving parameters on a smartphone with appropriate software installed, determines the driver’s driving method based on indications of, among others, the acceleration sensor. According to the applied algorithm, the driver receives points when driving, which translates into the final rating: very bad (<750 points), bad, good, and very good (>990 points). The concept of a different, inexpensive and smart driver evaluation system aimed at identifying aggressive drivers is provided in the paper [
28]. The system is based on data obtained from a three-axis accelerometer. Similar measurements are also discussed in other publications [
29,
30]. The paper [
31] describes a system that allows for the identification of a driver’s emotional excitation by measuring the driver’s selected physiological parameters and the data on the vehicle’s movement. The sensors establish wireless communication with the smartphone. All data on the driver’s behavior and driving method are displayed in real-time in the dedicated application (for the Android system).
The vehicle’s speed and acceleration distributions measured at specific time intervals are the basis for evaluating the driving method of the driver described in the paper [
16]. Such driving style analysis can be used to recognize the driver’s mental and physiological condition and in particular to detect his or her drowsiness and fatigue.
Three-axis acceleration sensors constitute the foundation for a system aimed at determining the profile of the driver described in the paper [
32]. The obtained acceleration values undergo a spectral analysis and are then used in conjunction with a suitable algorithm to enable recognition of an ‘aggressive’ driver and a ‘safe’ driver. The available literature also includes publications that include measurements on the positions of the controls, e.g., throttle or service brake [
33,
34]. In paper [
35], Wakita et al. have proposed a method for identifying the driver’s features based on signals recorded when driving behind a different vehicle. These signals included: the motion of the throttle; service brake; vehicle speed; and distance from the preceding vehicle. The tests were conducted in a driving simulator.
In paper [
36], an instrumented vehicle-based experiment was designed to observe the drivers’ action under various urban lane-changing scenarios. The ‘in-vehicle’ driver behavior data were obtained from the experiment and used to classify 40 drivers into four general groups according to the lane-changing maneuvers performed in an urban street environment.
The paper of Van Ly et al. [
37], which profiled a driver enabling the identification of many dangerous maneuvers performed when driving, utilized the concept of using acceleration sensors that are already present in the vehicle (bus). The data was obtained from the CAN bus. The researchers focused on the ‘observation’ of three maneuvers: braking, turning, and acceleration. As result of the conducted analysis, it was pointed out that the evaluation of braking and acceleration gives better effects for drive identification than does an analysis of the acceleration process.
The method of comparing passenger surveys with acceleration measurements’ results was used in the study presented in the publication [
38]. The surveyed city bus passengers were tasked with evaluating, in a subjective manner, the vehicle’s acceleration on a three-level scale, i.e., comfortable, normal and uncomfortable. For example, longitudinal accelerations deemed by the surveyed passengers as uncomfortable were in the range of 1.5–2.75 m/s
2. Sensors built into high-grade smartphones, such as accelerometer, gyroscope, magnetometer, GPS, and video cameras, were used in the study described in the paper [
39]. It presents the concept of a system aimed at identifying typical and aggressive drivers based on data obtained by using the aforementioned sensors. Paper [
40] features an analysis of driver behavior in urban conditions. It was demonstrated that the average speed and delay range were lower during peak traffic hours than at other times of bus operation. Interesting analyses concern the dependency between driving technique and driver gender. Men drove more aggressively and moved with higher acceleration values than did women. The difference was especially clear in the city. On most routes, drivers of both genders were driving at similar speeds. Driver behavior studies are often focused on attempts to determining specific parameters that would satisfactorily describe driver behaviors in selected road situations. Certain conventional indicators facilitating a broader driver behavior analysis are often designated. Examples of such indicators include, e.g., the headway or time to collision. Due to the universality of various devices that may directly or indirectly distract the drivers and simultaneously affect their actions, researchers are conducting tests aimed at determining the impact of the operation of various devices, e.g., radio, navigation system, or mobile phone, in various road situations [
41,
42].
In [
43], large taxi floating car data (FCD) was used to empirically evaluate how traffic congestion-related negative moods, defined as state aggressiveness, affected drivers’ speed choice. The results indicated that the speed model incorporating state aggressiveness could better predict the travel time than the traditional speed model that considers only the specific expected speed distribution. Publication [
18] determines the criteria for evaluating driver behavior in three situations: when stationary; when driving, and when braking; whereas paper [
44], to evaluate the drivers’ driving styles, classifies vehicle exploitation in conditions during urban and extra-urban driving with simultaneous specification of driving in traffic and dynamic driving.
The presented paper constitutes a part of the studies aimed at establishing a method of parameter-based evaluation of driver behavior. This method assumes the continuous measurement of many parameters, some of which will be obtained from the vehicle CAN bus and includes utilization of various sensors in the vehicle’s electronic control systems for specific assemblies (e.g., engine, suspension, brake system, etc.) as well as the active and passive safety systems. The method also projects the installation of additional sensors constituting special elements of measurement and recording modules-the so-called trackers. It is assumed that several variants of algorithms determining the so-called ‘driver profile’ will be developed. These profiles (algorithms) will vary in complexity based mainly on the number of parameters used. They will be developed hierarchically, starting with the simplest and proceeding to those of increasing complexity.
The short literature study presented above demonstrates that longitudinal and lateral acceleration values (as well as driving speed) are the parameters most often used to evaluate the driver’s profile (driving style, technique, manner of driving). The authors also want to start their study by analyzing these acceleration values and verifying the factors (except habits and behaviors) that affect them the most. One of the most important factors contributing to the variety in the obtained parameters is, e.g., the type and performance of the driver’s vehicle. High-capacity and high-torque engines installed in vehicles favor achieving high acceleration values. It can be expected that the values of acceleration, braking delays, and lateral acceleration in curvilinear motion in a high-class passenger vehicle with a high-capacity engine will be substantially higher (while ensuring the passengers’ subjective feeling of comfort) than in the case of an urban transport bus. With respect to persons standing in such transport, even low longitudinal and lateral acceleration values can be experienced as excessive.
Another important factor that affects the acceleration values and variation is the road type and shape. When the same driver uses the same vehicle on different roads, he or she will achieve various acceleration values. Impactful will be such factors as, e.g., road grade, including the number of available traffic lanes; its profiling; straight section lengths; number and shape of corners; traffic organization, and traffic intensity. The topic of this paper is to study this specific factor.
5. Analysis and Discussion
Figure 6 presents the frequency of occurrence of particular longitudinal acceleration values on the analyzed sections. Most of the driving time is dominated by acceleration values of 0.5 to −0.5 m/s
2. This interval was distinguished arbitrarily because it can be conventionally named as driving approximately at a constant speed or ‘smooth driving’. These slight acceleration or delay values occur across the entire route. These are acceleration changes caused, e.g., by the topography (ascending or descending on a hill), or by the changing headwind or tailwind, and similar situations causing changes in driving speed. These can also include intentional driving speed corrections made by the driver to maintain the intended speed. Depending on the road type, the share of such acceleration values lies within a broader range of 61.9% to 99.5%, whereas the highest share of the ‘smooth driving’ occurs on the motorway, then on the expressway and non-urban area; the smallest share occurs in the urban area.
When driving in the city, there is also a high variation in longitudinal acceleration values—the recorded acceleration values occur in eight separate ranges in the chart. The narrowing of these ranges occurs on the other road sections but is it most evident on the expressway and motorway.
As explained in the Introduction, the number of acceleration classes in the diagrams showing longitudinal and lateral acceleration was limited in accordance with the aim of the study (see the Acknowledgements). Increasing the number of classes, i.e., further dividing them, would be justified only if it helped understand the problem in more detail. Here, the purpose was driver risk assessment (driver profiling), which required a simple-to-use method of analysis to determine acceleration for different types of routes. Subdividing the classes of acceleration would make the interpretation and comparison of the results too complicated. A similar method of result presentation is used, e.g., in [
36].
In the case of positive acceleration, mainly in urban traffic, it is possible to observe values of up to 3 m/s2; however, their occurrence is sporadic. Negative values (delay during deceleration and braking) occur in the range of down to −4 m/s2, wherein the lowest values were recorded sporadically only when driving in the city and on the expressway. What is interesting is that there were no cases when the delay values would exceed −4 m/s2, i.e., intense braking, although the testing was conducted on a long route (650 km) on which situations requiring extensive braking can be expected. This was the case even though the driver was moving rather dynamically. This fact can be interpreted as confirmation of the driver’s good skills, including anticipation of dangerous situations. A driver with lower skills would be more often ‘forced’ to brake extensively, most likely being surprised by the road situation. However, the revealed impact of the driver’s experience and skills will be the topic of a separate study cycle. In the case of negative acceleration values, all charts are dominated by the range from −0.5 to −1 m/s2.
Figure 7 shows the share of occurrence of various lateral acceleration value ranges when driving on different roads. Positive and negative values designate the acceleration’s direction (left-right), hence the absolute values included. The figure also includes the distinguished range from −0.5 to 0.5 m/s
2. This interval can also be interpreted (in a fashion similar to the longitudinal acceleration values analysis) as the conventional ‘smooth driving’. When driving on a straight road, drivers make mild corrections to the driving path to center the vehicle on the traffic lane if for any reason (operation of the radio, air conditioning, navigation system, etc.) they neared the left or right edge of the lane. This can also be caused by the varying crosswind affecting the vehicle. It is possible to specify other minor reasons inducing driving path correction, for example, the impact of pressure drop on the vehicle, caused by the presence of a large commercial vehicle on the side, etc.
Values in the range of −0.5 to 0.5 m/s
2 were recorded for over 80% of the drive time, wherein the highest values were obtained when driving on the motorway (95%). It is worth noting that the shares of the lowest range for lateral acceleration values are within the substantially lowest interval of 80.4% to 95.1%. The interval length therefore amounts to 15.0%, whereas for longitudinal acceleration values (see
Figure 6), the interval is twice as long and amounts to 99.5% − 61.9% = 37.6%.
The overwhelming prevalence of driving conventionally, referred to as ‘smooth driving’ or driving at approximately constant speed with its specific acceleration range of −0.5 to 0.5 m/s
2 makes the shares of driving at other acceleration values very small. However, in terms of the synthetic attempt of evaluating the driving techniques of different drivers, the cases of non-conventional or non-smooth driving are the more important. To take a look at these other cases, the sections of driving at acceleration values of −0.5 to 0.5 m/s
2 were excluded from further analysis. The modified waveforms were analyzed further. This allowed for the evaluation of the structure of other longitudinal and lateral acceleration values. The longitudinal acceleration values modified in the manner specified above are presented in
Figure 8, and the lateral acceleration values are presented in
Figure 9.
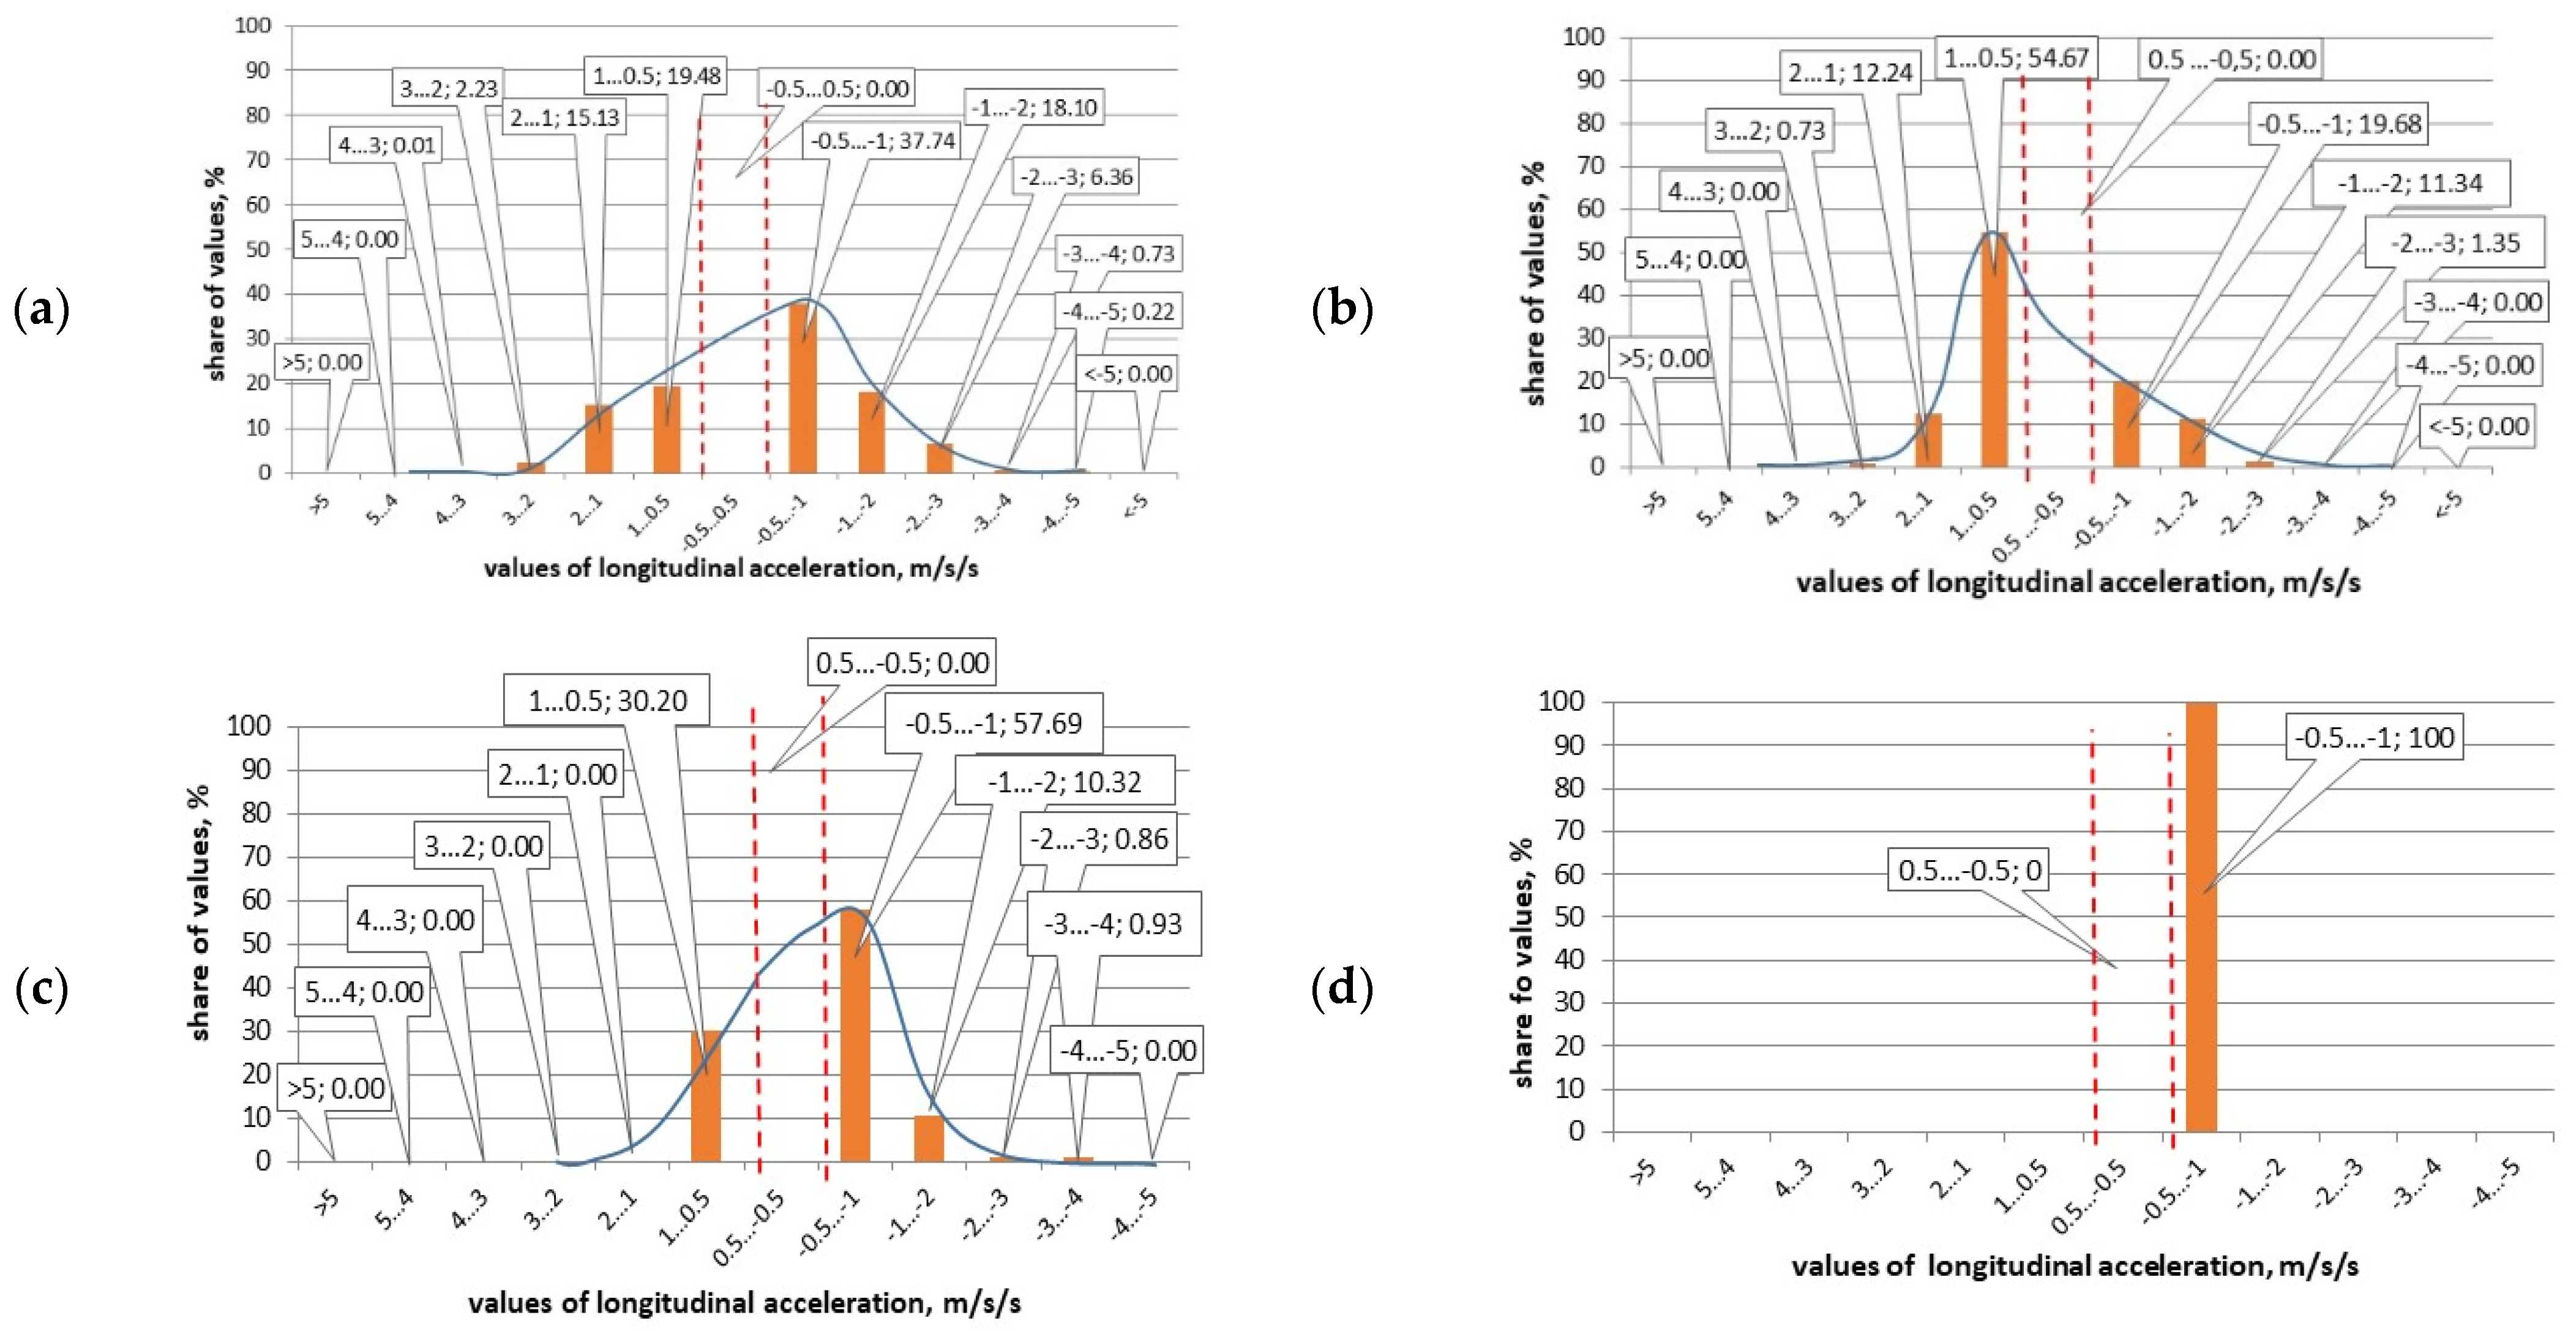
Based on the charts presented in
Figure 10 and
Figure 11, it is possible to evaluate the structure of the longitudinal and lateral acceleration values. In the case of the urban section driving, longitudinal acceleration in the range of −0.5 to −1 m/s
2, corresponding to mild braking is dominant, with a share of nearly 38%. The case is similar for expressway and motorway driving, wherein their shares amount to 58% and 100% accordingly. As for extra-urban route driving, slight acceleration in the range of 0.5 to 1 m/s
2, corresponding to smooth acceleration, has a share of 52.5%.
The charts presented in
Figure 10 demonstrate that the acceleration values are becoming more focused as the road standard increases: six diagram columns are visible in the chart for the urban road; for extra-urban roads—five; for the expressway—three; and only one for the motorway.
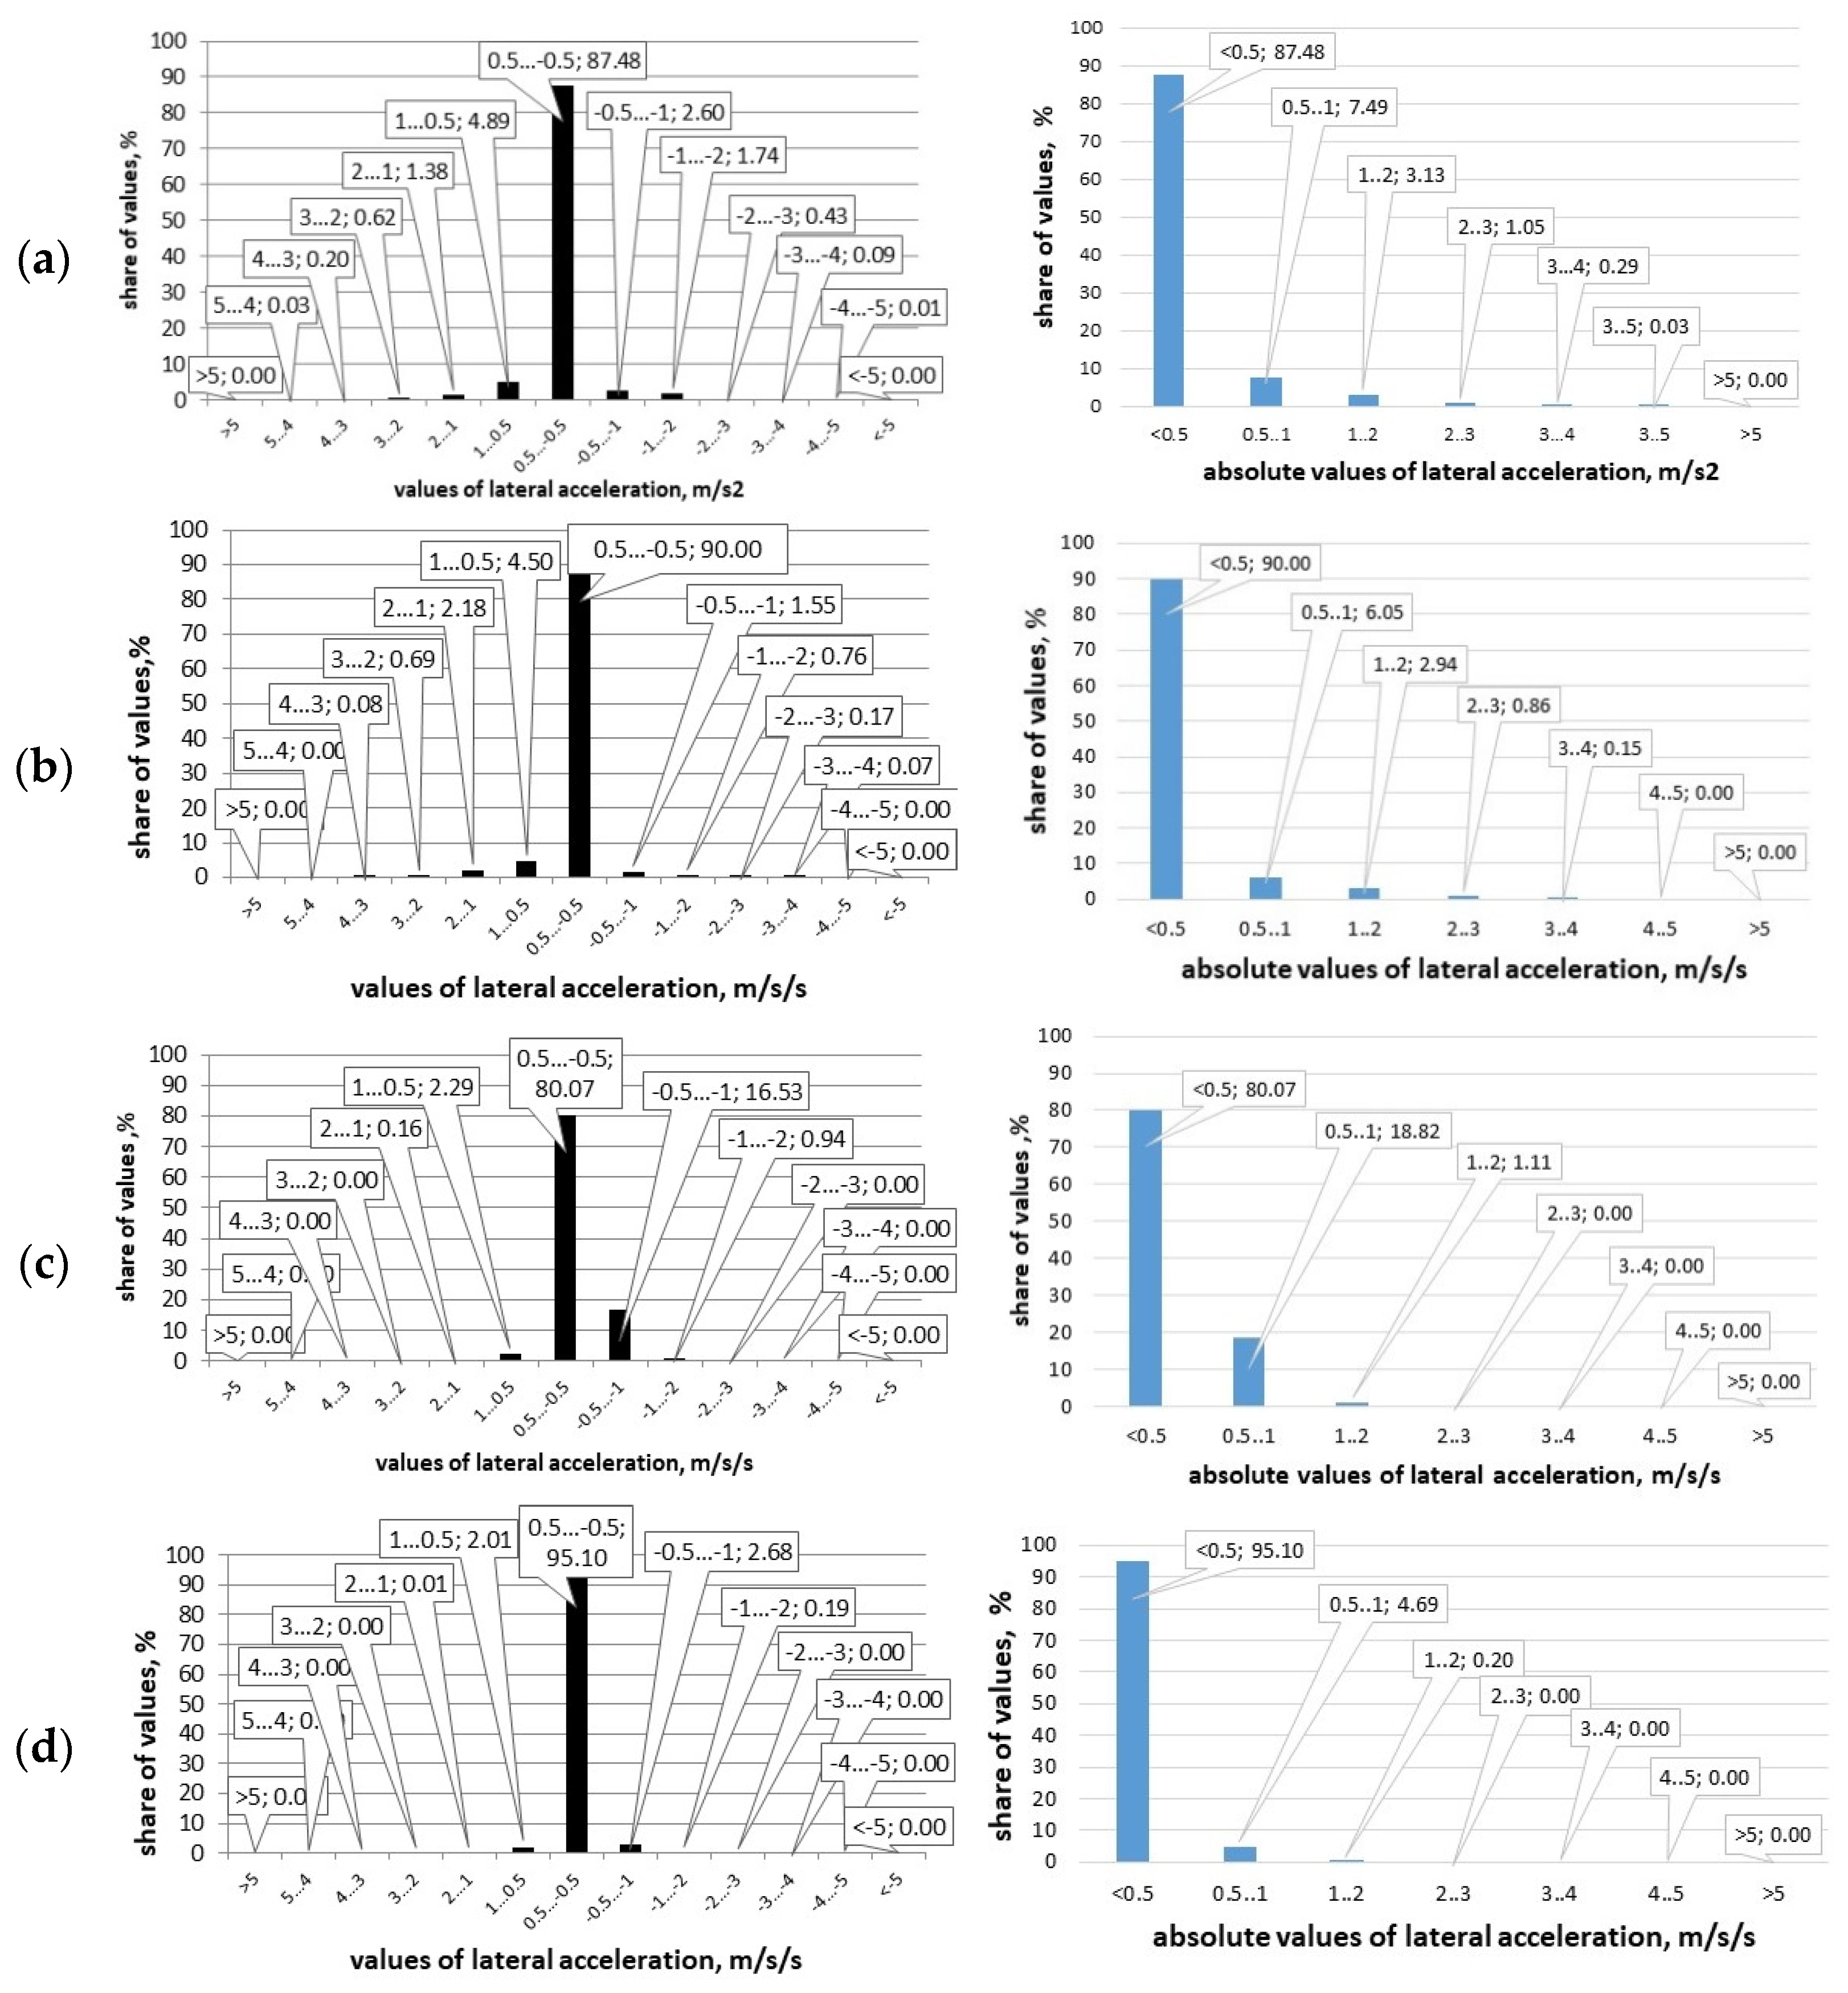
In the case of lateral acceleration values,
Figure 11 presents distributions with consideration of the acceleration mark (turning right or left) and distributions of the accelerations’ absolute values. The shares of driving at other acceleration values are visible only after such modifications. The first two charts demonstrate a high similarity, and only charts 3 and 4 differ from one another rather clearly. The high similarity of chart pairs 1 and 2 as well as 3 and 4, is visible only when the lateral accelerations’ absolute values are used. Acceleration values in the range of 0.5 to 1.0 m/s
2 are dominant in all charts, whereas on the urban and extra-urban sections they slightly exceed 60% and reach 95–96% on the expressway and motorway. This indicates that on higher-grade roads, driving is substantially smoother.
The next two charts (on
Figure 12 and
Figure 13) demonstrate acceleration distributions in the form of spline charts rather than bar graphs, wherein the curves of the given acceleration type were plotted on the common chart for all four of the studied road sections.
Figure 12 shows that each of the longitudinal acceleration distribution curves has a different and individual shape. If the shapes would be repeated approximately for other vehicle types, then it is possible to state that the acceleration curves (modified in an aforementioned manner) can be used to recognize the road type on which the driving took place.
In the case of the lateral acceleration values presented in the left chart of
Figure 13, their distribution curves also have individual shapes; however, it is more difficult to point out any regularities in the charts’ shapes. However, a very interesting result is obtained when applying absolute value distribution curves-the right chart in
Figure 13. It turns out that when charts 1 and 2, as well as 3 and 4, are paired, the charts are nearly identical. This means that in terms of the lateral dynamics, the vehicles’ movement on each of the roads in the given pair is the same.
6. Conclusions
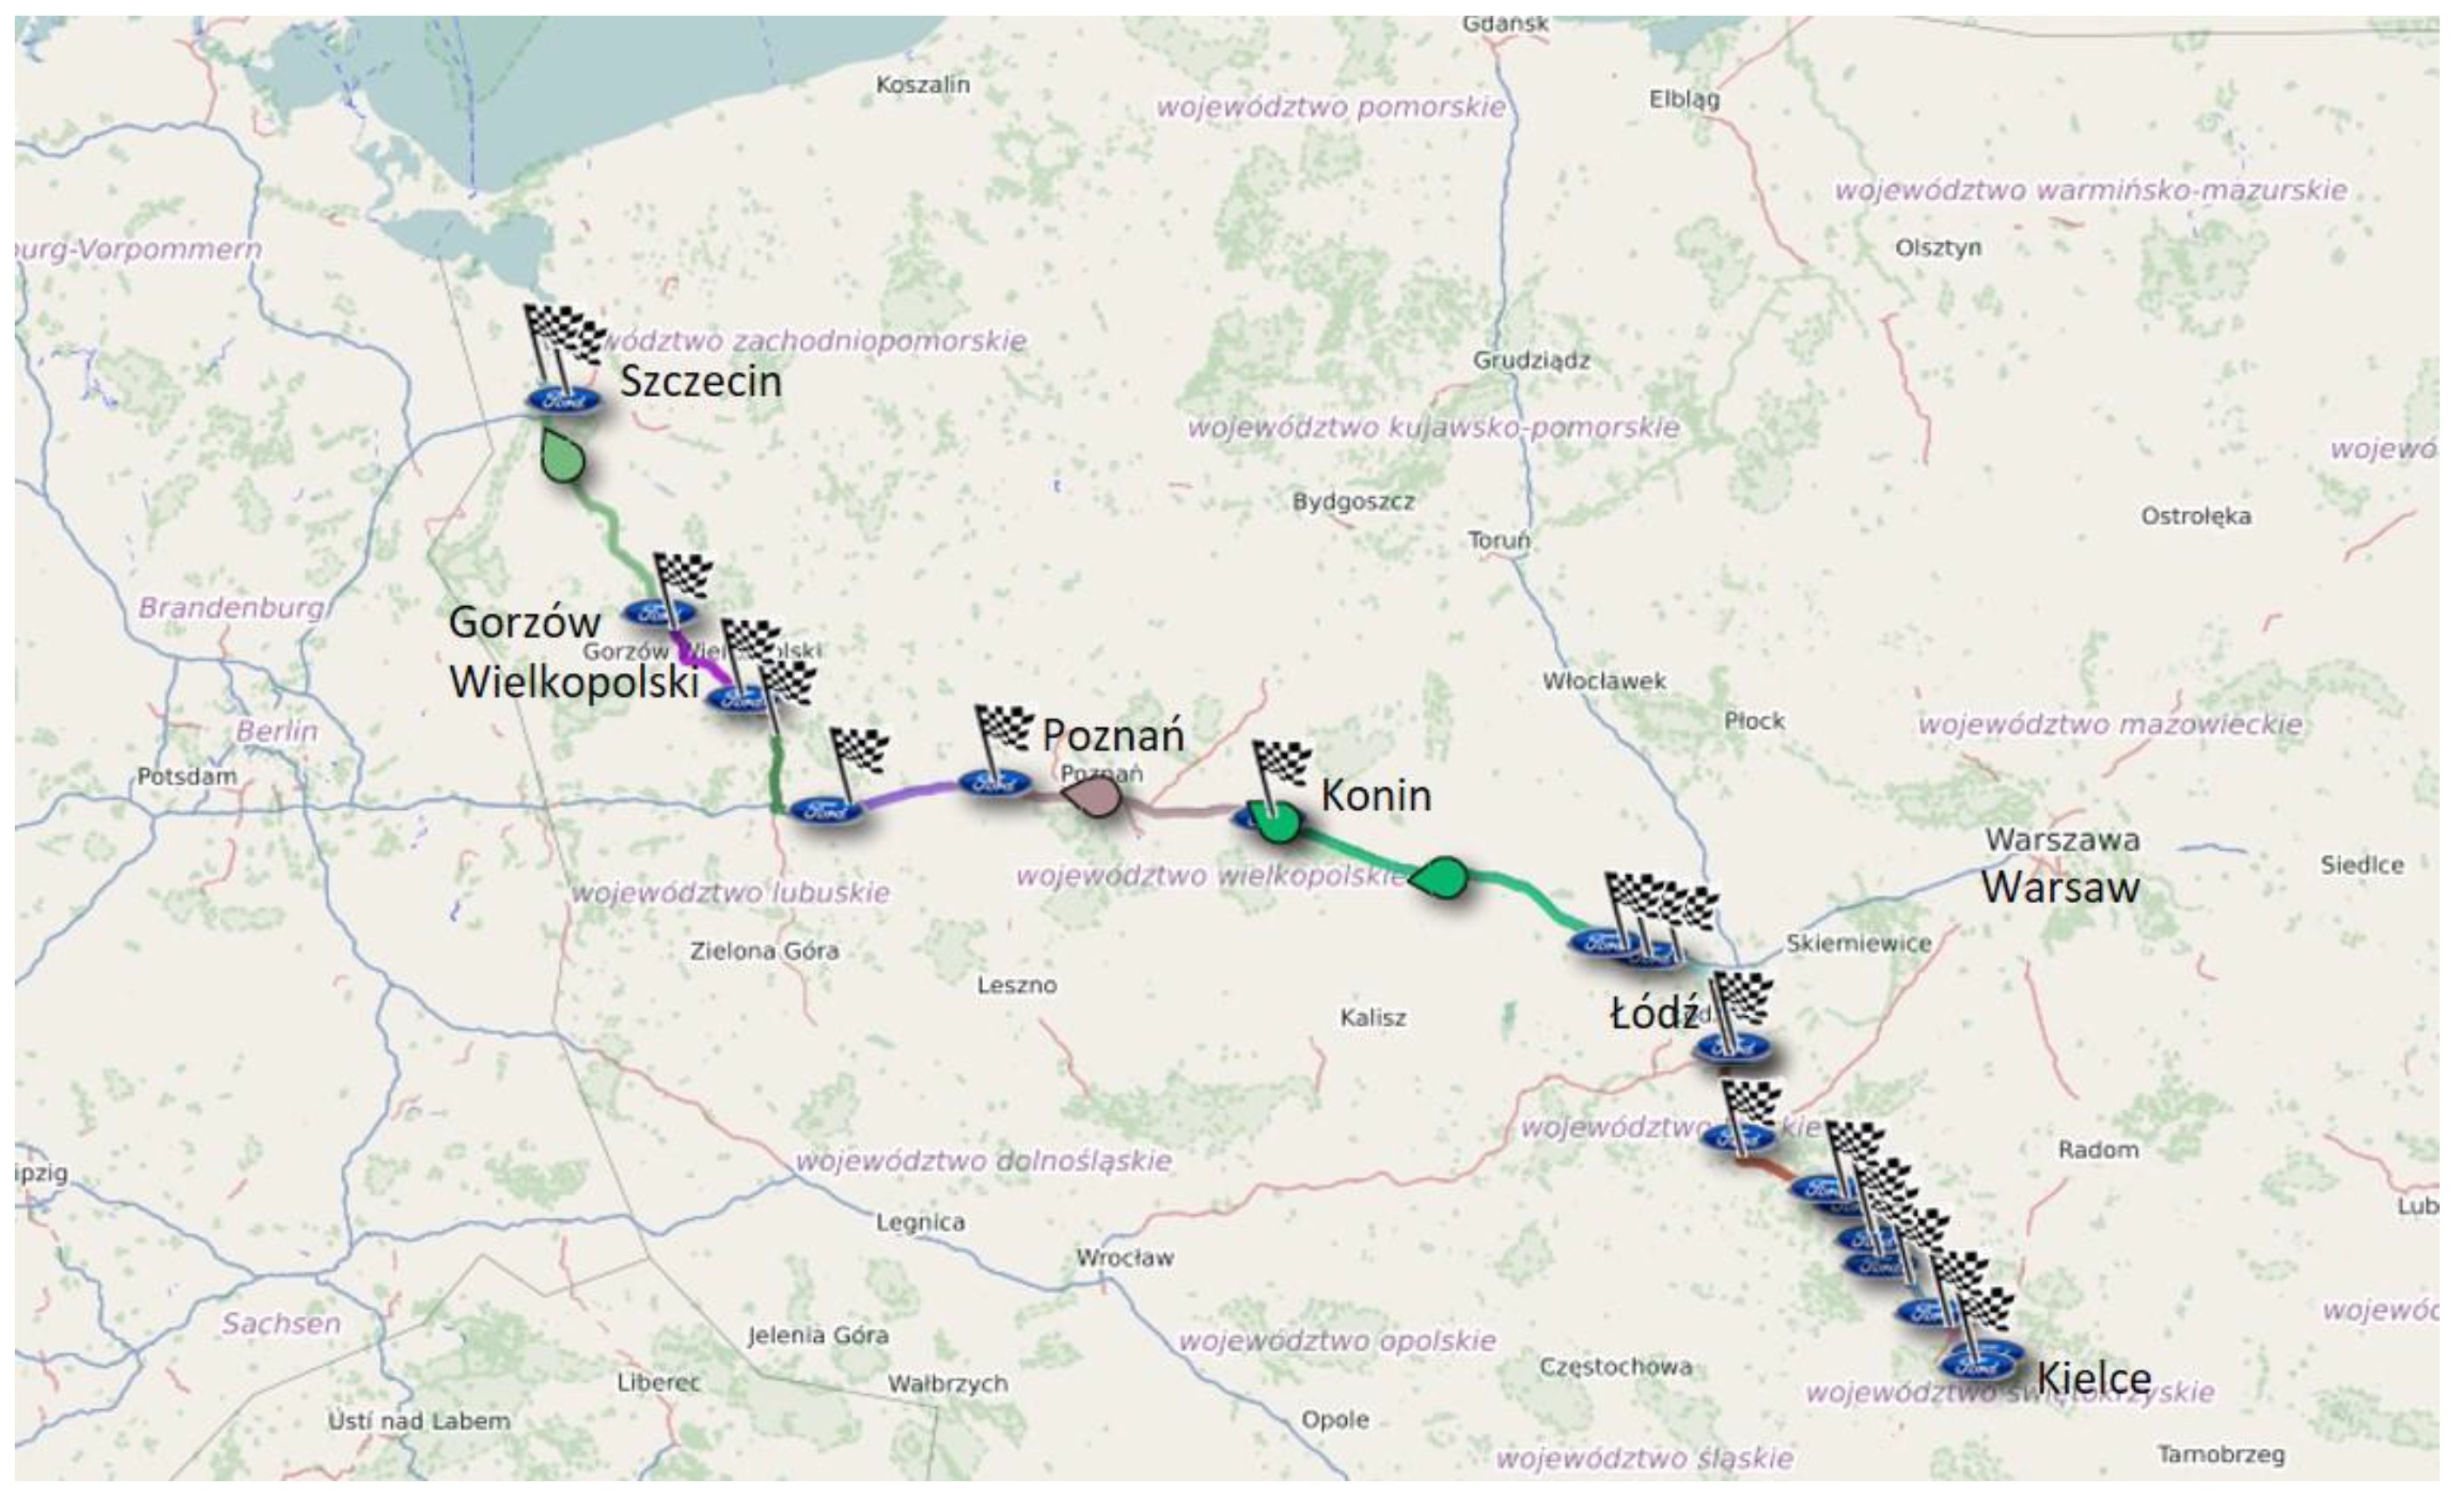
In terms of the paper’s main objective formulated in the final paragraph of the Introduction, i.e., the impact of the road type and shape on some of the basic movement parameters, i.e., longitudinal (positive and negative) and lateral acceleration values, the route selection must be evaluated as correct. It can be considered that the route included the four most-typical road types for many countries: urban area (city); single-roadway road with two traffic lanes in a non-urban area; expressway (with two roadways); and a motorway. In more detailed analyses, it is certainly possible to distinguish additional road types. However, in terms of achieving the paper’s objective, the diversity of road type (and their features) in the presented set is sufficient to allow for achieving the attainment of the study’s objective.
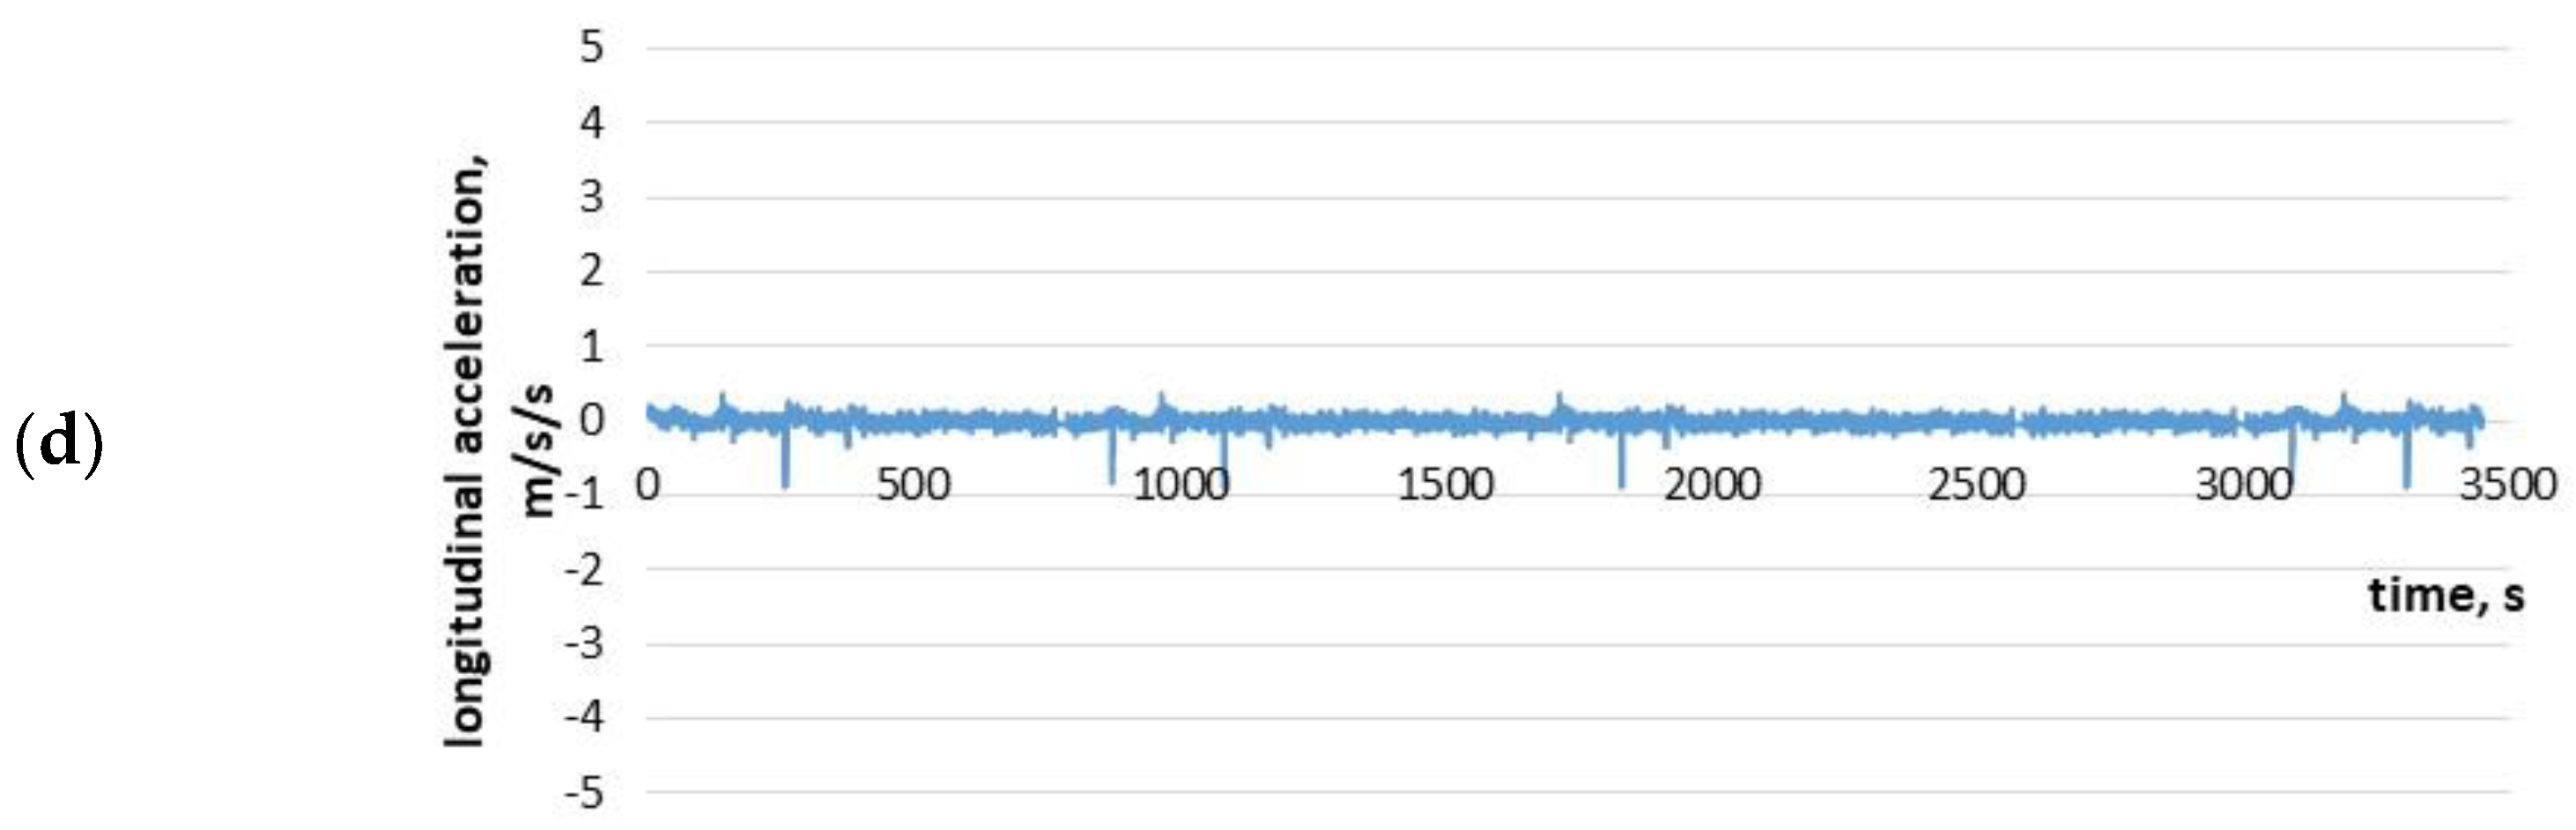
An analysis of the positive longitudinal acceleration values (vehicle acceleration) confirms the thesis about the strong impact of the road type on the occurring acceleration values. This conclusion can be drawn when observing the movement on particular roads, but this would be a qualitative conclusion. As result of the conducted testing, it is possible to formulate more specific quantitative conclusions. The charts’ top parts presented in
Figure 3 demonstrate that there is great diversity in the occurring values and in the variety of them. The urban area road features the highest values and the greatest variety of values. Both features clearly decline on other road types (the single-roadway extra-urban road, and the expressway) and are lowest on the motorway. It can be stated that on the other road types, the driving becomes ‘smoother and easier’ despite the fact that higher speeds are involved. Additional confirmation of this are the maximum values provided in
Table 1, amounting respectively to: 3.17, 2.61, 0.8 and 0.36 m/s
2.
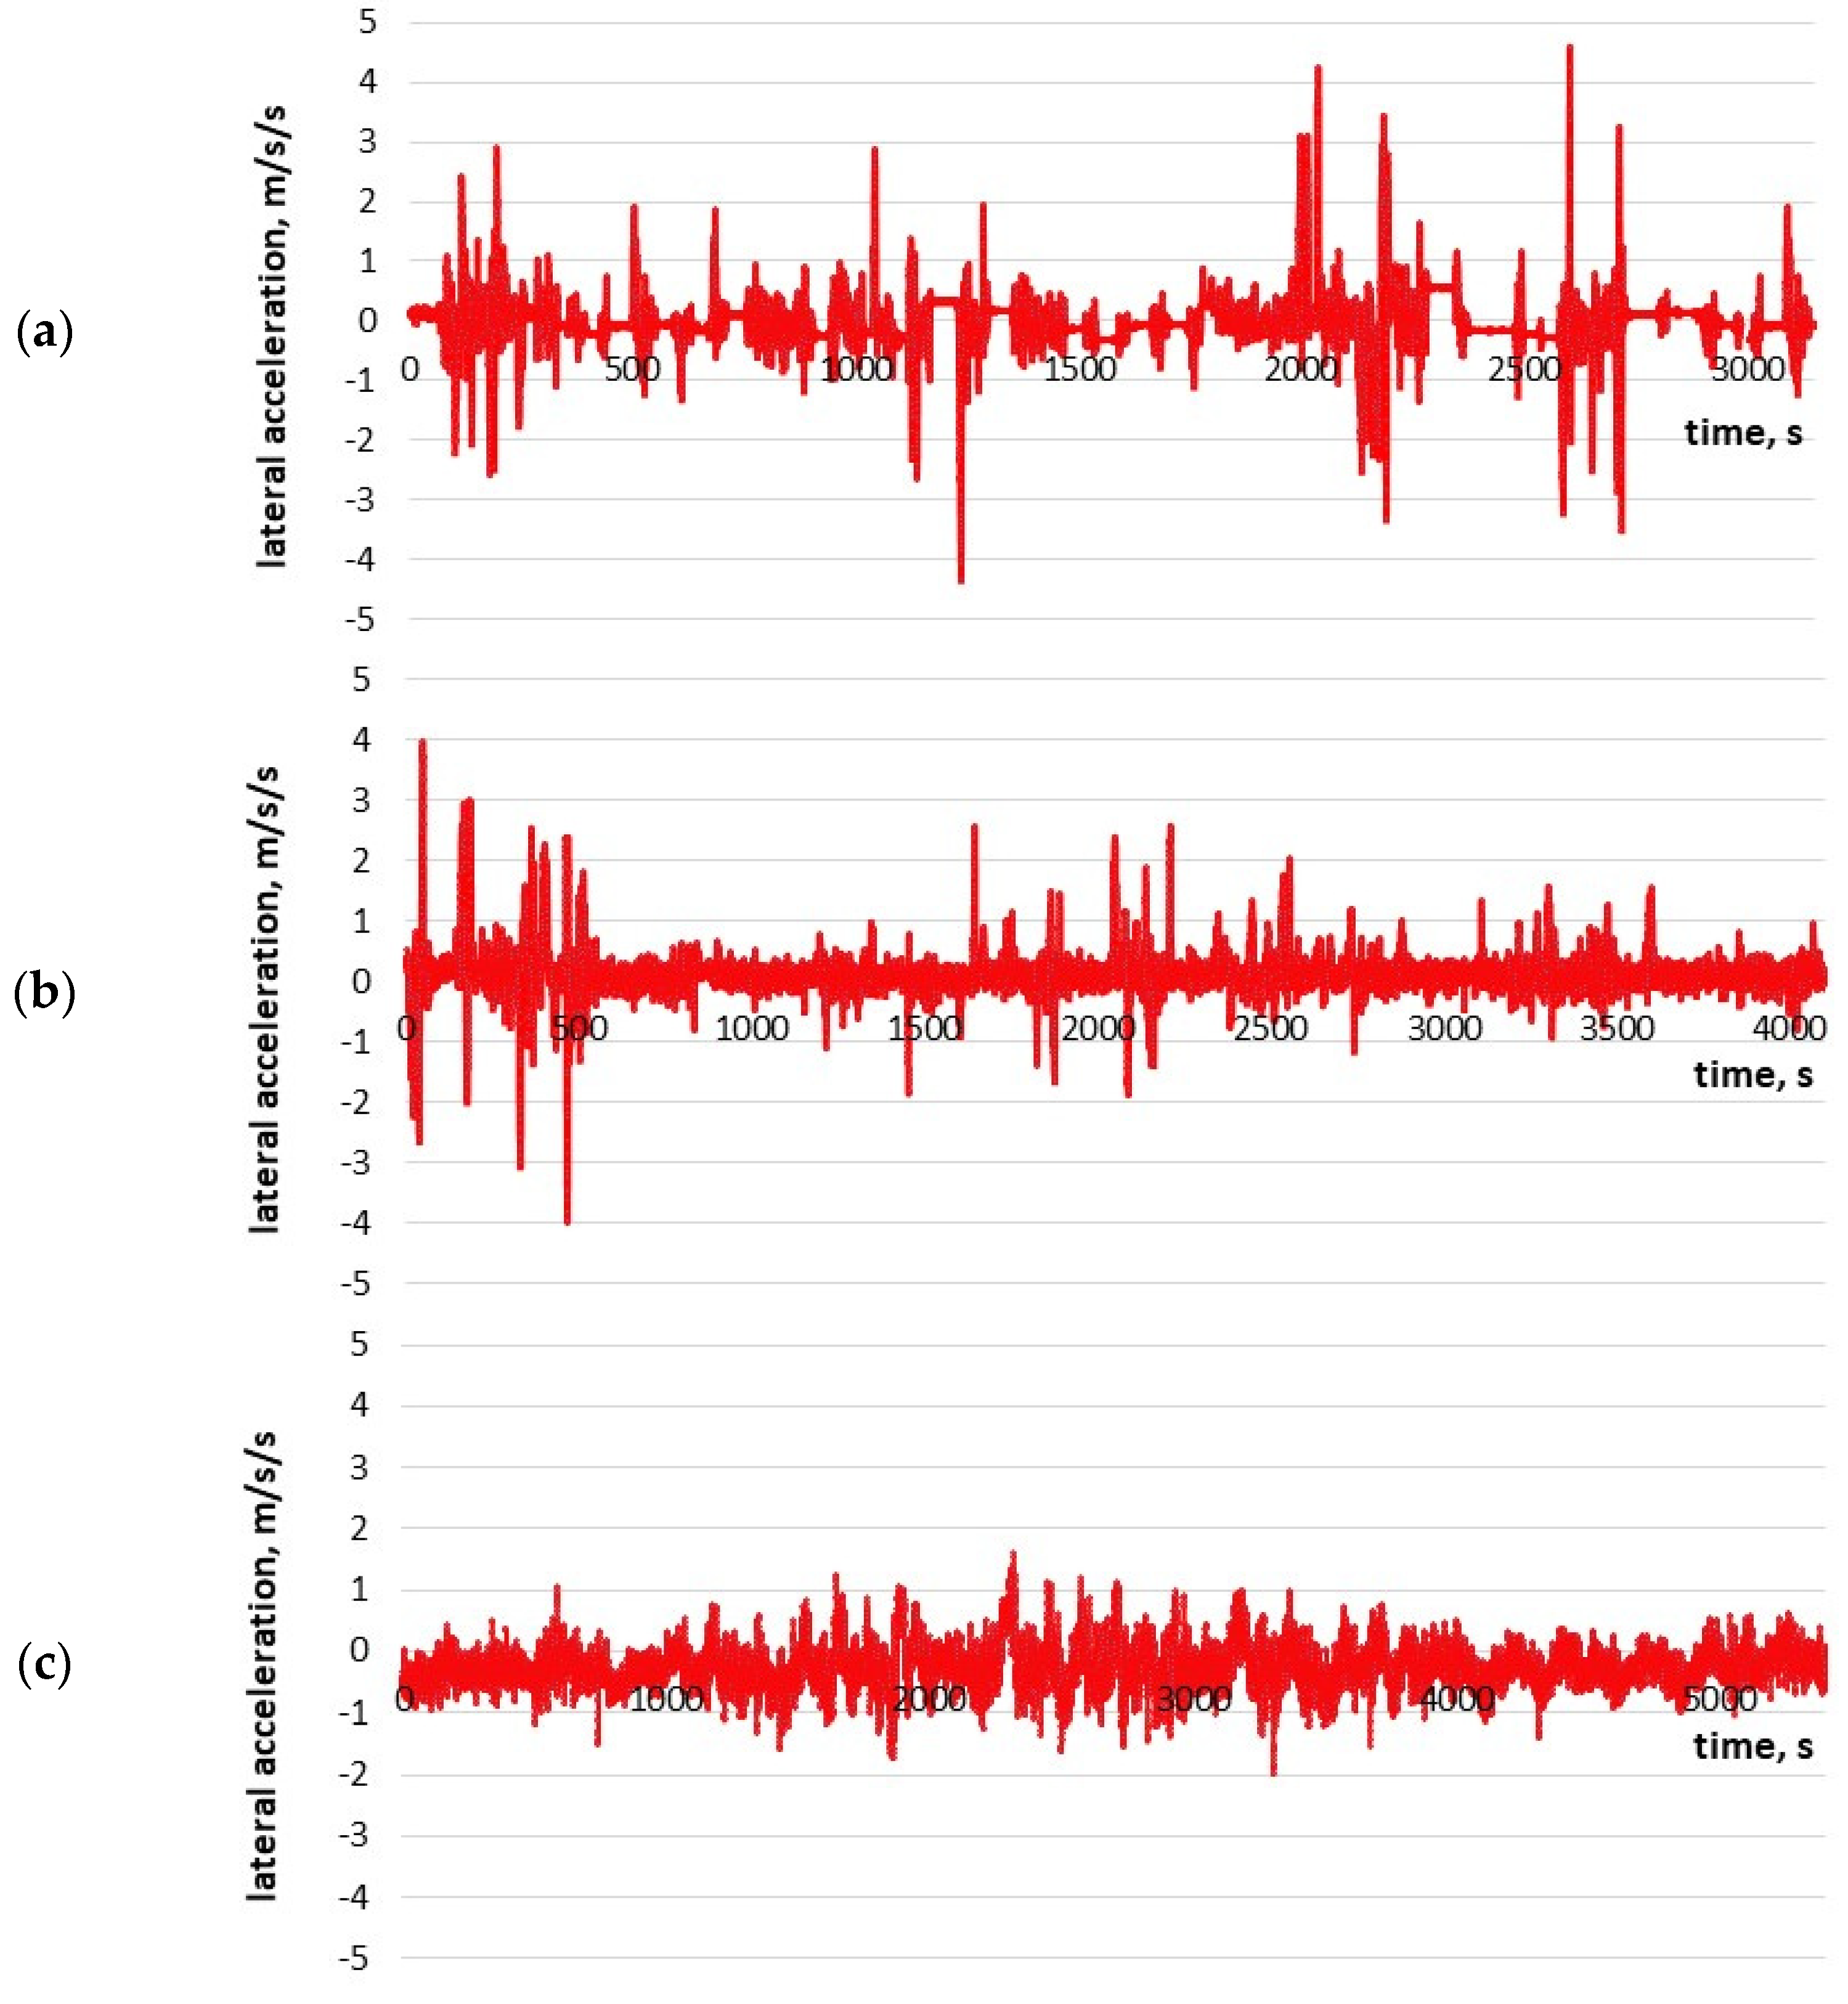
A similar regularity applies to negative acceleration, i.e., delays occurring at deceleration. The bottom parts of the charts in
Figure 4 show the same gradation of roads in terms of the occurring values and their variety (if the value −3.2 m/s
2 line 3 of
Table 2 is omitted, considering that according to
Figure 3, it was an effect of the driver’s one-time reaction to a dangerous situation, which can occur on any road).
In the case of the lateral acceleration values shown in
Figure 4 and in
Table 2, the road gradation in terms of the occurring values and their variety is the same as in the case of the longitudinal acceleration values.
The longitudinal acceleration distributions enable a more precise analysis of movement on particular road types. Each of the four charts features an overwhelming dominance of acceleration values in the range of 0.5 to −0.5 m/s2. The share of these acceleration values amounted from 61.9% for the urban area road up to 99.5% for the motorway. In the analysis of the longitudinal acceleration values, the authors distinguished this interval and treated it conventionally, based on initial analyses, as driving at an approximately constant speed. When driving at a constant speed, there is some minor acceleration depending on the topography (e.g., driving up and down gentle slopes), gentle acceleration by several and up to over a dozen km/h to a new constant value, etc.
The lateral acceleration distributions also show an overwhelming dominance of acceleration values in the range of 0.5 to −0.5 m/s2. The share of these acceleration values fluctuates from 80.1 to 95.1% on particular road sections. However, no gradation visible for longitudinal acceleration values has occurred in this case. Additionally, in this case, based on an analysis of the recorded vehicle movement parameters, the authors distinguished the aforementioned interval and deemed that the lateral acceleration values point to smooth cornering and smooth overtaking, bypassing, or traffic lane changing, which can also be deemed as ‘smooth driving’.
The overwhelming dominance of driving conventionally referred to as ‘smooth driving’ on the longitudinal and lateral acceleration charts renders the shares of driving at other acceleration values very small. However, in terms of the synthetic attempt of evaluating the driving techniques of different drivers, these other cases are very important. To analyze them more precisely, the sections of driving at acceleration values of −0.5 to 0.5 m/s2 were excluded from further analysis. This allowed for the evaluation of the structure of other longitudinal and lateral acceleration values.
The longitudinal and lateral acceleration values (in a time function) after the aforementioned modification were presented in
Figure 8 and
Figure 9 accordingly. The charts presented in the figures more clearly show the differences in movement on particular road sections (especially for the longitudinal acceleration).
After excluding the conventional ‘smooth driving’ from the analysis, the longitudinal acceleration distributions demonstrate shares of driving at other (positive and negative) acceleration values. These charts clearly show that the acceleration value distributions become more focused along with increases in the road standard. A similar conclusion can be formulated for the analysis of lateral acceleration distributions. However, in this case, there is a similarity in the distribution’s focus for roads 1 and 2, while distributions for roads 3 and 4 are much more focused (but similar to one another).
The analysis benefits most from the presentation of acceleration distributions not in the form of bar graphs, but the in the form of curves. The longitudinal acceleration distribution curve charts demonstrate that the acceleration distribution for the urban road is the least focused and, therefore, its modal value is the smallest. The curves for roads 2 (extra-urban) and 3 (expressway) are asymmetric but have a similar focus and similar modal values. The acceleration distribution for the motorway, after the aforementioned modification, is the most focused and features only a single column. The driving’s monotonicity increases along with the increasing distribution focus.
Figure 12 shows that each of the longitudinal acceleration distribution curves has a different and individual shape, therefore the road type on which the driving was taking place can be recognized based on the curve’s shape.
In the case of the lateral acceleration values, their distribution curves also have individual shapes. However, interesting conclusions can be drawn when applying absolute value distribution curves. It turns out that when pairing the urban (1) and extra-urban road (2) as well as the expressway (3) and motorway (4), the curve charts are nearly identical. This means that in terms of the lateral dynamics, the vehicles’ movement on each of the roads in the given pair is very similar.


