Article

Use of Bioluminescence for Monitoring Brown Coal Mine Waters from Deep and Surface Drainage

by
Ryszard Staniszewski
1,
Dorota Cais-Sokolińska
2,*,
Łukasz K. Kaczyński
2 and
Paulina Bielska
2
1
Department of Ecology and Environmental Protection, Faculty of Environmental and Mechanical Engineering, University of Life Sciences, 94C Piątkowska Street, 60-649 Poznań, Poland
2
Department of Dairy Products Quality, Faculty of Food Science and Nutrition, Poznań University of Life Sciences, 31 Wojska Polskiego Street, 60-624 Poznań, Poland
*
Author to whom correspondence should be addressed.
Energies 2021, 14(12), 3558; https://doi.org/10.3390/en14123558
Submission received: 10 May 2021 / Revised: 10 June 2021 / Accepted: 13 June 2021 / Published: 15 June 2021
(This article belongs to the Section B: Energy and Environment)

Abstract

:
Open-pit mines can cause environmental changes, such as alterations of landscape structure, hydrology, air quality, and river sediments; they can also generate cones of depression. We propose a new method for surveys of mine waters using the example of an open-pit mine in central Poland. This study examines the correlations between bioluminescence and the color of brown coal mine waters and tests whether values of the three-color coordinate system reflected the physicochemical quality of mine waters measured in real-time and in the field. Our results show that alkalinity, pH reaction, and conductivity are higher in surface drainage, while values of trophic parameters (soluble reactive phosphates, total phosphorus, nitrates) are greater in samples representing subsurface drainage. Correlation analysis of bioluminescence with mine water quality parameters showed that only water color had a strong association with bioluminescence. This correlation is stronger for surface drainage, than for mine waters from subsurface drainage. Direct measurement of bioluminescence, resulting from adenosine 5`-triphosphate (ATP) using a luminometer, is a fast and reliable method for evaluation of the characteristics of mine waters in real-time.

1. Introduction

Brown coal is an important natural resource for electric power generation in several countries, e.g., Germany, Turkey, China, Poland, Russian Federation, Greece, and others. The top brown coal producers in the European Union are Germany, followed by Poland [1]. In all those countries, the impact on aquatic and terrestrial ecosystems can be observed near operating and closed open-pit mines. Amongst several environmental effects of open-cast mines in the presence of cone of depression in the surrounding area, which affect not only groundwater table, but also the availability of surface waters, due to drying out of small lakes, ponds, and even watercourses. This phenomenon is an unavoidable consequence of the drainage of brown coal deposits [2,3]. This complicates the hydrological situation, especially in areas with frequent hydrological droughts. Open-mines activity can limit the agricultural usefulness of organic soils, due to changes in moisture and subsequently the physicochemical properties [4]. The quality of mine waters differs according to the type of drainage. In general, waters from deep-seated drainage had good quality in terms of transparency, salinity, and presence of heavy metals. Another type, from surface drainage, had poorer quality, and it was related to the presence of ions and especially to turbidity [5].
Environmental problems related to the lignite open-pit mines have been surveyed by only a limited number of authors and studies, mostly concerning impacts on groundwaters, mine waters volume, impact on agriculture, landscape changes, air quality modifications, and treatment processes, but omitting mine waters impact on river ecosystem [3,6,7,8,9].
Physicochemical parameters of brown coal mine waters differ between regions, i.e., mine waters can have variable concentrations of trace elements, total phosphorus, or conductivity [5]. In some areas, reactions causing low pH in the mine waters are linked to the problem of acid mine drainage (AMD), an additional environmental impact of mining [10]. In general, two types of brown coal mine waters can be distinguished: Surface mine waters and deep-seated drainage. The most visible differences between them are transparency (much higher in deep drainage), turbidity (higher in surface drainage), temperature, and oxygen concentrations (deep drainage waters tend to be deoxygenated).
Deep drainage mine waters are normally clean enough to be discharged directly to rivers, and sometimes its quality is good as in drinking waters. Mine waters from surface drainage require treatment in settling ponds to reduce turbidity and to improve physicochemical quality, e.g., reduction of concentrations of phosphorus or selected metals.
In this study, we investigated the (possibly innovative) method for evaluating overall metabolic activity in mine water by measuring the amount of adenosine 5`-triphosphate (ATP) using bioluminescence. The method was very fast, relatively cheap, and easy to use even under field conditions. This method allows researchers to determine the whole pool of ATP present in bacteria, protozoa, and fungi cells. Bioluminescence is a widespread phenomenon in nature and involves the production of light by living organisms [11]. Light is related to the enzymatic oxidation of luciferin catalyzed by luciferase [12]. The reaction requires ATP and ions of magnesium. ATP is present in every living cell (bacteria, fungi, and protozoa) and material of biological origin. It acts as an energy carrier and participates in the metabolic processes of cells. Dead cells do not contain ATP. ATP is then hydrolyzed to adenosine-5′-diphosphate (ADP) or adenosine-5′-monophosphate (AMP). Oxidation produces an activated OxyLH2 (oxyluciferin) molecule. The return from the activation state to a lower energy state is associated with releasing large amounts of free energy, which can be measured as emissions of light quanta. Hammes et al. [11] studied the viability of natural microbial communities in aquatic environments, such as drinking water, groundwater, bottled water, river water, lake water, and wastewaters. They found that the average ATP concentration was 1.75 × 10⁻¹⁰ nmol/cell. The authors have experience in using ATP analyses to assess the state of surface cleanliness of abiogenic materials used in the food industry [13,14]. One component of the research was to examine correlations between bioluminescence and the color of brown coal mine waters, and to test whether values of the three-color coordinate system reflected the physicochemical quality of mine waters. Another question investigated was whether biochemical parameters that differentiated mine waters from other waters influenced chroma.
We hypothesized a relationship exists between the metabolic activity in surface and deep mine water drainage and the color of the water measured in real-time and in the field. Outcomes of this study can be the first steps toward establishing a new and fast microbiological method helpful in mine water quality assessment. Traditional methods of enumerating microorganisms are laborious, and above all, time-consuming [15], averaging 72 h, and in some cases up to 7 days [16]. The significance of studies to evaluate mine-water effects on the river ecosystem was also related to the need to precisely identify full mixing zone length. Knowing this length is important because of the possible need to shorten this path [17], for example, by changing of river width or introducing deflectors. This understanding is particularly important in an era of moving away from coal as a power resource and trying to reduce the environmental impact of mining and coal power generation, which will be slowly phased out through 2040 [18].

2. Materials and Methods

2.1. The Sampling of the Brown Coal Mine Waters

Mine waters were sampled from two channels at the Tomisławice open-pit mine, located in central Poland (latitude 52°29′8″ N, longitude 18°30′9″ E).
All mine water samples were collected in 0.5 L polyethylene bottles and transported to the laboratory on ice, within 6 h. Surface samples of mine waters were collected in the middle of the channels. To maintain sampling precision, the sampler faced upstream, and each water sample was collected without disturbing channel sediments. Special attention was paid to avoid contaminating PVC samplers during storage, and they were rinsed with the waters to be sampled before final sampling and transport on ice.
Tomisławice open-pit mine waters were sampled (n = 11) in April and June 2019. It was a vegetation season of the year suitable for studies of the freshwater ecosystem in the case of biological aspects. Waters were sampled at two sites. Site A was situated on an artificial concrete channel where mine waters from deep drainage were discharged. Site B was located in the channel of the Pichna River (actually dry near a pit mine), where surface drainage was released (after treatment in a settling pond and mixing with waters from deep-seated drainage in about 10 to 1 proportion).

2.2. Physicochemical Analyses

The following chemical analyses of mine waters were performed using a HACH spectrophotometer DR2700 using surface samples collected during field studies [19,20,21]. Soluble reactive phosphorus (SRP): Samples were filtered through 0.45 μm pore size Whatman membranes and analyzed by the ascorbic acid method. Nitrates: Samples were filtered as for SRP and analyzed by the cadmium reduction method. Total phosphorus (TP) was analyzed by the acid persulfate digestion method, without filtration.
Conductivity and pH were measured in the field. The apparent and true color of mine waters were analyzed using laboratory test methods: Apparent color by the HACH APHA Platinum-Cobalt standard, and true color by the same standard after filtration.

2.3. Water Activity

Water activity, an indicator of the potential for microbial development, was analyzed with an AquaLab Series 4TE instrument (Decagon Devices Inc., Pullman, WA, USA) equipped with a thermostatic chamber controlled using measuring elements using the thermoelectric Peltier effect. Higher values of aw indicate more potential for microbial development in the sampled water. Water activity (aw) is the ratio of the vapor pressure of water in a material p (Pa) to the vapor pressure of pure water po (Pa) at the same temperature [22]. The accuracy of the measurement was ±0.003 aw (Pa/Pa) and the measuring range 0.03–1.000 aw. The following salt solutions were used for reference: 0.5 M KCl (aw = 0.984 Pa/Pa at 15 °C), 6 M NaCl (aw = 0.760 Pa/Pa at 20 °C), 8.57 M LiCl (aw = 0.500 Pa/Pa at 25 °C) and 13.41 M LiCl (aw = 0.250 Pa/Pa at 25 °C). Samples of volume = 15 mL were placed in a DE 501 measurement vessel (Decagon Devices Inc., Pullman, WA, USA) and tested at 15 °C.

2.4. Freezing Point

The freezing point of the water was determined according to the ISO 5764 [23] (In ISO 5764 (2009). Milk-Determination of freezing point—Thermistor cryoscope method Reference Method. IDF bulletin N° 42. Brussels, Belgium: International Dairy Federation. WAITDELETE) standard method using an Advanced® Model 4D3 cryoscope with a 3LH700 thermistor probe (Advanced Instruments Inc., Norwood, MA, USA). The calibration process was carried out using calibration standards −0.422 °H (−0.408 °C), −0.621 °H (−0.600 °C), and Lactrol 530 reference solution −0.530 °H (−0.512 °C) for use with Advanced Instruments cryoscopes. The water was poured into 2 mL sample tubes (DZ 3LA823, Advanced Instruments Inc., Norwood, MA, USA).

2.5. Bioluminescence

Bioluminescence in mine water samples of 0.15 mL was based on ATP analyses with a luminometer (FireFly Charm Sciences Inc., Malden, MA, USA) and swabs (PocketSwab Plus Charm Science Inc., Lawrence, KS, USA). Measurements were performed following the instructions of the manufacturers of the meter and swabs, and recorded in relative light units (RLU). The temperature of the samples during the measurement was 6–10 °C.

2.6. Color

Color measurements were based on the CIELAB color space. A water sample was placed in an optical glass cuvette 2/96G/10 (Starna Scientific Company Ltd., Ilford, UK). The measurement was performed with a D65 light source, and a 10° observation angle, with geometry SPIN, using an X-Rite SP-60 camera (Grandville, MI, USA) equipped with spherical geometry (diffusive), and a measurement chamber with a DRS-811 ceramic insert. The camera was calibrated based on the white and black reference standards SP-62–162 (Grandville, MI, USA). The chroma (C*) was calculated using Equation (1) and whiteness index (WI) using Equation (2). The calculations assumed that ideal white is defined by L* = 100, a* = 0, and b* = 0.
C* = [(Δa*)2 + (Δb*)2]0.5
WI = [(ΔL*)2 + (Δa*)2 + (Δb*)2]0.5

2.7. Statistical Evaluation

For tests of statistical hypotheses, a level of significance of p = 0.05 was adopted. A one way analysis of variance was conducted to test properties of water from the surface versus deep mine drainage for thirteen items (traits) within physicochemical characteristics and color parameters. The statistical calculations were carried out using Statistica data analysis software, version 13 (TIBCO Software Inc., Palo Alto, CA, USA).

3. Results

3.1. Basic Chemical Composition and Selected Quality Characteristics

The type of mine water affected nitrate concentrations and alkalinity (p > 0.05, Table 1). Differences also were observed in pH and conductivity. Water activity from deep drainage (sample A; aw = 0.974 Pa/Pa) was similar to aw in surface drainage (0.971 Pa/Pa, Figure 1). No effect of mine water type on freezing point was found (p > 0.05, Figure 1). The mean freezing point of deep mine waters was −0.015 °C, and from surface drainage −0.019 °C. Freezing points ranged between −0.022 and −0.011 °C.
Surface drainage waters were turbid and had higher values of parameters, such as like pH reaction, conductivity, and alkalinity (Table 1). On the contrary, surface drainage had lower mean values of trophic parameters in comparison to deep-seated drainage, including nitrates (mean value equal to 0.09 mg N-NO3/L), soluble reactive phosphates (mean 0.35 mg PO4/L), and total phosphorus (mean 0.26 mg P/L). In waters from deep-seated drainage, the pH reaction ranged from 7.8 to 8.2 and conductivity from 0.536 to 0.624 mS/cm, while in the case of surface drainage, the range of pH was from 7.9 to 8.4, and conductivity was also higher and varied from 0.676 to 0.710 mS/cm. Surveyed water quality parameters were far below thresholds established by the Regulation of the Minister of Maritime Economy and Inland Navigation [24] for maximum permissible values for other pollutants that those particularly harmful to the aquatic environment.
Mine waters from surface drainage are normally very turbid and could not be discharged directly to rivers. They were treated in settling ponds, and iron coagulant was added to improve the rate of purification. Iron coagulants are widely used to remove phosphorus compounds and, to some extent, hydrogen sulfide. It could explain the low concentration of SRP and TP in this kind of mine waters. Even after treatment, surface mine waters are characterized by high values of conductivity, due to solids remaining in waters despite the treatment. Mine waters from deep-seated drainage have lower conductivity and also lower pH. Low conductivity is predominant in such waters, and because of predominantly good chemical quality, they can be used as drinking water. Mine waters from deep-seated drainage have a lower pH reaction, due to CO2 and limited concentration of dissolved oxygen (tertiary and quaternary waters). Higher concentrations of phosphorus could be explained by the geological characteristics of open-pit mines; this phenomenon was also observed in nearby pit mines.
Experimental results by Ming et al. [25] show that the freezing point is related to the energy status of liquid water in saline soils. The freezing point becomes lower the greater the salt concentration. The freezing point depression of saline soil is mainly caused by the decrease in water activity. This measurement of the freezing point is relevant for, e.g., engineering construction in saline soil areas. There is a dependency of the freezing points on the contents in mineral salts. According to Martuzzi et al. [26], the freezing point in raw materials of animal origin decreases when mineral salts are increased. Furthermore, the freezing point also depends on the biochemical composition of the soluble phase; thus, 55% of the total variability was associated with lactose, 25% with salts, especially Cl, and the remaining 20% by Ca2+, K+, Mg2+, lactate, citrate, and phosphate. The presence of such solutes causes depression of the freezing point below zero degrees C [27].

3.2. Color Parameters, Color and Whiteness Indices

In the case of mine waters from deep-seated drainage, both apparent and true color of water was similar to drinking water with values below 10 Pt/Co (Table 2). Turbidity of surface drainage was proved by apparent water color with a maximum value equal to 62 Pt/Co and a mean value equal to 39 Pt/Co.
The whiteness index for deep and surface mine waters (26.01 and 25.31%, respectively) did not differ significantly (p > 0.05, Table 2). Both types of mine waters were the same distance from the model of perfect white by about 74%. There were also no differences in parameter a*, the –green/+red axis (−0.06 and −0.04, respectively, p > 0.05). The –blue/+yellow axis parameter was −0.54 in sample A) and −0.03 in sample B. This difference represented a significant color effect (p < 0.05).

3.3. Bioluminescence and Correlation with Selected Quality Parameters

Earlier studies showed that biological indicators based on macrophytes, which are good measures of ecological state, were not suited for evaluation of mine waters. Differences were insignificant despite changes in species structure, thus biological diversity indices gave more accurate results [28]. But in this study, the two methods generated different answers. In such circumstances, an additional approach would be useful for determining the presence of brown coal mine waters in watercourses. This study has demonstrated that it is possible to use the luminometer directly in analyses of mine water bioluminescence, with almost immediate results. Bioluminescence measured in mine waters from deep drainage (186 RLU, P5–P95 from 168 to 204) was significantly different (p < 0.05) from luminometer results in surface mine waters (141 RLU, P5–P95 from 137 to 144, Figure 2).
Among these modern methods is ATP measurement using a luminometer. Deininger and Lee [19] proved that ATP tests can indicate the microbial quality of drinking water within 5 min. Their results showed that the rapid ATP test is strongly correlated with the conventional plate counting method and the DVC method (direct number of viable bacteria). In recent literature, ATP in water has rarely been reported in RLU units. More often, the data have been converted to ATP concentrations in pg/mL. The results of ATP measurements of samples of water supplied to dental instruments (air/water syringe, high-speed turbine, micromotor, and cup filler) ranged from 6 to 1189 RLU [29].
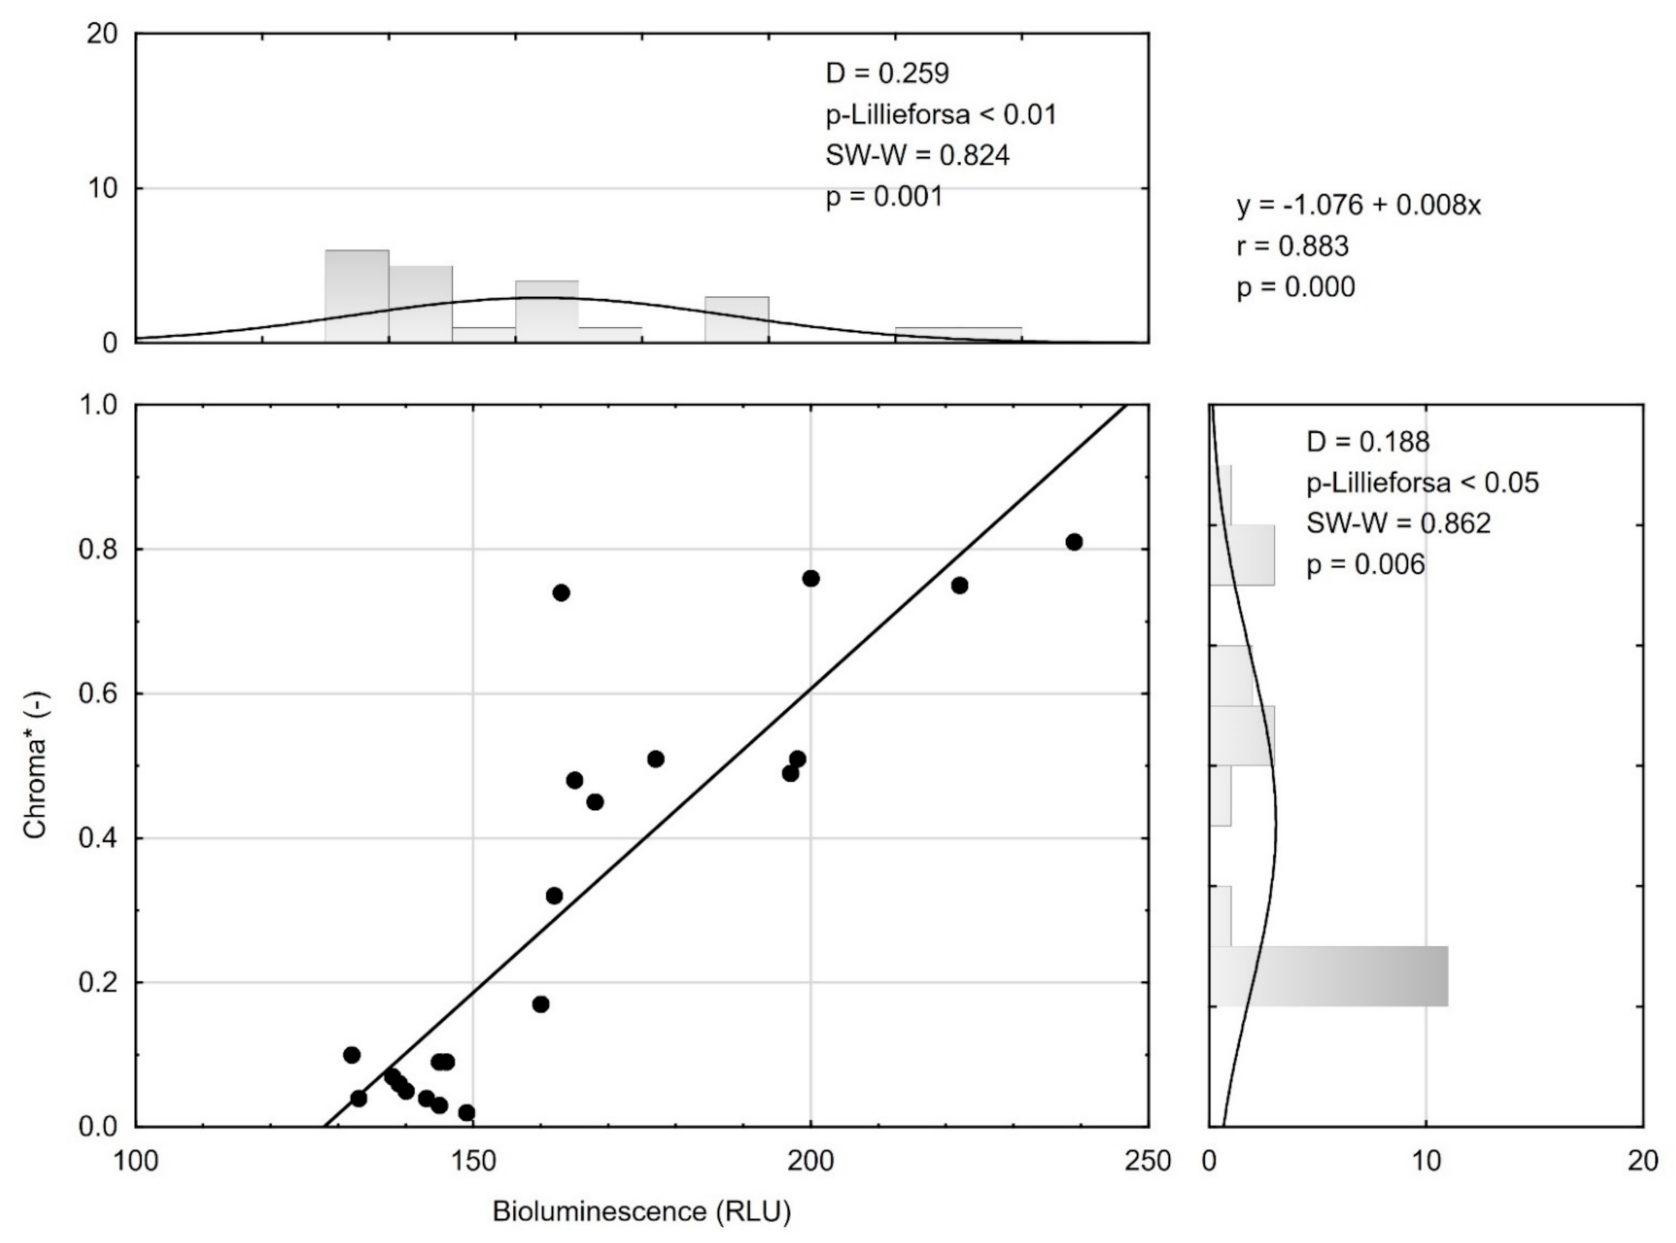
In correlation analysis of bioluminescence with other mine water quality parameters (Table 3), only water color had a strong association with bioluminescence (p < 0.05). This correlation was stronger for surface drainage (r = 0.879, WD = 77.31), than for mine waters from deep drainage (r = 0.697, WD = 48.61). Combining the two types of mine water in a joint analysis resulted in a stronger correlation between water color and bioluminescence (r = 0.883, WD = 77.97), demonstrating that the probabilities were additive (Figure 2).
Magic-Knezev and Van Der Kooij [30] proved that ATP concentrations correlated significantly with total direct bacterial cell counts in 30 different granular activated carbon filters (GAC) at nine treatment plants in the Netherlands. The ATP concentrations ranged from 25 to 5000 ng ATP cm−3 GAC. The ATP assay was more efficient in the detection of contaminants than total direct counts [31]. Authors have used ATP measurement to detect microbial activity in mine waters from the surface (turbid mixed waters) and deep-seated drainage. Compared to traditional microbiological methods, the ATP assay could detect contamination by mine waters or other effluents of river and drinking waters to a higher degree than total direct counts. Studies by Li et al. [32] showed that ATP luminescence had a strong correlation with bio-growth in reclaimed waters. These authors proposed combining ATP luminescence with assimilable organic carbon, which provides a new approach for monitoring the biological stability of reclaimed waters. Measurement of ATP was an effective method for assessment of active biomass of acidophilic microorganisms in pure cultures and in leach liquors from mineral bio-processing operation [33].
Analyses of bioluminescence were correlated with optical density measurements, as shown by Greenstein and Wert [34] in studies related to monitoring and treating cultured and naturally occurring cyanobacteria cells in surface water. Measurements of ATP correlated (R2 = 0.791) with chlorophyll-a concentrations (≤50 μg/L). These values were independent of cell morphology artifacts. ATP analysis circumvents interferences, e.g., from turbidity and light scattering particles [35] or from natural organic matter and organic matter released from cells [36]. Bioluminescence was used to rapidly detect microbial contamination in aqueous polymer emulsions by Montanez et al. [15]; the method was easy to execute, with repeatable results. A high coefficient of determination (R2 > 0.960) was observed to correlate measured cellular ATP and culturable microbes in aqueous polymer emulsions.

4. Conclusions

Differences between studied mine waters were found according to all physicochemical parameters. Mine waters from deep-seated drainage had lower conductivity and pH reaction, but slightly higher values of trophic parameters. Much more clear variability was observed in the case of ATP analyses.
To our knowledge, this is the first report on the successful use of ATP detection to assess the quality of mine waters. Given the worldwide importance of the mining problem, each possibility for a more scientifically precise evaluation of mine water quality should be considered. As a result of these initial studies, we can report that direct measurement of bioluminescence resulting from ATP, using a luminometer, is a fast and reliable technique for evaluating the characteristics of mine waters in real-time. There is a strong and positive correlation between bioluminescence measured in mine waters in the range 132–239 RLU and water chroma (Figure 2). Mine waters from surface drainage contained significantly less ATP than mine waters from deep drainage (Table 2). It means that in clean mine waters from deep drainage, conditions for the development of microorganisms were better than in the case of surface drainage.
Detection of ATP could be used in the future to estimate the mixing ratio of subsurface drainage in mixed discharges of the two types of lignite mine waters, and to identify mixing zone length and the point of complete mixing in rivers affected by sewage discharge. According to earlier studies [5], knowledge of this length is crucial for estimating the environmental impact of this sector of industry on aquatic ecosystems. Our results can be used where there is a need to shorten the length of the mixing path, and thus, to minimize side effects of mining and energy generation.

Author Contributions

Conceptualization, R.S. and D.C.-S.; methodology, R.S. and D.C.-S.; investigation, P.B.; resources, Ł.K.K.; writing—original draft preparation, D.C.-S. All authors have read and agreed to the published version of the manuscript.

Funding

This research was funded by Polish Ministry of Science and Higher Education, grant number 506.868.06.00/UPP.

Institutional Review Board Statement

Not applicable.

Informed Consent Statement

Not applicable.

Data Availability Statement

The data presented in this study are available on request from the corresponding author.

Conflicts of Interest

The authors declare no conflict of interest.

References

  1. Eurocoal. Coal in Europe. 2019. Available online: https://euracoal.eu/info/euracoal-eu-statistics/ (accessed on 30 October 2020).
  2. Wachowiak, G.; Galiniak, G.; Jończyk, W.; Martyniuk, R. Evaluation of outflow changes in the Widawka river basin in the hydrological year 2010 under the impact of a mining and energetics project in the Bełchatów region. Górnictwo i Geoinżynieria 2011, 35, 381–395. (In Polish) [Google Scholar]
  3. Pepliński, B.; Czubak, W. The influence of opencast lignite mining dehydration on plant production—a methodological study. Energies 2021, 14, 1917. [Google Scholar] [CrossRef]
  4. Domska, D.; Raczkowski, M. Effect of strip mine activity on changes of some physicochemical properties of soil. Acta Agroph. 2008, 12, 73–77. [Google Scholar]
  5. Staniszewski, R. Heavy metals in waters and sediments of rivers affected by brown coal mine waters. Pol. J. Environ. Stud. 2014, 23, 2217–2222. [Google Scholar] [CrossRef]
  6. Hildmann, E.; Wonsche, M. Lignite mining and its after-effects on the Central German landscape. Water Air Soil Pollut. 1996, 91, 79–87. [Google Scholar] [CrossRef]
  7. Kavouridis, K. Lignite industry in Greece within a world context: Mining, energy supply and environment. Energy Policy 2008, 36, 1257–1272. [Google Scholar] [CrossRef]
  8. Hancock, S.; Wolkersdorfer, C. Renewed demands for mine water management. Mine Water Environ. 2012, 31, 147–158. [Google Scholar] [CrossRef]
  9. Luo, H.; Zhou, W.; Jiskani, I.M.; Wang, Z. Analyzing characteristics of particulate matter pollution in open-pit coal mines: Implications for Green Mining. Energies 2021, 14, 2680. [Google Scholar] [CrossRef]
  10. Friese, K.; Hupfer, M.; Schultze, M. Chemical characteristics of water and sediment in acid mining lakes of the lusatian lignite district. In Acidic Mining Lakes; Environmental Science; Geller, W., Klapper, H., Salomons, W., Eds.; Springer: Berlin/Heidelberg, Germany, 1998. [Google Scholar] [CrossRef]
  11. Hammes, F.; Goldschmidt, F.; Vital, M.; Wang, Y.; Egli, T. Measurement and interpretation of microbial adenosine tri-phosphate (ATP) in aquatic environments. Water Res. 2010, 44, 3915–3923. [Google Scholar] [CrossRef]
  12. Yang, N.C.; Ho, W.M.; Chen, Y.H.; Hu, M.L. A convenient one-step extraction of cellular ATP using boiling water for the luciferin–luciferase assay of ATP. Biochem. Anal. 2002, 306, 323–327. [Google Scholar] [CrossRef]
  13. Cais-Sokolińska, D.; Pikul, J.; Wójtowski, J. Use of bioluminescence in the assessment of the degree of cleanliness of milk tanks in goat milk processing plants. Arch. Lebensmittelhyg. 2010, 61, 75–79. [Google Scholar] [CrossRef]
  14. Cais-Sokolińska, D.; Wójtowski, J.; Pikul, J.; Dobrzańska, A. An attempt at the specification of common cleanliness limits for abiotic surfaces in dairy processing plants based on ATP bioluminescence. Arch. Lebensmittelhyg. 2016, 67, 12–16. [Google Scholar] [CrossRef]
  15. Montanez, G.; Passman, F.; Machtiger, N.; Montemayor, R.; Whalen, P. Bioluminescence testing for rapid detection of microbial contamination in aqueous polymer emulsions. Int. Biodeterior. Biodegradation 2016, 114, 216–221. [Google Scholar] [CrossRef]
  16. Deininger, R.A.; Lee, J. Rapid determination of bacteria in drinking water using an ATP assay. Field Anal. Chem. Technol. 2001, 5, 185–189. [Google Scholar] [CrossRef] [Green Version]
  17. European Commission. Technical Background Document on Identification of Mixing Zones, EU Common Implementation Strategy Document “Guidelines for the Identification of Mixing Zones under the EQS Directive (2008/105/EC); European Commission: Brussels, Belgium, 2010; p. 34. [Google Scholar]
  18. Kaszyński, P.; Kamiński, J. Coal demand and environmental regulations: A case study of the Polish power sector. Energies 2020, 13, 1521. [Google Scholar] [CrossRef] [Green Version]
  19. HACH Company. Hach Methods Approved/Accepted by the USEPA, Colorado, USA. 1999, p. 12. Available online: https://www.hach.com/cms/documents/pdf/EPA (accessed on 30 October 2020).
  20. HACH. Water Analysis Guide. DOC316.53.01336. 2013. Available online: https://www.hach.com/WAH (accessed on 30 October 2020).
  21. Staniszewski, R.; Szoszkiewicz, K.; Zbierska, J.; Leśny, J.; Jusik, S.; Clarke, R.T. Assessment of sources of uncertainty in macrophyte surveys and the consequences for river classification. Hydrobiologia 2006, 566, 235–246. [Google Scholar] [CrossRef]
  22. Lewicki, P.P. Water as the determinant of food engineering properties. A review. J. Food Eng. 2004, 61, 483–495. [Google Scholar] [CrossRef]
  23. ISO. Milk-Determination of Freezing Point—Thermistor Cryoscope Method Reference Method; ISO 5764, IDF bulletin N° 42; International Dairy Federation: Brussels, Belgium, 2009. [Google Scholar]
  24. Regulation of the Minister of Maritime Economy and Inland Navigation of July 12, 2019 on substances particularly harmful to the aquatic environment and the conditions that must be met when discharging sewage into waters or soil, as well as draining rainwater or snowmelt to water or water devices. J. Laws 2019, 1311, 1–48. (In Polish)
  25. Ming, F.; Chen, L.; Li, D.; Du, C. Investigation into Freezing Point Depression in Soil Caused by NaCl Solution. Water 2020, 12, 2232. [Google Scholar] [CrossRef]
  26. Martuzzi, F.; Summer, A.; Formaggioni, P.; Mariani, P. Milk of Italian Saddle and Haflinger nursing mares: Physico–chemical characteristics, nitrogen composition and mineral elements at the end of lactation. Ital. J. Anim. Sci. 2004, 3, 293–299. [Google Scholar] [CrossRef]
  27. Navratilova, P.; Janstova, B.; Glossova, P.; Vorlova, L. Freezing point of heat-treated drinking milk in the Czech Republic. Czech J. Food Sci. 2006, 24, 156–163. [Google Scholar] [CrossRef] [Green Version]
  28. Staniszewski, R.; Jusik, S. Impact of mine waters discharge from open-pit lignite mine on river water quality. Rocznik Ochrona Środowiska (Annual Set Environ. Protect.) 2013, 15, 2652–2665. [Google Scholar]
  29. Watanabe, A.; Tamaki, N.; Yokota, K.; Matsuyama, M.; Kokeguchi, S. Monitoring of bacterial contamination of dental unit water lines using adenosine triphosphate bioluminescence. J. Infect. Hosp. 2016, 94, 393–396. [Google Scholar] [CrossRef]
  30. Magic-Knezev, A.; Van Der Kooij, D. Optimisation and significance of ATP analysis for measuring active biomass in granular activated carbon filters used in water treatment. Water Res. 2004, 38, 3971–3979. [Google Scholar] [CrossRef]
  31. Vang, Ó.K.; Corfitzen, C.B.; Smith, C.; Albrechtsen, H.J. Evaluation of ATP measurements to detect microbial ingress by wastewater and surface water in drinking water. Water Res. 2014, 64, 309–320. [Google Scholar] [CrossRef] [Green Version]
  32. Li, G.Q.; Yu, T.; Wu, Q.Y.; Lu, Y.; Hu, H.Y. Development of an ATP luminescence-based method for assimilable organic carbon determination in reclaimed water. Water Res. 2017, 123, 345–352. [Google Scholar] [CrossRef]
  33. Okibe, N.; Johnson, D.B. A rapid ATP-based method for determining active microbial populations in mineral leach liquors. Hydrometallurg 2011, 108, 195–198. [Google Scholar] [CrossRef]
  34. Greenstein, K.E.; Wert, E.C. Using rapid quantification of adenosine triphosphate (ATP) as an indicator for early detection and treatment of cyanobacterial blooms. Water Res. 2019, 154, 171–179. [Google Scholar] [CrossRef]
  35. Zamyadi, A.; Choo, F.; Newcombe, G.; Stuetz, R.; Henderson, R.K. A review of monitoring technologies for real-time management of cyanobacteria: Recent advances and future direction. Trac. Trends Anal. Chem. 2016, 85, 83–96. [Google Scholar] [CrossRef]
  36. Korak, J.A.; Wert, E.C.; Rosario-Ortiz, F.L. Evaluating fluorescence spectroscopy as a tool to characterize cyanobacteria intracellular organic matter upon simulated release and oxidation in natural water. Water Res. 2015, 68, 432–443. [Google Scholar] [CrossRef]
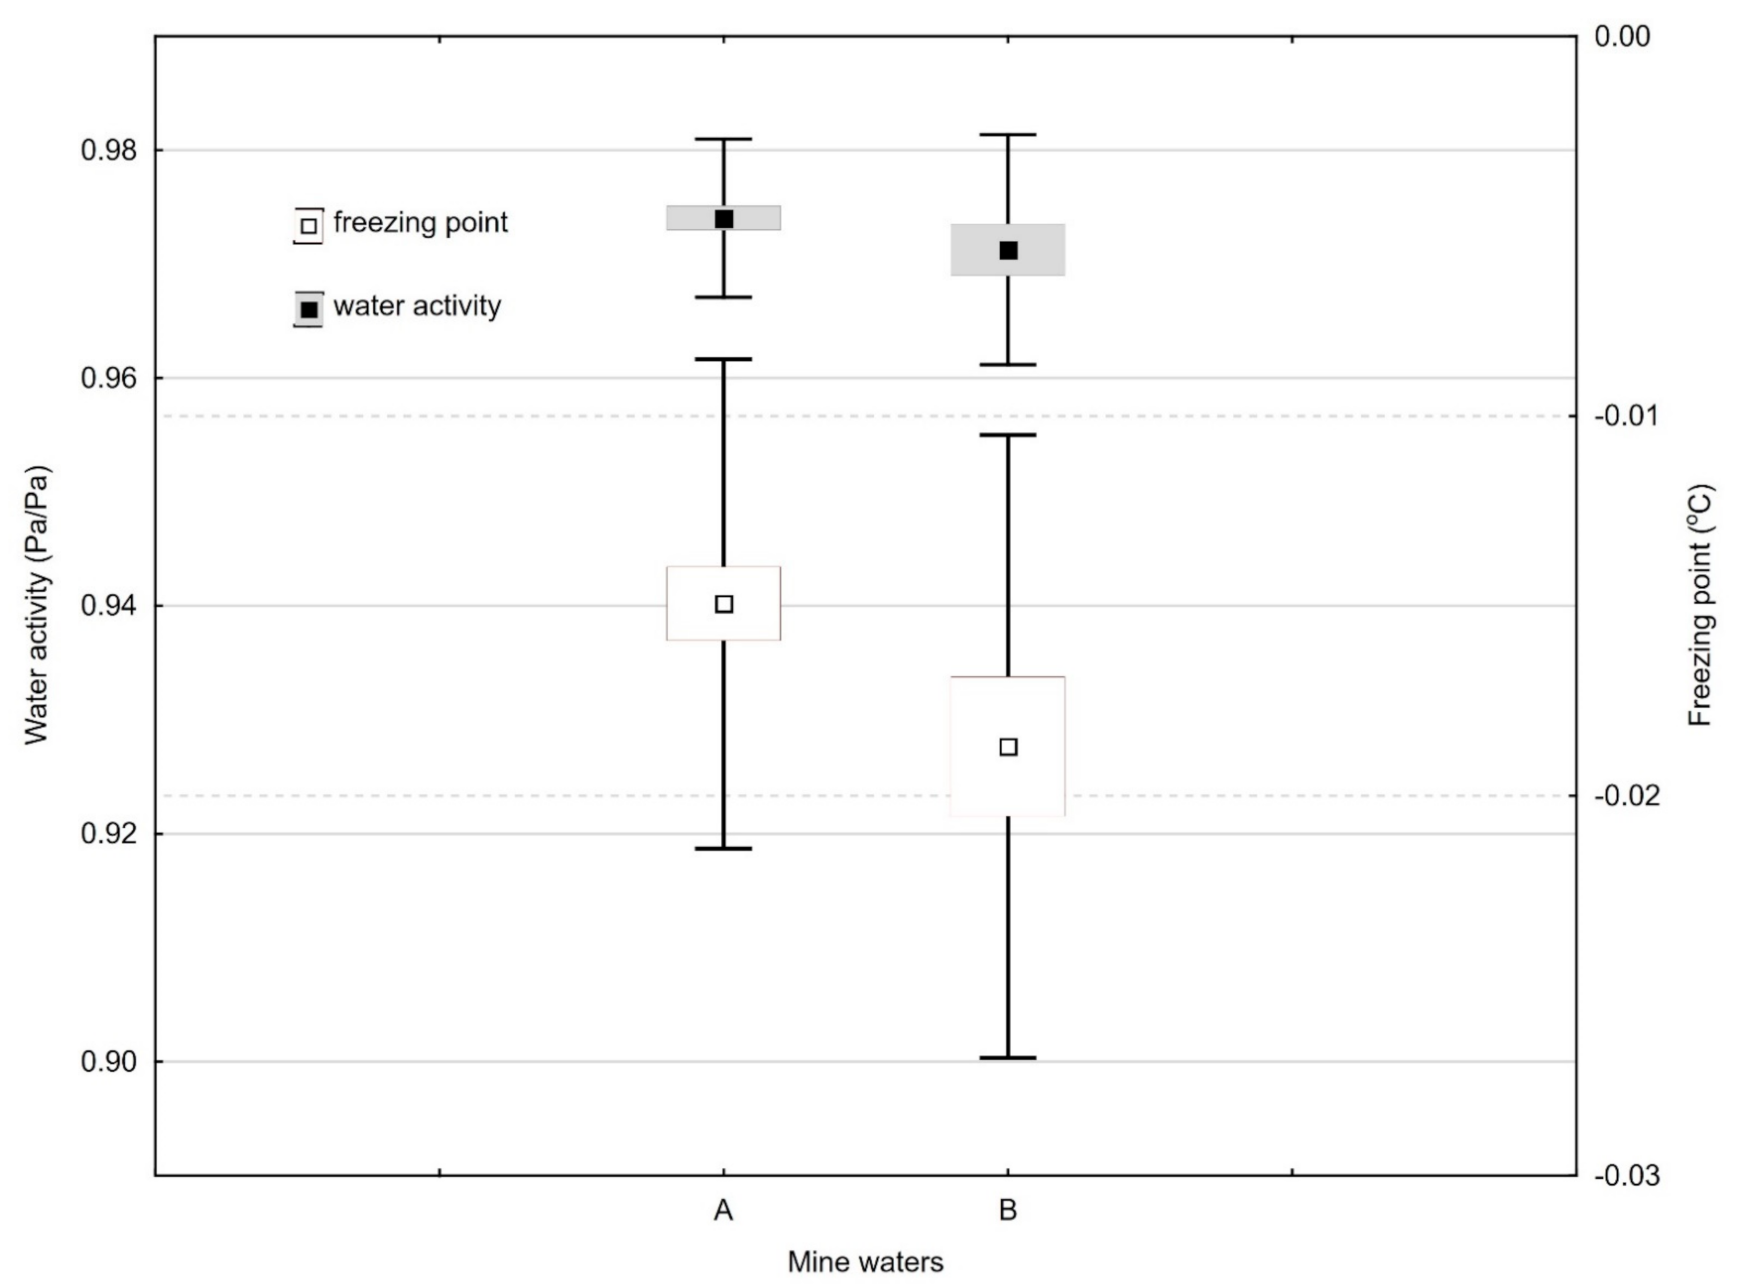
Figure 1. Water activity and freezing point of mine waters (mean ± SD; P5–P95). A, mine waters from deep-seated drainage; B, mine waters from surface drainage; SD, standard deviation.
Energies 14 03558 g001
Figure 2. Relative probability of distribution of bioluminescence and chroma of mine waters despite the type of mine waters (n = 22). SW-W, Shapiro-Wilk test; D, value of the test statistic Lilliefors test.
Energies 14 03558 g002
Table 1. Physicochemical characteristics of studied brown coal mine waters.
ParameterMine WatersMSE
AB
MeanP5–P95MeanP5–P95
Nitrates (mg N-NO3/L)0.09 b0.07–0.090.01 a0.01–0.020.000
SRP (mg PO4/L)0.350.30–0.390.300.09–0.510.012
TP (mg P/L)0.260.23–0.290.220.12–0.330.004
Alkalinity (mg CaCO3/L)304.46 a290.02–318.88347.80 b336.20–359.39354.540
pH reaction (-) *7.96 a7.89–8.058.13 b7.86–8.540.032
Conductivity (mS/cm)0.60 a0.58–0.630.69 b0.67–0.720.001
A, mine waters from deep-seated drainage; B, mine waters from surface drainage; SRP, soluble reactive phosphates; TP, total phosphorus; P5–P95, confidence interval of the mean; MSE, mean square error of inter-group (A and B) variability. Different small letters in superscript in the rows indicate statistically significant differences at the level p = 0.05. * mean pH calculated using a mean concentration of H+.
Table 2. Assessment of the color of mine waters.
ItemMine WatersMSE
AB
MeanP5–P95MeanP5–P95
Platinum-Cobalt Standard
Apparent color7.55 a5.63–9.4539.00 b18.56–59.4483.20
Platinum-Cobalt Standard after filtration
True color4.27 a2.65–5.8921.80 b20.18–23.424.642
CIELAB color space
L* (%)26.0125.65–26.3825.3124.09–26.530.486
a*−0.06−0.08–−0.05−0.04−0.08–0.000.001
b*−0.54 a−0.68–−0.40−0.03 b−0.08–0.010.029
C*0.54 b0.41–0.680.06 a0.02–0.100.029
WI (%)73.9973.62–74.3574.6973.47–75.910.487
A, mine waters from deep-seated drainage; B, mine waters from surface drainage; L*, lightness; a*, –green/+red color; b*, –blue/+yellow; C*, chroma; WI, whiteness index; P5–P95, confidence interval of the mean; MSE, mean square error of inter-group (A and B) variability. Different small letters in superscript in the rows indicate statistically significant differences at the level p = 0.05.
Table 3. Correlation between bioluminescence (x, RLU) and selected parameters of mine waters.
Quality Parameter (y)Mine Waters
AB
WDabpWDabp
Nitrates (mg N-NO3/L)0.57−5.53 × 1050.090.8260.01−8.43 × 1060.020.985
Alkalinity (mg CaCO3/L)9.24−0.24349.860.36316.38−0.49416.800.499
pH reaction (-)0.92−0.018.050.7799.500.016.660.614
Conductivity (mS/cm)0.052.800.600.9479.44−0.010.780.615
Apparent color5.410.032.950.4912.25−0.3284.050.810
C*48.610.01−0.430.01777.310.00−0.500.049
aw (Pa/Pa)0.021.850.970.96735.880.000.920.268
A, mine waters from deep-seated drainage; B, mine waters from surface drainage; C*, chroma; aw, water activity; WD, linear determination index (%); a,b, linear adjustment coefficients y = ax + b.
Publisher’s Note: MDPI stays neutral with regard to jurisdictional claims in published maps and institutional affiliations.