1. Introduction
1.1. Background and Motivation
Due to population growth, human comfort level boosting, and industrialization development, electricity demand is increasing rapidly in the world with an annual growth rate of 4% [
1,
2,
3]. It was stated by the International Energy Agency report that, with growing electricity demand, if no suitable measure is adopted, carbon emissions would increase by 70% over the next two decades [
1]. It is estimated that 40% of the electricity demand is consumed by buildings (residential and commercial), which result in about 36% of the total emissions [
4]. Renewable energy sources are the most promising solutions to supply the electricity demand and decrease carbon emissions [
5]. Among them, rooftop solar photovoltaic (PV) technology has been widely incorporated for residential buildings. In addition to decreasing the emissions, installed rooftop PV systems can reduce the electricity bills of consumers [
6].
Around 21% of Australian homes, 2.5 million houses, have installed a rooftop PV system as of October 2020 [
7]. In Australia, consumers import electricity at a retail price (RP). Following rooftop PV installation, the load can be supplied by the PV system when there is PV generation, and the extra power of PV can be exported to the grid in a feed-in-tariff (FiT) rate [
8]. Since the FiT rate is a fraction of RP in most Australian states and territories, consumers tend to install a battery energy storage system (BESS) with the rooftop PV system. When using the BESS in the premises of the home, the extra power of PV can be stored in the battery rather than selling back to the grid at a low price. Significant growth has been observed in the number of home battery installations in Australian houses over the past 5 years. According to an analytics report, 22,661 energy storage systems with a total capacity of 233 MWh were installed in Australia in 2019. A total of 73,000 home battery installations have been reported in Australia since 2015. This suggests that 8% of Australian houses with a rooftop PV have also installed BESS [
9].
Traditionally, the customers use flat rates for import/export electricity prices (RP and FiT) from/to the main grid. The new electricity price mechanisms, however, propose a time-variant electricity rate for customers. Time-of-use (TOU) is the most recommended mechanism among the time-variant electricity rate programs [
10]. By using the TOU mechanism, the electricity price changes two or three times during the day. Hence, the optimal capacity of PV and BESS needs to be selected according to the electricity rates for import/export costs of GCHs to obtain the highest economic profits [
11]. There are also several important parameters such as the salvation value and degradation of PV and BESS, considering grid constraints, as well as incorporation of actual data that are required to achieve a practical optimal sizing of the system.
1.2. Literature Review
Several papers investigated the optimal sizing problem of components to achieve a techno-economic system. In [
12], a new smart building was introduced using a solar-based system. In [
13], dynamic real-time optimization was proposed to minimize the energy cost for a house with TOU and real-time pricing (RTP). In [
14], optimal sizing of PV and BESS was evaluated by considering the battery degradation effect on its lifetime for two cases in the Netherlands and USA. The daily supply of charge (DSOC) was considered in the developed cost objective function. Optimal sizing of BESS was studied for a PV–BESS system in [
15]. In [
16], optimal sizing of PV and BESS was investigated for a GCH in China by considering different electricity rates. However, several practical parameters such as degradation of components, grid constraints, and salvation value were neglected. The annualized cost of electricity was minimized to find the optimal capacity of PV and BESS for GCHs in [
17]. In [
18], two system configurations were optimally sized for a grid-connected house (GCH) in Australia. In [
19], a Malaysian case study was considered for optimal sizing of PV and BESS on the basis of maximum load reduction modelling.
The impact of energy management systems on the optimal sizing problem of rooftop PV and BESS was evaluated in [
20]. In [
21], a techno-economic analysis of rooftop PV and BESS for GCHs in Finland was adopted. The self-consumption issue of PV-BESS systems and their capacity optimization were investigated in [
22]. In [
23], the economic and environmental outcomes of optimal rooftop PV system installations were studied for customers in the residential sector in Iran by considering TOU rates for purchasing electricity and flat rates for selling. In [
24], a linear optimization model was used for cost-optimal sizing of battery in a PV-BESS system. In [
25], the levelized cost of electricity was minimized to find the optimal configuration of a PV-BESS microgrid. In [
26], electricity cost minimization for net-zero energy homes through optimal sizing of BESS was investigated.
Table 1 summarizes the limitations of the existing studies. Degradation of BESS was mostly neglected, which is an important parameter that can affect the operation of the system by affecting the capacity reduction during the system operation and BESS lifetime. The salvation value of components, which is their value after the project lifetime, was neglected in existing studies. The grid constraint was rarely considered in the optimization model of the literature. The existing studies only considered one option of electricity rates and did not provide a comprehensive guideline for the customers on the basis of existing electricity rates in the market.
1.3. Contribution
The key contribution of this paper is the development of a comprehensive and practical optimal sizing for rooftop PV and BESS for GCHs by considering flat and TOU rates for import/export electricity prices. Two system configurations, PV only and PV-BESS, are optimally sized by minimizing the net present cost of electricity for four options of electricity rates (Flat-Flat, Flat-TOU, TOU-Flat, and TOU-TOU). A practical model is developed by considering grid constraints, daily supply of charge of electricity, salvation value of PV and BESS, actual annual data of load and solar, and current market price of components. The capacity degradation of BESS is calculated using the Rainflow counting algorithm. The degradation of BESS is then used to calculate the lifetime of battery. The capacity degradation rate is also considered for the rooftop solar PV system. A rule-based home energy management system (HEMS) is examined for the GCHs to control the power flow between PV, BESS, load, and grid. Operation analysis is presented for summer and winter to verify the proper power flow in the system configurations. Various sensitivity analyses are presented to examine the impacts of grid constraint and electricity rates on the cost of electricity and the sizes of the components. Although the developed capacity optimization model is generally applicable, a grid-connected house in Australia is considered as the case study.
1.4. Article Organization
This paper is structured as follows: the developed home energy management systems for two system configurations are presented in
Section 2. The model of optimization for the system configurations is defined in
Section 3.
Section 4 presents the case study and its associated data. The optimization results, as well as operation and sensitivity analyses, are provided in
Section 5.
Section 6 concludes the paper.
2. Energy Management System
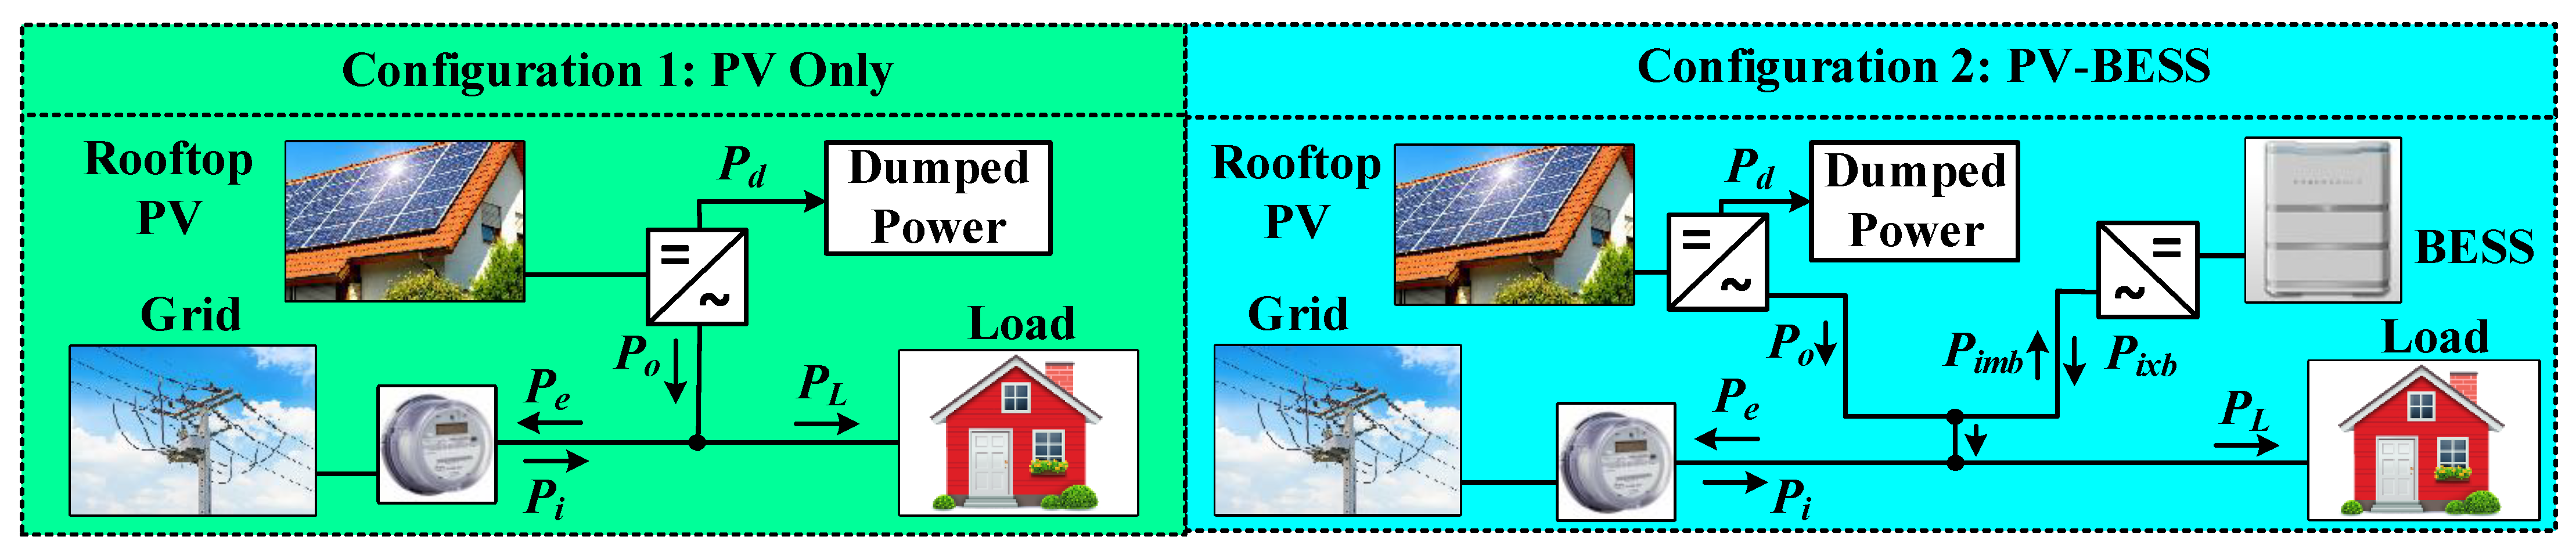
Two system configurations, PV only and PV-BESS, were investigated for a GCH in this study.
Figure 1 demonstrates the connections among the components, load, and grid in both system configurations. In Configuration 1, the rooftop PV is connected to the grid and load through an inverter. In Configuration 2, an AC-coupled configuration is selected for rooftop PV and BESS. The HEMS of each system configuration is discussed in this section.
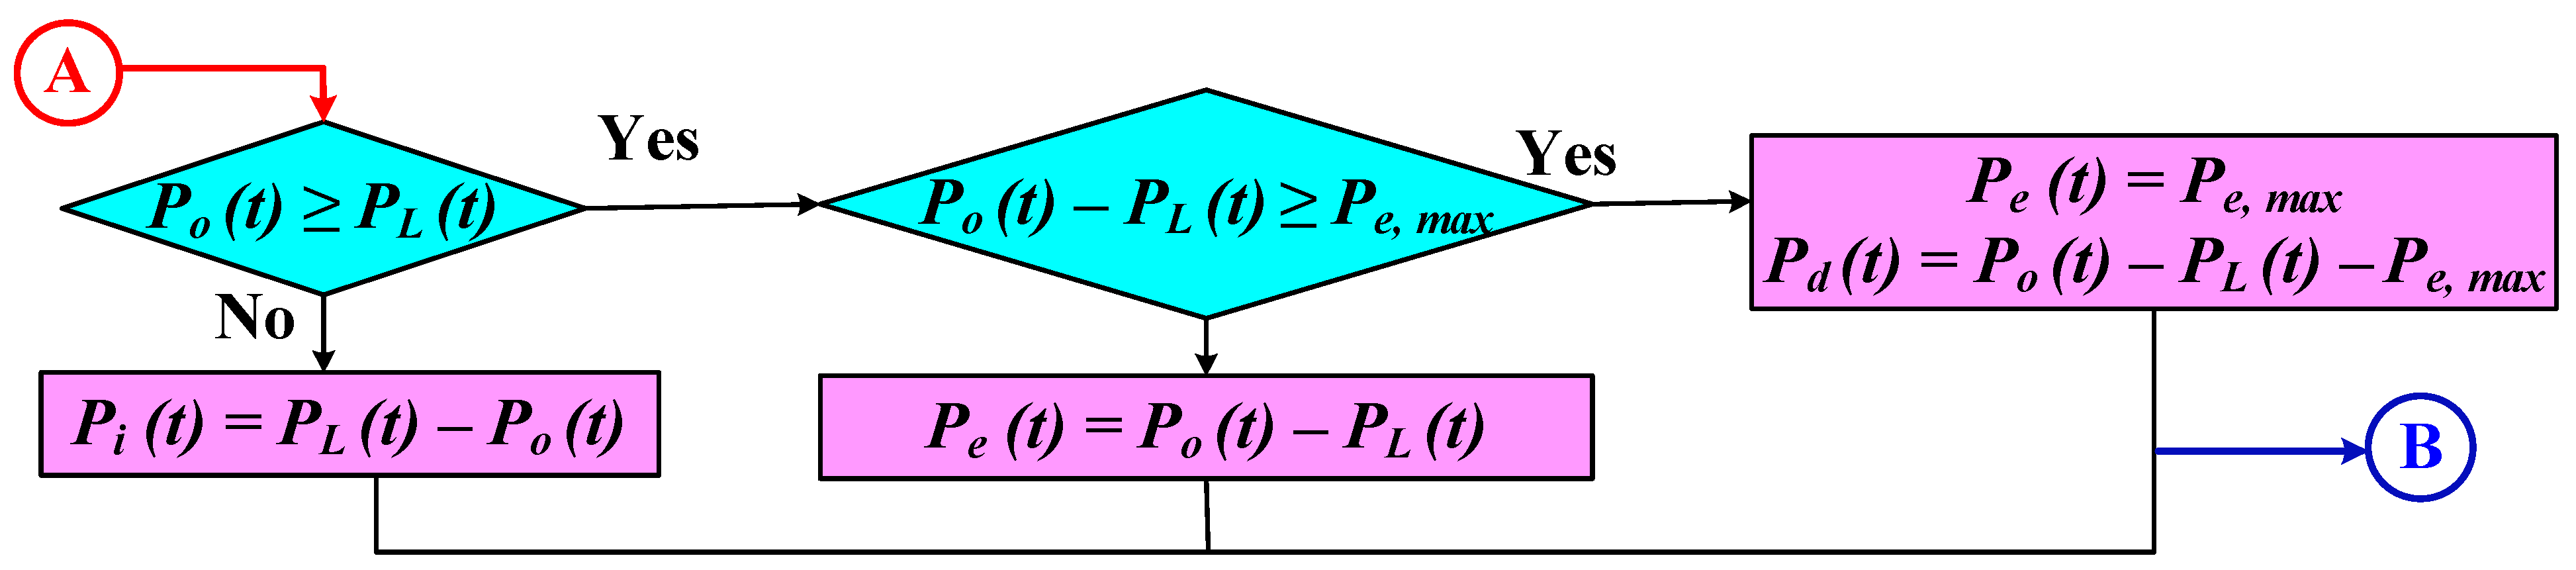
2.1. Configuration 1: PV Only
Figure 2 illustrates a rule-based HEMS for PV only configuration. The HEMS controls the power flow among the PV, load, and grid. In this figure, points A and B indicate the start and end of the system operation, which are then used in the optimization algorithm.
In this configuration, if the generated power by the rooftop PV (
) is greater than the household load (
), then the extra power is sold to the grid by considering the grid constraint. Hence, the sold power to the grid (
) can be formulated as follows [
18]:
If the power of rooftop PV exceeds the grid constraint (
), the extra power is dumped. It should be mentioned that the considered dumped power is not a physical load and is dumped by the control system of the inverter. The dumped power (
) can be calculated as follows:
On the other hand, when the generated power of rooftop PV cannot meet the load, the deficit power is to be purchased from the grid. The imported power (
) from the grid can be expressed as follows [
18]:
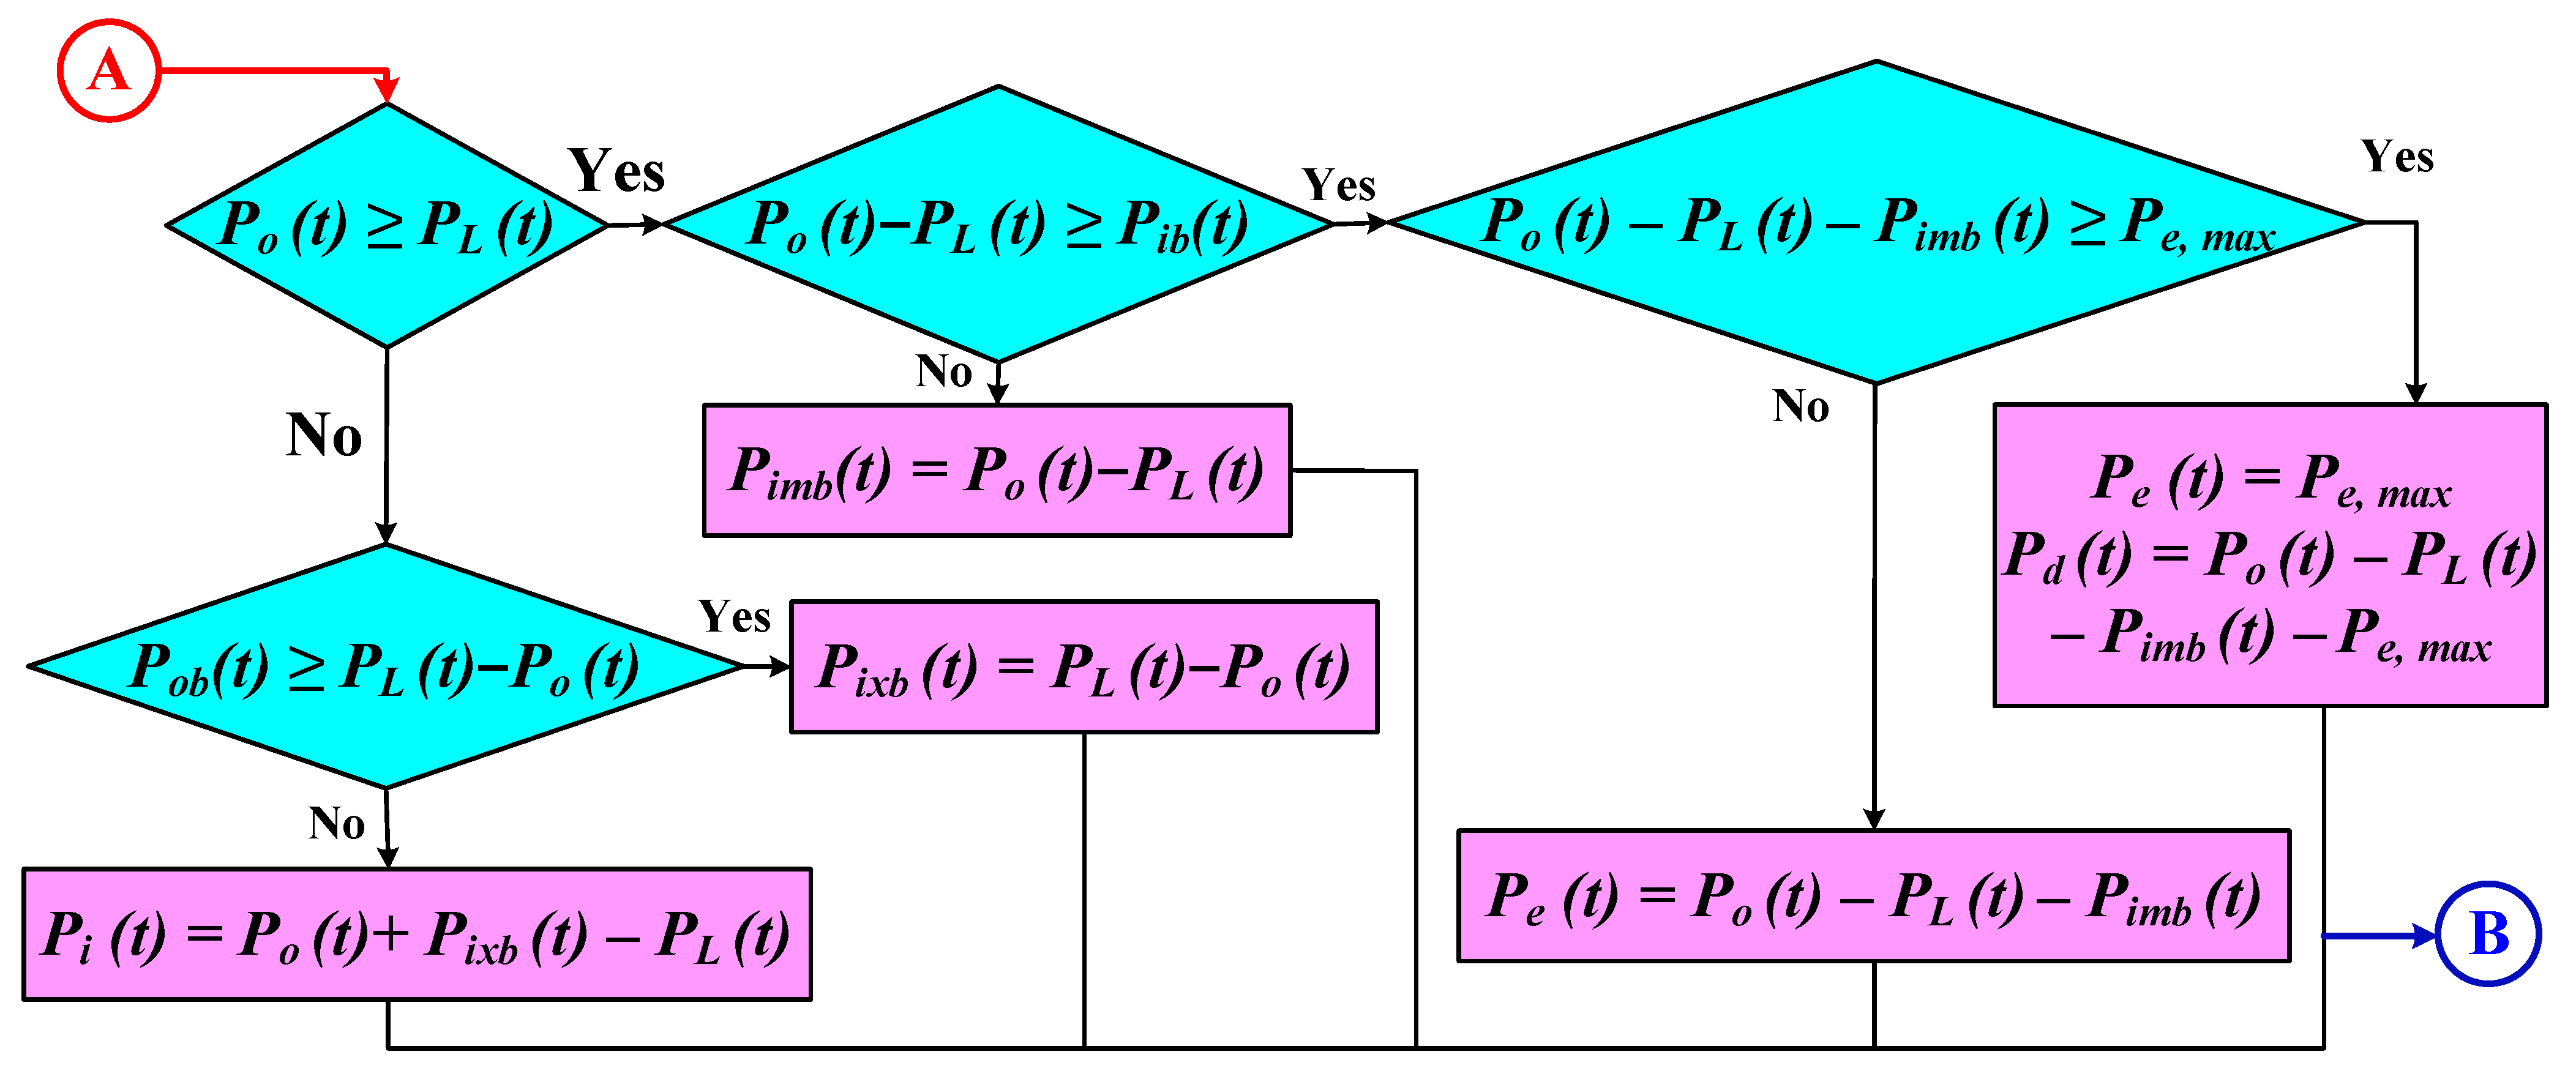
2.2. Configuration 2: PV–BESS
Figure 3 indicates the rule-based HEMS for the PV-BESS system configuration. In this configuration, the HEMS controls the power flow among the PV, BESS, load, and grid.
When the generated power of the rooftop PV exceeds the load, the extra power first charges the BESS by considering the available input power limit of the battery. The charging power of the battery (
) can be formulated as follows [
18]:
If the PV power exceeds the load and input power limit of battery, then the extra power is sold to the grid by considering the grid constraint. The exported power to the grid can be expressed as
Any extra power can be dumped as follows:
On the other hand, when the generated power by PV is less than the load, the deficit power can be supplied by the discharging power of the BESS considering the output power limit of battery. The discharging power of battery (
) can be expressed as follows [
18]:
If the output power limit of battery is not enough to fully supply the load, the deficit is imported from the grid as follows:
For each time interval (
), the battery SOC is measured by
Available BESS input power (
) and output power (
) limits are measured by
3. Optimization Model
The optimal sizing contains the objective function of the model, design constraints of the system, and optimization methodology.
3.1. Objective Function
The objective function was to minimize the total net present cost (NPC) of electricity. The total NPC (
) can be formulated as a function of the NPC of components (
) and NPC of electricity exchange with the grid (
) as follows [
18]:
The NPC of components can be formulated as a function of the capital cost (
), replacement present cost (
), maintenance present cost (
), and salvation value of PV and BESS. Hence, the
can be calculated as follows:
where the subscripts
and
are used for the BESS and PV system, respectively.
The capital cost of PV and BESS is the investment cost at the beginning of the project. The replacement present cost of components can be calculated as follows:
The maintenance present cost of components can be formulated as follows:
The salvation value of the components can be expressed as follows [
5]:
where
is the lifetime of components and
is their remaining lifetime at the end of the project lifetime.
The lifetime of solar PV technology is usually determined by the company. The BESS lifetime is, however, determined on the basis of the capacity degradation in the system operation, and it is reached when the degradation reaches 20%. The capacity degradation of BESS is determined as a function of the depth of discharge (DOD) which is calculated according to a battery’s SOC as follows [
5]:
To calculate the battery degradation, the number of cycles and their associated DOD should be determined. The Rainflow cycle counting algorithm was adopted in this study to extract the full data of battery cycles data from the annual DOD. Then, an experimental model was used to determine the battery degradation on the basis of the provided data from the Rainflow algorithm. The applied experimental model was obtained according to the calendar lifetime and accelerated laboratory cycle tests under various stress factors and stress levels of BESS taken from [
23]. This experimental model for determining the degradation of a lithium-ion battery was calculated as a function of the DOD for each cycle (
) as follows [
27]:
The total degradation of battery (TDB) for the annual operation of the system can be expressed as follows [
5]:
The cost of electricity usually increases at an inflation rate (
) above the interest rate (
). Hence, the interest rate of electricity can be expressed as follows [
28]:
The NPC of electricity is calculated as a function of the annual electricity cost and the new interest rate of electricity as follows:
The
is the annual cost of electricity, which is calculated as a function of the purchased and sold electricity and their associated electricity rates.
3.2. Design Constraints
There were several design constraints for the developed optimization model, as presented below.
Equation (23) represents the constraint on the capacity of the rooftop PV which is limited by the available rooftop area in a typical household. Equation (24) indicates that the charging/discharging power of battery is limited by the available input/output power. The SOC of the battery is limited to between its minimum and maximum values as shown in Equation (25). Equation (26) shows the constraint of power balance for each time interval. Equation (27) shows the constraint on the export power limit to the grid from the rooftop PV of the GCH.
3.3. Cost of Electricity
The cost of electricity (COE) is the ratio of net annual payments and net annual consumption of electricity of the household. The COE, which was used for a comparison between the designed systems in this study, is calculated as follows [
8]:
The annual electricity demand (
) of the GCH is calculated as follows [
8]:
The capital recovery factor (CRF) is calculated differently for components and electricity exchange costs.
3.4. Optimization Procedure
The formulated optimization model can be solved with different solvers in MATLAB. In this study, particle swarm optimization (PSO) was used due to its salient features such as computational efficiency, ease of implementation, capacity of finding global optima, suitable convergence rate, and lesser dependency on initial points [
18]. The PSO algorithm has been broadly used for optimal sizing of power systems [
28,
29,
30,
31].
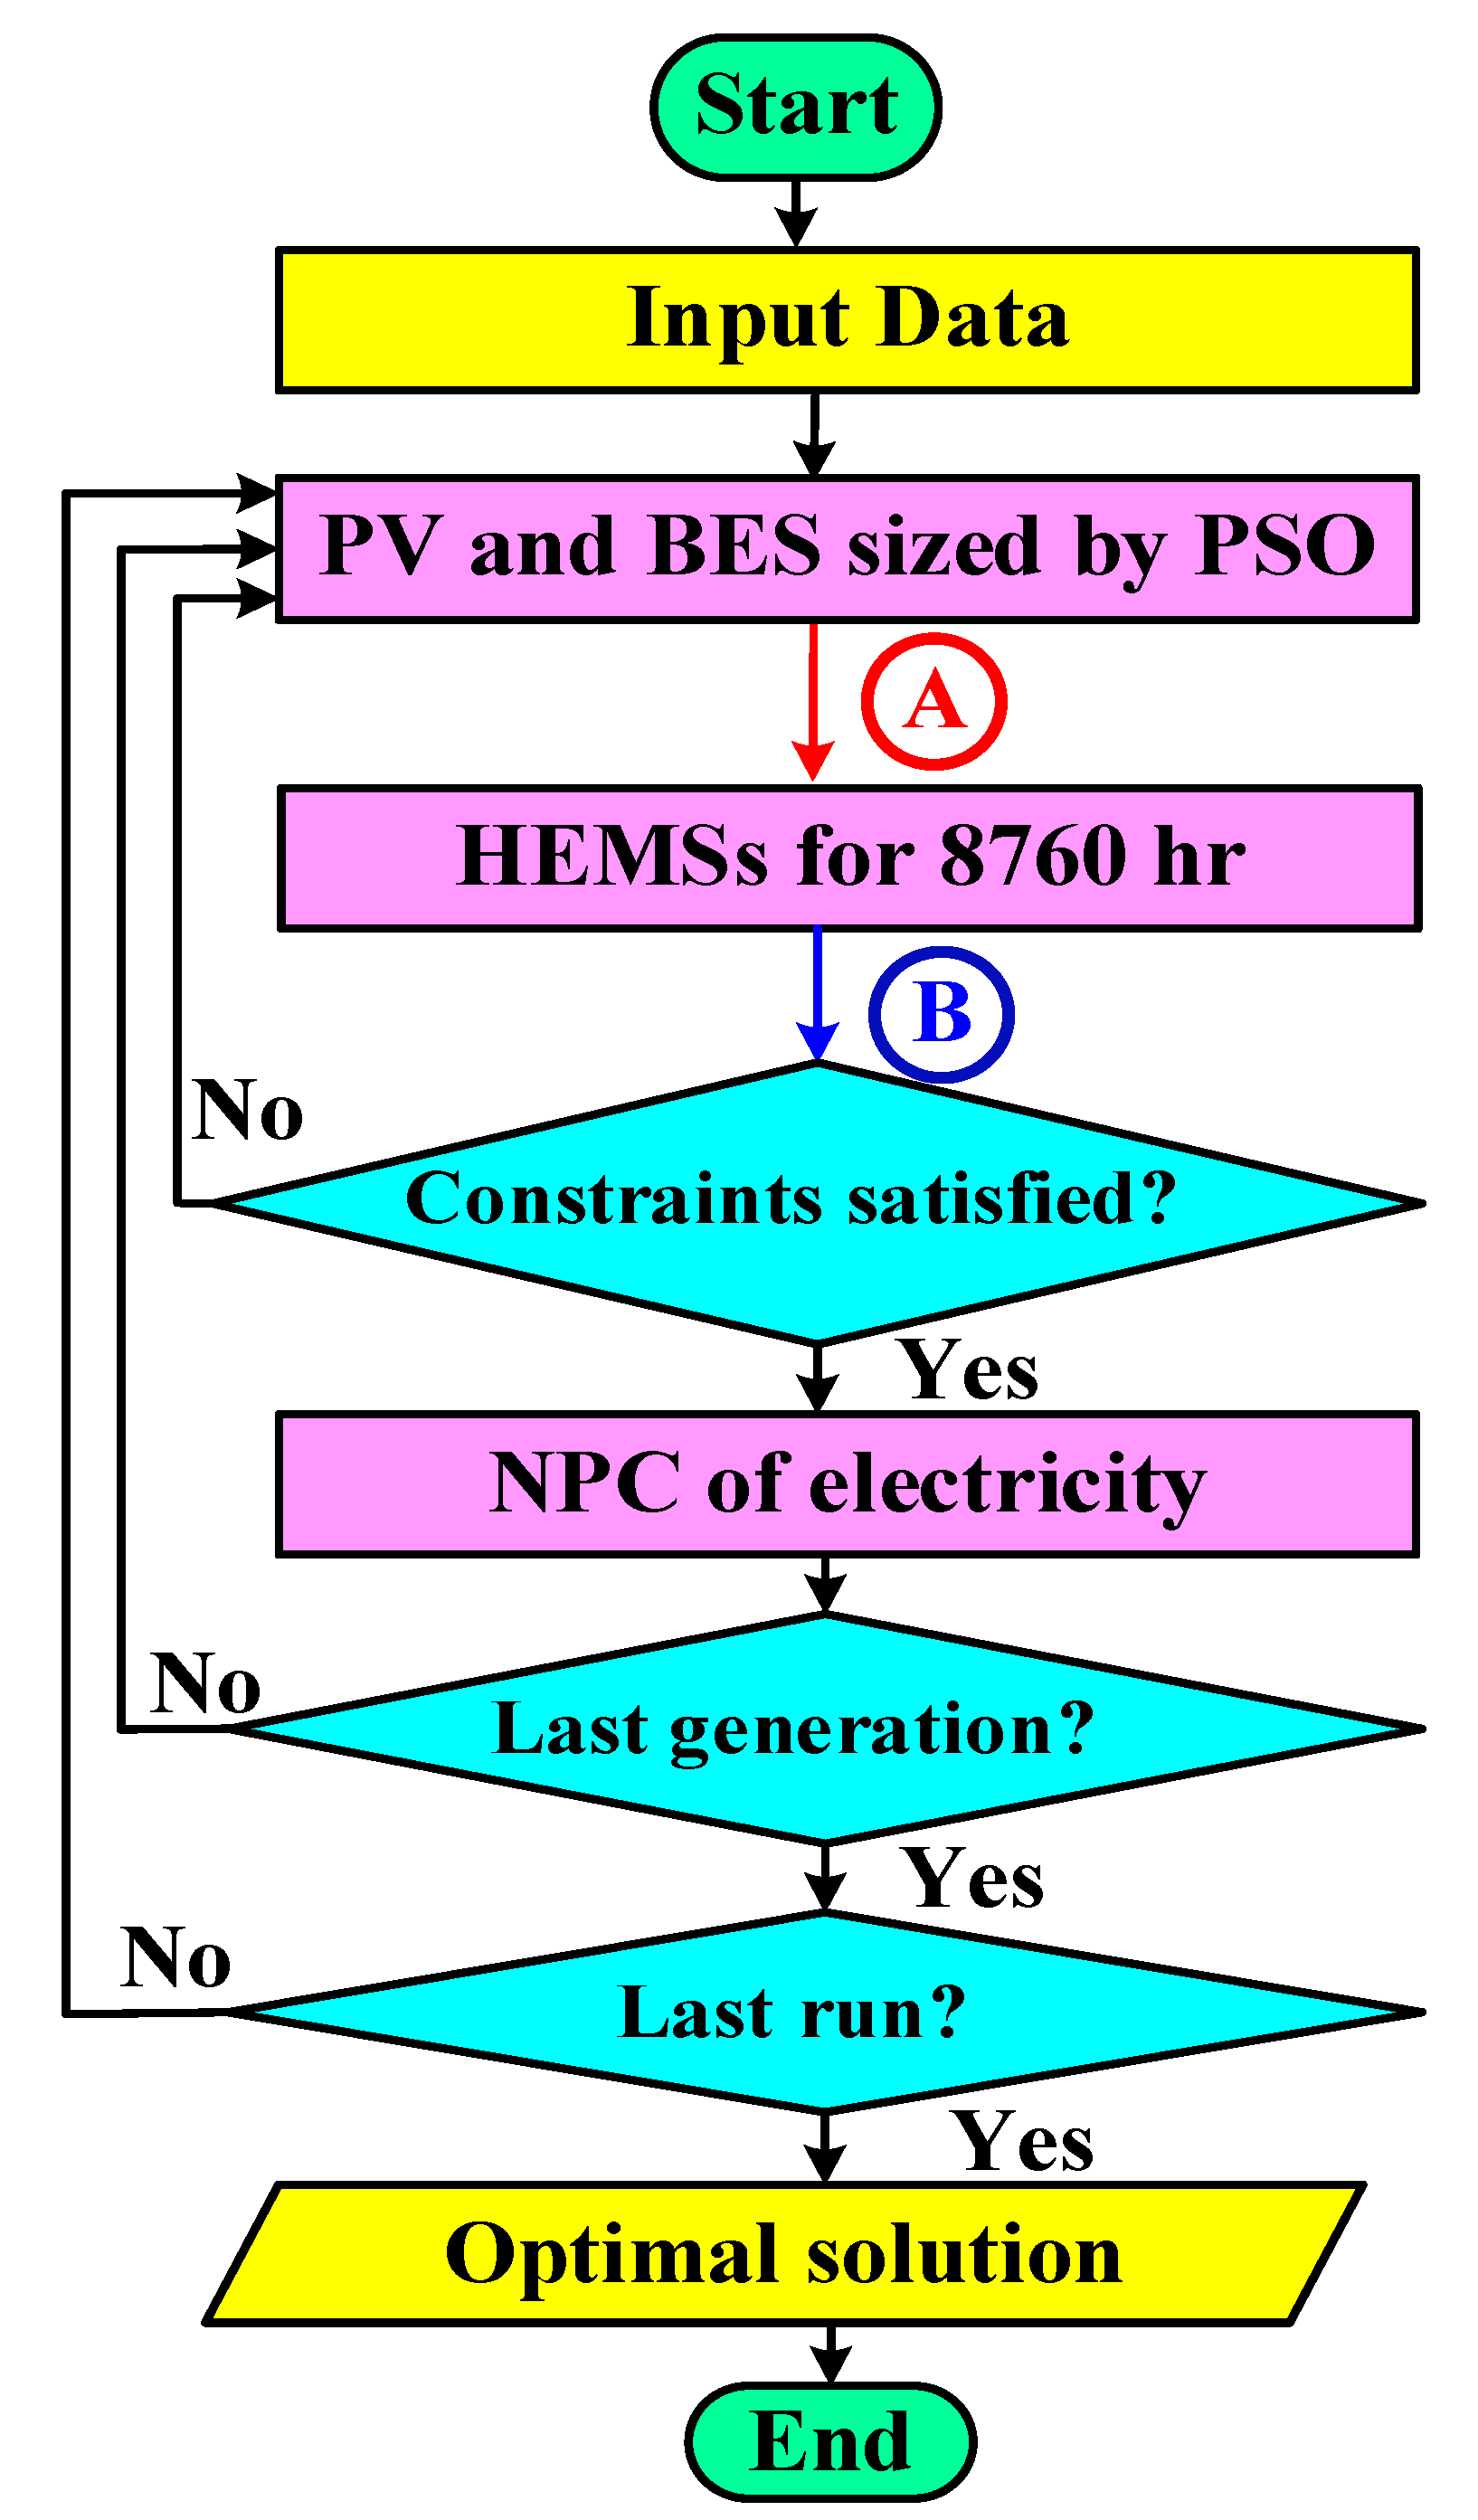
Figure 4 indicates the optimization flowchart for sizing of the rooftop PV and BESS. The procedure started with input data of the system. This comprised the electricity consumption of the GCH, weather data, electricity rates, grid data, and component data, which are all discussed in the next section. The PV and BESS were then sized by the PSO, and the operation of the system was examined for 1 year (8760 h). The system operation started at point A and ended at point B, as shown in the HEMSs in
Figure 2 and
Figure 3. Once the operation was terminated, the algorithm checked if the design constraints were satisfied. Then, the NPC of the system was calculated, and it was determined if the total generations and runs were satisfied. Lastly, the solution with the lowest NPC was selected as the best solution. The inertia, cognition, and social weights of the PSO algorithm were considered as 0.5, 2, and 2, respectively, in this study. To increase the robustness of the optimization, 200 particles and 200 generations were selected for the PSO, and the optimization was repeated for 20 runs.
4. Case Study
The optimal sizing model was examined for a case study in South Australia (SA). For this purpose, a typical GCH in SA was used by adopting the electricity consumption and weather data. In addition, the components and grid data were adopted according to the Australian market data.
The parameters associated with the optimal sizing project for the case study are listed in
Table 2. The lifetime of the project was 20 years. The interest and inflation rates were 8% and 2% per year [
32]. The daily supply of charge of electricity was 79 cent. Single-phase residential customers such as typical GCHs are prohibited to export more than 5 kW to the utility grid at any time [
7].
Table 3 lists the electricity prices of flat and TOU rates for purchasing and selling electricity. The TOU rates of electricity are changed in three time periods for residential customers in SA [
33]. The off-peak period is between 11:00 p.m. and 8:00 a.m., the shoulder period is between 8:00 a.m. and 6:00 p.m., and the peak period is from 6:00 p.m. to 11:00 p.m.
The rooftop PV and BESS characteristics for the optimal sizing model are listed in
Table 4. The data include the size unit, lifetime, and economic data of components. The lifetime of rooftop PV was considered as 25 years and that of BESS was to be decided (TBD) as a function of the degradation after system operation. The economic data of the components were taken from [
18] according to the market prices in SA. The minimum and maximum values of SOC were considered as 20% and 100%. The efficiency of BESS is assumed as 92.5%. It was assumed that the rooftop area of the typical GCHs in SA was limited to 50 m
2, such that the maximum capacity of PV could not exceed 10 kW [
18].
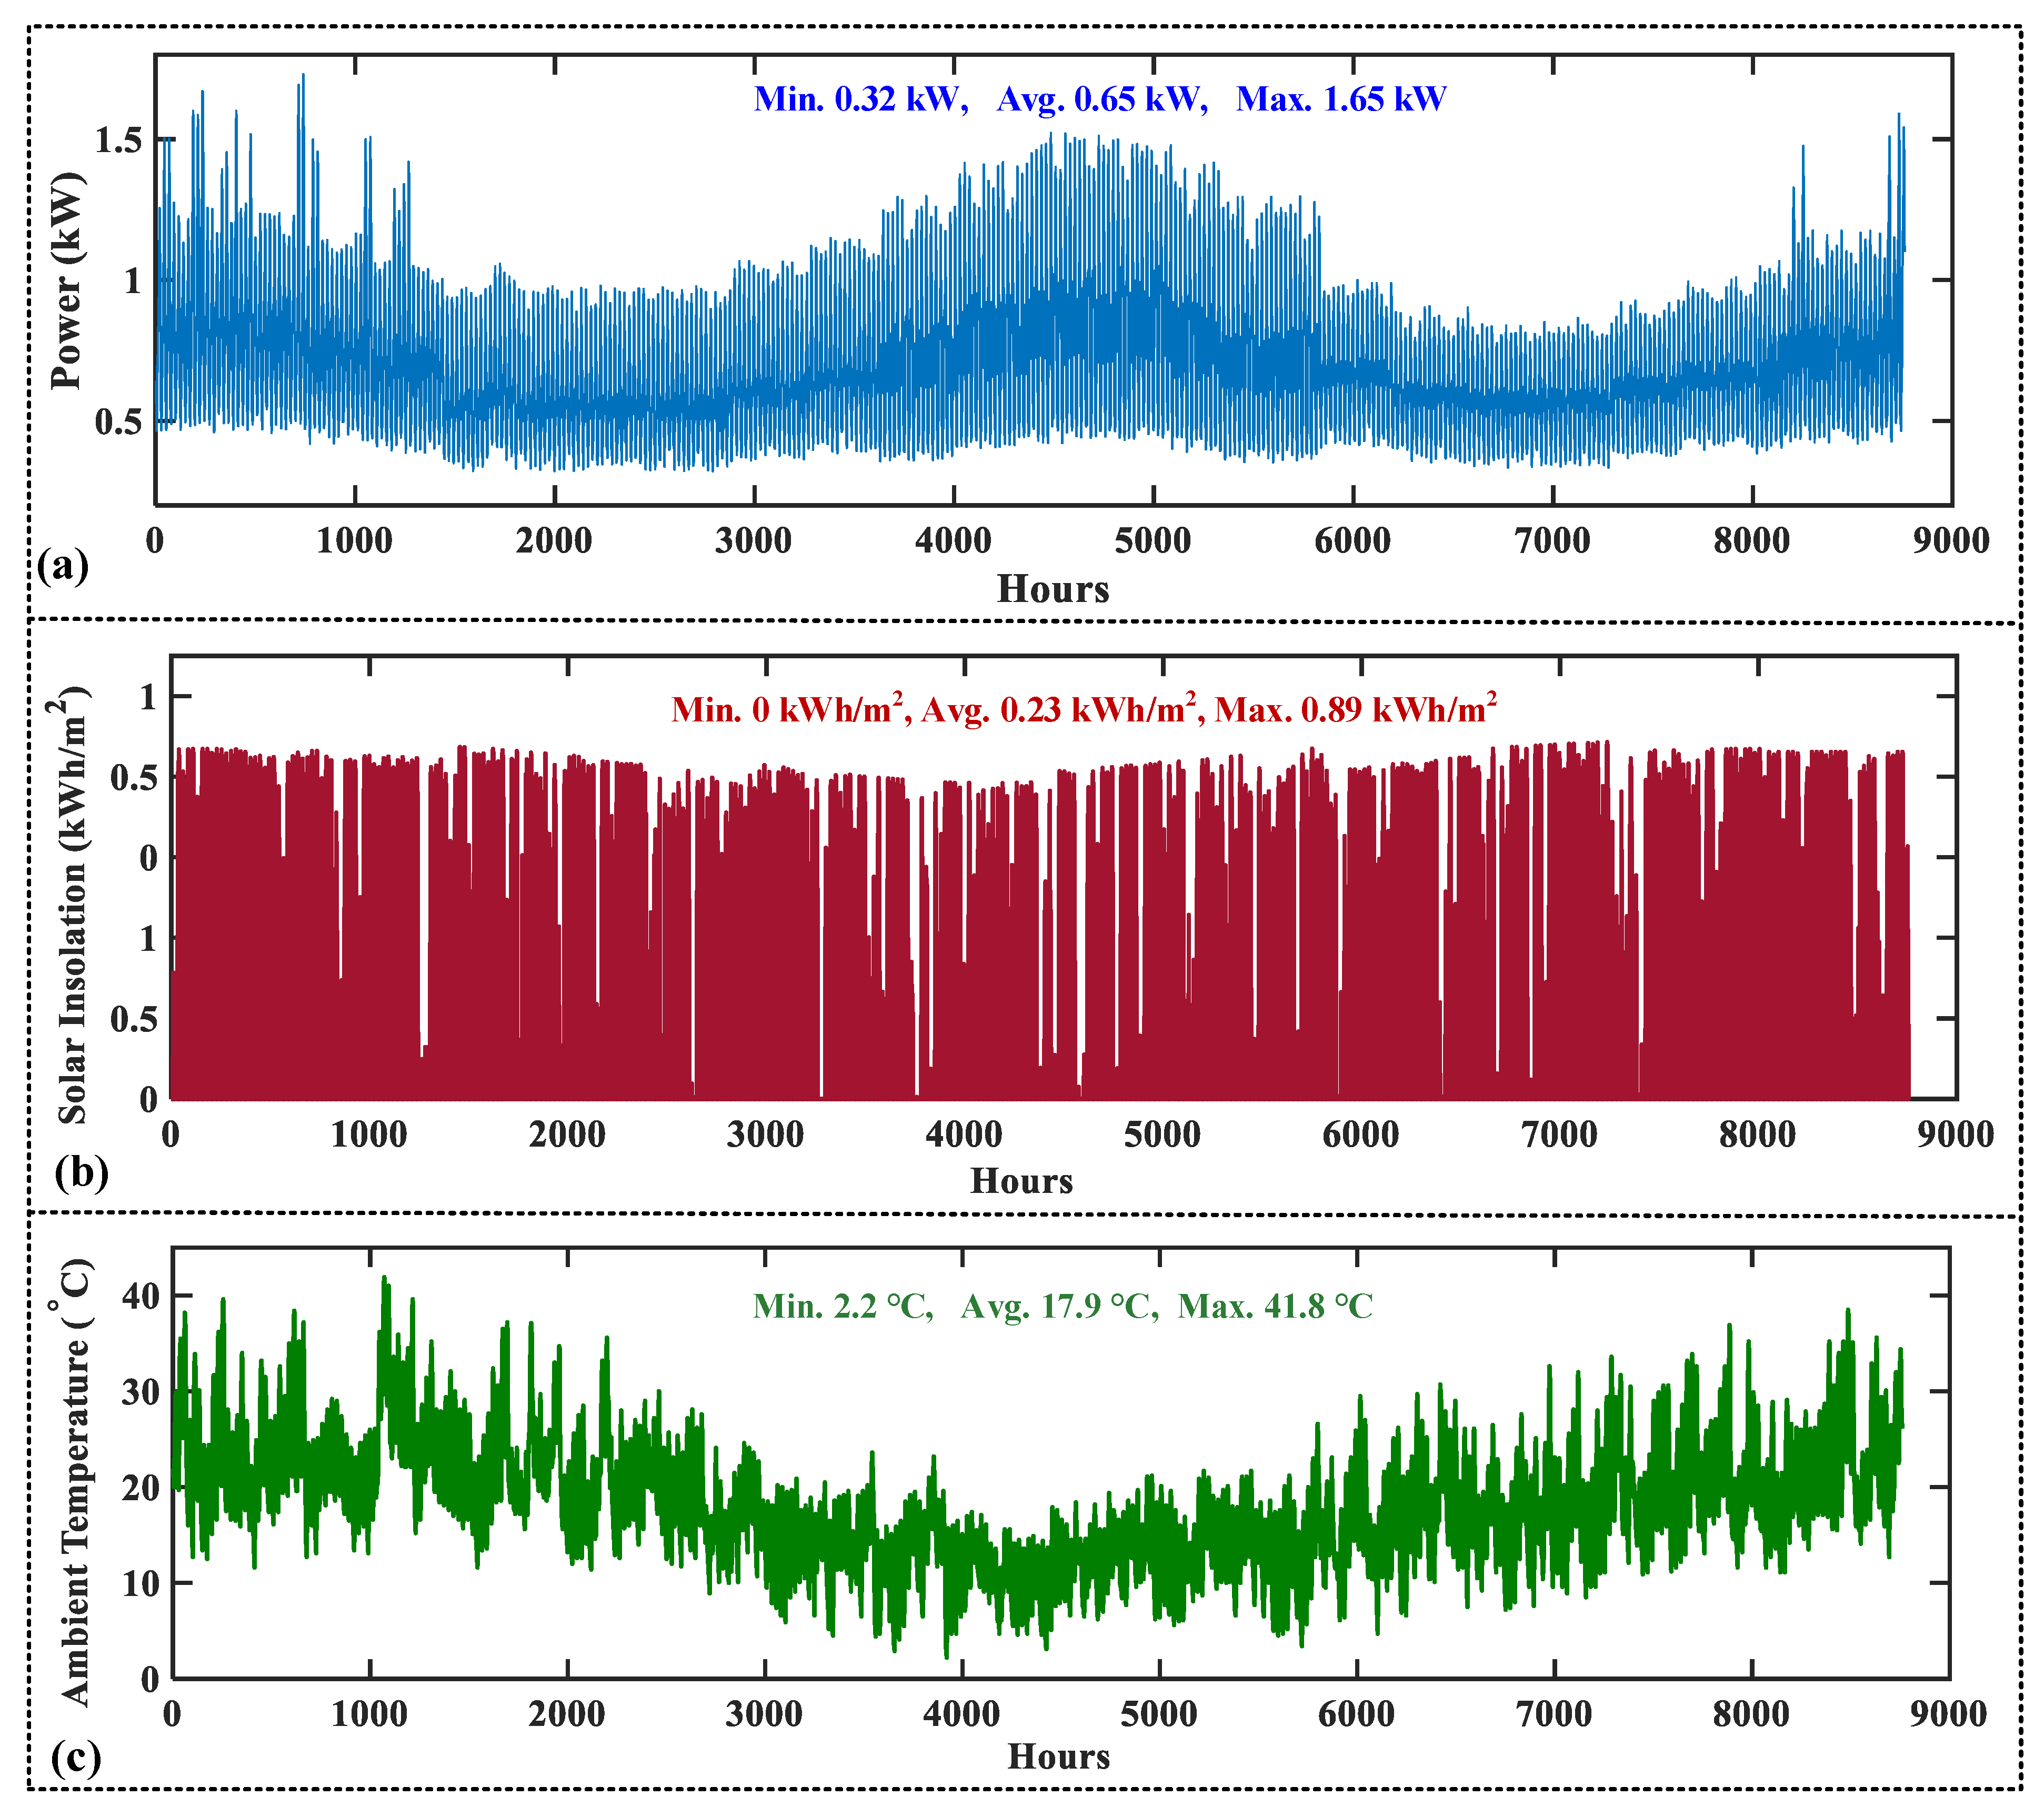
Actual annual variations of electricity consumption for a typical GCH in SA, as well as the solar insolation and ambient temperature in an urban area of SA, were collected on an hourly basis for the case study.
Figure 5 demonstrates the annual variation of those data. The average of electricity consumption is 0.65 kWh with an average daily consumption of 15.6 kWh [
14]. The ambient temperature varies from a minimum amount of 2.2 °C to a maximum amount of 41.8 °C for the urban area [
8]. The maximum value of solar insolation in a whole year is 0.89 kWh/m
2 [
7].
5. Results and Discussion
The optimal results, power flow analysis, and sensitivity analysis for both system configurations are evaluated in this section. The results are presented for four different options, as listed in
Table 5, according to electricity rates for purchasing and selling electricity.
5.1. Optimal Results of System Configurations
The following optimization results are presented for both system configurations with each electricity rate option in this subsection: (a) optimal capacity of rooftop PV and BESS, (b) annual dumped energy (ADE) of the systems, (c) annual import energy from the grid (AIEG), (d) annual export energy to grid (AEEG), (e) total NPC of system configurations, (f) COE of the systems, and (g) capacity degradation (CD) and calculated lifetime of the BESS. It is to be noted that, in this study, all the economic values are presented in Australian dollars (AUD).
5.1.1. Option 1: Flat-Flat
Table 6 lists the optimization results for both system configurations in Option 1. The normal case shows the results for a GCH without any PV and BESS when all the electricity is supplied by the grid. The optimal capacity of rooftop PV was obtained as 9 kW for both configurations. The BESS capacity was optimally sized at 10 kWh for the PV-BESS system. It is shown that adding 9 kW PV in the PV only system decreased the total NPC to half of that of normal GCH without PV. The total NPC of the PV-BESS system was lower than the PV only system by around
$3000. The COE of the GCH was efficiently decreased by adding PV and BESS to the premises of the house. This is because the NPC of electricity exchange was decreased efficiently. As illustrated, the total annual electricity demand (5.7 MWh) was supplied by the main grid in the normal case and there was no export electricity to the grid. The AIEG for the PV only system was 3.25 MWh and only 0.76 MWh for the PV-BESS system. This means that only about 13% of the electricity demand was supplied by the main grid in the PV-BESS system. The PV only system exported more electricity throughout the year compared to the PV-BESS system. This is because the extra power of PV after supplying the load was first used to charge the battery in the PV-BESS system. The ADE of the PV only system was a bit higher than that of PV–BESS. The annual capacity degradation of battery in the PV-BESS system was obtained as 1.32%; hence, the battery lifetime was 15 years.
5.1.2. Option 2: TOU-Flat
In this option, the customer purchases electricity by TOU rates and sells the PV’s extra power under flat rate.
Table 7 lists the optimization results for both system configurations in Option 2. The total NPC and COE of all configurations in Option 2 were lower than those of Option 1. The optimal capacity of PV was found to be 9 kW for both configurations, while the optimal capacity of BESS was 6 kWh for the second configuration. The COE of the PV-BESS system was about 2.62 ¢/kWh lower than that of the PV only system. The AIEG of the PV only system was almost half of the normal case and two times higher than that of the PV–BESS system. The annual BESS degradation was obtained as 1.46%; hence, the battery lifetime was about 13 years.
5.1.3. Option 3: Flat-TOU
In this option, the electricity is purchased at a flat rate and it is sold to the grid at TOU rates.
Table 8 lists the optimization results for both system configurations in Option 3. The optimal capacity of rooftop PV was obtained lower than the beforementioned options. This recommends the customers to not invest in a high-capacity rooftop PV if they use a flat rate for purchasing and TOU rates for selling. Since the selling price is lower during the daytime, when the PV has higher generation, a BESS is more recommended to save the PV generation and use it for load supply. The optimal capacity of BESS was, hence, obtained as 10 kWh for the PV-BESS system. The total NPC and COE of the PV–BESS system were lower than those of the PV only system by about
$5000 and 5 ¢/kWh, respectively. The ADE of both system configurations was zero since the PV capacity was low. The annual degradation of the battery was less than 1%; hence, its lifetime was about 20 years.
5.1.4. Option 4: TOU-TOU
In this option, both the purchased and the sold electricity costs are considered using TOU rates.
Table 9 lists the optimization results for both system configurations in Option 4. Since the purchasing electricity price was based on TOU, and the price was lower during daytime (shoulder and off-peak), the optimal capacity of PV was obtained lower than Option 3 for the PV-BESS system. The BESS capacity was only 8 kWh for the PV-BESS system. Like Option 3, the ADE of both configurations was zero and the CD of the battery was less than 1%; hence, the BESS had a 20 year lifetime.
5.2. Economic and Operation Analyses
The COE of the options for the investigated system configurations is compared in
Figure 6. As illustrated, for the normal system (without PV and BESS), the COE of Options 1 and 3 was the same since the electricity was purchased at a flat (F) rate. Furthermore, Options 2 and 4 had the same COE for the normal system since the electricity was purchased at a TOU rate. It was found that the TOU rate resulted in lower COE for the customers compared to the flat rate. For all the options, the customers could reach lower COE if they bought a BESS with their rooftop PV package. The minimum COE was obtained for the PV-BESS system configuration with Option 2.
It was found from the optimization results that the cheapest systems were achieved for Option 2 (TOU-Flat). To examine the operation of the systems, the power distribution of both configurations was investigated in the operation analysis for two sample days in summer and winter.
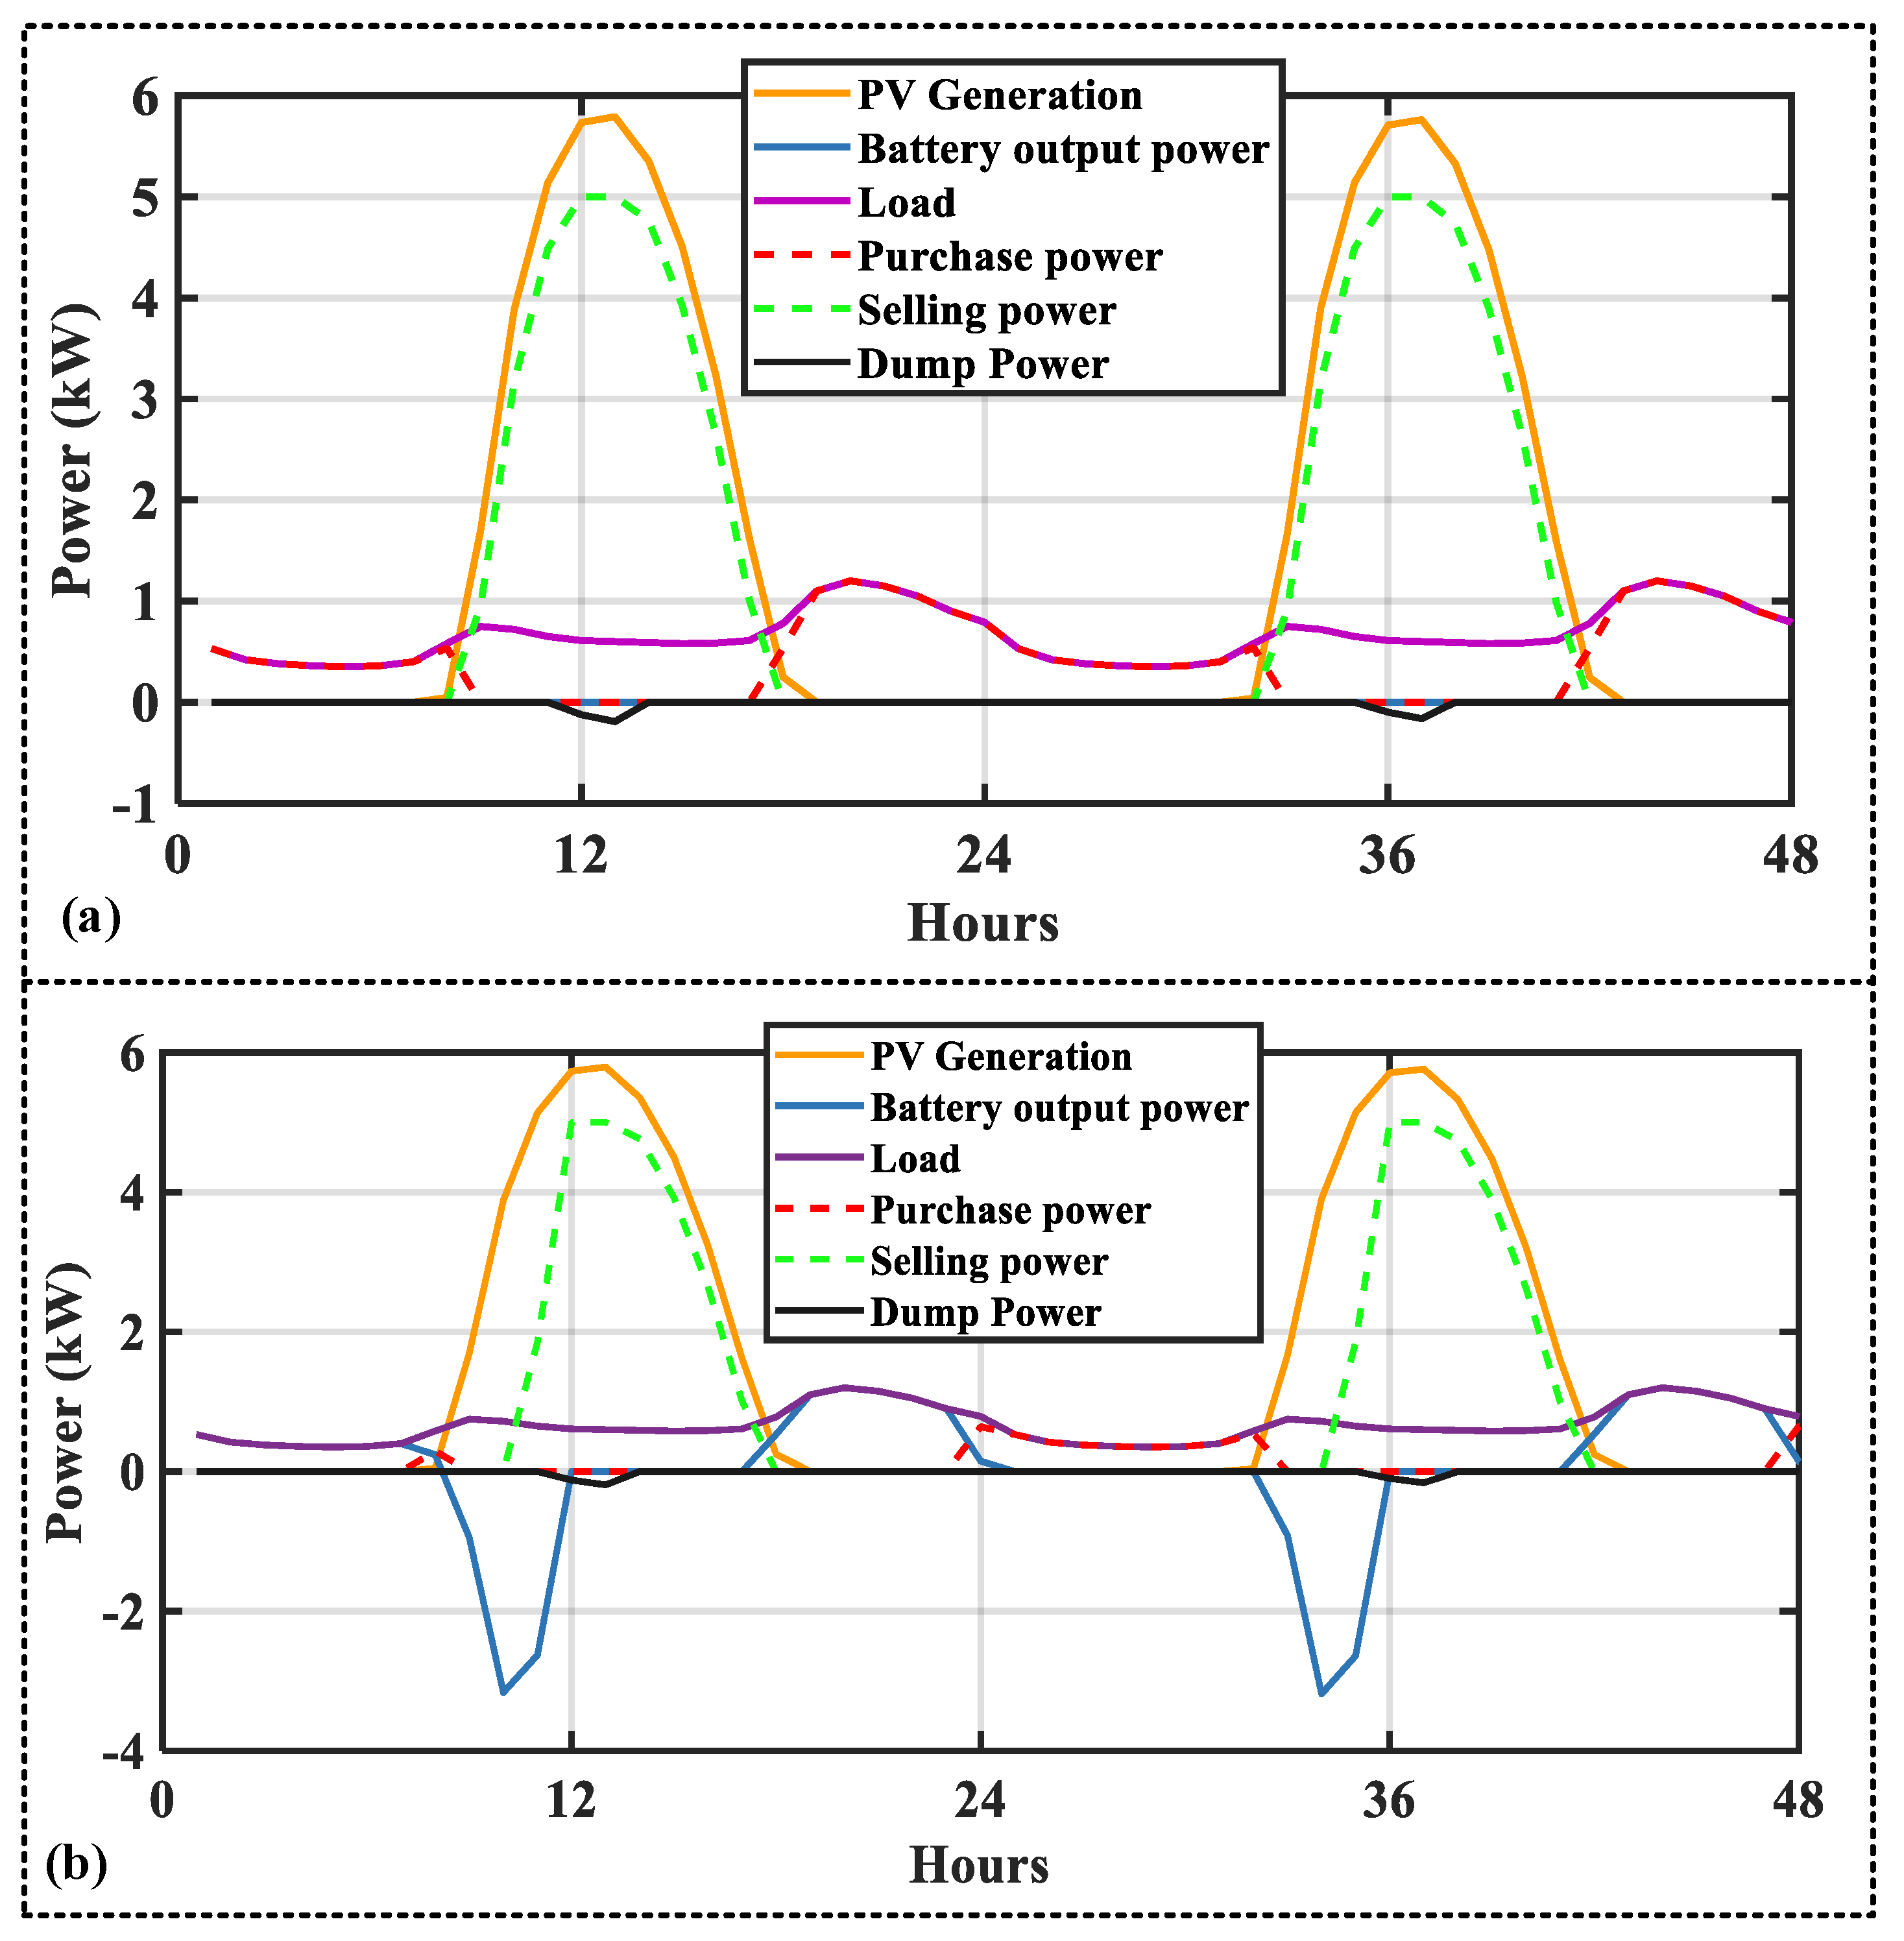
Figure 7 shows the daily power flow for two successive days (48 h) in summer using Option 2 for PV only and PV-BESS systems. In both configurations, there was no imported energy between 9:00 a.m. and 5:00 p.m. due to sunny days of summer with high generation of PV. This means that the PV could fully supply the GCH’s load during that period. In addition, most of the generated power of PV was exported to the grid, and the exported power exceeded the maximum export power limitation by around 12:00 p.m. For Configuration 1, the GCH’s load was supplied by importing power from the grid in the evening period. In Configuration 2, however, the BESS supplied the GCH’s load in the evenings and the imported power from the grid was nearly zero.
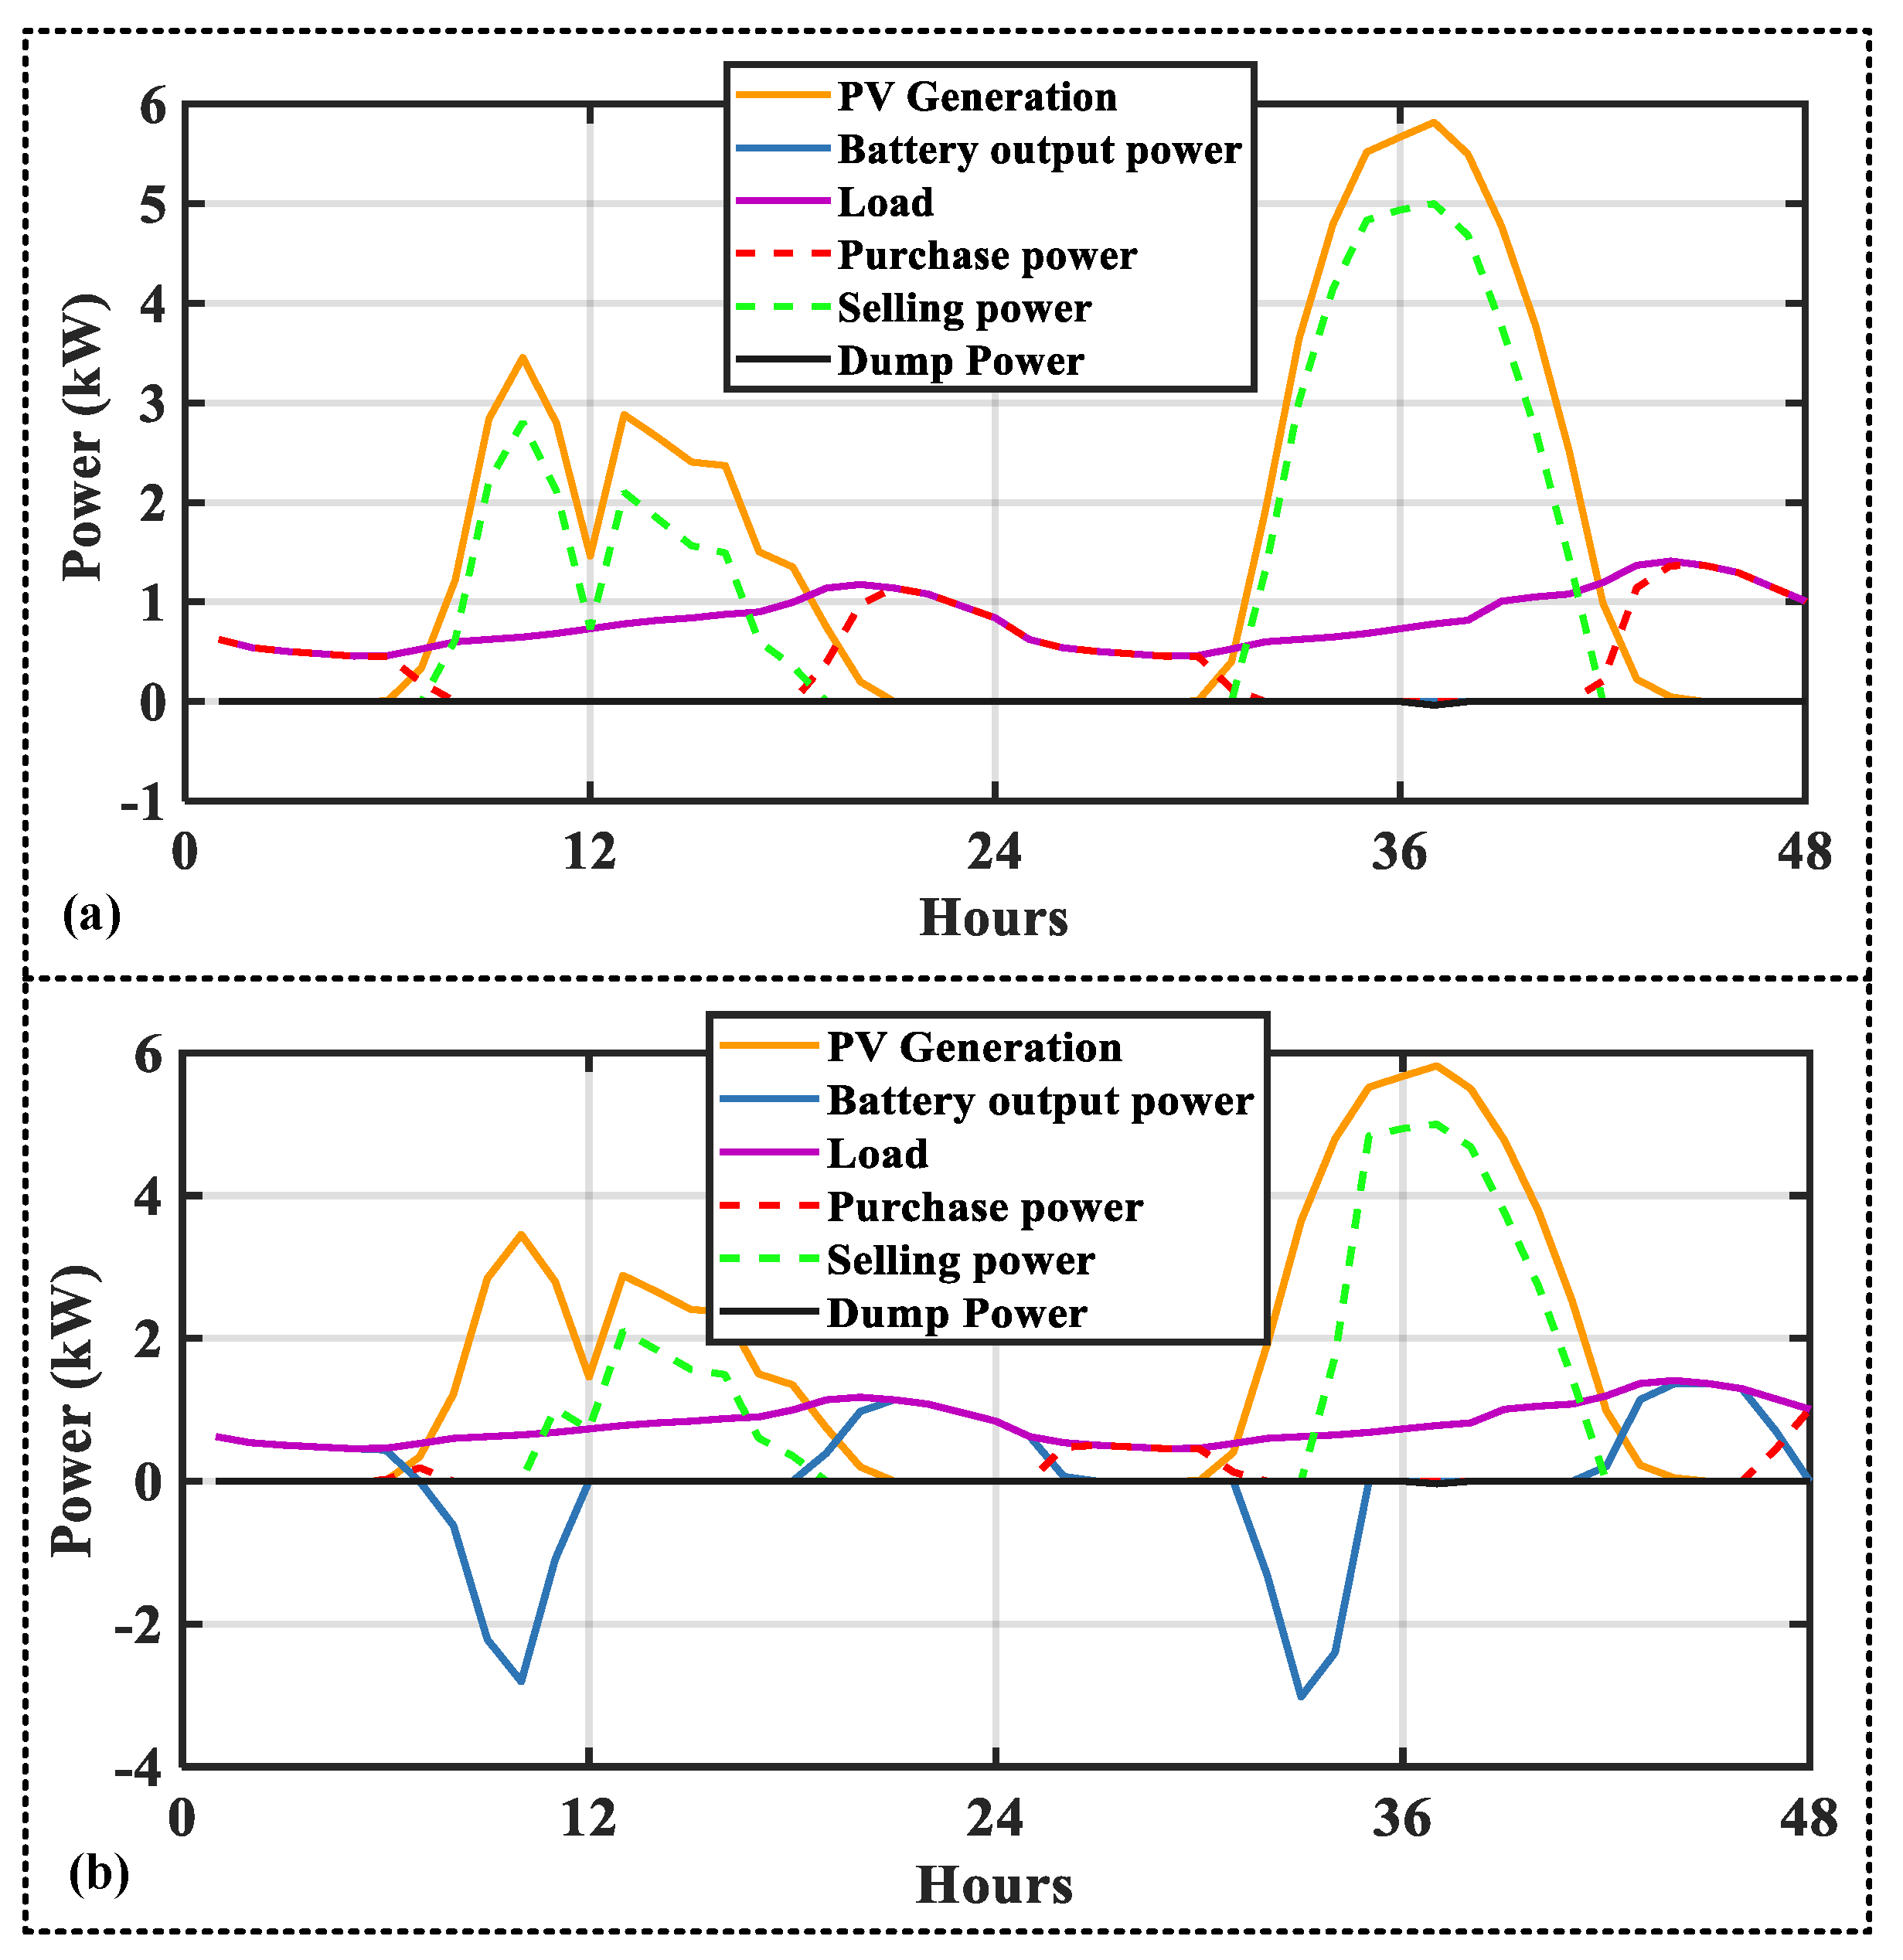
Figure 8 shows the daily power flow for two successive days (48 h) in winter using Option 2 for PV only and PV-BESS systems. In the winter, the rooftop PV system had less generation due to cloudy days with lower solar insolation. The sold electricity to the grid was much lower than that on summer days. As can be illustrated, the dumped energy was almost zero during the days in winter for both configurations since the extra power of PV was fully used to supply the load, selling to the grid, and charging the battery.
5.3. Sensitivity Analysis
Several sensitivity analyses are provided in this subsection as a function of the changes in the grid constraint, TOU rate, and flat rate. The optimal system configurations of Option 2, representing the best systems with the lowest costs, were examined for the sensitivity analyses.
For the GCHs in SA, there is a grid constraint to not export more than 5 kW to the grid at any time. It is vital to investigate the impacts of different values of the grid constraint on the optimal sizing model.
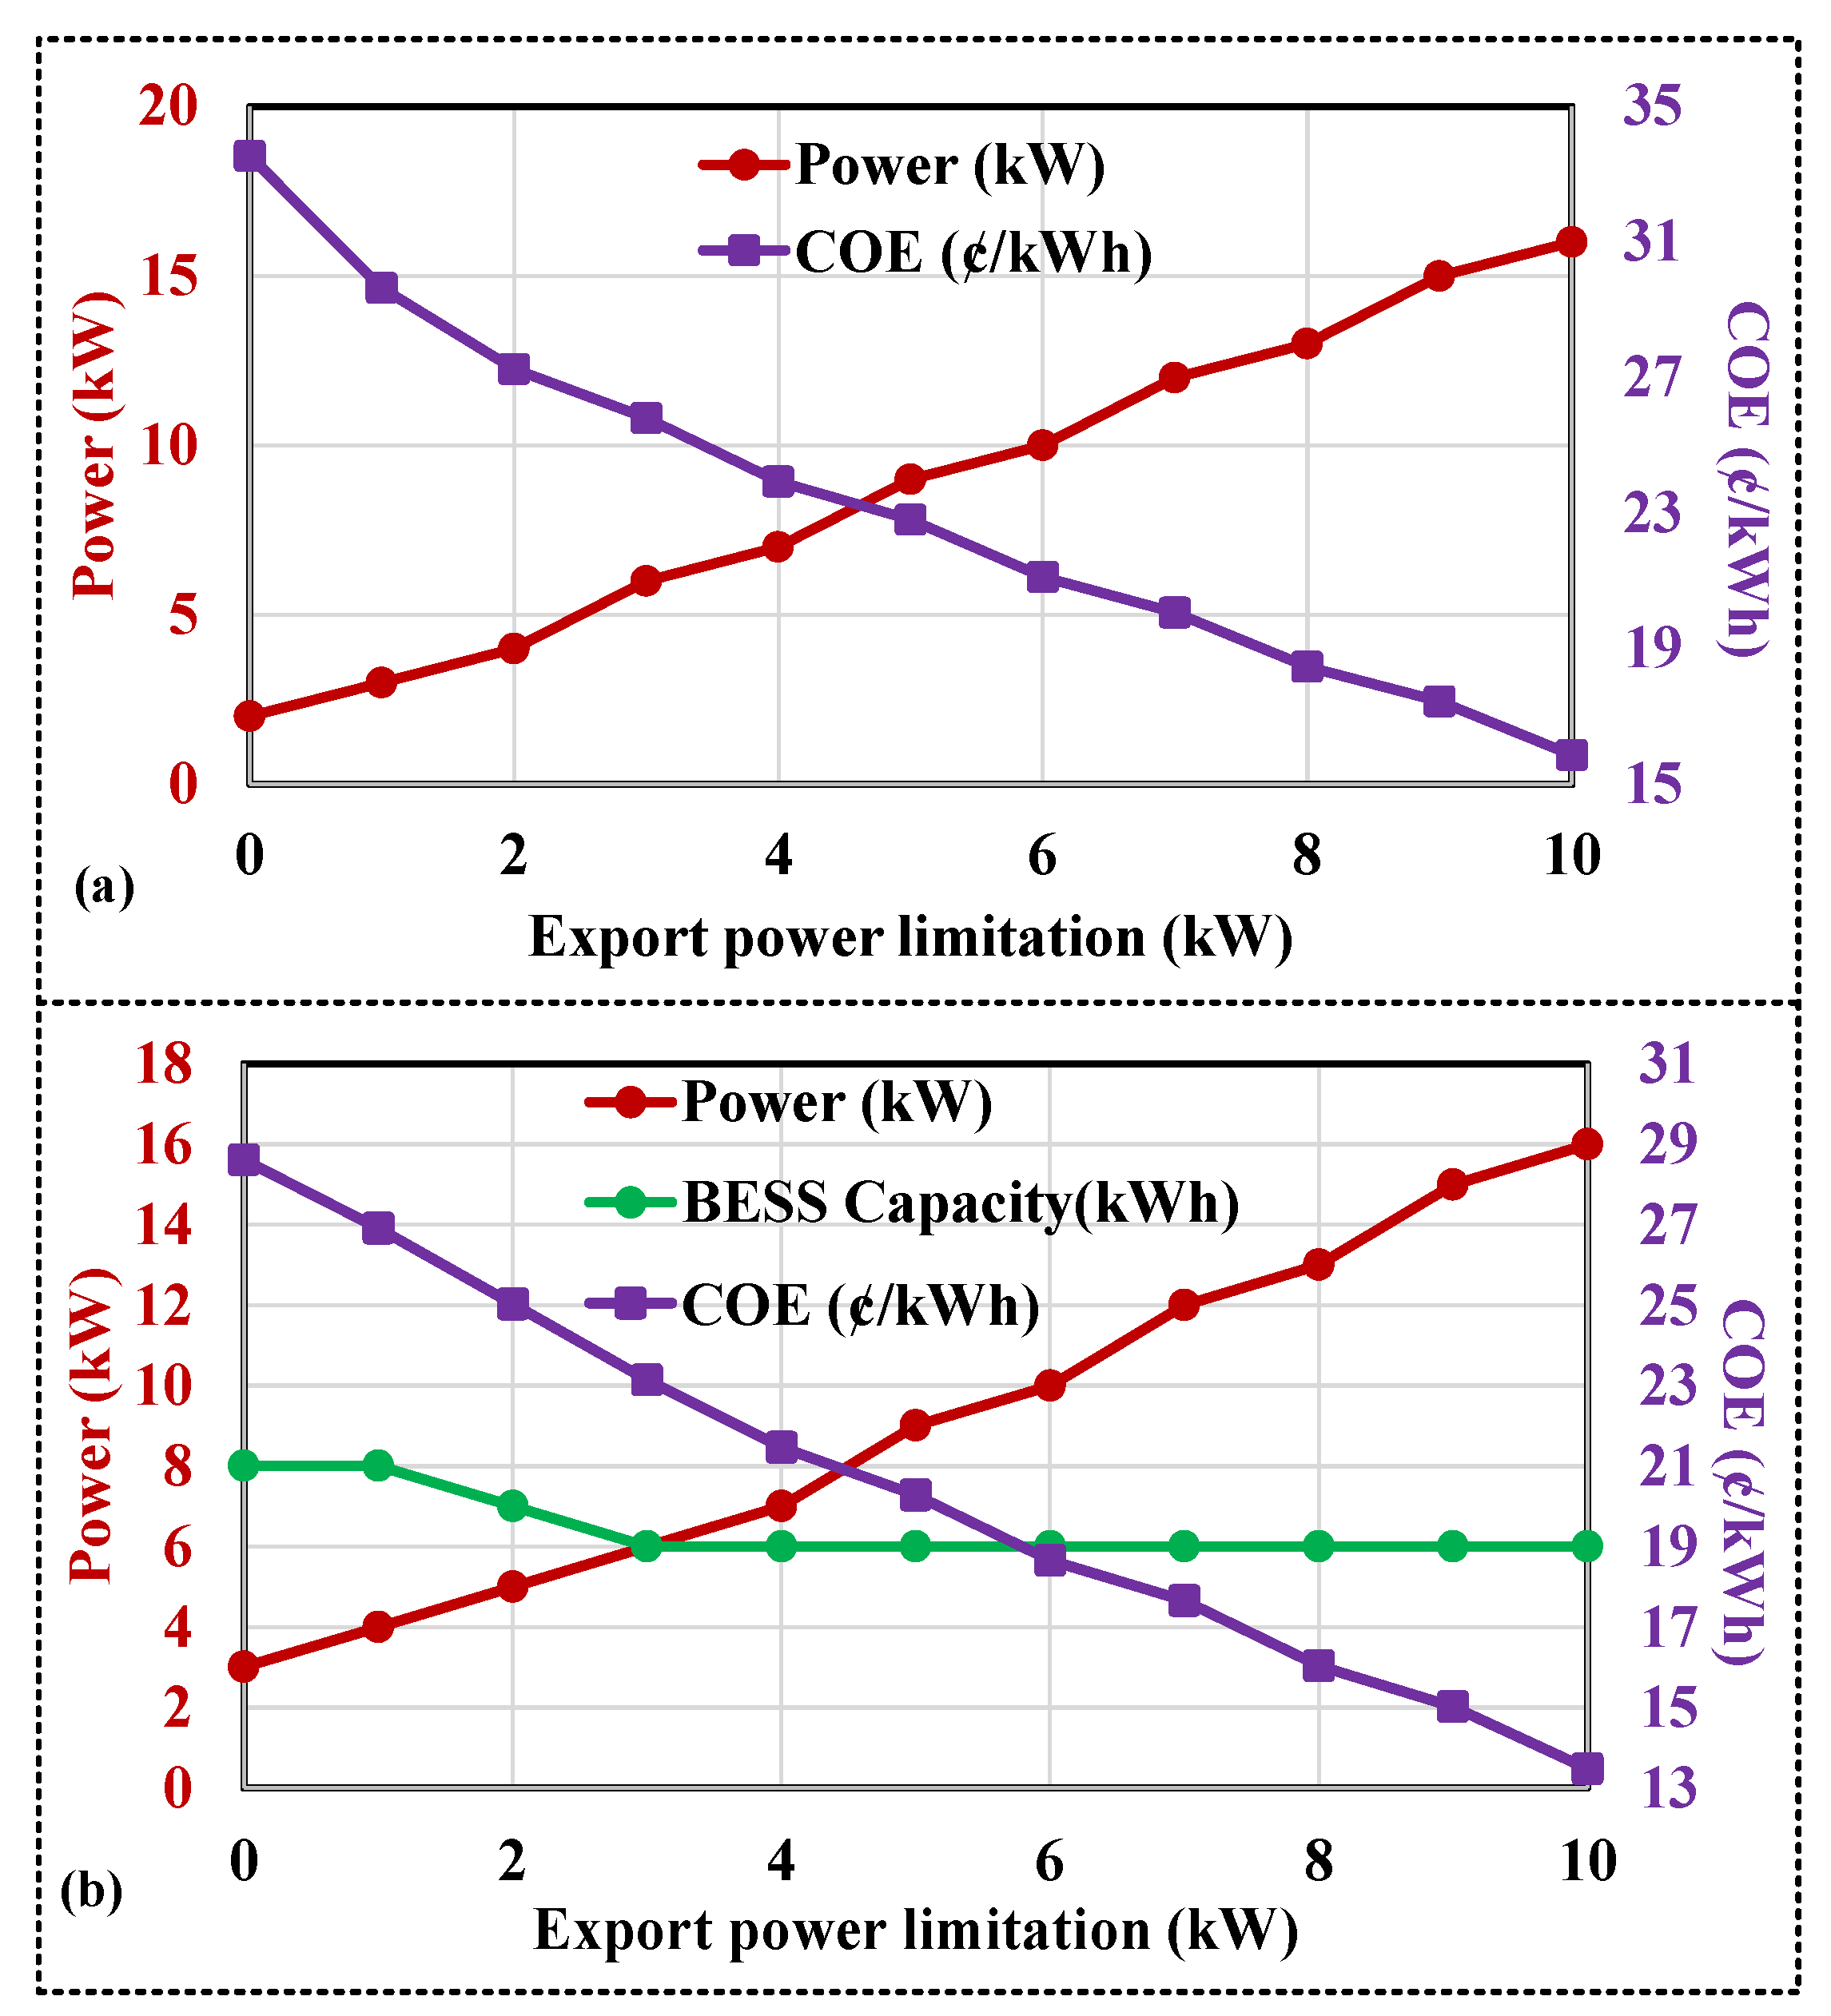
Figure 9 illustrates the sensitivity analysis for the impact of export power limitation in Option 2 for PV only and PV-BESS system configurations. The optimal capacities of PV and BESS, as well as the COE, are shown in
Figure 9. It is illustrated that, by decreasing the grid constraint, the optimal capacity of rooftop PV decreased accordingly. However, the COE of the configurations increased upon decreasing the export power limitation. For example, when the customers were prohibited to export any power to the grid, the optimal capacity of PV was obtained as 2 kW and 3 kW for Configurations 1 and 2, respectively. In Configuration 2, the BESS capacity did not change significantly upon changing the export power limitation. For export power limitations between 3 and 10 kW, the optimal capacity of BESS was 6 kWh and did not change.
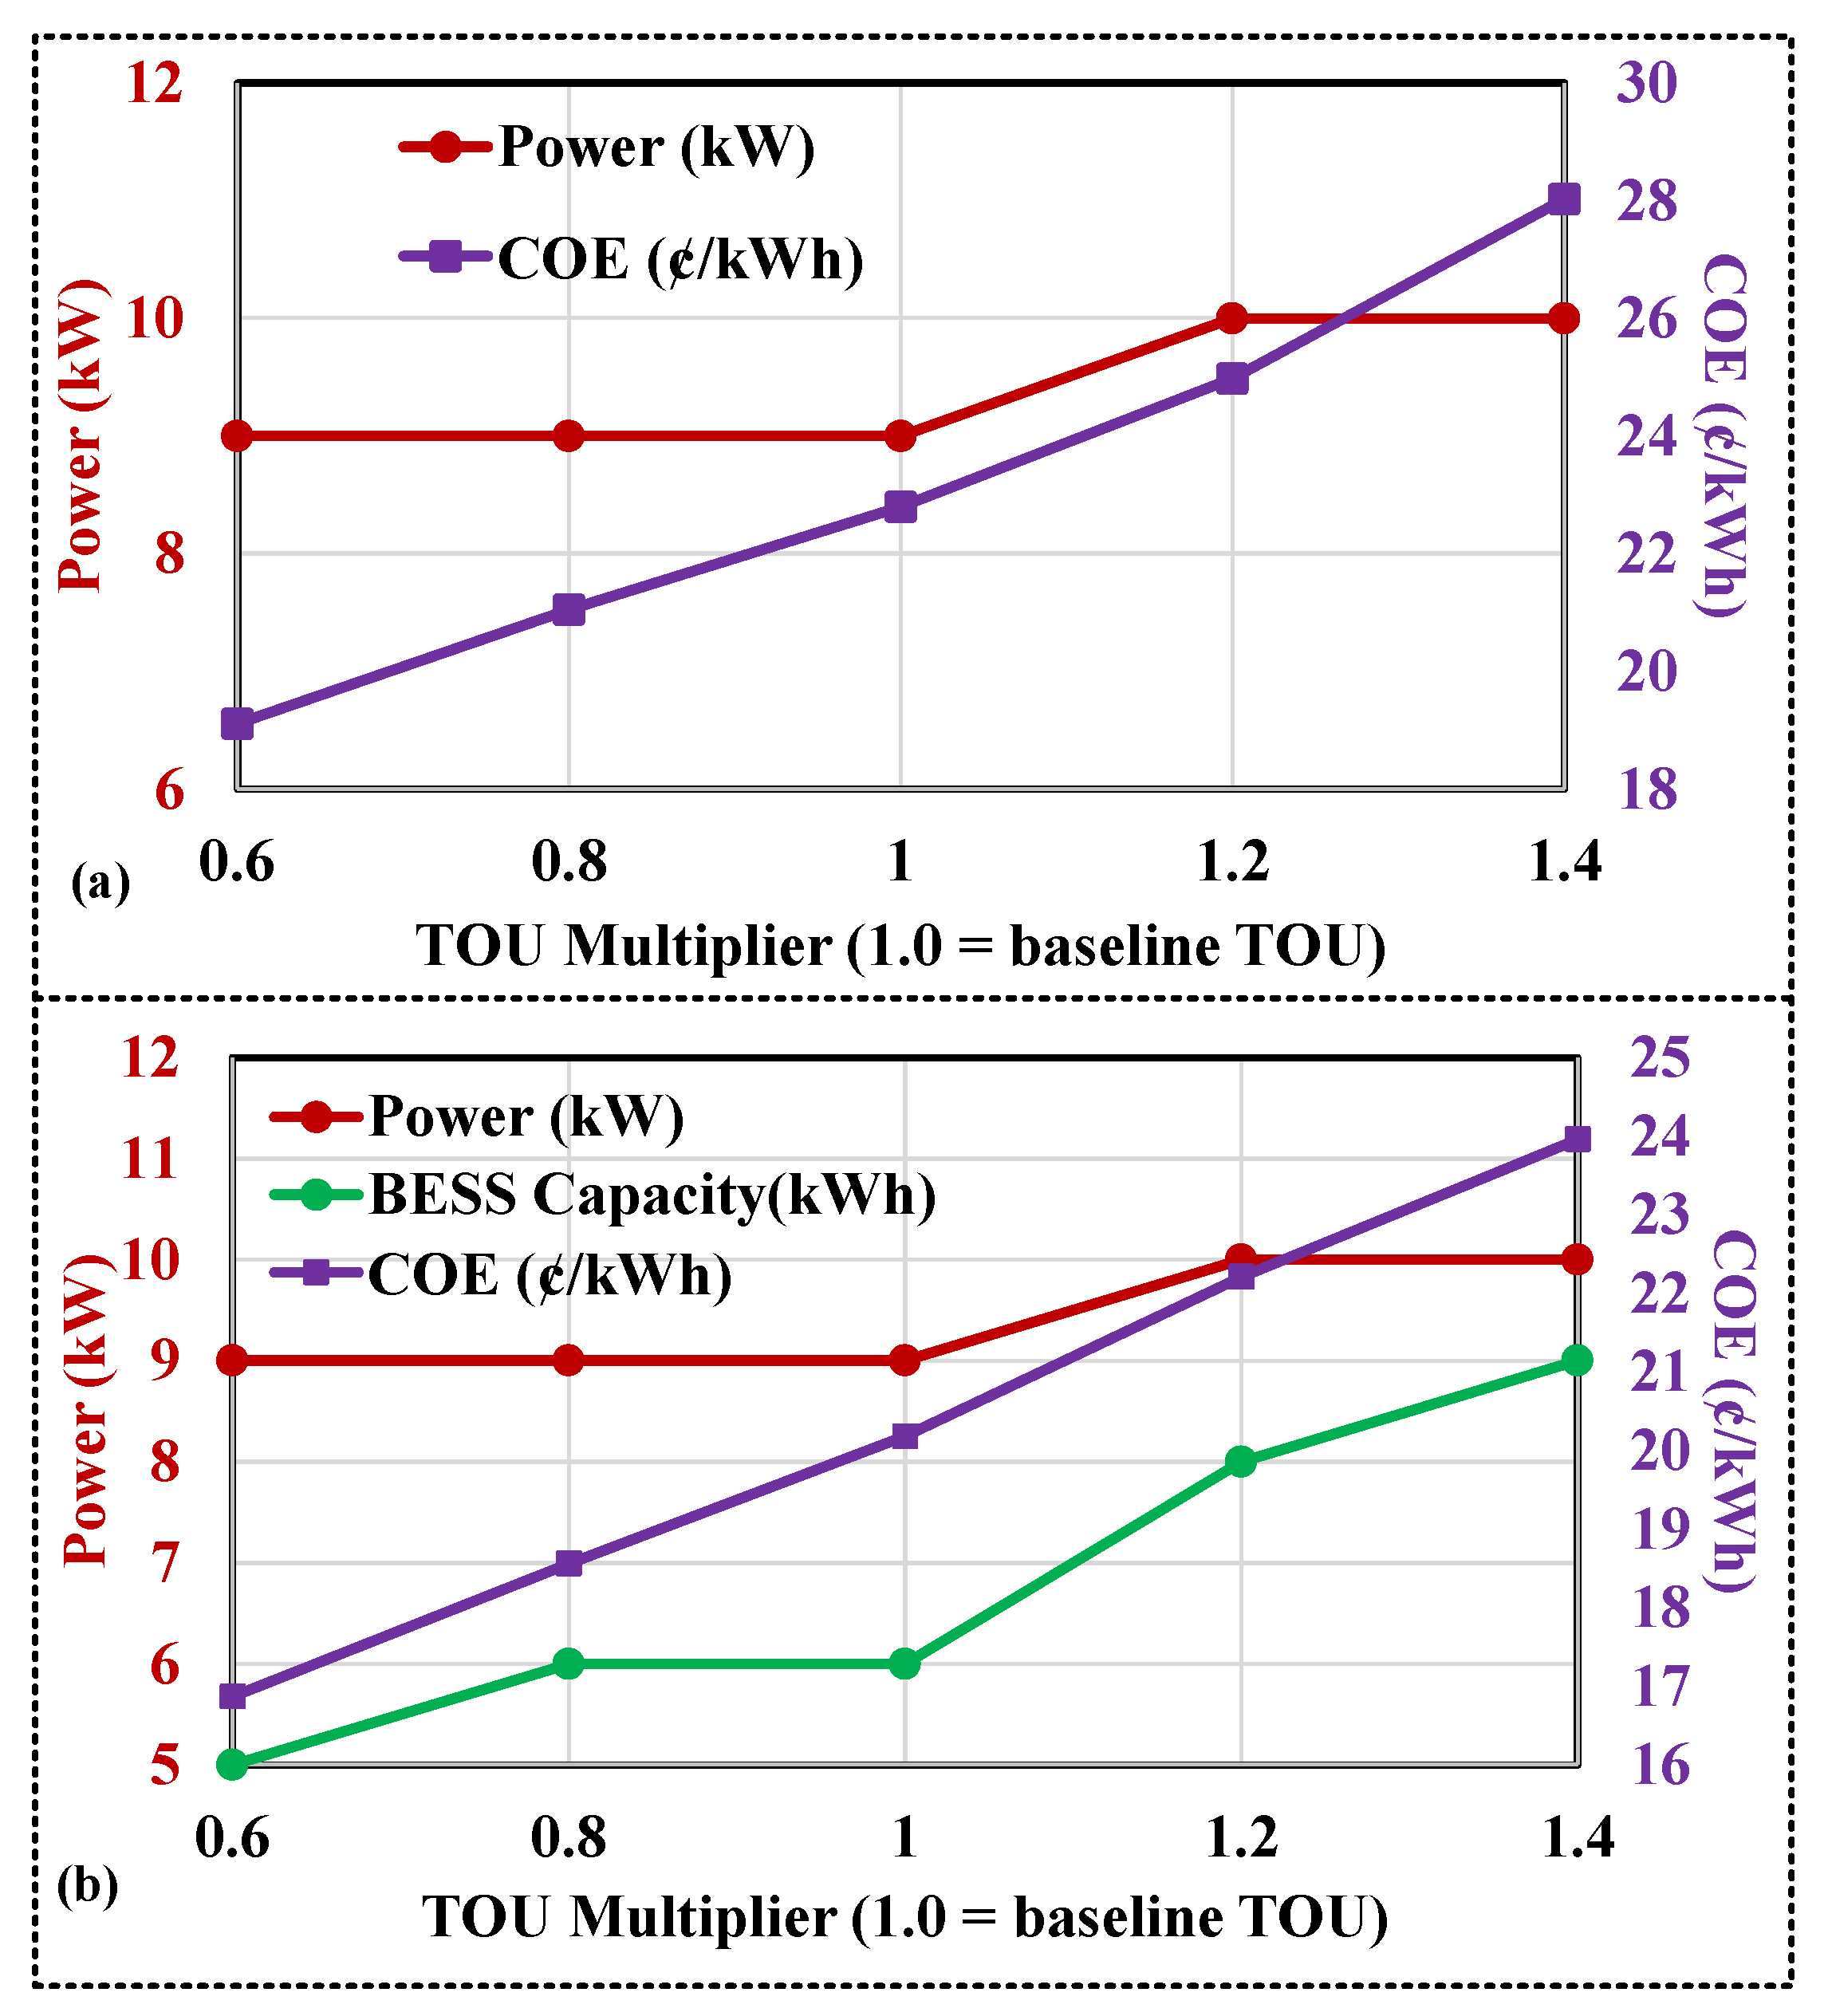
Figure 10 demonstrates the sensitivity analysis for the impact of TOU rates of purchasing electricity using option 2 for PV only and PV-BESS system configurations. By increasing the TOU rates, the COE was increased. For example, when the TOU rates were multiplied by 1.4, the COE was increased to 28 ¢/kWh and 24 ¢/kWh in Configurations 1 and 2, respectively. The capacity of PV showed a similar change pattern for both system configurations. It was increased to 10 kW when the TOU rates were increased from the current values. The optimal capacity of BESS was increased when the TOU rates increased in the PV-BESS configuration.
Figure 11 illustrates the sensitivity analysis for the impact of TOU rates of purchasing electricity using Option 2 for PV only and PV-BESS system configurations. The sensitivity analysis shows that, by increasing the FiT, the COE of both configurations was decreased, and the rooftop PV capacity was increased. The optimal capacity of BESS was increased from 2 kWh for an FiT of 5 ¢/kWh to 8 kWh for an FiT of 25 ¢/kWh.
6. Conclusions and Future Works
This research investigated the optimal sizing problem of PV and BESS for GCHs by considering flat and TOU rates for import/export electricity prices from/to the main grid. Two system configurations, PV only and PV-BESS, were optimally sized for four options of electricity rates: Flat-Flat, Flat-TOU, TOU-Flat, and TOU-TOU. A practical model was developed by considering grid constraints, daily supply of charge of electricity, salvation value and degradation of PV and BESS, actual annual data of load and solar, and current market price of components. The developed capacity optimization model was examined for a grid-connected house in Australia. It was found that the TOU-Flat option for the PV-BESS configuration achieved the lowest NPC and COE compared to other configuration and options. The optimal capacities of rooftop PV and BESS were obtained as 9 kW and 6 kWh, respectively, for the PV-BESS configuration with TOU-Flat. It was found that changing the export power limitation would significantly change the COE and optimal capacity of PV, whereas it did not affect the BESS capacity. The sensitivity analyses indicated that increasing the export power limitation, decreasing the import tariff, and increasing the FiT would significantly reduce the COE of the household.
Future studies may focus on the incorporation of demand response programs in households with different electricity pricing mechanisms. Hence, new analysis should be implemented to find the most suitable electricity tariffs for the customers.
Author Contributions
Conceptualization, I.J., R.K. and A.M.; methodology, R.K. and I.J.; software, R.K. and I.J.; validation, I.J., R.K. and A.M.; formal analysis, A.M., A.Y. and G.M.S.; investigation, R.K.; resources, A.M.; data curation, R.K.; writing—original draft preparation, R.K. and I.J.; writing—review and editing, A.M., A.Y., and G.M.S.; visualization, R.K.; supervision, A.M.; project administration, A.M.; funding acquisition, A.M., A.Y. and G.M.S. All authors read and agreed to the published version of the manuscript.
Funding
This research received no external funding.
Conflicts of Interest
The authors declare no conflict of interest.
Nomenclature
| Battery degradation (%) |
| Annual cost of electricity exchange with grid ($) |
| Yearly maintenance cost of components ($) |
| Replacement cost of components ($) |
| Components capital recovery factor |
| Electricity capital recovery factor |
| Feed-in-tariff price (¢/kWh) |
| Battery capacity (kWh) |
| Annual electricity demand (MWh) |
| Escalation rate (%) |
| Retail price (¢/kWh) |
| Interest/discount rates of electricity (%) |
| Interest/discount rates (%) |
| Total time interval (hr) |
| Component’s lifetime (year) |
| Number of components |
| Net present cost of components ($) |
| Net present cost of electricity exchange with grid ($) |
| Total net present cost ($) |
| Project lifetime (year) |
| Maximum allowable power of battery (kW) |
| Maximum export power limit to the grid (kW) |
| Maximum allowable power of PV (kW) |
| Charging/discharging power of battery (kW) |
| Available input/output power of battery (kW) |
| Load power (kW) |
| Export/import power to/from grid (kW) |
| Dumped power (kW) |
| Output power of rooftop PV (kW) |
| Capital present cost of components ($) |
| Maintenance present cost of components ($) |
| Replacement present cost of components ($) |
| Salvation present value of components ($) |
| Electricity interest/discounts rates (%) |
| Remaining lifetime of components at the end of project lifetime (year) |
| Maximum and minimum SOC of battery (%) |
| Year |
| Time interval (h) |
| Import/export efficiency of battery (%) |
References
- International Energy Agency. World Energy Outlook; IEA: Paris, France, 2018. [Google Scholar]
- Fang, Y.; Wei, W.; Mei, S.; Chen, L.; Zhang, X.; Huang, S. Promoting electric vehicle charging infrastructure considering policy incentives and user preferences: An evolutionary game model in a small-world network. J. Clean. Prod. 2020, 258, 120753. [Google Scholar] [CrossRef]
- Rashid, K. Design, Economics, and Real-Time Optimization of a Solar/Natural Gas Hybrid Power Plant. Ph.D. Thesis, The University of Utah, Salt Lake City, UT, USA, 2020. [Google Scholar]
- Ang, Y.Q.; Berzolla, Z.M.; Reinhart, C.F. From concept to application: A review of use cases in urban building energy modelling. Appl. Energy 2020, 279, 115738. [Google Scholar] [CrossRef]
- Khezri, R.; Mahmoudi, A.; Haque, M.H. A Demand Side Management Approach for Optimal Sizing of Standalone Renewable-Battery Systems. IEEE Trans. Sustain. Energy 2021. [Google Scholar] [CrossRef]
- Zunnurain, I.; Maruf, M.; Islam, N.; Rahman, M.; Shafiullah, G.M. Implementation of advanced demand side management for microgrid incorporating demand response and home energy management system. Infrastructures 2018, 3, 50. [Google Scholar] [CrossRef]
- Solar PV and Batteries|Energy.gov.au. Available online: https://www.energy.gov.au/households/solar-pv-and-batteries (accessed on 19 August 2020).
- Khezri, R.; Mahmoudi, A.; Haque, M.H. Optimal Capacity of PV and BES for Grid-connected Households in South Australia. In Proceedings of the 2019 IEEE Energy Conversion Congress and Exposition (ECCE), Baltimore, MD, USA, 29 September–3 October 2019; pp. 3483–3490. [Google Scholar]
- Vorrath, S. Australians Installed 22,661 Home Battery Systems in 2019. One Step off the Grid. 16 April 2020. Available online: https://onestepoffthegrid.com.au/australians-installed-22661-home-battery-systems-in-2019/ (accessed on 15 December 2020).
- Rahman, M.M.; Hettiwatte, S.; Shafiullah, G.M.; Arefi, A. An analysis of the time of use electricity price in the residential sector of Bangladesh. Energy Strategy Rev. 2017, 18, 183–198. [Google Scholar] [CrossRef]
- Khezri, R.; Mahmoudi, A. Review on the state-of-the-art multi-objective optimisation of hybrid standalone/grid-connected energy systems. IET Gener. Transm. Distrib. 2020, 14, 4285–4300. [Google Scholar] [CrossRef]
- Arabkoohsar, A.; Behzadi, A.; Alsagri, A. Techno-economic analysis and multi-objective optimization of a novel solar-based building energy system; An effort to reach the true meaning of zero-energy buildings. Energy Convers. Manag. 2021, 232, 113858. [Google Scholar] [CrossRef]
- Sheha, M.N.; Powell, K.M. Dynamic real-time optimization of air-conditioning systems in residential houses with a battery energy storage under different electricity pricing structures. Comput. Aided Chem. Eng. 2018, 44, 2527–2532. [Google Scholar]
- Bandyopadhyay, S.; Mouli, G.R.C.; Qin, Z.; Elizondo, L.R.; Bauer, P. Techno-Economical Model Based Optimal Sizing of PV-Battery Systems for Microgrids. IEEE Trans. Sustain. Energy 2020, 11, 1657–1668. [Google Scholar] [CrossRef]
- Schram, W.L.; Lampropoulos, I.; van Sark, W.G. Photovoltaic systems coupled with batteries that are optimally sized for household self-consumption: Assessment of peak shaving potential. Appl. Energy 2018, 223, 69–81. [Google Scholar] [CrossRef]
- Zhou, L.; Zhang, Y.; Lin, X.; Li, C.; Cai, Z.; Yang, P. Optimal Sizing of PV and BESS for a Smart Household Considering Different Price Mechanisms. IEEE Access 2018, 6, 41050–41059. [Google Scholar] [CrossRef]
- Li, J. Optimal sizing of grid-connected photovoltaic battery systems for residential houses in Australia. Renew. Energy 2019, 136, 1245–1254. [Google Scholar] [CrossRef]
- Khezri, R.; Mahmoudi, A.; Haque, M.H. Optimal Capacity of Solar PV and Battery Storage for Australian Grid-Connected Households. IEEE Trans. Ind. Appl. 2020, 56, 5319–5329. [Google Scholar] [CrossRef]
- Subramani, G.; Ramachandaramurthy, V.K.; Sanjeevikumar, P.; Holm-Nielsen, J.B.; Blaabjerg, F.; Zbigniew, L.; Kostyla, P. Techno-economic optimization of grid-connected photovoltaic (PV) and battery systems based on maximum demand reduction (MDRED) modelling in Malaysia. Energies 2019, 12, 3531. [Google Scholar] [CrossRef]
- Farrokhifar, M.; Aghdam, F.H.; Alahyari, A.; Monavari, A.; Safari, A. Optimal energy management and sizing of renewable energy and battery systems in residential sectors via a stochastic MILP model. Electr. Power Syst. Res. 2018, 129, 513–526. [Google Scholar] [CrossRef]
- Koskela, J.; Rautiainen, A.; Järventausta, P. Using electrical energy storage in residential buildings–Sizing of battery and photovoltaic panels based on electricity cost optimization. Appl. Energy 2019, 239, 1175–1189. [Google Scholar] [CrossRef]
- Beck, T.; Kondziella, H.; Huard, G.; Bruckner, T. Assessing the influence of the temporal resolution of electrical load and PV generation profiles on self-consumption and sizing of PV-battery systems. Appl. Energy 2016, 173, 331–342. [Google Scholar] [CrossRef]
- Rad, M.A.V.; Toopshekan, A.; Rahdan, P.; Kasaeian, A.; Mahian, O. A comprehensive study of techno-economic and environmental features of different solar tracking systems for residential photovoltaic installations. Renew. Sustain. Energy Rev. 2020, 129, 109923. [Google Scholar]
- Hesse, H.C.; Martins, R.; Musilek, P.; Naumann, M.; Truong, C.; Jossen, A. Economic optimization of component sizing for residential battery storage systems. Energies 2017, 10, 835. [Google Scholar] [CrossRef]
- Alramlawi, M.; Li, P. Design Optimization of a Residential PV-Battery Microgrid with a Detailed Battery Lifetime Estimation Model. IEEE Trans. Ind. Appl. 2020, 56, 2020–2030. [Google Scholar] [CrossRef]
- Sharma, V.; Haque, M.H.; Aziz, S.M. Energy cost minimization for net zero energy homes through optimal sizing of battery storage system. Renew. Energy 2019, 141, 278–286. [Google Scholar] [CrossRef]
- Dragičević, T.; Pandžić, H.; Škrlec, D.; Kuzle, I.; Guerrero, J.M.; Kirschen, D.S. Capacity optimization of renewable energy sources and battery storage in an autonomous telecommunication facility. IEEE Trans. Sustain. Energy 2014, 5, 1367–1378. [Google Scholar] [CrossRef]
- Combe, M.; Mahmoudi, A.; Haque, M.H.; Khezri, R. Cost effective sizing of an AC mini-grid hybrid power system for a remote area in South Australia. IET Gener. Transm. Distrib. 2019, 13, 277–287. [Google Scholar] [CrossRef]
- Mohandes, B.; Acharya, S.; Moursi, M.S.E.; Al-Sumaiti, A.S.; Doukas, H.; Sgouridis, S. Optimal Design of an Islanded Microgrid with Load Shifting Mechanism Between Electrical and Thermal Energy Storage Systems. IEEE Trans. Power Syst. 2020, 35, 2642–2657. [Google Scholar] [CrossRef]
- Combe, M.; Mahmoudi, A.; Haque, M.H.; Khezri, R. Optimal sizing of an AC-coupled hybrid power system considering incentive-based demand response. IET Gener. Transm. Distrib. 2019, 13, 3354–3361. [Google Scholar] [CrossRef]
- Combe, M.; Mahmoudi, A.; Haque, M.H.; Khezri, R. AC-Coupled Hybrid Power System Optimisation for an Australian Remote Community. Int. Trans. Electr. Energy Syst. 2020, 30, e12503. [Google Scholar] [CrossRef]
- Khezri, R.; Mahmoudi, A.; Haque, M.H. SWT and BES Optimisation for Grid-connected Households in South Australia. In Proceedings of the 2019 IEEE Energy Conversion Congress and Exposition (ECCE), Baltimore, MD, USA, 29 September–3 October 2019; pp. 418–425. [Google Scholar]
- Khezri, R.; Mahmoudi, A.; Aki, H. Multi-Objective Optimization of Solar PV and Battery Storage System for A Grid-Connected Household. In Proceedings of the 2020 IEEE International Conference on Power Electronics, Drives and Energy Systems (PEDES), Jaipur, India, 16–19 December 2020; pp. 1–6. [Google Scholar]
Figure 1.
Two system configurations for a grid-connected house.
Figure 1.
Two system configurations for a grid-connected house.
Figure 2.
Rule-based home energy management system for PV only system.
Figure 2.
Rule-based home energy management system for PV only system.
Figure 3.
Rule-based home energy management system for PV-BESS system.
Figure 3.
Rule-based home energy management system for PV-BESS system.
Figure 4.
Optimization flowchart for sizing of PV and BESS.
Figure 4.
Optimization flowchart for sizing of PV and BESS.
Figure 5.
Annual variations of (a) electricity consumption, (b) solar insolation, and (c) ambient temperature.
Figure 5.
Annual variations of (a) electricity consumption, (b) solar insolation, and (c) ambient temperature.
Figure 6.
COE comparison of different options for the investigated system configurations.
Figure 6.
COE comparison of different options for the investigated system configurations.
Figure 7.
Daily power flow for two sample days in summer using Option 2: (a) PV only system; (b) PV-BESS system.
Figure 7.
Daily power flow for two sample days in summer using Option 2: (a) PV only system; (b) PV-BESS system.
Figure 8.
Daily power flow for two sample days in winter using Option 2: (a) PV only system; (b) PV-BESS system.
Figure 8.
Daily power flow for two sample days in winter using Option 2: (a) PV only system; (b) PV-BESS system.
Figure 9.
Sensitivity analysis for the impact of export power limitation using Option 2: (a) PV only; (b) PV-BESS.
Figure 9.
Sensitivity analysis for the impact of export power limitation using Option 2: (a) PV only; (b) PV-BESS.
Figure 10.
Sensitivity analysis for the impact of TOU rates using Option 2: (a) PV only system; (b) PV-BESS system.
Figure 10.
Sensitivity analysis for the impact of TOU rates using Option 2: (a) PV only system; (b) PV-BESS system.
Figure 11.
Sensitivity analysis for the impact of FiT price using option 2: (a) PV only; (b) PV–BESS.
Figure 11.
Sensitivity analysis for the impact of FiT price using option 2: (a) PV only; (b) PV–BESS.
Table 1.
Summary of limitations of existing studies on optimal sizing of PV and BESS for GCHs.
Table 1.
Summary of limitations of existing studies on optimal sizing of PV and BESS for GCHs.
| Reference | Electricity Rate | DSOC | Degradation of BESS | Grid Constraint | Salvation Value |
|---|
| [12] | Flat | ✗ | ✗ | ✓ | ✗ |
| [13] | TOU and RTP | ✗ | ✗ | ✗ | ✗ |
| [14] | TOU | ✓ | ✓ | ✗ | ✗ |
| [15] | Flat | ✗ | ✓ | ✗ | ✗ |
| [16] | Flat and TOU | ✗ | ✗ | ✓ | ✗ |
| [17] | TOU | ✓ | ✗ | ✗ | ✗ |
| [18] | Flat | ✗ | ✗ | ✓ | ✗ |
| [19] | TOU | ✓ | ✗ | ✗ | ✗ |
| [20] | Flat | ✗ | ✗ | ✓ | ✗ |
| [21] | TOU | ✓ | ✗ | ✗ | ✗ |
| [22] | Flat | ✗ | ✗ | ✓ | ✗ |
| [23] | TOU | ✗ | ✗ | ✗ | ✗ |
| [24] | Flat | ✗ | ✓ | ✗ | ✗ |
| [25] | Flat | ✗ | ✓ | ✗ | ✗ |
| [26] | Flat | ✓ | ✗ | ✗ | ✗ |
| This study | Flat and TOU | ✓ | ✓ | ✓ | ✓ |
Table 2.
Parameters associated with the optimal sizing project for the case study.
Table 2.
Parameters associated with the optimal sizing project for the case study.
| Parameter | Value | Parameter | Value |
|---|
| Grid export limit (kW) | 5 | Electricity supply charge (¢/day) | 0.79 |
| Escalation Rate (%) | 2 | Project lifetime (years) | 20 |
| Interest/Discount Rate (%) | 8 | | |
Table 3.
Economic data of the proposed EMS.
Table 3.
Economic data of the proposed EMS.
| Electricity Exchange | Purchasing (¢/kWh) | Selling (¢/kWh) |
|---|
| Flat rates | 48.00 | 17.00 |
| ToU rates during Peak | 58.01 | 18.00 |
| ToU rates during Shoulder | 39.93 | 10.00 |
| ToU rates during Off-Peak | 25.41 | 5.00 |
Table 4.
Rooftop PV and BESS characteristics for the optimal sizing model.
Table 4.
Rooftop PV and BESS characteristics for the optimal sizing model.
| Component | Size Unit | Capital Cost | Replacement Cost | Maintenance Cost | Lifetime |
|---|
| PV | 1 kW | $1500 | $300 (for inverter in 10th year) | $50/year | 25 years |
| BESS | 1 kWh/0.5 kW | $350 | $ 200 | N/A | TBD after annual operation |
Table 5.
Different options based on the type of the electricity rate for retail price and feed-in-tariff.
Table 5.
Different options based on the type of the electricity rate for retail price and feed-in-tariff.
| Options | Retail Price | Feed-in-Tariff |
|---|
| 1 | Flat | Flat |
| 2 | TOU | Flat |
| 3 | Flat | TOU |
| 4 | TOU | TOU |
Table 6.
Optimal results for both system configurations with Option 1 (Flat–Flat).
Table 6.
Optimal results for both system configurations with Option 1 (Flat–Flat).
| Configuration | PV (kW) | BESS (kWh) | NPCt
($) | COE (¢/kWh) | AIEG (MWh) | AEEG (MWh) | ADE (MWh) | BESS CD (%) | BESS Lifetime (Year) |
|---|
| PV only | 9 | - | 15,113.70 | 28.08 | 3.25 | 11.13 | 0.52 | - | - |
| PV-BESS | 9 | 10 | 12,116.32 | 24.73 | 0.76 | 7.99 | 0.43 | 1.32 | 15 |
| Normal | - | - | 31,710.99 | 48.00 | 5.70 | - | - | - | - |
Table 7.
Optimal results for both system configurations with Option 2 (TOU-Flat).
Table 7.
Optimal results for both system configurations with Option 2 (TOU-Flat).
| Configuration | PV (kW) | BESS (kWh) | NPCt
($) | COE (¢/kWh) | AIEG (MWh) | AEEG (MWh) | ADE (MWh) | BESS CD (%) | |
|---|
| PV only | 9 | - | 11,624.43 | 22.80 | 3.62 | 11.13 | 0.52 | - | - |
| PV-BESS | 9 | 6 | 9479.90 | 20.18 | 1.69 | 9.18 | 0.45 | 1.46 | 13 |
| Normal | - | - | 26,509.02 | 40.13 | 5.70 | - | - | - | - |
Table 8.
Optimal results for both system configurations with Option 3 (Flat–TOU).
Table 8.
Optimal results for both system configurations with Option 3 (Flat–TOU).
| Configuration | PV (kW) | BESS (kWh) | NPCt
($) | COE (¢/kWh) | AIEG (MWh) | AEEG (MWh) | ADE (MWh) | BESS CD (%) | |
|---|
| PV only | 2 | - | 24,808.31 | 38.71 | 3.74 | 1.18 | 0.00 | - | - |
| PV-BESS | 4 | 10 | 19,622.06 | 33.22 | 1.24 | 1.12 | 0.00 | 0.97 | 20 |
| Normal | - | - | 31,710.99 | 48.00 | 5.70 | - | - | - | - |
Table 9.
Optimal results for both system configurations with Option 4 (TOU-TOU).
Table 9.
Optimal results for both system configurations with Option 4 (TOU-TOU).
| Configuration | PV (kW) | BESS (kWh) | NPCt
($) | COE (¢/kWh) | AIEG (MWh) | AEEG (MWh) | ADE (MWh) | BESS CD (%) | |
|---|
| PV only | 2 | - | 21,164.37 | 33.19 | 3.72 | 1.18 | 0.00 | - | - |
| PV-BESS | 3 | 8 | 17,040.57 | 28.49 | 1.92 | 0.40 | 0.00 | 0.92 | 20 |
| Normal | - | - | 26,509.02 | 40.13 | 5.70 | - | - | - | - |
| Publisher’s Note: MDPI stays neutral with regard to jurisdictional claims in published maps and institutional affiliations. |
© 2021 by the authors. Licensee MDPI, Basel, Switzerland. This article is an open access article distributed under the terms and conditions of the Creative Commons Attribution (CC BY) license (https://creativecommons.org/licenses/by/4.0/).


