Article

Oxytetracycline Adsorption from Aqueous Solutions on Commercial and High-Temperature Modified Activated Carbons

by
Joanna Lach
1,*,
Agnieszka Ociepa-Kubicka
2 and
Maciej Mrowiec
1
1
Faculty of Infrastructure and Environment, Czestochowa University of Technology, 42-200 Częstochowa, Poland
2
Faculty of Management, Czestochowa University of Technology, 42-200 Częstochowa, Poland
*
Author to whom correspondence should be addressed.
Energies 2021, 14(12), 3481; https://doi.org/10.3390/en14123481
Submission received: 19 May 2021 / Revised: 4 June 2021 / Accepted: 6 June 2021 / Published: 11 June 2021

Abstract

:
The aim of the work was to evaluate the possibility of using commercial and modified activated carbons for the removal of oxytetracycline from aqueous solutions. The kinetics and statics of adsorption as well as the effect of the activated carbon dose and solution pH on the efficiency of the oxytetracycline adsorption were analyzed. Based on the study of oxytetracycline adsorption isotherms, the activated carbons were ranked in the following order: F-300 > WG-12 > Picabiol > ROW08 > WACC 8 × 30 > F-100 > WAZ 0.6–2.4. The most effective activated carbons were characterized by large specific surfaces. The best matching results were obtained for: Redlich–Peterson, Thot and Jovanovic models, and lower for the most frequently used Freundlich and Langmuir models. The adsorption proceeded better from solutions with pH = 6 than with pH = 3 and 10. Two ways of modifying activated carbon were also assessed. A proprietary method of activated carbon modification was proposed. It uses the heating of activated carbon as a result of current flow through its bed. Both carbons modified at 400 °C in the rotary kiln and on the proprietary SEOW (Joule-heat) modification stand enabled to obtain adsorbents with higher and comparable monolayer capacities. The advantage of the proposed modification method is low electricity consumption.

1. Introduction

The pharmaceutical industry is one of the most dynamically developing branches of the economy in the world. According to the European Federation of Pharmaceutical Industries and Associations (EFPIA), the production value of the pharmaceutical industry in Europe in 2017 increased by 25.8% compared to 2010 and by as much as 96.8% compared to 2000. The production value of the pharmaceutical industry in Europe (according to EFPIA) in 2018 was around 260 billion Euros. The result of such a large production and consumption of medicines is their presence in the environment. Currently, almost all types of medicines are identified in raw and treated wastewater, surface waters, groundwater and even drinking water [1].
Antibiotics are an important group of pharmaceuticals identified in the environment. The discovery of penicillin by Alexander Fleming almost a century ago started a new era in medicine. However, today there is a great danger of returning to the pre-antibiotic era due to the rapid increase in resistance of many bacterial strains. Currently, there are strains resistant to all antibiotics (superbugs) that can be used in a given disease. The superbugs cause the death of 33,000 people in Europe every year [2]. Antimicrobial resistance is a natural process, but it has been greatly accelerated by the incorrect use of antibiotics. The problem is their excessive, often irrational use in human and animal treatment, but also their use as animal growth promoters [3,4].
On average, 70% of antibiotics used on humans or animals are excreted in their unchanged form into the wastewater [5]. Antibiotics present in wastewater are one of the causes of bacterial drug resistance due to their relatively low concentrations. Antibiotics at such low concentrations do not work bactericidally, but enable the creation of drug resistance of microorganisms [6,7]. It was also found that the continuous activity of antibiotics in human food has a negative effect on health [8,9]. The effect of this is inter alia decreased immunity, obesity, type 2 diabetes, change in the structure of gut microbiota [10,11]. Moreover, antibiotics have carcinogenic, teratogenic and mutagenic properties [12]. Some antibiotics act like hormones and may interfere with physiological functions [12,13].
A large load of antibiotics is introduced along with wastewater. Conventional wastewater treatment plants are often ineffective in the case of these pollutants [14,15]. Moreover, the presence of antibiotics in wastewater may disrupt the operation of the biological part of the sewage treatment plant [16,17]. The consequence of this is the presence of antibiotics in surface waters and groundwater. Furthermore, the great number of antibiotics used in human medicine, veterinary medicine and agriculture can be also found in surface waters.
One of the groups of antibiotics often found in the environment are tetracyclines (tetracycline TC, chlortetracycline CTC, oxytetracycline OTC and doxycycline DOX). They are very often used in pig and poultry farming [18]. Their biodegradation is difficult (24% in 10–180 days) [19]. Their presence is detected in raw and treated wastewater in various parts of the world [15,20]. The result of their presence in treated wastewater and their use in agriculture is their presence in surface waters (Table 1).
Their presence was also found in drinking water: OTC China 0.6 ng/L; TC 1.1 ng/L [26]. The presence of tetracyclines was also found in bottled water in China from China as well as Germany, France, the USA and Japan [27]. It should be emphasized that antibiotic studies in wastewater, surface waters as well as drinking water are carried out randomly and therefore this matter is still not completely understood. Many waters have never been tested in this respect, and the surveying carried out are not only random, but are limited to selected antibiotics only.
In recent years, the literature described various methods of removing antibiotics from water and wastewater: bioelectrochemical systems [28], photocatalytic systems [29], advanced oxidation process [30], microbiological methods [31], adsorption methods [32]. All the aforementioned methods, except from adsorption, can cause incomplete decay of antibiotics (especially in the industrial scale) and the appearance of more dangerous products than the initial compound [33,34]. The methods are also expensive, complex and very often unstable. Adsorption as a method which does not create any by-products is simple to apply, versatile, highly effective, cheap and seems to be the most promising strategy for removing antibiotics of various properties from water [35,36,37,38]. A great number of researchers perceive the activated carbons as very effective absorbents of tetracyclines in connection with their large specific surface area and the possibility of interactions of electrons π–π with the molecules TC [39,40]. In the scientific literature there is described the adsorption of about 30 out of 250 types of antibiotics. Furthermore, the results of the adsorptions depend also on the used sorbent and on the conditions of the ongoing process [41].
The aim of the study is to analyze the possibility of using various commercial activated carbons to remove oxytetracycline from aqueous solutions.

2. Materials and Methods

2.1. Oxytetracycline Adsorption Research

Oxytetracycline used in the research was purchased from Acros Organics Polska (Antwerp, Belgium). Oxytetracycline adsorption measurements (C22H24N2O9 molar mass of 460.46 g/mol) were carried out from one-component aqueous solutions made of deionized water and oxytetracycline (Table 2). Oxytetracycline concentrations were quantified with a UV-Vis spectrophotometer at the wave length of λ = 275 nm. Tetracycline concentration measurements with the spectrophotometric method were also used by other researchers [42,43,44,45].
Both measurements of kinetics and adsorption statics were carried out from 0.1 dm3 solutions to which 0.2 g of sorbent was added and mixed on a mechanical vortexer at a speed of 160 rpm. The adsorption kinetics was measured with the use of solutions with a pH = 6 ± 0.2 and an oxytetracycline concentration of 100 mg/dm3. In order to determine the adsorption kinetics, samples were taken every 0.5 h. The adsorption isotherms were measured from solutions with pH = 3; 6 and 10 ± 0.2 and at concentrations of: 60, 80, 100, 120, 150, 170 and 200 mg/dm3. The desirable pH value was obtained by adding HCl or NaOH solutions. A 10 h time of mixing the solutions with activated carbon was assumed for the measurements of adsorption isotherms. The mixture of the solution with activated carbon was then left for the next 14 h without shaking, which enabled to determine the concentrations on the next day. It was adopted based on the results of the adsorption kinetics study for three selected activated carbons.

2.2. Models for Isotherm and Adsorption Kinetics

The following models of adsorption kinetics were used to describe the adsorption kinetics: pseudo-first-order (PFO, pseudo-second-order (PSO), Elovich and intraparticle diffusion model (Weber–Morris) (Table 3). The oxytetracycline adsorption data can be described by means of models of Freundlich, Langmuir, Tempkin, Redlich–Peterson, Javanovica, Halseya and Thot (Table 4). The constants in the applied models were determined by the nonlinear regression method using the addition of Solver to the Excel spreadsheet.

2.3. Adsorbents Used

Seven commercial activated carbons used in water treatment plants were used in the oxytetracycline adsorption studies. These were 2 formed granulated activated carbons: WG-12 (Gryfskand, Gryfino, Poland) and ROW 08 Supra (NORIT, Pepinster, Belgium) and five gra-activated carbons: Picabiol (Jacobi Carbons, Kalmar, Sweden), Filtrasorb 300 and Filtrasorb 100 (Chemviron, Moon Township, PA, USA; Carbon, Racibórz, Poland), WACC 8 × 30, WAZ 0.6–2.4 (Carbon, Racibórz, Poland) (Table 5).
The surface acidic and basic functional groups were determined with the method developed by Boehm [54].
  • FTIR spectra of the carbon samples were measured by means of a Perkin-Elmer FTIR Spectrum 2000 spectrometer (Perkin-Elmer, Waltham, MA, USA). The measurements were carried out in infrared (wave numbers 4000–400 cm−1) at T  =  22 °C, resolution 4 cm−1 and number of scans 50 was recorded. Before the sample measurement, a “spectrum of atmosphere” was recorded and subtracted automatically as background during the registration of spectra for the investigated samples. The samples were mixed with KBr (in ratio 1/300 mg), heated at 100 °C under vacuum (p = 10–3 Torr) to remove traces of H2O and finally pressed in a hydraulic press.
  • Pore texture parameters were determined from nitrogen adsorption-desorption isotherms measured at 77 K with a Micromeritics model ASAP 2010 sorptometer (Micromeritics, Brussels, Belgium). Surface area measurements were taken from adsorption isotherms using the BET equation. The volume of macropores was determined using the Semilab PS-2000 porosimeter (Semilab, Budapest, Hungary). The pore volume of activated carbon was measured using the Horvath-Kawazoe method. The bulk density was determined in accordance with PN-EN 12915-1 standard, the iodine number (IN) with PN-EN 1290, and the methylene number (MN) with PN-83/C-97555.

2.4. Modification of Activated Carbon

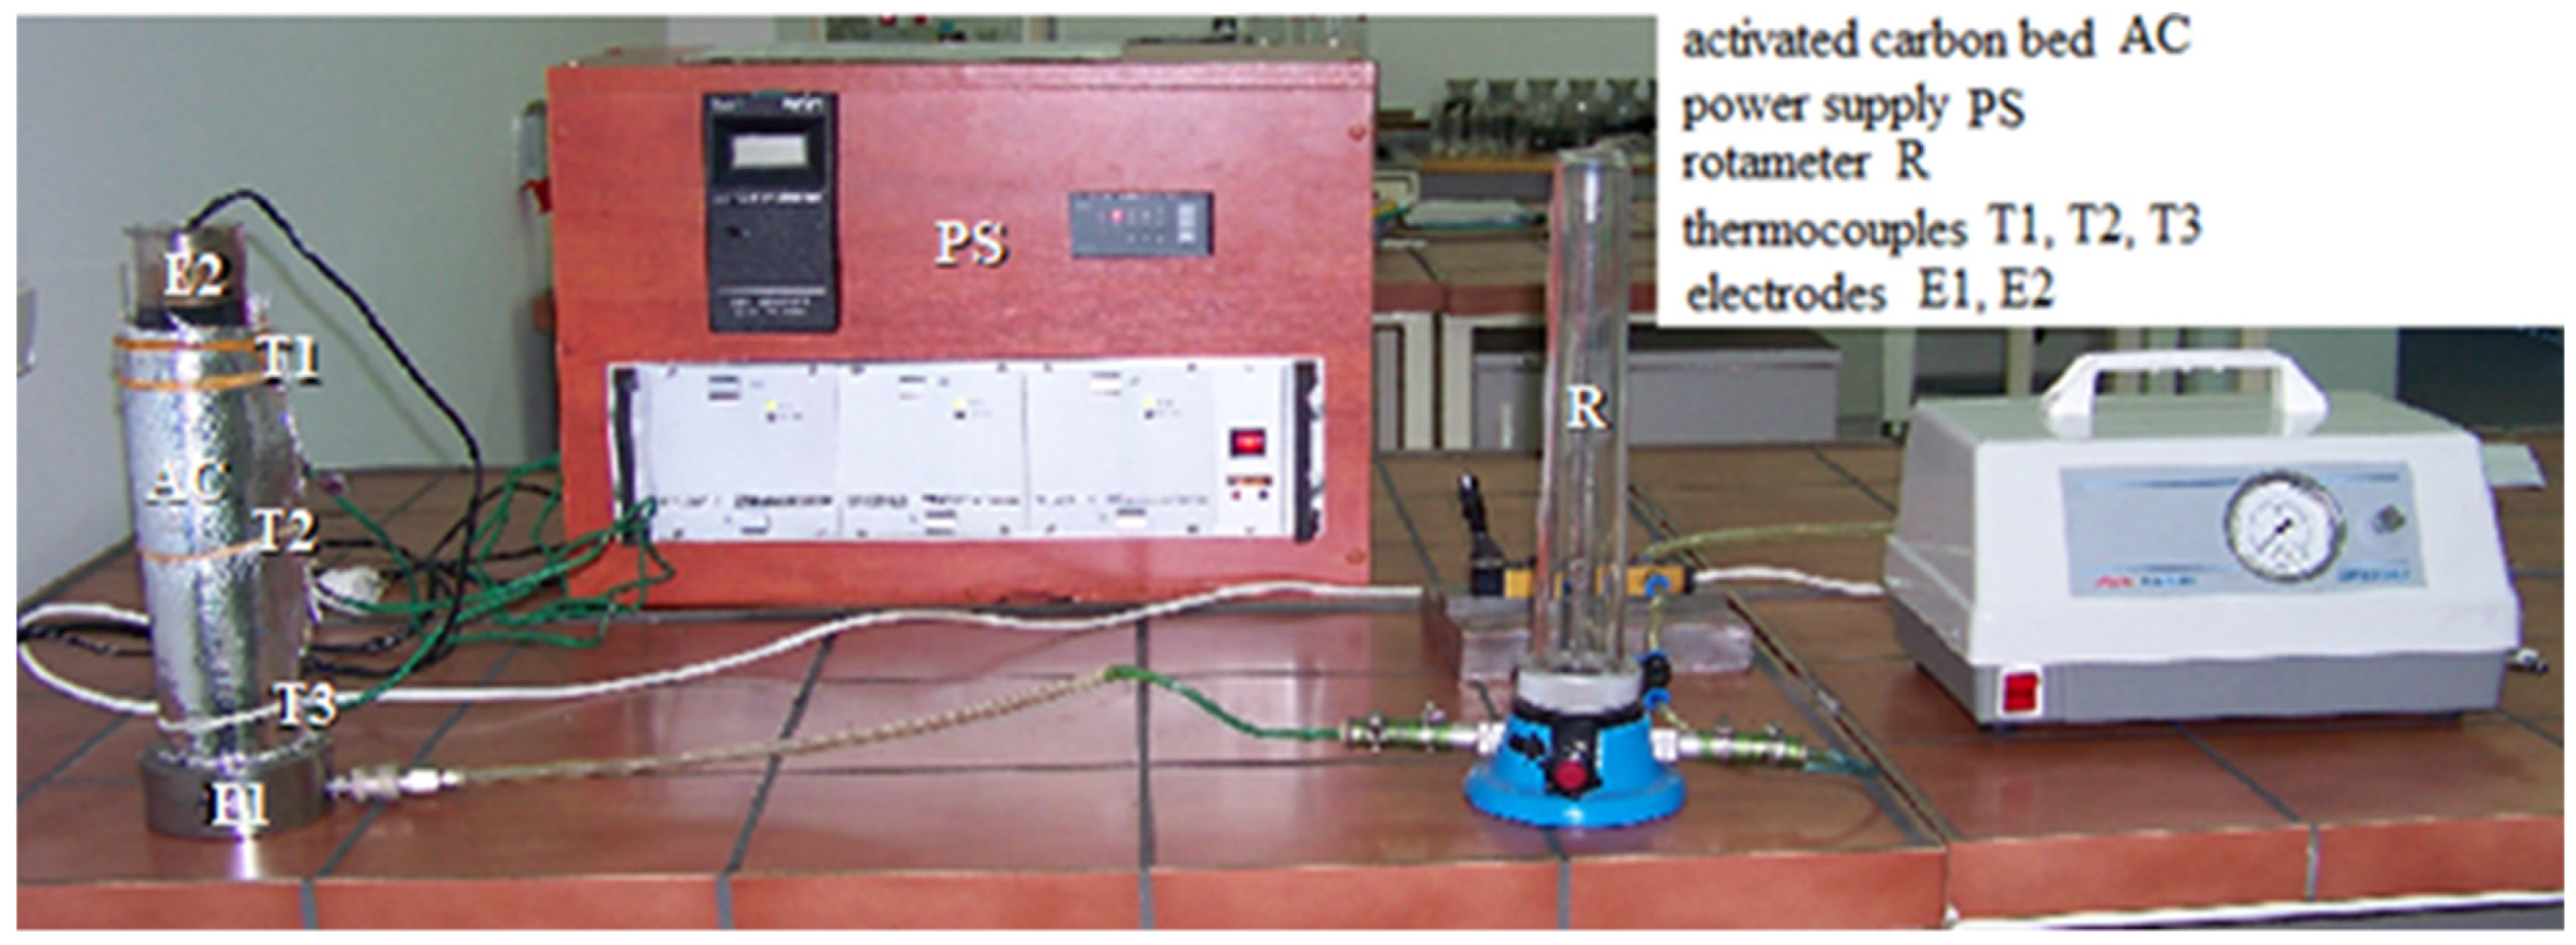
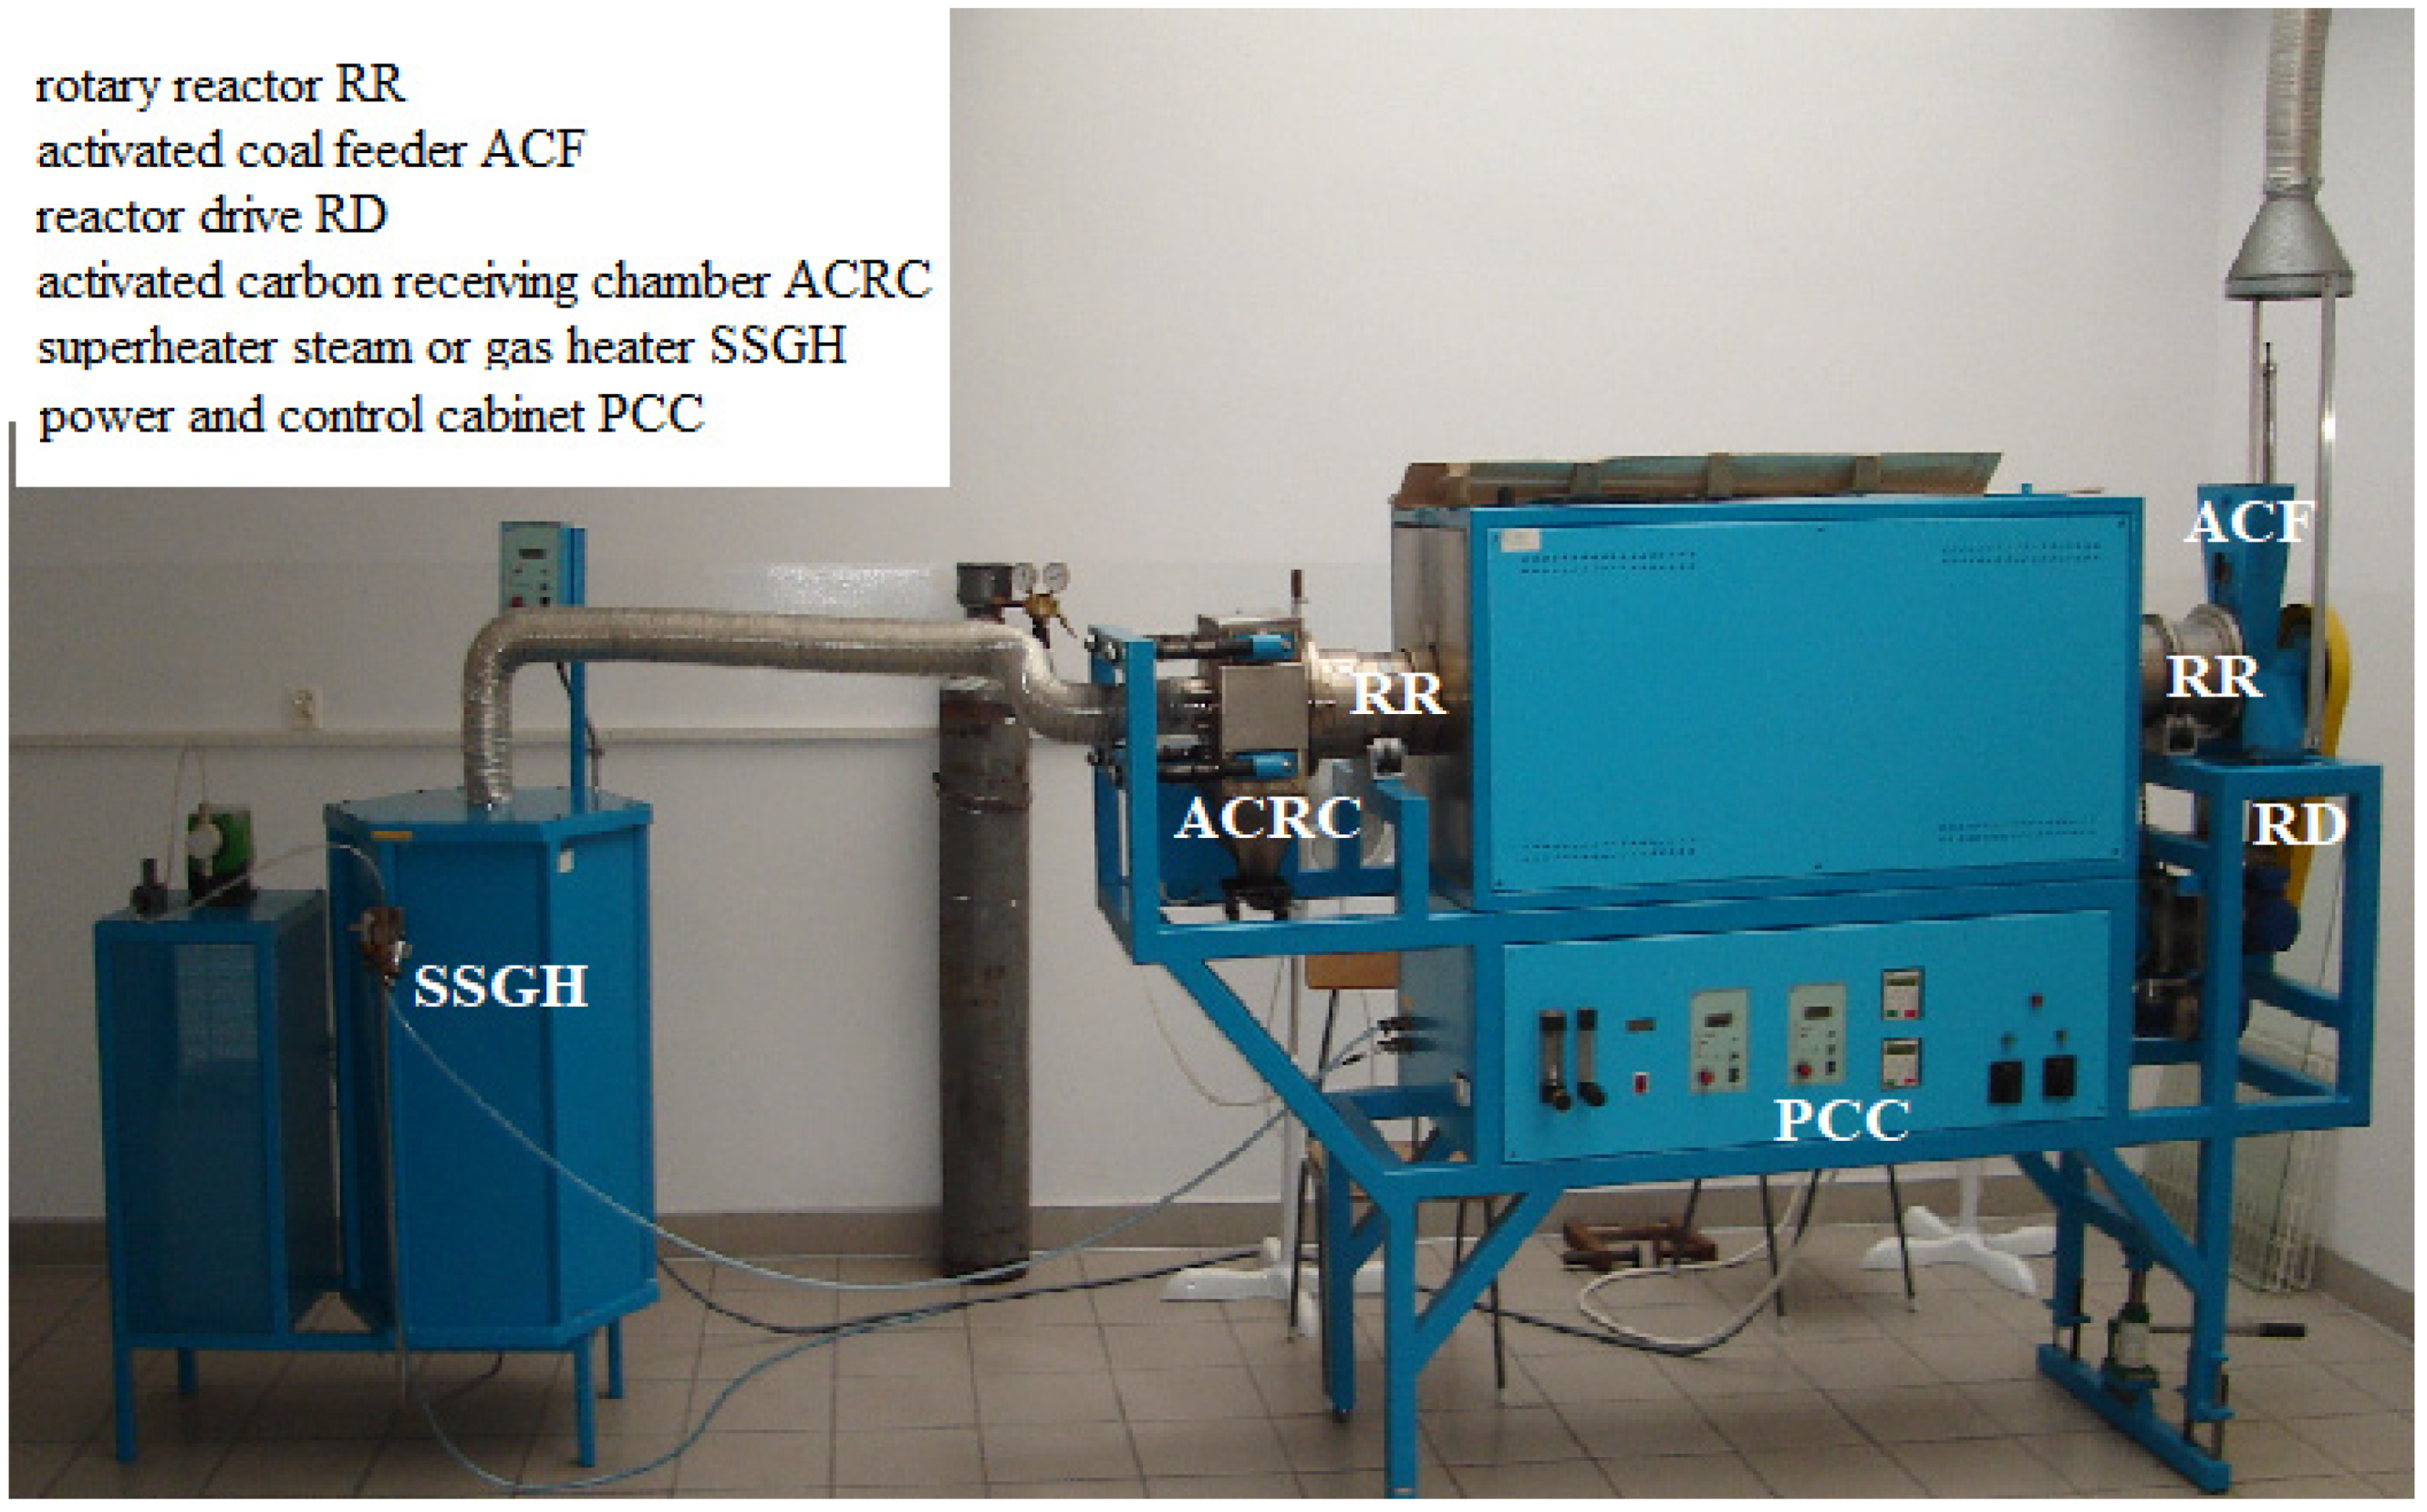
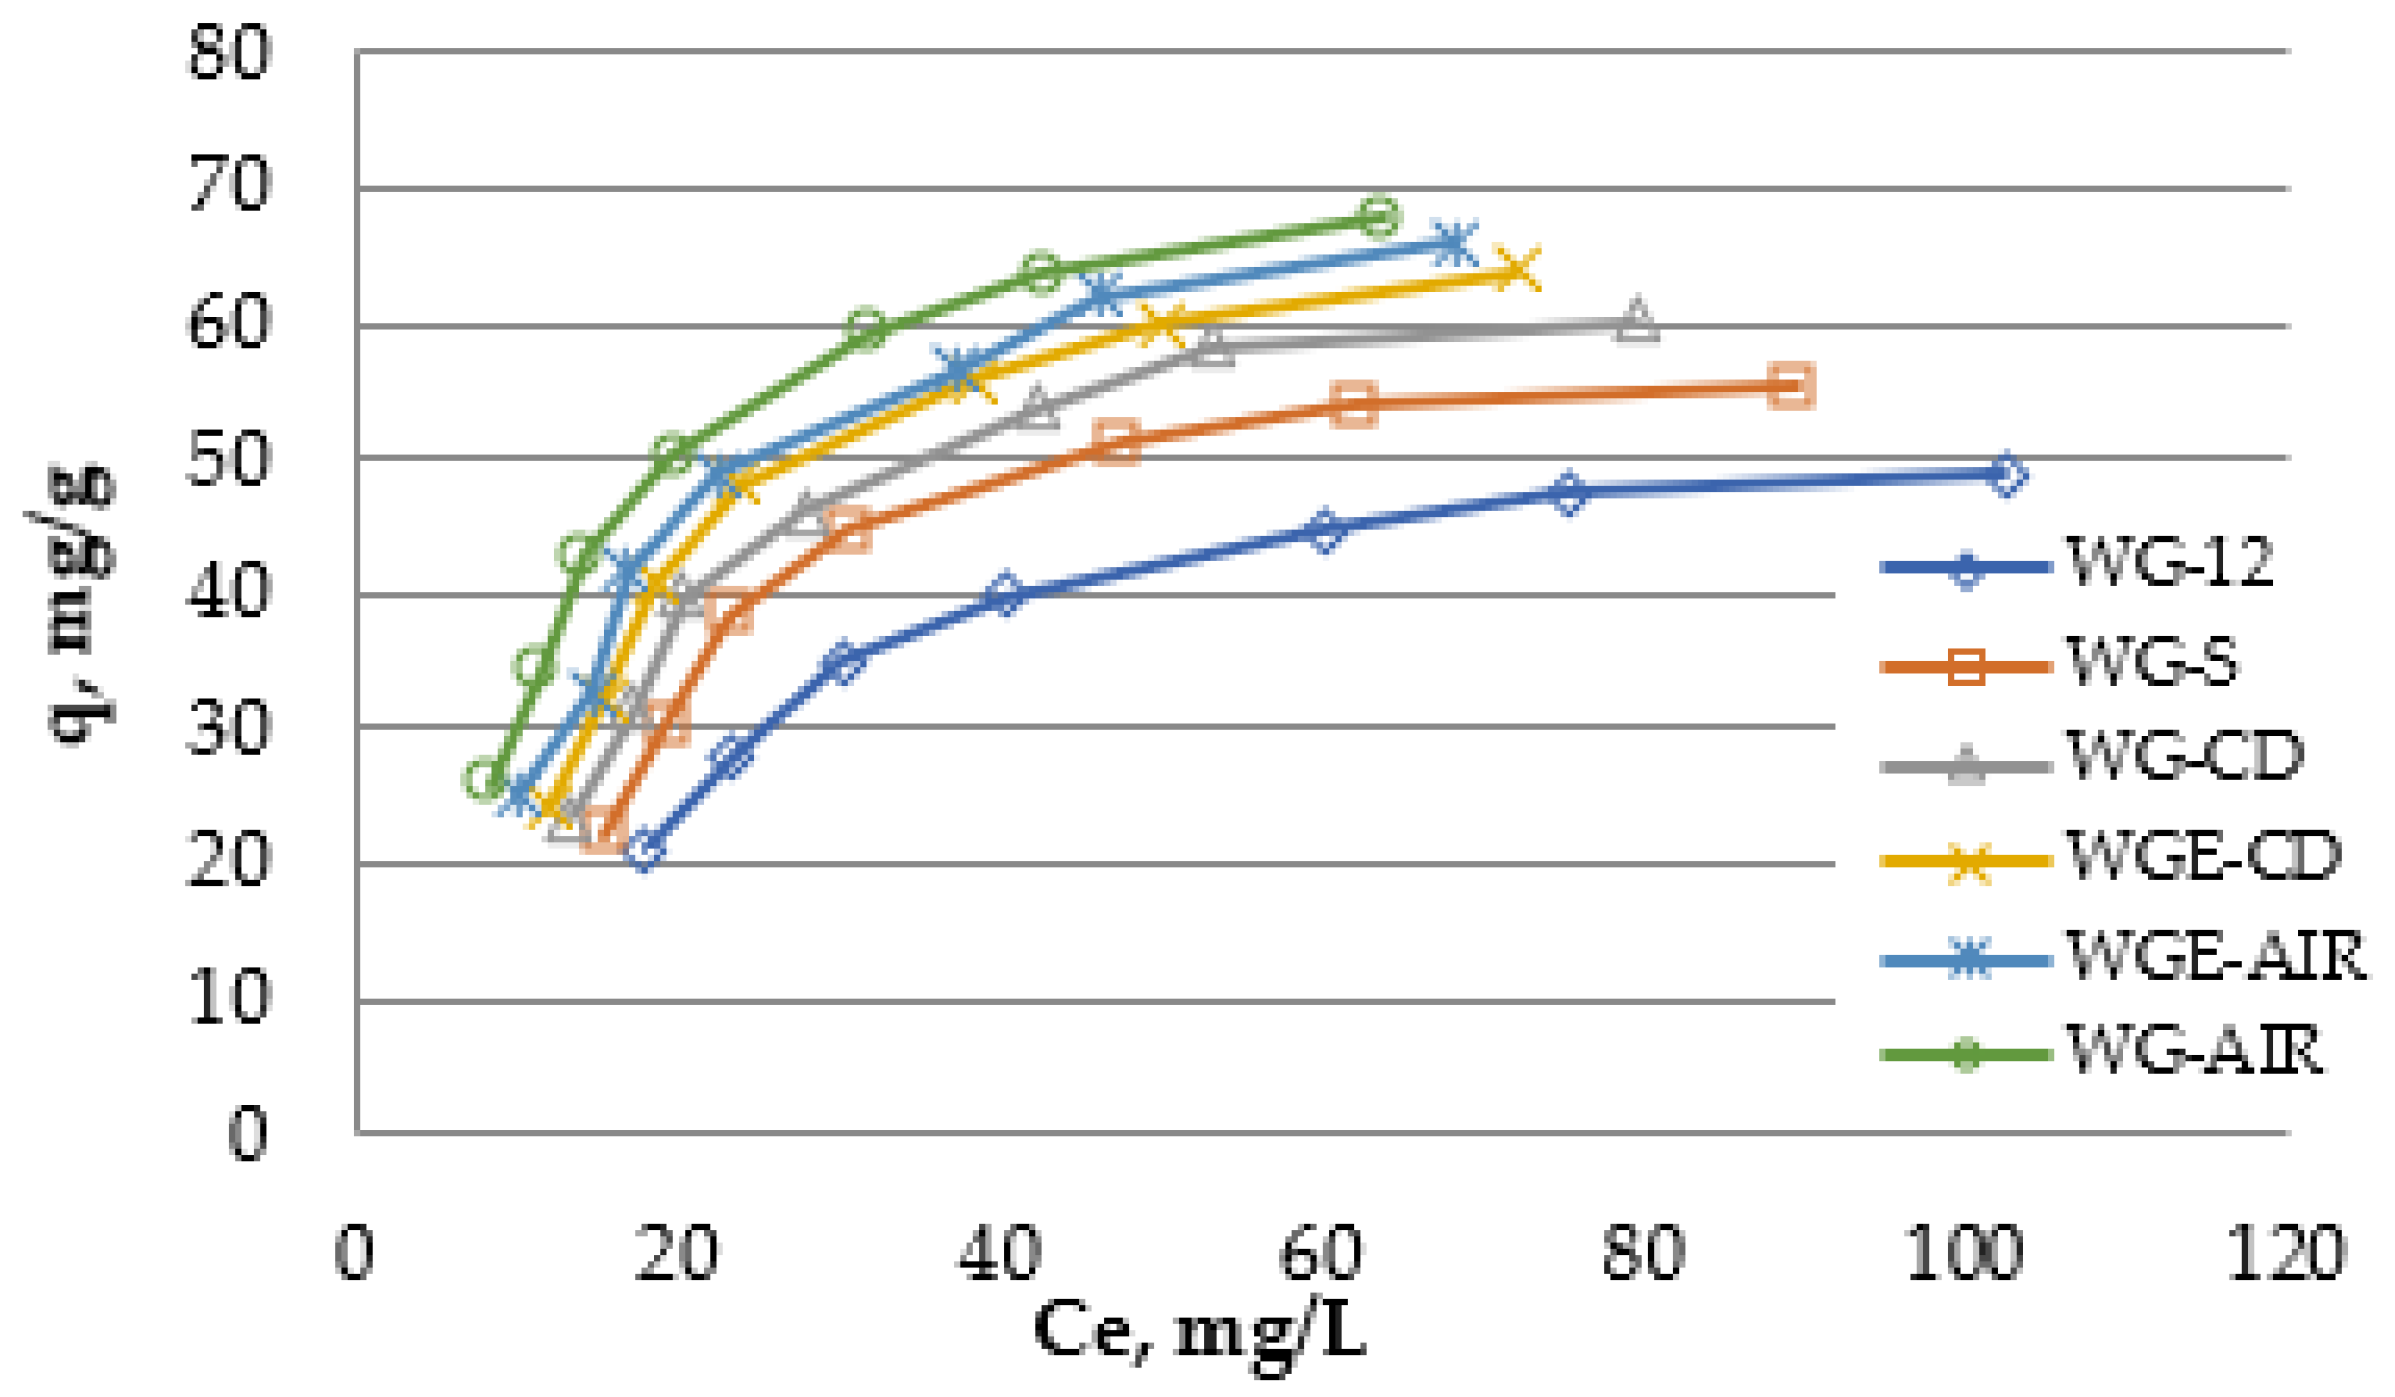
The activated carbon was modified in a rotary kiln and a stand for electric heating of activated carbon (Figure 1 and Figure 2). Modification of carbon WG-12 in a rotary kiln was conducted for 1 h at a temperature of 400 °C with a constant flow of steam, carbon dioxide and air. The starting activated carbon was marked as WG0, and modified as WG-AIR, WG-S (steam), WG-CD (carbon dioxide), respectively.
The second part of the carbon sample was modified on the SEOW stand. In this case, the carbon samples are heated to 400 °C ± 20 °C. The modification of activated carbon on the SEOW stand consisted in heating the carbon bed during the current flow. The carbons were heated to a temperature of 400 °C with air or carbon dioxide flow of 80 L/h and WGE-AIR (air flow) and WGE-CD (carbon dioxide flow) were determined. Carbon samples were taken after the entire volume of the sorbent from the reactor was mixed.

3. Results and Discussion

3.1. Adsorption Kinetics

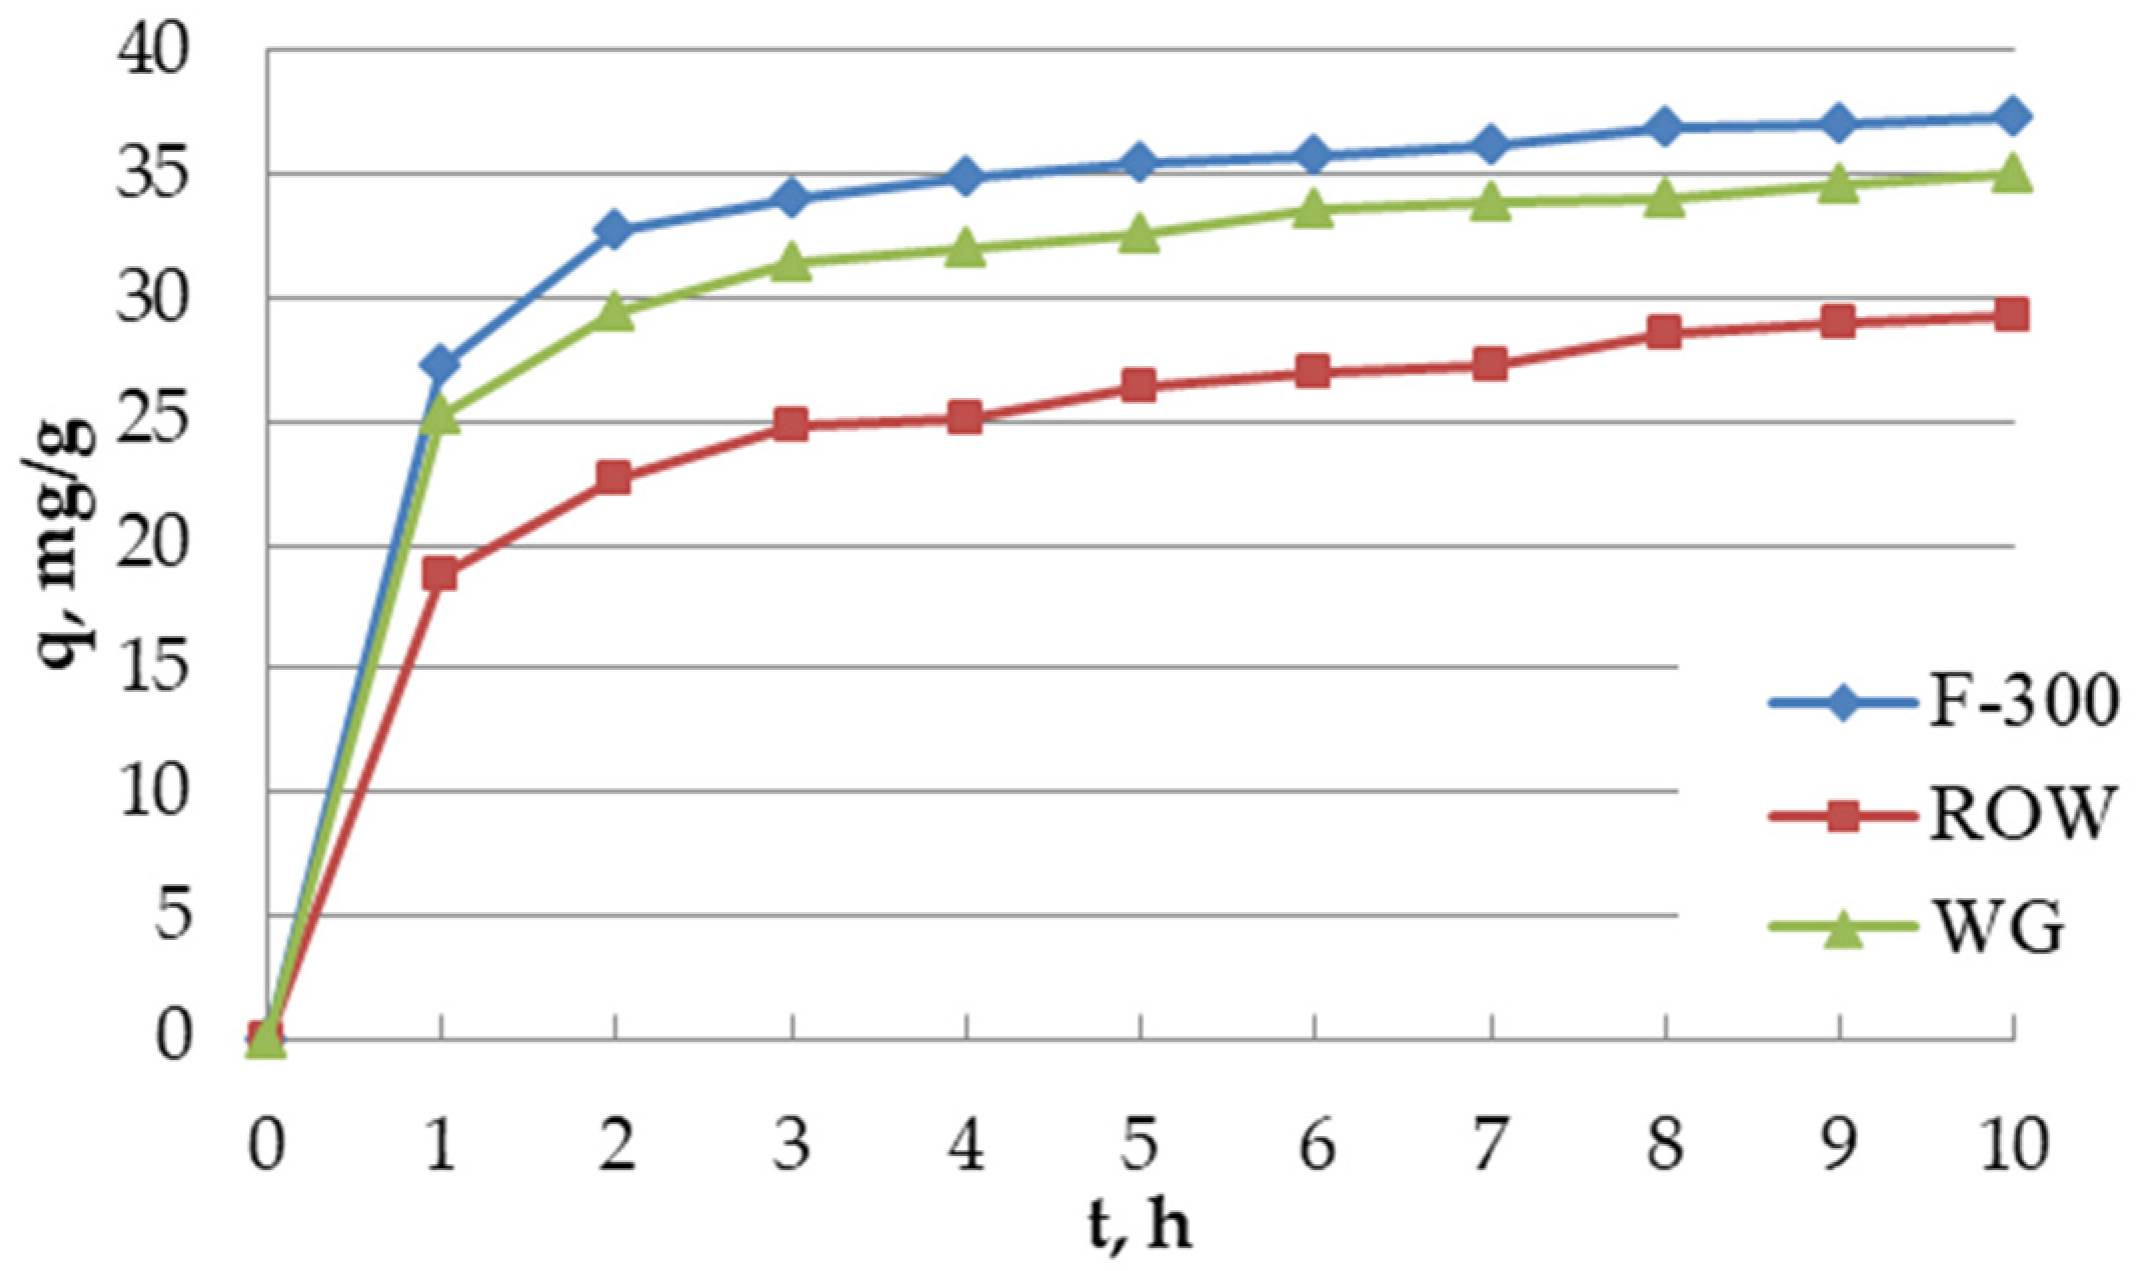
The adsorption kinetics of oxytetracycline on three commercial activated carbons F-300, WG-12 and ROW 08 Supra was analyzed (Figure 3). The process was conducted with a solution with the oxytetracycline concentration of 100 mg/L, pH = 6, volume = 100 mL, to which 0.2 g of the proper activated carbon was added. The time needed to completely establish the equilibrium on porous sorbents is very long. It was assumed in the study that the time to establish the adsorption equilibrium occurs when the concentration change within 1 h is less than 1% of the initial concentration (i.e., 1 mg/L). It was observed that the adsorption was very fast in the initial stage and then became slower as the adsorption progressed. During the kinetic study, samples of the solutions were taken every 1 h for 10 h. This time was sufficient to establish the adsorption equilibrium on the tested sorbents. For all activated carbons, this time was 8 h. Such similar results are the result of quite a long time between collecting the samples—1 h quite similar porous structure of activated carbons (all carbons are microporous sorbents). The obtained equilibrium time is medium in comparison to the one described in the literature. In the research of Chen et al., concerning the adsorption of tetracycline, the equilibrium time was longer than 200 h while in the work of Yang et al., it was only 2.5 h [55,56].
Four models of adsorption kinetics were used to describe the adsorption kinetics: PFO, PSO, intraparticle diffusion model (Weber–Morris), and Elovich (Table 3 and Table 6). A very high match of the obtained research results was obtained for the Elovich model (R2 from 0.9984 to 0.9998) and the intraparticle diffusion model (R2 from 0.9964 to 0.9993). A good match of the Elovich model would prove the significant importance of chemisorption on the heterogeneous surface of the activated carbon. Copying the experimental values using the Elovich model enabled to estimate the process rate constants α and coefficient β which reflects the number of areas available for adsorption [57]. Carbons WG-12 and F-300 are characterized by very similar values of coefficient β, higher than the value of this coefficient for carbon ROW 08. Adsorption rate constant α is clearly the highest for activated carbon F-300, and the lowest for ROW 08 Supra.
In the case of the obtained results, a long time to achieve the adsorption equilibrium (approximately 8 h) indicates that internal diffusion is probably dominant over the general adsorption kinetics. Basically, adsorption can be controlled by one or two stages [58]. By analyzing coefficients of the Weber–Morris equation k′ (intraparticle diffusion rate constant) and b (thickness, layer depth), the effect of the adsorption stages on the adsorption kinetics can be assessed. The greater the b value, the greater the effect of the boundary layer on the adsorption process. If the intraparticle diffusion is the rate limiting factor, then C = 0. For all three activated carbons, quite high C values were obtained, which proves that the factor limiting the reaction rate may be the boundary layer (film) controlled by the diffusion process.
Only slightly lower correlation coefficients (but above 0.93) were obtained for the PSO model. The weakest match was obtained for the PFO model. In many works there are analyzed only two models of kinetics and on this basis the conclusions are drawn. The tetracycline adsorption kinetics (the antibiotics which is the most widely described in the literature from the group of tetracyclines) is the most often better described by means of kinetic equation PSO [42,55,59,60,61]., There can also be found better matching results to the kinetic equation PFO than to the second order, although less frequently [62].
The results obtained during the study of the tetracycline adsorption kinetics equations carried out by Jang and Kan were similar to the results obtained in this article [63]. The best match was obtained for the Elovich equation, a slightly weaker one for the intraparticle diffusion model, then for PSO and the weakest one for the PFO. The similar results obtained Zhu et al., while examining the adsorption kinetics [64]. The best matching results were obtained for the Elovich model, next for PSO and the weakest for PFO. Additionally, Sun et al., while examining the kinetics of oxytetracycline on activated carbons made of chemically activated cotton fibers, obtained better results for pseudo-second-order kinetics models than for pseudo-first-order one [44]. According to Ahmed et al., a higher R2 of the pseudo-second order kinetic model indicates that chemical adsorption is an important factor deciding about the rate of this process, and the adsorption capacity is proportional to the active areas [65]. According to Płaziński and Rudziński, the PFO and PSO models do not represent any physical model because they are empirical in nature [66]. It is therefore wrong to draw conclusions about the nature of the process on their basis.
Based on coefficient k2 characterizing the adsorption rate, activated carbons can be classified as follows: F-300 > WG-12 > ROW08.

3.2. Adsorption Statics—The Effect of the Type of Activated Carbon

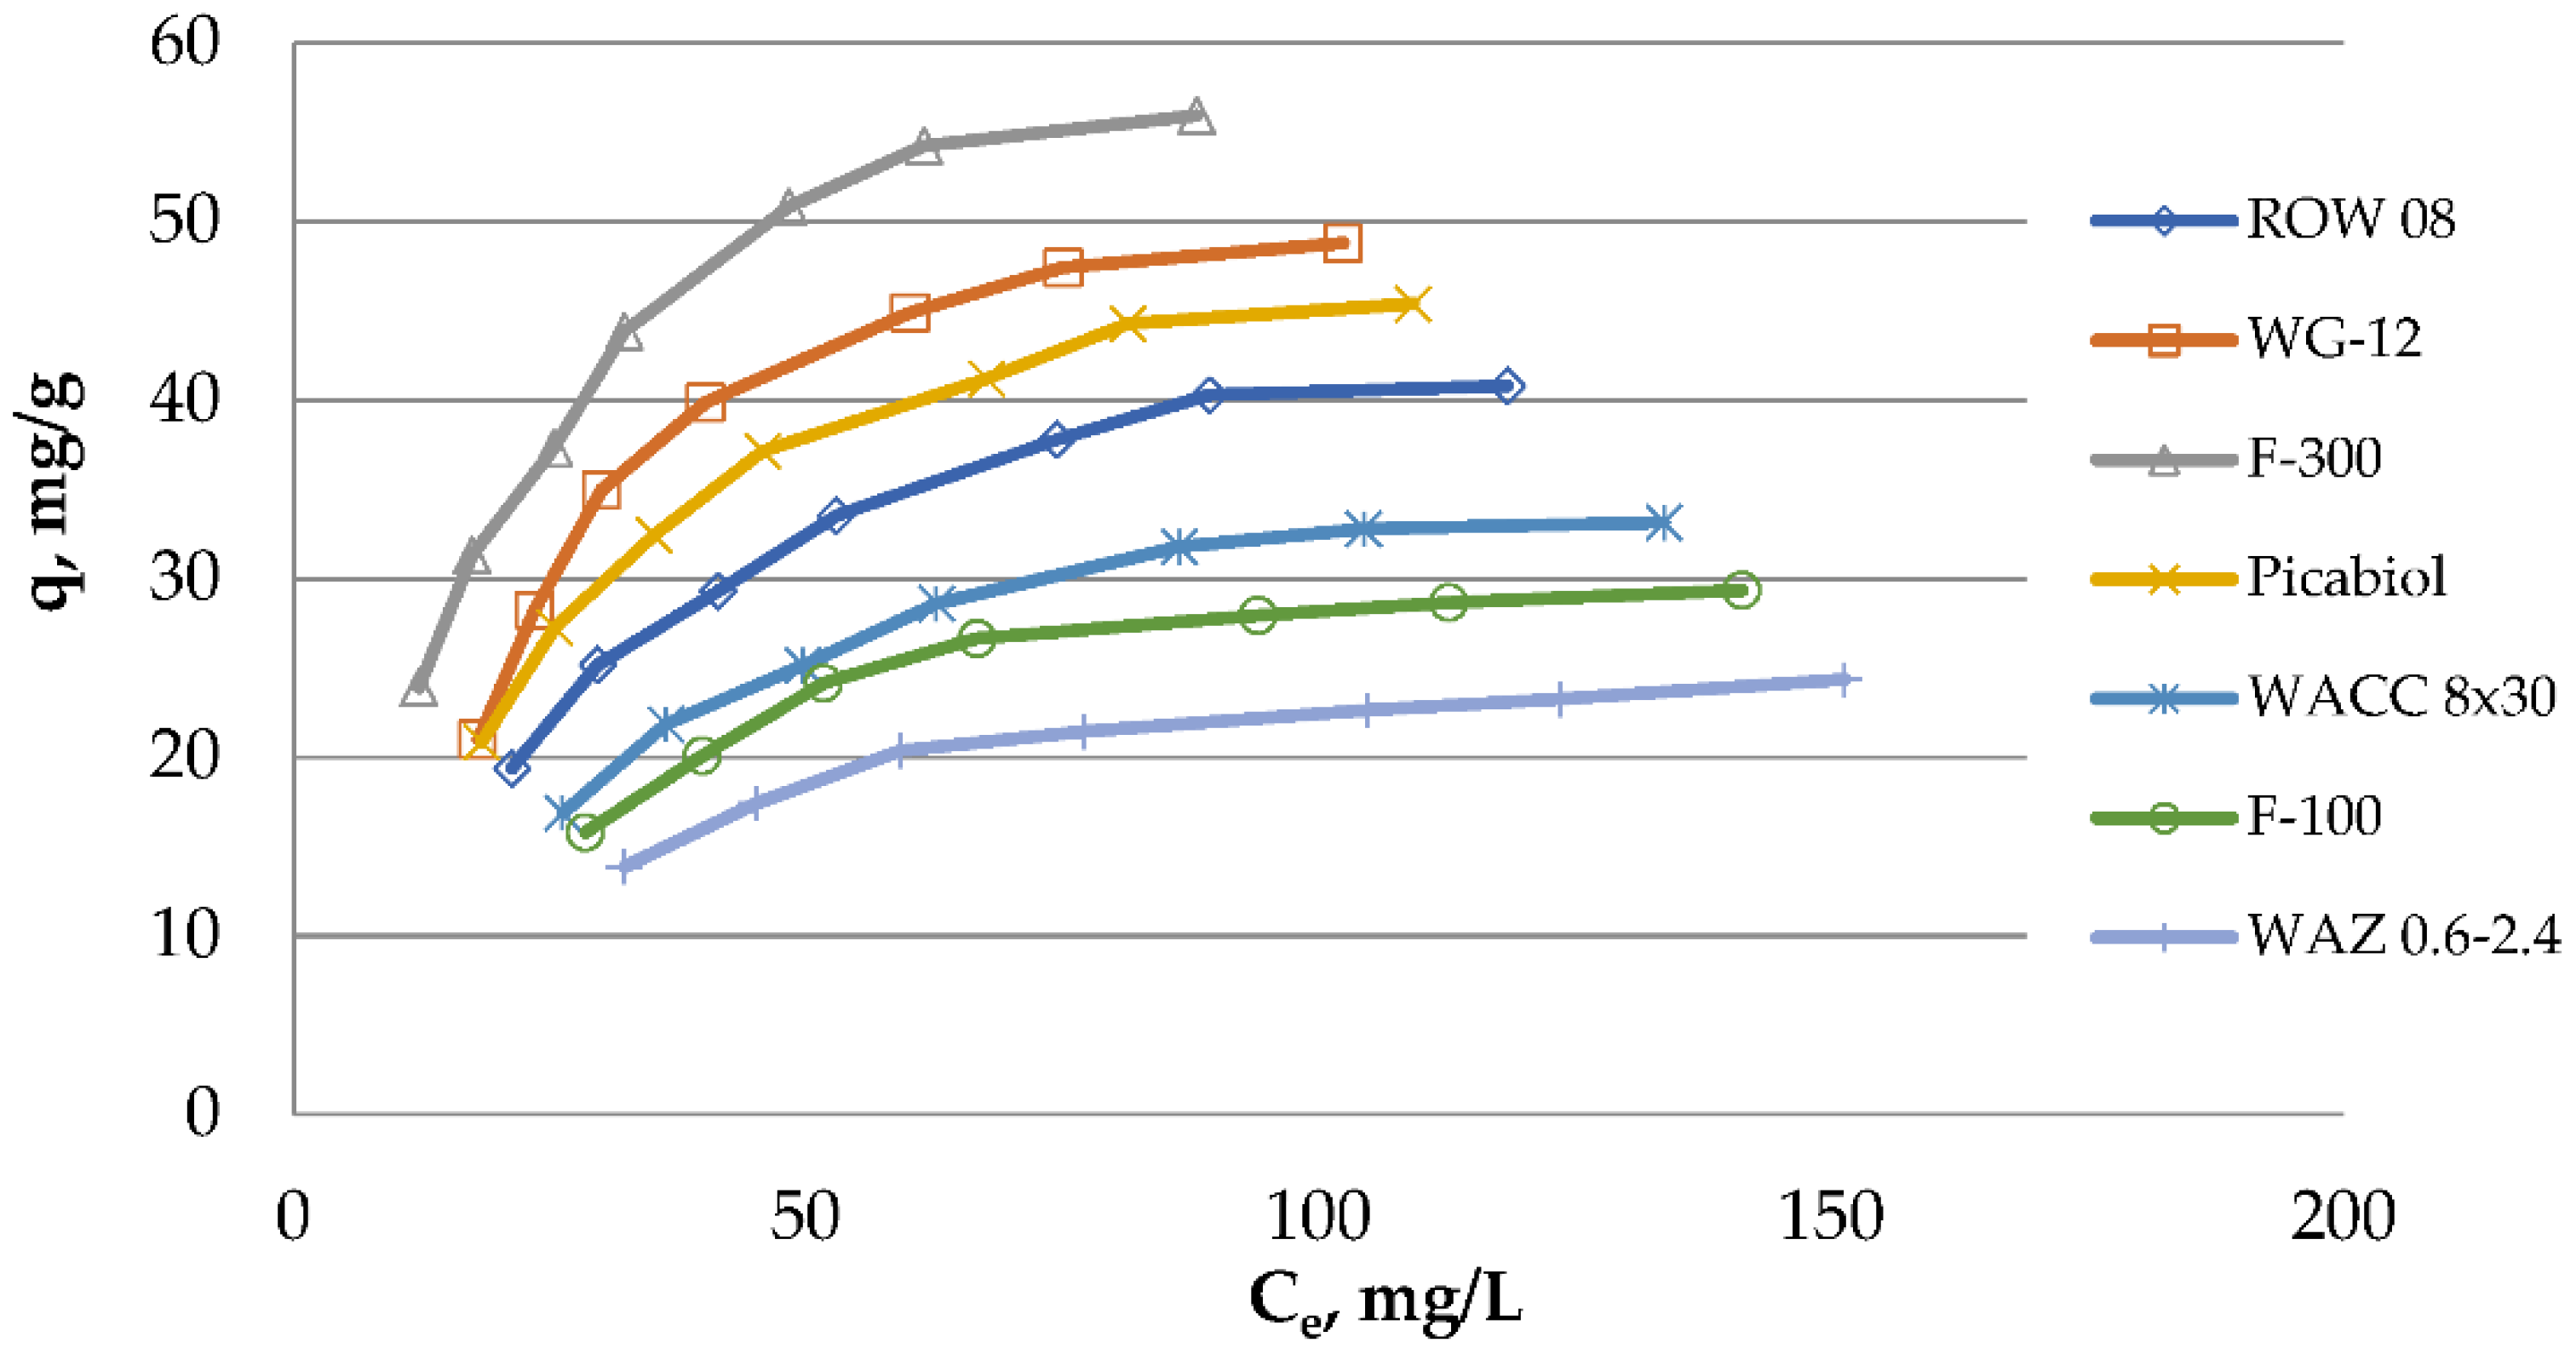
Seven commercial activated carbons used in water treatment plants were assessed. For this purpose, oxytetracycline adsorption isotherms from solutions at room temperature and pH = 6 ± 0.2 were carried out (Figure 4). The activated carbons used in the studies differ significantly in the amount of oxytetracycline adsorption. For the most effective of them, the activated carbon F-300 (qm Langmuir isotherm), the adsorption capacity obtained in the studies was 55.9 mg/g. The smallest adsorption capacity 24.3 mg/g had activated carbon WAZ 0.6–2.4. Taking the possibility of removing oxytetracycline into account, the carbons used in the tests can be ranked as follows: F-300 > WG-12 > Picabiol > ROW 08 > WACC 8 × 30 > F-100 > WAZ 0.6–2.4. Such a rank order does not coincide with the rank order of activated carbons due to the size of the specific surface area: Picabiol > WG-12 > ROW 08 > F-300 > WACC 8 × 30 > WAZ 0.6–2.4 > F-100. However, there are some common features between these ranks. The first four activated carbons in the rank order for oxytetracycline adsorption are also in the top four of the rank orders for specific surface areas, but in a slightly different configuration. The specific surface area is therefore an important parameter, but not the only one that determines the amount of oxytetracycline adsorption. Additionally, in the research of Huang et. al., a greater adsorption of oxytetracycline on activated carbon with a higher specific surface area was observed [67]. The essential influence of the size of the specific surface area on the efficiency of tetracycline adsorption is underlined by many researchers [59,68,69]. Undoubtedly, the porous structure and accessibility, or rather the lack of access to the pores of the smallest diameter, for oxytetracycline particles and the chemical structure of the surface of activated carbons also have the effect. The specific surface area is not always the deciding parameter. Ken et al. while examining three different activated carbons, the greatest oxytetracycline adsorption obtained on the activated carbon which had the smallest specific surface area [70]. The presence of a great number of functional groups on the surface of activated carbons in the case of adsorption from a solution with pH = 6, may be disadvantageous due to the possibility of blocking access to the pores.
The obtained results were described by two-parameter equations: Freundlich, Langmuir, Temkin, Jovanovic, Halsey and three-parameter equations: Redlich–Peterson and Thot (Table 4 and Table 7). The investigators use these models to describe the adsorption of organic compounds, including antibiotics, on activated carbons [65,71,72]. All the used models describe the obtained for oxytetracycline adsorption results well. The lowest R2 obtained is 0.9917. Nevertheless, the best match of the results was obtained for the following models: Redlich–Peterson, Thot and Jovanovic. These are isotherms used to describe adsorption from aqueous solutions, but these isotherms have different assumptions (e.g., for surface heterogeneity and homogeneity). The Jovanovic isotherm assumes surface homogeneity, the Thoth isotherm—heterogeneity, and the Redlich–Peterson isotherm, as the compilation of the Freundlich and Langmuir isotherms, is applicable to both types of sorbent surfaces. Nevertheless, these different oxytetracycline absorption isotherms used have a similar correlation coefficient R2. Such results may indicate slight differences in the adsorption potential of the surfaces of the analyzed activated carbons. Other researchers describing their research with different models also obtained similar correlation coefficients, despite their different assumptions [73,74,75]. Most likely, commercial activated carbons have such a diverse surface that it is difficult to talk about a single adsorption mechanism.
The most commonly used isotherms of Langmuir and Freundlich are marked by high (though not the highest) coefficients R2 (from 0.993 to 0.999). Constant n in the Freundlich equation characterizes the adsorption intensity. For all activated carbons, the values of this coefficient range from 1 to 10, which proves the favorable adsorption of oxytetracycline on all adsorbents. Other authors who examined both the adsorption of oxytetracycline and tetracycline on the different carbon sorbents also claimed that the adsorption is beneficial [44,55,56,60]. The reciprocal of the coefficient n (1/n) indicates the degree of diversity of active areas on the surface of activated carbon. The obtained values of 1/n (from 0.307 to 0.396) are similar for the tested adsorbents. Since they are closer to zero than to one, it proves that the surface of the activated carbons is not very heterogeneous. Capacitive coefficient KF ranges from 5.38 (WAZ 0.6–2.4) to 10.62 mg/g (F-300).
Higher correlation coefficients were obtained for the Langmuir isotherm (0.9973 < R2 < 0.9993). In a great number of scientific studies, the investigators use the description of the tetracycline adsorption from the model of Langmuir and Freundlich. However, on the basis of the literature review, it clearly cannot be claimed which of the aforementioned models describes the tetracycline adsorption in a better way, which is related to the different construction of the activated carbons. In some articles greater R2 was obtained for Langmuir isotherm [42,45,59,62], and in other ones for Freundlich model [55,60,64,76]. In order to establish whether the adsorption is favorable, it is necessary to determine distribution coefficient RL. The ranges of parameter RL values for all activated carbons fitted in range from 0 to 1 (precisely from 0.833 to 0.971), which means that the adsorption in the tested concentration range was favorable. This is consistent with the conclusions drawn from the analysis of the Freundlich equation. A good match of Langmuir isotherms can indicate the monolayer adsorption of oxytetracycline on active centers. The obtained monolayer capacities which were calculated with the usage of the Langmuir equation range from 29.87 (WAZ) to 73.31 mg/g (F-300).
Slightly lower correlation coefficients were obtained for the Temkin isotherm assuming that the adsorption mechanism is chemisorption, and for the Halsey model assuming the formation of a liquid adsorbate film on mesoporous adsorbents.

3.3. Effect of Process Conditions on Oxytetracycline Adsorption

The influence of the adsorbent dose and pH value of the solution on the amount of oxytetracycline adsorption was analyzed for three of the four most effective commercial adsorbents that are already used in Polish water treatment plants: F-300; WG-12 and ROW 08 Supra. Picabiol activated carbon was not included since it is not used in any water treatment plant in Poland.
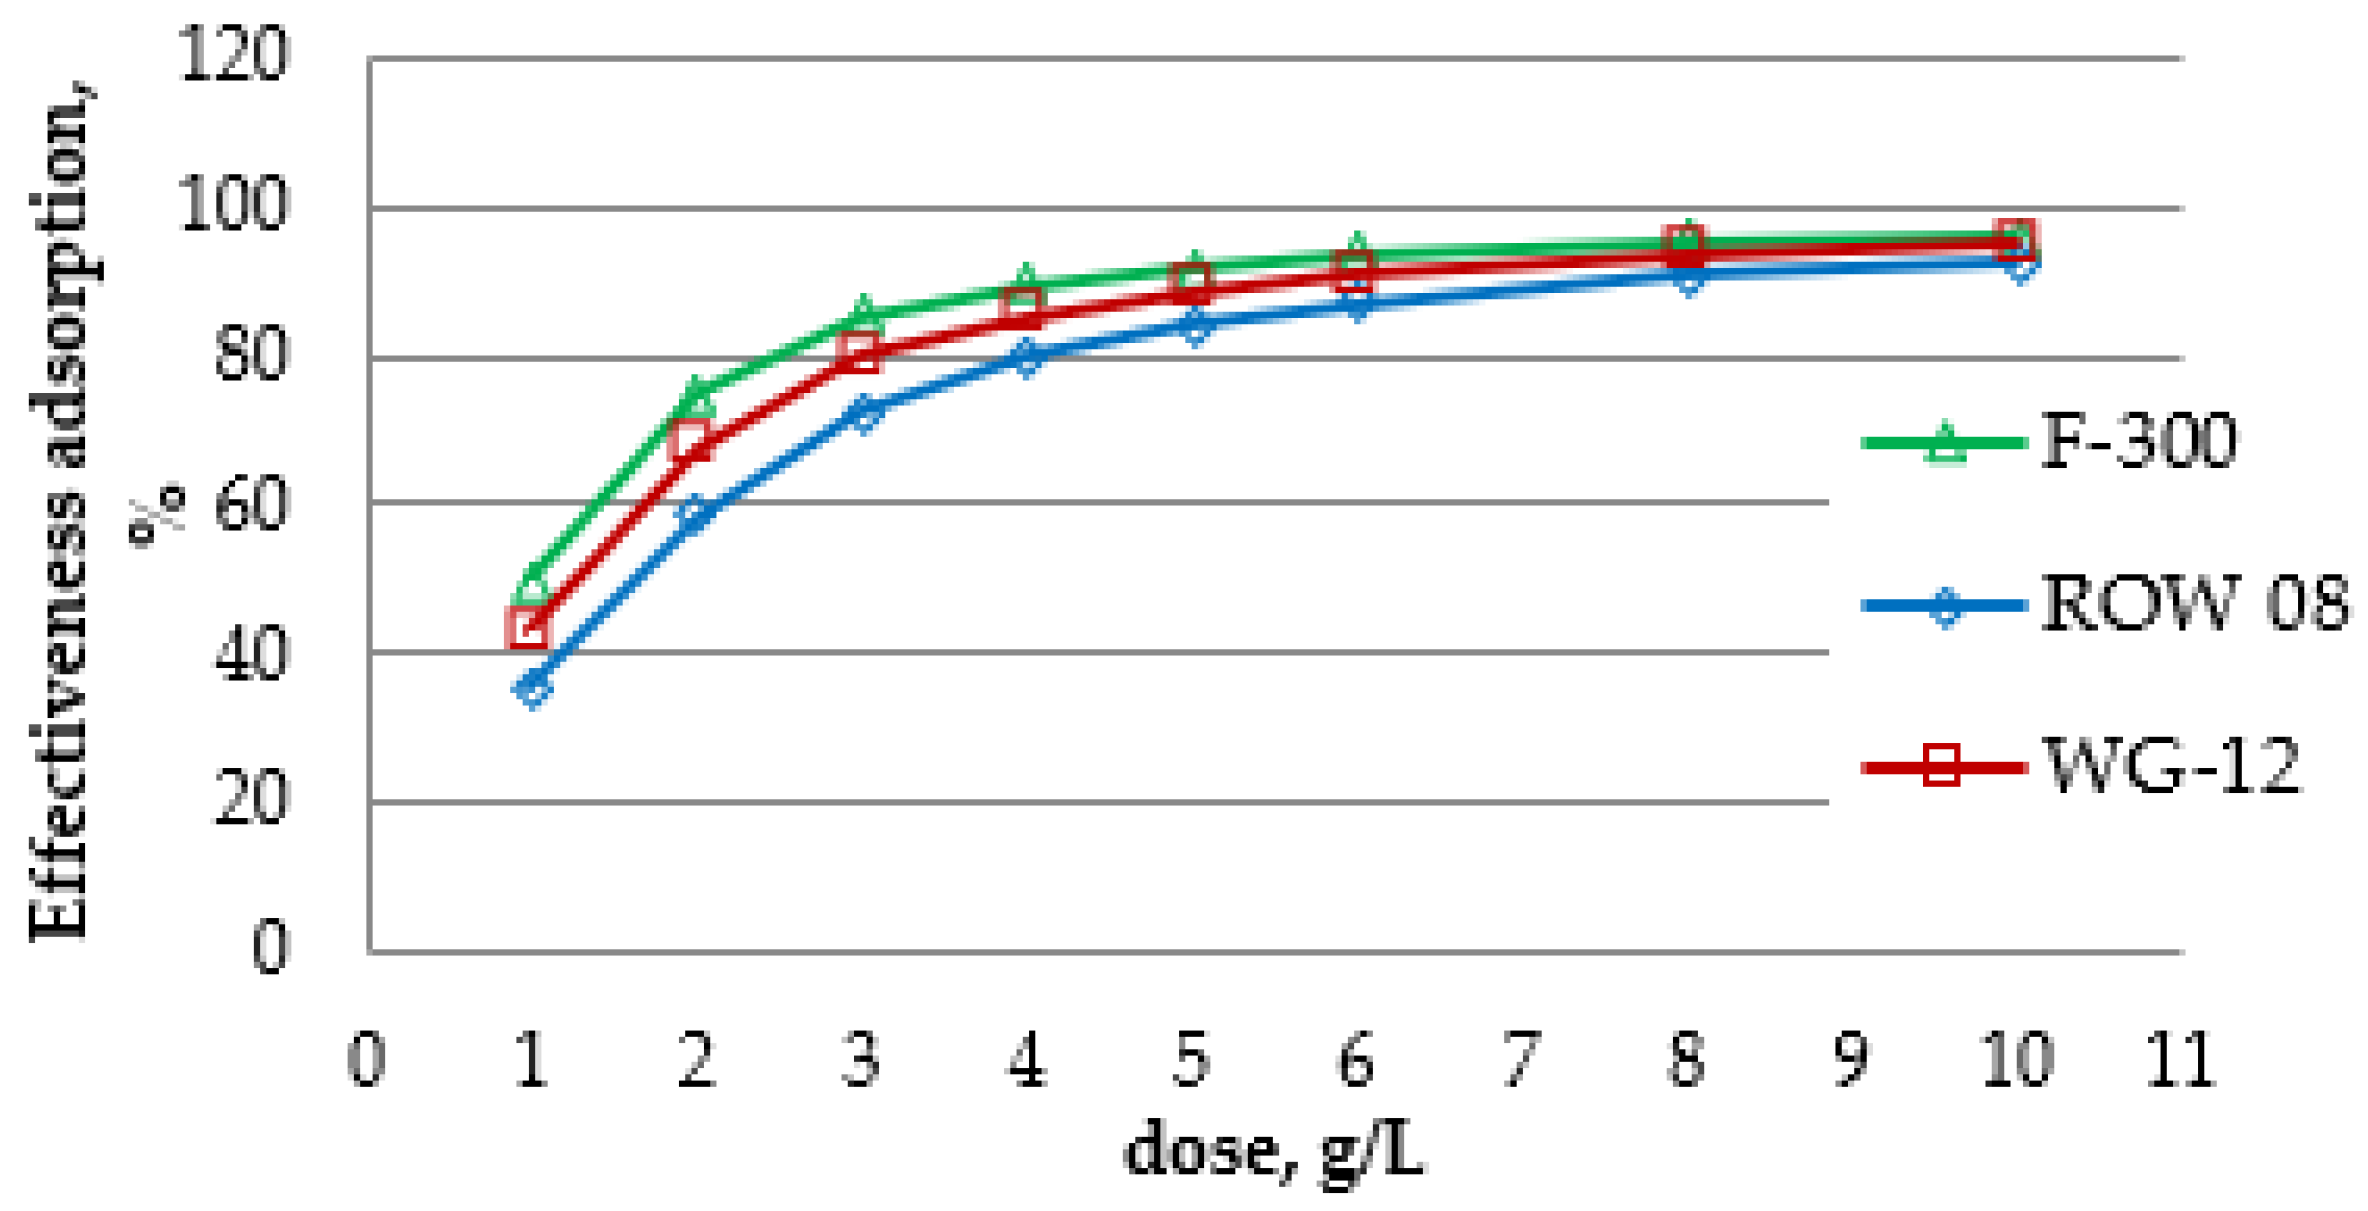
The influence of the adsorbent dose was assessed for the concentration of oxytetracycline 100 mg/L (Figure 5). The following doses of activated carbon were used: 1, 2, 3, 4, 5, 6, 8 and 10 g/L. Similar doses during the adsorption of various antibiotics were also used by other researchers, e.g., Fen et al., −8 g/L during the adsorption of chloramphenicol or Yazidi et al. 2020 from 0.9 to 14 g/l during the adsorption of amoxicillin and tetracycline [43,77]. The amounts of activated carbon F-300 enabled the removal of oxytetracycline from 50% (dose of 1 g/L) to over 96% (dose of 10 g/L), analogously from 43 to almost 95% for activated carbon WG-12 and from 35% to almost 93% for ROW 08 Supra. The differences in the efficiency of tetracycline removal with the dose of 6 and 8 g/L for carbon F-300 are small and amount to less than 2%, and for the other two activated carbons, such small differences were obtained between the doses of 8 and 10 g/L.
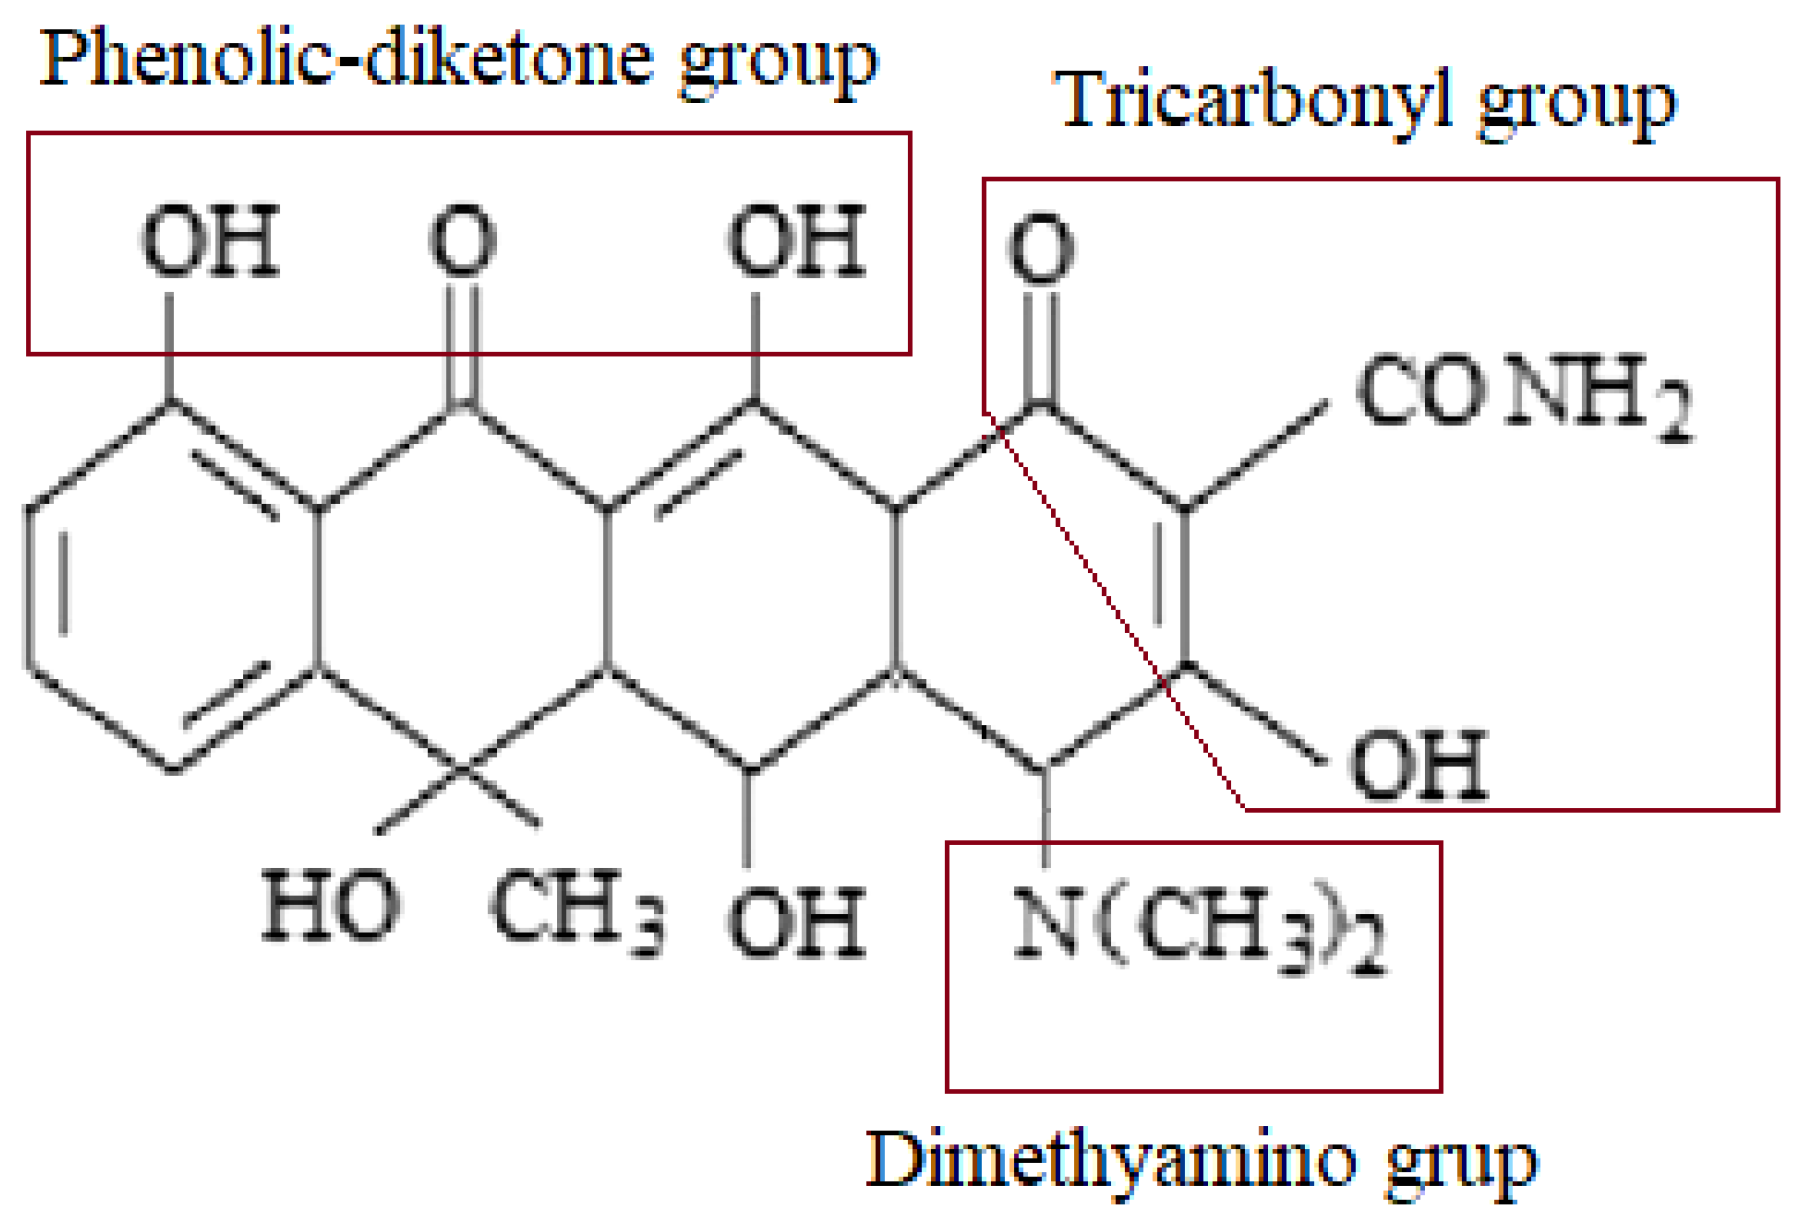
The solution pH may affect the size of the adsorption process due to changes in the surface properties of adsorbents and adsorbates. This parameter often determines the adsorption mechanism. Oxytetracycline, depending on the solution pH, can appear in the following forms: H3L+, H2L±, HL, and L2− (L means OTC) [78]. In the range of pH 2 to 3.8, there is a transformation of H3L+ to H2L± (pKa1 = 3.22—deprotonating OH3—tricarbonyl group), from pH 5.5 to 12.0, H2L± transforms to HL and L2− (pKa2 = 7.46 deprotonation phenolic-diketone group, pKa3 = 8.94 deprotonation of the dimethylamine group NH4) (Figure 6).
Oxytetracycline in solution at pH = 3 is present approximately in 80% as an OTC+ cation and in 20% as bipolar OTC±, in solution at pH = 6, the whole compound is in the bipolar form (OTC±). In alkaline solution at pH = 10, it is present as a di- and monovalent anion in equal amounts (about 50% OTC and 50% OTC−2) [44].
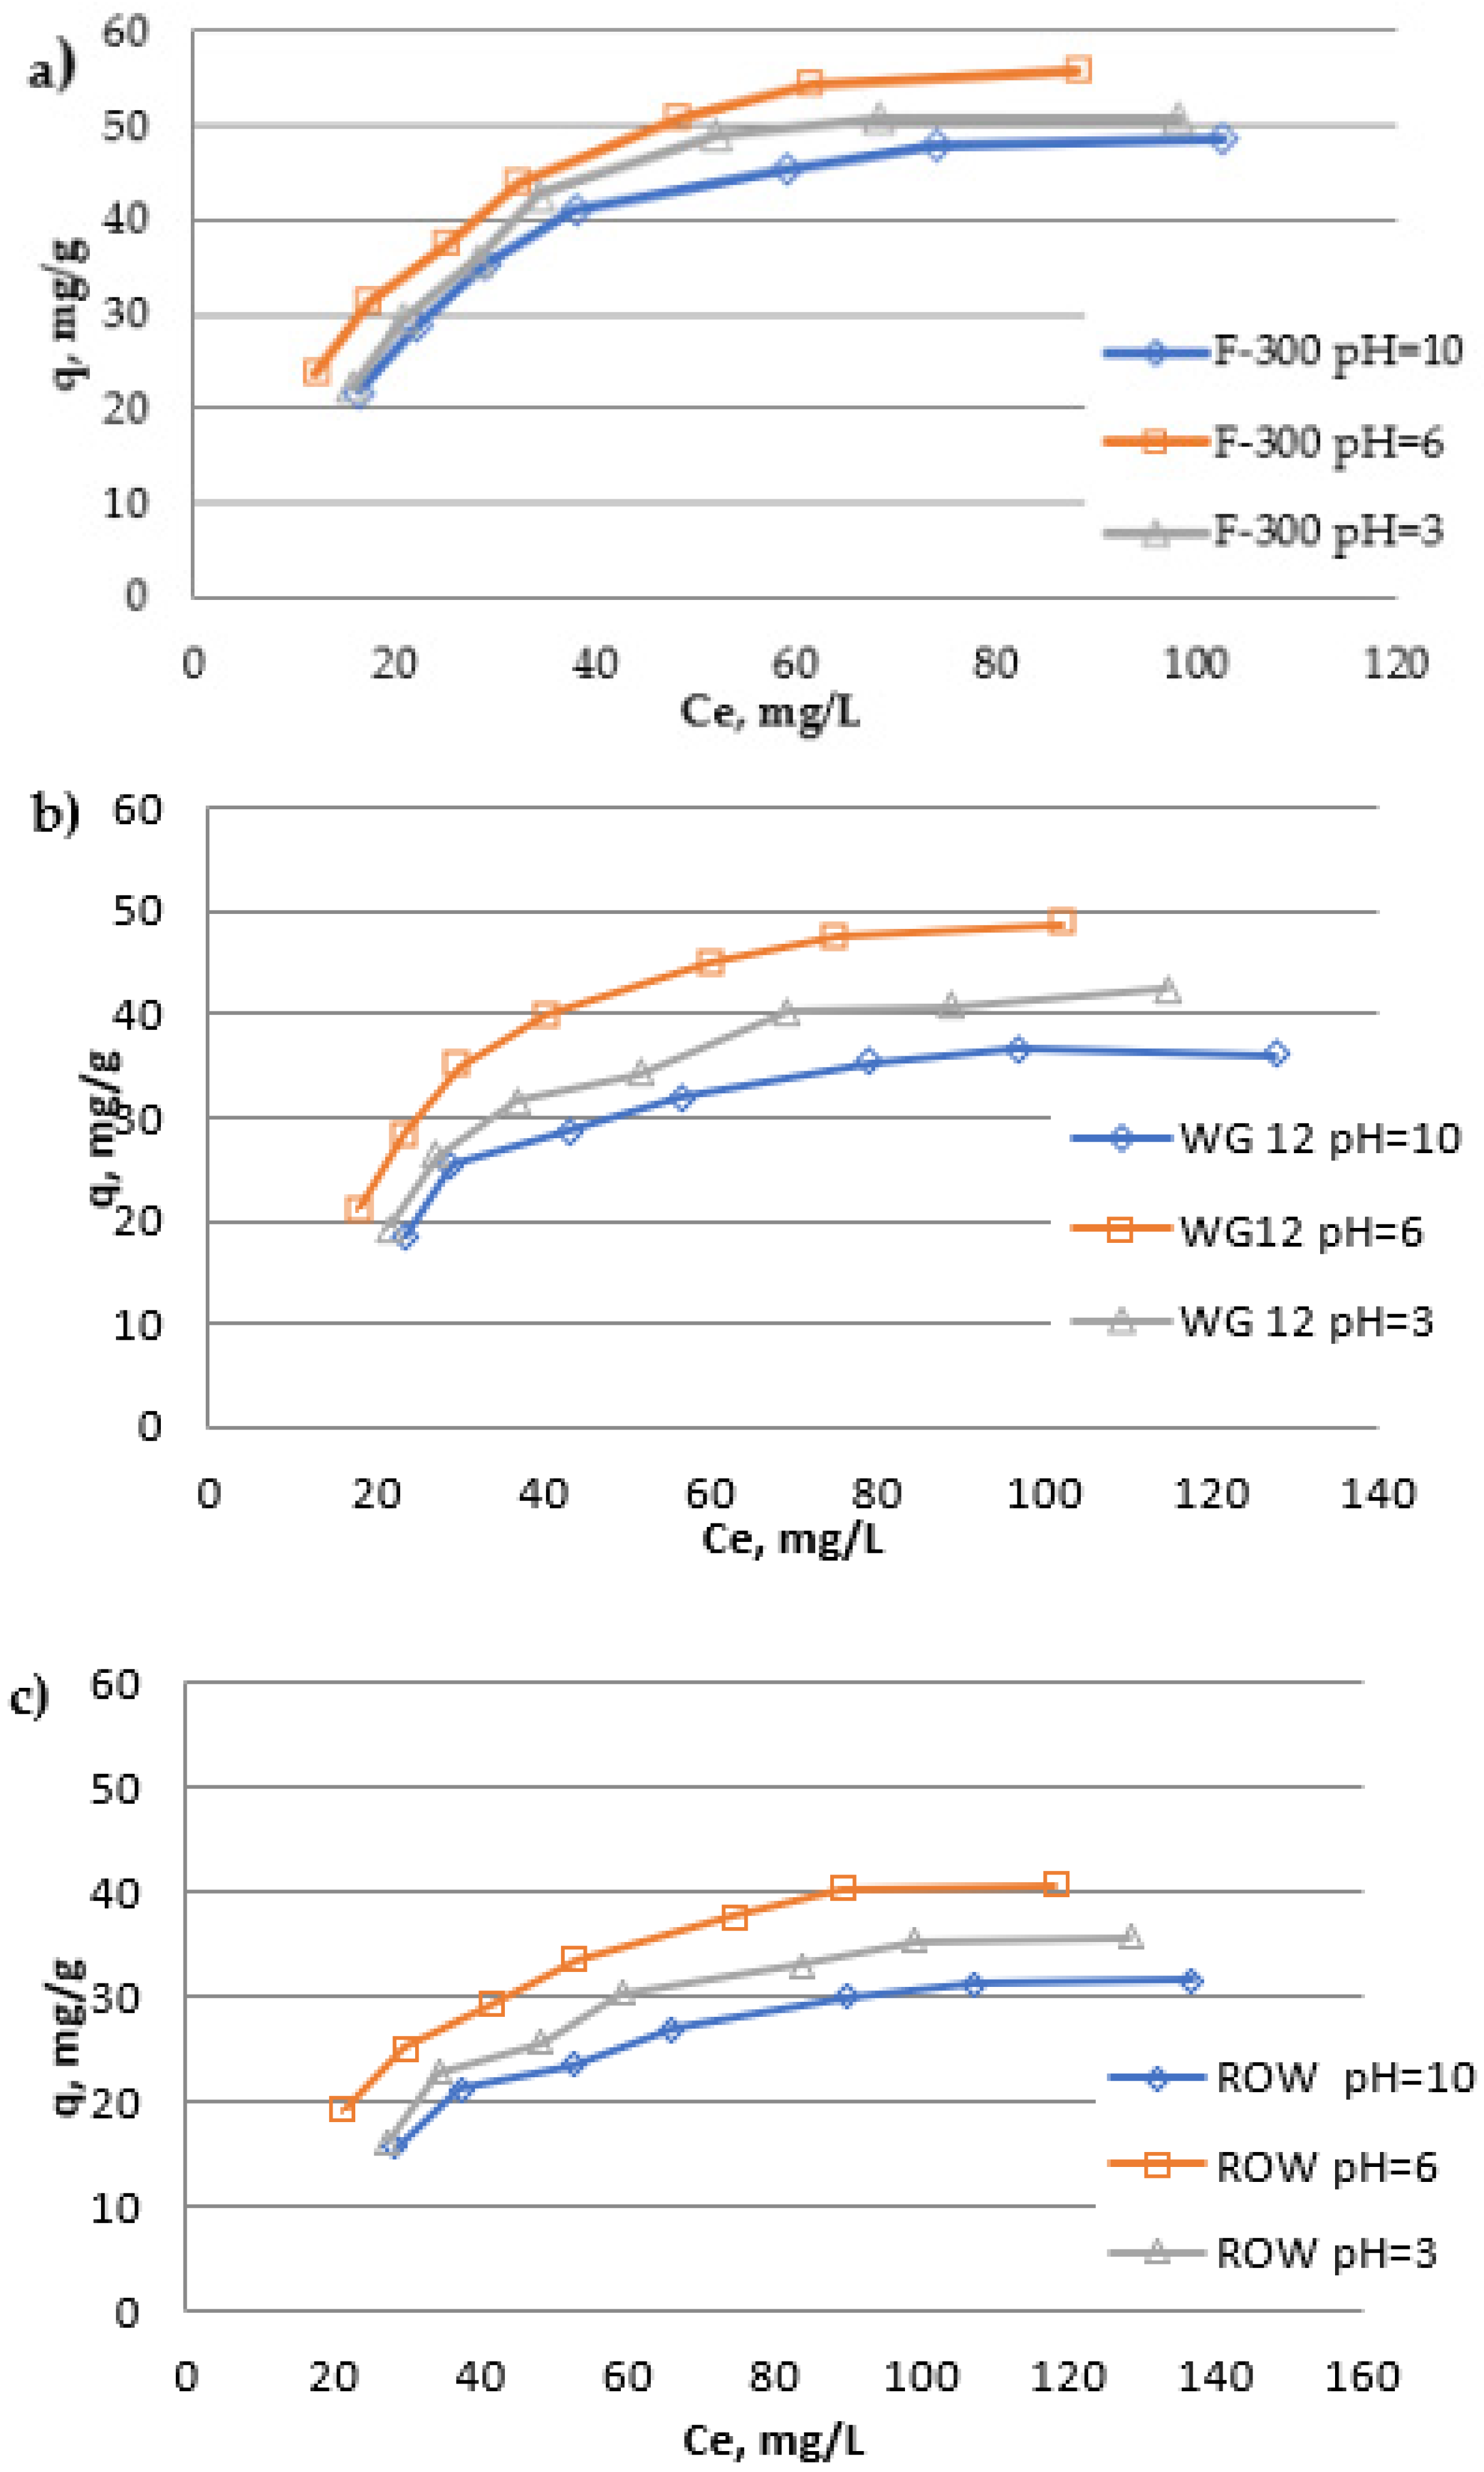
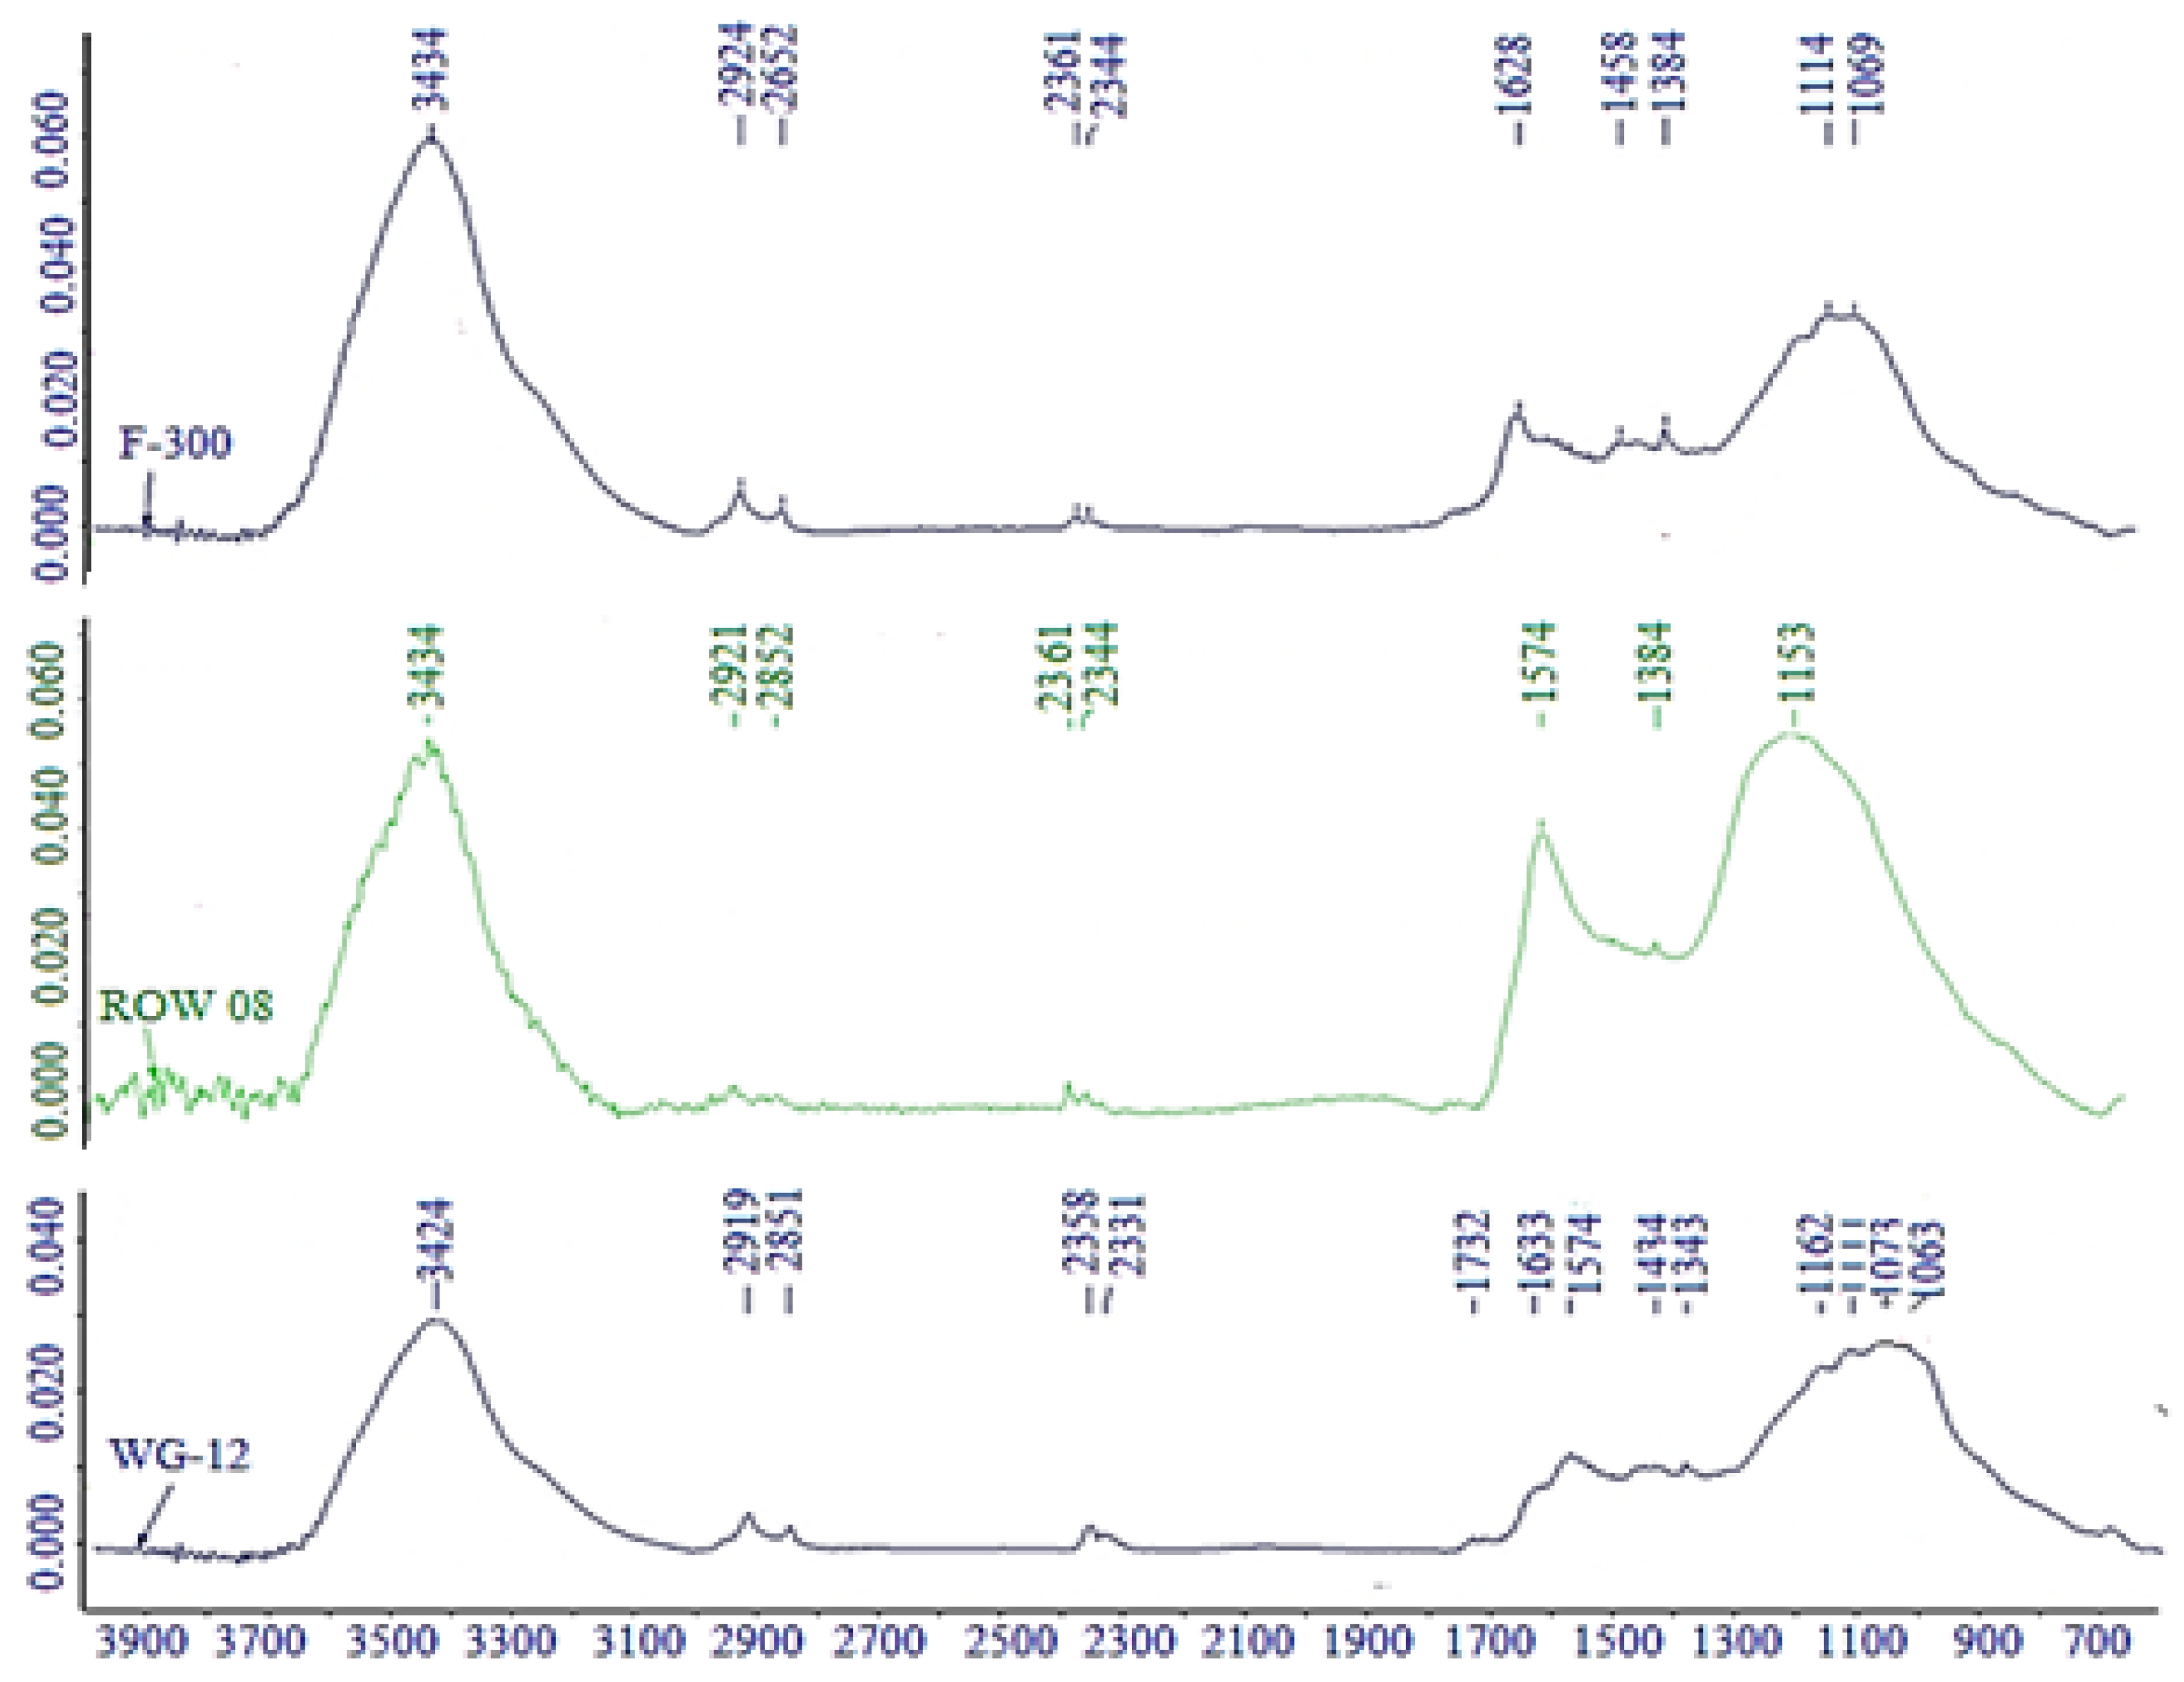
While assessing the effect of the pH of the solution on the amount of oxytetracycline adsorption, a significant importance of this parameter was found (Figure 7 and Table 8). For all the activated carbons used in the research, the same tendencies of the influence of pH on the adsorption of oxytetracycline were observed. The highest adsorption efficiency was obtained when the process was carried out from a solution with pH = 6, and the lowest with pH = 10. The similar influence of pH on the tetracycline adsorption obtained Wand et al., and Liu et al., (the maximum adsorption at pH = 5 and the minimum adsorption in the strongly alkaline solutions) [59,60]. The influence of pH on the tetracycline adsorption is, however, depended on the used sorbent. In the research [55,56] there was observed that the higher pH, the better TC adsorption. Wang et al. in their research observed high and similar adsorption within the range of pH from 4 to 8 [45]. Differences between qm monolayer capacities calculated with the Langmuir isotherm are significant. The largest differences in adsorption capacities qm were observed for activated carbon WG-12, for which qm for pH = 10 is 46.29 and the pH = 6 qm = 65.94 mg/g. The smallest differences were noted in the case of activated carbon F-300: for pH = 10 qm = 63,59 mg/g and for pH = 6 qm = 73.31 mg/g. It is clear that oxytetracycline in the OTC± (pH = 6) form is better adsorbed than in the anionic or cationic form. A similar effect of the pH of the solution on the results of oxytetracycline adsorption was obtained inter alia by Sun et al. [44]. Both basic and acid functional groups are present on the surface of activated carbons produced by the steam-gas method. Their presence was determined by the Bohem method, and the results are presented in Table 9. The tested activated carbons do not differ significantly in the chemical nature of the surface, which was also found on the basis of FTIR tests (Figure 8). Commercial activated carbons used in the research were not additionally oxidized, therefore their surface has relatively few acid-base groups. It can be observed that these carbons have similar amounts of acidic (from 0.434 to 0.586 mmol/g) and basic groups (from 0.467 to 0.592 mmol/g). The simultaneous presence of acidic and basic groups on the surface of activated carbons is characteristic for sorbents produced by the steam-gas method. Carbon ROW 08 Supra, adsorbing the smallest amounts of oxytetracycline, has the lowest amount of acidic groups capable of anion exchange, but the highest amounts of basic groups among the tested sorbents. Activated carbon F-300 with the best oxytetracycline adsorption has moderate amounts of both acidic and basic groups. However, while analyzing the chemical structure of the activated carbons, it is not so obvious to determine simple dependencies between the adsorption capacity and the number of groups on the surface of activated carbons determined by the Boehm method. With such small differences in the chemical structure of the surface of activated carbons, the porous structure and the accessibility of active areas may also be important.
Measurements of the FTIR spectrum of the analyzed activated carbons were also carried out. It is the measurement which is often carried out in order to explain the mechanisms of the tetracycline adsorption [42,60]. Carbon F-300, adsorbing the largest amounts of oxytetracycline, is marked by the highest intensity of phenolic O–H groups forming the hydrogen bond (3200–3500 cm−1). A lower intensity of carbonyl groups > C=O (1740–1500 cm–1) and ester groups C–O–C (1300–1000 cm–1) was observed on carbon F-300 compared to carbon ROW 08 Supra, which absorbs the lowest degree of oxytetracycline. A small peak of carboxyl groups (1732 cm−1) was observed only for activated carbon WG-12. There is a possibility of creating hydrogen bonds between oxytetracycline and phenolic groups on the surface of activated carbon.
In a solution with an acidic pH = 3, dissociated functional groups present on the surface of activated carbons have a repulsive effect on oxytetracycline in the form of OTC+. However, ion exchange (H+ OTC+ functional groups) and electrostatic attraction may occur since some of the oxytetracycline is in the OTC± form. Since oxytetracycline is present in the form of an anion (monovalent and bivalent) in a solution with pH = 10, then the increase of the amount of competing OH ions and the dissociation of weak acid groups (COO and O) on the surface of activated carbons will reduce the adsorption efficiency compared to adsorption from a solution with pH = 6. Therefore, the repulsive interactions between the negatively charged surface and the adsorbate anion may be significant forces, which explains the lowest value of adsorption from such solutions.
Lower adsorption, but not of zero, from solutions with pH = 3 and 10 may indicate the effect of van der Waals forces, ion exchange and electrostatic interactions. In solutions with low pH values, the π–π EDA interaction between the aromatic rings of tetracycline and activated carbons is possible [72,79]. Hydrophobic interactions are also possible [63]. Therefore, oxytetracycline adsorption is most likely the result of various interactions [44,45,80].
The Freundlich, Langmuir, Jovanovic, Redlich–Peterson and Thot isotherms used to describe the results of the research on the influence of the solution pH on the adsorption volume of oxytetracycline describe the obtained results with very high accuracy. The first two isotherms—Freundlich and Langmuir, which are the most widely used, have slightly lower correlation coefficients than other ones (R2 for Freundlich from 0.9903–0.9970, Langmuir from 0.8959 to 0.9993). The isotherms with the highest correlation coefficient (from 0.9953 to 0.9998) are the Jovanovic, Redlich–Peterson and Thot models, whose common feature is that they are a modification, compilation or are based on the assumptions of the Langmuir isotherm (in the case of Redlich–Peterson also the Freundlich isotherms). These isotherms in many cases enable a better match of the results than the Langmuir isotherm [81]. Moreover, the Thot and Redlich–Peterson isotherms are three-parameter equations.

3.4. Oxytetracycline Adsorption on Modified Activated Carbons

The two methods of activated carbon WG-12 modification were compared. One of them is the modification with steam, carbon dioxide or air in a rotary kiln at a temperature of 400 °C. The second method is to use activated carbon as a semiconductor and heat it while the electric current flows to a temperature of 400 °C with the flow of carbon dioxide or air. The carbon used for the modification had quite high values of the adsorption capacity among the sorbents used in the research. The size of the specific surface area, the porous structure and the number of acidic and basic groups for commercial and modified carbon are presented in Table 10. The sorbents formed as a result of the modification of commercial carbon, regardless of its method, were characterized by an increased specific surface area and an increased amount of basic and acidic functional groups. However, the differences are not large and reach a maximum of 10% in the case of the specific surface, up to 15% for basic groups, and up to 50% for acidic groups (for carbon modified with air in a rotary kiln).
Oxytetracycline isotherms were carried out for all modified activated carbons and increased removal of the antibiotic was obtained (Figure 9 and Table 11). Due to the monolayer capacity calculated from the Langmuir isotherm (qm), the tested activated carbons can be arranged in the following order: WG-12 < WG-S < WG-CDWGE-CDWG-AIR ≈ WGE-AIR. A similar, but not identical, order of the activated carbons was obtained by ranking them on the basis of qmax calculated from the Thot and Jovanovic isotherm. According to these models, activated carbon WG-AIR adsorbs more oxytetracycline than carbon WGE-AIR. Such calculated maximum adsorption capacities are consistent with the isothermal diagrams, because the WG-AIR curve lies above the WGE-AIR curve. These differences are not large, but it seems that these isotherms reflect reality better than the Langmuir isotherm. However, the obtained qmax from the Thot and Jovanovic isotherms are closer to the maximum values obtained in the tests, and the Langmuir isotherm determines the capacity of the monolayer.
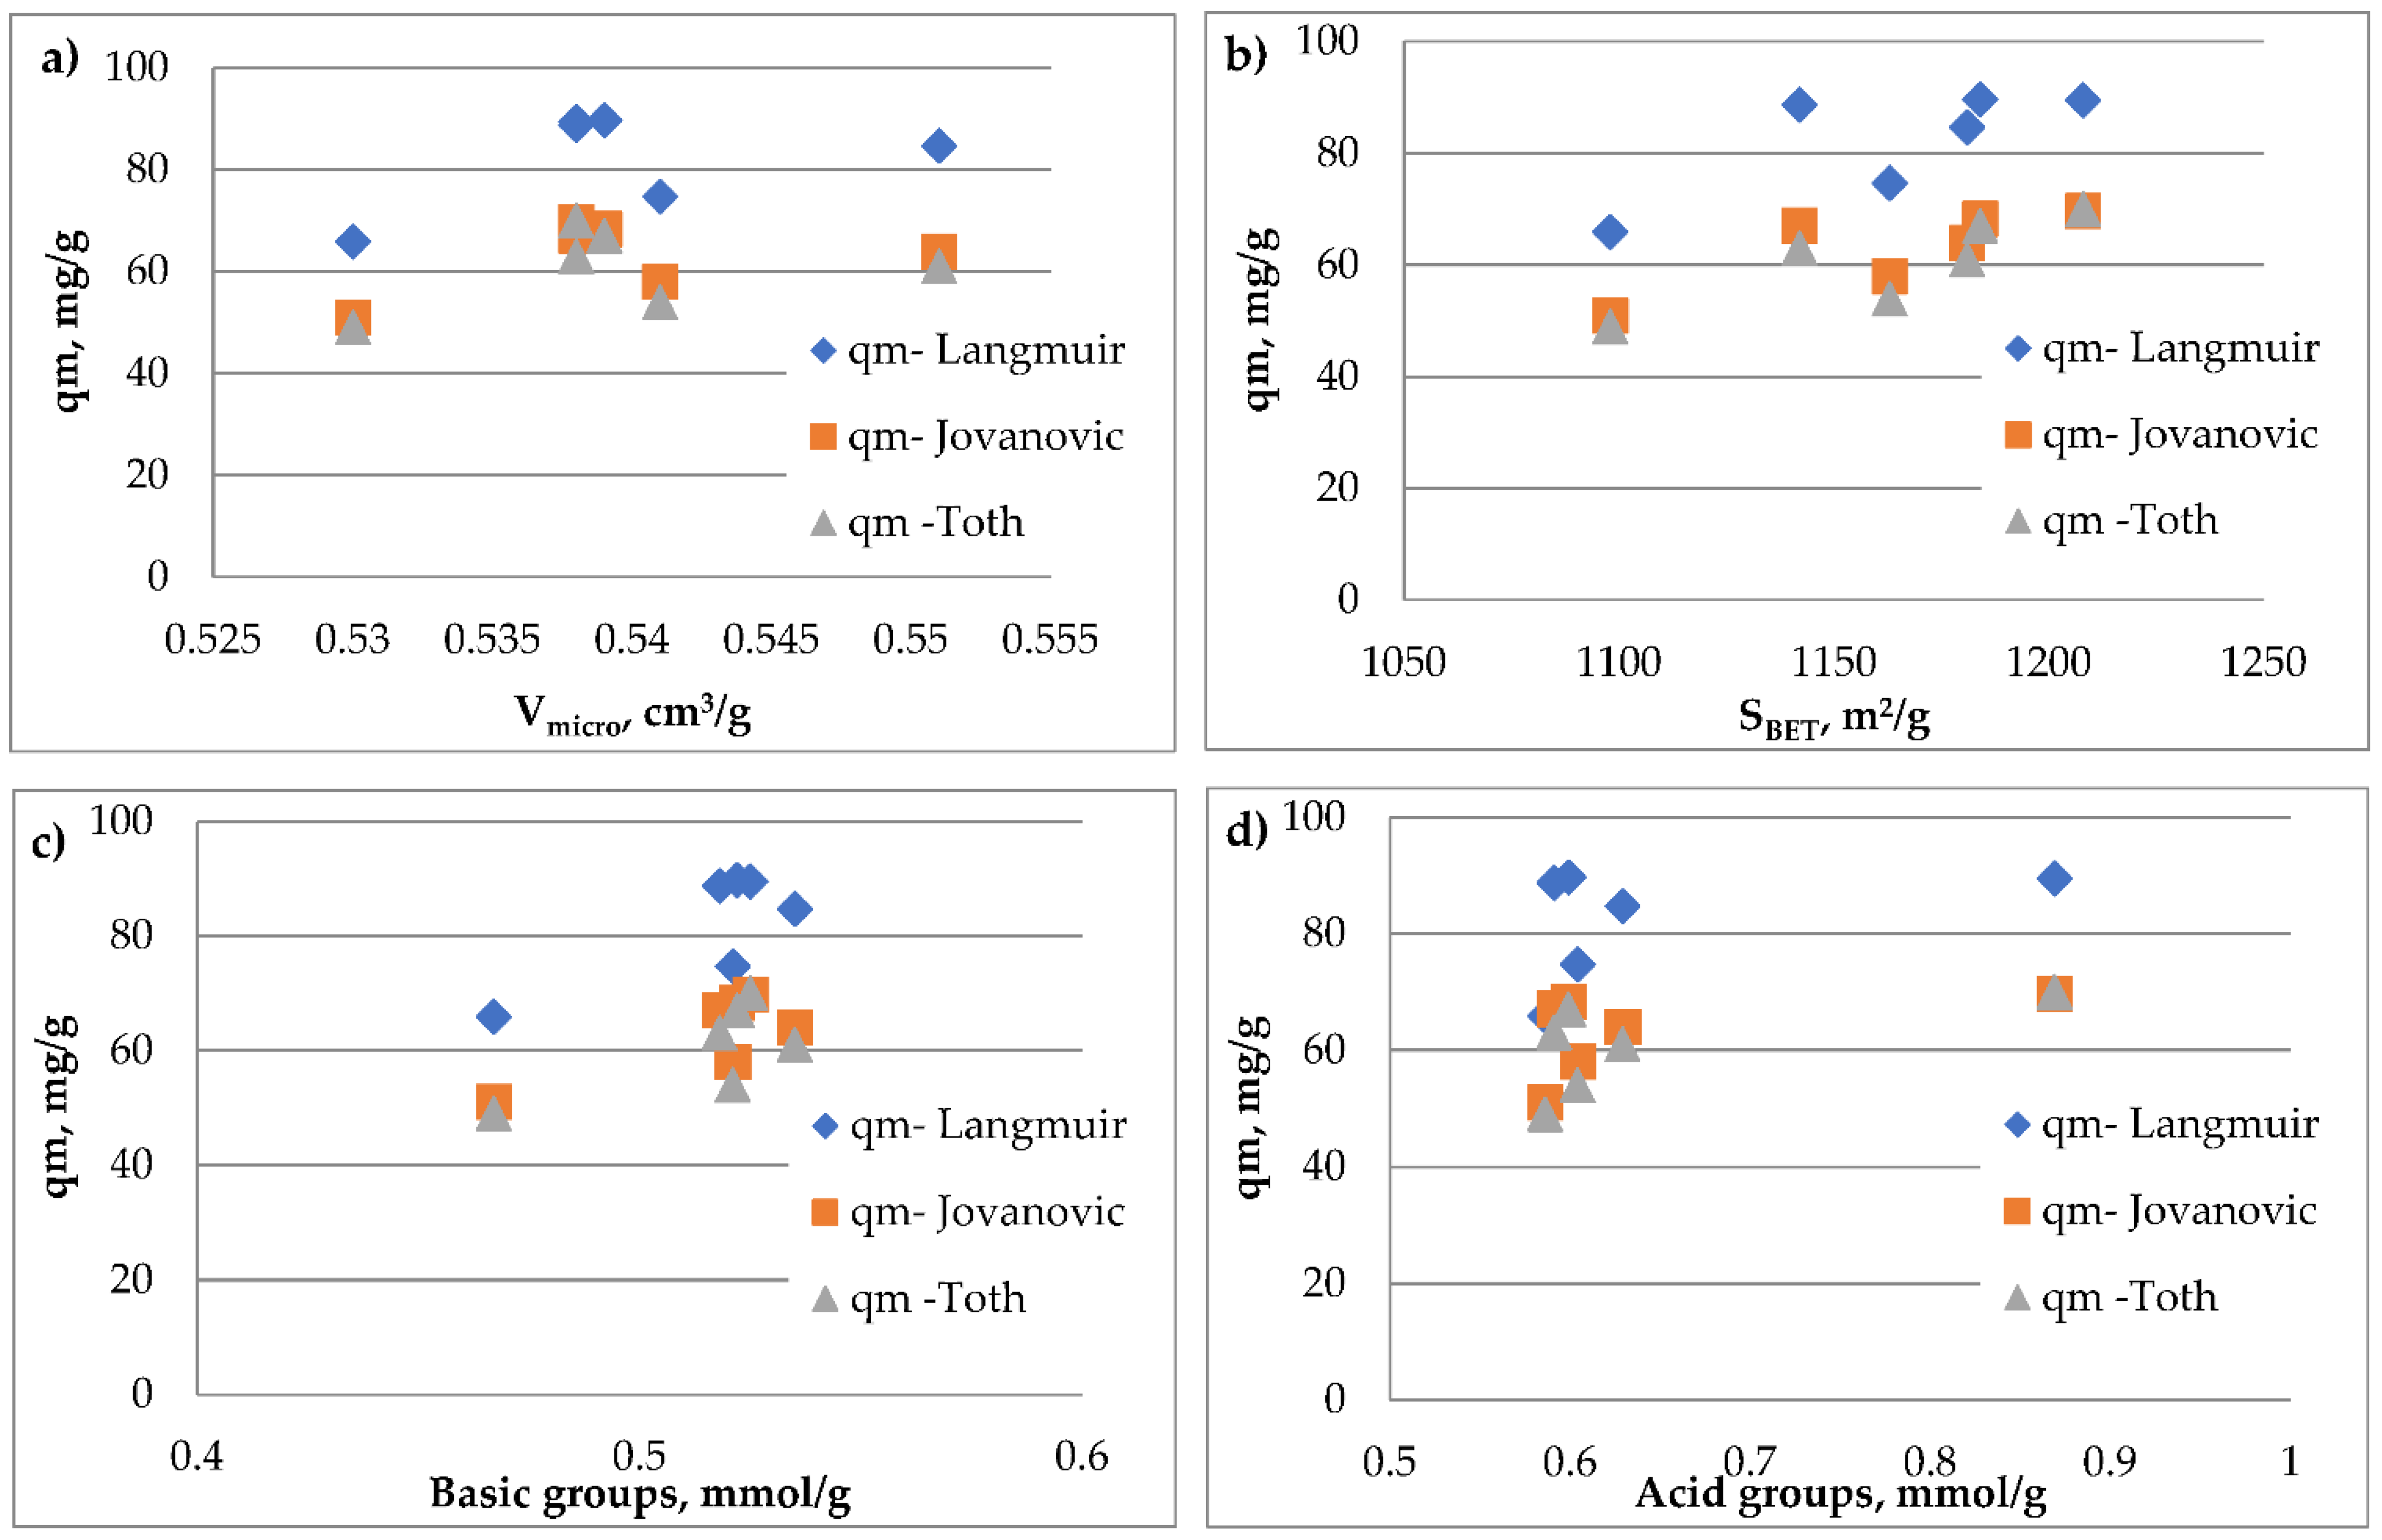
The Pearson correlation between qm/qmax determined from the Langmuir/Jovanovic/Thot isotherm and the specific surface area/volume of micropores/number of acid groups/number of basic groups was analyzed (Table 12). The strength of the correlation depending on the Pearson coefficient is defined as: weak correlation below 0.2, 0.2–0.4 low correlation, 0.4–0.6 moderate correlation (significant dependence), 0.6–0.8 high correlation, 0.8–0.9 very high correlation, 0.9–1 practically full correlation. A high or very high correlation was found between the maximum adsorption capacity and the specific surface area. A slightly higher Pearson correlation coefficient was obtained when the maximum capacity read from the Thot and Jovanovic isotherm was analyzed compared to qm obtained from the Langmuir isotherm. A high correlation was obtained while analyzing the effect of the number of basic groups on qmax and moderate correlation when the effect of the number of acid groups and value of micropore was analyzed. The dependence of the adsorption capacity counted on the basis of the Langmuir/Jovanovic/Thot isotherm on the specific surface area/volume of micropores/number of acid groups/number of basic groups there was presented in Figure 10.
Comparing both methods of modification, it can be seen that higher adsorption occurred on air-modified carbons compared to modification with carbon dioxide or steam (qmax 66 mg/g for WG-12 and 90 mg/g for WG-AIR and WGE-AIR). The modification on the proprietary SEOW stand gives similar results to the modification in a rotary kiln at the same temperature. However, this method is much less energy-consuming, and this parameter is the major disadvantage of high-temperature modification.
The paper attempts to calculate the amount of energy consumed for both methods of activated carbon modification in an approximate manner. This is an approximate comparison because the rotary kiln is made in a fractional-technical scale, and the SEOW stand is a laboratory scale. 1 dm3 of activated carbon was modified within an hour in the rotary kiln, and 0.38 dm3 on the SEOW. The calculations did not take the amount of current required to heat the rotary kiln into account, because if the kiln were to run continuously, this value would have little effect on the final result.
Calculation of energy consumption for the modification of 1 dm3 activated carbon in a rotary kiln:
  • Work within 1 h
  • Total time of turning on reactor heaters—20 min—power 7.2 kW; 2.4 kWh
  • Continuous operation of receiving chamber heating element—1 h-power 0.5 kW; 0.5 kWh
  • Continuous operation of reactor and feeder drive unit—1 h—power 0.2 kW; 0.2 kWh
  • Total time of turning on gas superheater heaters—25 min—power 4.5 kW; 1.9 kWh
  • Total energy consumption: 5 kWh
In the case of modification on the SEOW stand within 24 min (during that time the activated carbon was heated to 400 °C), the energy consumption was 0.2 kWh. However, since there was 0.38 dm3 of activated carbon in the reactor, the energy consumption per 1 dm3 was about 0.6 kWh.
The above calculations prove a large disproportion in electricity consumption for the modification of activated carbon.
The adsorption capacities of commercial activated carbons obtained in the study are lower than those presented in the literature (Table 13). It should be emphasized that activated carbons are often prepared in a special way due to the adsorbed contamination; therefore, the monolayer capacities qm are higher for such carbons than for the commercial sorbents used in the paper. By analyzing the match of the results to the applied kinetic equations, it can be concluded that the PSO equation describes the adsorption kinetics of tetracyclines better than the PFO. The use of other kinetic equations is not common, but sometimes gives a better match to the results than the PSO. However, it depends on the used adsorbent. It is similar in the case of describing the results of adsorption statics with isotherms. The most popular and widely used Langmuir and Freundlich isotherms are often characterized by a lower correlation coefficient R2 than, for example, the Redlich–Peterson equation.
By analyzing the literature reports on the adsorption of tetracyclines (Table 13), it can be noticed that regardless of the used adsorbent, its production and modification method, the physical adsorption is a very important mechanism, but chemical adsorption may occur as well. In the literature, the forces responsible for the adsorption of tetracyclines are mainly described as van der Waals forces, π–π EDA interactions, hydrogen bonds and electrostatic interaction, depending on the used adsorbent. The dominating mechanisms are different depending on the used adsorbent [45,59,76].

4. Conclusions

  • Commercial micro or micro-mesoporous activated carbons used in water treatment plants: F-100, F-300, ROW 08 Supra, WG-12, Picabiol WAZ 0.6–2.4 and WACC 8 × 30 can be used to remove oxytetracycline from water although they are characterized by not very high adsorption capacities (qm from 37.45 to 73.31 mg/g).
  • The activated carbons used in the research can be ranked according to the adsorption of oxytetracycline in the following order: F-300 > WG-12 > Picabiol > ROW 08 Supra > WACC 8 × 30 > F-100 > WAZ 0.6–2.4. Such a rank order does not fully coincide with the arrangement of activated carbons due to the size of the surface area. However, there are some common features between these ranks. The first four activated carbons in the rank order for oxytetracycline adsorption are also in the top four of the rank order for specific surface areas, but in a slightly different configuration. Therefore, the size of the surface area is an important parameter determining the amount of oxytetracycline adsorption, but not the only one.
  • The results of the adsorption kinetics are best described by the Elovich equation, then by the intraparticle diffusion model (Weber–Morris), pseudo-second-order, with the weakest description by pseudo-first-order.
  • A clear effect of the solution pH on the adsorption process was found. It was observed that the adsorption occurred best from solutions with a pH = 6, where the medicine was in a bipolar form of OTC±. Lower adsorption was observed when the process was conducted from solutions with a pH of 3, in which the dominant form was the OTC+ cation. The lowest adsorption was observed from the solution with pH = 10 in which oxytetracycline is present in the form of a monovalent and divalent anion. The highest adsorption from neutral, slightly acidic or slightly alkaline solutions is favorable when the process is to be used for water treatment.
  • Among the analyzed two and three parameter isotherms (Freundlich, Langmuir, Temkin, Jovanovic, Halsey, Redlich–Peterson and Thot), the highest correlation coefficient was obtained for the Redlich–Peterson, Thot and Jovanovic models. The common feature of these isotherms is that they are a modification, compilation or are based on the assumptions of the Langmuir isotherm (in the case of Redlich–Peterson—also the Freundlich isotherm) and, as a result, describe the adsorption of oxytetracycline with a higher correlation coefficient than the Langmuir equation.
  • The adsorption capacity of carbon WG-12 was increased as a result of modification in the rotary kiln and on the proprietary SEOW stand. Increased similar adsorption capacities were obtained for both methods of modification. The best results of oxytetracycline adsorption were obtained on air-modified activated carbons in the rotary kiln and on the ones modified with air and carbon dioxide on the SEOW stand.
  • Modification of activated carbon WG-12 in the rotary kiln and on the SEOW gives similar results; however, the proprietary method involves a much lower electricity consumption.

Author Contributions

Conceptualization, J.L.; methodology, J.L. and A.O.-K.; software, J.L. and M.M.; formal analysis, J.L., A.O.-K. and M.M.; investigation, J.L.; resources, J.L.; data curation, J.L.; writing—original draft preparation, J.L.; writing—review and editing, J.L. and A.O.-K.; visualization, J.L. and M.M.; supervision, J.L.; project administration, J.L. All authors have read and agreed to the published version of the manuscript.

Funding

This research was funded by Czestochowa University of Technology, Poland.

Institutional Review Board Statement

Not applicable.

Informed Consent Statement

Not applicable.

Data Availability Statement

Not applicable.

Acknowledgments

Not applicable.

Conflicts of Interest

The authors declare no conflict of interest.

References

  1. Lach, J.; Stępniak, L.; Ociepa-Kubicka, A. Antibiotics in the Environment as one of the Barriers to Sustainable. Probl. Sustain. Dev. 2018, 13/1, 197–207. [Google Scholar]
  2. Cassini, A.; Högberg, L.D.; Plachouras, D.; Quattrocchi, A.; Hoxha, A.; Simonsen, G.S.; Colomb-Cotinat, M.; Kretzschmar, M.E.; Devleesschauwer, B.; Cecchini, M.; et al. Attributable deaths and disability-adjusted life-years caused by infections with antibiotic-resistant bacteria in the EU and the European Economic Area in 2015: A population-level modelling analysis. Lancet Infect Dis. 2019, 19, 55–56. [Google Scholar] [CrossRef] [Green Version]
  3. Zhou, L.J.; Ying, G.G.; Liu, S.; Zhao, J.L.; Yang, B.; Chen, Z.F.; Lai, H.J. Occurrence and fate of eleven classes of antibiotics in two typical wastewater treatment plants in south China. Sci. Total Environ. 2013, 452–453, 365–376. [Google Scholar] [CrossRef]
  4. Rodriguez-Mozaz, S.; Chamorro, S.; Marti, E.; Huerta, B.; Gros, M.; Sànchez-Melsió, A.; Borrego, C.M.; Barceló, D.; Balcázar, J.L. Occurrence of antibiotics and antibiotic resistance genes in hospital and urban wastewaters and their impact on the receiving river. Water Res. 2015, 69, 234–242. [Google Scholar] [CrossRef] [PubMed]
  5. Kümmerer, K. Antibiotics in the aquatic environment—A review—Part I. Chemosphere 2009, 75, 417–434. [Google Scholar] [CrossRef] [PubMed]
  6. Andersson, D.I.; Hughes, D. Microbiological effects oof sublethallevels of antibiotics. Nat. Rev. Microbiol. 2014, 12, 465. [Google Scholar] [CrossRef]
  7. Qiao, M.; Ying, G.G.; Singer, A.C.; Zhu, Y.G. Review of antibiotic resistance in China and its environment. Environ. Int. 2017, 110, 160–172. [Google Scholar] [CrossRef] [PubMed] [Green Version]
  8. Su, H.C.; Liu, Y.S.; Pan, C.G.; Ying, G.G. Persistence of antibiotic resistance genes and bacterial community changes in drinking water treatment system from drinking water source to tap water. Sci. Total Environ. 2018, 616–617, 453–462. [Google Scholar] [CrossRef]
  9. Xu, L.K.; Ouyang, W.Y.; Qian, Y.Y.; Su, C.; Su, J.Q.; Chen, H. Hoght-throughput profilling of antibiotic resistance genes in drinking water treatment plants and distribution systems. Environ. Pollut. 2016, 213, 119–126. [Google Scholar] [CrossRef] [PubMed]
  10. Blaser, M.J. Antibiotic use and consequences for the normal microbione. Science 2016, 352, 544–545. [Google Scholar] [CrossRef] [Green Version]
  11. Pérez-Cobas, A.E.; Gosalbes, M.J.; Friedrichs, A.; Knecht, H.; Artacho, A.; Eismann, K.; Otto, W.; Rojo, D.; Bargiela, R.; von Bergen, M.; et al. Gut microbiota disturbance during antibiotic therapy: A multi-omic approach. Gut 2012, 62, 1591–1601. [Google Scholar] [CrossRef]
  12. Jones, O.A.; Lester, J.N.; Voulvoulis, N. Pharmaceuticals: A threat to drinking water? Trends Biotechnol. 2005, 23, 163–167. [Google Scholar] [CrossRef]
  13. Wollenberger, L.; Halling-Sørensen, B.; Kusk, K.O. Acute and chronic toxicity of veterinary antibiotics to Daphnia magna. Chemosphere 2000, 40, 723–730. [Google Scholar] [CrossRef]
  14. Wu, M.; Que, C.J.; Xu, G.; Sun, Y.F.; Ma, J.; Xu, H.; Sun, R.; Tang, L. Occurrence, fate and interrelation of selected antibiotics in sewage treatment plants and their receiving surface water. Ecotoxicol. Environ. Saf. 2016, 132, 132–139. [Google Scholar] [CrossRef]
  15. Golovko, O.; Kumar, V.; Fedorova, G.; Randak, T.; Grabic, R. Seasonal changes in antibiotics, antidepressants/psychiatric drugs, antihistamines and lipid regulators in a wastewater treatment plant. Chemosphere 2014, 111, 418–426. [Google Scholar] [CrossRef]
  16. Michael, I.; Rizzo, L.; Mcardell, C.; Manaia, C.; Merlin, C.; Schwartz, T.; Dagot, C.; Fatta-Kassinos, D. Urban wastewater treatment plants as hotspots for the release of antibiotics in the environment: A review. Water Res. 2013, 47, 957–995. [Google Scholar] [CrossRef] [PubMed] [Green Version]
  17. Guerra, P.; Kim, M.; Shah, A.; Alaee, M.; Smyth, A. Occurrence and fate of antibiotic, analgesic/anti-inflammatory, and antifungal compounds in five wastewater treatment processes. Sci. Total Environ. 2014, 473–474, 235–243. [Google Scholar] [CrossRef] [PubMed]
  18. Kemper, N. Veterinary antibiotics in the aquatic and terrestrial environment. Ecol. Indic. 2008, 8, 1–13. [Google Scholar] [CrossRef]
  19. Thiele-Bruhn, S.; Beck, I.C. Effects of sulfonamide and tetracycline antibiotics on soil microbial activity and microbial biomass. Chemosphere 2005, 59, 457–465. [Google Scholar] [CrossRef]
  20. Li, W.; Shi, Y.; Gao, L.; Liu, J.; Cai, Y. Occurrence and removal of antibiotics in a municipal wastewater reclamation plant in Beijing, China. Chemoosphere 2013, 92, 435–444. [Google Scholar] [CrossRef]
  21. Kolpin, D.W.; Furlong, E.T.; Meyer, M.T.; Thurman, E.M.; Zaugg, S.D.; Barber, L.B.; Buxton, H.T. Pharmaceuticals, hormones, and others organic wastewater contaminants in US streams, 1999–2000: A national reconnaissance. Environ. Sci. Technol. 2002, 36, 1202–1211. [Google Scholar] [CrossRef] [PubMed] [Green Version]
  22. Zhao, S.; Liu, X.; Cheng, D.; Liu, G.; Liang, B.; Cui, B.J. Temporal–spatial variation and partitioning prediction of antibiotics in surface water and sediments from the intertidal zones of the Yellow River Delta, China. Sci. Total Environ. 2016, 569–570, 1350–1358. [Google Scholar] [CrossRef]
  23. Watkinson, J.; Murby, E.J.; Kolpin, D.W.; Costanzo, S.D. The occurrence of antibiotics in an urban watershed: From wastewater to drinking water. Sci. Total Environ. 2009, 407, 2711–2723. [Google Scholar] [CrossRef]
  24. Qin, Y.Q.; Wen, Q.; Ma, Y.; Yang, C.C.; Liu, Z.C. Antibiotics pollution in gonghu Bay in the period of water diversion from Yangtze River to Taihu Lake. Environ. Earth. Sci. 2018, 77, 1–11. [Google Scholar] [CrossRef]
  25. Grenni, P.; Ancona, V.; Caracciolo, A.B. Ecological effects of antibiotics on natural ecosystems: A review. Microchem. J. 2018, 136, 25–39. [Google Scholar] [CrossRef]
  26. Feng, L.; Cheng, Y.; Zhang, Y.; Li, Z.; Yu, Y.; Feng, L.; Zhang, S.; Xu, L. Distribution and human health risk assessment of antibiotic residues in large-scale drinking water sources in Chongqing area of the Yangtze River. Environ. Res. 2020, 185, 109386. [Google Scholar] [CrossRef]
  27. Ben, Y.; Hu, M.; Zhang, X.; Wu, S.; Wong, M.H.; Wang, M.; Andrews, C.B.; Zheng, C. Efficient detection and assessment of human exposure to trace antibiotic residues in drinking water. Water Res. 2020, 175, 115699. [Google Scholar] [CrossRef]
  28. Yan, W.; Xiao, Y.; Yan, W.; Ding, R.; Wang, S.; Zhao, F. The effect of bioelectrochemical systems on antibiotics removal and antibiotic resistance genes: A review. Chem. Eng. J. 2019, 358, 1421–1437. [Google Scholar] [CrossRef]
  29. Biancullo, F.; Moreira, N.F.F.; Ribeiro, A.R.; Manaia, C.M.; Faria, J.L.; Nunes, O.C.; Castro-Silva, S.M.; Silva, A.M.T. Heterogeneous photocatalysis using UVA-LEDs for the removal of antibiotics and antibiotic resistant bacteria from urban wastewater treatment plant effluents. Chem. Eng. J. 2019, 367, 304–313. [Google Scholar] [CrossRef]
  30. Wang, J.; Zhuan, R. Degradation of antibiotics by advanced oxidation processes: An overview. Sci. Total Environ. 2020, 701, 135023. [Google Scholar] [CrossRef]
  31. Liu, C.X.; Xu, Q.M.; Yu, S.C.; Cheng, J.S.; Yuan, Y.J. Bio-removal of tetracycline antibiotics under the consortium with probiotics Bacillus clausii T and bacillus amyloliquefaciens producing biosurfactants. Sci. Total Environ. 2020, 710, 136329. [Google Scholar] [CrossRef] [PubMed]
  32. Kim, J.E.; Bhatia, S.K.; Song, H.J.; Yoo, E.; Jeon, H.J.; Yoon, J.Y.; Yang, Y.; Gurav, R.; Yang, Y.H.; Kim, H.J.; et al. Adsorptive removal of tetracycline from aqueous solution by maple leaf-derived biochar. Bioresour. Technol. 2020, 306, 1–13. [Google Scholar] [CrossRef]
  33. Adams, C.; Wang, Y.; Loftin, K.; Meyer, M. Removal of antibioticsfrom surface and distilled water in conventional water treatment processes. J. Environ. Eng. 2002, 128, 253–260. [Google Scholar] [CrossRef]
  34. Westerhoff, P.; Yoon, Y.; Snyder, S.; Wert, E. Fate of endocrine-disruptor, pharmaceutical, and personal care product chemicals during simulated drinking water treatment processes. Environ. Sci. Technol. 2005, 39, 6649–6663. [Google Scholar] [CrossRef]
  35. Ahmed, M.J.; Hameed, B.H. Removal of emerging pharmaceutical contaminants by adsorption in fixed-bad column: Areview. Ecotoxicol. Environ. Saf. 2018, 149, 257–266. [Google Scholar] [CrossRef] [PubMed]
  36. Ali, I.; AL-Othman, A.Z.; Alwarthan, A. Synthesis of composite iron nano adsorbent and removal of ibuprofen drug residue from water. J. Mol. Liq. 2016, 219, 858–864. [Google Scholar] [CrossRef]
  37. Abazari, R.; Mahjoub, A.R.; Shariati, J. Synthesis of a nanostructured pillar MOF with hig adsorption capacity towards antibiotics pollutants from aqueous solution. J. Hazard Mater. 2019, 366, 439–451. [Google Scholar] [CrossRef]
  38. Chayid, M.A.; Ahmed, M.J. Amoxicillin adsorption on microwave prepared activated carbon from Arundo donax Linn: Isotherms, kinetics, and thermodynamics studies. J. Environ. Chem. Eng. 2015, 3, 1592–1601. [Google Scholar] [CrossRef]
  39. Liu, P.; Liu, W.J.; Jiang, H.; Chen, J.J.; Li, W.W.; Yu, H.Q. Modification of bio-char derived from fast pyrolysis of biomass and its application in removal of tetracycline from aqueous solution. Bioresour. Technol. 2012, 121, 235–240. [Google Scholar] [CrossRef]
  40. Zhou, Q.; Li, Z.; Shuang, C.; Li, A.; Zhang, M.; Wang, M. Efficient removal of tetracycline by reusable magnetic microspheres with a high surface area. Chem. Eng. J. 2012, 210, 350–356. [Google Scholar] [CrossRef]
  41. Ahmed, M.B.; Zhou, J.L.; Ngo, H.H.; Guo, W. Adsorptive removal of antibiotics from water and wastewater: Progress and challenges. Sci.Total Environ. 2015, 532, 112–126. [Google Scholar] [CrossRef] [PubMed]
  42. Yang, Q.; Wua, P.; Liu, J.; Rehman, S.; Ahmed, Z.; Ruan, B.; Zhu, N. Batch interaction of emerging tetracycline contaminant with novel phosphoric acid activated corn straw porous carbon: Adsorption rate and nature of mechanism. Environ. Res. 2020, 181, 108899. [Google Scholar] [CrossRef]
  43. Yazidi, A.; Atrous, M.; Soetaredjo, F.E.; Sellaoui, L.; Ismadji, S.; Erto, A.; Bonilla-Petriciolet, A.; Dotto, G.L.; Laminea, A.B. Adsorption of amoxicillin and tetracycline on activated carbon prepared from durian shell in single and binary systems: Experimental study and modeling analysis. Chem. Eng. J. 2020, 379, 122320. [Google Scholar] [CrossRef]
  44. Sun, Y.; Yue, Q.; Gao, B.; Li, Q.; Huang, L.; Yao, F.; Xu, X. Preparation of activated carbon derived from cotton linter fibers by fused NaOH activation and its application for oxytetracycline (OTC) adsorption. J. Colloid Interf. Sci. 2012, 368, 521–527. [Google Scholar] [CrossRef]
  45. Sun, Y.; Yue, Q.; Gao, B.; Wang, Y.; Gao, Y.; Li, Q. Preparation of highly developed mesoporous activated carbon by H4P2O7 activation and its adsorption behavior for oxytetracycline. Powder Technol. 2013, 249, 54–62. [Google Scholar] [CrossRef]
  46. Chuang, Y.-H.; Li, H. Mechanistic study on uptake and transport of pharmaceuticals in lettuce from water. Environ. Int. 2019, 131, 104976. [Google Scholar] [CrossRef]
  47. Sallach, J.B.; Bartelt-Hund, S. Concomitant uptake of antimicrobials and Salmonella in soil and into lettuce following wastewater irrigation. Environ. Pollut. 2015, 197, 269–277. [Google Scholar] [CrossRef] [PubMed]
  48. Yuan, L.; Yan, M.; Huang, Z.; He, K.; Zeng, G.; Chen, A.; Hu, L.; Li, H.; Peng, M.; Huang, T.; et al. Influences of pH and metal ions on the interactions of oxytetracycline onto nano-hydroxyapatite and their co-adsorption behavior in aqueous solution. J. Colloid Interf. Sci. 2019, 541, 101–113. [Google Scholar] [CrossRef]
  49. Benjellou, M.; Miyah, Y.; Evrendilek, G.A.; Zerrouq, F.; Lairini, S. Recent Advances in Adsorption Kinetic Models: Their Application to Dye Types. Arab. J. Chem. 2021, 14, 103031. [Google Scholar] [CrossRef]
  50. Ignatowicz, K. Application of Mathematical Models of Sorption Process to Describe the Removaln of HCH Pesticide on Vermicompos. Annu. Set Environ. Prot. 2010, 12, 525–542. [Google Scholar] [CrossRef]
  51. Nworie, F.S.; Nwabue, F.I.; Oti, W.; Mbam, E.; Nwali, B.U. removal of methylene blue from aqueous solution using activated rice husk biochar: Adsorption isotherms, kinetics and error analysis. J. Chil. Chem. Soc. 2019, 64, 4365–4376. [Google Scholar] [CrossRef] [Green Version]
  52. Omotunde, I.; Okoronkwo, A.; Oluwashina, O. Derived and thiourea-functionalized silica for cadmium removal: Isotherm, kinetic and thermodynamic studies. Appl. Water Sci. 2018, 8, 21. [Google Scholar] [CrossRef] [Green Version]
  53. Dada, A.O.; Olalekan, A.P.; Olatunya, A.M.; Dada, O. Langmuir, Freundlich and Dubinin-Radushkevich isotherms studies of equilibrium sorption of Zn+ unto phosphoric acid modified rice husk. IOSR J. Appl. Chem. 2012, 3, 38–45. [Google Scholar]
  54. Boehm, H.P. Some aspects of the surface chemistry of carbon blacks and other carbons. Carbon 1994, 32, 759–776. [Google Scholar] [CrossRef]
  55. Chena, T.; Luoa, L.; Denga, S.; Shib, G.; Zhanga, S.; Zhanga, Y.; Dengc, Q.; Wanga, L.; Zhanga, J.; Weib, L. Sorption of tetracycline on H3PO4 modified biochar derived from rice straw and swine manure. Bioresour. Technol. 2018, 267, 431–437. [Google Scholar] [CrossRef] [PubMed]
  56. Yang, Z.; Zhao, Z.; Yang, X.; Ren, Z. Xanthate modified magnetic activated carbon for efficient removal of cationic dyes and tetracycline hydrochloride from aqueous solutions. Colloid. Surf. A 2021, 615, 126273. [Google Scholar] [CrossRef]
  57. Sun, L.; Chen, D.; Wan, S.; Yu, Z. Performance, kinetics, and equilibrium of methylene blue adsorption on biochar derived from eucalyptus saw dust modified with citric, tartaric, and acetic acids. Bioresour. Technol. 2015, 198, 300–308. [Google Scholar] [CrossRef]
  58. Zhou, Y.; Liu, X.; Xiang, Y.; Wang, P.; Zhang, J.; Zhang, F.; Wei, J.; Luo, L.; Lei, M.; Tang, L. Modification of biochar derived from sawdust and its application in removal of tetracycline and copper from aqueous solution: Adsorption mechanism and modelling. Bioresour. Technol. 2017, 245, 266–273. [Google Scholar] [CrossRef]
  59. Wang, J.; Lei, S.; Liang, L. Preparation of porous activated carbon from semi-coke by high temperaturę activation with KOH for the high-efficiency adsorption of aqueous tetracycline. Appl. Surf. Sci. 2020, 530, 147187. [Google Scholar] [CrossRef]
  60. Liu, H.; Xu, G.; Li, G. Preparation of porous biochar based on pharmaceutical sludge activated by NaOH and its application in the adsorption of tetracycline. J. Colloid Interf. Sci. 2021, 587, 271–278. [Google Scholar] [CrossRef]
  61. Li, G.; Zhang, D.; Wang, M.; Huang, J.; Huang, L. Preparation of activated carbons from Iris tectorum employing ferric nitrate as dopant for removal of tetracycline from aqueous solutions. Ecotox. Environ. Safe. 2013, 98, 273–282. [Google Scholar] [CrossRef] [PubMed]
  62. Boudrahem, N.; Delpeux-Ouldriana, S.; Khenniche, L.; Boudrahem, F.; Aissaani-Benissad, F.; Gineys, M. Single and mixture adsorption of clofibric acid, tetracycline and paracetamol onto Activated carbon developed from cotton cloth residue. Process Saf. Environ. 2017, 111, 544–559. [Google Scholar] [CrossRef]
  63. Jang, H.M.; Kan, E. Engineered biochar from agricultural waste for removal of tetracycline in water. Bioresour. Technol. 2019, 284, 437–447. [Google Scholar] [CrossRef]
  64. Zhu, X.; Liu, Y.; Qian, F.; Zhou, C.; Zhang, S. Jianmin Chen Preparation of magnetic porous carbon from waste hydrochar by simultaneous activation and magnetization for tetracycline removal. Bioresour. Technol. 2014, 154, 209–214. [Google Scholar] [CrossRef]
  65. Ahmed, M.B.; Zhoua, J.L.; Ngo, H.H.; Guoa, W.; Johir, M.A.H.; Belhaj, D. Competitive sorption affinity of sulfonamides and chloramphenicol antibiotics toward functionalized biochar for water and wastewater treatment. Bioresour. Technol. 2017, 238, 306–312. [Google Scholar] [CrossRef]
  66. Płaziński, W.; Rudziński, W. Adsorption Kinetics at solid/solution interfaces the meaning of the pseudo-first- and pseudo-second-order equations. J. Pol. Chem. Soc. 2011, 65, 1055–1067. [Google Scholar]
  67. Hung, L.; Sun, Y.; Wang, W.; Yue, Q.; Yang, T. Comparative study on characterization of activated carbons prepared by microwave and conventional heating methods and application in removal of oxytetracycline (OTC). Chem. Eng. J. 2011, 171, 1446–1453. [Google Scholar] [CrossRef]
  68. Tan, G.; Mao, Y.; Wang, H.; Xu, N. A comparative study of arsenic(V), tetracycline and nitrate ions adsorption onto magnetic biochars and activated carbon. Chem. Eng. Res. Des. 2020, 159, 582–591. [Google Scholar] [CrossRef]
  69. Li, Y.; Wang, H.; Liu, X.; Zhao, G.; Sun, Y. Dissipation kinetics of oxytetracycline, tetracycline and chlorotetracycline residues in soil. Environ. Sci. Pollut. Res. 2016, 23, 13822–23831. [Google Scholar] [CrossRef] [PubMed]
  70. Kan, Y.; Yue, Q.; Li, D.; Wu, Y.; Gao, B. Preparation and characterization of activated carbons from waste tea by H3PO4 activation in different atmospheres for oxytetracycline removal. J. Taiwan Inst. Chem. E. 2017, 71, 494–500. [Google Scholar] [CrossRef]
  71. Zhang, P.; Li, Y.; Cao, Y.; Han, L. Characteristics of tetracycline adsorption by cow manure biochar prepared at different pyrolysis temperatures. Bioresour. Technol. 2019, 285, 121348. [Google Scholar] [CrossRef]
  72. Alahabadi, A.; Hosseini-Bandegharaei, A.; Moussavi, G.; Amin, B.; Rastegar, A.; Karimi-Sani, H.; Fattahi, M.; Miri, M. Comparing adsorption properties of NH4Cl-modified activated carbon towards chlortetracycline antibiotic with those of commercial activated carbon. J. Mol. Liq. 2017, 232, 367–381. [Google Scholar] [CrossRef]
  73. Din, M.A.T.; Ahmad, M.A.; Hameed, B.H. Ordered mesoporous carbons originated from non-edible polyethylene glycol 400 (PGE-400) for chloramphenicol antibiotic recovery from liquid phase. Chem. Eng. J. 2015, 260, 730–739. [Google Scholar] [CrossRef]
  74. Chowdhury, A.; Kumari, S.; Khan, A.A.; Chandra, M.R.; Hussain, S. Activated carbon loaded with Ni-Co-S nanoparticle for superior adsorption. Colloids Surf. A 2021, 611, 125868. [Google Scholar] [CrossRef]
  75. Hasanzadeh, V.; Rahmanian, O.; Heidari, M. Cefixime adsorption onto activated carbon prepared by dry thermochemical activation of date fruit residues. Microchem. J. 2020, 152, 104261. [Google Scholar] [CrossRef]
  76. Sun, S.; Cao, J.; Xu, Z.; Yang, Z.; Xiong, W.; Song, P.; Zhong, R.; Peng, S. KOH activated ZIF-L derived N-doped porous carbon with enhanced adsorption performance towards antibiotics removal from aqueous solution. J. Solid State Chem. 2020, 289, 121492. [Google Scholar] [CrossRef]
  77. Fan, Y.; Wang, B.; Yuan, S.; Wu, X.; Chen, J.; Wang, L. Adsorptive removal of chloramchenicol from wastewatern by NaOH modified bamboo charcoal. Bioresour. Technol. 2010, 101, 7661–7664. [Google Scholar] [CrossRef] [PubMed]
  78. Jin, X.; Xu, H.; Qiu, S.; Jia, M.; Wang, F.; Zhang, A.; Jiang, X. Direct photolysis of oxytetracycline: Influence of initial concentration, pH and temperature. JPPA 2017, 332, 224–231. [Google Scholar] [CrossRef]
  79. Gao, Y.; Li, Y.; Zhang, L.; Huang, H.; Hu, J.; Shah, S.M.; Su, X. Adsorption and removal of tetracycline antibiotics from aqueous solution by graphene oxide. J. Colloid Interface Sci. 2012, 368, 540–546. [Google Scholar] [CrossRef] [PubMed]
  80. Hasan, Z.; Jhung, S.H. Removal of hazardous organics from water using metalorganic frameworks (MOFs): Plausible mechanisms for selective adsorptions. J. Hazard Mater. 2015, 283, 329–339. [Google Scholar] [CrossRef] [PubMed]
  81. Ayawei, N.; Ebelegi, A.N.; Wankasi, D. Modelling and Interpretation of Adsorption Isotherms. J Chem. 2017, 2017, 3039817. [Google Scholar] [CrossRef]
Figure 1. Testing stand for activated carbon modification using Joule heat (SEOW).
Energies 14 03481 g001
Figure 2. Testing stand for the high-temperature modification of activated carbon.
Energies 14 03481 g002
Figure 3. Oxytetracycline adsorption kinetics.
Energies 14 03481 g003
Figure 4. Oxytetracycline adsorption isotherms on tested activated carbons; pH = 6.
Energies 14 03481 g004
Figure 5. Effect of activated carbon dose on adsorption efficiency.
Energies 14 03481 g005
Figure 6. Oxytetracycline (OTC) molecular structure with marked dissociating groups [69]: tricarbonyl group pKa1 = 3.3; phenolic diketone group pKa2 = 7.68; dimethylamine group pKa3− = 9.69.
Energies 14 03481 g006
Figure 7. Oxytetracycline adsorption isotherms on activated carbons from solutions of different pH: (a) ROW 08 Supra; (b) WG-12; (c) F-300.
Energies 14 03481 g007
Figure 8. FTIR spectra for activated carbons WG-12, F-300 and ROW 08 Supra.
Energies 14 03481 g008
Figure 9. Oxytetracycline adsorption isotherms for the starting activated carbon WG-12 and sorbents resulting from the modification.
Energies 14 03481 g009
Figure 10. The dependence of the adsorption capacity on: (a) the specific surface area; (b) micropores volume, (c) basic groups, (d) acid groups.
Energies 14 03481 g010
Table 1. Maximum concentrations of tetracyclines in surface water.
Maximum Concentrations of Tetracyclines in Surface Water
OTCCTCTC
LocationMaximum ConcentrationLocationMaximum ConcentrationLocationMaximum Concentration
USA streams320 ng/L [21]USA streams670 ng/L [21]USA streams130 ng/L [21]
China Yellow R. Delta83.5 ng/L [22]Australia/South-Easy Queensland600 ng/L [23]China Yellow R. Delta64.8 ng/L [22]
China Lake Thina600 ng/L [24]China Lake Thina211 ng/L [24]Australia/South-Easy Queensland80 ng/L [23]
Italy/R. Lambro14.4 ng/L [25] China Lake Thina154 ng/L [24]
Table 2. Physical and chemical properties of oxytetracycline (OTC) [46,47].
Molecular StructureMolecular
Formule
Molecular Weight, g/mollogKowpKaCross Area, nm2
Energies 14 03481 i001C22H24N2O9460.45−0.93.274.074
Table 3. Models of adsorption kinetics used in the paper [48,49].
ModelsNonlinear FormaParameter
Pseudo-first-order dq t dt = k 1 ( q e q t ) qe (mg/g)—is the amount of solute adsorbed et equilibrium and qt is the amount of solvent adsorbed at time t
k1 (1/h)—the rate constant for the PFO kinetic model
Pseudo-second-order dq t dt = k 2 ( q e q t ) 2 qe (mg/g)—the amount of solute adsorbed et equilibrium and qt is the amount of solvent adsorbed at time t
k2 (1/h) is the rate constant for the PSO kinetic model
Elovich dq t dt = α e β q t α, mg/(g∙h)—the initial adsorption rate
β, g/mg—is reflected the number of sites available for adsorption
Weber-Morri q t = k p t 0.5 + C Kp, mg/(g∙h0.5)—the slope which refer to intra-particle diffusion rate constant
C, mg/g—the intercept which is a constant related to the thickness of the boundary layer
Table 4. Characteristics of adsorption isotherms used in the paper [50,51,52,53].
IsothermAssumptions of the IsothermEquationParameter
Two-Parameter Isotherms
Freundlich
monolayer adsorption
q = K F C e 1 n n—adsorption intensity
heterogeneous surface
microporous adsorbents
KF, mg/g—Freundlich isotherm constant
type of adsorption: physicorption and chemisorption
empirical isotherm
Langmuir
monolayer adsorption
q = q m K L C e 1 + K L C e qm, mg/g—monolayer capacity
homogeneous surface (it allows for additional interactions resulting in a multi-layer effect)
type of adsorption: physisorption and chemisorption
KL, L/mg—the constant related to the free energy of adsorption
Temkin
monolayer adsorption
q = B   lnA T C e A, L/mg—Temkin isotherm equilibrium binding constant
heterogeneous surface, taking into account the interactions between adsorbed substances
type of adsorption: chemisorption
B—Temkin isotherm constant
Jovanovic
monolayer adsorption (it allows for additional interactions resulting in a multi-layer effect)
q = q · ( 1 e K j · C e ) q, mg/g—the maximum adsorption capacity, mg/g
heterogeneous and homogeneous surface
based on the assumptions of the Langmuir isotherm
Kj, L/mg—the constant related to the free energy of adsorption
type of adsorption: physisorption
Halsey
multilayer adsorption surface
q = ( K h · C e ) 1 / n h Kh, (mg·g−1/mg·L−1 ) 1 / n h —the Halsey constans
film theory
dispersive interactions
nh—the Halsey constans
Three-Parameter Isotherms
Redlicha-Peterson
monolayer adsorption
q = K R · C e 1 + a R · C e β KR, L/g—Redlich–Peterson isotherm constant
heterogeneous and homogeneous surface
compilation of Langmuir and Freundlich isotherms
aR, (L/mg)β—constant
type of adsorption: physisorption and chemisorption
empirical isotherm
β—constant
Toth
monolayer adsorption
q = q m · b · C e ( 1 + ( b · C e ) v ) 1 / v n—parameter characterizing the heterogeneity of the deposit
heterogeneous surface (it allows for additional side impacts and multilayers)
adsorption type: physical localized
b, mg/g—Toth isotherm constant
empirical modification of the Langmuir isotherm
qm, mg/g—maximum adsorption capacity
Where: Ce—equilibrium concentration of solute in bulk solution (mg/L).
Table 5. Physical and chemical properties of activated carbons.
ParameterActivated Carbon
F-100WAZ 0.6–2.4WACC 8 × 30F-300ROW 08 SupraWG-12Picabiol
Surface area, m2/g674 ± 24820 ± 34839 ± 27847 ± 29897 ± 301098 ± 381367 ± 26
Bulk density, g/dm3560421483542381424234
Iodine adsorption, LI, mg/g850100510261065109610501071
Methylene blue number, LM, cm328282928303030
Vmicr., cm3/g0.3320.3960.4080.4760.4360.5240.679
Vmeso., cm3/g0.1590.1770.2140.2940.4530.0660.626
Vtotal, cm3/g0.7000.8160.8890.9871.1350.992.103
Table 6. Kinetic equation constants: PFO, PSO, intraparticle diffusion model (Weber–Morris) and Elovich.
ParameterF-300ROWWG-12
Pseudo-First-Order (PFO)
qmax (mg/g)36.0527.5633.50
k1 (h−1)1.3320.9681.257
R20.90890.83220.8611
Pseudo-Second-Order (PSO)
qmax (mg/g)34.7328.7433.71
k2 (h−1)0.1060.0660.088
R20.97380.93760.9612
Elovich
α, mg/(g∙h)6344.23350.012852.79
Β, g/mg0.2560.2270.251
R20.99840.99980.9994
Intraparticle Diffusion Model (Weber–Morris)
Kp, mg/(g∙h0.5)3.824.433.95
C, mg/g26.1815.9523.32
R20.99620.99930.9981
Table 7. Constants of oxytetracycline adsorption isotherms on commercial activated carbons.
ParameterF-100F-300ROW 08 SupraWG-12PicabiolWAZ 0.6–2.4WACC 8 × 30
Freundlich
1/n, -0.330.390.390.390.380.310.37
KF, mg/g6.1710.626.608.467.945.385.75
R20.99560.99570.99700.99340.99670.99760.9966
Langmuir
qm, mg/g37.4573.3155.1365.9459.7929.8744.35
KL, L/mg0.0300.0430.0280.0330.0330.0310.026
R20.99820.99920.99930.99730.99930.99910.9989
Temkin
A, L/mg0.2880.3610.2280.2580.2720.3300.221
B, -8.3517.0913,0415.8714.036.3910.37
R20.99710.99840.99880.99650.99870.99850.9983
Redlich–Peterson
KR, L/g0.6762.3481.2171.4351.4890.6060.841
aR, (L/mg)β0.0010.0090.0070.0010.0070.0040.004
Β1.551.291.221.581.261.321.33
R20.99970.99980.99980.99930.99980.99960.9998
Jovanovic
Kj, L/mg0.0290.0440.0290.0350.0340.0280.027
qm, mg/g30.1857.6142.7251.0546.7724.3934.76
R20.99930.99980.99980.99870.99980.99960.9997
Halsey
Kh, (mg·g−1/mg·L−1 ) 1 / n h 1768176817681768176817681768
n, -3.652.943.293.093.173.913.52
R20.99490.99480.99460.99170.99510.99690.9946
Toth
qm, mg/g29.3961.2344.2849.0248.6124.5935.06
b, mg/g0.020.040.020.030.030.020.02
v, -3.331.701.913.211.902.382.27
R20.99990.99970.99970.99970.99990.99980.9998
Table 8. Constants of oxytetracycline absorption isotherms on activated carbons F-300, WG-12, ROW 08 Supra from solutions with pH 3; 6 and 10.
ParameterF-300WG-12ROW 08 Supra
pH = 10pH = 6pH = 3pH = 10pH = 6pH = 3pH = 10pH = 6pH = 3
Freundlich
1/n, -0.360.390.380.320.390.380.380.400.42
KF, mg/g9.8610.629.968.108.467.325.146.605.02
R20.99310.99570.99030.99430.99340.99480.99670.99700.9948
Langmuir
qm, mg/g63.5973.3169.0446.2965.9456.4442.7255.1350.66
KL, L/mg0.0390.0430.0380.0360.0330.0300.0240.0280.022
R20.99740.98940.99590.99730.99730.89590.99870.99930.9975
Jovanovic
Kj, L/mg0.0400.0440.0390.0340.0350.0310.0250.0290.024
qm, mg/g50.4657.6154.1137.5151.0544.0133.2342.7238.36
R20.99900.99980.99810.99840.99870.99860.99920.99970.9983
Redlich–Peterson
KR, L/g1.6162.3091.6161.0641.4111.1760.7261.1300.736
aR, (L/mg)β0.0020.0080.0020.0030.0010.0020.0020.0040.001
Β, -1.521.311.531.421.631.431.381.321.63
R20.99950.99980.99530.99870.99930.99880.99930.99980.9988
Thot
qm, mg/g48.9761.2251.5037.4049.0243.8833.8844.2837.08
b, mg/g0.030.040.030.030.030.020.020.020.02
v, -3.191.703.992.553.212.392.111.912.82
R20.99990.99970.99970.99860.99960.99890.99930.99970.9989
Table 9. The amount of acidic and basic groups on activated carbons WG-12, F-300 and ROW 08 Supra.
Activated CarbonWG-12ROW 08 SupraF-300
Acidic groups, mmol/g0.5860.4340.544
Basic groups/sites, mmol/g0.4670.5920.512
Table 10. Characteristics of modified activated carbons.
ParameterWG0WG-CDWG-SWG-AIRWGE-AIRWGE-CD
Porous Structure
SBET, m2/g109811811163120811841142
Vmicro, cm3/g0.5300.5510.5410.5380.5390.538
Vmeso, cm3/g0.0480.0400.0450.0440.0430.049
Vmacro, cm3/g0.4170.3430.4130.4120.4200.417
Surface Functional Groups, mmol/g
Basic groups/sites0.4670.5350.5210.5250.5220.518
Acid groups/sites0.5860.6290.6040.8690.5990.591
Table 11. Oxytetracycline adsorption isotherms on modified activated carbons.
ParameterWG-12WG-SWG-CDWG-AIRWGE-CDWGE-AIR
Freundlich
1/n, -0.390.390.430.400.430.43
KF, mg/g8.4610.6210.1113.6210.7311.51
R20.99340.98790.99060.99270.99110.9934
Langmuir
qm, mg/g65.9474.6684.7489.5088.6989.65
KL, L/mg0.0330.0400.0380.0570.0410.046
R20.99730.993340.99570.99730.99590.9974
Jovanovic
Kj, L/mg0.0350.0420.0420.0600.0460.050
qm, mg/g51.0558.1464.2369.6967.1068.34
R20.99870.99550.99750.99840.99730.9984
Redlich–Peterson
KR, L/g1.5031.902.1363.7112.5083.014
aR, (L/mg)β0.0020.0010.0010.0090.0020.006
Β, -1.481.701.681.361.591.40
R20.99920.99700.99850.99850.99800.9985
Thot
qm, mg/g49.0254.3360.6570.1063.1967.79
b, mg/g0.030.030.030.050.040.04
v, -3.214.973.372.223.412.35
R20.99970.99810.99890.99870.99880.9988
Table 12. Pearson correlation coefficients.
ParameterSurface AreaVmicroBasic Groups/SitesAcid Groups/Sites
qm—Langmuir0.770.450.790.40
qm—Jovanovic0.810.410.790.49
qm—Toth0.830.310.700.60
Table 13. Comparison of tetracycline adsorption results based on literature reports.
qm mg/gAdsorption Isotherms Equations Tested 1/The Equations of Adsorption Kinetics Studied 1Mechanism of AdsorptionAdsorption ConditionsReference
TC 227L > F > T
PSO > PFO
filling pores,
influence π-π EDA,
hydrogen bond,
electrostatic interaction
coal based on corn straw[42]
C = 10–50 mg /L, pH =4.0, T = 303 K
SBET = 463.89 m3/g
TC 344L > T > F
PSO > PFO
coal based on corn straw
C = 10–50 mg /L, pH =4.0, T = 323 K
SBET = 463.89 m3/g
TC 302F > T > D-R > L
E > IP > PSO > PFO
hydrogen bond,
π–π electron–donor–acceptor (EDA),
electrostatic and hydrophobic interactions
BCA alfalfa biochar[63]
C = 10–100 mg/L, pH = 5.0,
SBET = 302.37 m3/g
CTC 482.466 377.537R-P > F > L = D-R
− physical adsorption
π–π electron–donor–acceptor (EDA),
NH4Cl-modified activated carbon[72]
R-P > F = L > D-RC = 20–200 mg/L, pH = 6, T = 283–323
PSO > PFO > E > M-WNAC; SBET = 1029 m3/g
PSO > E > PFO > W-MSAC; SBET = 1024 m3/g
OTC 869.57–1340.82PSO > IPD > PFO
L > T > F
ion exchange
electrostatic interactions
van der Waals forces
activated carbon from cotton fibers modified NaOH[44]
C = 308.2–530.3 mg/L, pH = 5–6,
T= 292–323 K
SBET = 2143 m3/g
OTC 534–649L > F = D-R
-physical adsorption
Modified Arundo donax[45]
C = 90–660 mg/L, pH = 5; T = 298–318 K
SBET = 1443.4 m3/g
* PFO—pseudo-first-order, PSO—pseudo-second-order, IPD—intra-particle diffusion, E—Elovich, D-R—Dubinin–Radushkevich, T—temperature tested, Co—initial concentration. 1—the order of equations based on the correlation coefficient R2.
Publisher’s Note: MDPI stays neutral with regard to jurisdictional claims in published maps and institutional affiliations.