Article

Electrochemical Hydrogen Production Powered by PV/CSP Hybrid Power Plants: A Modelling Approach for Cost Optimal System Design

1
Deutsches Zentrum für Luft- und Raumfahrt, Institute of Future Fuels, Linder Höhe, 51147 Köln, Germany
2
Institute of Power Engineering, Faculty of Mechanical Science and Engineering, TU Dresden, 01062 Dresden, Germany
3
Deutsches Zentrum für Luft- und Raumfahrt, Institute of Solar Research, Linder Höhe, 51147 Köln, Germany
*
Author to whom correspondence should be addressed.
Energies 2021, 14(12), 3437; https://doi.org/10.3390/en14123437
Submission received: 26 April 2021 / Revised: 27 May 2021 / Accepted: 28 May 2021 / Published: 10 June 2021

Abstract

:
Global trade of green hydrogen will probably become a vital factor in reaching climate neutrality. The sunbelt of the Earth has a great potential for large-scale hydrogen production. One promising pathway to solar hydrogen is to use economically priced electricity from photovoltaics (PV) for electrochemical water splitting. However, storing electricity with batteries is still expensive and without storage only a small operating capacity of electrolyser systems can be reached. Combining PV with concentrated solar power (CSP) and thermal energy storage (TES) seems a good pathway to reach more electrolyser full load hours and thereby lower levelized costs of hydrogen (LCOH). This work introduces an energy system model for finding cost-optimal designs of such PV/CSP hybrid hydrogen production plants based on a global optimization algorithm. The model includes an operational strategy which improves the interplay between PV and CSP part, allowing also to store PV surplus electricity as heat. An exemplary study for stand-alone hydrogen production with an alkaline electrolyser (AEL) system is carried out. Three different locations with different solar resources are considered, regarding the total installed costs (TIC) to obtain realistic LCOH values. The study shows that a combination of PV and CSP is an auspicious concept for large-scale solar hydrogen production, leading to lower costs than using one of the technologies on its own. For today’s PV and CSP costs, minimum levelized costs of hydrogen of 4.04 USD/kg were determined for a plant located in Ouarzazate (Morocco). Considering the foreseen decrease in PV and CSP costs until 2030, cuts the LCOH to 3.09 USD/kg while still a combination of PV and CSP is the most economic system.

1. Introduction

The vision of a hydrogen economy becomes ever more real. Hydrogen technologies shall play a decisive role in reaching climate neutrality and enable the breakthrough of renewable energies in all sectors [1,2]. Global trade of green hydrogen, produced by renewable energy sources, is widely considered to be an important factor in a future hydrogen economy [3]. For Europe, a study estimates that trading renewable energy carriers would reduce the energy costs by more than 20% compared to a self-supply scenario [4]. Some not densely populated areas have an especially high renewable energy potential and promise therefore low hydrogen production costs. Direct usage of renewable electricity is not an option in those regions, because population centers are far away and grid connection is not economic. Producing green hydrogen in these remote areas could therefore open up new potentials of renewable energies. Especially in the sunbelt of the earth a promising combination of available land and high solar irradiation can be found [5]. The countries in the region could therefore become important players in the global green hydrogen market.
A suitable and mature technology for large-scale hydrogen production is low-temperature electrochemical water splitting [6]. 100 MW electrolyser plants are in the project development phase and also upscaling into the GW scale is already planned [7]. For regions with a high solar potential, photovoltaics appears a promising technology to power electrochemical water splitting. This pathway for solar hydrogen production was already investigated in 1993 in the German-Saudi Arabian cooperation project HYSOLAR [8]. With the massive drop in PV investment costs this concept is more promising than ever.
However, until now industrial electrolysers were exclusively operated with continuous electricity sources, especially hydrodynamic power [9]. To switch the power supply to fluctuating renewable energy sources like PV is a challenge. One aspect is that investment costs of electrolyser systems account for an important share of the final hydrogen production costs. Since availability of fluctuating renewable energy sources is limited, the share of electrolyser investment in the levelized cost of hydrogen (LCOH) increases because of the unused hydrogen production capacity. Low electricity costs can only partly compensate this effect. Furthermore, the most economic electrolyser technology available now, the alkaline electrolyser, is not made for dynamic operation. A cold start-up of the current technology takes about 1 h [10] so that fluctuating electricity cannot be used completely. Another difficulty is that start-ups and stops increase in general significantly electrolyser degradation [11].
To overcome this challenge, the integration of a suitable storage technology appears a good approach for large-scale solar hydrogen production powered by PV. Battery storage is still too expensive for this purpose. Thermal energy storage (TES) in contrast is a proven technology in concentrated solar power (CSP) plants [12]. The thermal heat produced by CSP plants can be stored efficiently and economically, for example by using molten salt as heat transfer and storage medium [13]. The power block, consisting of a steam cycle, can then adapt the electricity production to the demand. The advantageous combination of PV and CSP, called PV/CSP hybrid power plants, is already used in electricity generation projects, for example in the Noor plant in Morocco [14]. A recent study analysed the levelized cost of electricity (LCOE) of a PV/CSP hybrid power plant located in Chile [15]. The authors determined a LCOE of 53 USD/MWhel and found that the concept outperforms electricity generation with gas power plants (LCOE of 86 USD/MWhel). First economic estimations showed that electrochemical hydrogen production powered by a combination of PV and CSP could also be more economical than solely using one of the technologies [16]. A techno-economic analysis (TEA) of solar hydrogen production in Chile, compared PV to CSP powered electrochemical water splitting [17]. Although the study identified lowest hydrogen production costs for a PV powered alkaline electrolyser system, the authors also found that the most economic system would be a combination of PV and CSP power generation, if subsequent process steps are considered in the TEA, like hydrogen liquefaction or ammonia production. Summing up, previous research identified that combinations of PV and CSP power generation are often economically advantageous, also for electrochemical hydrogen production. However, previous work has focused on the techno-economic evaluation of PV/CSP systems based on existing plant design. The studies did not include a detailed energy system analysis of PV/CSP and electrolyser plant combinations. Therefore, it was not possible to consider different operational strategies and to size the different process units in order to minimize the overall product costs. Furthermore, it was not possible to investigate process variants in which PV surplus electricity can be stored as heat, by considering an additional electrical heater. Thus, there is still a need for further investigation of cost-optimal design of PV/CSP hydrogen production plants.
In this work we want to address this knowledge gap. Therefore, we present a dynamic energy system model, which can be used for cost-optimized system design of PV/CSP hydrogen production plants. We suggest an operational strategy for an optimal interplay between PV and CSP part. The model also includes an electrical heater which enables to heat the storage medium molten salt with surplus PV-electricity. With the developed tool it is possible to size the process units of the PV/CSP powered electrolyser plant, by minimizing the LCOH. In total, six optimization variables are considered: the nominal CSP receiver power, the PV peak power, the alkaline electrolyser (AEL) system nominal power, the turbine nominal power, the nominal power of the electric heater and the capacity of the thermal energy storage. The model is designed in a way that each technology can be investigated solely or in different combinations. For example, it is also possible to investigate a system without CSP components but with PV and a thermal energy storage. Consequently, the optimization tool offers a great variability for developing general cost-optimal designs of solar hydrogen production plants. This was used for an exemplary study for three locations and two cost scenarios: a standard scenario based on actual PV and CSP costs and a cost outlook scenario, considering the expected decrease in investment costs in the next ten years for both technologies. The techno-economic study and the determined LCOH is based on total installed costs (TIC) of all equipment. Thereby more realistic LCOH can be determined than by using only capital expenditure (CAPEX) data for investment costs estimation.

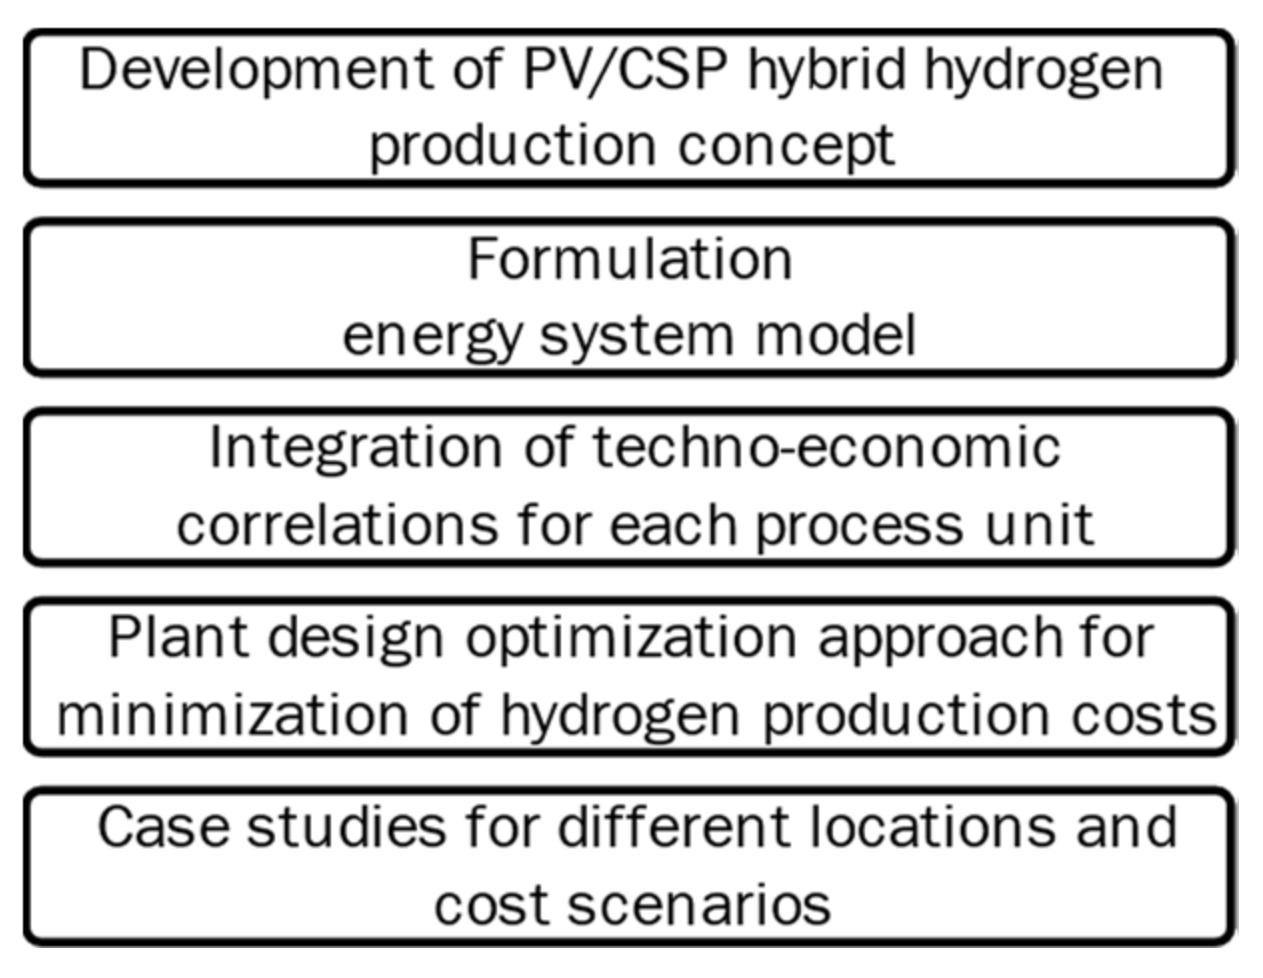
2. PV/CSP Hybrid Hydrogen Plant Design Optimization Model

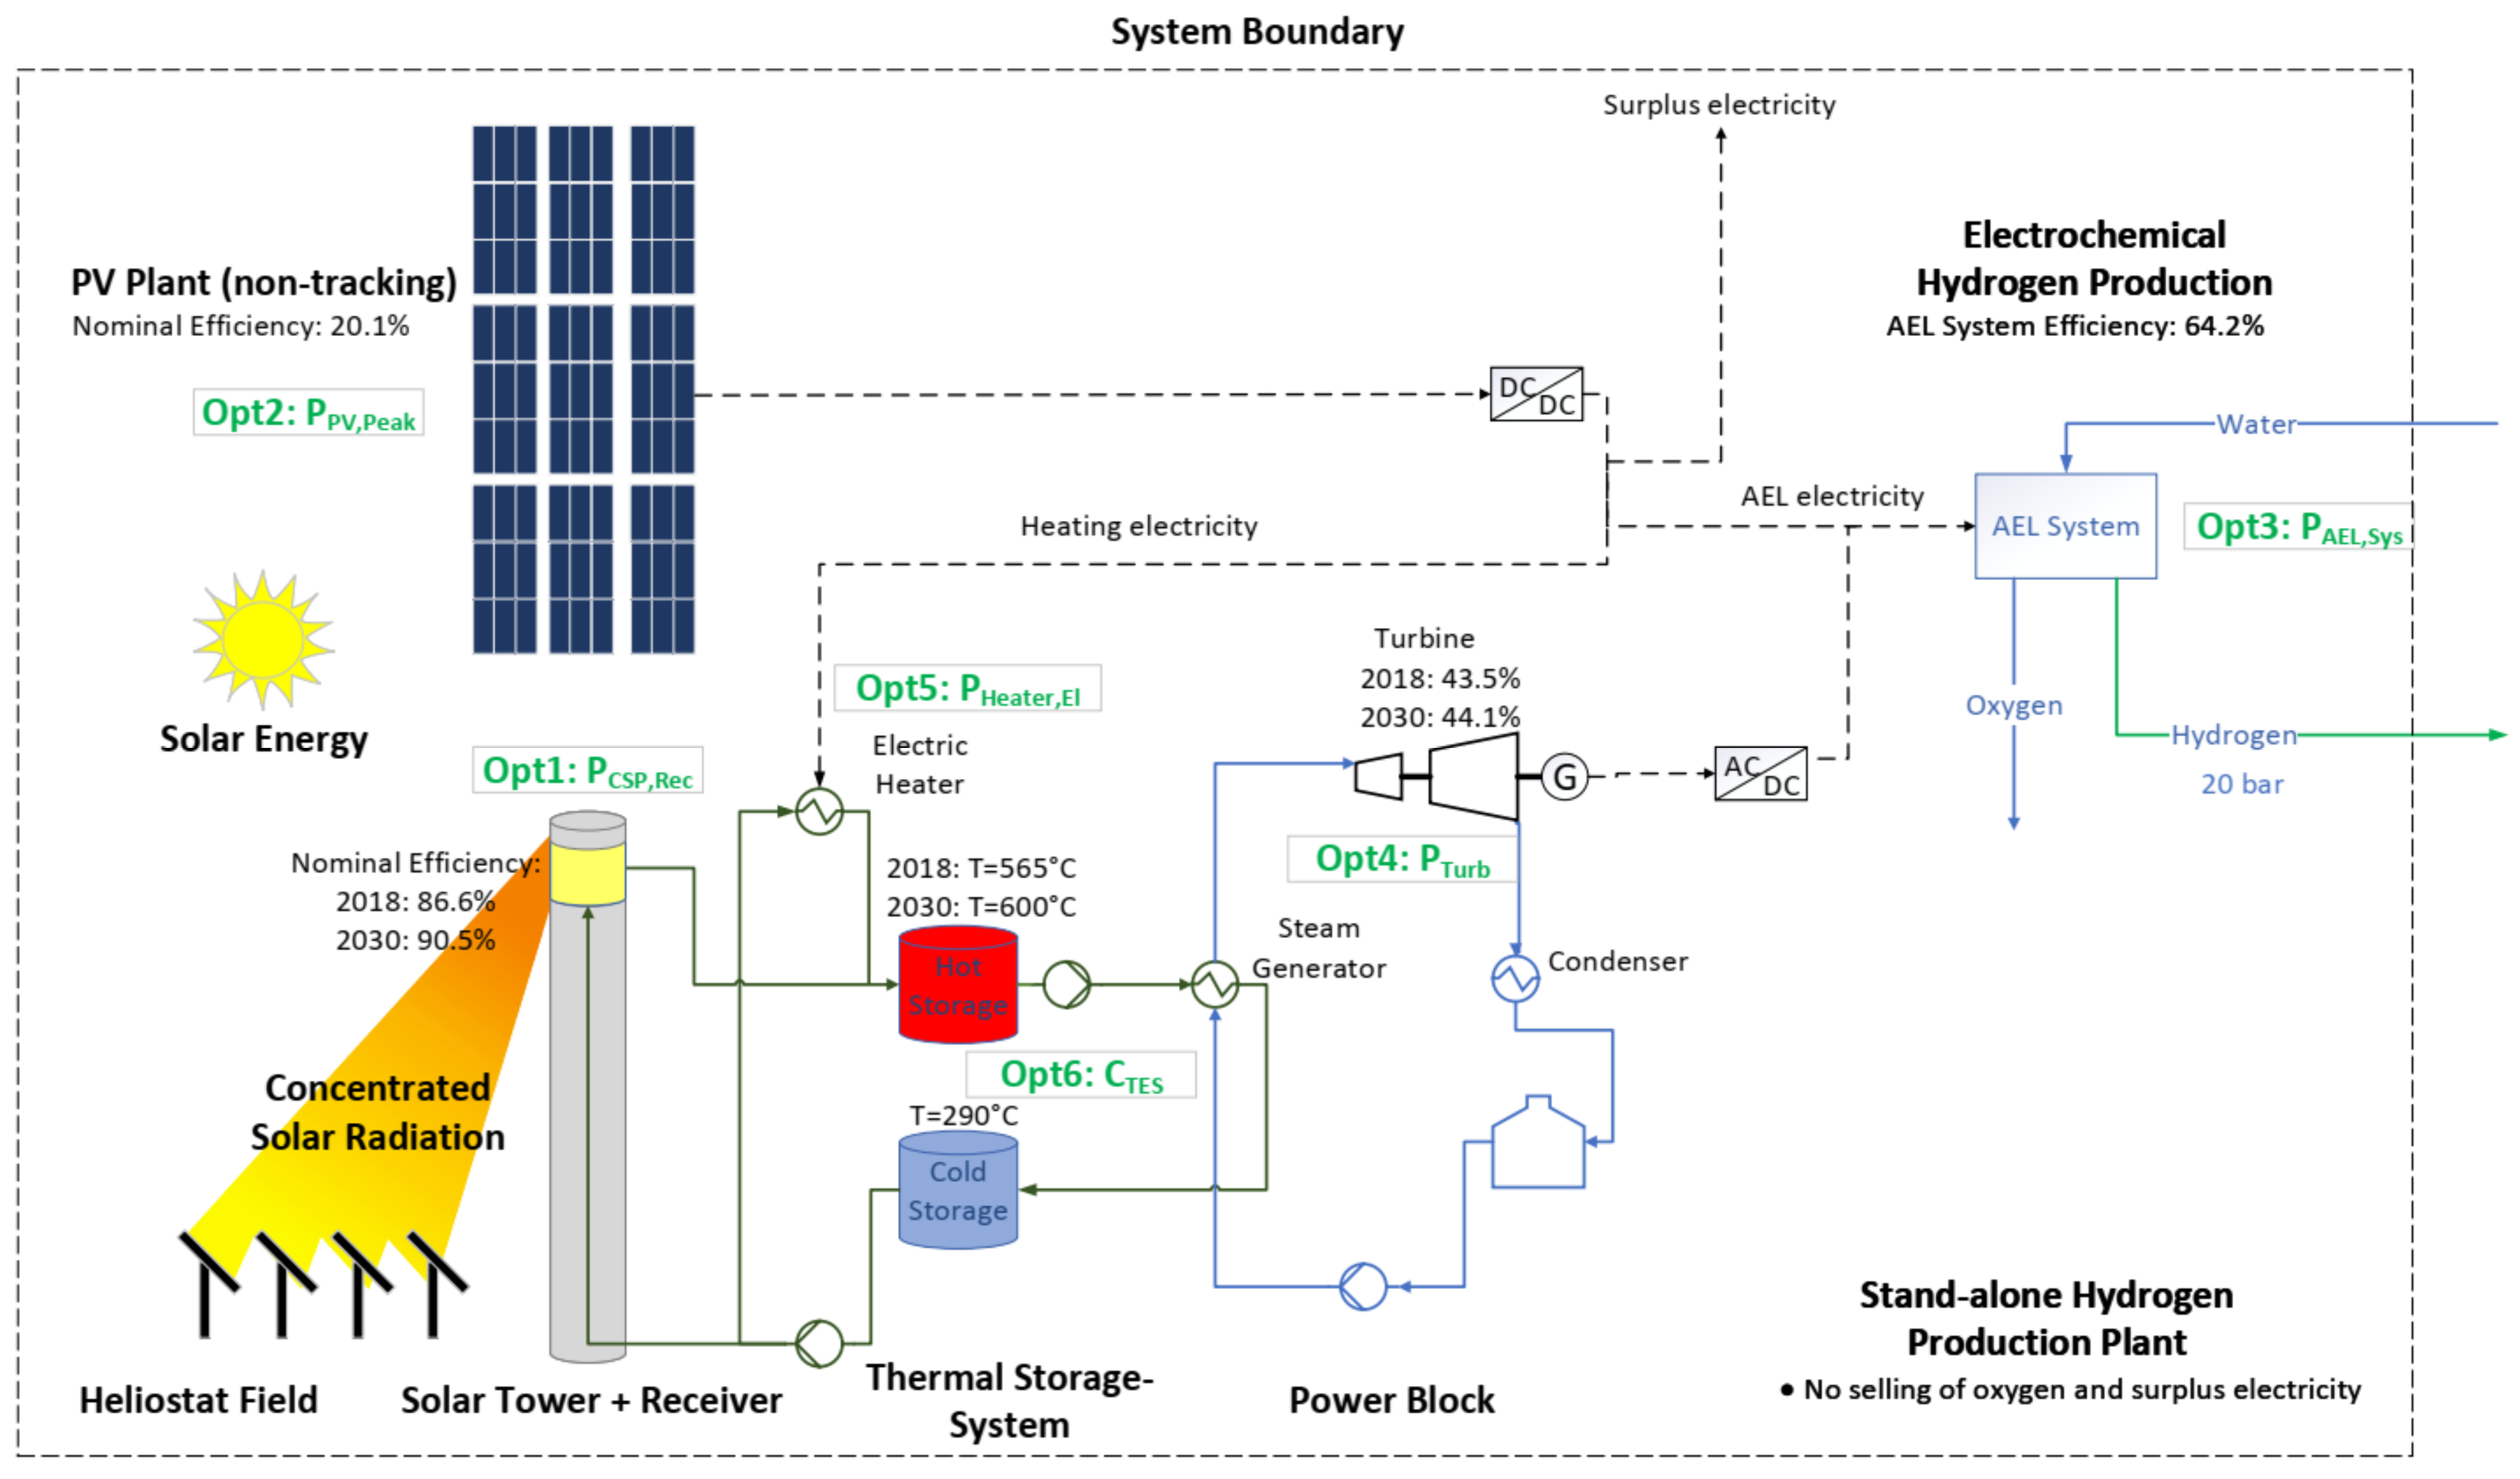
2.1. Concept Solar Hydrogen Production Plant

The focus of this work is the development of a techno-economic system model which permits to design PV/CSP powered hydrogen production plants by minimizing the hydrogen production costs. Figure 1 presents the main stages of presented work.
Figure 2 illustrates the developed concept of a PV/CSP hybrid power plant for electrochemical hydrogen production. A solar tower system was chosen because of the higher system efficiency compared to line-focus CSP systems [12]. The PV plant produces electricity depending on the instantaneous solar irradiance. In the CSP plant a working fluid (molten salt) is heated up in a receiver at the top of a solar tower and stored in a hot storage. From there, as needed, hot molten salt can be extracted to transfer heat to a steam cycle which runs a steam turbine connected to a generator [13]. Thereby, the CSP electricity production can be adapted to the demand. In this case, the aim is to combine PV and CSP electricity production in the best way for cost-optimal operation of the alkaline electrolyser system, where water is electrochemically split into hydrogen and oxygen. An alkaline electrolyser is chosen for this study, because AEL have currently the lowest costs and the highest system efficiency of all electrolyser systems which are available in large-scale [10].
In this work different combinations of the presented technologies are investigated. For comparison, systems with only PV or CSP electricity production are simulated. PV electricity can also be used for additional electric heating of the molten salt. The optimization model also permits to analyze systems without heliostat field and solar tower, where the heat for the molten salt system is solely provided by PV electricity. For the techno-economic study the hydrogen production plants are regarded as stand-alone systems, constructed in remote areas and only for hydrogen production. Selling of surplus electricity is excluded and selling of oxygen as a by-product is also not considered. The three different locations in this study were chosen to demonstrate the influence of different solar resources (see Table 1). The local price index was considered for the installation of CSP equipment (see Section 3.4). For the location Freiburg only PV is considered, because CSP power plants are usually only an option for a DNI in the range of 2000 kWh/m2a and above [12]. The study includes two cost scenarios: a standard scenario with the PV and CSP costs of today and a cost outlook scenario which considers the possible cost reductions until 2030. For CSP the cost outlook scenario considers an increased receiver efficiency and a higher working fluid temperature which leads to a higher power cycle efficiency (assumption from [18], see Figure 2).

2.2. Optimization Approach

Figure 2 shows the overall concept of a PV/CSP hybrid hydrogen production plant. The figure also contains the six plant design optimization variables. Each optimization variable is a characteristic design variable for one of the process units. The nominal receiver power P C S P , R e c is the design variable of the CSP part. This parameter represents the concentrated solar power reaching the receiver at a DNI of 900 W/m2. Further design variables are: the PV peak power, the AEL system nominal power, the steam turbine nominal power, the nominal power of the electric heater and the capacity of the thermal energy storage (see also Table 2). The overall plant design optimization approach is to minimize the levelized costs of hydrogen (LCOH) depending on these six optimization variables:
MIN ( L C O H ) = f ( P C S P , R e c , P P V , P e a k , P A E L , P T u r b , C T E S , P H e a t e r , e l )
To minimize the objective function the Pattern Search algorithm from MathWorks® Global Optimization Toolbox (Natick, MA, USA) was used, which is recommended to be used first for non-smooth optimization problems [20]. Starting values have to be provided and optimization studies should be repeated with different initial values. Through varying the optimizations variables constraints, different studies were performed, for example by setting different upper boundaries for the thermal storage, the effect of higher electrolyser full load hours could be investigated. Table 2 provides global boundaries for the constraint variables, meaning that in some studies a different boundary was set but the given boundary was never exceeded. For electrical power, the maximum was set to 1 GW.

2.3. Approach Modelling

2.3.1. AEL Electrolyser System and Hydrogen Production

To decrease the time for each optimization, a time step Δ t of one hour was chosen for the annual simulations. Dynamic behaviour of the electrolyser system was neglected and a constant electrolyser system efficiency η A E L , S y s (64.2%) was assumed. The hydrogen production rate was calculated according to Equation (2) from the instantaneous electric power input P A E L , i n t , the electrolyser system efficiency η A E L , S y s and the lower heating value of hydrogen L H V H 2 (33.326 kWh/kgH2):
m ˙ H 2 ( t ) = η A E L , S y s P A E L , i n ( t ) L H V H 2
The possible electric power input was limited to a range of 20–100%. Overload operation was excluded because of possible higher degradation. If the electricity available is below the minimum load, the electrolyser system is operated in standby mode. This means that the electric current is zero but the electrolyser is kept under voltage. Thereby no time-consuming cold-starts of the electrolyser are necessary which also lead to a much higher degradation rate. For a PEM electrolyser system, in [6] a standby mode consumption of approximately 1% of the nominal electrolyser power was determined. The same value is assumed for the alkaline electrolyser system of this study. The model is designed in a way that electricity for standby operation can always be provided. More information on that can be found in the Section 2.4. The technical assumptions (summarized in Table 3) are based on a recent survey of electrolyser manufactures [10].

2.3.2. PV System Electricity Output

The Green Energy System Analysis Tool greenius from the DLR Institute of Solar Research [21,22] was used to determine the PV electricity generation efficiency η P V t , l o c a t i o n in each time step and for each location. Greenius calculates η P V t from Global Horizontal Irradiance (GHI) data, using the SOLPOS Sun Position Calculation from NREL and the Perez Diffuse Irradiance Model. For this study a monocrystalline silicon PV module (BenQ PM 318B01-327) was selected with a nominal efficiency of 20.1% at a nominal irradiance of 1000 W/m2. The calculation was performed for a non-tracking system, since this study focuses on the lower range of PV investment costs (see Section 3.4) and already a high module efficiency was assumed. The module efficiency η P V t for the three locations is imported to the PV/CSP plant model. From the optimization variable PV peak power P P V , P e a k the total PV module area A P V can be determined:
A P V ( i n   m 2 ) = P P V , P e a k 1000 W m 2
For each time-step in the PV/CSP plant model the PV electricity production P P V t   is calculated from the irradiance data of the location G H I t , the PV electricity generation efficiency η P V t and the total PV module area A P V :
P P V ( t ) = η P V ( t ) G H I ( t ) A P V

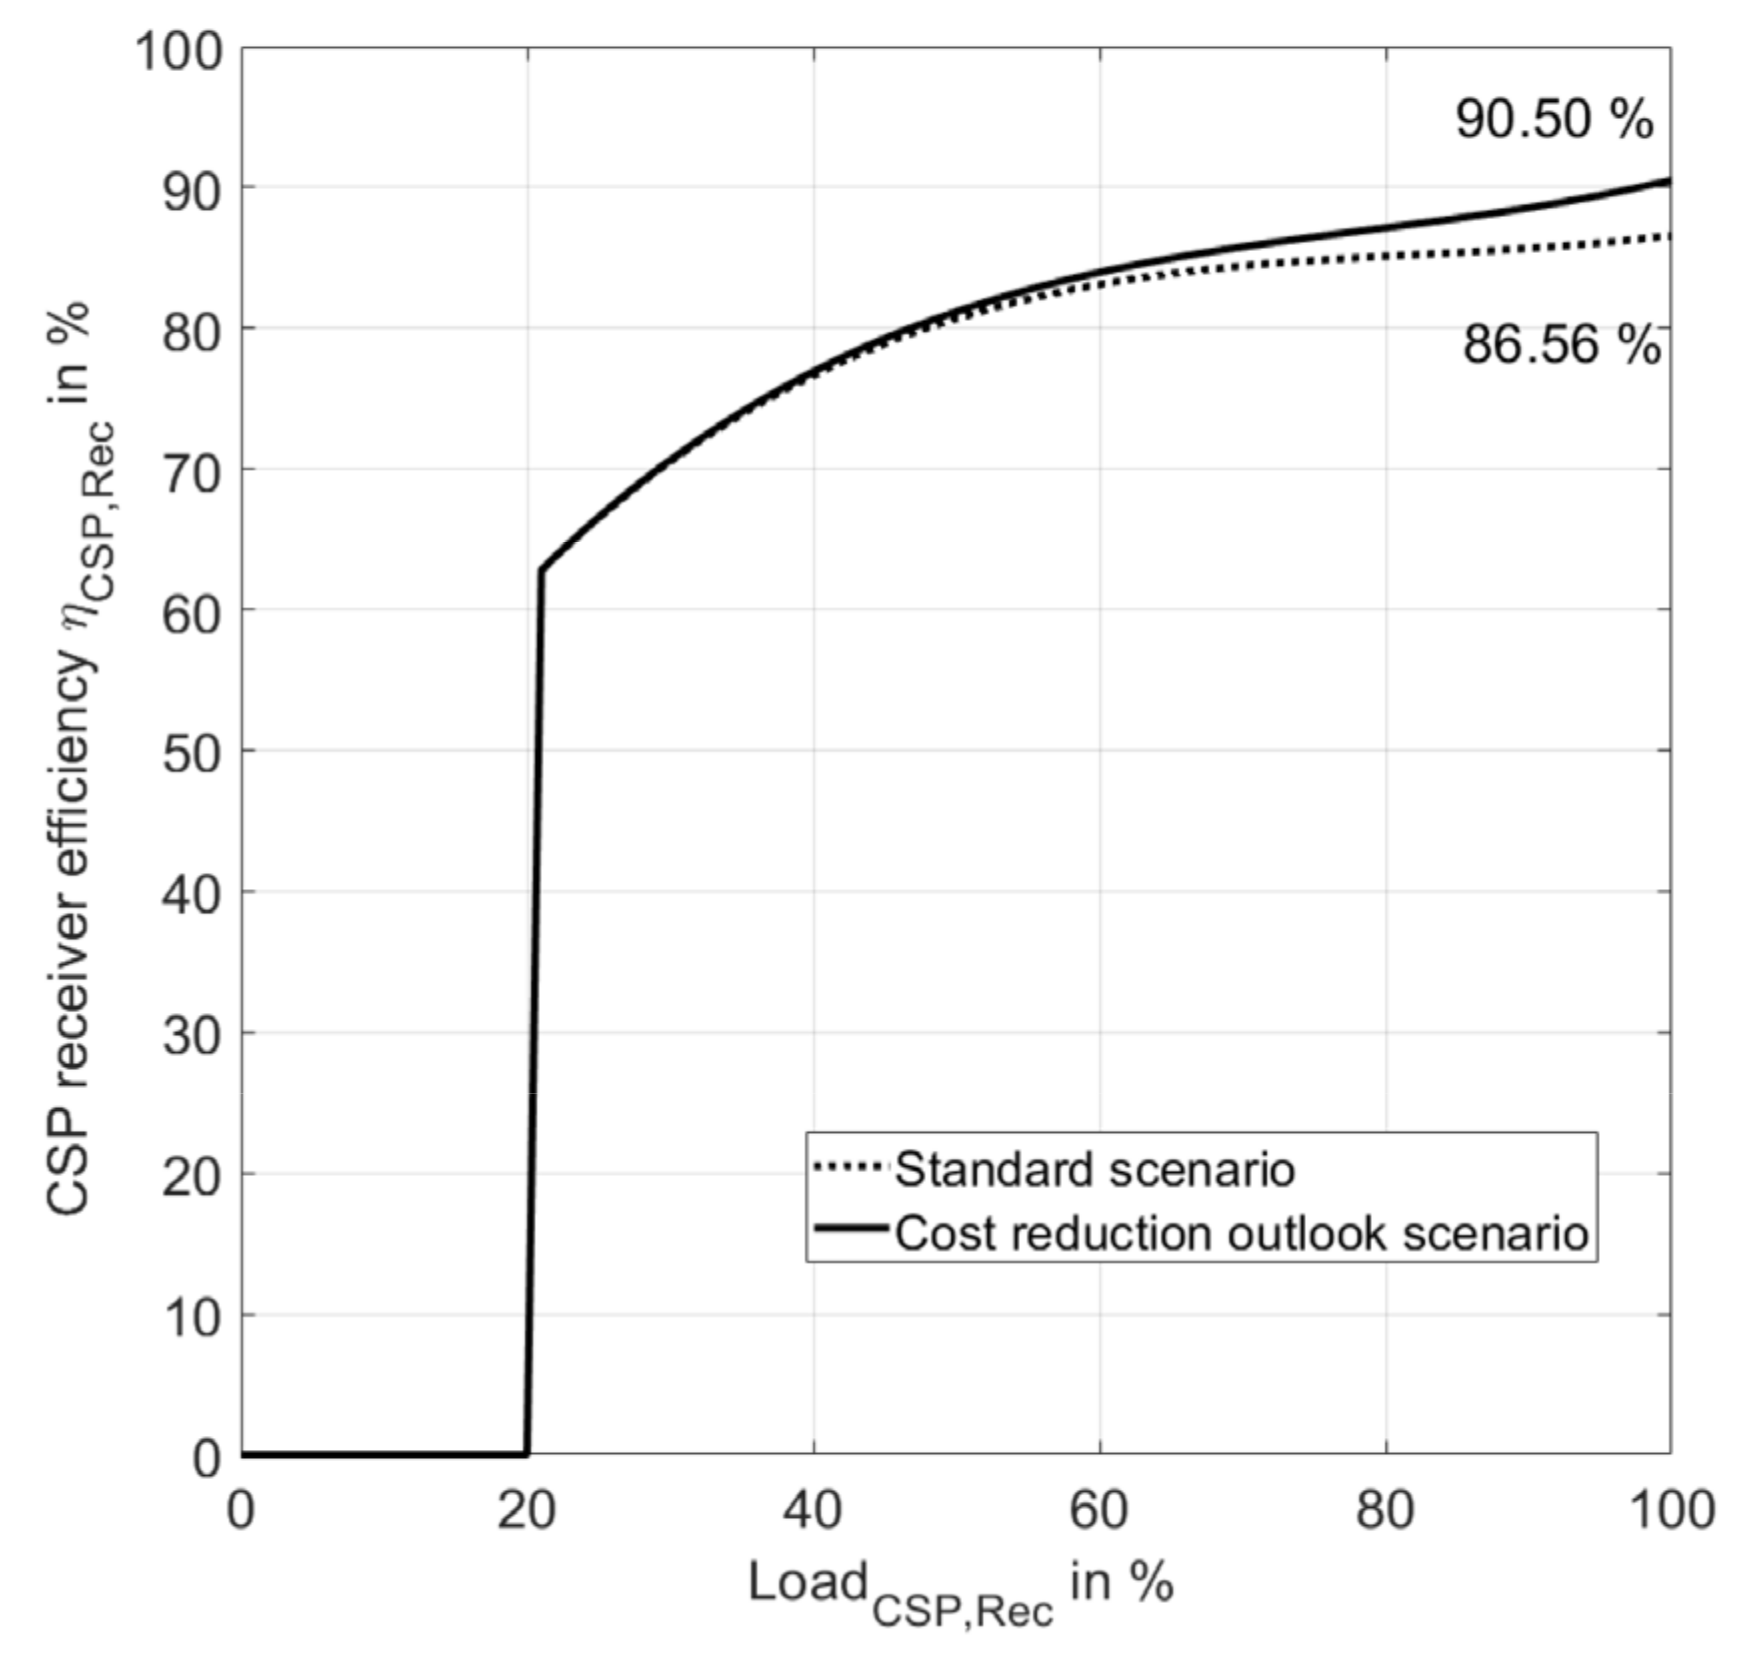
2.3.3. CSP System Thermal Power Output

  • CSP system receiver concentrated power input:
Similar to the PV system, the DLR tool greenius is used to determine the concentrated power input to the molten salt receiver in each time step. In this case annual Direct Normal Irradiance data D N I t is used and an efficiency of the heliostat field is determined for each timestep and location η H e l i o s t a t t , l o c a t i o n   based on efficiency maps. For simplification a field size independent heliostat field efficiency is assumed. The concentrated solar power input to the receiver P C S P , R e c , i n   t can then be calculated with the total heliostat area A H e l i o s t a t as follows:
P C S P , R e c , i n   ( t ) = D N I ( t ) A H e l i o s t a t η H e l i o s t a t ( t )
In the optimization model the maximum nominal receiver input power PCSP,Rec is limited by an optimization constraint (see Table 2). Thereby, the heliostat field stays in a size, in which the assumption of a field size independent heliostat field efficiency is reasonable.
  • Molten salt receiver thermal power output:
The load of the molten salt receiver in each time step l o a d C S P , R e c   t is determined as ratio between concentrated power input and the nominal receiver power P C S P , R e c , n o m :
l o a d C S P , R e c   ( t ) = P C S P , R e c , i n   ( t ) P C S P , R e c , n o m  
The efficiency of the receiver depends on the actual load. A similar load curve to the one provided in greenius was implemented in the plant model (see Figure 3). For each cost scenario a different efficiency load curve was implemented. In the standard scenario the maximum receiver efficiency at nominal power is 86.56% and in the cost reduction outlook scenario 90.50%.
With the receiver input power P C S P , R e c   t and the receiver efficiency η C S P , R e c t the produced thermal CSP power in each time step can be calculated:
Q ˙ C S P   ( t ) = P C S P , R e c , i n ( t ) η C S P , R e c ( t )
The maximum possible CSP power is defined by the nominal receiver power P C S P , R e c ,   n o m   and the maximum receiver efficiency η C S P , R e c , m a x :
Q ˙ C S P   ( t ) P R e c , C S P η C S P , R e c , m a x
In practice this would mean that an appropriate number of heliostats is defocused if the incoming concentrated solar power exceeds the nominal power of the molten salt receiver.

2.3.4. CSP Part and Steam Cycle Auxiliary Electric Consumption

The operation of the CSP plant requires electricity, e.g., for molten salt pumping. Also, when no solar energy is available the molten salt receiver has a permanent electricity consumption (here defined as standby mode). For simplification a linear relation between standby mode consumption and nominal receiver power and operating auxiliary consumption and current receiver power input was assumed. The coefficients were derived from greenius 799 MW molten salt receiver example (see Table 4). In the PV/CSP hybrid plant the operational strategy permits to cover the CSP auxiliary consumption with PV electricity (see Section 2.4). A similar approach was chosen for auxiliary consumption in the steam cycle. Here the electricity demand, for example for feed water pumping, is assumed to be linear to the current turbine power output P T u r b t .

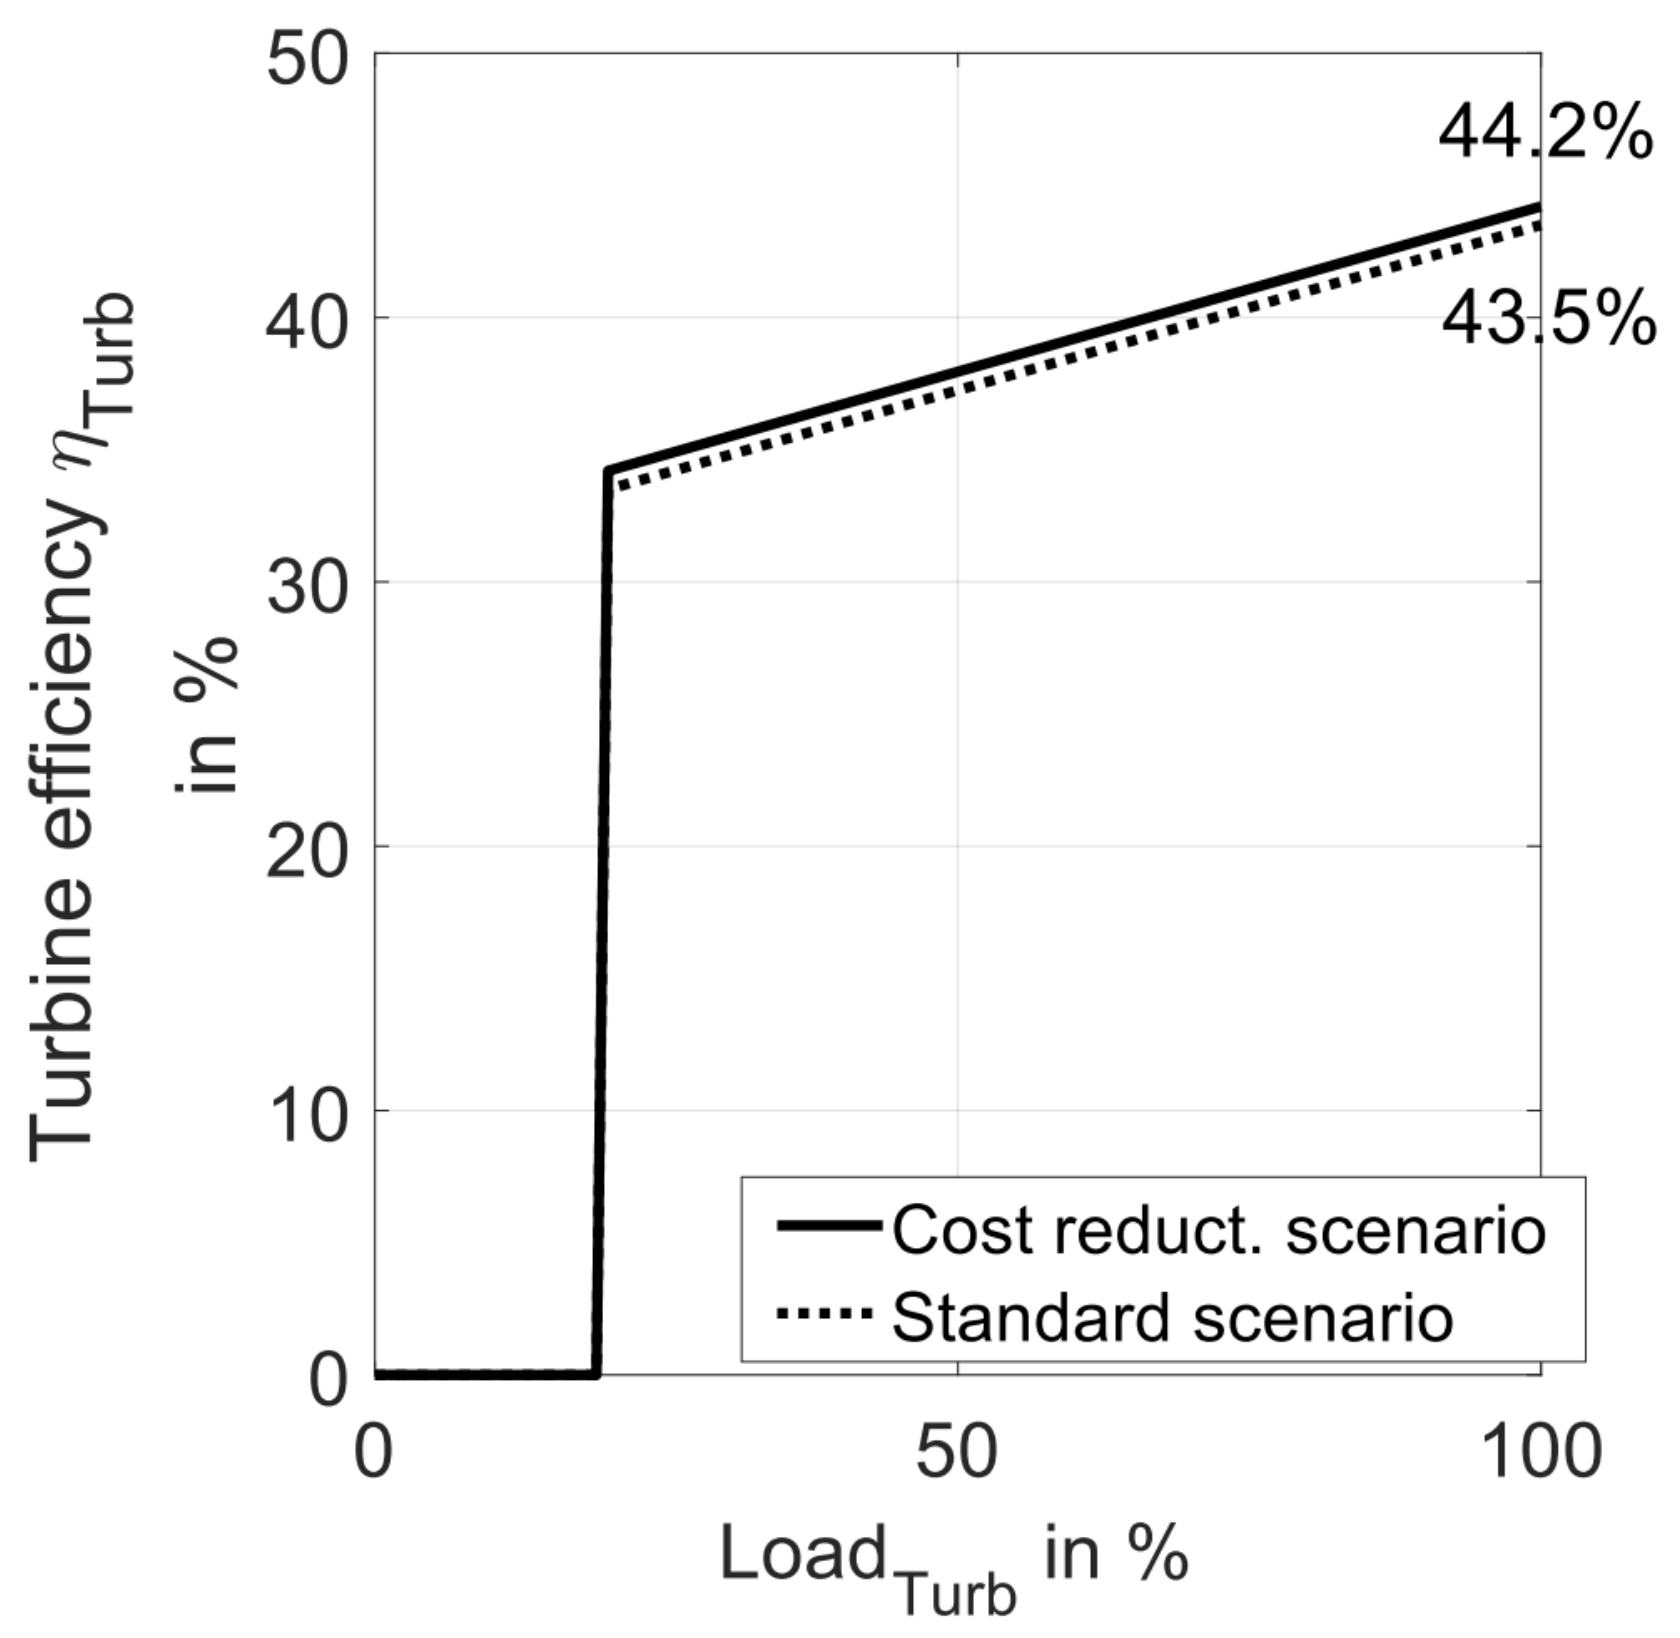
2.3.5. Power Cycle Electricity Production

The model includes a load dependent turbine efficiency. The load is defined by the ratio of current turbine power P T u r b   t and turbine nominal power P T u r b , n o m :
l o a d T u r b = P T u r b   ( t ) P T u r b , n o m  
The minimum load is 20% of the nominal turbine power. Similar to greenius above the minimum load a linear increase of the efficiency to the maximum value was implemented [22]. Figure 4 illustrates the used correlation for the standard and the cost outlook scenario, in which the maximum efficiency increases from 43.5 to 44.2% (compare Section 2.1).
With the turbine efficiency η T u r b t the extracted heat from the thermal storage to run the steam cycle Q ˙ T u r b   t can be determined:
Q ˙ T u r b   ( t ) = P T u r b ( t ) η T u r b ( t )
P T u r b   t is defined by the operational strategy, and will only be calculated if enough thermal energy is stored. Including auxiliary consumption P T u r b , a u x (see Table 4) the net electricity production in the steam cycle is:
P T u r b , n e t ( t )   = P T u r b ( t ) P T u r b , a u x ( t )

2.3.6. Energy Balance Thermal Heat Storage

The operational strategy considers if thermal energy can be extracted from the thermal storage (see Section 2.4). In greenius a minimum storage level of 10% is suggested which was also adapted in this model. The thermal energy stored in the molten salt storage is calculated for the next time step by balancing the incoming and outgoing thermal energy streams:
Q T E S ( t + 1 ) = Q T E S ( t ) + ( Q ˙ C S P   ( t ) + Q ˙ H e a t e r , e l   ( t ) Q ˙ T u r b   ( t ) Q ˙ L o s s ( t ) ) Δ t
The added streams are the thermal energy provided by concentrated solar power Q ˙ C S P   t and the input from the electric heater Q ˙ H e a t e r , e l   t . Outgoing thermal energy streams are the extracted energy to run the turbine Q ˙ T u r b   t   and the thermal energy loss Q ˙ L o s s t . The power to heat efficiency of the electric heater η H e a t e r , e l was set to 99% with:
Q ˙ H e a t e r , e l   ( t ) =   η H e a t e r , e l P H e a t e r , e l ( t )
A loss of thermal energy Q ˙ L o s s t of 1% in 24 h was assumed like in greenius. Calculated for each timestep Δ t with the actual stored thermal energy Q T E S t :
Q ˙ L o s s   ( t ) = 0.01 Δ t 24 h Q T E S ( t )

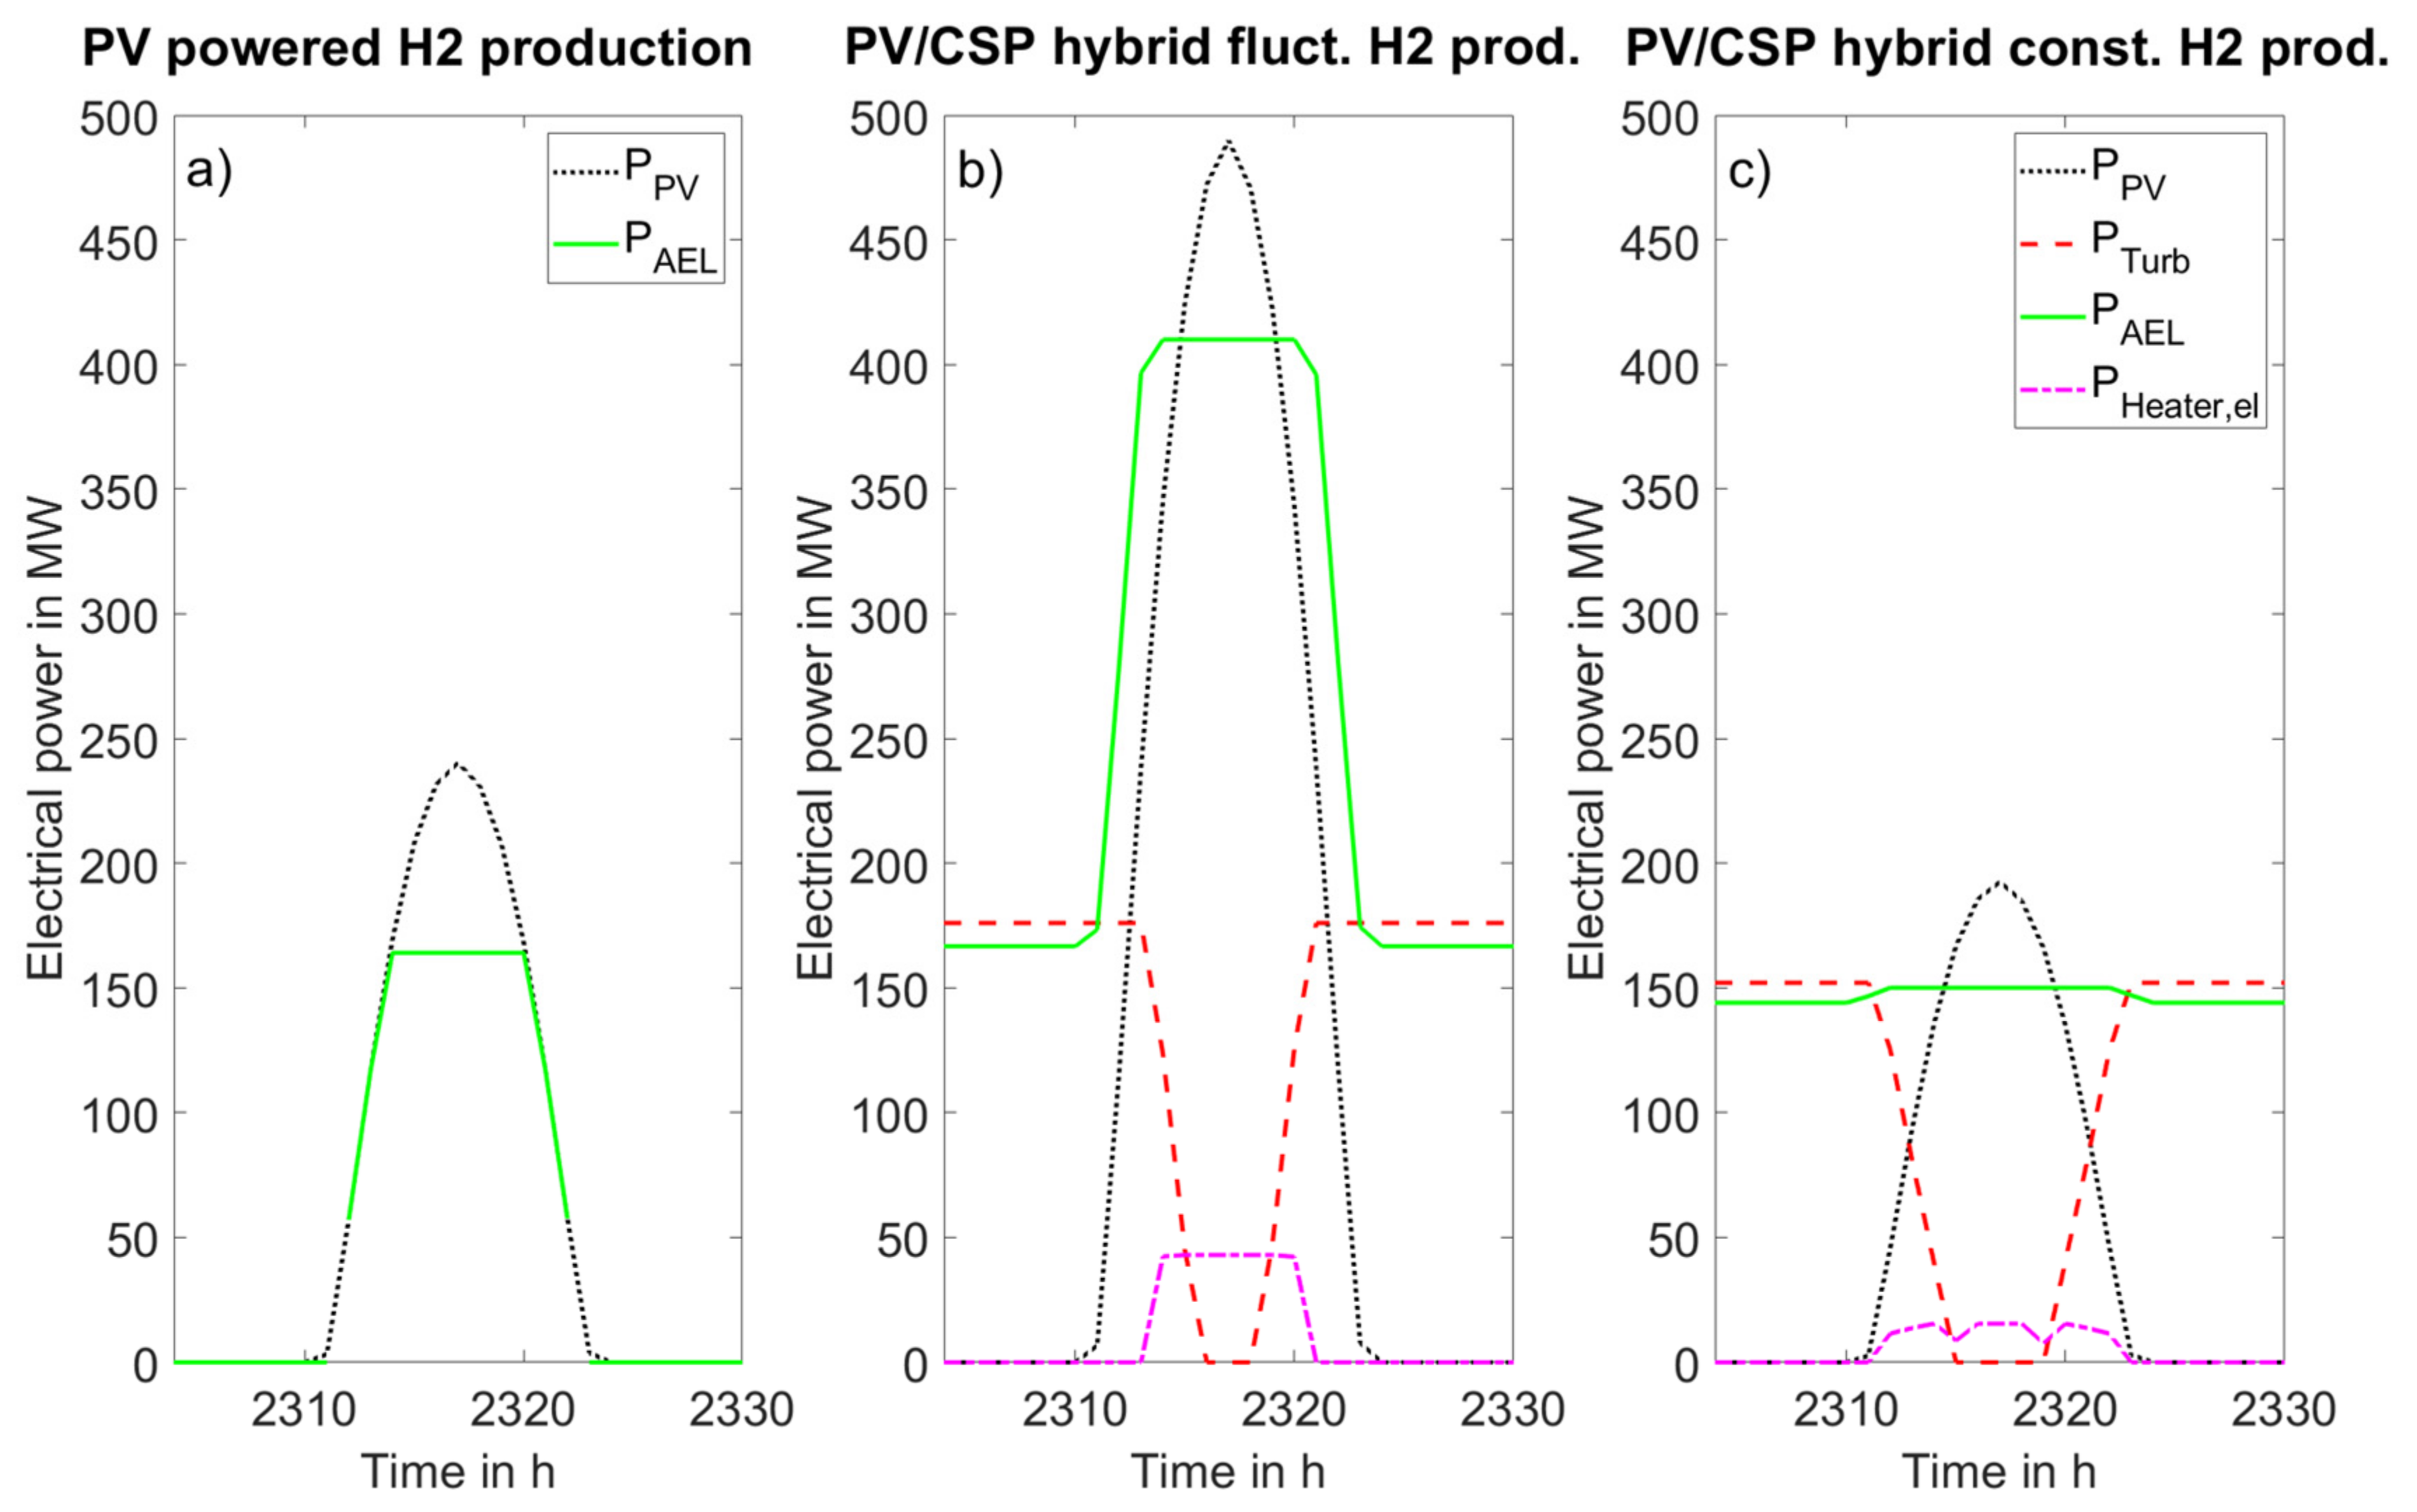
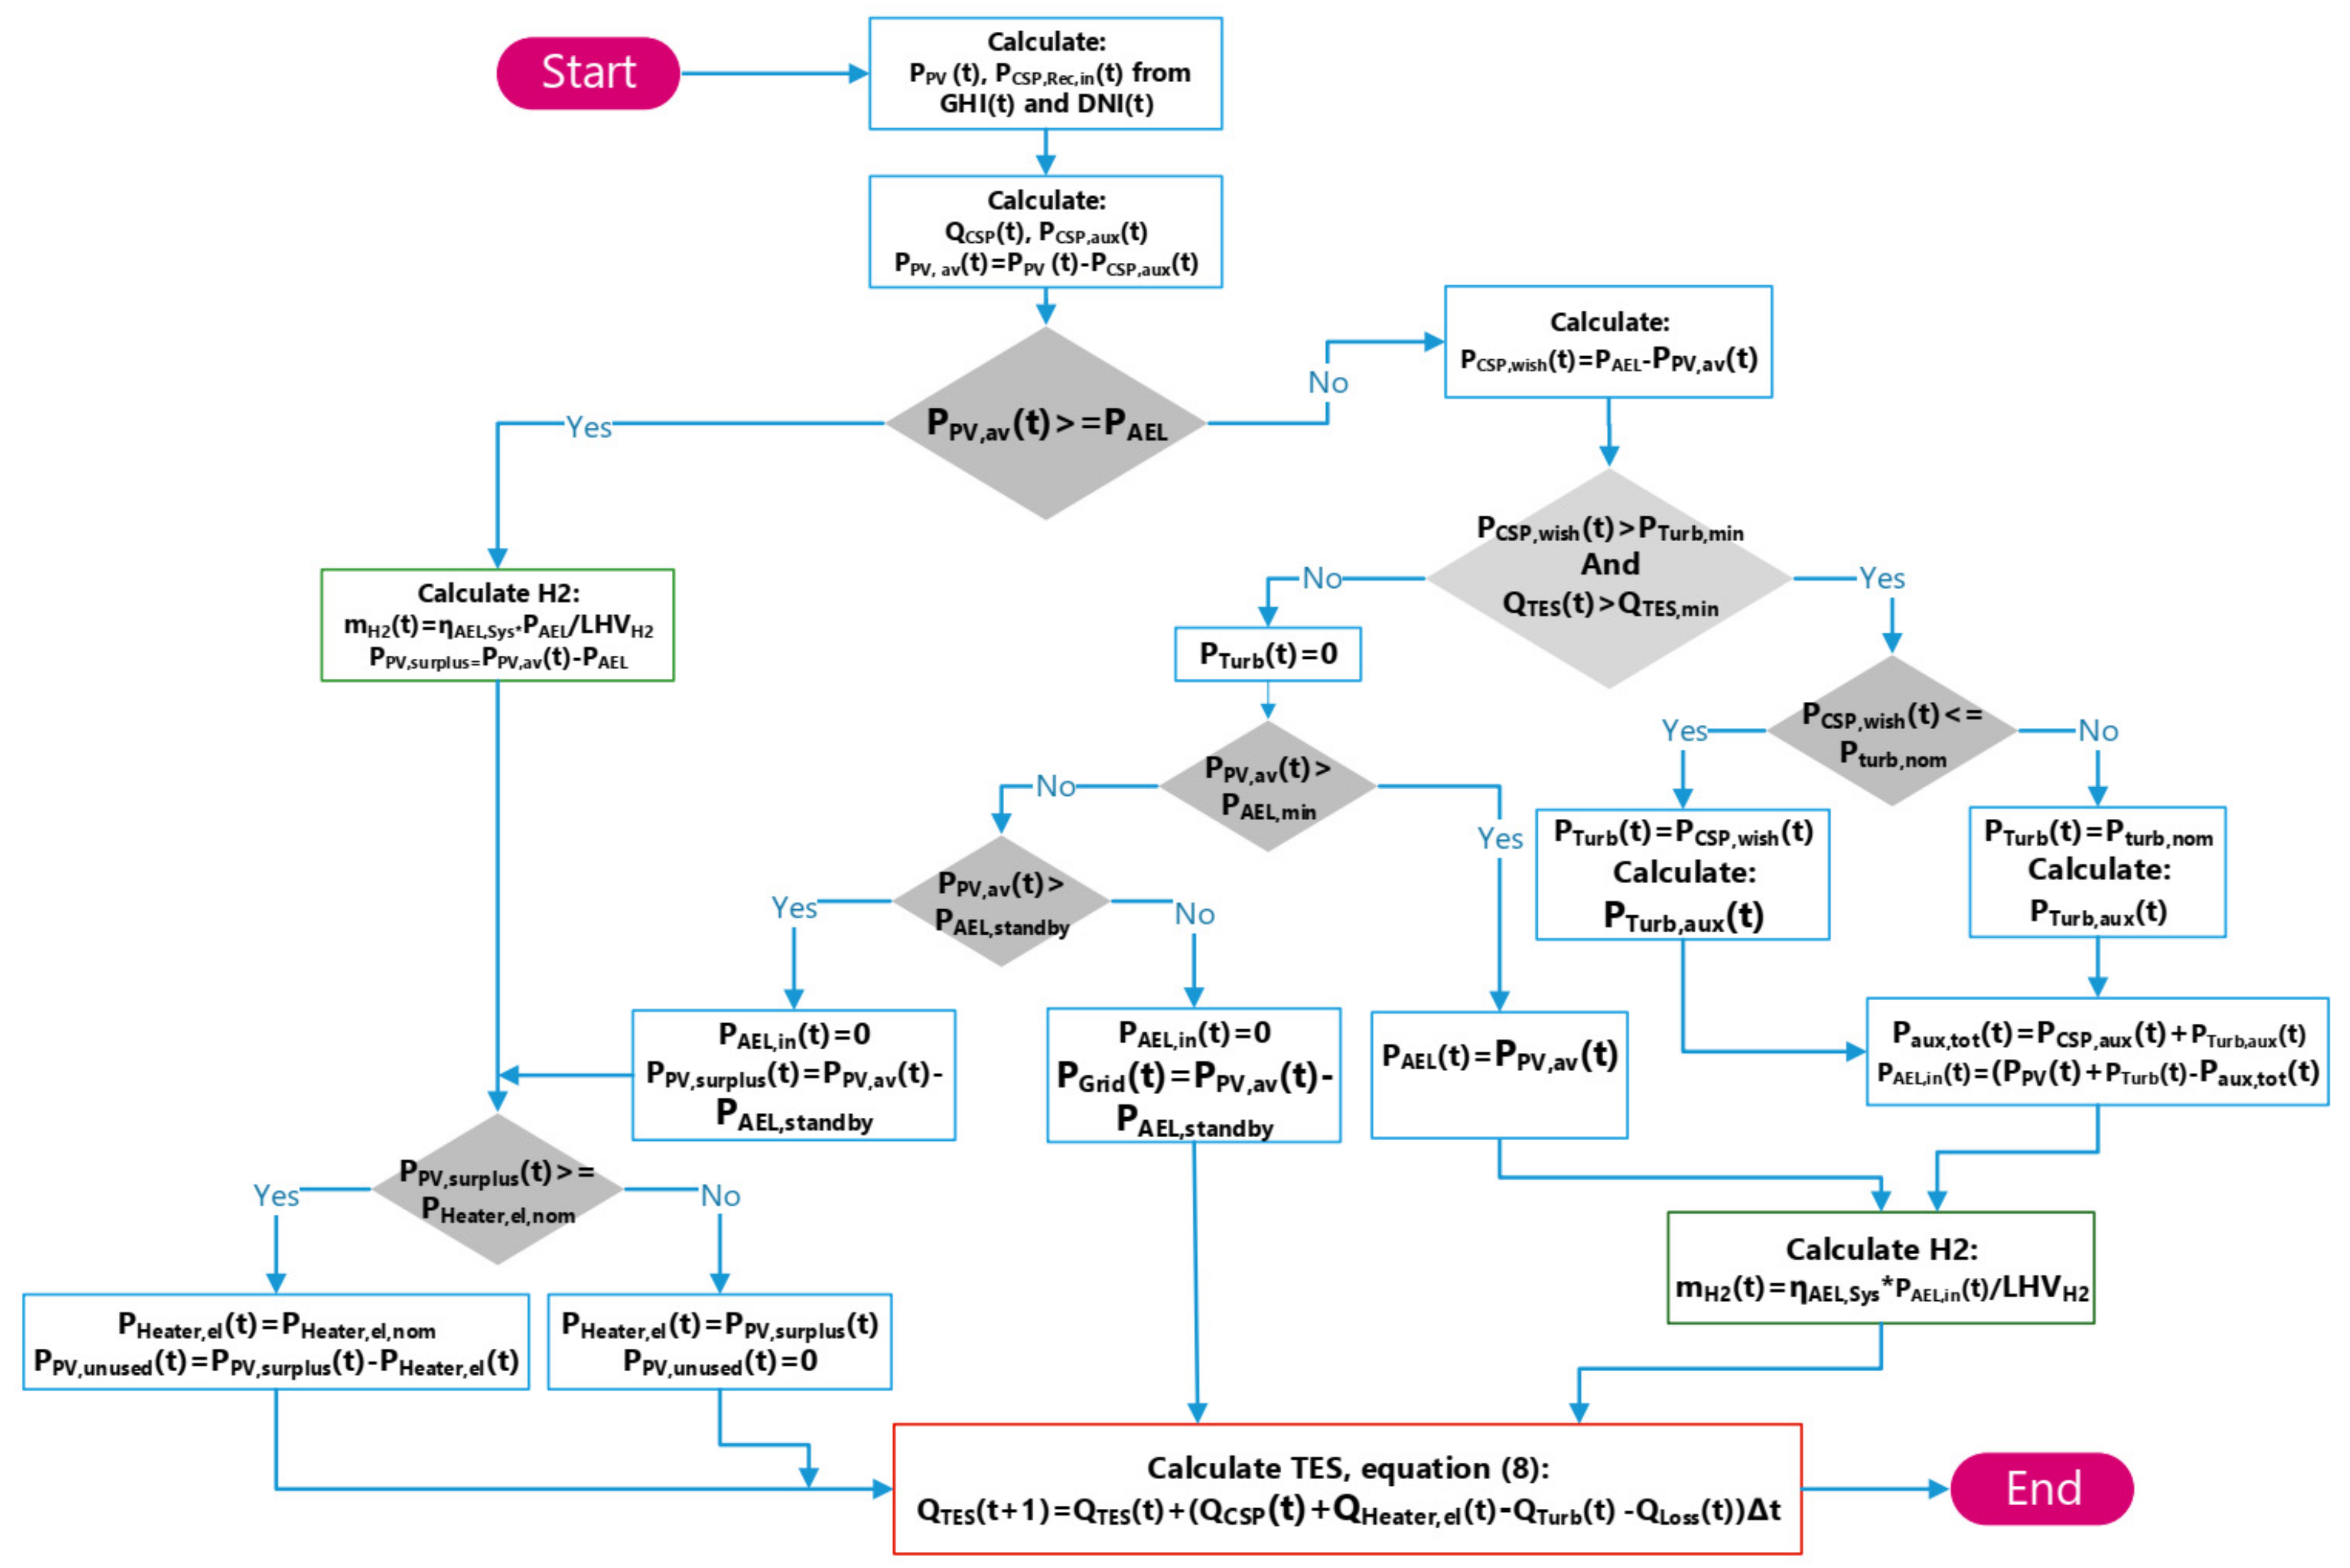
2.4. Operational Strategy of the PV/CSP Hybrid Hydrogen Production Plant

2.4.1. Operational Strategy for AEL System Electricity Provision

As explained in Section 2.2 the alkaline electrolyser is operated in a range from 20 to 100% of its nominal power. For a net electricity produced by the PV/CSP plant in that range, the electrolyser input power can be calculated as sum of actual PV and turbine power, subtracting auxiliary consumption of the CSP part P C S P , a u x and the steam cycle P T u r b , a u x .
P A E L , i n ( t ) = P P V ( t ) + P T u r b ( t ) P C S P , a u x ( t ) P T u r b , a u x ( t )
In this study, the AEL system is operated in standby mode when less than the minimum AEL power input is available, consuming then 1% if it is nominal power without producing hydrogen. The model is designed in a way that this standby-mode electricity demand can always be covered. In case that not enough electricity for standby mode operation is available, the difference is covered by additional electricity P a d d t which represents an additional source, e.g., a battery system. The electricity cost for P a d d t was defined with the interactive online tool of a cost outlook study for electricity storage systems [23,24]. With this tool a levelized cost of storage (LCOS) of 150 USD/MWhel was determined assuming a battery storage with 365 annual cycles and a discharge duration of 12 h. The cost of charging was set to zero, assuming that surplus electricity during daytime can be used for charging. P a d d t is introduced here to simplify the system for the overall design optimization without considering an operational strategy of the TES. In a more detailed analysis of a predesigned PV/CSP hybrid hydrogen production plant, an operational strategy of a combination of TES and a battery storage could be also considered, but this is beyond the scope of this work. Different hydrogen production concepts were analyzed by varying the optimization variables constraints.
Figure 5 illustrates the studied different operational modes for solar hydrogen production at a time period of good solar irradiation. For a solely PV powered system (a), hydrogen production stops at night. Because of standby-mode operation, hydrogen production directly starts when the PV field provides the minimum load. The PV system is oversized resulting in unused surplus electricity. The second plot (b) is a PV/CSP powered AEL plant with fluctuating hydrogen production. In the night, electricity is provided by the steam turbine. The electrolyser system has a higher nominal power and during daytime it is operated with its maximum load provided by PV. In the design of third system (c) a constant hydrogen production was achieved by limiting the maximum AEL system power to 150 MWel, a typical power output of a CSP tower system.

2.4.2. Operational Strategy Electricity Provision of PV/CSP

Figure 6 illustrates the operational strategy for electricity provision and the model calculations in each time step. At first, the solar power input P P V t and P C S P , R e c , i n t   is calculated from irradiance data. In the following, a concept of using the PV electricity in a cascade is applied. Primarily, PV electricity is used to cover the auxiliary electricity demand P C S P , a u x   in the CSP part and the thermal storage section, for example for molten salt pumping (see Table 4). If afterwards enough PV electricity P P V , a v   is available to provide the nominal electrolyser input power P A E L , this is directly used for water splitting in the electrolyser section. If more PV electricity than the AEL nominal power is available, this electricity can be used to electrically heat molten salt and store the heat in the hot storage. The maximum PV electricity that can be stored as thermal energy is defined by the nominal power of the electric heater. The remaining PV electricity after this step is not used ( P P V , u n u s e d ).
If the PV section is not able to provide the nominal power of the AEL system, it is intended to cover the difference between available PV electricity and the electrolyser nominal power with the CSP, defined as P C S P , w i s h t . In order to operate the steam cycle, P C S P , w i s h t needs to be larger than the minimum turbine power P T u r b , m i n . If this is not the case, but available PV electricity is greater than the minimum AEL system input, the electrochemical water splitting is operated with smaller electricity input. If the available electricity is smaller than the minimum AEL system input, the standby electricity demand is covered. The remaining PV electricity can be used to operate the electric heater. If the available electricity is even smaller than the AEL system standby demand, the difference is covered by an additional electricity source P a d d t . At the end of each time step the energy balance of the TES is calculated (see Section 2.3.6).

2.5. Model Validation

The energy system model of the CSP part and the thermal storage were validated with data from greenius. A CSP powered plant was simulated with reference data for thermal energy storage capacity CTES and nominal receiver power PCSP,Rec and a given nominal turbine power PTurb. The nominal power of the electrolyser plant PAEL was set to the turbine power. The conformity of the turbine full load hours in the model and the values from greenius was in the range of 99% and also the levelized cost of electricity (LCOE), which is also calculated in the model, was similar. To validate the correctness of the levelized cost of hydrogen (LCOH), a correlation was used, which determines the LCOH as a function of electrolyser full load hours and the price of electricity (see Equation (23) in Section 4.1.2). The reference lines in Table 9 provides electrolyser full load hours and LCOE data determined with the simulation tool. The data shows good agreement with the correlation in Equation (23).

3. Techno-Economic Assumptions and Equipment Costs

3.1. General Techno-Economic Assumptions

Table 5 lists the basic techno-economic assumptions used for the exemplary study. The lifetime of all equipment was set to 25 years. Electrolyser stack replacement is included in the operating and maintenance costs. Costs provided in Euro were converted to USD with the given exchange rate.

3.2. Product Cost Calculation Method

The total revenue requirement (TRR) method was used to determine products costs in the process. The capital-recovery factor (CRF) is calculated from the internal interest rate ieff and the lifetime of the plant n [25]:
C R F = i e f f ( 1 + i e f f ) n ( 1 + i e f f ) n 1
With the CRF, an annual equal payment AoI related to the investment can be determined from the total installed costs (TIC):
A o I = C R F T I C
With the operating and maintenance costs (OMC) the product price can be determined, by summing up AoI and OMC of all process units to A o I H 2   p l a n t   and O M C H 2   p l a n t   . For the PV/CSP-hybrid stand-alone hydrogen production plant the mass-specific levelized cost of hydrogen (LCOH) are determined from the annual hydrogen production MH2,annual with the following equation:
L C O H = A o I H 2   p l a n t   + O M C H 2   p l a n t   + C P , a d d M H 2 ,   a n n u a l + c H 2 O / H 2
Additional electricity costs CP,add and specific cost of water c H 2 O / H 2   per kgH2 are also considered. Similarly, levelized costs of electricity (LCOE) can be calculated. For example, for PV with the annual sum of PV electricity produced E e l ,   P V ,   a n n u a l :
L C O E P V = A o I P V + O M C P V E e l ,     P V ,   a n n u a l

3.3. Net Present Value of Hydrogen Production Plant

For a known market price of the product, the net present value WNP is a suitable variable to characterize the economic feasibility of a project. The WNP is the arithmetic sum of the present worth of all cash flows during the total project time [26]. Assuming a constant annual cash flow FC the net present value can be determined from the total installed costs (TIC):
W N P = T I C + F C C R F
All replacement costs are included in the operation and maintenance costs so that the annual cash flow is the difference between the revenue from hydrogen selling R H 2 , the overall plant operation and maintenance costs O M C H 2   p l a n t and the costs for additional electricity C P , a d d .
F C = R H 2 O M C H 2   p l a n t C P , a d d

3.4. Investment and Operational Cost Assumptions

3.4.1. AEL System

In a recent study the total installed costs (TIC) of large-scale electrochemical hydrogen production plants were determined in detail [27]. This resulted in a TIC of 1645 USD/kW for an alkaline electrolysis plant located in the the Netherlands. The TIC was calculated for state-of-the-art electrolyser technology. In the next years a significant decrease of electrolyser costs is expected, mainly through automation in stack production. A study based on a survey of electrolyser manufacturers [10] expects a decrease in electrolyser system costs in the range of 36% in the next 10 years.
The present study shall give an outlook for the next ten years and therefore already include the expected decrease in electrolyser system costs. Furthermore, it is assumed that the cost for electricity provision infrastructure and land would be lower than in the reference project in the Netherlands, because land costs are much lower in sparsely populated areas and those regions in the sun belt also have a lower price index. Therefore, a total decrease of TCI of 50% was assumed for the techno-economic study (see Table 6). Following a concept suggested in [10], operating and maintenance costs of electrolyser systems already include stack replacement costs.

3.4.2. PV System and Electric Heater

The assumptions of PV costs were based on IRENA studies. In [28] country-specific total installed costs (TIC) of PV plants are provided. The value for the standard scenario (760 USD/kW) was chosen at the lower end of the actual project values (see Table 6). For the cost outlook scenario, the lowest value for 2030 of a given range (340–834 USD/kW) was taken from a IRENA study about the future development of PV [29]. The present study is therefore assuming a continuing strong decrease in PV costs, to analyze how this effects the combination with CSP. Few studies exist about the costs of electric molten salt heaters, in [30] a value of 410 USD/kW is derived from [31]. With such high values storing surplus electricity as heat would be uneconomic. It is probable that industrial implementation of electric molten salt heating will significantly decrease the costs. For this study an optimistic decrease in heater costs to a TIC of 180 USD/kW is assumed.

3.4.3. CSP, TES and Power Block

A study of the DLR Institute of Solar Research determined country-specific CSP equipment costs by considering the local share of work and the local price index [18]. This leads to the different equipment cost which are provided for Almeria and Ouarzazate in Table 7. Furthermore, the study gives an outlook to the cost development until 2030 which is considered for the cost outlook scenario. Increased efficiencies of the receiver and the power cycle are expected (see Figure 2) and also a general decrease in CSP investment costs. Operating and maintenance costs are not changed in the different scenarios. Values based on [22] are provided in Table 8. Additional costs for land, project development and others account for approximately 20% of the final CSP project costs [18]. The equipment costs E P C C S P calculated with the values in Table 7 are therefore increased to obtain the total installed costs of the CSP plant.
T I C C S P = 1.2 E P C C S P

4. Simulation Results and Discussion

4.1. Optimal PV, CSP/AEL System Combinations

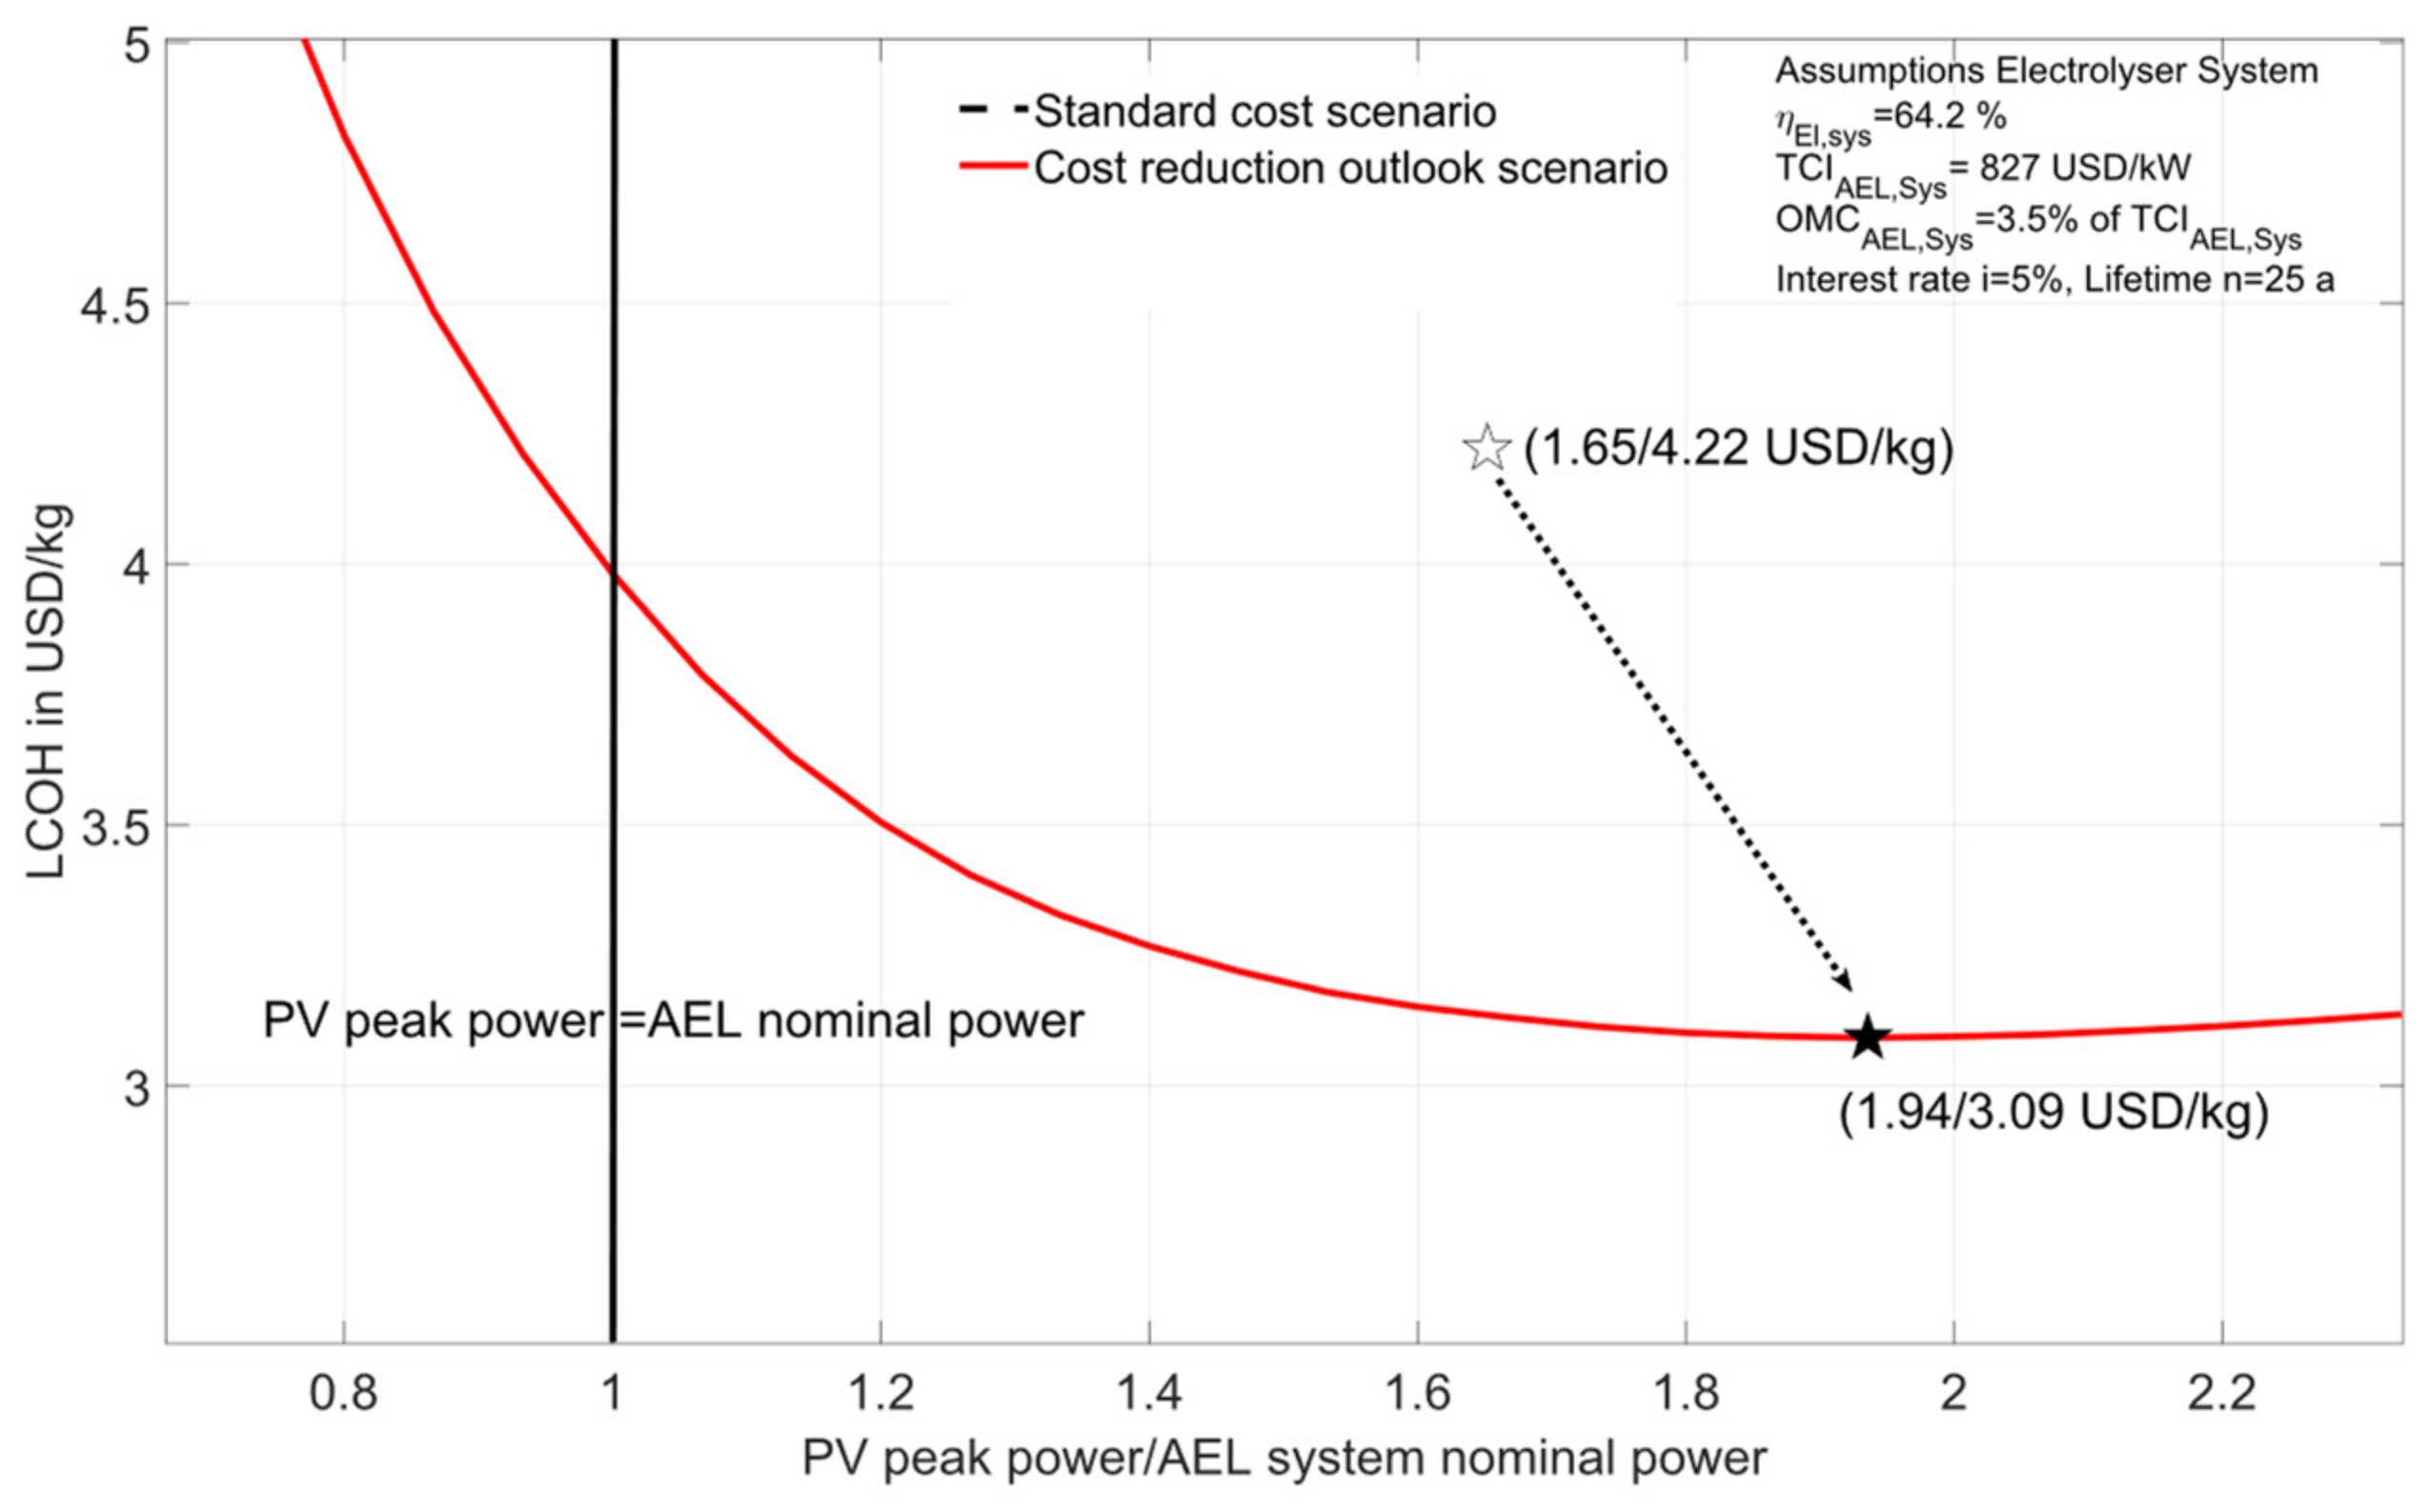
4.1.1. PV-AEL Hydrogen Plant Results

Thinking about direct coupling of photovoltaics and electrolyser systems one could expect that the electrolyser full load hours are equal to the operating hours of the PV plant. However, the economic optimization showed that it’s more economic to overscale the PV system. Figure 7 shows the influence of the PV peak power to AEL nominal power ratio for the location Ouarzazate in Morocco. For the standard scenario the minimum of LCOH is achieved for a ratio of 1.65. In the cost reduction outlook scenario, the electrolyser costs are equal but PV investment costs are decreased. For this reason, the minimum of LCOH shifts to a higher PV:AEL ratio of 1.94. For the other locations, due to the reduced GHI, the lowest LCOH are reached for even higher PV:AEL ratios.
In summary, by oversizing the PV system, lower LCOH can be reached for PV/AEL hydrogen plants which are operated as stand-alone systems. The AEL system is operated with more full load hours (FLH) than the annual PV FLH. On the other hand, a certain share of the PV electricity is now not used. As a result, the electricity costs for hydrogen production are higher than the levelized cost of electricity of the PV plant (see results in Table 9).

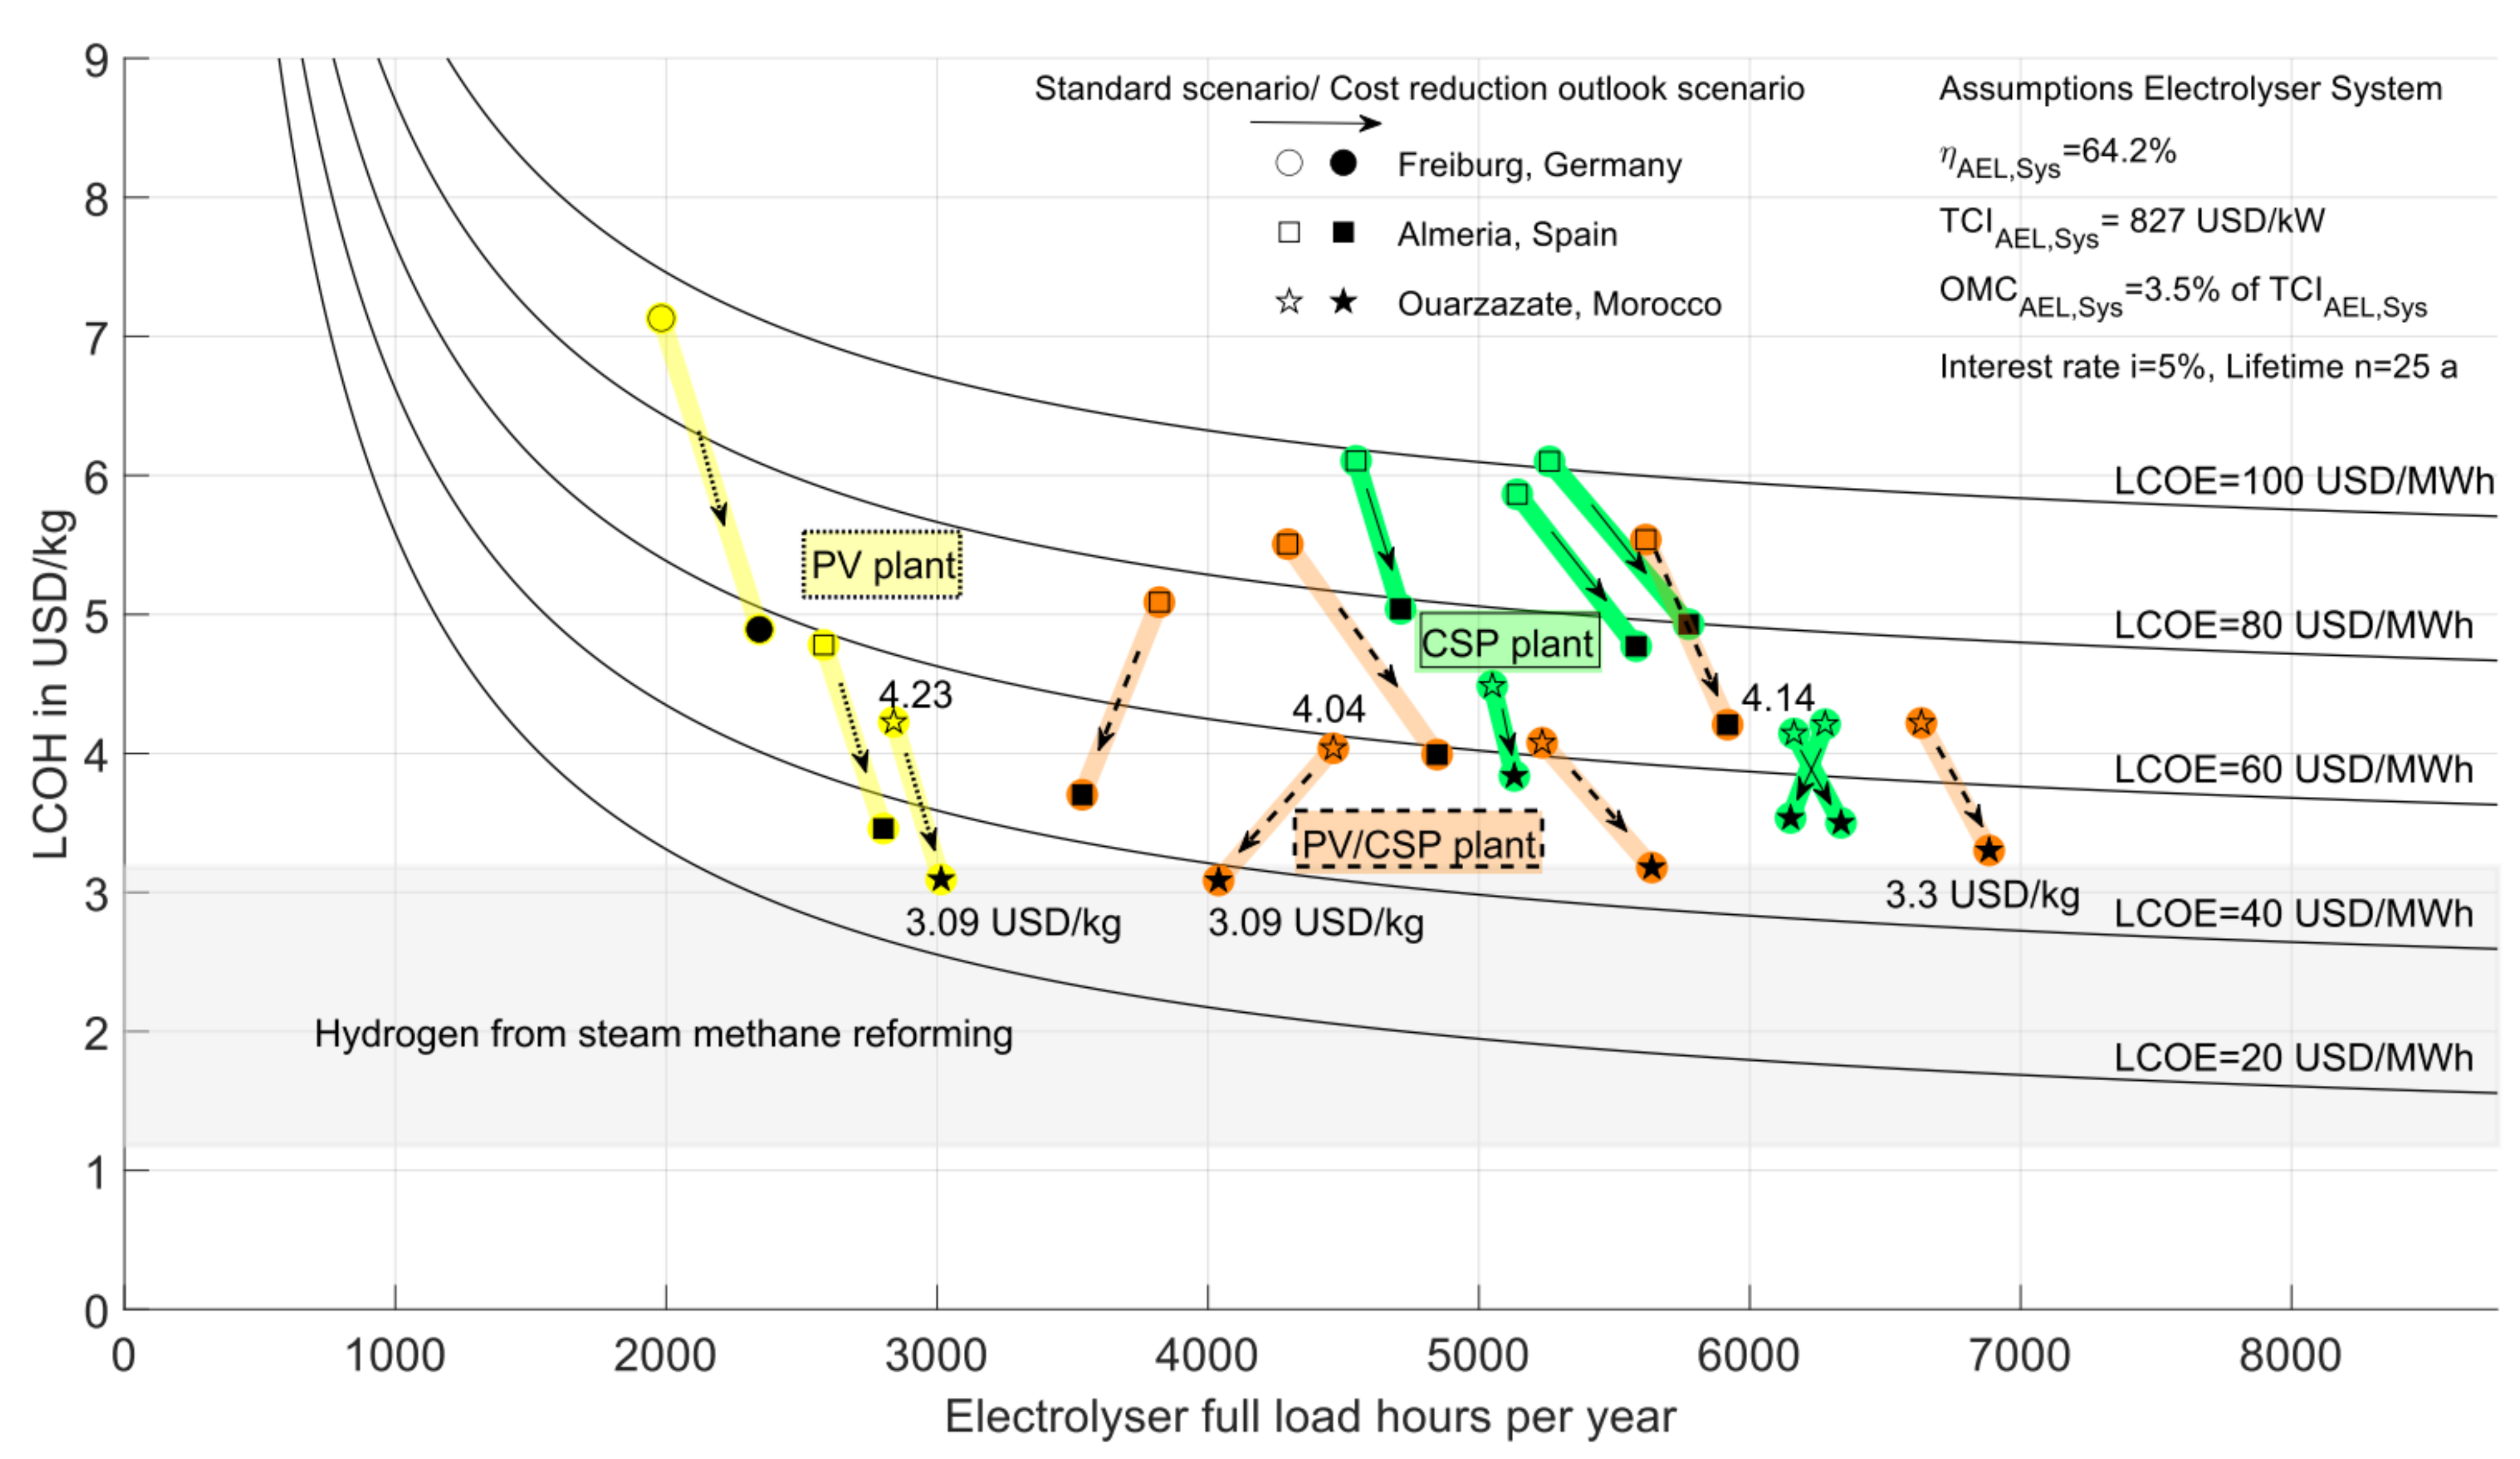
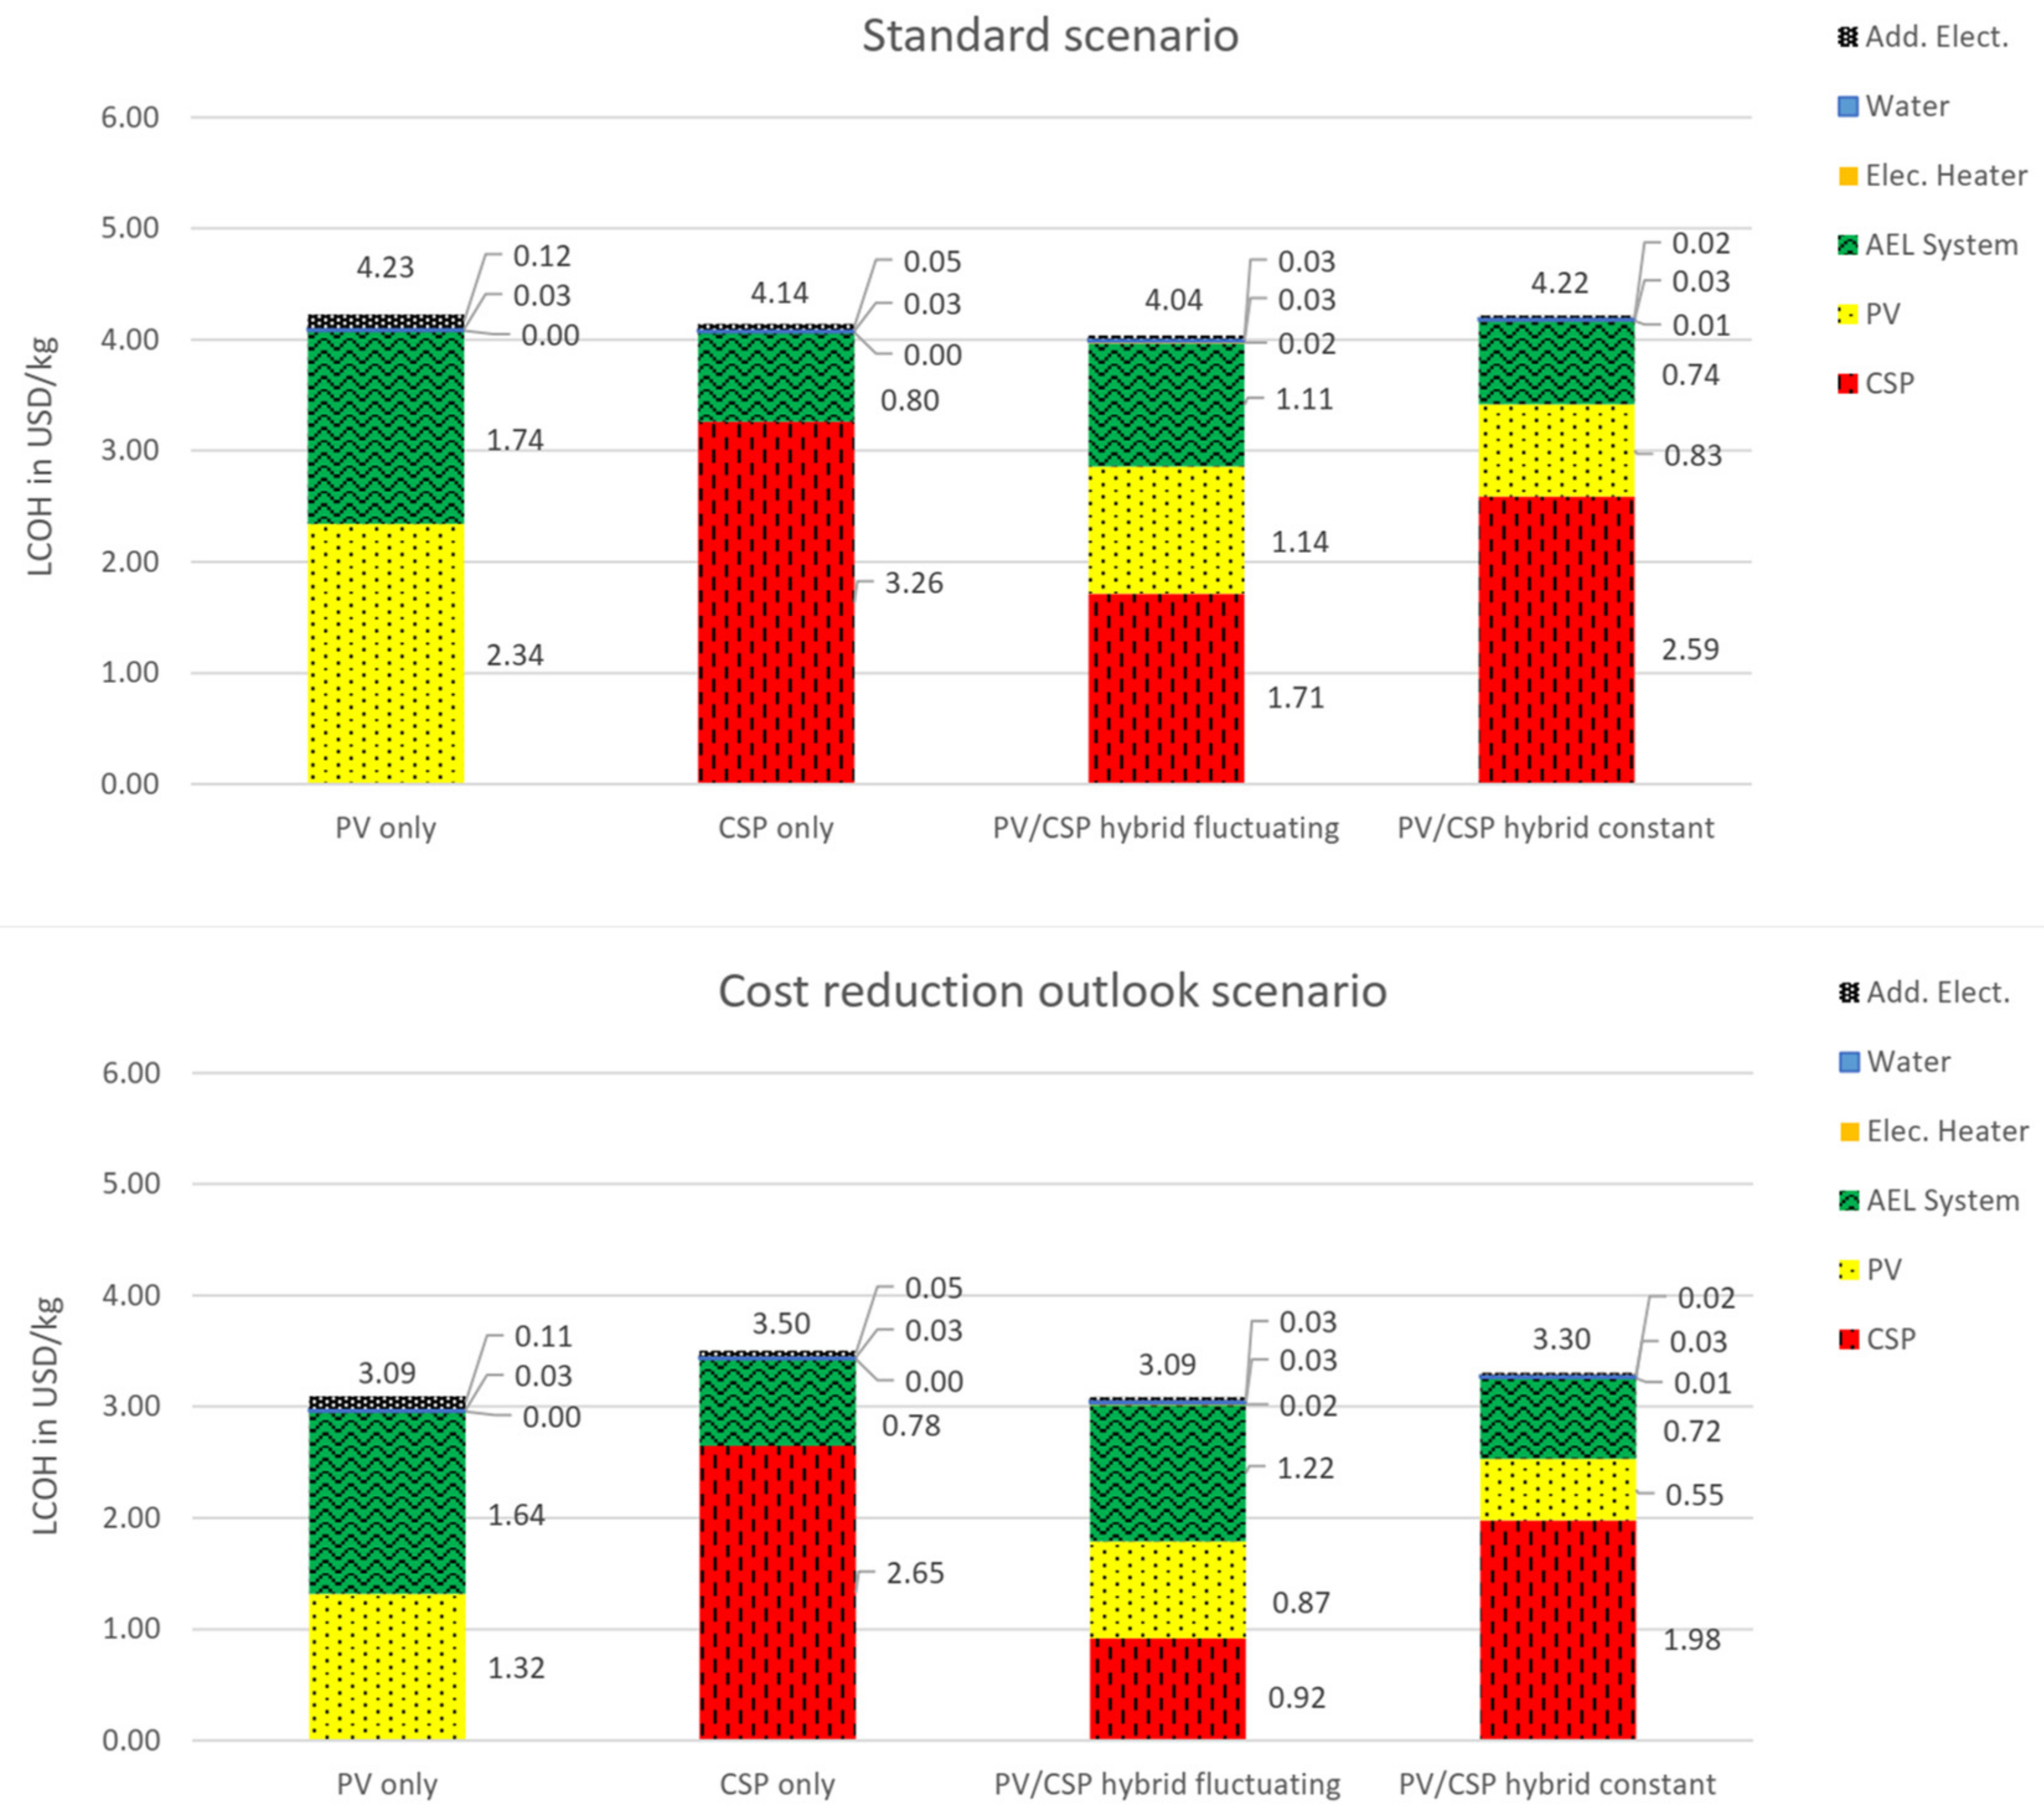
4.1.2. PV/CSP-Hybrid-AEL Plant and Overall LCOH Results

Figure 8 presents the results of the hydrogen production plant design optimization for an alkaline electrolyser system powered solely by PV, solely by CSP or by a combined PV/CSP hybrid power plant. The plotted points are the Levelized Cost of Hydrogen (LCOH) and the corresponding full load hours per year of the electrolyser plant determined with the energy system model of this work. The shown reference lines are determined with Equation (23), a correlation that determines the LCOH (USD/kg) from the investment annuity and operating costs depending on the full load hours of the electrolyser and the cost of electricity. This correlation was adapted from [10] and same assumptions for TIC and OMC were used like in the overall plant model:
L C O H = ( T I C A E L , S y s C R F + O M C A E L , S y s + F L H A E L , S y s L C O E ) L H V H 2 η A E L , S y s F L H A E L , S y s
For all plant configurations the lowest LCOH were determined for the location with the highest solar resource (Ouarzazate, Morocco). For current PV and CSP investment costs (Standard costs scenario, results see Figure 9) the lowest LCOH were found for a PV/CSP hybrid-AEL plant (4.04 USD/kgH2). In this case using only CSP as power source leads also to lower LCOH (4.14 USD/kgH2) compared to 4.23 USD/kgH2 for a PV-AEL plant. The cost outlook scenario was designed in way to investigate the influence of a strong decrease in PV and a moderate decrease in CSP investment costs. In this case a PV-AEL plant reaches almost the same LCOH than a PV/CSP hybrid-AEL plant (3.09 USD/kgH2), while the LCOH of the PV/CSP hybrid-AEL is still the global minimum. For a PV/CSP plant configuration with constant hydrogen production higher electrolyser full load hours can be reached compared to a solely CSP powered system. Table 9 summarizes the electrolyser full load hour values and the levelized cost of electricity for the most promising plant configurations. LCOE for each technology separately are listed up and also the cost of electricity provided to the electrolyser system (LCOE to AEL), and the same value including the cost of additional electricity. The table illustrates the effect of overscaling the PV system, whereby higher electrolyser full load hours can be reached, but the final electricity costs are higher than the PV LCOE. Depending on the operational strategy, the PV/CSP hybrid concept leads to 4000–6900 electrolyser full load hours. The total cost of electricity provided to the electrolyser is in the range of 35 USD/MWhel (cost outlook scenario, fluctuating H2 production) to 66 USD/MWhel (standard scenario, constant H2 production).
Figure 9 provides the share of the LCOH corresponding for each plant section (AoI and OMC) and cost for water and additional electricity. It can be seen that the cost of additional electricity (first value) increases the LCOH for solely PV-powered AEL in the range of 0.11–0.12 USD/kgH2. This additional cost would be in a stand-alone hydrogen plant the cost for a battery system which provides the electricity for standby operation. Providing electricity with costs lower than 150 USD/MWhel could further reduce the LCOH of the PV-AEL concept and result in the lowest LCOH in the cost reduction outlook scenario. However, also the concepts which include a thermal energy storage consider additional electricity costs (0.03–0.05 USD/kgH2). This value could be reduced with an optimized operational strategy of the TES, by adjusting the turbine power and avoiding that the TES is running empty.

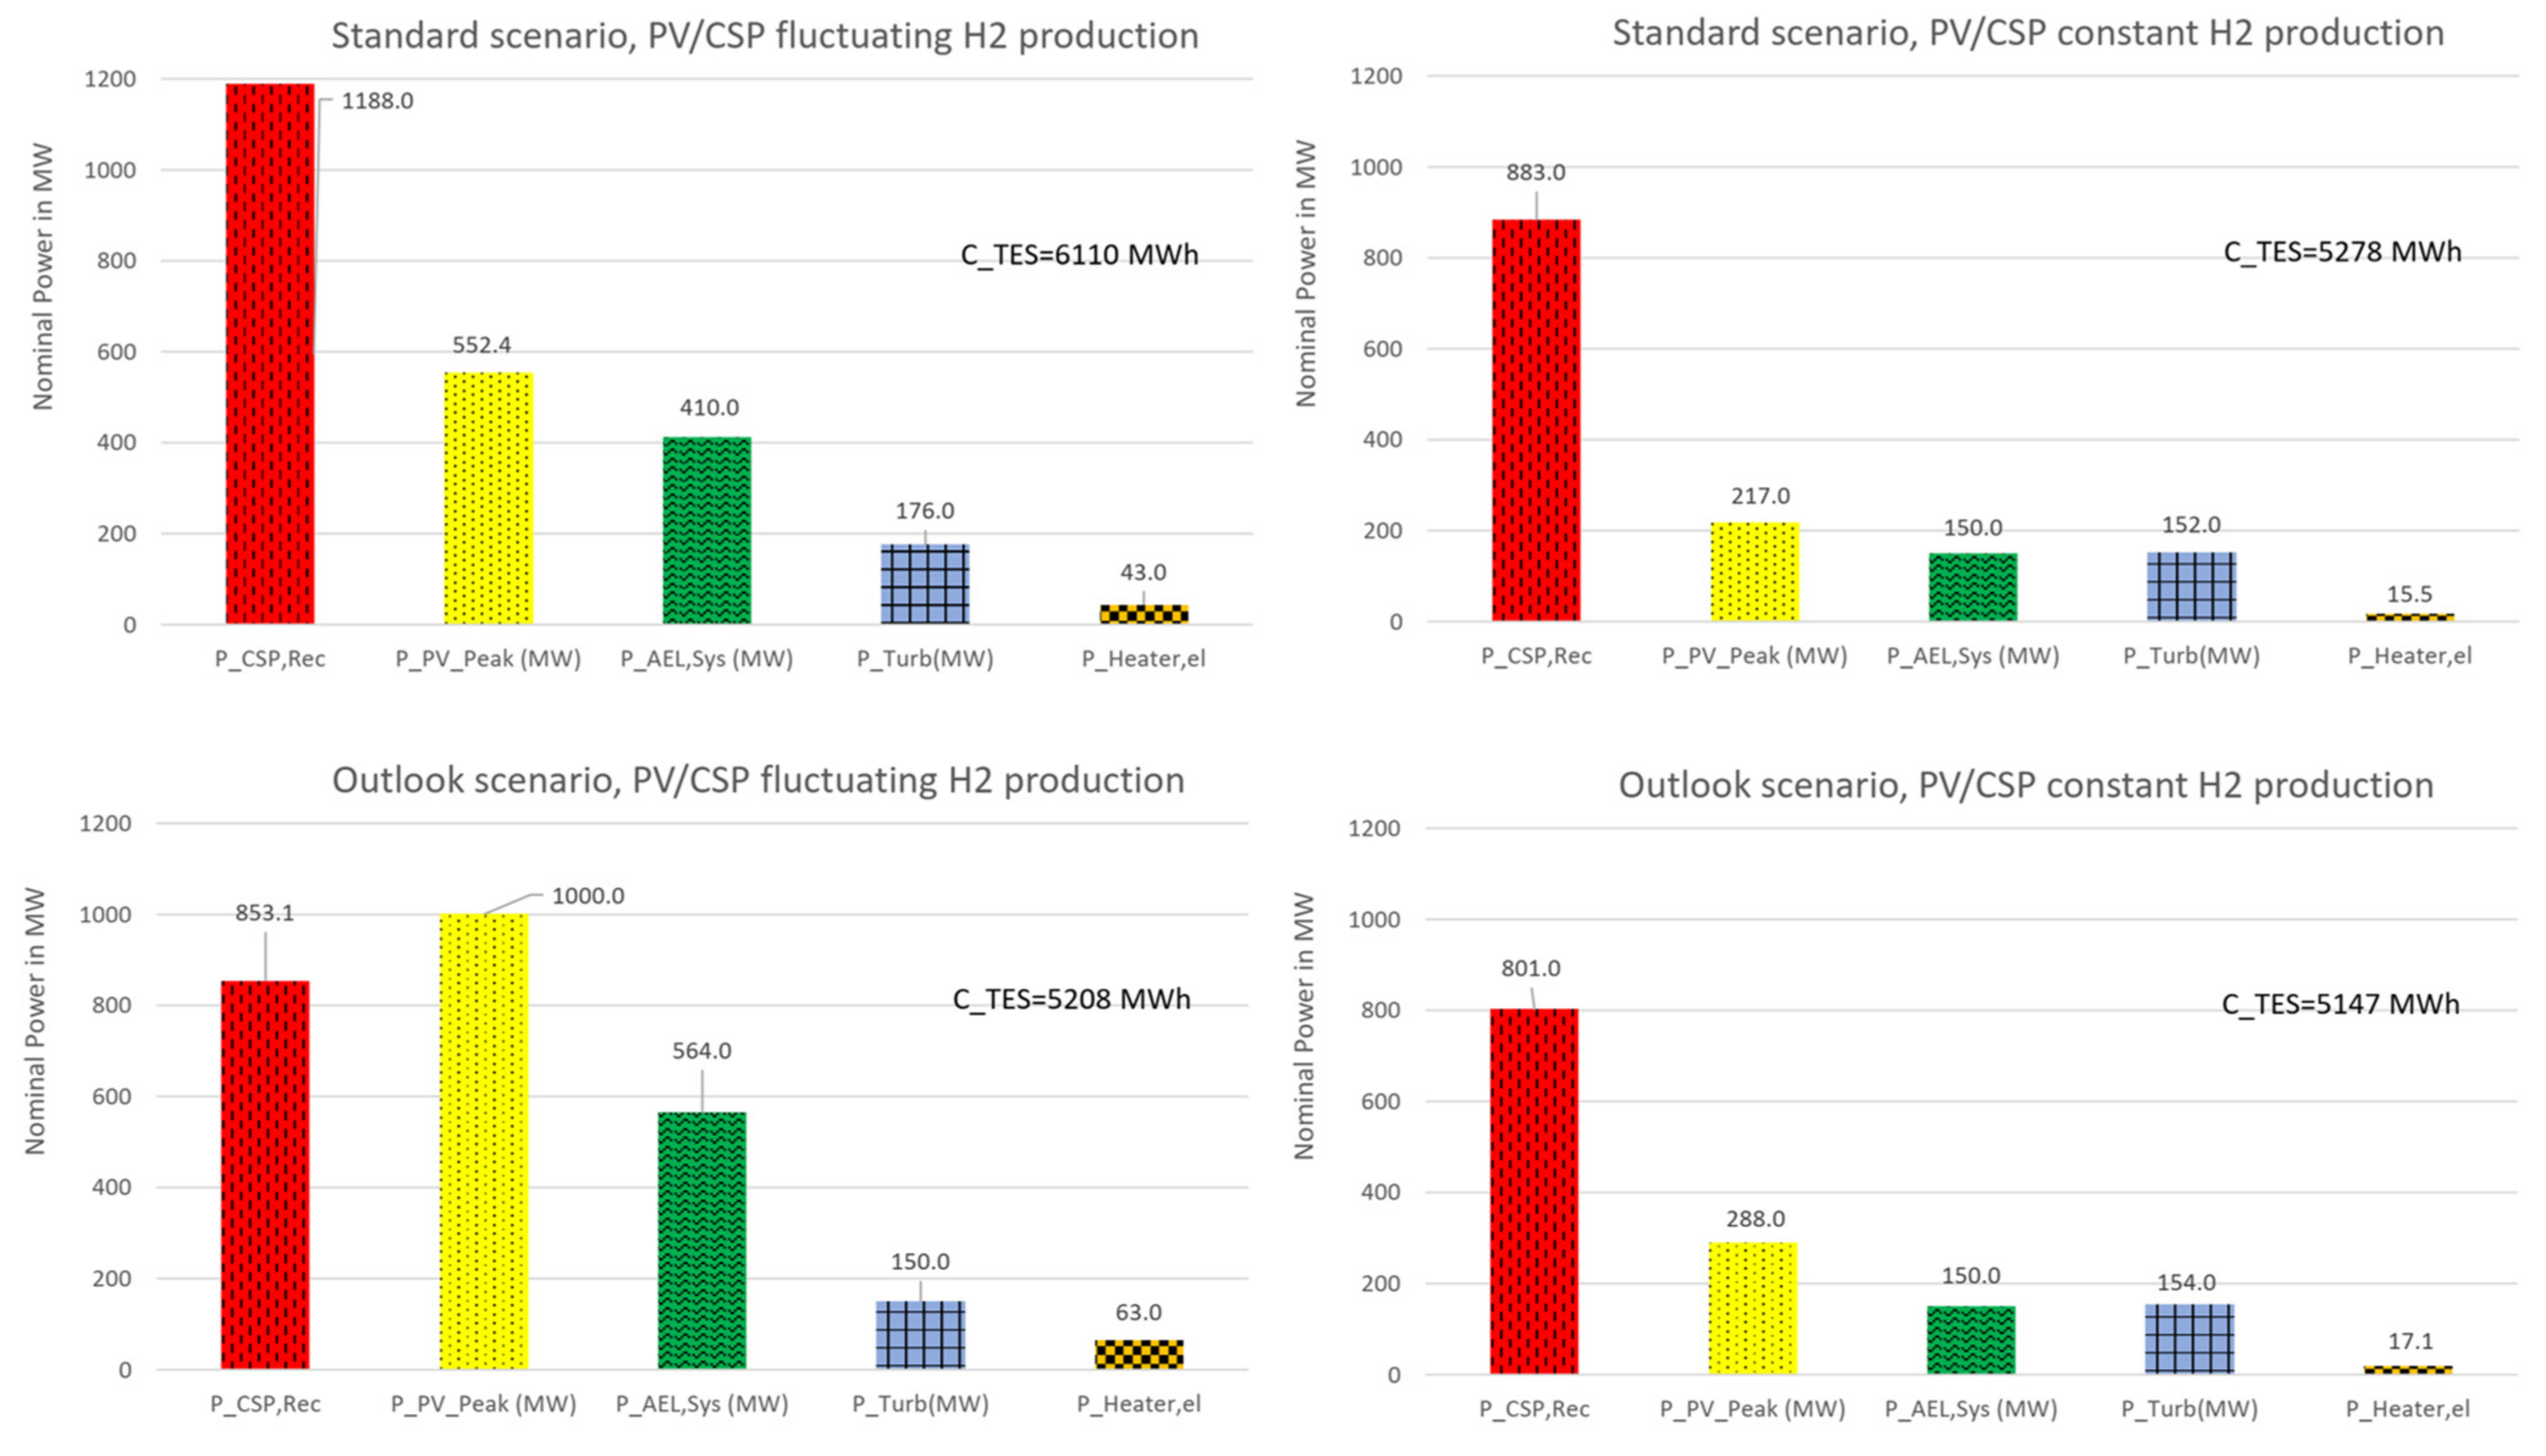
4.1.3. PV/CSP-Hybrid-AEL Plants Suggested Plant Design

Figure 10 illustrates the optimized plant designs for PV/CSP powered AEL hydrogen production plants. Permitting fluctuating hydrogen production leads to an increased PV peak power, especially in the cost outlook scenario. In the constant production case an optimization constraint was set to limit the alkaline electrolyser system nominal power to 150 MW. In this case, PV peak power and AEL nominal power are significantly lower while the other process equipment has a similar nominal power and also the capacity of the TES does not change much. Thus, for the constant production scenario the investment costs are significantly lower but also the annual hydrogen production. Coupling to hydrogen production to subsequent processes will probably favour the constant production concept (see also next section).

4.2. Economic Interpretation of the Results

Until now, only product costs (LCOH) were considered for the evaluation of the different design concepts. In Section 3.3 the concept of net present value (WNP) was introduced. Figure 11 depicts the WNP depending on the revenue of the produced hydrogen for the three most promising concepts in the cost outlook scenario. For each plant design the WNP turns positive for hydrogen prices greater than the before determined LCOH. The PV/CSP hybrid plant with fluctuating H2 production has the steepest slope and is therefore the mot economic design concept for hydrogen revenue prices greater than 3.09 USD/kgH2. The earnings from the PV/CSP hybrid concept with constant hydrogen production also exceed the value of the PV-AEL plant for hydrogen revenue prices greater than 3.50 USD/kgH2. Electrochemical hydrogen production will typically be coupled to other processes, except if a direct feeding to a pipeline system is foreseen. For example, for long-distance transport as liquid hydrogen (LH2) the electrochemical process will be coupled to a hydrogen liquefaction plant. Another option is to couple the hydrogen production to a fuel synthesis process like the Fischer-Tropsch process. In all these cases a more constant H2 production is more convenient to reduce costs for hydrogen storage and other process equipment. Therefore, a process design evaluation including coupling to other processes will probably favour the concepts with constant H2 production.

5. Conclusions and Outlook

In this study we developed an energy system model of an electrochemical hydrogen production plant powered by a combination of PV and CSP. The energy system includes a thermal energy storage and an electrical heater which can be used to store surplus electricity as heat. We implemented an operational strategy algorithm for optimal interplay between PV, CSP and an alkaline (AEL) electrolyser system. The operational strategy includes the use of PV surplus electricity in a cascade, covering first process auxiliary consumption and only storing the remaining surplus as heat. The energy system model was designed to be used for techno-economic system design optimization studies. Optimization variables were the nominal CSP receiver power, the PV peak power, the AEL system nominal power, the turbine nominal power, the nominal power of the electric heater and the capacity of the thermal energy storage.
We varied the optimization constraints to compare plant configurations and performed an exemplary study for two different cost scenarios. The cost outlook scenario should thereby especially consider the minimum of PV costs that can be reached in the next ten years. For comparison, we performed the study for three locations with different solar resources. The following values of LCOH refer to the location Ouarzazate, Morocco. This location reached the lowest LCOH in this study because of the highest solar resource combined with the lowest cost index.
We found for the assumptions made that integrating concentrated solar power is the economically most promising concept. In the standard scenario a PV/CSP plant with fluctuating hydrogen production reaches the lowest LCOH (4.04 USD/kgH2). Considering the mentioned minimum of PV costs in the cost outlook scenario results in almost equal LCOH for a PV powered AEL plant and a PV/CSP-AEL plant with fluctuating hydrogen production (3.09 USD/kgH2). However, the PV/CSP hybrid variant leads to a significantly higher project profitability, what we showed with an investigation of the net present worth of the investment.
Summing up, we found that integrating concentrated power plants is an auspicious pathway for large-scale solar hydrogen production. The presented plant model and the optimization approach turned out a powerful tool to develop first designs of such plants. This predesign could be used for a detailed analysis with a smaller time step size. This could then include advanced operational strategies for combinations of TES and battery electricity storage. Then, the extent of energy extraction from the TES can be adapted considering the storage level and solar energy forecasts. Thereby, stops and start-ups of the electrolyser system can be prevented or its number can be reduced at least.
In general, we present in this work a modelling approach for optimized system design of solar hydrogen production plants. The final optimized design and the determined LCOH depend strongly on the techno-economic input data. Therefore, in further studies the effect of varied assumptions is worth to be investigated. For example, faster progress in electrolyser system cost reduction and a higher electrolyser efficiency would favor a PV powered hydrogen production. The applied PV technology could be also analyzed more in detail. This study was based on the lower end of the given range of PV investment cost, assuming a non-tracking PV system with high module efficiency. Using a tracking PV system would improve the performance of a PV-AEL plant but also lead to higher investment costs. With detailed information on different PV technology costs, the model could be used to choose the best suited technology.
Coupling of hydrogen production with other processes, like hydrogen liquefaction for hydrogen transport or synthesis processes, like the Fischer-Tropsch process was not part of this analysis. Considering this coupling will probably shift the cost minimum towards the PV/CSP hybrid concept with constant hydrogen production. In this case a smaller hydrogen storage and process components with a reduced nominal power and therefore smaller investment costs could be installed. A subsequent study could also include wind power, as other fluctuating renewable power source with a great potential.

Author Contributions

Conceptualization, A.R., C.S., R.P.-P. and N.M.; methodology, A.R., N.M. and J.D.; validation, A.R. and J.D.; formal analysis, N.M. and M.R.; resources, A.R. and J.D.; writing—original draft preparation, A.R.; writing—review and editing, N.M and M.R.; visualization, A.R.; supervision, C.S. and R.P.-P.; project administration, N.M. and M.R.; funding acquisition, N.M and M.R. All authors have read and agreed to the published version of the manuscript.

Funding

This research was funded by the German Federal Ministry for Economic Affairs and Energy, grant number 03EIV221.

Acknowledgments

The authors of this paper gratefully acknowledge the funding of the project SolareKraftstoffe (Grant agreement Nr. 03EIV221) by the German Federal Ministry for Economic Affairs and Energy, on the basis of a decision by the German Bundestag.

Conflicts of Interest

The authors declare no conflict of interest.

Nomenclature

AbbreviationsGreek Letters
AoIannuity of investment η energetic efficiency
AELalkaline electrolyserTechnical Nomenclature
CAPEXcapital expenditure A area (m2)
CSPconcentrated solar power c H 2 O / H 2 specific cost of water (USD/kgH2)
CRFcapital recovery factor C P , a d d cost of additional electricity
DNIdirect normal irradiance i e f f internal interest rate
EPCtotal major equipment costs P power (J/s)
FLHfull load hours Q thermal energy (J)
GHIglobal horizontal irradiance Q ˙ rate of heat transfer (J/s)
LCOElevelized cost of electricitySubscripts
LCOHlevelized cost of hydrogenaddadditional
LCOSLevelized cost of storageauxauxiliary
LHVlower heating valueavavailable
OMCoperating and maintenance costselelectric
PVphotovoltaicsH2hydrogen
TEAtechno-economic analysisininput stream
TESthermal energy storageSyssystem
TICtotal installed cost
TRRtotal revenue requirement
USDUS Dollar
WNPnet present worth

References

  1. European Commission. The European Green Deal COM/2019/640 Final; European Commission: Brussels, Belgium, 2019. [Google Scholar]
  2. FCH JU. Hydrogen Roadmap Europe. A Sustainable Pathway for the European Energy Transition, 1st ed.; FCH JU: Luxembourg, 2019. [Google Scholar] [CrossRef]
  3. The National Hydrogen Strategy; Federal Ministry for Economic Affairs and Energy, P.R. Division: Berlin, Germany, 2020.
  4. Ram, M.; Galimova, T.; Bogdanov, D.; Fasihi, M.; Gulagi, A.; Breyer, C.; Micheli, M.; Crone, K. Powerfuels in a Renewable Energy World -Global Volumes, Costs, and Trading 2030 to 2050; LUT University and Deutsche Energie-Agentur GmbH (dena): Lappeenranta, Finland; Berlin, Germany, 2020; ISBN 978-952-335-551-4. [Google Scholar]
  5. Trieb, F.; Schilling, C.; O’Sullivan, M.; Pregger, T.; Hoyer-Klick, C. Global potential of concentrating solar power. In Proceedings of the SolarPaces Conference, Berlin, Germany, 15–18 September 2009. [Google Scholar]
  6. Buttler, A.; Spliethoff, H. Current status of water electrolysis for energy storage, grid balancing and sector coupling via power-to-gas and power-to-liquids: A review. Renew. Sustain. Energy Rev. 2018, 82, 2440–2454. [Google Scholar] [CrossRef]
  7. IEA. Hydrogen Projects Database; IEA: Paris, France, 2020; Available online: https://www.iea.org/reports/hydrogen-projects-database (accessed on 12 April 2020).
  8. Steeb, H.; Abaoud, H. HYSOLAR: German-Saudi Joint Program. on Solar Hydrogen Production and Utilization. Phase II, 1992–1995; DLR Stuttgart: Stuttgart, Germany, 1996. [Google Scholar]
  9. Godula-Jopek, A.; Stolten, D. Hydrogen Production: By Electrolysis, 1st ed.; John Wiley & Sons, Incorporated: Berlin, Germany, 2015. [Google Scholar]
  10. Smolinka, T.; Wiebke, N.; Sterchele, P.; Lehner, F.; Jansen, M. Studie IndWEDe Industrialisierung der Wasser elektrolyse in Deutschland: Chancen und Herausforderungen für nachhaltigen Wasserstoff für Verkehr, Strom und Wärme; Nationale Organisation Wasserstoff-und Brennstoffzellentechnologie–NOW GmbH: Berlin, Germany, 2018. [Google Scholar]
  11. Ursúa, A.; Barrios, E.L.; Pascual, J.; Martín, I.S.; Sanchis, P. Integration of commercial alkaline water electrolysers with renewable energies: Limitations and improvements. Int. J. Hydrogen Energy 2016, 41, 12852–12861. [Google Scholar] [CrossRef]
  12. Buck, R.; Schwarzbözl, P. Comprehensive Energy Systems; Elsevier BV: Amsterdam, The Netherlands, 2018; pp. 692–732. [Google Scholar]
  13. Pitz-Paal, R. Concentrating solar power. In Future Energy, 3rd ed.; Letcher, T.M., Ed.; Elsevier Science: Amsterdam, The Netherlands, 2020; pp. 413–430. [Google Scholar]
  14. Boisgibault, L.; Al Kabbani, F. Energy Transition in Metropolises. In Energy Transition in Metropolises, Rural Areas and Deserts; ISTE Ltd and John Wiley & Sons, Inc.: Hoboken, NJ, USA, 2020; pp. 17–108. [Google Scholar] [CrossRef]
  15. Moris, C.H.; Guevara, M.C.; Salmon, A.; Lorca, Á. Comparison between concentrated solar power and gas-based generation in terms of economic and flexibility-related aspects in Chile. Energies 2021, 14, 1063. [Google Scholar] [CrossRef]
  16. Roeb, M.; Brendelberger, S.; Rosenstiel, A.; Agrafiotis, C.; Monnerie, N.; Budama, V.; Jacobs, N. Wasserstoff als ein Fundament der Energiewende Teil 1: Technologien und Perspektiven für eine Nachhaltige und Ökonomische Wasserstoffversorgung; Deutsches Zentrum für Luft- und Raumfahrt e. V. (DLR): Köln, Germany, 2020. [Google Scholar]
  17. Gallardo, F.I.; Ferrario, A.M.; Lamagna, M.; Bocci, E.; Garcia, D.A.; Baeza-Jeria, T.E. A techno-economic analysis of solar hydrogen production by electrolysis in the north of Chile and the case of exportation from Atacama Desert to Japan. Int. J. Hydrogen Energy 2020, 46, 13709–13728. [Google Scholar] [CrossRef]
  18. Dersch, J.; Dieckmann, S.; Hennecke, K.; Pitz-Paal, R.; Taylor, M.; Ralon, P. LCOE reduction potential of parabolic trough and solar tower technology in G20 countries until 2030. AIP Conf. Proc. 2020, 2303, 120002. [Google Scholar] [CrossRef]
  19. OECD. Price Level Indices (Indicator). 2018. Available online: https://data.oecd.org/price/price-level-indices.htm (accessed on 28 May 2018).
  20. MathWorks. Global Optimization Toolbox User’s Guide; The MathWorks, Inc.: Natick, MA, USA, 2021. [Google Scholar]
  21. Dersch, J. Techno-economic evaluation of renewable energy projects using the software greenius. Int. J. Therm. Environ. Eng. 2015, 10, 17–24. [Google Scholar]
  22. Dersch, J. Greenius—The Green Energy System Analysis Tool; Deutsches Zentrum für Luft- und Raumfahrt, Institute of Solar Research: Cologne, Germany, 2018. [Google Scholar]
  23. Schmidt, O.; Melchior, S.; Hawkes, A.; Staffell, I. Projecting the future levelized cost of electricity storage technologies. Joule 2019, 3, 81–100. [Google Scholar] [CrossRef] [Green Version]
  24. Schmidt, O. Lifetime Cost of Electricity Storage. 2019. Available online: https://energystorage.shinyapps.io/LCOSApp/ (accessed on 24 April 2020).
  25. Bejan, A.; Tsatsaronis, G.; Moran, M. Thermal Design and Optimization; Wiley: New York, NY, USA, 1996. [Google Scholar]
  26. Pintarič, Z.N.; Kravanja, Z. Selection of the economic objective function for the optimization of process flow sheets. Ind. Eng. Chem. Res. 2006, 45, 4222–4232. [Google Scholar] [CrossRef]
  27. Van ’t Noordende, H.; Ripson, P. Baseline Design and Total Installed Costs of a GW Green Hydrogen Plant. State-of-the-Art Design and Total Installed Capital Costs; Institute for Sustainable Process Technology (ISPT): Amersfoort, The Netherlands, 2020; Available online: https://ispt.eu/projects/hydrohub-gigawatt/ (accessed on 12 April 2020).
  28. IRENA. Renewable Power Generation Costs in 2019; International Renewable Energy Agency: Abu Dhabi, United Arab Emirates, 2020. [Google Scholar]
  29. IRENA. Future of Solar Photovoltaic: Deployment, Investment, Technology, Grid Integration and Socio-Economic Aspects (A Global Energy Transformation: Paper); International Renewable Energy Agency: Abu Dhabi, United Arab Emirates, 2019. [Google Scholar]
  30. Schöniger, F.; Thonig, R.; Resch, G.; Lilliestam, J. Making the sunshine at night: Comparing the cost of dispatchable concentrating solar power and photovoltaics with storage. Energy Sources Part B Econ. Plan. Policy 2021, 16, 55–74. [Google Scholar] [CrossRef]
  31. De Vita, A.; Kielichowska, I.; Mandatowa, P.; Capros, P.; Dimopoulou, E.; Evangelopoulou, S.; Dekelver, G. Technology Pathways in Decarbonisation Scenarios; Tractebel, Ecofys, E3-Modelling: Brussels, Belgium, 2018. [Google Scholar]
Figure 1. Work flow and main stages of the study.
Energies 14 03437 g001
Figure 2. Scheme of the PV/CSP hybrid power plant powering an alkaline electrolyser (AEL) system for stand-alone solar hydrogen production. The six plant design optimization variables are highlighted in green.
Energies 14 03437 g002
Figure 3. Modelled CSP receiver efficiency depending on the load of the receiver. Values for standard and cost outlook scenario.
Energies 14 03437 g003
Figure 4. Modelled load dependent turbine efficiency. Values for standard and cost outlook scenario.
Energies 14 03437 g004
Figure 5. Comparison of different solar hydrogen plant operational concepts for a day with good solar irradiation. Results from the standard cost scenario for the location Ouarzazate, Morocco. (a) PV powered H2 production; (b) PV/CSP powered fluctuating H2 production; (c) PV/CSP powered constant H2 production.
Energies 14 03437 g005
Figure 6. Operational strategy for time step calculation of PV/CSP hybrid hydrogen production plant.
Energies 14 03437 g006
Figure 7. Levelized cost of hydrogen (LCOH) depending on the PV peak power to AEL nominal power ratio for the location Ouarzazate in Morocco. The study was performed for the standard cost scenario and the cost reduction outlook scenario.
Energies 14 03437 g007
Figure 8. Levelized cost of hydrogen (LCOH) depending on electrolyser full load hours and levelized costs of electricity provided to the electrolyser (LCOE). Each simulation value for three locations and two costs scenarios was obtained by cost minimization for different stand-alone hydrogen production plants.
Energies 14 03437 g008
Figure 9. Share of process equipment costs (TIC and OMC) in the levelized hydrogen production costs for the most promising PV/CSP-AEL plant configurations in the standard and in the cost reduction outlook scenario. Plant location is Ouarzazate in Morocco.
Energies 14 03437 g009
Figure 10. Optimized plant design of PV/CSP-hybrid alkaline electrolyser plants (fluctuating or constant hydrogen production) for the two cost scenarios and the location Ouarzazate, Morocco. Nominal power of process equipment is provided.
Energies 14 03437 g010
Figure 11. Net present worth (WNP) of the best solar hydrogen production plants depending on the revenue of the produced hydrogen (cost reduction outlook scenario).
Energies 14 03437 g011
Table 1. Summary locations of the study.
LocationPrice Index (OECD) [18,19]Considered TechnologySolar Resource: DNI/GHI
(kWh/m2a)
Source Meteo Data
Freiburg, Germany100PV971/1137greenius
Almeria, Spain84PV, CSP1918/1812greenius
Ouarzazate, Morocco42PV, CSP2518/2123Meteonorm 6.1
Table 2. Optimization variables of the PV/CSP powered electrolyser plant model.
Nr.Optimization VariableDescriptionGlobal Optimization Variable Constraints
1PCSP,RecCSP molten salt receiver nominal input power (at DNI 900 W/m2)0 or: 800   P C S P , R e c 1200 MW
2PPV,PeakPV peak power (at GHI 1000 W/m2) 1000 MW
3PAELNominal power of alkaline electrolyser system 1000 MW
4PTurbNominal power of steam cycle turbine 0 or: 50 MW
5CTESCapacity of molten salt thermal energy storage 8000 MWh
6PHeater,elNominal power of electric molten salt heater 1000 MW
Table 3. Technical assumptions for the alkaline electrolyser system modeling.
ParameterValue Source [6,10]
AEL System efficiency η A E L , S y s in %64.2
LHVH2 (kWh/kg)33.326
AEL operational range in %20–100
AEL standby consumption in % of nominal power1
Hydrogen outlet pressure (bar)20
Table 4. CSP and steam cycle auxiliary electricity consumption.
CaseConditionCorrelation
CSP standby mode aux. consumption (no solar input) P C S P , R e c   t = 0 P C S P , a u x t = 0.0005 P C S P , R e c
CSP operating aux. consumption P C S P , R e c   t > 0 P C S P , a u x t = 0.0091 P C S P , R e c t
Steam cycle auxiliary consumption P T u r b t > 0 P T u r b , a u x   t = 0.05 P T u r b t
Table 5. General techno-economic assumptions.
Reference year2018
USD/Euro exchange rate1.1815
Internal interest rate i e f f 5%
Plant lifetime n (years)25
Table 6. Techno-economic data (TIC and OMC) for the AEL system, the PV plant and the electric heater for the standard cost scenario and the cost reduction outlook scenario.
EquipmentParameterStandard
Scenario
Outlook
Scenario
Cost Reduction
AEL plantTIC (USD/kW)8278270%
OMC, including stack replacement (USD/a)0.035 of TIC
PV plantTIC (USD/kW)76034055.3%
OMC, including replacement and insurance (USD/kW a)14.08
Elec. heaterTIC (USD/kW)1801800%
OMC elec. heater (USD/kWhth)11.83
Table 7. CSP equipment costs for the standard and the cost reduction outlook scenario for the location Almeria in Spain and Ouarzazate in Morocco.
CSP EquipmentLocation: Almeria, Spain
Cost Index: 84 [18,19]
Location: Ouarzazate, Morocco
Cost Index: 42 [18,19]
Standard ScenarioOutlook
Scenario
Cost
Reduction
Standard ScenarioOutlook
Scenario
Cost
Reduction
Heliostat field (USD/m2)114.7683.1127.6%87.8865.2725.7%
Tower (103 USD/m)78.4862.7820.0%48.2438.5920.0%
Receiver (USD/kWth)146.57102.6030.0%124.4387.1030.0%
Thermal storage (USD/kWh)24.9320.6817.0%21.0917.7515.8%
Power Block (USD/kWel)785.12708.459.8%693.5625.629.8%
Table 8. Annual CSP operating and maintenance costs.
CSP Equipment Annual OMC
Heliostat field (USD/m2)3.00
Tower (USD/m)1063
Receiver (USD/kWth)2.95
Thermal storage (USD/kWhth)0.24
Power Block (USD/kWel)0.95
Table 9. Results of AEL-system full load hours and levelized cost of electricity (LCOE) for the most promising PV/CSP-AEL plant configurations in the standard and in the cost reduction outlook scenario. Plant location is Ouarzazate in Morocco.
Scenario/ConfigurationFLH AEL
(h/a)
LCOE PV
(USD/MWh)
LCOE CSP
(USD/MWh)
LCOE to AEL
(USD/MWh)
LCOE to AEL + Cost Padd
(USD/MWh)
Standard cost scenario
Only PV275137.92-43.8546.26
Only CSP6163-62.8762.8763.90
PV/CSP hybrid fluctuating446337.9269.0355.0755.67
PV/CSP hybrid constant663337.9277.6965.8466.26
Outlook scenario
Only PV297319.83-24.8727.09
Only CSP6337-51.0251.0251.94
PV/CSP hybrid fluctuating403919.8358.6934.4835.07
PV/CSP hybrid constant688419.8365.0248.7549.10
Publisher’s Note: MDPI stays neutral with regard to jurisdictional claims in published maps and institutional affiliations.

