Article

Performance Evaluation of Photovoltaic Modules by Combined Damp Heat and Temperature Cycle Test

School of Chemical Engineering, Yeungnam University, 280 Daehak-ro, Gyeongsan 38541, Korea
*
Author to whom correspondence should be addressed.
Energies 2021, 14(11), 3328; https://doi.org/10.3390/en14113328
Submission received: 10 May 2021 / Revised: 26 May 2021 / Accepted: 3 June 2021 / Published: 5 June 2021
(This article belongs to the Special Issue Modeling, Design, Development and Testing for Solar System)

Abstract

:
Standard damp heat (DH), temperature cycle (TC), and combined DH-TC tests were performed using monocrystalline Si 72-cell modules with a conventional ethylene vinyl acetate (EVA) encapsulant, and their module performance and electroluminescence images were investigated. During the DH test, a significant drop (~20%) in the maximum output power of the module was noticed, primarily because of the degradation of fill factor and an increase in series resistance at 5500 h of DH testing (DH5500), presumably due to the corrosion of metal electrodes by moisture ingress. Conversely, it was revealed that temperature cycling did not seriously degrade module performance until 1400 cycles. However, the combined DH5000-TC600 test suggested in this study, with a sequence of DH1000-TC200-DH1000-TC200-DH1000-TC200-DH2000, was confirmed to provide harsher conditions than the DH-only test by causing a 20% decrease in maximum output power (Pmax) after DH3000/TC400. Promisingly, we confirmed that the module with a polyolefin elastomer encapsulant showed better durability than the module with EVA even in the combined DH-TC test, showing a limited decrease in Pmax (~10%) even after the DH5500/TC600 test.

Graphical Abstract

1. Introduction

Long-term reliability tests of photovoltaic (PV) modules are required to guarantee an acceptable lifetime (e.g., 25 years) of modules. However, it is not realistic to perform outdoor field tests for long periods. Therefore, the module certification process following the International Electrotechnical Commission (IEC) standards (e.g., IEC 61215) adopts accelerated testing methods, such as temperature cycle (TC) and damp heat (DH) tests.
According to IEC 61215 (ed.2), the TC test of PV modules is designed to follow a temperature change between −40 and +85 °C for a pre-set number of cycles, for example, 200 cycles for the TC200 test. Repeated cycles of extreme temperature variation may cause thermo-mechanical stress and damage to components and their interfaces within PV modules, such as cells, metal grids, bus-bars, encapsulant, cover glass, and back-sheets, due to the mismatch in coefficients of thermal expansion (CTE). Typically, electroluminescence (EL) images are taken both before and after TC tests, and their comparison is used to identify possible thermo-mechanical damages, including micro-cracks within cells and delamination between constituent layers [1,2,3]. The interfacial contact failure and breakages between layers within modules can lead to an increase in series resistance, thus reducing the fill factor (FF) and open-circuit voltages (Voc) [4].
DH tests of modules are conducted at high temperature (85 °C) and high humidity (relative humidity 85%) conditions for typically 1000 h (called DH1000) to identify the degradation of module performance due to moisture penetration or diffusion into the modules, which can be affected by DH time and relative humidity [5]. In general, moisture ingress is initiated from the edges of the modules [6]. Then, the polymer encapsulant, for example, ethylene vinyl acetate (EVA), reacts with infiltrated water molecules and is decomposed by a hydrolysis mechanism, leading to the delamination of the encapsulant, which accelerates moisture ingress and the corrosion of metal electrodes [5,6,7]. It has also been reported that the corrosion of metal electrodes is caused by their reaction with water molecules, and can be accelerated by acetic acid produced from the hydrolysis of vinyl acetate monomers within EVA. Ultimately, the corrosion of the electrodes results in the degradation of PV output power by increased contact resistivity and reduced FF [8,9]. Koehl et al. [8] performed DH tests on commercial PV modules with 60 crystalline silicon cells at different temperatures (75, 85, and 90 °C), until the final degradation was obtained (3500–7000 h), and found that the degradation of FF occurred first, followed by the reduction of short-circuit current (Isc).
Zhu et al. [10] conducted DH tests at various temperatures–relative humidity conditions such as (75, 85, 95 °C)/85%, 95 °C/70%, and 90 °C/50% for crystalline silicon PV modules with different backsheets and encapsulants. They reported that a conventional module with an EVA encapsulant and polymer backsheet was severely damaged by the DH test, and its output power was reduced primarily via the losses of photocurrent (Iph) and series resistance (Rs) due to water ingress. In addition, they reported that water infiltration can be minimized by adding an aluminum barrier to the backsheet.
Recently, there is a demand to fabricate PV modules with longer lifetimes (e.g., ~50 years), which require more stable encapsulant and backsheet materials. In addition, it is also required to develop new acceleration test method, which is effective and reproducible for the evaluation of PV modules with better reliability and a longer lifetime [11,12,13]. Therefore, resistance to more severe environmental conditions, such as longer duration, larger temperature variations, and higher humidities, should be explored for new acceleration tests [11]. In this study, the DH (5000 h)-TC (600 cycles) combined acceleration test scenario was employed to evaluate 72 cell monocrystalline Si modules under harsher environments than conventional acceleration test conditions, and the results were compared with those of individual DH7000 and TC1400 tests.

2. Materials and Methods

In this study, the commercial p-PERC monocrystalline Si 72-cell module was used, and its specifications are as follows: peak power = 360 W, Voc = 47.20 V, Isc = 9.98 A, and efficiency = 18.48%. The test conditions of individual DH and TC cycles followed the IEC 61215 10.13 and 10.11 standards, respectively. For example, the DH test was performed at a temperature of 85 °C (± 2 °C) and a relative humidity of 85% (± 5%). Initially, the temperature within the chamber was increased from 25 to 85 °C for 2 h (+30 °C/h) and maintained for a desired time period, for example, 500 h for DH500, as shown in Figure 1a. After the test, the chamber was cooled to 25 °C for 3 h (−20 °C/h). During each cycle of the TC200 test, the chamber temperature was raised from −40 to +85 °C (± 2 °C) for approximately 90 min (rate ~1.39 °C/min) and then maintained at 85 °C (± 2 °C) for 30 min (dwelling time). For the cooling process, the cooling rate (−1.39 °C/min) and dwelling time at −40 °C (30 min) were almost the same as those for the heating process. Therefore, the total time required for each cycle was approximately four hours. The time–temperature profile for the TC test cycle is summarized in Figure 1b.
The DH5000-TC600 combined acceleration test suggested in this study is composed of sequential tests of: (1) DH1000, (2) TC200, (3) DH1000, (4) TC200, (5) DH1000, (6) TC200, and (7) DH2000, as illustrated in Figure 2.
The flash I-V tests of the PV module were performed using a module simulator (SPIRE, Model: SPI-SUN SIMULATOR 4600SLP) equipped with a multi-flash filtered Xenon tube lamp at standard conditions of 25 °C (± 0.5 °C) and 1000 W/m2 (AM 1.5 G). Electroluminescence (EL) images were obtained using a custom-made EL system equipped with a camera (Nikon D5600) and a DC power supply (Keithley 2260B-80-27).

3. Results and Discussion

3.1. Performance Evaluation of PV Module by Damp Heat Test

During the DH test, the module was removed from the test chamber every 500 h from 1000 to 7000 h and its I-V characteristics were measured. Figure 3 and Table 1 show the degradation of characteristic module performance parameters such as Voc, Isc, FF, Pmax, Rs, and shunt resistance (Rsh) during the DH acceleration test on the PV module. The maximum output power (Pmax) of the testing module was maintained at approximately 90% of the initial value (i.e., loss of less than 10%) until DH3500 and reduced by approximately 12.7% after 5000 h of DH, and then drastically degraded by almost 40% and 60% after 6000 and 7000 h, respectively. As shown in Figure 3, the Voc was gradually and slightly reduced by less than 5% during the entire DH test period of 7000 h, suggesting that the p-n junction properties of the cell unit were not significantly affected by the DH test [8]. The Isc also mildly decreased until DH6000 and then rapidly dropped between 6000 and 7000 h, from 10% to 26%. The FF remained nearly unchanged (~79%) until DH2500, while Pmax was mainly affected by Isc and Voc because Pmax = FF × Isc × VocIsc × Voc (FF ~ constant), graphically evidenced by similar variation behaviors of Isc, Voc, and Pmax values in Figure 3. It can be assumed that the encapsulant effectively prohibited moisture penetration until DH2500. However, FF began to decrease after DH3000, accelerating the degradation of Pmax (=FF × Isc × Voc), presumably due to moisture ingress and the corrosion of the metal electrodes, leading to an increase in the contact resistance and degradation of FF [5,6,7,8]. After DH5000, the significant loss of FF led to the failure of module performance (~40% and ~60% of Pmax loss after 6000 and 7000 h, respectively), along with a dramatic increase in Rs by ~300% of the initial value after DH7000. The behavior of noticeable FF degradation (after DH5000) followed by Isc drop (DH6000) was also reported by another research group [8]. As shown in Table 1, the shunt resistance (Rsh) varied in a range of 58~94 Ω until DH5500, and then rapidly dropped to 17~33 Ω after DH6000, where the module was severely damaged. The detailed values of each parameter with the DH times are summarized in Table 1.
The EL images in Figure 4 showed that there were no noticeable micro-cracks in the cells and no significant damage to front grids and interconnection in the module until the DH2500 test. However, the degradation of the module was accelerated after DH3000, as indicated by several cells with relatively darker regions than neighboring regions, which is consistent with the results in Figure 3 and Table 1. Dark regions in EL images resulted from the low current due to increased series resistance by the corrosion of metal electrodes [14]. Furthermore, the EL images taken after DH7000 confirmed that the dark regions were widely identified on the entire surface of the module. Photographs of the DH7000-tested module are shown in Figure 5, where a part of the white backsheet was cracked and delaminated by thermal stress during the DH test, and part of the cable connector was also broken [15].

3.2. Performance Evaluation of PV Module by Temperature Cycle Test

During the TC test, the I-V characteristics of the PV module were measured after every 100 cycles until 1400 cycles, and the results are summarized in Figure 6 and Table 2. Compared to the DH7000 test results in Figure 3, the effect of TC1400 on the degradation of the module performance can be considered less significant [16]. Please note that the relative scales of the y1 and y2-axes in Figure 3 and Figure 6 are identical. During the TC1400 test, the characteristic module performance parameters of Voc, Isc, and FF fluctuated between +0.2% and −3.5%, yielding a maximum Pmax drop of 7.1%. The values of the series resistance fluctuated between −14.0% and +11.9%, which was also negligible compared to that in the DH7000 test (ΔRs ~ +316%). As shown in Figure 7, no noticeable changes were observed in the EL images for 300–1400 cycles, supporting that there was no considerable damage in metal grids and cell interconnection during the TC test. Therefore, it can be assumed that the PV module tested in this study was durable without any significant thermo-mechanical damage, such as micro-cracks within cells and the delamination of protecting layers until TC 1400. In addition, a careful investigation of the surface and backside of the module after TC1400 confirmed that there was no detectable physical damage for the backsheet, cable connector, and other components.

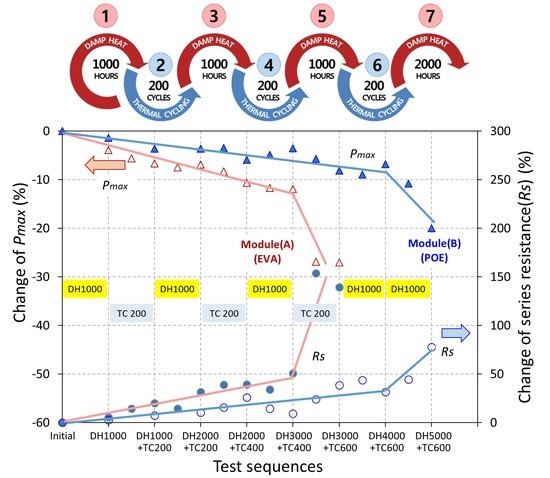
3.3. Performance Evaluation of PV Module by Combined Damp Heat-Temperature Cycle Test

Based on the scheme of the DH5000-TC600 combined acceleration test in Figure 2, DH and TC tests were executed alternatively. Flash I-V characterization was performed every 500 h, except for the first 500 h during the DH tests and after every 100 cycles during the TC tests. The test was stopped after DH3000 + TC600 (i.e., step 6 out of 7 in Figure 2), when the drop in the maximum output power (Pmax) reached almost 27%, indicating significant damage to the module. As shown in Figure 3 and Table 1, Pmax decreased by 11.8% and 23.0% after DH4000 and DH5500, respectively. However, from the combined DH-TC test, a > 10% decrease in Pmax was observed only after DH2000 + TC400. In addition, the DH3000 + TC500 test led to a drastic degradation of Pmax by 26.9%, along with a considerable increase in Rs (+51.0% → +153.7%). Therefore, it can be assumed that moisture ingress and the resulting corrosion of metal electrodes within the PV module during the DH test can be expedited by approximately 400–500 cycles of the standard TC test. As shown in Figure 6, it is noteworthy that the TC400 test was not detrimental to module power production, as evidenced by a 3% loss of Pmax in Figure 6. Similar to the DH test results, Figure 8a–c demonstrate that the degradation of maximum power production was caused by the reduction of FF rather than that of Voc and Isc. The detailed results with the combined DH-TC sequences are summarized in Table 3. The EL images, as shown in Figure 9, confirmed that there was no noticeable damage to the module until DH2000 + TC400.
Another set of combined DH5000-TC600 tests was performed using different modules (called “Module (B)” in the manuscript) fabricated by another company, for which cell and module specifications were similar to what was used in the previous section (called “Module (A)”): p-PERC monocrystalline Si 72 cell module with a nominal power of ~360 W. The main difference between the two modules was that module (B) adopted a polyolefin elastomer (POE)-based encapsulant instead of the conventional EVA encapsulant used in module (A). POE is a polyethylene-based copolymer with a co-monomer (e.g., acrylates, n-alkanes); thus, its physical properties depend on the relative composition and spatial distribution of the co-monomer [17]. In this study, an ethylene-octene copolymer was used as the POE encapsulant. Unlike EVA, POE does not produce any acid by reacting with water and thus can prevent the corrosion of metal electrodes.
The overall behavior of the module performance parameters (e.g., Isc, Voc, FF, Pmax, and Rs) for module (B) was similar to that for module (A). However, as seen in Figure 10, the thermo-mechanical stability of module (B) with the POE encapsulant was significantly better than that of module (A) with the EVA encapsulant. Figure 10 demonstrates that the maximum output power of module (A) was reduced by ~10% after the DH2000/TC200 test and rapidly dropped by over 20% after DH3000/TC500, while that of module (B) gradually decreased until DH4500/TC600, maintaining only a 10% drop, and reached a ~20% drop after the completion of the DH5000/TC600 test. The EL images shown in Figure 11 also confirmed the stability of cells within the modules until the DH3000/TC600 test. These results on the durability of POE encapsulants agree well with previous reports in the literature [17,18,19].

4. Conclusions

DH, TC, and DH-TC combined tests were performed on a commercial p-PERC monocrystalline Si 72-cell module, and the results were investigated using flash I-V and EL images. During the DH test, the critical drop in the maximum output power of the module was primarily accelerated by the degradation of FF and an increase in Rs, which was mainly related to the corrosion of metal electrodes due to moisture ingress, and later followed by Isc loss after DH6000. On the other hand, it was confirmed that the TC test between −40 °C and +85 °C did not considerably degrade the module performance until 1400 cycles. However, the combined DH-TC test suggested in this study is confirmed to provide harsher conditions to the module than the DH-only test, and thus has the potential to reduce the time and cost for the acceleration test of PV modules. Therefore, further research on the correlation between combined DH-TC indoor test sequences and outdoor degradation phenomena of diverse PV modules can expedite the design and development of more reliable PV modules with a longer lifetime (e.g., ~50 years). It was also confirmed that the module with POE showed better durability even in the combined DH-TC environment than the module with EVA, in particular showing a Pmax drop of only approximately 10% after the DH5500/TC600 test.

Author Contributions

Conceptualization, H.P., W.S., and W.K.K.; methodology, H.P. and W.S.; formal analysis, H.P. and W.S.; data curation, H.P. and W.K.K.; writing—original draft preparation, H.P. and W.K.K.; writing—review and editing, W.K.K.; supervision, W.K.K.; project administration, W.K.K.; funding acquisition, W.K.K. All authors have read and agreed to the published version of the manuscript.

Funding

This work was supported by the Korea Institute of Energy Technology Evaluation and Planning (KETEP) and the Ministry of Trade, Industry & Energy (MOTIE) of the Republic of Korea (No. 20183010014320).

Institutional Review Board Statement

Not applicable.

Informed Consent Statement

Not applicable.

Data Availability Statement

Not applicable.

Conflicts of Interest

The authors declare no conflict of interest.

References

  1. Kawai, S.; Tanahashi, T.; Fukumoto, Y.; Tamai, F.; Masuda, A.; Kondo, M. Causes of degradation identified by the extended thermal cycling test on commercially available crystalline silicon photovoltaic modules. IEEE J. Photovolt. 2017, 7, 1511–1518. [Google Scholar] [CrossRef]
  2. Chaturvedi, P.; Hoex, B.; Walsh, T.M. Broken metal fingers in silicon wafer solar cells and PV modules. Sol. Energy Mater. Sol. Cells 2013, 108, 78–81. [Google Scholar] [CrossRef]
  3. Roy, S.; Kumar, S.; Gupta, R. Investigation and analysis of finger breakages in commercial crystalline silicon photovoltaic modules under standard thermal cycling test. Eng. Fail. Anal. 2019, 101, 309–319. [Google Scholar] [CrossRef]
  4. Kumar, S.; Gupta, R. Investigation and analysis of thermo-mechanical degradation of fingers in a photovoltaic module under thermal cyclic stress conditions. Sol. Energy 2018, 174, 1044–1052. [Google Scholar] [CrossRef]
  5. Park, H.; Jeong, J.; Shin, E.; Kim, S.; Yi, J. A reliability study of silicon heterojunction photovoltaic modules exposed to damp heat testing. Microelectron. Eng. 2019, 216, 111081. [Google Scholar] [CrossRef]
  6. Poulek, V.; Šafránková, J.; Černá, L.; Libra, M.; Beránek, V.; Finsterle, T.; Hrzina, P. PV panel and PV inverter damages caused by combination of edge delamination, water penetration, and high string voltage in moderate climate. IEEE J. Photovolt. 2021, 11, 561–565. [Google Scholar] [CrossRef]
  7. de Olivira, M.C.C.; Diniz, A.S.A.C.; Viana, M.M.; Lins, V.F.C. The causes and effects of degradation of encapsulant ethylene vinyl acetate copolymer (EVA) in crystalline silicon photovoltaic modules: A review. Renew. Sustain. Energy Rev. 2018, 81, 2299–2317. [Google Scholar] [CrossRef]
  8. Koehl, M.; Hoffmann, S.; Wiesmeier, S. Evaluation of damp-heat testing of photovoltaic modules. Prog. Photovolt. Res. Appl. 2017, 25, 175–183. [Google Scholar] [CrossRef]
  9. Peike, C.; Hoffmann, S.; Hülsmann, P.; Thaidigsmann, B.; Weiß, K.A.; Koehl, M.; Bentz, P. Origin of damp-heat induced cell degradation. Sol. Energy Mater. Sol. Cells 2013, 116, 49–54. [Google Scholar] [CrossRef]
  10. Zhu, J.; Koehl, M.; Hoffman, S.; Berger, K.A.; Zamini, S.; Bennett, I.; Gerritsen, E.; Malbranche, P.; Pugliatti, P.; Stefano, A.D.; et al. Changes of solar cell parameters during damp-heat exposure. Prog. Photovolt. Res. Appl. 2016, 24, 1346–1358. [Google Scholar] [CrossRef] [Green Version]
  11. Masuda, A.; Yamamoto, C.; Uchiyama, N.; Ueno, K.; Yamazaki, T.; Mitsuhashi, K.; Tsutsumida, A.; Watanabe, J.; Shirataki, J.; Matsuda, K. Sequential and combined acceleration tests for crystalline Si photovoltaic modules. Jpn. J. Appl. Phys. 2016, 55, 04ES10. [Google Scholar] [CrossRef]
  12. Owen-Bellini, M.; Hacke, P.; Miller, D.C.; Kempe, M.D.; Spataru, S.; Tanahashi, T.; Mitterhofer, S.; Jankovec, M.; Topič, M. Advancing reliability assessments of photovoltaic modules and materials using combined-accelerated stress testing. Prog. Photovolt. Res. Appl. 2021, 29, 64–82. [Google Scholar] [CrossRef]
  13. Spataru, S.; Hacke, P.; Owen-Bellini, M. Combined-accelerated stress testing system for photovoltaic modules. In Proceedings of the 2018 IEEE 7th World Conference on Photovoltaic Energy Conversion (WCPEC) (A Joint Conference of 45th IEEE PVSC, 28th PVSEC & 34th EU PVSEC), Waikoloa, HI, USA, 10–15 June 2018; pp. 3943–3948. [Google Scholar] [CrossRef] [Green Version]
  14. Pingel, S.; Korth, H.; Winkler, M.; Weiss, P.; Geipel, T. Investigation of damp heat degradation mechanisms and correlation to an Accelerated Test Procedure (HAST). In Proceedings of the 27th European Photovoltaic Solar Energy Conference and Exhibition (27th EU-PVSEC), Frankfurt, Germany, 24–28 September 2012; pp. 3137–3141. [Google Scholar] [CrossRef]
  15. Li, Y.-T.; Lin, W.-Y.; Yang, W.-L.; Hsieh, C.-F. Sequential acceleration tests with Pressure Cooker Test (PCT) and UV for backsheets of PV modules. Energy Procedia 2018, 150, 44–49. [Google Scholar] [CrossRef]
  16. Schiller, C.H.; Rendler, L.C.; Eberlein, D.; Mülhöfer, G.; Kraft, A.; Neuhaus, D.H. Accelerated TC test in comparison with standard TC test for PV modules with ribbon, wire and shingle interconnection. In Proceedings of the 36th European Photovoltaic Solar Energy Conference and Exhibition (36th EU-PVSEC), Marseille, France, 9–13 September 2019; pp. 995–999. [Google Scholar] [CrossRef]
  17. Chang, M.; Chen, H.; Chen, C.; Hsueh, C.H. Cocktail sequential test for c-SI PV module: The correlation among accelerated stress factors. In Proceedings of the 31st European Photovoltaic Solar Energy Conference and Exhibition (31st EU-PVSEC), Hamburg, Germany, 14–18 September 2015; pp. 1894–1898. [Google Scholar] [CrossRef]
  18. Lin, B.; Zheng, C.; Zhu, Q.; Xie, F. A polyolefn encapsulant material designed for photovoltaic modules: From perspectives of peel strength and transmittance. J. Therm. Anal. Calorim. 2020, 140, 2259–2265. [Google Scholar] [CrossRef]
  19. Oreski, G.; Omazic, A.; Eder, G.C.; Voronko, Y.; Neumaier, L.; Mühleisen, W.; Hirschl, C.; Ujvari, G.; Ebner, R.; Edler, M. Properties and degradation behaviour of polyolefin encapsulants for photovoltaic modules. Prog. Photovolt. Res. Appl. 2020, 28, 1277–1288. [Google Scholar] [CrossRef]
Figure 1. (a) Time–temperature and humidity profile for DH500 test and (b) time–temperature profile for TC test.
Energies 14 03328 g001
Figure 2. Schemes of DH5000-TC600 combined acceleration test.
Energies 14 03328 g002
Figure 3. (a) Change of module performance parameters with respect to damp heat test times and corresponding (b) current–voltage and (c) power–voltage plots of selected modules.
Energies 14 03328 g003aEnergies 14 03328 g003b
Figure 4. Electroluminescence images of modules with respect to damp heat test times.
Energies 14 03328 g004
Figure 5. Physical damage observed for the tested module after DH7000: (a) cracks of backsheet, (b) cracks and delamination of backsheet, and (c) broken cable connectors.
Energies 14 03328 g005
Figure 6. Change of module performance parameters with respect to temperature cycles.
Energies 14 03328 g006
Figure 7. Electroluminescence images of modules with respect to temperature cycles.
Energies 14 03328 g007
Figure 8. (a) Change of module performance parameters with respect to combined DH-TC test sequences and corresponding (b) current–voltage and (c) power-voltage plots of selected modules.
Energies 14 03328 g008aEnergies 14 03328 g008b
Figure 9. Electroluminescence images of modules with respect to combined DH-TC test sequences.
Energies 14 03328 g009
Figure 10. Changes in maximum output power (Pmax) and series resistance (Rs) with respect to combined DH5000-TC600 test sequences for two different modules, (A) with EVA and (B) with POE.
Energies 14 03328 g010
Figure 11. Electroluminescence images of module (B) with respect to combined DH-TC test sequences.
Energies 14 03328 g011
Table 1. Module performance parameters with time of damp heat test.
DH Time
(h)
Voc
(V)
Isc
(A)
FF
(%)
Pmax
(W)
Rs
(Ω)
Rsh
(Ω)
047.219.45679.0352.60.44092.9
100046.709.17779.0338.40.49168.0
150046.829.13878.9337.70.50894.1
200046.909.19678.9340.10.50674.2
250046.359.02679.0330.30.47667.8
300046.619.07278.2330.80.51989.2
350045.868.99877.5319.60.51169.1
400045.318.82977.8311.10.55668.5
450045.368.76177.5308.10.54365.8
500046.068.96874.5307.80.64164.4
550045.888.87566.7271.70.77958.4
600044.878.46756.6215.10.96233.1
650045.588.05247.1172.91.4221.8
700045.966.96944.5142.41.8317.0
Table 2. Module performance parameters with temperature cycles.
TC Cycle
(Cycles)
Voc
(V)
Isc
(A)
FF
(%)
Pmax
(W)
Rs
(Ω)
Rsh
(Ω)
047.349.48778.1350.60.531125
20046.919.40078.0343.80.46567.3
30046.899.36578.1343.00.457126
40046.739.38077.6340.00.469101
50046.659.38276.8336.00.53462.3
60046.599.35376.5333.20.54595.4
70046.679.33576.8334.80.55295.0
80046.559.33276.6332.60.583102
90046.559.35776.6333.60.56663.3
100046.419.24775.9325.60.59460.1
110047.229.34576.1335.60.57069.6
120047.349.40376.3339.50.55623.6
130047.429.39575.4335.80.58938.2
140047.179.41375.7336.10.55182.8
Table 3. Module performance parameters with sequences of DH-TC combined acceleration test.
DH/TC
(h/Cycles)
Voc
(V)
Isc
(A)
FF
(%)
Pmax
(W)
Rs
(Ω)
Rsh
(Ω)
0/047.479.49278.4353.40.47375.5
1000/046.969.25278.2339.60.49950.3
1000/10046.839.25577.0333.60.54156.3
1000/20046.399.27276.7330.00.56852.7
1500/20046.409.16076.9326.90.54242.2
2000/20046.839.22876.2329.10.62251.7
2000/30046.829.26874.7324.090.65847.7
2000/40046.219.17074.5315.80.65957.4
2500/40046.099.10574.3312.00.63548.3
3000/40046.629.24172.2311.20.71459.1
3000/50046.189.11361.4258.41.20036.5
3000/60045.508.97763.1257.81.13355.2
Publisher’s Note: MDPI stays neutral with regard to jurisdictional claims in published maps and institutional affiliations.

